Embed Size (px)
Citation preview
Complexity, Concentration and Contagion
Prasanna Gai�, Andrew Haldaneyand Sujit Kapadiaz
1 August 2011
Abstract
This paper develops a network model of interbank lending in which unsecured claims, repo activity
and shocks to the haircuts applied to collateral assume centre stage. We show how systemic liquidity crises
of the kind associated with the interbank market collapse of 2007-8 can arise within such a framework,
with funding contagion spreading widely through the web of interlinkages. Our model illustrates how
greater complexity and concentration in the �nancial network may amplify this fragility. The analysis
suggests how a range of policy measures �including tougher liquidity regulation, macro-prudential policy,
and surcharges for systemically important �nancial institutions �could make the �nancial system more
resilient.
Keywords: Network models; Contagion; Financial crises; Systemic risk; Liquidity risk; Interbank markets; Regulatory
policy
JEL classi�cation: D85; G01; G21; G28
Disclaimer: This paper represents the views of the authors and should not be thought
to represent those of the Bank of England or Financial Policy Committee members.
Forthcoming in Journal of Monetary Economics, 58(5)
�Department of Economics, University of Auckland, 12 Grafton Road, Auckland 1142, New Zealand. E-mailaddress : [email protected].
yBank of England, Threadneedle Street, London, EC2R 8AH, United Kingdom. E-mail address :[email protected]
zCorresponding author. Bank of England, Threadneedle Street, London, EC2R 8AH, United Kingdom. E-mailaddress : [email protected]
Complexity, Concentration and Contagion 2
1. Introduction
Herbert Simon spent over half a century teaching at Carnegie-Mellon University. In his classic
study of �The Architecture of Complexity�, he laid the foundations for evaluating the resilience
and evolution of complex systems (Simon, 1962). His analysis drew upon a wide spectrum of
systems thinking �from physical, biological and social sciences. Out of this, Simon reached the
powerful conclusion that even complex systems tended to exhibit a basic simplicity. Systems could
be arranged in a natural hierarchy, comprising nested sub-structures. Non-hierarchical structures
would tend to be deselected over time because of their ine¢ ciency or lack of robustness relative to
simpler, hierarchical structures. Whether the complex system was biological, physical, or social,
it would be a case of survival of the simplest.
The modern �nancial system seems to have bucked this evolutionary trend. In recent years, it
has become much more complex, concentrated and interconnected.1 As much as two-thirds of the
spectacular growth in banks�balance sheets in the years prior to the crisis re�ected increasing
claims within the �nancial system, rather than with non-�nancial agents. In Simon�s words,
the �nancial system has become less modular, less hierarchical and thus less decomposable. In
consequence, it became markedly more susceptible to systemic collapse. This sowed the seeds of
the global �nancial crisis of 2007/8.
In this paper, we explore how the complexity and concentration of �nancial linkages can give
rise to systemic liquidity crises that threaten �nancial system resilience. In keeping with the multi-
disciplinary spirit of Simon (1962), our theoretical framework draws upon network techniques
developed in epidemiology and statistical physics to identify �tipping points�in complex systems,
whereby a small change in the underlying parameters or shocks can make a very large di¤erence to
outcomes. In light of recent events, the paper focuses on the collapse of the interbank market. We
demonstrate both analytically and via numerical simulations how repo market activity, haircut
shocks, and liquidity hoarding in unsecured interbank markets may have contributed to the
spread of contagion and systemic collapse.2 The network lens also o¤ers new perspectives on a
broad range of recent and proposed policy measures aimed at tackling �nancial system risk.
1See Haldane (2009). It is natural to ask why the evolutionary forces described by Simon may not have forcedan earlier deselection of such a complex system. One possible explanation is policy. Successive crises have seen aprogressive widening and broadening of the �nancial safety net � from last resort lending from the 19th centuryonwards, to deposit insurance from the 1930s, to the block-buster capital and liquidity support for both banksand non-banks during this century (Alessandri and Haldane, 2009). Until the end of the Bretton Woods era,increasing implicit support went hand-in-hand with tougher �nancial regulation and greater restrictions on globalcapital �ows. The 25-year postwar period was remarkable for its absence of systemic banking crises. But an eraof deregulation since the mid 1970s may have contributed to increasing complexity and concentration.
2A repo transaction entails borrowing money using securities as collateral. It is structured as the spot sale ofa security for cash, coupled with an agreement to repurchase the same security at the initial price plus interest ata particular date in the future. When the cash lent on repo trades is lower than the current market value of thesecurity used as collateral, the discount is referred to as the haircut.
Complexity, Concentration and Contagion 3
Despite obvious parallels between �nancial systems and complex systems in other �elds (May
et al, 2008; Haldane, 2009; Haldane and May, 2011), the use of network techniques from epidemi-
ology and statistical physics to the study of �nancial contagion is in its infancy. One important
reason for the slow up-take amongst economists is that such network techniques are typically
silent about behavioural considerations. But they have the advantage of eclecticism about net-
work formation processes and can be calibrated to match real-world networks (such as those
depicted in Figure 1). They are particularly well suited for dealing with heterogeneity of agents,
charting the dynamic propagation of shocks within the �nancial system and identifying the non-
linearities that characterize �nancial instability in a parsimonious way.3
In what follows, we examine the interplay between complexity, concentration and stability us-
ing a simple network model of the banking system in which individual banks are randomly linked
together by their interbank claims on each other. Although stylised, the set-up is su¢ ciently rich
to permit the study of shocks that diminish the availability of interbank loans, so-called �funding
liquidity shocks�. During the crisis, this took the form of liquidity hoarding by banks. As one
bank calls in or shortens the term of its interbank loans, a¤ected banks in turn do the same. The
connectivity and concentration of the players in the network play key roles in this propagation
mechanism.
We start by exploring analytically how such funding contagion can generate systemic liquidity
crises.4 In doing so, we articulate how tipping points may be embedded in the �nancial network
and show how these depend on the level of liquid asset holdings, the amount of interbank activity,
and the size of haircuts on banks�assets.
We then consider numerical simulations which illustrate the potential fragility of the banking
system and shed light on the design and implementation of policies which might help to address
this. The simulations consider two possible network con�gurations: one in which the interbank
links in the network are distributed roughly evenly across di¤erent banks (Poisson con�guration),
and one in which some banks in the network are much more highly connected than the typical
bank (geometric con�guration). The simulations for the Poisson network are a useful benchmark,
while the fat-tailed geometric con�guration is more in keeping with real-world networks.
We consider six experiments and a further four policy exercises. First, to provide a baseline,
we consider what happens when a random adverse haircut shock at a single bank forces it to
3See Jackson (2008) for a comprehensive study of network techniques and their applications to economics.4We build on Gai and Kapadia (2010, 2011) who model default contagion and liquidity hoarding by adapting
techniques advanced by Newman et al (2001) and Watts (2002). May and Arinaminpathy (2010) show how similarresults on the likelihood and dynamics of default contagion can be obtained by assuming that all banks followexactly �average� behaviour, and we also draw on them in applying this type of (mean-�eld) approximation toour model.
Complexity, Concentration and Contagion 4
start hoarding liquidity under the Poisson network con�guration. We illustrate the frequency and
contagious spread of systemic liquidity crises, identifying the tipping point of the system in the
process. Our second experiment introduces an additional aggregate haircut shock which a¤ects
all banks. We use it to articulate how our model speaks to the collapse of interbank markets in
the early part of the crisis during August and September 2007.
The third and fourth experiments focus on the role of concentration by assessing how the
results change under a fat-tailed (geometric) network con�guration, and also explore the di¤ering
consequences of a �targeted�shock which a¤ects the most interconnected interbank lender under
both network con�gurations. These are old exercises in epidemiology and the analysis of network
resilience (Anderson and May, 1991; Albert et al, 2000). But the rapid emergence of institutions
that are too big, connected, or important to fail underlines their increasing importance in �nance.
The �fth and sixth experiments explore di¤erent dimensions of complexity �what happens to
�nancial vulnerability when unsecured interbank market activity increases and initial aggregate
haircuts change. Since haircuts appear to exhibit cyclical behaviour, tending to be compressed
in the upswing of a cycle as �nancial institutions become increasingly exuberant, the latter
experiment speaks to how systemic risk in the system may change dynamically.
Our �rst policy exercise explores the consequences of imposing a uniform increase in liquid
asset holdings on the resilience of the �nancial system. The second policy exercise then simulates
the model under an alternative policy rule in which the average increase in liquid assets is
identical to the �rst policy exercise but where the increase in liquid assets at each individual
bank is positively related to its interbank assets. This allows us to assess the impact of targeting
higher liquidity requirements on key players in the interbank network.
The third policy exercise analyses how imposing haircut-dependent liquidity requirements
might a¤ect the cyclicality of systemic risk. Finally, we consider what happens if the ampli�cation
mechanism underpinning the liquidity hoarding dynamic is attenuated somewhat. Since this
ampli�cation may be associated with uncertainty about the network among participants within
it, this exercise speaks to the impact that greater network transparency could have on �nancial
system resilience.
The parsimony of our framework allows us to incorporate insights from the recent literature on
�nancial crises. It draws on more conventional theoretical and empirical approaches that view the
�nancial system as a network.5 But it is able to assess resilience and policy interventions under
5More conventional theoretical models include Allen and Gale (2000), Freixas et al (2000) and Brusco andCastiglionesi (2007) �see Allen and Babus (2009) for a comprehensive survey. The empirical literature is surveyedby Upper (2011). This tends to use regulatory data on large exposures between banks to analyse default contagionin interbank markets �apart from a brief discussion by Fur�ne (2003), the role of liquidity e¤ects in the contagionprocess is largely ignored in this line of the literature.
Complexity, Concentration and Contagion 5
a much more realistic network structure, while placing liquidity e¤ects and funding contagion at
centre stage and still maintaining the generality of an analytical model. Our model also embodies
the ampli�cation role of collateral in recognising that a key risk in repo transactions stems from
shocks to the haircuts on the securities which serve as collateral, and complements the literature
on the behavioural foundations of the interbank freeze by articulating how a strong focus on
network contagion e¤ects may help to improve understanding of the probability and impact of
such events.6
The paper proceeds as follows. Section 2 presents some empirical motivation for a network
approach to the study of systemic risk. Section 3 outlines the model and describes analytically
how contagion can spread across a banking network. Section 4 presents the results of our six
experiments and four policy exercises. Section 5 draws out the policy implications and discusses
them in the context of the ongoing debate on regulatory reform. A �nal section concludes.
2. Stylised Evidence on Financial System Complexity and Concentration
Quantifying the complexity and concentration of �nancial systems is di¢ cult. Nevertheless,
data on interbank lending and intra-�nancial system activity provide some motivation for adopt-
ing a network approach, and for our focus on bank heterogeneity, liquidity hoarding dynamics,
and non-linearities.
Figure 1 depicts the network of bilateral large exposures between the major UK banks, with
the nodes representing banks, their size representing each bank�s overall importance in the inter-
bank network, and the darkness of the links re�ecting the value of interbank exposures between
institutions. The evident complexity highlights the need to move beyond stylised network repre-
sentations when analysing systemic risk. Concentration in the network is also clearly visible and
this is re�ected in the fat-tailed nature of the underlying distribution of linkages and loan sizes
implied by Figure 1.7
Evidence on the recent evolution of concentration and complexity motivates our focus on
these issues in relation to the interbank market collapse. Figure 2 points to growing concentration
within national �nancial boundaries, from already high starting points. It shows the marked rise6On the ampli�cation role of haircut shocks, see Brunnermeier and Pedersen (2009), Adrian and Shin (2010a),
Geanakoplos (2010) and Gorton and Metrick (2010). Key papers on the interbank freeze include Caballero andKrishnamurthy (2008), Allen et al (2009), Caballero and Simsek (2010), Bolton et al (2011), Diamond and Rajan(2011) and Acharya et al (2011). Acharya and Skeie (this issue) is another contribution in this vein. Their modelexplores how banks�uncertainty over their ability to roll over their own debt may cause them to restrict lendingin interbank markets. Although they do not consider how such behaviour may propagate through the interbanknetwork, their story of a precautionary motive for liquidity hoarding is consistent with the view of hoarding takenin this paper; indeed, it may be interpreted as providing a behavioural foundation for it.
7See Boss et al (2004) and Craig and von Peter (2010) for similar evidence on the Austrian and Germaninterbank markets, respectively. Properties of cross-border banking networks are discussed by von Peter (2007),Kubelec and Sa (2010) and Garratt et al (2011).
Complexity, Concentration and Contagion 6
in the combined assets of the three largest banks by total assets as a percentage of total banking
system assets in both the UK and US.8
Financial system complexity is likely to go hand-in-hand with intra-�nancial system activ-
ity which tends to increase the length of credit chains. Shin (2009) notes how the advent of
securitization markedly increased the complexity of the �nancial system by lengthening the in-
termediation chain in the lead up to the global �nancial crisis. In many cases, the same security
was used repeatedly in repo markets, with the lender using the security received as collateral to
borrow from others. As noted above, these transactions are subject to amplifying dynamics and
cyclical �uctuations linked to the variability of collateral haircuts over the credit cycle. Fluctu-
ations of this kind are illustrated by the dramatic rise and subsequent fall in the stock of repos
and �nancial commercial paper as a percentage of broad money in the US.9 And, as Figure 3
shows, the growth in intra-�nancial activity extended well beyond banks to other intermediaries,
with �nancial corporate debt (including banks and non-banks) accounting for some two-thirds of
the total growth in UK debt between 2003 and 2007.
Figure 4 illustrates the sudden and sharp rise in the cost of unsecured interbank borrowing
that followed the onset of di¢ culties at some institutions in August 2007 and, again in September
2008, following the collapse of Lehman Brothers. Precautionary hoarding by banks and growing
counterparty risks prompted a freeze in interbank borrowing. Such a breakdown of the interbank
market in the US, UK and Europe was an unprecedented event and the ensuing contagion placed
considerable funding pressure on banks in other jurisdictions. Prices alone do not tell the full
story. The quantity of funding available, especially at maturities greater than overnight, declined
dramatically. The counterpart to this was the sharp increase in banks�holdings of reserves with
central banks. This meant that national �nancial systems e¤ectively collapsed into a star network
with central banks at their centre.
3. A Network Model of the Banking System
In broad terms, our model explores the resilience of the �nancial system to liquidity shocks
a¤ecting a subset of banks under di¤erent network con�gurations, degrees of connectivity be-
tween �nancial institutions, haircut assumptions, and balance sheet characteristics. We start by
describing how the network of interbank exposures and balance sheets are constructed, before
discussing how shocks to haircuts which trigger liquidity hoarding at some institutions may po-
8King (2010) also provides evidence on this.9See Figure 10 in Adrian and Shin (2010b). For evidence of cyclicality in the underlying haircuts, see CGFS
(2010), Geanakoplos (2010), Gorton and Metrick (2010), and Krishnamurthy (2010).
Complexity, Concentration and Contagion 7
tentially propagate across the system. We then provide some intuition for the tipping points that
emerge in the simulations in section 4 by applying a simplifying assumption to the model. This
allows us to derive an explicit condition which identi�es whether or not the system is vulnerable
to a systemic liquidity crisis and how this is a¤ected by the parameters of the model, including
balance sheet characteristics and initial haircuts.
Throughout our analysis, the only sources of randomness in our model relate to the structure
of the network, which is drawn from an exogenously set distribution, and the initial idiosyncratic
shocks that trigger liquidity hoarding, which randomly a¤ect any bank in the system. As the
network fully determines the pattern of interbank linkages and because we also �x each bank�s
total interbank liability position exogenously, the value of each individual interbank linkage is
determined endogenously, and so therefore is each bank�s total interbank asset position. So
randomness in the network structure maps into randomness in each institution�s total interbank
asset position.
Otherwise, the model is entirely non-stochastic: once the network and an initial shock have
been drawn, the propagation of contagion is a purely deterministic process which depends on the
parameters of the model, all of which are exogenous. Given these parameters, the setup seeks to
explain whether or not an initial shock generates more widespread liquidity hoarding and, if so,
what fraction of the system is a¤ected by outbreaks of contagion. But despite the deterministic
nature of the contagion process, the randomness over the network and initiating shock imply
uncertainty over whether contagion will occur from an ex ante perspective. So we also explore
how the frequency of contagion is a¤ected by changes in both the distributional assumptions that
drive the network structure and in the nature of the initiating shocks.
3.1. The Financial Network
Table 1 provides a summary of all notation used in the paper. The �nancial network consists
of n �nancial intermediaries, �banks� for short, which are linked together randomly by their
unsecured claims on one another. Each bank is represented by a node on the network, and the
bilateral unsecured interbank exposures of bank i de�ne the links with other banks. These links
are directed, re�ecting the fact that interbank connections comprise both assets and liabilities.
The number of individual interbank exposures varies across banks. We suppose that each bank
has ji lending links representing its unsecured interbank assets (i.e. money lent to counterparties
by the bank) and ki borrowing links representing its unsecured interbank liabilities (i.e. money
borrowed by the bank from counterparties). Since every interbank lending link for one bank is
Complexity, Concentration and Contagion 8
a borrowing link for another bank, the average number of lending links across all banks in the
network must equal the average number of borrowing links. We refer to this quantity as the
average degree or connectivity of the system, and denote it by z.
The structure of bilateral claims and obligations in the �nancial network, as de�ned by the
joint distribution of lending and borrowing links and its moments (including the average degree),
plays a key role in determining how shocks spread through the network. Our general modelling
framework applies for any arbitrary choice of joint distribution, though we adopt speci�c as-
sumptions both when analysing the theoretical approximation to our model and in our numerical
simulations.10 This means that our results are able to encompass all possible network structures,
including any implied by a prior optimal network formation game and real-world networks like
the UK interbank network depicted in Figure 1.
3.2. Balance Sheets and Repo Haircuts
Figure 5 presents the composition of individual bank balance sheets in the model. The
liabilities of each bank i are comprised of unsecured interbank liabilities, LIBi ; repo liabilities (ie
borrowing secured with collateral), LRi ; retail deposits, LDi ; and capital, Ki. We assume that the
total unsecured interbank liability position of every bank is evenly distributed over each of its
borrowing links and is independent of the number of links the bank has.11
Since every interbank liability is another bank�s asset, unsecured interbank assets at each
bank, AIBi , are endogenously determined by the network links. So, although total unsecured
interbank assets equal total unsecured interbank liabilities in aggregate across the network, each
individual bank can have a surplus or de�cit in their individual unsecured interbank position.
Additionally, banks hold four further asset classes: �xed assets (eg individual corporate loans or
mortgages), AFi ; assets which may be used as collateral in repo transactions (�collateral assets�),
ACi ; reverse repo assets (ie collateralised lending), ARRi ; and fully liquid assets (eg cash, central
bank reserves, high-quality government bonds), ALi .
In our model, fully liquid assets can always be used as collateral to obtain repo �nancing if
required without any haircut (or alternatively sold without any price discount), i.e. borrowing
can be obtained against the full value of the asset. On the other hand, we assume that �xed
assets and unsecured interbank assets can never be used as collateral in repo transactions.
The aggregate haircut associated with using collateral assets to obtain repo funding is denoted
by h 2 [0; 1]. This haircut re�ects the perceived underlying risk of the collateral. It is designed10The framework also assumes that there is no statistical tendency for highly connected banks to be either more
or less likely to be linked to other highly connected banks or to poorly connected banks.11 If a bank has no borrowing links, LIBi = 0 for that bank.
Complexity, Concentration and Contagion 9
to protect lenders against losses that they may incur when trying to sell collateral in the event
that they are left with it due to counterparty default. Such losses may be caused by market
illiquidity, changing degrees of asymmetric information, or increases in the probability of default
on the underlying security over the duration of the loan. So changes in the likelihood of any of
these factors may a¤ect aggregate haircuts.12
We further allow for the possibility of a bank-speci�c haircut, hi, so that the maximum
amount of repo funding that can be obtained from collateral assets is given by (1� h� hi)ACi .
This idiosyncratic haircut might re�ect the greater default probability of a particular bank �
if the lender perceives that there is a higher chance it will fail, then it might demand a higher
haircut as extra protection both because it is more likely to end up with the collateral in practice,
and because there may be some legal risk in accessing the collateral in a timely fashion.
Reverse repo transactions are secured with collateral that commands the same aggregate
haircut as on ACi . This implies that the amount of collateral that bank i receives on its reverse
repo assets is given by ARRi = (1� h). We allow for this collateral to be fully rehypothecated (i.e.
reused in another unrelated transaction) to obtain repo funding with the same aggregate haircut,
h. The maximum amount of repo funding that can be obtained from rehypothecating collateral
obtained in reverse repo transactions is then given by [(1� h� hi) = (1� h)]ARRi .
3.3. Liquidity Shortages, Replenishment and Propagation
Given the balance sheet and haircut assumptions above, we now seek the condition under
which bank i will remain liquid in each period. To simplify our analysis, we preclude the possi-
bility of systematic retail deposit in�ows or out�ows and assume that banks cannot raise fresh
equity. We also assume that the central bank never takes collateral at more generous terms than
the market in its liquidity operations.
A bank is liquid if the total amount of collateral it has available to obtain repo funding (which
includes its fully liquid assets) plus any new unsecured interbank borrowing, LNi , is su¢ cient to
exceed the amount of existing repo funding it has and meet any idiosyncratic liquidity shock, �"i,
or loss of interbank funding that it might experience. Liquidity shocks or shocks to aggregate or
idiosyncratic haircuts thus have the potential to trigger a liquidity shortage at the bank.
If a bank faces such a liquidity shortage, it needs to take defensive action to avoid defaulting
on required payments. In our model, we assume that the bank tries in the �rst instance to
raise any resources needed by withdrawing (or, equivalently, refusing to roll over) unsecured
12For a more detailed explanation of why repo collateral involves haircuts and why these haircuts might �uctuate,see Gorton and Metrick (2010).
Complexity, Concentration and Contagion 10
interbank assets, AIBi , from counterparties it was lending to in the interbank network, i.e. it
hoards liquidity.13 Clearly, there are other avenues open to the bank. For example, it may try to
liquidate its �xed assets, AFi , in a �re sale. Alternatively, it might seek to raise the interest rate
it is prepared to o¤er on new interbank borrowing.14 As the recent crisis demonstrates, however,
liquidity hoarding was widely observed, whereas there was less evidence of widespread �re sales
or of banks �paying up�signi�cantly in interbank funding markets. This is largely because banks
typically viewed such actions as unattractive, last resort measures, given their large, direct costs
in terms of pro�tability and important adverse stigma e¤ects due to their high visibility. By
contrast, hoarding liquidity has fewer direct costs and since unsecured interbank transactions
are over-the-counter, adverse stigma e¤ects can be kept to a minimum. Indeed, in contrast to
other options, the bank may not need to make any active decision if it chooses not to roll over
interbank loans.15
Once we recognise liquidity hoarding, network e¤ects take centre stage. In particular, liquidity
shortages can propagate through the system via the network of interbank linkages. Suppose that
a fraction, �i, of banks connected to bank i in the network �hoard�liquidity from it, withdrawing
a portion of their deposits held at bank i. Further, let us suppose that, on average, these hoarding
banks withdraw a fraction � of the deposits that they hold at bank i. Under these assumptions,
bank i loses ��iLIBi of its liabilities due to liquidity hoarding by its counterparties in the network.
Therefore, taking into account the potential for lost deposits due to liquidity hoarding and the
haircut assumptions, its overall liquidity condition can be formally expressed as:
ALi + (1� h� hi)ACi +(1� h� hi)(1� h) ARRi + LNi � LRi � ��iLIBi � "i > 0 (1)
where the �rst four terms represent its available liquidity and the last three terms represent
funding it needs to cover with collateral, and funding out�ows.
The value of � is a key determinant of the strength of ampli�cation in the model �in particular,
the higher the value of �, the larger the shocks that can hit banks further down the chain
13Note that hoarding in this context is driven purely by the bank�s own liquidity needs; concerns over thesolvency of its counterparty play no role in its decision. In the model presented here, we assume that suchhoarding behaviour represents a genuine drain on the liquidity of the entire banking system, for example, endingup as increased reserves at central banks. As discussed by Gai and Kapadia (2011) in a similar model whichabstracts from repo market activity, hoarding behaviour can also be interpreted as a switch from lending at longmaturities (e.g. for three months or one year) to lending at much shorter maturities (e.g. overnight).14The bank could also try to cut lending to the real economy, AFi . While this was certainly observed during
the crisis, we abstract from this possibility as it is only likely to generate liquidity slowly. But the potential forthis type of credit crunch reaction is one of the key channels through which systemic liquidity crises can becomeso costly for society.15Diamond and Rajan (2011) observe that banks may be hesitant to enter into a �re sale because the alternative
of holding on to the asset may be more bene�cial. Adverse selection in the spirit of Stiglitz and Weiss (1981)points to the fact that banks may be unwilling to �pay up� signi�cantly in interbank markets as there is a riskthat wholesale lenders may view it as a signal of underlying di¢ culties. Acharya and Skeie (this issue) providebehavioural foundations for why banks may choose to hoard liquidity for precautionary reasons.
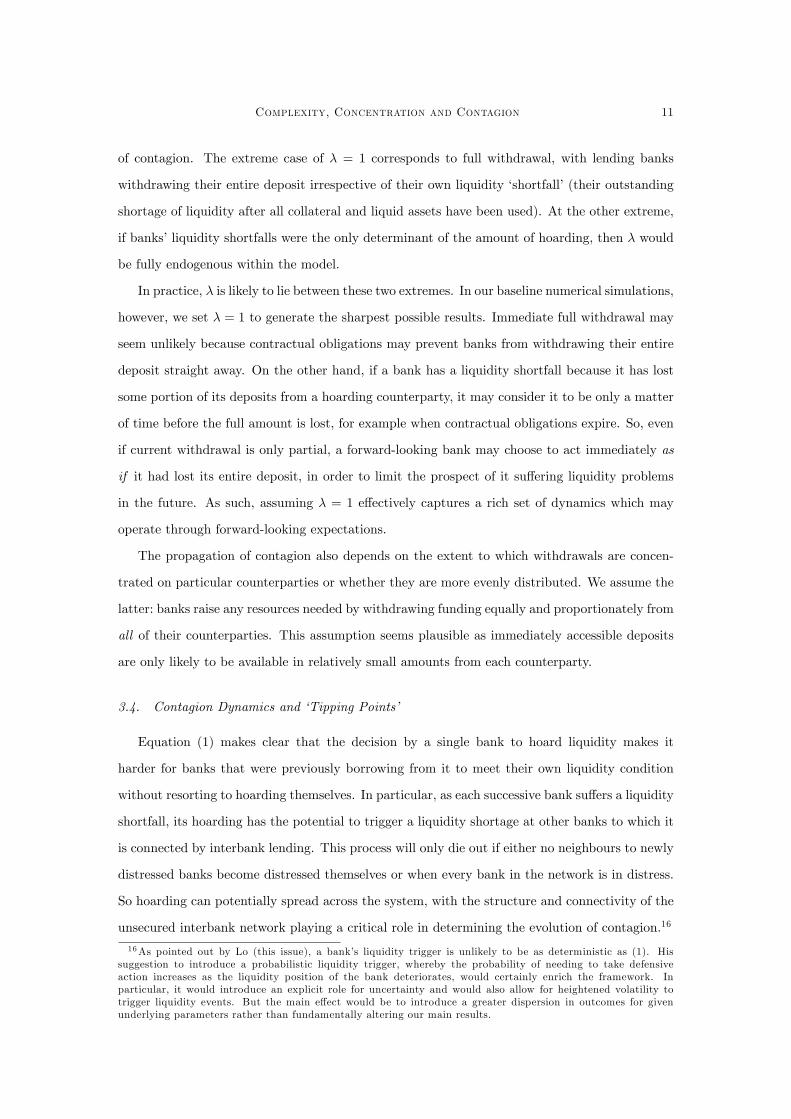
Complexity, Concentration and Contagion 11
of contagion. The extreme case of � = 1 corresponds to full withdrawal, with lending banks
withdrawing their entire deposit irrespective of their own liquidity �shortfall�(their outstanding
shortage of liquidity after all collateral and liquid assets have been used). At the other extreme,
if banks�liquidity shortfalls were the only determinant of the amount of hoarding, then � would
be fully endogenous within the model.
In practice, � is likely to lie between these two extremes. In our baseline numerical simulations,
however, we set � = 1 to generate the sharpest possible results. Immediate full withdrawal may
seem unlikely because contractual obligations may prevent banks from withdrawing their entire
deposit straight away. On the other hand, if a bank has a liquidity shortfall because it has lost
some portion of its deposits from a hoarding counterparty, it may consider it to be only a matter
of time before the full amount is lost, for example when contractual obligations expire. So, even
if current withdrawal is only partial, a forward-looking bank may choose to act immediately as
if it had lost its entire deposit, in order to limit the prospect of it su¤ering liquidity problems
in the future. As such, assuming � = 1 e¤ectively captures a rich set of dynamics which may
operate through forward-looking expectations.
The propagation of contagion also depends on the extent to which withdrawals are concen-
trated on particular counterparties or whether they are more evenly distributed. We assume the
latter: banks raise any resources needed by withdrawing funding equally and proportionately from
all of their counterparties. This assumption seems plausible as immediately accessible deposits
are only likely to be available in relatively small amounts from each counterparty.
3.4. Contagion Dynamics and �Tipping Points�
Equation (1) makes clear that the decision by a single bank to hoard liquidity makes it
harder for banks that were previously borrowing from it to meet their own liquidity condition
without resorting to hoarding themselves. In particular, as each successive bank su¤ers a liquidity
shortfall, its hoarding has the potential to trigger a liquidity shortage at other banks to which it
is connected by interbank lending. This process will only die out if either no neighbours to newly
distressed banks become distressed themselves or when every bank in the network is in distress.
So hoarding can potentially spread across the system, with the structure and connectivity of the
unsecured interbank network playing a critical role in determining the evolution of contagion.16
16As pointed out by Lo (this issue), a bank�s liquidity trigger is unlikely to be as deterministic as (1). Hissuggestion to introduce a probabilistic liquidity trigger, whereby the probability of needing to take defensiveaction increases as the liquidity position of the bank deteriorates, would certainly enrich the framework. Inparticular, it would introduce an explicit role for uncertainty and would also allow for heightened volatility totrigger liquidity events. But the main e¤ect would be to introduce a greater dispersion in outcomes for givenunderlying parameters rather than fundamentally altering our main results.
Complexity, Concentration and Contagion 12
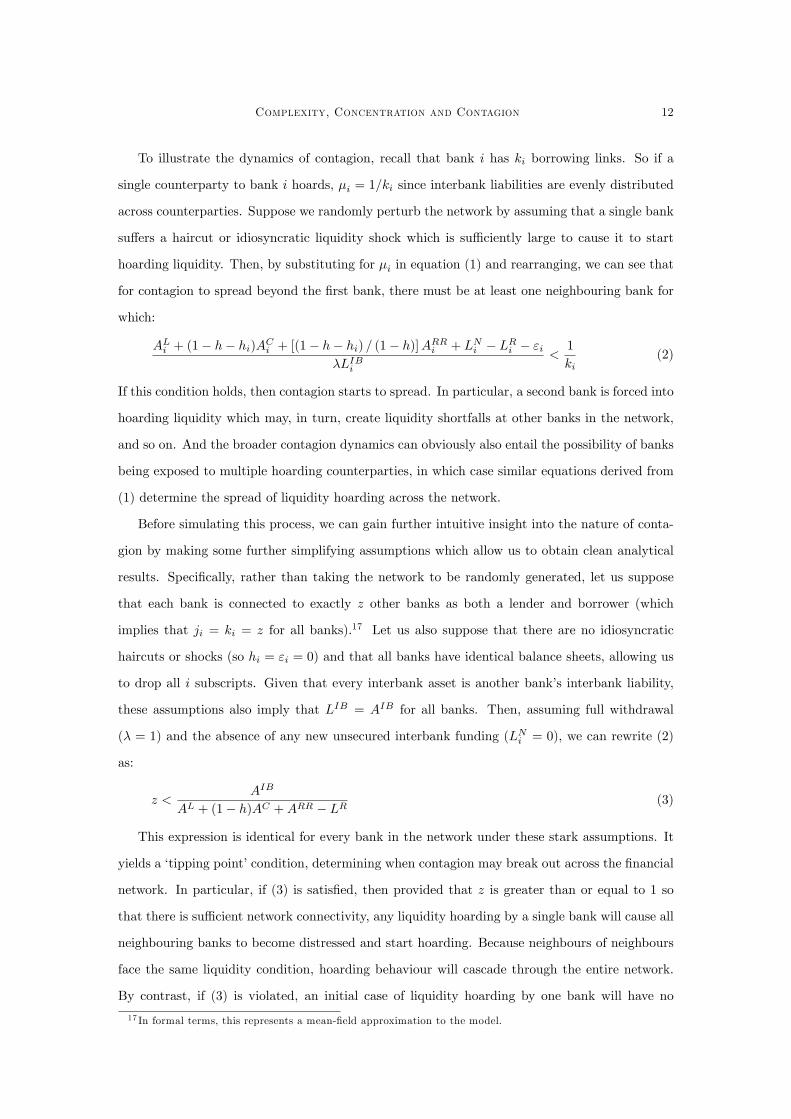
To illustrate the dynamics of contagion, recall that bank i has ki borrowing links. So if a
single counterparty to bank i hoards, �i = 1=ki since interbank liabilities are evenly distributed
across counterparties. Suppose we randomly perturb the network by assuming that a single bank
su¤ers a haircut or idiosyncratic liquidity shock which is su¢ ciently large to cause it to start
hoarding liquidity. Then, by substituting for �i in equation (1) and rearranging, we can see that
for contagion to spread beyond the �rst bank, there must be at least one neighbouring bank for
which:
ALi + (1� h� hi)ACi + [(1� h� hi) = (1� h)]ARRi + LNi � LRi � "i�LIBi
<1
ki(2)
If this condition holds, then contagion starts to spread. In particular, a second bank is forced into
hoarding liquidity which may, in turn, create liquidity shortfalls at other banks in the network,
and so on. And the broader contagion dynamics can obviously also entail the possibility of banks
being exposed to multiple hoarding counterparties, in which case similar equations derived from
(1) determine the spread of liquidity hoarding across the network.
Before simulating this process, we can gain further intuitive insight into the nature of conta-
gion by making some further simplifying assumptions which allow us to obtain clean analytical
results. Speci�cally, rather than taking the network to be randomly generated, let us suppose
that each bank is connected to exactly z other banks as both a lender and borrower (which
implies that ji = ki = z for all banks).17 Let us also suppose that there are no idiosyncratic
haircuts or shocks (so hi = "i = 0) and that all banks have identical balance sheets, allowing us
to drop all i subscripts. Given that every interbank asset is another bank�s interbank liability,
these assumptions also imply that LIB = AIB for all banks. Then, assuming full withdrawal
(� = 1) and the absence of any new unsecured interbank funding (LNi = 0), we can rewrite (2)
as:
z <AIB
AL + (1� h)AC +ARR � LR (3)
This expression is identical for every bank in the network under these stark assumptions. It
yields a �tipping point�condition, determining when contagion may break out across the �nancial
network. In particular, if (3) is satis�ed, then provided that z is greater than or equal to 1 so
that there is su¢ cient network connectivity, any liquidity hoarding by a single bank will cause all
neighbouring banks to become distressed and start hoarding. Because neighbours of neighbours
face the same liquidity condition, hoarding behaviour will cascade through the entire network.
By contrast, if (3) is violated, an initial case of liquidity hoarding by one bank will have no
17 In formal terms, this represents a mean-�eld approximation to the model.
Complexity, Concentration and Contagion 13
systemic consequences at all. As such, the �tipping point�condition clearly illustrates how very
small changes in the underlying parameters of the model can lead to fundamentally di¤erent
outcomes.18
Equation (3) also clari�es the conditions under which systemic liquidity crises may occur.
In particular, it highlights the way in which low liquid asset holdings, large adverse aggregate
haircut shocks, a high amount of repo borrowing, and a high level of unsecured interbank lending
are all likely to increase the susceptibility of the system to a widespread liquidity crisis. Our
simulations demonstrate that these results are borne out under more general assumptions.
4. Model Simulations
We now draw upon numerical simulations to o¤er further insight into the role of concentration
and complexity in contributing to systemic liquidity crises, and to assess a range of possible
�nancial stability policy interventions.
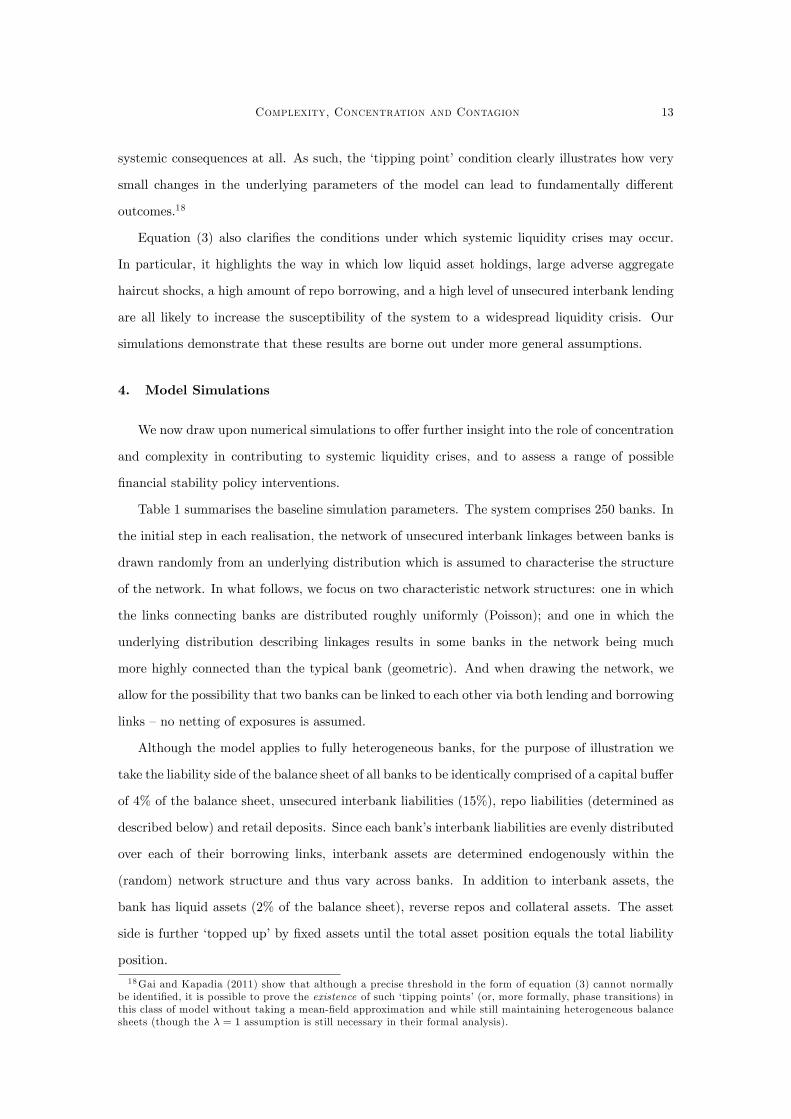
Table 1 summarises the baseline simulation parameters. The system comprises 250 banks. In
the initial step in each realisation, the network of unsecured interbank linkages between banks is
drawn randomly from an underlying distribution which is assumed to characterise the structure
of the network. In what follows, we focus on two characteristic network structures: one in which
the links connecting banks are distributed roughly uniformly (Poisson); and one in which the
underlying distribution describing linkages results in some banks in the network being much
more highly connected than the typical bank (geometric). And when drawing the network, we
allow for the possibility that two banks can be linked to each other via both lending and borrowing
links �no netting of exposures is assumed.
Although the model applies to fully heterogeneous banks, for the purpose of illustration we
take the liability side of the balance sheet of all banks to be identically comprised of a capital bu¤er
of 4% of the balance sheet, unsecured interbank liabilities (15%), repo liabilities (determined as
described below) and retail deposits. Since each bank�s interbank liabilities are evenly distributed
over each of their borrowing links, interbank assets are determined endogenously within the
(random) network structure and thus vary across banks. In addition to interbank assets, the
bank has liquid assets (2% of the balance sheet), reverse repos and collateral assets. The asset
side is further �topped up�by �xed assets until the total asset position equals the total liability
position.
18Gai and Kapadia (2011) show that although a precise threshold in the form of equation (3) cannot normallybe identi�ed, it is possible to prove the existence of such �tipping points�(or, more formally, phase transitions) inthis class of model without taking a mean-�eld approximation and while still maintaining heterogeneous balancesheets (though the � = 1 assumption is still necessary in their formal analysis).
Complexity, Concentration and Contagion 14
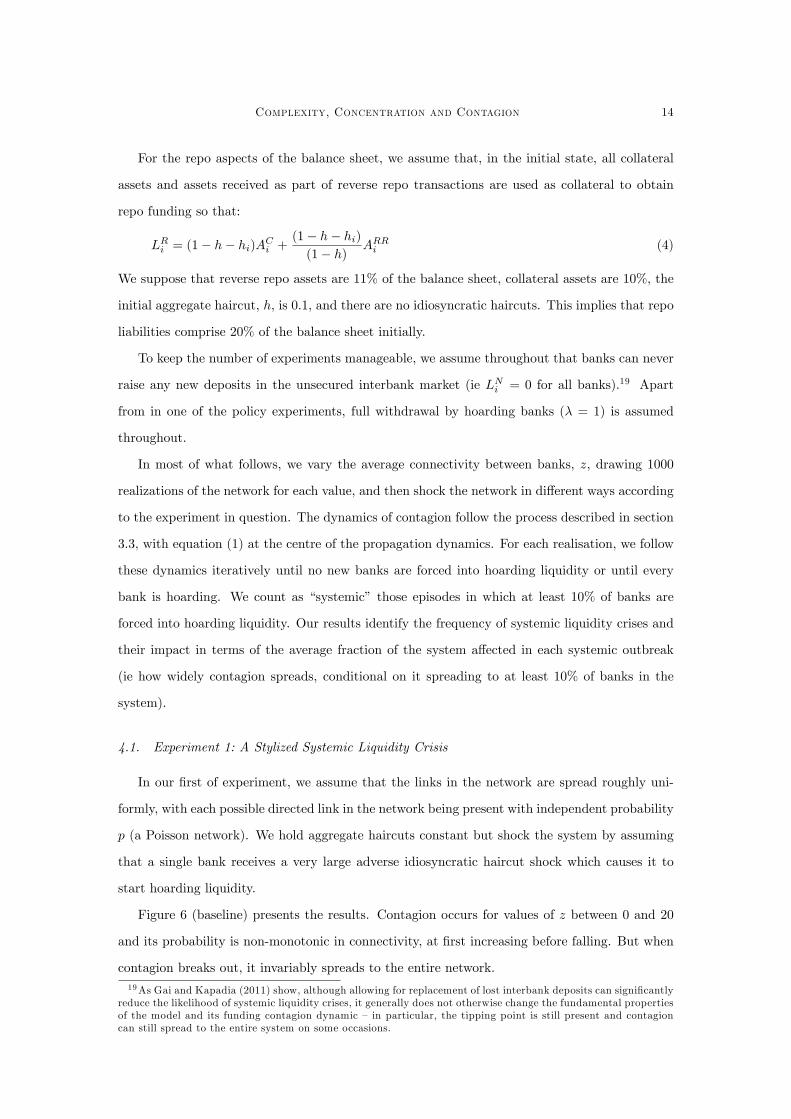
For the repo aspects of the balance sheet, we assume that, in the initial state, all collateral
assets and assets received as part of reverse repo transactions are used as collateral to obtain
repo funding so that:
LRi = (1� h� hi)ACi +(1� h� hi)(1� h) ARRi (4)
We suppose that reverse repo assets are 11% of the balance sheet, collateral assets are 10%, the
initial aggregate haircut, h, is 0.1, and there are no idiosyncratic haircuts. This implies that repo
liabilities comprise 20% of the balance sheet initially.
To keep the number of experiments manageable, we assume throughout that banks can never
raise any new deposits in the unsecured interbank market (ie LNi = 0 for all banks).19 Apart
from in one of the policy experiments, full withdrawal by hoarding banks (� = 1) is assumed
throughout.
In most of what follows, we vary the average connectivity between banks, z, drawing 1000
realizations of the network for each value, and then shock the network in di¤erent ways according
to the experiment in question. The dynamics of contagion follow the process described in section
3.3, with equation (1) at the centre of the propagation dynamics. For each realisation, we follow
these dynamics iteratively until no new banks are forced into hoarding liquidity or until every
bank is hoarding. We count as �systemic� those episodes in which at least 10% of banks are
forced into hoarding liquidity. Our results identify the frequency of systemic liquidity crises and
their impact in terms of the average fraction of the system a¤ected in each systemic outbreak
(ie how widely contagion spreads, conditional on it spreading to at least 10% of banks in the
system).
4.1. Experiment 1: A Stylized Systemic Liquidity Crisis
In our �rst of experiment, we assume that the links in the network are spread roughly uni-
formly, with each possible directed link in the network being present with independent probability
p (a Poisson network). We hold aggregate haircuts constant but shock the system by assuming
that a single bank receives a very large adverse idiosyncratic haircut shock which causes it to
start hoarding liquidity.
Figure 6 (baseline) presents the results. Contagion occurs for values of z between 0 and 20
and its probability is non-monotonic in connectivity, at �rst increasing before falling. But when
contagion breaks out, it invariably spreads to the entire network.19As Gai and Kapadia (2011) show, although allowing for replacement of lost interbank deposits can signi�cantly
reduce the likelihood of systemic liquidity crises, it generally does not otherwise change the fundamental propertiesof the model and its funding contagion dynamic � in particular, the tipping point is still present and contagioncan still spread to the entire system on some occasions.
Complexity, Concentration and Contagion 15
These results accord well with the analytical approximation at the end of section 3.4, which is
not too surprising because this approximation is most reasonable for a Poisson network. Speci�-
cally, given the parameters chosen in the baseline simulation, equation (3) suggests that contagion
will occur for z < 7:5 but not for z > 7:5. From Figure 6 (baseline), it is evident that z = 7:5 is
the point around which the probability of contagion starts to fall from close to one. The reason
it remains positive for higher values of z is due to the randomness of the network structure which
means that contagion can still break out under certain con�gurations. And the reason contagion
is not always certain for smaller values of z is that the initial shock may hit a bank which either
has no interbank assets, and is therefore unable to trigger any contagion by hoarding liquidity,
or is in an isolated subset of the network.
4.2. Experiment 2: Adding Aggregate Haircut Shocks
Our second experiment repeats the �rst but also incorporates an aggregate haircut shock that
increases the haircut from 0.1 to 0.2. This acts like a bank run in draining liquid assets from
every repo borrower in the system as they are all required to post more collateral to obtain the
same amount of repo funding. It is clear from (3) that this shifts the tipping point to around
z = 15. This is borne out by the results presented in Figure 6 (with aggregate haircut shock).
In some respects, this type of experiment mimics the behaviour of interbank markets in the
early part of the crisis during August and September 2007. In light of both bad news and greater
uncertainty on subprime mortgages and other types of collateral which were being used to back
repo and other secured forms of funding, aggregate haircuts increased. As a result, some banks
found themselves short of liquidity. This was especially true of banks which were forced to take
back assets from o¤-balance sheet vehicles for which liquidity had dried up. In response to their
own funding liquidity stress, some banks started to hoard in the unsecured interbank market.
As highlighted by Lo (this issue), uncertainty over the value of assets may also have exacer-
bated hoarding behaviour. The result was paralysis in the interbank market as re�ected by the
sharp increase in spreads depicted in Figure 4. This will have increased counterparty risk which
may have intensi�ed problems for some institutions. Although this framework abstracts from
the counterparty risk dimension, it makes clear how a seemingly small shock to a limited set of
assets which are being used as collateral can lead to a collapse in both secured and unsecured
interbank markets.20
20 In the model, hoarding entails withdrawal of funds while, in reality, much of the hoarding behaviour earlyin the crisis involved banks dramatically reducing the maturity of their lending. But, as noted above, the broadframework can be interpreted as speaking to this behaviour as well.
Complexity, Concentration and Contagion 16
4.3. Experiment 3: Systemic Liquidity Crises in a Concentrated Network
Real-world �nancial networks do not appear to be particularly uniform; instead they appear
to exhibit fat tails, with a small number of key players who are very highly connected both in
terms of the number of interbank relationships they have and in terms of the overall value of
those relationships. This re�ects the underlying concentration in the banking sector.
To explore the impact of concentration on our results, we repeat our �rst simulation exer-
cise but draw the network from a (geometric) distribution which embeds fat tails by allowing
some banks to have substantially more connections than the typical bank.21 Figure 7 (baseline)
presents the results. Contagion is less likely and less severe for low values of z than under the
Poisson distribution. This re�ects the well-known result that fat-tailed networks tend to be more
robust to random shocks (Anderson and May, 1991; Albert et al, 2000). On the other hand, it
is also clear that contagion can occur for much higher values of z, albeit rarely. So, for a broad
range of connectivity, higher concentration in the network makes the system more susceptible to
a systemic liquidity crisis.
4.4. Experiment 4: The Impact of Targeted Shocks in Concentrated and Less Concentrated Net-
works
Experiment 3 masks what is perhaps the key di¤erence between the fragility of concentrated
and less concentrated networks. Thus far, we have assumed that when the initial idiosyncratic
haircut shock occurs, it hits any bank in the network at random. Now suppose instead that the
initial shock hits the bank with the largest number of unsecured interbank lending relationships.
Figures 6 and 7 (with targeted shock) show the results for each type of network.
When the shock is targeted at the most connected interbank lender, contagion occurs more
frequently in both cases. But for the less concentrated (Poisson) network, a targeted shock
only makes a relatively small di¤erence to the results. By contrast, a targeted shock under
the concentrated (geometric) network has catastrophic consequences, making contagion a near
certainty for a very wide range of z. In the Poisson network, the most connected bank is not that
much more connected than the typical bank. But under the fat-tailed (geometric) network, the
most connected bank is likely to be connected to a very large portion of the other banks in the
network, so if it becomes distressed, it has the potential to spread contagion very widely. This
21 In the version implemented, we draw the number of borrowing and lending links separately from the samedistribution, implying that there is no correlation between the number of counterparties a bank lends to andborrows from. To construct the network, we also need to ensure that the total number of borrowing links drawnequals the total number of lending links. We follow the algorithm outlined by Newman et al (2001) to achievethis.
Complexity, Concentration and Contagion 17
is again consistent with the results of Anderson and May (1991) and Albert et al (2000), who
both demonstrate how fat-tailed networks are particularly susceptible to shocks targeted at key
participants.
It is clear that banks who are heavily involved in repo activity are more likely to face liquidity
shortages from aggregate haircut shocks. So the most dangerous banks for the stability of the
network are those which are both heavily involved in repo activity and big lenders in the unsecured
interbank market �the former because it makes them highly susceptible to the initial shock, the
latter because they propagate the shock widely. Because the banks that are heavily involved in
repo activity are typically the same large, complex �nancial institutions that are big players in the
unsecured interbank market, we can immediately see how the structure of the modern �nancial
system may be particularly prone to systemic collapse. It also demonstrates why the seemingly
small shocks of early / mid 2007 could have had such catastrophic systemic consequences as
they a¤ected banks that were both highly susceptible to liquidity disturbances and central to the
structure of the network.
4.5. Experiment 5: The Impact of Greater Complexity
Financial system complexity has no single de�nition and is di¢ cult to measure. But it seems
likely that, on any de�nition, it will be increased by intra-�nancial system activity, both in
unsecured and secured markets. Therefore, in this experiment, we consider a random shock
in a concentrated network (as in Experiment 3) but now suppose that unsecured interbank
liabilities comprise 25% rather than 15% of the balance sheet. As can be seen in Figure 7 (with
25% interbank liabilities), contagion occurs more frequently than in the baseline. Intuitively,
this is because the overall rise in interbank liabilities increases the likelihood of larger funding
withdrawals which cannot be absorbed by liquid assets.
4.6. Experiment 6: Cyclicality in Haircuts and the Likelihood of Systemic Liquidity Crises
It is perhaps more interesting to consider complexity in a dynamic setting. If unsecured
interbank lending were to increase over the economic cycle, then the system would become
increasingly vulnerable to shocks. And compression in aggregate haircuts, which often occurs
during the upswing of a cycle as the �nancial system becomes increasingly exuberant, may
in�uence the amount of repo market activity by allowing more secured funding to be generated
from a �xed amount of collateral.22 Rehypothecation of collateral may also increase in upswings,
22For more on the links between haircuts and repo activity over the economic cycle, see Adrian and Shin (2010a)or CGFS (2010).
Complexity, Concentration and Contagion 18
serving to increase the money multiplier and expand balance sheets. All of this may alter the
vulnerability of the �nancial system over time.
We provide an indicative simulation of such time-varying risks in our model by varying the
initial aggregate haircut from 0.25 to 0 (which, in turn, a¤ects the initial amount of repo funding
via equation (4)). We then assess the e¤ect of this on the frequency of systemic crises in response
to a combined shock in which the aggregate haircut jumps to a stressed level, taken to be 0.25,
and a single bank su¤ers a su¢ ciently large idiosyncratic shock that it is forced to start hoarding.
Figure 8 (diamonds) presents the results for a concentrated network with average connectivity
(z) �xed at 50. It is clear that risk in the system increases as the initial aggregate haircut falls,
pointing towards the potential for systemic risk to increase as the credit cycle evolves. The non-
linearity is due to the tipping point embedded in the model which implies that around critical
thresholds, the system suddenly becomes much more vulnerable to collapse.
4.7. Policy Exercise 1: Tougher Liquidity Requirements
We now turn to a series of policy experiments. Equation (3) implies that an increase in liquid
asset holdings should make the system directly less susceptible to systemic liquidity crises. So, in
our �rst policy exercise, we repeat Experiment 3 (random idiosyncratic shock in a concentrated
network) but suppose that 3.5% of assets are liquid rather than 2%. It is clear from Figure 9
(with additional liquid assets) that this makes the system less prone to collapse.
4.8. Policy Exercise 2: Systemic Liquidity Requirements
Experiment 4 revealed that concentrated networks were highly vulnerable to shocks to key
players. Therefore, it is interesting to consider the e¤ects of targeting higher liquidity require-
ments at such banks. So we simulate the model under a liquidity rule in which banks are required
to hold a minimum of 2% liquid assets, plus an amount equal to 10% of their total interbank
assets. Since interbank assets comprise 15% of total assets on average, this implies that the
average liquid asset holding is 3.5%, thus making the experiment directly comparable to Policy
Exercise 1. But banks with higher-than-average interbank assets will hold more liquid assets,
while banks with lower-than-average interbank assets will hold less.
Figure 9 (with systemic liquidity surcharge) presents the results. Comparing with the other
experiment in Figure 9, it is clear that the augmented liquidity rule is more e¤ective in reducing
the probability and spread of contagion than an equivalent across-the-board increase in liquid
asset requirements. The intuition is simple �targeting liquidity requirements at the banks which
Complexity, Concentration and Contagion 19
are most instrumental in spreading contagion is more potent than requiring peripheral players
to hold extra liquid assets.
4.9. Policy Exercise 3: Haircut-Dependent (Time-Varying) Liquidity Requirements
Experiment 6 demonstrated that the �nancial system might become increasingly vulnerable
to collapse as aggregate haircuts fall. One possible policy response would be to compensate for
this by linking liquidity requirements to aggregate haircuts � given the cyclical tendencies of
haircuts, this policy can also be interpreted as a time-varying liquidity requirement. The solid
circles and triangles in Figure 8 illustrate the e¤ects of amending Experiment 6 by introducing
a �tough�policy rule, in which liquid assets are required to rise from 2% of total assets at an
aggregate haircut of 0.25 to 4.5% when haircuts are zero, and a �weak�rule in which the liquid
asset requirement only rises to 3.25%. In both cases, policy intervention works to o¤set the
systemic risks created from lower aggregate haircuts by increasing resilience. Under the �tough�
policy rule, there is no increase in risk. Although not captured in the simulations, such policy
rules may also reduce the incentives of banks to cut haircuts in the �rst place via e¤ects operating
through expectations.
4.10. Policy Exercise 4: Greater Network Transparency
The assumption that hoarding banks fully withdraw their interbank deposits held with coun-
terparties acts as a key ampli�er in the model. Policy measures which help to promote greater
network transparency could help to mitigate such incentives to hoard liquidity. In the context of
the model, this would reduce the value of �. To illustrate this, Figure 10 presents results from
a simulation in which, rather than withdrawing all their interbank lending when under liquidity
stress, banks only withdraw an amount equal to their liquidity shortfall plus half of any remaining
interbank assets. It is clear that this greatly diminishes the likelihood of collapse.
5. Policy Implications
The literature on market failures in banking systems justi�es the need for static (micropru-
dential) regulation and dynamic (macroprudential) policy intervention.23 At the heart of the
systemic collapses modelled in this paper is an underlying network externality: banks fail to
internalise the consequences of their hoarding behaviour on others in the network.24 The scale
23See, for example, Allen and Gale (2004). For an overview of market failures which may justify a macropru-dential policy response, see Bank of England (2009).24Note that the externality in our model di¤ers from �conventional�network externalities in economics which
typically refer to the spillovers on users of particular services or products from the adoption of the service or
Complexity, Concentration and Contagion 20
of this externality depends on the network and balance sheet structure of the �nancial system
and behavioural assumptions such as the amount of liquidity hoarding when a bank is in distress
(the value of �). As the simulations involving targeted shocks make clear, these externalities
vary across banks. Given these externalities, there is a case for public policy intervention, along
a range of potential dimensions. These include:
(a) Tougher Microprudential Liquidity Regulation One immediate implication of our
results is that banks need to have a larger stock of genuinely high-quality liquid assets than they
would naturally choose given their own individual incentives. As noted above, it is clear from
equation (3) that an increase in liquid asset holdings makes the system directly less susceptible to
systemic liquidity crises. This is supported by the simulation results from the �rst policy exercise.
But to the extent that greater liquid asset bu¤ers also reduce the amount of repo activity and
overall balance sheet size, they may also indirectly improve the resilience of the system by making
banks less susceptible to haircut shocks. In equation (3), this would show up via a reduction in
the amount of repo liabilities. So tougher liquidity requirements may have an additional ex ante
bene�t for system resilience by dampening the money multiplier.
The model takes liquid assets to be those which can either be sold without any price discount
or used as collateral to obtain repo �nancing without any haircut. This clearly distinguishes them
from �collateral assets�which can only be used to obtain repo funding at a positive haircut. The
model suggests that any asset which is likely to have a large haircut in times of stress is much
less useful as a bu¤er against systemic liquidity crises. This points towards the importance of
microprudential liquidity regulation maintaining a relatively tight de�nition of what constitutes
a liquid asset. In particular, it suggests that holdings of bank debt (eg certi�cates of deposit,
covered bonds etc.) should not constitute the majority of banks�prudential liquid asset require-
ments because such assets are likely to have large haircuts and thus relatively little value in a
situation of systemic stress. They are �inside�liquidity. By contrast, genuine �outside�liquidity is
likely to prove much more useful. From an ex ante perspective, the model also suggests that ma-
turing interbank assets should not be allowed to contribute to liquid asset requirements because
if they are, then there is again less overall �outside�liquidity available in stress. Indeed, one of
the central points of the model is to demonstrate how withdrawals of interbank assets may be a
key ampli�er in precipitating a systemic liquidity crisis.25
product by others, and are often discussed in the context of telecommunications networks. But it is a networkexternality in the sense that the behaviour of individual participants can a¤ect other participants via the linksjoining them together.25This second issue is less clear-cut ex post once a liquidity crisis has begun. In this case, again for reasons
made clear by the model, it is better from a systemic perspective for banks to use their �outside�liquidity to meet
Complexity, Concentration and Contagion 21
Regulators internationally have just agreed, for the �rst time, international standards for
liquidity regulation. This includes a requirement for banks to hold su¢ cient genuinely liquid
securities to cover prospective out�ows of funds. The de�nition of liquid assets is narrowly
drawn and seeks explicitly to exclude �inside� liquidity. Some of the key parameters of this
liquidity regime can be justi�ed analytically using the model developed here.
(b) Macro-prudential Policy and Systemic Surcharges The results on concentration and
complexity highlight two di¤erent dimensions of risk linked to intra-�nancial system activity. For
a given level of concentration, lower aggregate haircuts or a more complex network are likely to
make the system more prone to collapse. Similarly, for a given level of complexity, a more
concentrated network is more vulnerable to shocks to key banks. Past experience suggests that
�uctuations in haircuts and the complexity of the network are likely to be at least partially
cyclical, while changes in network concentration are likely to be more structural.
By the Tinbergen principle, two distinct policy instruments (one time-varying and one struc-
tural) are thus likely to be needed to help address intra-�nancial system risks. These form the
bedrock of so-called macro-prudential policy. With the advent of the Financial System Oversight
Committee in the US, the European Systemic Risk Board in the EU and the Financial Policy
Committee in the UK, macro-prudential policy is about to become a reality.
In terms of structural macro-prudential instruments, one regulatory response to the too con-
centrated to fail problem is to levy a tax on institutions in line with their contribution to systemic
risk. Because systemic risk is an externality, such an approach is equivalent to the imposition
of a Pigouvian tax. Within the international regulatory community, the G20 and Financial Sta-
bility Board (FSB) are drawing up a blueprint for dealing with so-called systemically important
�nancial institutions (SIFIs). Among the options on the table are additional, graduated capi-
tal charges and regulatory limitations on the extent of exposures between these SIFIs (a �large
exposures�regime).
To target concentration and the structural aspects of interconnectivity e¤ectively, additional
capital or liquidity could be set aside according to banks�market shares in interbank activity (eg
the share of a bank�s interbank assets as a fraction of total interbank assets across all banks) and
potentially other systemically important markets. These additional bu¤ers would then help both
to enhance the resilience of SIFIs to shocks and create incentives for the network to become less
concentrated in the �rst place.
liquidity needs rather than withdrawing interbank funding. Therefore, care is needed to ensure that banks do nothave strong incentives to withdraw interbank funding rather than run down liquid assets ex post, for examplebecause such action helps to maintain prudential liquid asset bu¤ers at a high level.
Complexity, Concentration and Contagion 22
Our second policy exercise highlights the potential improvements in system resilience which
may be achieved by targeting higher liquidity requirements at the most connected banks in
the network. Importantly, it shows that even a mean-preserving redistribution of liquid assets
towards the more connected banks is stability-enhancing for the system as a whole. And this
exercise may understate the potential bene�ts of systemic liquidity policies because it does not
account for any reduction in concentration that might be incentivised by them.26
The cyclical aim of macro-prudential policy is to lean against the wind of the credit cycle,
much like monetary policy does in respect of the business cycle (Bank of England, 2009; Hanson
et al, 2011). There are a variety of instruments that might be used, including varying head-
line regulatory capital and liquidity ratios, changing the risk weights which attach to some of
the components of lending, and adjusting haircuts on secured �nancing to �nancial institutions
(CGFS, 2010).
Our third policy exercise demonstrates how haircut-dependent liquidity requirements, which
can be interpreted as time-varying liquidity requirements given the cyclical tendencies of haircuts,
can help to deliver a less fragile �nancial network. Increasing the amount of liquidity held
by banks as complexity increases may reduce the e¤ects of liquidity hoarding in the event of
stress. Such a policy may also help to mitigate the cyclical build-up in complexity by dampening
the money multiplier. Similarly, adjusting the haircuts on secured �nancing in a pro-cyclical
fashion could also help defuse the cyclical dynamics highlighted in our sixth experiment. More
generally, time-varying macro-prudential policy could be targeted at changes in intra-�nancial
system activity given its inherent cyclicality (and perhaps greater cyclicality than real economy
lending �see Figure 3). And raising the risk weights on intra-�nancial system exposures would
serve as another way of disincentivising network complexity.
(c) Network Transparency At present, very little is known about the dynamic properties of
the �nancial network. This is in part a result of data de�ciencies as �nancial data have tended
to be collected and analysed on an institution by institution basis (Haldane, 2009). Such data do
not allow an e¤ective mapping of the entire �nancial web or a simulation of its properties, though
small parts of its sub-structures such as the domestic payments and interbank networks have been
mapped in some countries. This may be all about to change. There are e¤orts internationally
26There is an interesting analogy to be drawn here with the use of targeted vaccination programmes to controlthe outbreak of disease. It is a well-known result in the epidemiology literature that if vaccine stocks are limited,programmes should be targeted at the most highly connected individuals (Anderson and May, 1991). The samelogic applies to banks here. But there is also an important di¤erence: while vaccinating particular individuals isunlikely to reduce the size of their social networks, applying surcharges to highly connected banks may create realcosts for them which may a¤ect the structure of the network in a desirable way. Thus targeted approaches maybe even more useful in relation to �nancial networks than they are in epidemiology.
Complexity, Concentration and Contagion 23
to begin collecting systematically much greater amounts of data on evolving �nancial network
structure, potentially in close to real time. For example, the introduction of the O¢ ce of Financial
Research (OFR) under the Dodd-Frank Act will nudge the United States in this direction.
This data revolution potentially brings at least two bene�ts. First, it ought to provide the
authorities with data to calibrate and parameterise the sort of network framework developed
here. An empirical mapping of the true network structure should allow for better identi�cation
of potential �nancial tipping points and cli¤ edges across the �nancial system. It could thus
provide a sounder, quantitative basis for judging remedial policy actions to avoid these cli¤
edges.
Second, more publicly available data on network structures may a¤ect the behaviour of �-
nancial institutions in the network. Armed with greater information on counterparty risk, banks
may feel less need to hoard liquidity following a disturbance. A reduction in network uncertainty
and counterparty risk could make banks�liquidity decisions less hair-trigger. This would have a
collective bene�t, lessening the potential for destabilising liquidity spirals.
In the context of the model, a lower incentive to hoard liquidity would reduce the value of
�. Our �nal policy exercise shows how this diminishes the frequency of contagion across the
network.
(d) Netting and Central Clearing The �nancial system is a dense cats-cradle of exposures.
These gross exposures can easily exceed a bank�s capital. And it is gross exposures which matter
when gauging the virulence of contagion through a network. One means of reducing this contagion
is by netting-o¤ gross exposures between participants within the �nancial system as this would
lower the value of interbank connections relative to balance sheet size. In graphical terms, this
would have a similar e¤ect to moving from the case with 25% interbank liabilities to the baseline
in Figure 7.
There have been recent attempts by regulators internationally to achieve such netting bene�ts
across the �nancial system, in particular in respect of derivatives contracts. Algorithms have been
developed which either eliminate (in the case of redundant transactions) or net-down (in the case
of perfectly o¤setting transactions) outstanding derivatives contracts.
A more ambitious, and far-reaching, regulatory initiative is the drive from the G20 and FSB
to centrally clear a much larger proportion of, in particular, over-the-counter products through
central counterparties (CCPs). Our model speaks to the rationale for such action given that
CCPs may a¤ect both complexity and concentration.
On complexity, a CCP simpli�es the network of bilateral exposures. Higher-order, unobserv-
Complexity, Concentration and Contagion 24
able counterparty credit risk is replaced by �rst-order, observable counterparty risk with respect
to the CCP. This, too, ought to reduce the sensitivity of banks�liquidity hoarding to disturbances,
thereby lowering the fragility of the system as a whole, in line with the fourth policy exercise.
On concentration, a CCP alters the structural con�guration of the network. This now re-
sembles a star formation rather than a cats-cradle. From a resilience perspective, this is a
double-edged sword. On the one hand, concentration among the key �nancial institutions is
e¤ectively eliminated, reducing the contagion risk from SIFIs. In the context of the model, this
is the limiting case of moving towards a more fat-tailed distribution, comparing the baseline in
Figures 6 and 7. On the other, concentration risk is, in an important sense, relocated rather than
eliminated, from SIFIs to the CCP. This underscores the importance of ensuring that CCPs are
bullet-proof moving forward as they clear larger numbers of transactions.
At the height of the crisis, the �nancial network degenerated to a hub-and-spoke con�guration.
The central bank became the de facto central counterparty. To avoid that outcome ex post, a
set of bullet-proof CCPs could enforce a simpli�ed hub-and spoke con�guration ex ante. From
an incentives and counterparty uncertainty perspective, this ex-ante structure seems preferable.
6. Conclusion
This paper has developed a network model of interbank interactions which seeks to embody
many of the key structural features of the �nancial system. The framework generates knife-
edge liquidity dynamics which have strong echoes with the systemic liquidity crisis of 2007-8.
We showed how concentration and complexity may be key ampli�ers of this fragility by poten-
tially leaving the system highly vulnerable to distress at key institutions and increasing risk
over the economic cycle. The paper has also identi�ed some public policy measures which could
mitigate these fragilities, many of which are currently being designed or implemented interna-
tionally. These include tougher microprudential liquidity regulation, countercyclical liquidity
requirements, and surcharges for systemically important �nancial institutions.
The model could be improved in several respects. It could be made more practically relevant
by incorporating a stronger role for uncertainty. Calibrating it to the data would allow it to match
more closely the unfolding of the crisis, though the lack of available information on the interbank
network and haircuts would present signi�cant challenges. It would also be interesting to enrich
the framework by incorporating a stronger role for behavioural considerations, for example in
relation to the formation of links. This would allow for endogeneity in the network structure.
Another interesting extension of the network approach would be to consider the e¤ects of
Complexity, Concentration and Contagion 25
policy measures which act on �nancial system structure more directly �a quantity rather than
price-based approach to regulation. Following Weitzman (1974), this directive approach may be
optimal if there is uncertainty about the elasticities associated with price-based instruments. In
the spirit of Simon (1962), the aim of such structural interventions would be to create a �nancial
system that was decomposable and modular. A number of regulatory initiatives and ideas are
currently in train which speak to this agenda.
One is �living wills�or, more formally, recovery and resolution plans (RRPs). These require
banks to draw up plans for how they would be wound-down in an orderly fashion in the event
of failure. The newly-passed Dodd-Frank Act in the US requires that US �rms draw up credible
RRPs. Pilot RRPs are currently being drawn up for the world�s largest �nancial institutions. A
second idea, which is being debated within academic and policymaking circles, is the potential for
ring-fencing of �nancial activities, either within �rms or across them. The Volcker rule, enacted
in US Legislation recently, is one example, in this case in respect of proprietary trading activity;
the Glass-Steagall Act, which separated investment and commercial banking in the US between
1933 and 1999, is another.
These structural measures have the advantage that they act directly on the topology of the
network. As such, they may be less subject to implementation error. Firebreaks and �rewalls are
familiar fail-safe devices against systemic problems in other networks, from infectious diseases
spreading across people to infectious viruses spreading across the web, from transport networks
to meteorology maps, from forest-�re control to military control (Haldane, 2009). The model
developed here could be adapted to assess the systemic implications of these structural policy
measures. In some respects, this would represent a truer test of Herbert Simon�s complexity
hypothesis in a �nancial system context.
Acknowledgments
This paper was prepared for the November 2010 Carnegie-Rochester Conference on Public
Policy. We thank Clare Rogowski and, particularly, Jason Dowson for outstanding research
assistance. We are also grateful to John Elliott, Marvin Goodfriend, Andrew Lo, Lavan Mahadeva
and seminar participants at the Bank of England, Imperial College London, the University of
Auckland, the Carnegie-Rochester Conference on Public Policy (Pittsburgh, 12-13 November
2010) and the Reserve Bank of New Zealand Workshop on Macroprudential Policy (Wellington,
21 March 2011) for helpful comments and suggestions.
Complexity, Concentration and Contagion 26
References
Acharya, V, Gale, D and T Yorulmazer (2011), Rollover risk and market freezes, Journal of
Finance, 66(4), 1177-1209.
Acharya, V and D Skeie (2011), A model of liquidity hoarding and term premia in inter-bank
markets, Journal of Monetary Economics, 58(5).
Adrian, T and H S Shin (2010a), Liquidity and leverage, Journal of Financial Intermediation,
19 (3), 418-437.
Adrian, T and H S Shin (2010b), The changing nature of �nancial intermediation and the �nancial
crisis of 2007-09, Annual Review of Economics, 2, 603-618.
Albert, R, Jeong, H and A-L Barabasi (2000), Error and attack tolerance of complex networks,
Nature, 406, 378-382.
Alessandri, P and Haldane, A G (2009), Banking on the state, Paper from material presented
at the Federal Reserve Bank of Chicago/World Bank event �International Financial Crisis:
Have the Rules of Finance Changed?, 24 September 2009.
Allen, F and A Babus (2009), Networks in �nance, in The Network Challenge: Strategy, Pro�t,
and Risk in an Interlinked World, Kleindorfer, P, Wind, Y and R Gunther (eds.), Wharton
School Publishing.
Allen, F, Carletti, E and D Gale (2009), Interbank market liquidity and central bank intervention,
Journal of Monetary Economics, 56(5), 639-652.
Allen, F and D Gale (2000), Financial contagion, Journal of Political Economy, 108(1), 1-33.
Allen, F and D Gale (2004), Financial intermediaries and markets, Econometrica, 72(4), 1023�
1061.
Anderson, R and R May (1991), Infectious diseases of humans: dynamics and control, Oxford
University Press.
Bank of England (2009), The role of macroprudential policy. November.
Bolton, P, Santos, T and J Scheinkman (2011), Outside and inside liquidity, Quarterly Journal
of Economics, 126(1), 259-321.
Complexity, Concentration and Contagion 27
Boss, M, Elsinger, H, Thurner S and M Summer (2004), Network topology of the interbank
market, Quantitative Finance, 4(6), 677-684.
Brunnermeier, M. K. and Pedersen, L. H. (2009), Market liquidity and funding liquidity, Review
of Financial Studies, 22(6), 2201-2238.
Brusco, S and F Castiglionesi (2007), Liquidity coinsurance, moral hazard, and �nancial conta-
gion, Journal of Finance, 62(5), 2275-2302.
Caballero, R and A Krishnamurthy (2008), Collective risk management in a �ight to quality
episode, Journal of Finance, 63(5), 2195-2230.
Caballero, R and A Simsek (2010), Fire sales in a model of complexity, mimeo, MIT.
CGFS (2010), The role of margin requirements and haircuts in procyclicality, CGFS Papers,
Number 36.
Craig, B and G von Peter (2010), Interbank tiering and money center banks, Bank for Interna-
tional Settlements Working Paper, Number 322.
Diamond, D and R Rajan (2011), Fear of �re sales, illiquidity seeking and credit freezes, Quarterly
Journal of Economics, 126(2), 557-591.
Freixas, X, Parigi, B and J-C Rochet (2000), Systemic risk, interbank relations and liquidity
provision by the central bank, Journal of Money, Credit and Banking, 32(3), 611-638.
Fur�ne, C H (2003), Interbank exposures: quantifying the risk of contagion. Journal of Money,
Credit and Banking, 35(1), 111-128.
Gai, P and S Kapadia (2010), Contagion in �nancial networks. Proceedings of the Royal Society
A, 466, no. 2120, 2401-2423.
Gai, P and S Kapadia (2011), Liquidity hoarding, network externalities, and interbank market
collapse, mimeo, Bank of England.
Garratt, R J, Mahadeva, L and K Svirydzenka (2011), Mapping systemic risk in the international
banking network, Bank of England Working Paper, Number 413.
Geanakoplos, J (2010), Solving the present crisis and managing the leverage cycle, Federal Reserve
Bank of New York Economic Policy Review, August, 16(1).
Gorton, G and A Metrick (2010), Haircuts, Federal Reserve Bank of St. Louis Review, Novem-
ber/December, 92(6), 507-520.
Complexity, Concentration and Contagion 28
Haldane, A G (2009), Rethinking the �nancial network, Speech at the Financial Student Associ-
ation, Amsterdam, 28 April.
Haldane, A G and R May (2011), Systemic risk in banking ecosystems, Nature, 469, 351-355.
Hanson, S G, Kashyap, A K and J C Stein (2011), A Macroprudential Approach to Financial
Regulation, Journal of Economic Perspectives, 25(1), 3-28.
Jackson, M (2008), Social and Economic Networks, Princeton University Press, NJ, USA.
King, M (2010), Banking: From Bagehot to Basel, and back again, Speech at the Second Bagehot
Lecture Buttonwood Gathering, New York City, 25 October.
Krishnamurthy, A (2010), How Debt Markets have Malfunctioned in the Crisis, Journal of Eco-
nomic Perspectives, 24(1), 3-28.
Kubelec, C and F Sa (2010), The geographical composition of national external balance sheets:
1980-2005, Bank of England Working Paper, Number 384.
Lo, A (2011), Comments on "Complexity, Concentration and Contagion", Journal of Monetary
Economics, 58(5).
May, R, Levin, S and G Sugihara (2008), Ecology for bankers, Nature, 451, 893-895.
May, R and N Arinaminpathy (2010), Systemic risk: the dynamics of model banking systems,
Journal of the Royal Society Interface, 46, 823-838.
Newman, M, Strogatz, S and D Watts (2001), Random graphs with arbitrary degree distributions
and their applications, Physical Review E, 64, 026118.
Simon, H (1962), The architecture of complexity, Proceedings of the American Philosophical
Society, 106(6), 467-482.
Shin, H (2009), Financial Intermediation and the Post-Crisis Financial System, Paper presented
at the 8th BIS Annual Conference, June.
Stiglitz, J and A Weiss (1981), Credit Rationing in Markets with Imperfect Information, Amer-
ican Economic Review, 71(3), 393-410.
Upper, C (2011), Simulation methods to assess the danger of contagion in interbank markets,
Journal of Financial Stability, 7(3), 111-125.
Complexity, Concentration and Contagion 29
von Peter, G (2007), International banking centres: a network perspective, BIS Quarterly Review,
December.
Watts, D (2002), A simple model of global cascades on random networks, Proceedings of the
National Academy of Sciences, 99(9), 5766-5771.
Weitzman, M L (1974), Prices vs. Quantities, Review of Economic Studies, 41(4), 477-91.
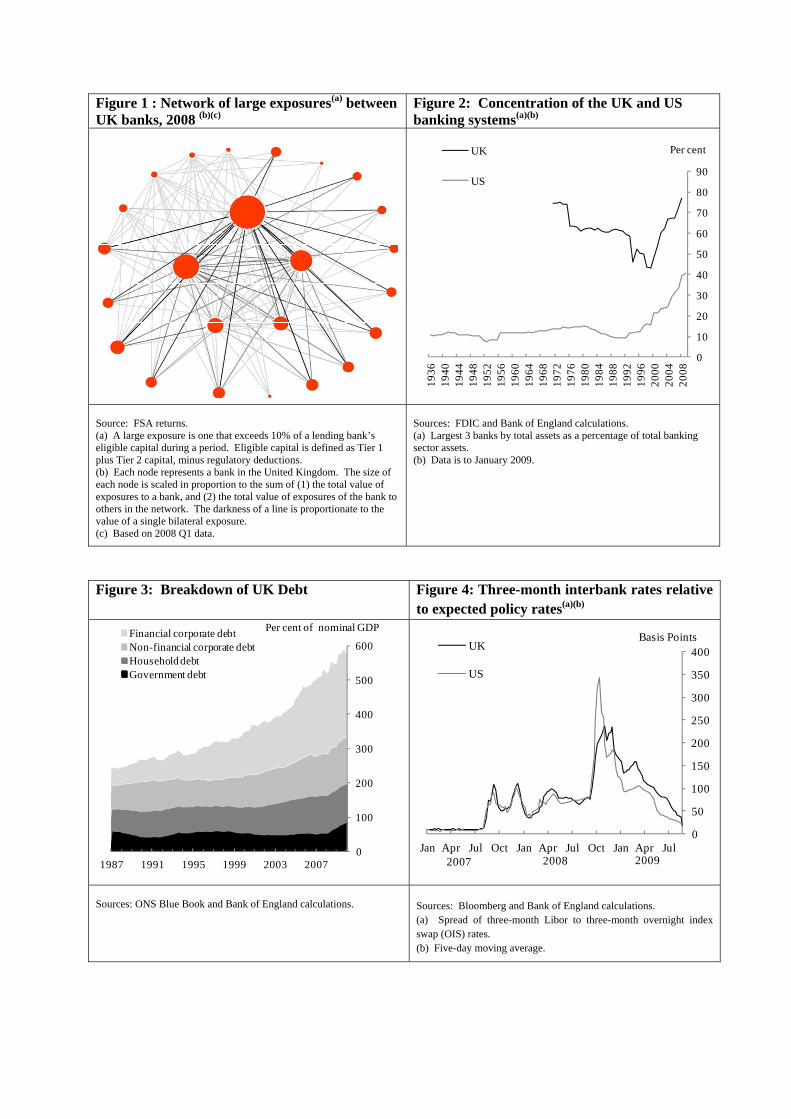
Figure 1 : Network of large exposures(a) between UK banks, 2008 (b)(c)
Figure 2: Concentration of the UK and US banking systems(a)(b)
Source: FSA returns. (a) A large exposure is one that exceeds 10% of a lending bank’s eligible capital during a period. Eligible capital is defined as Tier 1 plus Tier 2 capital, minus regulatory deductions. (b) Each node represents a bank in the United Kingdom. The size of each node is scaled in proportion to the sum of (1) the total value of exposures to a bank, and (2) the total value of exposures of the bank to others in the network. The darkness of a line is proportionate to the value of a single bilateral exposure. (c) Based on 2008 Q1 data.
Sources: FDIC and Bank of England calculations. (a) Largest 3 banks by total assets as a percentage of total banking sector assets. (b) Data is to January 2009.
Figure 3: Breakdown of UK Debt
Figure 4: Three-month interbank rates relative to expected policy rates(a)(b)
Sources: ONS Blue Book and Bank of England calculations.
Sources: Bloomberg and Bank of England calculations. (a) Spread of three-month Libor to three-month overnight index swap (OIS) rates. (b) Five-day moving average.
0
10
20
30
40
50
60
70
80
90
1936
1940
1944
1948
1952
1956
1960
1964
1968
1972
1976
1980
1984
1988
1992
1996
2000
2004
2008
Per centUK
US
0
100
200
300
400
500
600
1987 1991 1995 1999 2003 2007
Financial corporate debtNon-financial corporate debtHousehold debtGovernment debt
Per cent of nominal GDP
0
50
100
150
200
250
300
350
400
Jan Apr Jul Oct Jan Apr Jul Oct Jan Apr Jul
UK
US
Basis Points
2007 2008 2009
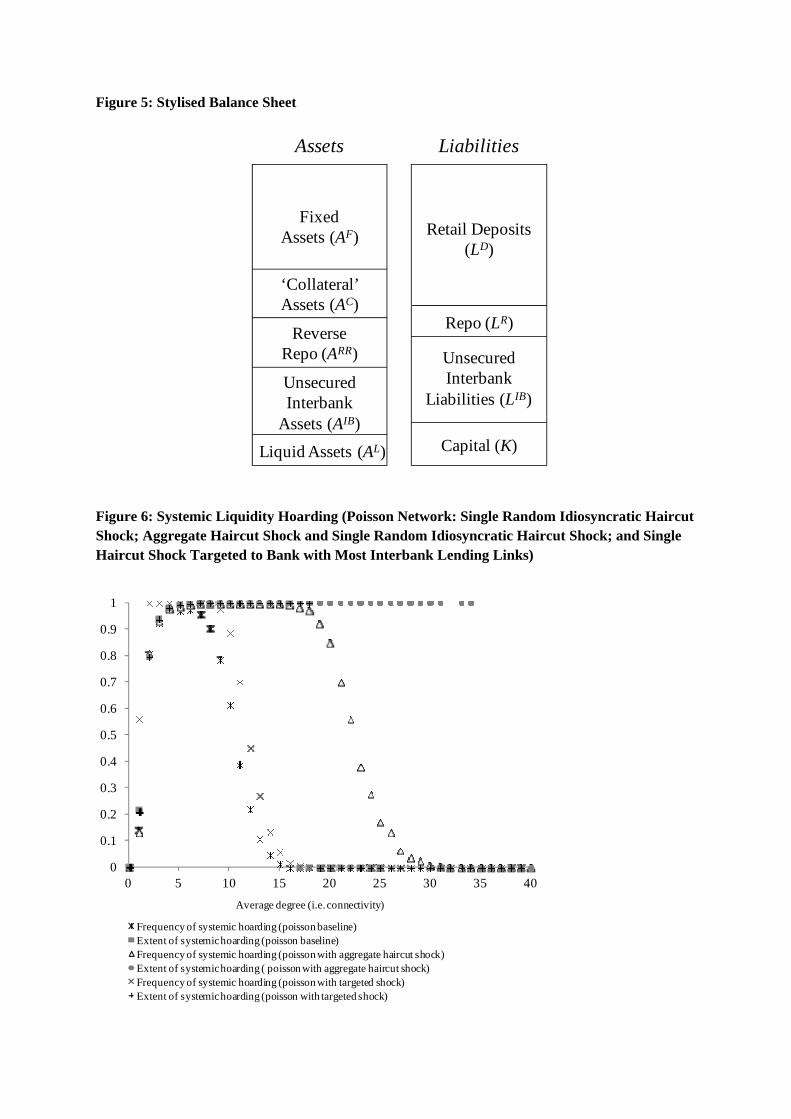
Figure 5: Stylised Balance Sheet
Figure 6: Systemic Liquidity Hoarding (Poisson Network: Single Random Idiosyncratic Haircut Shock; Aggregate Haircut Shock and Single Random Idiosyncratic Haircut Shock; and Single Haircut Shock Targeted to Bank with Most Interbank Lending Links)
Fixed Assets (AF)
Unsecured Interbank
Assets (AIB)
Retail Deposits (LD)
Unsecured Interbank
Liabilities (LIB)
Capital (K)
Assets Liabilities
Liquid Assets (AL)
‘Collateral’ Assets (AC)
Reverse Repo (ARR)
Repo (LR)
0
0.1
0.2
0.3
0.4
0.5
0.6
0.7
0.8
0.9
1
0 5 10 15 20 25 30 35 40
Frequency of systemic hoarding (poisson baseline)Extent of systemic hoarding (poisson baseline)Frequency of systemic hoarding (poisson with aggregate haircut shock)Extent of systemic hoarding ( poisson with aggregate haircut shock)Frequency of systemic hoarding (poisson with targeted shock)Extent of systemic hoarding (poisson with targeted shock)
Average degree (i.e. connectivity)
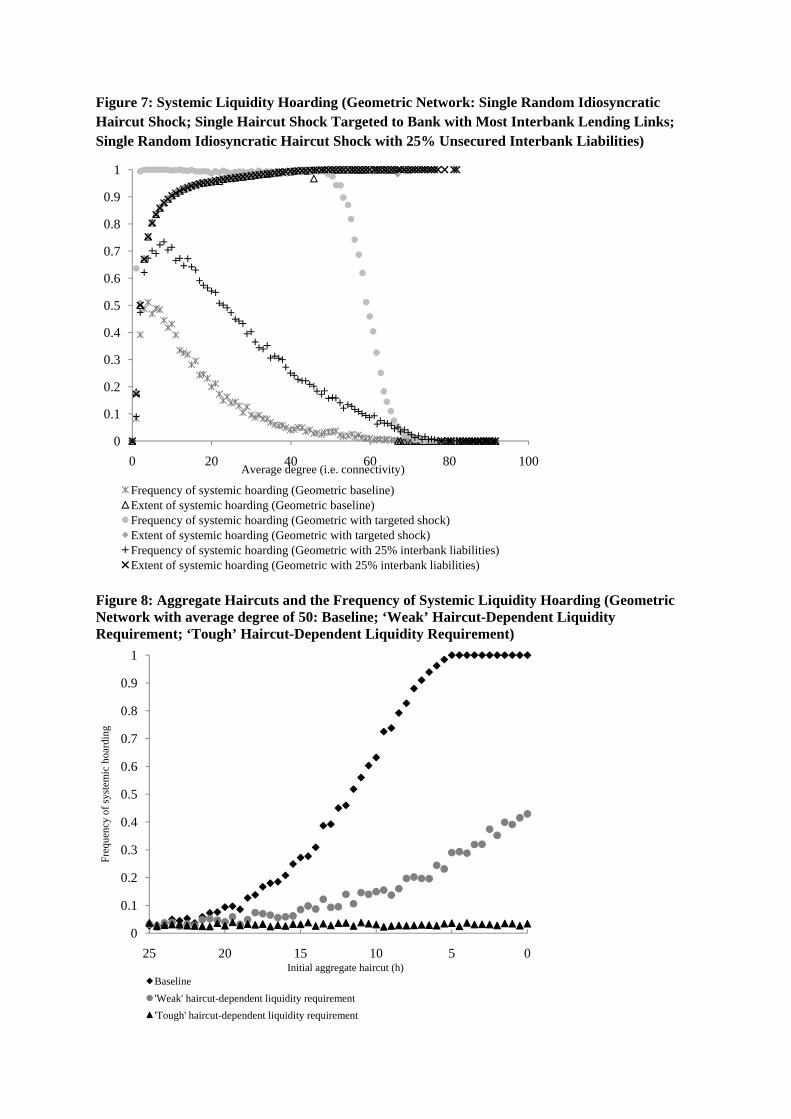
Figure 7: Systemic Liquidity Hoarding (Geometric Network: Single Random Idiosyncratic Haircut Shock; Single Haircut Shock Targeted to Bank with Most Interbank Lending Links; Single Random Idiosyncratic Haircut Shock with 25% Unsecured Interbank Liabilities)
Figure 8: Aggregate Haircuts and the Frequency of Systemic Liquidity Hoarding (Geometric Network with average degree of 50: Baseline; ‘Weak’ Haircut-Dependent Liquidity Requirement; ‘Tough’ Haircut-Dependent Liquidity Requirement)
0
0.1
0.2
0.3
0.4
0.5
0.6
0.7
0.8
0.9
1
0 20 40 60 80 100
Frequency of systemic hoarding (Geometric baseline)Extent of systemic hoarding (Geometric baseline)Frequency of systemic hoarding (Geometric with targeted shock)Extent of systemic hoarding (Geometric with targeted shock)Frequency of systemic hoarding (Geometric with 25% interbank liabilities)Extent of systemic hoarding (Geometric with 25% interbank liabilities)
Average degree (i.e. connectivity)
0
0.1
0.2
0.3
0.4
0.5
0.6
0.7
0.8
0.9
1
0510152025
Fre
quen
cy o
f sy
stem
ic h
oard
ing
Initial aggregate haircut (h) Baseline
'Weak' haircut-dependent liquidity requirement
'Tough' haircut-dependent liquidity requirement
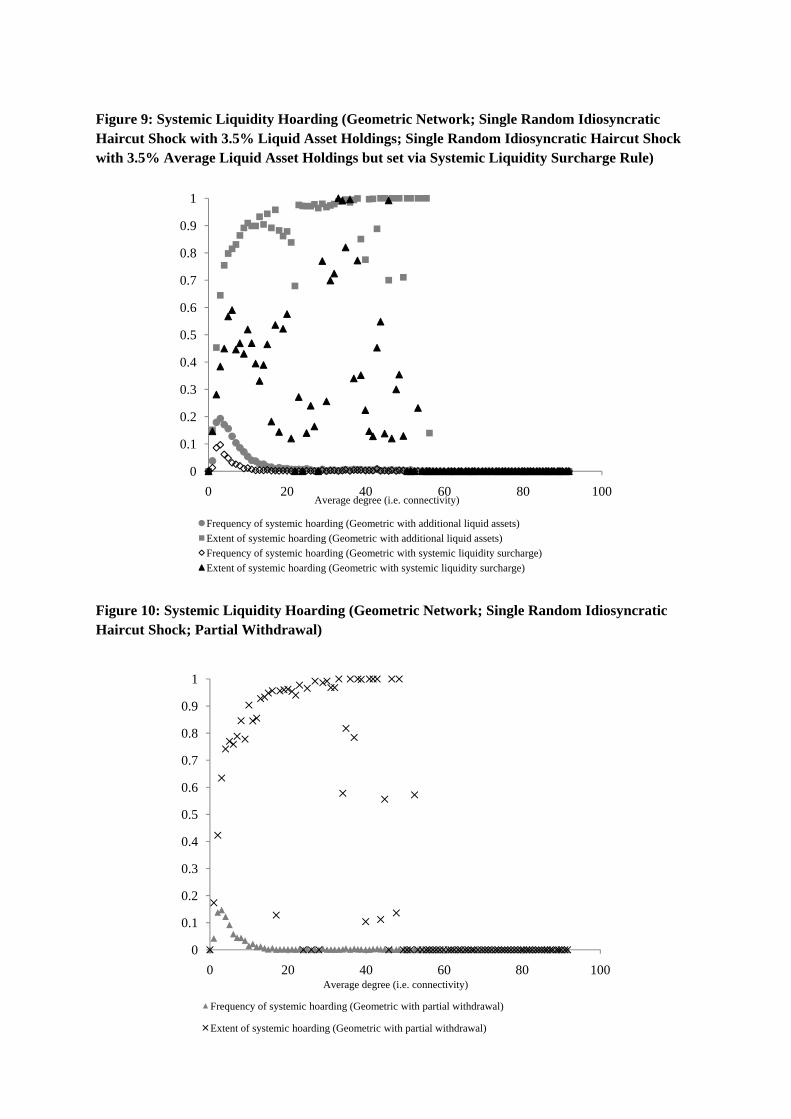
Figure 9: Systemic Liquidity Hoarding (Geometric Network; Single Random Idiosyncratic Haircut Shock with 3.5% Liquid Asset Holdings; Single Random Idiosyncratic Haircut Shock with 3.5% Average Liquid Asset Holdings but set via Systemic Liquidity Surcharge Rule)
Figure 10: Systemic Liquidity Hoarding (Geometric Network; Single Random Idiosyncratic Haircut Shock; Partial Withdrawal)
0
0.1
0.2
0.3
0.4
0.5
0.6
0.7
0.8
0.9
1
0 20 40 60 80 100
Frequency of systemic hoarding (Geometric with additional liquid assets)
Extent of systemic hoarding (Geometric with additional liquid assets)
Frequency of systemic hoarding (Geometric with systemic liquidity surcharge)
Extent of systemic hoarding (Geometric with systemic liquidity surcharge)
Average degree (i.e. connectivity)
0
0.1
0.2
0.3
0.4
0.5
0.6
0.7
0.8
0.9
1
0 20 40 60 80 100
Frequency of systemic hoarding (Geometric with partial withdrawal)
Extent of systemic hoarding (Geometric with partial withdrawal)
Average degree (i.e. connectivity)
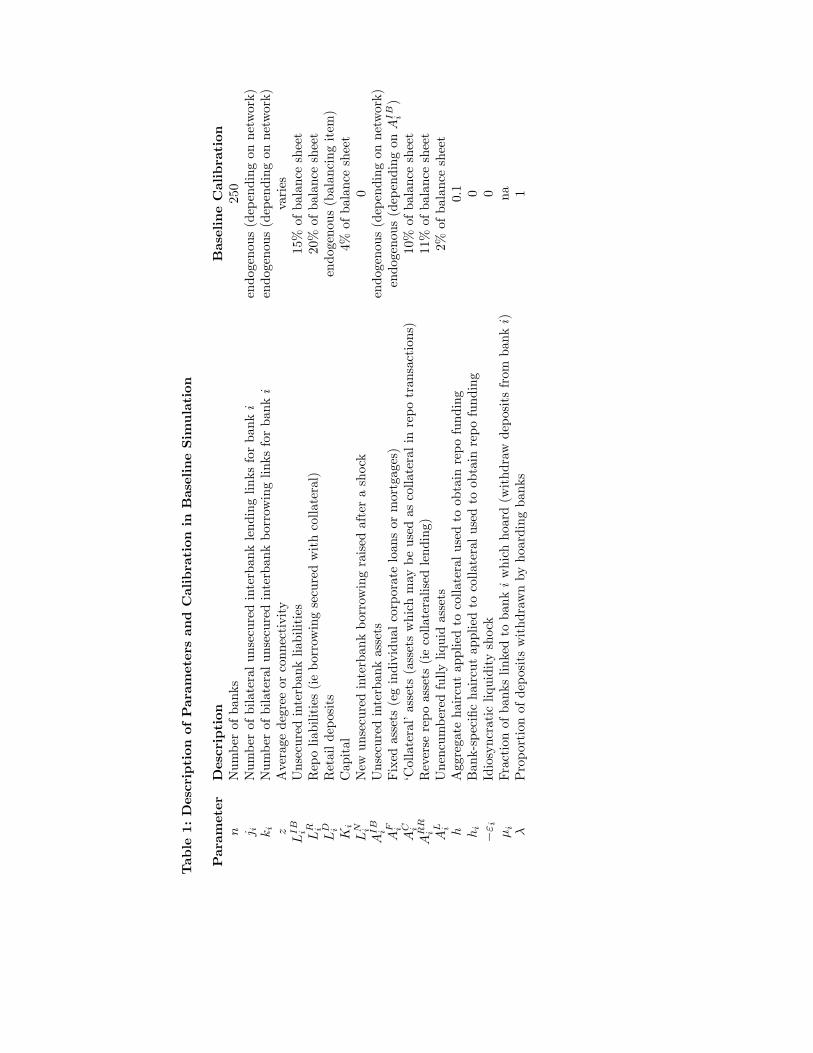
Table1:Description
ofParam
etersandCalibration
inBaselineSimulation
Param
eter
Description
BaselineCalibration
nNumberofbanks
250
j iNumberofbilateralunsecuredinterbanklendinglinksforbanki
endogenous(dependingonnetwork)
ki
Numberofbilateralunsecuredinterbankborrowinglinksforbanki
endogenous(dependingonnetwork)
zAveragedegreeorconnectivity
varies
LIBi
Unsecuredinterbankliabilities
15%ofbalancesheet
LR i
Repoliabilities(ieborrowingsecuredwithcollateral)
20%ofbalancesheet
LD i
Retaildeposits
endogenous(balancingitem)
Ki
Capital
4%ofbalancesheet
LN i
Newunsecuredinterbankborrowingraisedafterashock
0AIBi
Unsecuredinterbankassets
endogenous(dependingonnetwork)
AF i
Fixedassets(egindividualcorporateloansormortgages)
endogenous(dependingonAIBi)
AC i
�Collateral�assets(assetswhichmaybeusedascollateralinrepotransactions)
10%ofbalancesheet
ARR
iReverserepoassets(iecollateralisedlending)
11%ofbalancesheet
AL i
Unencumberedfullyliquidassets
2%ofbalancesheet
hAggregatehaircutappliedtocollateralusedtoobtainrepofunding
0.1
hi
Bank-speci�chaircutappliedtocollateralusedtoobtainrepofunding
0�" i
Idiosyncraticliquidityshock
0�i
Fractionofbankslinkedtobankiwhichhoard(withdrawdepositsfrom
banki)
na�
Proportionofdepositswithdrawnbyhoardingbanks
1