Embed Size (px)
Citation preview
i
COMPLETE DENTURE OCCLUSION:
INTRA AND INTER OBSERVER ANALYSIS
Sandile Khayalethu Derrick Mpungose
A minithesis submitted in partial fulfilment of the requirements for the degree
Master of Dentistry in the speciality of Prosthodontics
in the Department of Restorative Dentistry, University of the Western Cape,
February 2014
Supervisor: Prof GAVM Geerts

ii
iii
ABSTRACT
Aim: The aim of this study was to investigate the accuracy, intra- and inter-observer
reliability of identifying occlusal markings made by articulating paper on complete
dentures intra-orally.
Methods: A series of photographs of 14 tissue borne complete dentures with occlusal
markings was obtained. Articulating paper was used intra-orally at the delivery visit to
make the occlusal markings. The denture sets were divided into two groups. Group 1
comprised pictures of the 14 complete lower dentures on their own, and group 2 comprised
pictures of the same 14 lower dentures together with their opposing upper denture. The two
groups of images were loaded into a Microsoft PowerPoint presentation as well as
Keynote. Two experienced observers analysed the complete dentures independently and
noted the number and distribution of the markings that they felt required adjustment. They
differed, but discussed these and reached consensus. These data served as the control.
Three groups of observers (10 per group) were then asked to analyse the occlusal markings
of the 2 groups of denture images twice, with a two-week interval between each
assessment. Before each subsequent assessment, the images were randomised by means of
computer-generated random number sequence. The mean number of markings was
established for each group and compared with the control mean. Intra-rater reliability was
established by comparing the difference of the means of sequential observations for each
rater by establishing the z-value. Inter-rater reliability within each group was established
by means of analysis of variance.

iv
Results: Considering all the data, in only 17 instances (of the possible 60), did observers’
mean scores not differ from the control mean scores with good intra-rater reliability. In all
other 43 instances the observers’ mean scores differed from the control mean scores and/or
displayed poor intra-rater reliability. Considerable variation in inter-rater reliability was
also found within every group of observers.
Conclusion: The results indicate that observers are generally unable to reliably identify
occlusal markings warranting occlusal adjustment, made by articulating paper on a lower
complete denture.
Clinical significance: Articulating paper should not be used intra-orally when delivering
removable complete dentures.

v
Keywords
Complete dentures, articulating paper, occlusal markings, intra-rater reliability, inter-rater
reliability.

vi
DECLARATION
I declare that this dissertation “Complete denture occlusion: Intra and inter observer
analysis” is my own work, that it has not been submitted for any degree or examination in
any other university, and that all sources I have used or quoted have been indicated and
acknowledged by complete references.
……………………………………..
Sandile Khayalethu Derrick Mpungose
24 February 2014

vii
ACKOWLEDGEMENTS
Prof. GAVM Geerts - Supervisor
Academic staff- Availing themselves for the study
Dental students- Availing themselves for the study
Prof. Maritz- Statistician

viii
DEDICATIONS
I dedicate this to my family for their unconditional love, support and sacrifice which
continues to propel me in achieving all my dreams.
• To my wife, Dr Nhlanhla Duma, for your unconditional love, understanding,
constructive critism and support.
• My mother, Ntombenhle Mpungose and Sister, S’bu Mpungose, for your
unconditional love and for always being my number one fan.
• My supervisor, Prof. G Geerts, for the advice, guidance, and always availing
yourself.
• My beautiful children, ZeKhethelo & Lukhetho for the unconditional love and
understanding.

ix
ABSTRACT III
KEYWORDS V
DECLARATION VI
ACKOWLEDGEMENTS VII
DEDICATIONS VIII
LIST OF TABLES XI
LIST OF FIGURES XIIII
CHAPTER 1: LITERATURE REVIEW 1
1.1. INTRODUCTION 1
1.2. LITERATURE 2 1.2.2. Complete denture occlusion 3 1.2.3. Occlusal indicating materials 5 1.2.4. Articulating paper 7 1.2.5. Interpretation of occlusal markings 8 1.2.6. Rater reliability in complete denture occlusion 9
1.3. AIM, OBJECTIVES AND HYPOTHESES 10 1.3.1. Aim 10 1.3.2. Objectives 10 1.3.3. Null-‐hypotheses 10
CHAPTER 2: RESEARCH DESIGN AND METHODOLOGY 11
2.1. INTRODUCTION 11
2.2. RESEARCH DESIGN 11
2.3. PREPARATION OF SAMPLES 12
2.4. DATA COLLECTION 13
CHAPTER 3: RESULTS 14
3.1. INTRODUCTION 14
3.2. CONTROL DATA SERIES 14
3.3. SUMMARY OF DATA FOR ALL GROUPS 16

x
3.4. STAFF DATA SERIES 17
3.5. BChDIII STUDENT DATA SERIES 22
3.6. BChDV STUDENT DATA SERIES 24
3.7. STATISTICAL ANALYSIS 27 3.7.1. Control data 27 3.7.2. Rater reliability for test groups 28 3.7.3. Staff 29 3.7.4. Students 33
CHAPTER 4: DISCUSSION 37
4.1. Introduction 37
4.2. Discussion of the results 38
4.3. Conclusions 43
4.4. Recommendations 43
BIBLIOGRAPHY 44
APPENDICES 47
APPENDIX A: COVER LETTER 47
INFORMATION FORM 47
Consent form 49
APPENDIX B: QUESTIONNAIRE 50
APPENDIX C: ETHICAL CLEARANCE 53

xi
LIST OF TABLES
Table 3.1. Differences and similarities in distribution of the occlusal markings for the single lower denture and the complete set. 15
Table 3.2. Total and average of occlusal markings for control and all observer
groups for the 14 single lower dentures. 16 Table 3.3. Total and average of occlusal markings for control and all observer
groups for the 14 complete sets of dentures. 17 Table 3.4. Sum and averages for the first reading by staff for the 14 single lower
dentures. 18 Table 3.5. Sum and averages for the second reading by staff for the 14 single
lower dentures. 19 Table 3.6. Sum and averages for the first reading by staff for the 14 complete
set of dentures. 20 Table 3.7. Sum and averages for the second reading by staff for the 14
complete set of dentures. 21 Table 3.8. Sum and averages for the first reading by BChDIII students for the
14 single lower dentures. 22 Table 3.9. Sum and averages for the second reading by BChDIII students for
the 14 single lower dentures. 23 Table 3.10. Sum and averages for the first reading by BChDIII students for
the 14 complete sets of dentures. 23 Table 3.11. Sum and averages for the second reading by BChDIII students for
the 14 complete sets of dentures. 24 Table 3.12. Sum and averages for the first reading by BChDV students for
the 14 single lower dentures. 25 Table 3.13. Sum and averages for the second reading by BChDV students for
the 14 single lower dentures. 25 Table 3.14. Sum and averages for the first reading by BChDV students for
the 14 complete sets of dentures. 26 Table 3.15. Sum and averages for the second reading by BChDV students
for the 14 complete sets of dentures. 26 Table 3.16. The means of the first readings, second readings, the difference in
the means, standard error and z-value for staff for
xii
the single denture. 29 Table 3.17. The means of the first readings, second readings, the difference in
the means, standard error and z-value for staff for the complete set. 30
Table 3.18. The means of the first readings, second readings, the difference in
the means, standard error and z-value for BChDIII for the single denture. 33
Table 3.19. The means of the first readings, second readings, the difference
in the means, standard error and z-value for BChDV for the single denture. 33
Table 3.20. The means of the first readings, second readings, the difference
in the means, standard error and z-value for BChDIII for the complete set. 34
Table 3.21. The means of the first readings, second readings, the difference
in the means, standard error and z-value for BChVI for the complete set. 34
Table 3.22. BChDIII and V means. 36

xiii
LIST OF FIGURES
Figure 2.1. Example of an image of a mandibular denture with its opposing maxillary denture. 12
Figure 3.1. Plot of the control mean markings single-denture against complete-set. 28
Figure 3.2. Plot of mean markings against years of experience. 32

1
CHAPTER 1: LITERATURE REVIEW
1.1. INTRODUCTION
Tissue supported complete dentures (CDs) are a common treatment modality in clinical
practice. When clinicians construct tissue supported CDs, the underlying rationale is to
replace the missing/deficient oral tissue with a prosthesis that is functional, aesthetic and
improves the oral health related quality of life. A prosthesis that is uncomfortable and
causes pain for the individual will often require post insertion adjustments, and if there is
gross discomfort it may even be rejected.
Occlusal adjustments of prostheses, at insertion or at recall visits, are common in clinical
practice. With tissue supported CDs, one may choose to use an intra-oral technique or a
clinical remount (Firtell et al. cited by Shigli et al, 2008). In some instances one may
choose to use both techniques. With both techniques an appropriate occlusal indicating
material must be used to allow the clinician to visualise and adjust the premature or
interfering occlusal contacts.
There are several occlusal indicating materials that can be used to evaluate occlusal
contacts in the construction of tissue supported CDs. The material most commonly used,
due to its being readily available, economic and ‘easy’ to interpret, is occlusal indicating
paper. There are several different thicknesses of occlusal indicating paper, and they also
come in different colours.

2
The proper understanding of the nature of occlusal indicating materials, may allow the
clinician to choose the appropriate occlusal indicator under varying clinical scenarios. It
may also have a positive impact by ensuring that clinicians do not become over-zealous in
occlusal adjustments, thus maintaining the integrity of the prosthesis.
1.2. LITERATURE
1.2.1. Edentulism and complete dentures
Globally, edentulism remains a serious health-care burden. Internationally, the incidence of
edentulism is estimated to be between 7% and 69% (Petersen et al. cited by Felton, 2009).
In the USA 26% of adults between the ages of 65-69 years were completely edentulous. In
contrast complete edentulism was only at 6% in Africa (Polzer et al., 2010).
There is a lack of prosthetic epidemiological data in most developing countries. South
African data has been confined to a few cross-sectional surveys conducted in convenience
samples of the elderly in the Western Cape population (Van Wyk et al., 1977 and
Watermeyer et al., 1981). Edentulism was highest amongst the “Cape Coloured”
population in South Africa, with a prevalence of 56.8%. Unlike the USA population
sample, the age group most affected in South Africa was that between the ages 35-44 years
in the low socioeconomic and education groups (Louw & Moola, 1979). These results
were confirmed by a later study by Du Plessis et al. (1989) which found that amongst the
different ethnic groupings in South Africa the “Coloured” population had the highest
prevalence (25%) of edentulism, followed by Whites (18%), Indians (2%), urban Blacks
(2%) and rural Blacks (1%).

3
The Western Cape Province is unique in its position as the province in South Africa with
the highest life expectancy, a population change rate that is double the national average,
and a higher than average older population (PGWC, Department of Health. 2010 Strategic
Plan 2010-2014). In viewing these trends it can be extrapolated with caution that
edentulism and denture use will still have an impact in South Africa and in particular the
Western Cape.
Tissue-born CDs are a common treatment modality for edentulism in South Africa. The
manufacturing of new CDs was reported to have a positive impact on the oral health
related quality of life of a sample population of CD-wearers in the Western Cape (Adam et
al., 2007).
However, CDs are not without problems. There are many factors that may affect the
success of complete dentures. To minimize bone loss, mucosal irritation and functional
problems, Felton (2009) recommended that “exemplary” CD therapy should be provided to
edentulous patients.
1.2.2. Complete denture occlusion
The objective with CD occlusion is to establish simultaneous bilateral contact on all
posterior teeth when the mandible is closed in a centric relation position (Jacobson & Krol,
1983). This is considered a minimum requirement for whatever occlusal scheme the
clinician may select for the CDs. The management of the occlusion in CDs is said to have a
direct impact on the stability of the prostheses (Jacobson & Krol, 1983).

4
A well-balanced occlusion is one aspect of CD therapy that may contribute to patient
adaptation (Shigli et al., 2008). This finding is supported by Goiato et al. (2011) who stated
that “occlusal adjustment should preserve the artificial teeth where possible, in so doing
this will improve the masticatory efficiency.” On the other hand, occlusal disharmony may
present as trauma on the denture-bearing areas due to the denture shifting to accommodate
the interferences, causing uneven pressure on the denture-bearing tissues (Ansari, 1996).
Goiato et al (2011) further stated that “neglect of occlusal adjustment, such as premature or
sliding contacts, may jeopardise denture stability and retention which affects masticatory
function, comfort and maintenance of the residual ridge”.
“Occlusal disharmony prevalent in new CDs can result from warping of the record bases,
errors in recording the maxillo-mandibular relationship, and errors in mounting procedures,
or processing changes” (Shigli et al., 2008). Even though laboratory procedures may
minimize the need for occlusal adjustments of CDs at delivery, it is doubtful that it can be
completely eliminated, due to the resilient properties of denture-bearing and
temperomandibular joint tissues as compared to the rigid nature of casts and articulators.
Any occlusal disharmony in CDs should be clinically corrected by occlusal refinement of
the offending tooth/teeth. The offending surfaces must first be identified by means of an
appropriate occlusal indicating tool. Clinically assessing the desired and undesired occlusal
contacts may be achieved through the use of occlusal indicating materials. Often, these are
manufactured with materials that transfer colour from the indicator to the occlusal surface
contact area (Millstein & Maya, 2001).
5
1.2.3. Occlusal indicating materials
Clinicians require an accurate means of recording occlusal contacts (Millstein and Maya,
2001). There are several indicators available to aid the clinician in the refinement of the
occlusion; Sharma et al. (2013) indicated that there are 17 that have been used (some of
them no longer in use): 1) alginate impression material, 2) mylar paper strips, 3) polyether
rubber impression bites, 4) silicone putty, 5) typewriter ribbon, 6) transparent acetate
sheets, 7) wax, 8) wax articulation paper, 9) silk strips, 10) foils, 11) black silicone, 12)
high spot indicator, 13) occlusal spray, 14) photo occlusion, 15) occlusal sonography, 16)
T-Scan and 17) pressure sensitive films. These indicators vary in stiffness, thickness,
design, colour and accuracy. The majority of these materials are used in conjunction with
the very subjective patient “feel” feedback. The thickness of the materials may range from
0.002mm-0.109mm (Schelb et al., 1985). Thus the various materials may exhibit varying
contact points due to thickness and resistance when placed interocclusally. To compound
matters the restorative material being tested also plays a role in attaining clinically
distinguishable occlusal contacts - gold, metal alloys, acrylic, ceramics and enamel all may
vary the visibility of the indicator used. The material of choice as an occlusal indicating
medium is yet to be standardized (Takai et al., 1993).
The most commonly used occlusal indicator is occlusal indicating (articulating) paper. It is
popular due to its simplicity and low cost and it is not time-consuming. The colour of
occlusal indicating paper may be blue, red, green and/or black. The description of occlusal
paper by the manufacturers is not standardized and offers little information regarding its
thickness and sensitivity, it is often described in terms of thin, micro thin, extra thin, extra-

6
extra thin, and thick (Schelb et al., 1985). This offers a relatively vague qualitative
relationship to the true strip thickness or mark size.
A study conducted by Takai et al. (1993) evaluating three occlusal examination methods
used to record contacts in lateral excursive movements in dentate subjects found that
normal articulating paper can record contacts up to, but not exceeding 34 microns. This is
in contrast to Schelb et al. (1985), who advocated that occlusal indicating strips should be
less than 21µm. On the other hand black silicone is said to be a much more stable material
and can record up to 100µm, therefore black silicone can record actual static contacts and
‘near contacts’ which may be in contact during normal occlusal function (Sharma et al.,
2013). Polyether silicone impression bites are said to be the gold standard against which
other indicators should be evaluated (Sharma et al., 2013). They exhibit good accuracy;
however the method itself is not easy to use and is impractical in clinical practice. There is
also strong evidence to suggest that silk strips are the best materials for indicating occlusal
contacts (Sharma et al., 2013). It is manufactured from high quality natural silk of 80µm
thickness. It has a high colour reservoir, is extremely tear resistant and flexible. It thus
lends itself to adapt perfectly to cusps and fossae.
Mylar paper/shimstock films are made of metallic polyester film, which is 8µm thick, and
when evaluated against articulating paper it has been found that they are a more reliable
method (Sharma et al., 2013). Other novel occlusal indicating methods are sonography
and T-Scan. Sonography first appeared in the dental literature in the 1960s. It detects tooth
contact by the sound generated during mouth closure (Sharma et al., 2013). There is
however a lack of data on the efficacy of this technique and the device used.
T-Scan is a computerised occlusal analysis system, it is designed to examine and record
occlusal contact from a pressure sensitive film. The manufacturer reports that this system
can digitally inscript both the location and timing of the contacts (Sharma et al., 2013). The

7
sensor is U-shaped and is 60µm thick and has 1500 sensitive receptor points. Several
independent researchers have reported that the sensors do not have the same accuracy and
they also always attain fewer contacts than the conventional method of articulating paper.
The sensor has also been shown to be less accurate than silk ribbon (Sharma et al., 2013).
There appears to be no ideal occlusal indicating tool or material. It is thus imperative that
clinicians understand the nature of the most commonly used material, its applications,
analysis and shortcomings.
1.2.4. Articulating paper
Articulating paper is used to detect high occlusal contact. This is achieved through the dye
leaving a mark(s) on the contacting surface. The assumptions made are (1) that the colour
indicator is accurate and (2) that the observer/clinician interprets the markings made by the
indicator material correctly.
The colour coating of the majority of occlusal indicating papers consists of waxes, oils and
pigments. It comes in strips and also horse-shoe shaped sheets (Sharma et al., 2013).
According to Millstein & Maya (2001) “occlusal contact might be present due to varying
factors: there may be a meeting of two blunt surfaces or of the close contact of many
irregular surfaces. Occlusal contacts may take place simultaneously or sequentially. “Near-
contacts” are those that may appear to touch but do not. Surface friction may occur when
two surfaces rub over each other. Furthermore articulating paper may be thin and smooth,
and thus not engage the irregular topography in an occlusal surface. It may also be thick
and coarse, and thus create friction and resistance on occlusal contact. It is such factors that
may render the identification of “harmful” occlusal contacts difficult. Saliva may also ruin

8
articulating paper, it may be difficult to insert and seat due to the resiliency of the soft
tissue beneath a lower complete denture, and they have a relatively inflexible base
material; all these factors may result in an increased number of “pseudo” contact
markings” (Saraçoglu & Özpinar, 2002). The advocated technique, in which the
articulating paper is used, is to conduct the first test with the blue 200µm paper (Sharma et
al., 2013). The “offending” surfaces will be immediately visible, as the pigments will be
transferred from the paper to the high occlusal surfaces. The next step would then be to use
a thin 8µm film with a different colour. The contrast between the two colours will clearly
show high contacts and near contacts (Sharma et al. 2013).
1.2.5. Interpretation of occlusal markings
The interpretation of the contacts is critical in order to (1) avoid excessive occlusal
adjustment by removing more denture tooth structure than required or (2) avoid missing
interocclusal interferences by not discriminating between “true” and “pseudo” markings,
giving a false sense of an appropriate distribution and number of contacts.
The interpretation of the articulating paper markings is a quantitative and qualitative
process (Kerstein, 2008). It assesses the number, the distribution and intensity of contacts.
The rationale is: large, dark marks are indicative of heavy occlusal loads; smaller, lighter
marks indicate lesser loads. Lastly many similar sized marks on neighbouring teeth
indicate equal occlusal contact intensity, evenness, and time simultaneity (Kerstein, 2008).
Several scholars have questioned and criticized this descriptive analysis of occlusal
contacts. In fact Millstein (2008) indicated that there are no American Dental Association
(ADA) standards for the assessment of occlusal contacts and there are no scientific based
guidelines for the clinician when utilising articulating paper. When grinding away the

9
offensive contacts, it is understood that it is the dark contacts that should be removed as
these represent high contact areas. This interpretation of the contacts is in contrast with
recent findings when using the T-Scan to evaluate the occlusal interferences (Kerstein,
2008). The dark heavily pigmented areas interpreted with the naked eye as high contacts
have been shown not to be so. The size of the mark, whether large or small, donut-shaped
or scratch like and whether light or dark in colour is not indicative of the magnitude of
force in that area. Similar sized marks on neighbouring teeth have been found to exhibit
varying forces; in fact similar marks within the same tooth could have different forces
attributed to it (Kerstein, 2008).
1.2.6. Rater reliability in complete denture occlusion
The interpretation of occlusal contacts as described by Kerstein (2008) has however been
clinically utilised for more than a century. It also continues to form part of undergraduate
curricula in academic settings. There is still a lack of data on the intra-observer and inter-
observer interpretation of the occlusal markings, amongst different observers. There are no
studies evaluating the accuracy and interpretation of occlusal markings by observers when
utilising the century-old but still popular articulating paper technique. Wilson and Rees
(2006) found that significantly less occlusal markings were identified on dentures using a
clinical remount technique compared to an intra-oral technique. Recently, a study by
Geerts (2013) reported that rater-reliability was better when scoring occlusal marks on
articulated dentures compared with scoring them on dentures when articulating paper was
used intra-orally. Remount procedures were recommended for CD occlusal refinement
over the intra-oral technique. Improved training of staff and students in reliably identifying
true contacts was recommended.

10
1.3. AIM, OBJECTIVES AND HYPOTHESES
1.3.1. Aim
The aim of this study was to investigate the accuracy, intra- and inter-observer reliability
of identifying occlusal markings made by articulating paper on complete dentures.
1.3.2. Objectives
1. Establish the accuracy of identification of the markings by groups of observers by
comparing them with a control data set derived by consensus by 2 other observers
2. Establish intra-observer reliability by comparing the occlusal markings identified by
the same observers at 2 different time intervals
3. Establish inter-observer reliability by comparing the occlusal markings identified by
different groups of observers (students / dentists), and
4. Establish the role of the presence of the opposing denture on observer reliability and
accuracy.
1.3.3. Null-‐hypotheses
1. The markings identified by different groups of observers do not differ from the control
data set
2. There is no intra-observer reliability
3. There is no inter-observer reliability
4. Observer accuracy and reliability is not improved by the presence of the opposing
upper denture.

11
CHAPTER 2: Research design and methodology
2.1. INTRODUCTION
The proposal was presented before the Research Committee of the Faculty of Dentistry and
ethical clearance was obtained from Faculty and Senate Review Boards of the University
of the Western Cape before embarking on the project.
All participants in the study signed an informed consent form (Appendix A).
2.2. RESEARCH DESIGN
This study is a controlled, randomized, cross-sectional study. Three groups of observers:
third-year and fifth-year dental students as well as staff from the Department of Prosthetic
Dentistry assessed the number and distribution of occlusal markings on two series of
images of 14 lower CDs. The first group of images consisted of 14 lower dentures without
the opposing upper denture (Figure 2.1). The second group of images consisted of the same
14 lower dentures, but this time the opposing upper denture was also shown (Figure 2.1).
The three groups of observers assessed the two series of images twice, two weeks apart.
This resulted in 12 databases of assessments collected over a period of at least eight weeks.
Before presenting the images to the observers, two examiners independently assessed the
occlusal markings, noting the number and distribution of markings warranting adjustment.
The examiners did this for both groups of images, only once. The examiners then
compared each other’s results and any disagreements on the occlusal markings were
resolved by means of discussion until consensus was reached. The data obtained in this
12
way was used as a control to establish observer agreement of the markings made by the
different groups of observers.
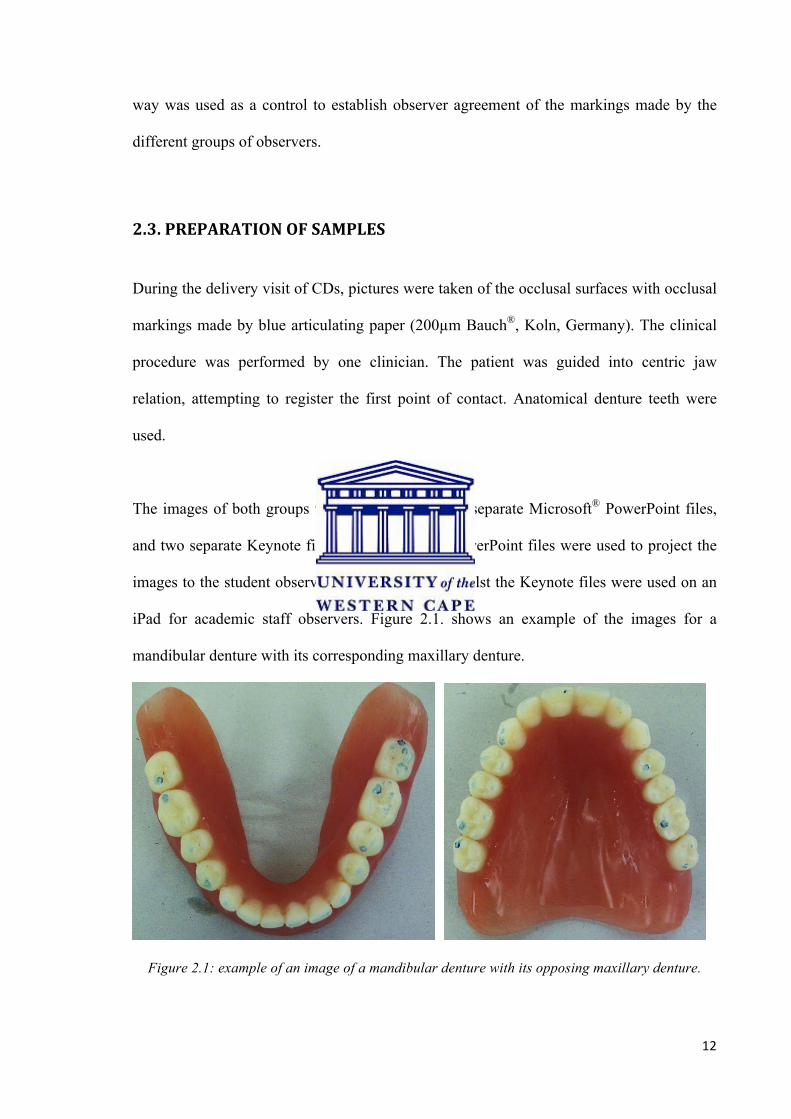
2.3. PREPARATION OF SAMPLES
During the delivery visit of CDs, pictures were taken of the occlusal surfaces with occlusal
markings made by blue articulating paper (200µm Bauch®, Koln, Germany). The clinical
procedure was performed by one clinician. The patient was guided into centric jaw
relation, attempting to register the first point of contact. Anatomical denture teeth were
used.
The images of both groups were captured into two separate Microsoft® PowerPoint files,
and two separate Keynote files. The Microsoft® PowerPoint files were used to project the
images to the student observers in a lecture hall, whilst the Keynote files were used on an
iPad for academic staff observers. Figure 2.1. shows an example of the images for a
mandibular denture with its corresponding maxillary denture.
Figure 2.1: example of an image of a mandibular denture with its opposing maxillary denture.

13
2.4. DATA COLLECTION
Identical questionnaires (Appendix B) were drawn up and distributed among 10 clinical
teaching staff with varying levels of experience, as well as to 10 students in the third and
10 students in the fifth year of their dental training programme. It was a convenience
sample consisting of the first 10 volunteers agreeing to complete the full project (4
observations over at least eight weeks). The questionnaire was provided at the start of each
assessment session for all observer groups. The original sequence of the images was noted
and kept secret. Prior to each observation session, the images were randomised by means
of an internet-based random sequencing program before each observer recording session.
The initial assessment for all observer groups was that of group 1 which comprised images
of the 14 lower dentures alone. After two weeks, the observation was repeated for group 1.
Another two weeks later, group 2, which comprised images of the same lower dentures
with the opposing upper dentures adjacent to them, was assessed. And again, two weeks
later, assessment of group 2 was repeated by all observer groups.
Data obtained was captured into a Microsoft® Excel spread sheet. A descriptive analysis
was done, prior to statistical analysis.
For the control group, the influence of the presence of the upper denture was analysed by
least squares regression analysis. Correctness of the different data series was done by
comparing the mean scores of the different test data series with the control by means using
analysis of variance. Intra-rater reliability was done by establishing the z-value for each
observer within each series of data. Inter-rater reliability was established by comparing
means of markings of the different observers in each group by means of analysis of
variance.

14
CHAPTER 3: RESULTS
3.1. INTRODUCTION
There are 3 factors to be analysed:
1) 10 different observers (to determine inter-rater reliability)
2) 2 time intervals (to determine intra-rater reliability)
3) single lower denture as opposed to opposing denture also present (to determine
the influence of the presence of the opposing denture).
3.2. CONTROL DATA SERIES
The scores for the control data series were achieved by means of consensus of two
observers. This resulted in two data series, one for when the markings on the occlusal
surfaces of lower dentures when assessed on their own, and one for when the markings on
the lower denture when assessed together with the image of the opposing upper denture.
For the lower denture-only data series, the total number of occlusal markings on the 14
lower dentures was 56 (Table 3.2). The average number of markings for this group was
4.00 per denture. Sixteen markings were on the anterior teeth (average: 1.14), 40 on
posterior teeth (average: 2.86).
For the complete denture-data series, the total number of occlusal markings on the 14
lower dentures was 53 (Table 3.3). The average number of markings for this group of
dentures was 3.78. Eighteen markings were on anterior teeth (average: 1.28), 35 were on
posterior teeth (average: 2.50).

15
Nine teeth on the database of the complete set had 1 marking more than the corresponding
teeth on the single denture data series, 12 teeth on the complete set data series differed by 1
marking less than the single denture series.
Comparing the 14 dentures of the two data series, there were only 2 dentures (nos. 3 and 5)
without any differences in markings, i.e. number and distribution were the same, regardless
of the presence of the upper denture. There were 6 dentures with 1 difference in number of
markings (nos. 2, 7, 8, 9, 11 and 12). There were 4 dentures with 2 differences in number
of markings (nos. 4, 6, 10 and 13). There was 1 denture with 3 differences in number of
markings (no.1). There was 1 denture with 4 differences in number of markings (no. 14).
Table 3.1. Differences and similarities in distribution of the occlusal markings for the single lower denture and the complete set.
KEY: 0 = no markings 1 = one marking 2 = two markings

16
3.3. SUMMARY OF DATA FOR ALL GROUPS
Table 3.2 shows the average of the number of markings for each denture counted by the
control and by the three test groups. For this table of values, the opposing denture was not
present.
Table 3.2. Total and average of occlusal markings for control and all observer groups for the 14 single lower dentures.
SINGLE DENTURE -‐ SECOND READINGstaff BChDIII BChDV staff BChDIII BChDV
1 4 5.1 4.9 4.4 5.6 3.9 4.12 4 3.3 5.6 4.3 4.9 4.8 33 2 2.8 2.1 2.3 2.8 2.3 4.64 5 4 4.5 4.4 4.4 4.5 5.95 5 4 4.5 4 3.7 3.9 4.66 4 3.3 2.8 3.6 3.6 1.8 3.77 5 3.7 4.7 4.4 4.7 3.6 28 5 3.6 4.5 4.1 4.5 3.5 5.89 6 2.3 3.8 3.9 3 2.8 2.510 2 1.5 1.8 2.5 2.1 1.3 4.411 3 3.9 6.2 5.5 4.6 6 5.412 6 3.7 5.1 5.5 4.1 4.4 4.413 1 3 3.7 2.7 3.4 1.8 5.214 4 4.3 4.5 3.9 5.2 2.8 5.3
total 56 48.5 58.7 55.5 56.6 47.4 60.9average 4 3.5 4.2 4.0 4.0 3.4 4.4
controldenture
Table 3.2SINGLE DENTURE -‐ FIRST READING

17
Table 3.3 shows the same data when the opposing denture was present.
Table 3.3. Total and average of occlusal markings for control and all observer groups for the 14 complete sets of dentures.
3.4. STAFF DATA SERIES
Table 3.4 shows the number of occlusal markings counted by the staff members for the
single denture. The highlighted cells show the highest and lowest means and totals.
SET OF DENTURES -‐ FIRST READINGstaff BChDIII BChDV staff BChDIII BChDV
1 3 5.2 3.7 4.9 5.6 3.6 3.72 5 3.5 4.5 5.2 4.7 2.9 4.93 2 3 2.4 3 2.8 2.2 4.64 3 3.9 4.2 4 3.9 3.3 2.45 5 4.3 4.2 3.4 3.6 3.1 4.76 4 3.4 3.1 3.6 3.6 1.7 3.37 4 3.9 4.3 4.6 4.7 2.8 4.68 4 3.2 4.6 3.8 4.2 3 2.39 5 2.4 5.1 3.3 2.8 2.4 5.110 2 1.5 2.6 2.5 1.9 2.7 5.511 4 4.3 6.9 6 4.1 3.7 2.712 5 3.8 5.5 4.9 4.1 4 5.213 3 3.1 4.5 3.5 3.3 1.9 514 4 4.7 6.1 4.1 5 1.3 5
total 53 50.2 61.8 56.8 54.3 38.6 59average 3.8 3.6 4.4 4.1 3.9 2.8 4.2
dentureSET OF DENTURES -‐ SECOND READING
Table 3.3
control

18
Table 3.4. Sum and averages for the first reading by staff for the 14 single lower dentures.
A total of 485 occlusal markings for all dentures and all observers were counted. Staff
member no.8 scored the lowest total number of occlusal markings for the 14 dentures, i.e.
28 with an average of 2.00 markings. Staff member no.10 scored the highest number of
markings, i.e. 89 with an average of 6.36. No relationship could be established between
these two staff members.
The lowest average of occlusal markings was for denture 10 (total of 15; average 1.5) and
the highest average of occlusal markings was for denture 1 (total of 51; average 5.1). This
does not agree with the control; they counted 2 markings for denture 10 and 4 markings for
denture 1.
denture staff1 staff2 staff3 staff4 staff5 staff6 staff7 staff8 staff9 staff10 sum average1 2 9 5 4 4 5 5 4 4 9 51 5.12 2 4 2 3 3 2 4 2 4 7 33 3.33 2 3 2 2 2 4 2 2 6 3 28 2.84 3 4 3 3 3 4 6 3 5 6 40 45 4 5 5 5 3 2 5 3 3 5 40 46 2 4 2 3 3 1 4 3 5 6 33 3.37 4 6 2 5 3 2 5 2 2 6 37 3.78 4 5 3 2 2 3 5 2 3 7 36 3.69 1 4 2 1 1 3 2 1 1 7 23 2.310 1 2 1 1 1 2 2 1 1 3 15 1.511 4 7 1 4 1 5 2 1 6 8 39 3.912 2 5 2 4 2 2 6 2 6 6 37 3.713 2 8 2 1 1 2 2 1 2 9 30 314 3 9 3 3 2 4 7 1 4 7 43 4.3
sum 36 75 35 41 31 41 57 28 52 89 485 48.5average 2.6 5.4 2.5 2.9 2.2 2.9 4.1 2.0 3.7 6.4 34.6 3.5
Table 3.4SINGLE DENTURE -‐ STAFF
FIRST READING
19
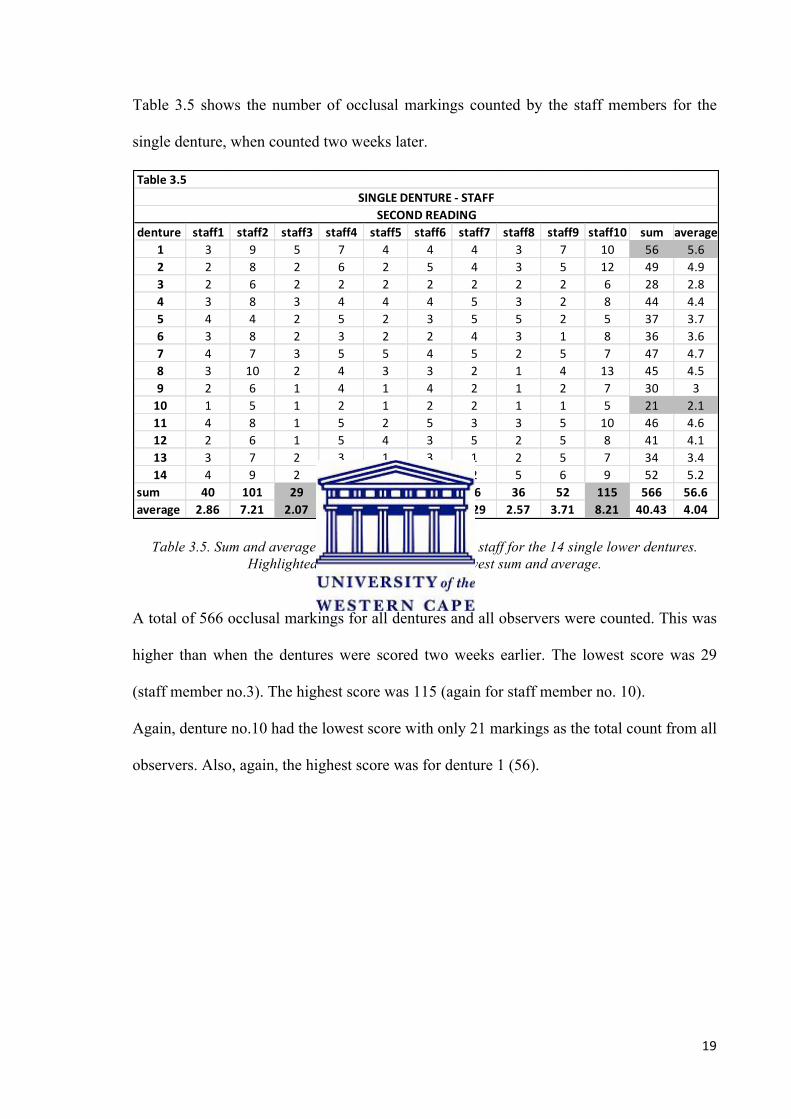
Table 3.5 shows the number of occlusal markings counted by the staff members for the
single denture, when counted two weeks later.
Table 3.5. Sum and averages for the second reading by staff for the 14 single lower dentures. Highlighted cells show highest and lowest sum and average.
A total of 566 occlusal markings for all dentures and all observers were counted. This was
higher than when the dentures were scored two weeks earlier. The lowest score was 29
(staff member no.3). The highest score was 115 (again for staff member no. 10).
Again, denture no.10 had the lowest score with only 21 markings as the total count from all
observers. Also, again, the highest score was for denture 1 (56).
denture staff1 staff2 staff3 staff4 staff5 staff6 staff7 staff8 staff9 staff10 sum average1 3 9 5 7 4 4 4 3 7 10 56 5.62 2 8 2 6 2 5 4 3 5 12 49 4.93 2 6 2 2 2 2 2 2 2 6 28 2.84 3 8 3 4 4 4 5 3 2 8 44 4.45 4 4 2 5 2 3 5 5 2 5 37 3.76 3 8 2 3 2 2 4 3 1 8 36 3.67 4 7 3 5 5 4 5 2 5 7 47 4.78 3 10 2 4 3 3 2 1 4 13 45 4.59 2 6 1 4 1 4 2 1 2 7 30 310 1 5 1 2 1 2 2 1 1 5 21 2.111 4 8 1 5 2 5 3 3 5 10 46 4.612 2 6 1 5 4 3 5 2 5 8 41 4.113 3 7 2 3 1 3 1 2 5 7 34 3.414 4 9 2 6 5 4 2 5 6 9 52 5.2
sum 40 101 29 61 38 48 46 36 52 115 566 56.6average 2.86 7.21 2.07 4.36 2.71 3.43 3.29 2.57 3.71 8.21 40.43 4.04
Table 3.5SINGLE DENTURE -‐ STAFF
SECOND READING

20
Table 3.6 shows the scores by staff for the lower dentures when evaluated together with the
opposing denture. The total number of occlusal markings counted was 502. Staff member
no. 5 counted the lowest total number of occlusal markings, i.e. 31 with an average of 2.21.
The highest number of occlusal markings was, again, counted by staff no.10 with a total of
92, average 6.57.
Table 3.6. Sum and averages for the first reading by staff for the 14 complete set of dentures. Highlighted cells show highest and lowest sum and average.
Table 3.7 shows the scores by staff when the lower dentures were scored together with the
opposing denture two weeks later. The total number of occlusal markings counted was
543. This is higher than the first reading with the opposing denture present (502). Staff
member no. 3 counted the lowest total number of occlusal markings, i.e. 29 with an
average of 2.07. The highest number of occlusal markings was counted again by staff
no.10 with a total of 106, average 7.57.
denture staff1 staff2 staff3 staff4 staff5 staff6 staff7 staff8 staff9 staff10 sum average1 4 9 5 4 4 4 5 3 4 10 52 5.22 2 4 2 3 3 3 4 3 4 7 35 3.53 2 3 2 2 2 2 2 2 6 7 30 34 4 4 3 3 3 2 6 3 5 6 39 3.95 3 5 5 5 3 4 5 5 3 5 43 4.36 2 4 2 3 3 3 4 3 5 5 34 3.47 4 6 2 5 3 3 5 2 2 7 39 3.98 3 5 3 2 2 3 5 1 3 5 32 3.29 2 5 2 1 1 3 2 1 1 6 24 2.410 1 2 1 1 1 2 2 1 1 3 15 1.511 4 7 1 4 1 6 2 3 6 9 43 4.312 2 5 2 4 2 3 6 2 6 6 38 3.813 2 8 2 1 1 2 2 2 2 9 31 3.114 3 9 3 3 2 4 7 5 4 7 47 4.7
sum 38 76 35 41 31 44 57 36 52 92 502 50.2average 2.71 5.43 2.50 2.93 2.21 3.14 4.07 2.57 3.71 6.57 35.86 3.50
Table 3.6COMPLETE SET -‐ STAFF
FIRST READING

21
Table 3.7. Sum and averages for the second reading by staff for the 14 complete set of dentures. Highlighted cells show highest and lowest sum and average.
denture staff1 staff2 staff3 staff4 staff5 staff6 staff7 staff8 staff9 staff10 sum average1 4 8 5 8 4 3 4 3 6 11 56 5.62 3 8 2 6 2 5 4 3 5 9 47 4.73 2 6 2 2 2 2 2 2 2 6 28 2.84 4 5 3 4 4 4 5 3 2 5 39 3.95 3 4 2 5 2 3 5 5 2 5 36 3.66 3 8 2 3 2 2 4 3 1 8 36 3.67 4 7 3 5 5 4 5 2 5 7 47 4.78 3 7 2 4 3 3 2 1 4 13 42 4.29 2 6 1 3 1 4 2 1 2 6 28 2.810 1 5 1 2 1 2 2 1 1 3 19 1.911 2 7 1 5 2 5 3 1 5 10 41 4.112 2 6 1 5 4 3 5 2 5 8 41 4.113 2 7 2 3 1 3 1 2 5 7 33 3.314 5 9 2 6 4 3 2 5 6 8 50 5
sum 40 93 29 61 37 46 46 34 51 106 543 54.3average 2.86 6.64 2.07 4.36 2.64 3.29 3.29 2.43 3.64 7.57 38.79 3.88
Table 3.7COMPLETE SET -‐ STAFFSECOND READING

22
3.5. BChDIII STUDENT DATA SERIES
Table 3.8 shows the BChDIII students’ first scores for the single denture. The total number
of markings counted was 587. The highest score was for denture 11 (62), with an average
of 6,2, the lowest score was for 10 (18), with an average of 1.8. The student who scored the
highest was student 2 (85), with an average of 6.1, the lowest was student 10 (29), with an
average of 2.1.
Table 3.8. Sum and averages for the first reading by BChDIII students for the 14 single lower dentures. Highlighted cells show highest and lowest sum and average.
Table 3.9 shows the BChDIII students’ scores two weeks later. A total reading of 474 was
obtained. Denture 11 scored the highest (60). Denture 10 scored the lowest (13). Student 6
recorded the highest number of markings (91), with an average of 6,5. Student 3 scored the
lowest (16), with an average of 1.1.
denture student 1student 2student 3student 4 student 5 student 6 student 7 student 8 student 9 student 10 sum average1 4 11 6 5 3 5 4 4 4 3 49 4.92 2 10 6 6 3 7 8 4 5 5 56 5.63 2 2 2 2 3 2 2 2 2 2 21 2.14 4 5 7 5 3 6 6 3 3 3 45 4.55 6 4 4 5 3 5 5 5 5 3 45 4.56 4 4 3 3 2 4 3 2 2 1 28 2.87 3 6 7 4 2 7 7 4 4 3 47 4.78 4 7 5 4 2 7 5 4 3 4 45 4.59 5 7 5 3 4 4 4 4 2 0 38 3.810 2 2 2 2 1 2 5 2 0 0 18 1.811 8 8 8 9 4 5 9 6 5 0 62 6.212 3 7 9 5 2 7 6 5 5 2 51 5.113 4 6 5 4 3 5 5 3 1 1 37 3.714 4 6 5 6 4 4 6 4 4 2 45 4.5
sum 55 85 74 63 39 70 75 52 45 29 587 58.7total 3.93 6.07 5.29 4.50 2.79 5.00 5.36 3.71 3.21 2.07 41.93 4.19
Table 3.8SINGLE DENTURE -‐ BChDIII
FIRST READING

23
Table 3.9. Sum and averages for the second reading by BChDIII students for the 14 single lower dentures. Highlighted cells show highest and lowest sum and average.
Table 3.10 shows the BChDIII students’ first scores when the opposing denture was
present. A total of 575 markings were recorded. Denture 11 had the highest total score
(65). Denture 10 had the lowest (19). Student 6 sored the highest (85), with an average of
6.07 markings per denture. Student 10 scored the lowest (34) with an average of 2.4.
Table 3.10. Sum and averages for the first reading by BChDIII students for the 14 complete sets of dentures. Highlighted cells show highest and lowest sum and average.
denture student 1student 2student 3student 4student 5student 6 student 7 student 8 student 9 student 10 sum average1 4 3 0 6 3 7 5 5 2 4 39 3.92 4 6 2 5 3 7 6 4 5 6 48 4.83 2 2 2 2 2 2 5 2 2 2 23 2.34 4 5 3 5 3 7 7 4 3 4 45 4.55 5 4 0 5 3 6 4 4 5 3 39 3.96 1 2 0 3 0 5 3 2 0 2 18 1.87 3 4 0 5 2 7 6 4 2 3 36 3.68 3 6 0 3 2 7 4 3 2 5 35 3.59 2 2 0 4 2 6 4 2 1 5 28 2.810 2 1 1 1 1 2 2 2 0 1 13 1.311 8 5 4 5 3 12 11 5 2 5 60 612 6 6 2 5 1 9 7 2 2 4 44 4.413 1 0 2 1 0 6 4 2 0 2 18 1.814 4 0 0 2 2 8 7 2 1 2 28 2.8
sum 49 46 16 52 27 91 75 43 27 48 474 47.4average 3.50 3.29 1.14 3.71 1.93 6.50 5.36 3.07 1.93 3.43 33.86 3.39
Table 3.9SINGLE DENTURE -‐ BChDIII
SECOND READING
Denture student 1 student 2 student 3 student 4 student 5 student 6 student 7 student 8 student 9 student 10 sum average1 5 4 6 4 3 5 2 5 4 2 40 4.002 3 6 5 6 4 7 3 5 5 4 48 4.803 3 2 2 2 2 2 1 4 2 3 23 2.304 5 5 6 5 4 6 2 6 3 0 42 4.205 3 4 4 4 3 6 4 5 5 3 41 4.106 1 3 3 3 4 4 2 3 3 2 28 2.807 2 4 3 4 2 7 4 7 5 2 40 4.008 6 4 5 4 2 6 6 5 3 2 43 4.309 5 4 5 5 3 6 7 6 3 3 47 4.7010 2 2 2 2 1 2 2 2 1 3 19 1.9011 6 5 5 7 3 8 10 11 5 5 65 6.5012 5 5 6 6 2 10 6 7 2 0 49 4.9013 4 5 2 4 3 8 2 6 2 1 37 3.7014 4 5 4 7 5 8 5 7 4 4 53 5.30
sum 54 58 58 63 41 85 56 79 47 34 575 57.50average 3.86 4.14 4.14 4.50 2.93 6.07 4.00 5.64 3.36 2.43 41.07 4.11
Table 3.10FULL SET -‐ BChDIIIFIRST READING

24
Table 3.11 shows the markings recorded for the BChDIII students evaluating the complete
set two weeks later. The total was 386. This is considerably lower than that recorded at the
previous assessment. Denture 12 scored the highest (40). Denture 14 scored the lowest
(13). Student 6 scored the highest (77) with an average of 5.5 markings per denture.
Student 5 and 9 scored the lowest (22) with an average of 1.57.
Table 3.11. Sum and averages for the second reading by BChDIII students for the 14 complete sets of dentures. Highlighted cells show highest and lowest sum and average.
3.6. BChDV STUDENT DATA SERIES
Table 3.12 shows the BChDV students’ first scores for the single denture. The total
markings recorded were 555, which was less than that of the third-year group for the same
assessment. The highest score was for dentures 11 and 12 (55). The denture with the
lowest score was denture 3 with a score of 23. The student who scored the lowest was
student 12 (29), with an average of 2.1 markings per denture, the highest was student 14
with a score of 83, with an average of 5.9.
denture student 1 student 2 student 3 student 4 student 5 student 6 student 7 student 8 student 9 student 10 sum average1 2 4 1 5 3 7 5 3 4 2 36 3.62 2 1 0 3 3 7 4 2 3 4 29 2.93 2 2 2 2 2 2 2 2 2 4 22 2.24 3 4 3 3 1 6 5 3 3 2 33 3.35 0 4 0 5 2 6 5 4 3 2 31 3.16 3 0 2 1 0 4 3 2 0 2 17 1.77 2 2 1 4 1 6 5 3 2 2 28 2.88 2 0 2 3 2 7 6 3 1 4 30 39 1 0 4 2 1 0 6 5 2 3 24 2.410 6 0 5 5 1 3 2 2 0 3 27 2.711 0 6 0 1 3 10 7 5 1 4 37 3.712 6 5 3 5 2 6 6 4 1 2 40 413 5 0 2 0 1 6 1 1 0 3 19 1.914 0 0 1 0 0 7 4 0 0 1 13 1.3
sum 34 28 26 39 22 77 61 39 22 38 386 38.6average 2.43 2.00 1.86 2.79 1.57 5.50 4.36 2.79 1.57 2.71 27.57 2.76
Table 3. 11FULL SET -‐ BChDIIISECOND READING

25
Table 3.12. Sum and averages for the first reading by BChDV students for the 14 single lower dentures. Highlighted cells show highest and lowest sum and average.
Table 3.13 shows the markings recorded by the BChDV group 2 weeks later. The total
score was 609. Denture 4 was the highest (59). Denture 7 was the lowest (20). Student 14
again scored the highest (100), with an average of 7.1. Student 12 again scored the lowest
(38), with an average of 2.7.
Table 3.13. Sum and averages for the second reading by BChDV students for the 14 single lower dentures. Highlighted cells show highest and lowest sum and average.
In Table 3.14, the BChDV group evaluated the complete set for the first time and a total of
568 was recorded. Denture 11 scored the highest (60). Denture 10 scored the lowest (25).
denture student 11student 12student 13 student 14 student 15 student 16 student 17 student 18 student 19 student 20 sum average1 3 3 3 8 4 4 4 7 4 4 44 4.42 5 2 3 6 3 5 4 6 3 6 43 4.33 2 2 5 2 2 2 2 2 2 2 23 2.34 4 3 3 6 5 5 4 5 4 5 44 4.45 4 3 3 5 5 5 3 4 4 4 40 46 4 2 5 5 2 4 3 4 3 4 36 3.67 3 3 3 7 5 6 5 5 2 5 44 4.48 5 1 2 7 5 4 5 4 3 5 41 4.19 5 1 2 7 6 4 4 3 2 5 39 3.910 3 1 7 4 2 2 2 1 1 2 25 2.511 4 3 4 7 8 6 6 5 3 9 55 5.512 2 2 2 8 8 6 4 5 4 14 55 5.513 2 1 3 5 4 1 5 5 1 0 27 2.714 4 2 0 6 5 3 5 6 4 4 39 3.9
sum 50 29 45 83 64 57 56 62 40 69 555 55.5average 3.57 2.07 3.21 5.93 4.57 4.07 4.00 4.43 2.86 4.93 39.64 3.96
Table 3.12SINGLE DENTURE -‐ BChDV
FIRST READING
denture student11 student12 student13 student14 student15 student16 student17 student18 student19 student20 sum average1 3 3 5 8 5 6 0 5 3 3 41 4.12 2 2 1 9 4 2 0 5 3 2 30 33 4 5 6 9 4 4 0 5 3 6 46 4.64 5 4 5 10 6 5 7 7 4 6 59 5.95 4 3 5 5 5 5 5 5 4 5 46 4.66 3 2 3 6 4 3 5 3 3 5 37 3.77 2 1 2 3 2 2 3 1 2 2 20 28 4 5 5 12 7 5 7 5 5 3 58 5.89 2 2 4 2 4 2 3 2 2 2 25 2.510 4 2 5 5 6 2 7 7 3 3 44 4.411 5 3 6 10 7 5 6 3 5 4 54 5.412 6 1 3 7 6 4 8 4 2 3 44 4.413 5 3 7 8 7 4 7 5 4 2 52 5.214 6 2 8 6 7 4 7 5 5 3 53 5.3
sum 55 38 65 100 74 53 65 62 48 49 609 60.9average 3.93 2.71 4.64 7.14 5.29 3.79 4.64 4.43 3.43 3.50 43.50 4.28
Table 3.13SINGLE DENTURE -‐ BChDV
SECOND READING

26
Student 18 scored the highest (74), with an average of 5.3. Student 12 scored the lowest
(44), with an average of 3.1.
Table 3.14. Sum and averages for the first reading by BChDV students for the 14 complete sets of dentures. Highlighted cells show highest and lowest sum and average.
In Table 3.15, the BChDV group evaluated the complete set two weeks later and a total of
590 was obtained. Denture 10 scored the highest (55), denture 8 scored the lowest (23).
Student 14 and 15 sored the highest (83), average 5.9, and student 12 scored the lowest
(32), average 2.3.
Table 3.15. Sum and averages for the second reading by BChDV students for the 14 complete sets of dentures. Highlighted cells show highest and lowest sum and average.
denture student11 student12 student13 student14 student15 student16 student17 student18 student19 student20 sum average1 5 4 2 7 5 4 6 7 3 6 49 4.92 5 4 9 4 6 4 5 5 4 6 52 5.23 2 4 7 2 3 2 3 2 2 3 30 34 3 4 3 4 5 4 3 5 4 5 40 45 0 3 2 4 4 4 4 5 3 5 34 3.46 4 2 5 4 4 4 3 3 3 4 36 3.67 3 4 4 5 5 6 5 5 4 5 46 4.68 4 3 5 3 3 5 5 3 3 4 38 3.89 5 2 3 5 4 3 3 2 2 4 33 3.310 2 1 1 2 2 2 1 9 1 4 25 2.511 9 4 6 7 8 6 8 3 7 2 60 612 5 3 5 4 6 5 5 9 4 3 49 4.913 2 1 1 4 5 1 5 10 3 3 35 3.514 4 5 0 6 3 5 5 6 2 5 41 4.1
sum 53 44 53 61 63 55 61 74 45 59 568 56.8average 3.79 3.14 3.79 4.36 4.50 3.93 4.36 5.29 3.21 4.21 40.57 4.06
Table 3.14FULL SET -‐ BChDVFIRST READING
denture student11student12student13student14student15student16student17student18student19 student20 sum average1 5 2 4 3 5 4 6 3 3 2 37 3.72 5 3 5 7 5 5 5 6 4 4 49 4.93 4 4 5 6 8 3 4 5 3 4 46 4.64 2 1 1 7 5 1 3 1 2 1 24 2.45 5 2 5 5 6 5 5 5 4 5 47 4.76 3 2 3 5 4 3 5 3 3 2 33 3.37 5 2 6 8 7 3 5 3 4 3 46 4.68 2 2 3 2 4 2 2 2 2 2 23 2.39 4 3 6 7 7 6 6 5 4 3 51 5.110 8 3 3 8 8 4 7 6 4 4 55 5.511 2 1 9 3 3 2 2 1 2 2 27 2.712 2 2 5 7 8 4 10 5 6 3 52 5.213 4 2 8 8 6 3 7 7 3 2 50 514 5 3 3 7 7 4 7 5 5 4 50 5
sum 56 32 66 83 83 49 74 57 49 41 590 59average 4 2.29 4.71 5.93 5.93 3.50 5.29 4.07 3.50 2.93 42.14 4.21
SECOND READING
Table 3.15FULL SET -‐ BChDV

27
3.7. STATISTICAL ANALYSIS
3.7.1. Control data
The data of the control, for the single denture and the set, is the result of a single score
reached by consensus of two observers.
The mean number of occlusal markings for the single denture was 4.000 per denture, and
for the set was 3.786. The difference of the mean is -0.214. This is not significantly
different from zero, suggesting that there is no difference between the single denture
readings and the complete set readings.
However, earlier on, the descriptive statistics suggested that, even though the total number
of markings may not be different, their distribution appeared to be (Table 3.1). Of the 14
dentures, there were only 2 dentures where the distribution of markings scored was exactly
the same regardless of the presence of the opposing denture (dentures no. 3 and 5).
Therefore, single-denture versus complete-set values were plotted, suggesting differences
(Figure 3.1): the black line in the graph is one with intercept = 0 and slope = 1. Points
should cluster around this line if there is no bias. However, the red line is the least squares
regression line complete-set on single-denture, and it has slope = 0.500 with estimated
standard error 0.138. Therefore, this slope differs significantly from slope 1. Note that (1-
0.500)/0.138=3.62. What is indicated is that at low single total scores, the complete set
total scores tend to be greater than the single total scores; at high single total scores, the set
total scores tend to be smaller than the single total scores.

28
Figure 3.1: Plot of the control mean markings single-denture against complete-set.
3.7.2. Rater reliability for test groups
Intra-rater reliability
Tables 3.16 through 3.21 show information in terms of intra-rater reliability. In the last row
of each table, the z-value = mean 1st reading – mean 2nd reading/S.E. 1st reading – 2nd
reading. Where the absolute value of z ≥ 2, statistically significant difference is indicated.
Inter-rater reliability
For the inter-rater reliability, two-way analysis of variance was performed. This is also
indicated in Tables 3.16 through 3.21. This was done for both the first reading in the single
and complete set, as well as for the second reading for the single and complete set.
ANOVA for the first readings of the single and complete set denture (first line of Tables
3.16-3.21) gave F (9,117)=28.61 and P<0.001. Any two means differing by 0.943 or more
can be considered to differ significantly at level 0.05 or smaller.

29
ANOVA for the second readings of the single and complete set denture (second line of
tables 3.16-3.21) gave F (9,117)=58.86 and P<0.001. Any two means differing by 0.916 or
more can be taken to differ significantly at level 0.05 or smaller.
The error standard deviation (S.E.) of a total reading is estimated as 1.254. This is a pooled
estimate over all staff and students.
3.7.3. Staff
Table 3.16 shows the intra-rater reliability for staff single lower denture. In the last row,
the z values are highlighted for 3 observers (2, 4 and 10). The difference in their means of
the 1st and 2nd readings are significantly higher than those of the other 7 staff members.
This suggests that they are statistically significant.
Table 3.16
Single lower denture
Staff 1 2 3 4 5 6 7 8 9 10
mean 1st reading 2.571 5.357 2.500 2.929 2.214 2.929 4.071 2.000 3.714 6.357
mean 2nd reading 2.857 7.214 2.071 4.357 2.714 3.429 3.286 2.571 3.714 8.214
mean 1st - 2nd -0.286 -1.857 0.429 -1.429 -0.500 -0.500 0.786 -0.571 0.000 -1.857
S.E. 1st – 2nd 0.163 0.533 0.251 0.327 0.327 0.327 0.408 0.359 0.655 0.533
z -1.749 -3.484 1.710 -4.372 -1.528 -1.528 1.924 -1.593 0.000 -3.484
Table 3.16. The means of the first readings, second readings, the difference in the means, standard
error and z-value for staff for the single denture. Blue highlights show inter-rater differences; yellow highlights show intra-rater differences.The green cells indicate no statistical difference from
the control mean scores.

30
For the inter-rater reliability, Analysis of variance (ANOVA) was used. For the first
readings of the single denture (first line of Table 3.16), the means of staff 2 and 10 are
significantly higher than all other staff means.
For the second readings of the single denture (second line of Table 3.16) the means of the
same staff members 2 and 10 are significantly higher than any other staff mean. Staff 3 and
4 also differ significantly from most other staff.
To determine intra-rater reliability for the complete set, the same is done as for the single
set, as indicated in Table 3.17. This time, two staff members, 2 and 4, exhibit means that
are significantly different. These two staff members also had statistically different scores
when assessing the single denture (Table 3.16).
Table 3.17
Complete set of dentures
Staff 1 2 3 4 5 6 7 8 9 10
means 1st reading 2.714 5.429 2.500 2.929 2.214 3.143 4.071 2.571 3.714 6.571
means 2nd reading 2.857 6.643 2.071 4.357 2.643 3.286 3.286 2.429 3.643 7.571
means 1st – set 2nd -0.143 -1.214 0.429 -1.429 -0.429 -0.143 0.786 0.143 0.071 -1.000
S.E. 1st -set 2nd 0.231 0.471 0.251 0.343 0.291 0.294 0.408 0.143 0.633 0.646
z -0.618 -2.579 1.710 -4.163 -1.472 -0.486 1.924 1.000 0.113 -1.547
Table 3.17. The means of the first readings, second readings, the difference in the means, standard error and z-value for staff for the complete set. Blue highlights show inter-rater differences; yellow highlights show intra-rater differences. The green cells indicate no statistical difference from the
control mean scores.
For the inter-rater reliability for the first reading (first line of Table 3.17), the mean scores
of staff 2 and 10 differ from all other staff members, while the mean score of staff 5, 7 and
9 differ from most of the other staff members.

31
For the inter-rater reliability for the readings 2 weeks later (second line of Table 3.17),
staff 2 and 10 differed from all other staff while staff 3 and 4 differed from most other man
scores.
In summary, staff members 2, 4 and 10 showed the poorest inter and intra-rater reliability
on both occasions.
For the single dentures, the mean control is 4.000 (Table 3.2). Based on an overall estimate
of error variation the standard error of the difference between the control mean and any
staff mean is 0.4866. Therefore, an observed difference of 0.954 or greater indicates
statistical significance at level 0.05 or smaller. Except for staff members 7 and 9, the mean
of all other staff members differed statistically from the control mean.
For the complete set, the mean control is 3.786 (Table 3.3). Based on an overall estimate of
error variation the standard error of the difference between the control mean and any staff
mean is 0.4620. Therefore, an observed difference of 0.906 or greater indicates statistical
significance at level 0.05 or smaller. Except for staff members 4, 6, 7 and 9, the mean of all
other staff members differed from the control mean.
Figure 3.2 is a plot of the mean single denture 1st reading (means s1), mean single denture
2nd reading (mean s2), mean complete set 1st reading (mean d1), and mean complete set 2nd
reading (mean d2) versus years of experience of staff. There is no obvious association
between years of experience and mean counts. In this analysis the staff individuals are
treated as a random selection from a potential population of staff. There are four
correlation coefficients:
mean s1 vs Years=0.095

32
mean s2 vs Years=-0.100
mean d1 vs Years=0.046
mean d2 vs Years=-0.090
These correlations are small and not statistically significant.
Figure 3.2: Plot of mean markings against years of experience.

33
3.7.4. Students
The results for the single denture and the BChDIII group are shown in Table 3.18.
Seven students (2, 3, 5, 6, 8, 9 and 10) show poor intra-rater reliability (yellow highlights).
Table 3.18 Single denture
Student BChDIII 1 2 3 4 5 6 7 8 9 10
means 1st reading 3.929 6.071 5.286 4.5 2.786 5 5.357 3.714 3.214 2.071
means 2nd reading 3.5 3.286 1.143 3.714 1.929 6.5 5.357 3.071 1.929 3.429
means 1st- 2nd 0.429 2.786 4.143 0.786 0.857 -1.5 0 0.643 1.286 -1.357
S.E. 1st – 2nd 0.465 0.697 0.533 0.459 0.275 0.522 0.432 0.308 0.322 0.44
z 0.921 3.998 7.772 1.712 3.122 -2.876 0 2.09 3.994 -3.085
Table 3.18. The means of the first readings, second readings, the difference in the means, standard error and z-value for BChDIII for the single denture. Blue highlights show inter-rater differences;
yellow highlights show intra-rater differences. The green cells indicate no difference from the control mean scores.
Table 3.19 Single denture
Student BChDV 11 12 13 14 15 16 17 18 19 20 means 1st reading 3.571 2.071 3.214 5.929 4.571 4.071 4 4.429 2.857 4.929 means 2nd reading 3.929 2.714 4.643 7.143 5.286 3.786 4.643 4.429 3.429 3.5 means 1st – 2nd -0.357 -0.643 -1.429 -1.214 -0.714 0.286 -0.643 0 -0.571 1.429 S.E. 1st – 2nd 0.551 0.414 0.724 0.878 0.549 0.539 0.76 0.663 0.359 0.998 z -0.648 -1.552 -1.973 -1.383 -1.301 0.53 -0.845 0 -1.593 1.431
Table 3.19. The means of the first readings, second readings, the difference in the means, standard error and z-value for BChDV for the single denture. Blue highlights show inter-rater differences;
yellow highlights show intra-rater differences. The green cells indicate no difference from the control mean scores.

34
Table 3.20 Complete set
Student BChDIII 1 2 3 4 5 6 7 8 9 10 means 1st reading 3.857 4.143 4.143 4.500 2.929 6.071 4.000 5.643 3.357 2.429 means 2nd reading 2.429 2.000 1.857 2.786 1.571 5.500 4.357 2.786 1.571 2.714 means 1st – 2nd 1.429 2.143 2.286 1.714 1.357 0.571 -0.357 2.857 1.786 -0.286 S.E. 1st – 2nd 0.747 0.582 0.615 0.737 0.440 0.590 0.427 0.543 0.366 0.384 z 1.914 3.680 3.716 2.326 3.085 0.968 -0.836 5.259 4.881 -0.744
Table 3.20. The means of the first readings, second readings, the difference in the means, standard error and z-value for BChDIII for the complete set. Blue highlights show inter-rater differences;
yellow highlights show intra-rater differences. The green cells indicate no difference from the control mean scores.
Table 3.21 Complete set
Student BChDV 11 12 13 14 15 16 17 18 19 20 means 1st reading 3.786 3.143 3.786 4.357 4.500 3.929 4.357 5.286 3.214 4.214 means 2nd reading 4.000 2.286 4.714 5.929 5.929 3.500 5.286 4.071 3.500 2.929 means 1st – 2nd -0.214 0.857 -0.929 -1.571 -1.429 0.429 -0.929 1.214 -0.286 1.286 S.E. 1st – 2nd 0.872 0.404 0.802 0.775 0.732 0.590 0.802 0.639 0.559 0.398 z -0.246 2.121 -1.158 -2.027 -1.953 0.726 -1.158 1.900 -0.511 3.229
Table 3.21. The means of the first readings, second readings, the difference in the means, standard
error and z-value for BChVI for the complete set. Blue highlights show inter-rater differences; yellow highlights show intra-rater differences. The green cells indicate no difference from the
control mean scores.
Student readings compared with the control.
For the single denture, the mean control for the first reading is 4.000. Based on an overall
estimate of error variation the standard error of the difference between the control mean
and any student mean is 0.5306, so an observed difference of 1.040 or greater indicates
statistical significance at level 0.05 or smaller.
For the single denture, two BChDIII students (1 and 4) did not differ from the control and
showed good intra-rater reliability. (Table 3.18) Students 2, 6, 8, 9 and 10 showed some

35
similarity with the control score, but displayed poor reliability. Three students (3, 5 and 7)
differed from the control and showed poor intra-rater reliability.
For the single denture and BChDV students (Table 3.19), all students displayed good intra-
rater reliability. Six students (11, 13, 16, 17, 18 and 20) did not differ from the control.
Students 15 and 19 had some similarity with the control scores. Students 12 and 14
differed completely from the control and did so consistently.
For the complete set the mean control for the first reading is 3.786. Based on an overall
estimate of error variation the standard error of the difference between the control mean
and any student mean is 0.5529, so an observed difference of 1.084 or greater indicates
statistical significance at level 0.05 or smaller.
For the complete set (Table 3.20), only one BChDIII student (7) did not differ with the
control and had good intra-rater reliability. Two students (1 and 10) had some similarity
with the control and good intra-rater reliability. Five students (2, 3, 4, 5, and 9) showed
some similarity with the control scores, but with poor intra-rater reliability. One student (6)
differed completely with the control and consistently so. One student (8) differed from the
control with poor intra-reliability.
For the BChDV students rating the complete set (Table 3.21), 4 students (11, 13, 16 and
19) did not differ from the control with good intra-rater reliability. Three students (15, 17,
and 18) did have some similarity with the control scores, with good intra-rater reliability.
Three students (12, 14 and 20) displayed some similarity but poor intra-rater reliability.

36
Considering all the 6 data bases represented by Tables 3.16 to 3.21, in only 17 instances
(of the possible 60), did observers’ mean scores not differ from the control mean scores
with good intra-rater reliability. In all other 43 instances observers’ mean scores differed
from the control mean scores and/or displayed poor intra-rater reliability.
Differences between BChDIII and BChDV students.
Table 3.22 gives means of single denture 1st reading (s1), single denture 2nd reading (s2),
complete set 1st reading (d1) and complete set 2nd reading (d2) for the two year groups. The
last column gives the result of a t-test (unpaired) of significance of difference of the means.
The means of the second readings of the complete set differ significantly between the 2
student groups. The others did not differ.
Table 3.22
BChDIII BChDV P
s1 4.193 3.964 0.673 s2 3.386 4.350 0.150 d1 4.107 4.057 0.904 d2 2.757 4.214 0.018*
Table 3.22. BChDIII and V means. *=significant difference

37
CHAPTER 4: DISCUSSION
4.1. Introduction
The objectives were to:
1. Establish the accuracy of identification of the markings by groups of observers by
comparing them with a control data set derived by consensus by 2 other observers
2. Establish intra-observer reliability by comparing the occlusal markings identified by
the same observers at 2 different time intervals
3. Establish inter-observer reliability by comparing the occlusal markings identified by
different groups of observers (students / dentists), and
4. Establish the role of the presence of the opposing denture on observer reliability and
accuracy.
Null-‐hypotheses
1. The markings identified by different groups of observers are not accurate
2. There is no intra-observer reliability
3. There is no inter-observer reliability
4. Observer accuracy and reliability is not improved by the presence of the opposing
upper denture.

38
The answer to the null-hypotheses is as follows:
1. The majority of the mean scores of all the observes differed from the control mean
score agreed by 2 other observers. Therefore, the first null-hypothesis is accepted
2. The second null-hypothesis is partially rejected because in 21 of the 60 instances, poor
intra-rater reliability was found
3. The third hypothesis is accepted because poor inter-rater reliability was predominant in
all data series
4. The fourth hypothesis is accepted because the presence of the opposing denture did not
improve rater reliability.
4.2. Discussion of the results
Looking at the control group, the total number of markings counted for the 14 dentures
was 56 (with an average of 4 markings per denture) for the single lower denture, and 53
(with an average of 3.78 markings per denture) for the denture with the opposing upper
denture also available for assessment. Comparing these totals and means, there was no
significant difference between the 2 series of dentures. At first glance, this means that for
the control observers, it did not make a difference whether the upper denture was present
or not when the markings were counted. However, looking at the distribution of the
markings, there appeared to be a lack of correlation between the data series from single and
full set markings. This became clear when a least squares analysis was done: while the
total did not differ, different markings on teeth were identified and counted when looking
at the lower denture with and without opposing upper denture. Therefore, it remains
questionable if the presence of the opposing denture has an influence on the number of
occlusal markings identified on a lower CD. This is clinically relevant because different

39
teeth may then be selected for occlusal adjustment in an effort to harmonize the occlusion.
If the incorrect teeth are selected and adjusted, this may result in an occlusion that is not
well-balanced. Shigli et al., (2008) stated that a well-balanced occlusion is one aspect of
complete denture therapy that may contribute to patient adaptation.
When staff counted the markings on the lower dentures without the upper present, they
counted 485 markings initially, and 566 two weeks later.
For the single denture, using the control scores agreed by 2 observers, staff 7 and 9 agree
with the control scores, both also displaying good intra-rater reliability (z-value smaller
than 2) (Table 3.16). Staff members 1, 3, 5, 6 and 8 differed from the control scores, but
did so reliably (z-value smaller than 2). These staff members may be easier to train into
discriminating between the correct markings as agreed by the 2 observers, and the incorrect
occlusal markings compared to the following category of staff. Staff members 2, 4 and 10
also differed from the control, and displayed unreliability in scoring. These individuals
may be the more difficult ones to standardize.
Still for the single denture, in terms of inter-rater reliability, an analysis of variance showed
significant differences among staff members for both the first reading of the markings and
the reading 2 weeks later. This means that staff are identifying different markings for
occlusal adjustment when given the same dentures. This may have negative consequences
for student training when staff do not agree on markings earmarked for occlusal
adjustments.
For the complete set, the scores of staff members’ nos. 4, 6, 7 and 9 did not differ from the
control scores, with staff members 6, 7 and 9 displaying good intra-rater reliability also

40
(Table 3.17). Raters 1, 3, 5, 8 and 10 differed from the control readings, and did so
reliably. Rater 2 differed from the control and also displayed poor intra-rater reliability.
It is important to remember in the interpretation of the results, that only mean scores were
used to calculate z-values and compare means. However, when distribution was examined,
more differences could be found among all raters. For example, staff member 9 showed no
difference in the total and mean markings counted. However, when looking at the values
for each denture, this staff member identified the same number of markings for 1 denture
only (Tables 3.4 and 3.5). Therefore, it is appropriate to remember that results in this study
may conceal differences in distribution that would make reliability scores worse than they
appear.
To assess the extent of distribution differences, a least squares analysis similar to the one
done for the control scores could be done for each observer. However, because substantial
reliability differences were already found by using mean scores only, it was decided not to
take the analysis further.
Looking at a possible association between years of experience of supervision staff and
mean counts of markings, no correlation was found. It was thought that more experienced
staff may correlate with the 2 control observers. This was not found.
The BChDIII group showed the highest prevalence of poor intra-rater reliability, with 13
out of 20 occurrences of z-value equal or higher than 2 (Tables 3.18 and 3.20). Inter-rater
reliability was also poor with many significant differences between mean scores of
observers. This poor reliability was to be expected as these students are treating edentulous
patients with complete dentures for the first time.

41
The fact that these students do not correlate with the control, as well as the other staff
observers, strengthens the argument that using articulating paper intra orally is in itself a
flawed procedure and should not be done. This finding is consistant with that of Wilson
and Rees (2006).
The BChDV group demonstrated the highest level of similarity with the control group with
28 of the 40 mean scores being similar to the control mean score. This was better than the
staff. Staff only had 14 mean scores being the same as the control mean scores. The
BChDV group also had the highest intra-rater reliability of all observer groups, with only 3
unreliable raters. Staff had 5 of those.
The large difference in reliability between the student groups, with the BChDV students
performing so much better, may be attributed to coincidence. There is a general overall
lack of correlation with all the observer groups, thus no other conclusion can be drawn
from the findings of the BChDV group.
Very little literature exists in terms of exploring rater reliability when using articulating
paper in removable prosthodontics. This makes it difficult to engage the results of this
study with others. Wilson and Rees (2006) looked at occlusal markings when articulating
paper was used on dentures intra-orally, or extra-orally on articulated dentures. It was
found that the use of articulating paper on articulated dentures lead to fewer occlusal
markings, more unilateral markings and improved rater reliability compared to using
articulating paper on dentures in the mouth. The findings of my study seem to support
these findings in the sense that the use of articulating paper intra-orally is unreliable.

42
This study supports the findings by Millstein (2008) indicating that there are no American
Dental Association (ADA) standards for the assessment of occlusal contacts and there are
no scientific based guidelines for the clinician when utilising articulating paper.
Standardization guidelines are necessary to improve the clinician’s ability to be consistent
in identifying the correct markings. This is necessary because as highlighted by Wilson and
Rees, (2006) “Despite the majority of prosthodontists recommending a remount procedure,
the majority of dentists in general practice seem to prefer other quicker and more
convenient methods.”
It was assumed at the start of the study that the presence of the opposing denture, so that
corresponding occlusal markings may confirm a true occlusal contact, may improve
accuracy and intra-rater reliability. However, this proved not to be the case. Considering all
observations, 30 correct mean scores were given for the single denture; 32 for the complete
set. Also, 10 raters were unreliable when looking at the single denture only; 11 raters were
unreliable when looking at the complete set.

43
4.3. Conclusions
Within the limitations of this study the following conclusions can be made:
1. All observer groups differed from each other
2. Intra-rater reliability was generally poor among all observers in the study.
3. Inter-rater reliability was poor for all the observer groups, for all observation
periods.
4. The presence of an opposing denture did not to improve intra-rater reliability or
accuracy.
5. There is no statistical significant correlation with years of experience in clinical
practice and rater accuracy and reliability when assessing occlusal markings.
6. This study confirms that the use of articulating paper intra-orally to assess the
occlusion in CDs is unreliable and invalid and should not be a clinical
procedure.
4.4. Recommendations
Articulating paper should not be used intra orally to assess the occlusion in complete
dentures.

44
BIBLIOGRAPHY
Adam RZ, Geerts GAVM, Lalloo R. (2007) The impact of new complete dentures on oral
health-related quality of life. SADJ; 27: 264-268.
Ansari IH. (1996). Simplified clinical remount for complete dentures. J Prosthet Dent; 76:
321-4.
Du Plessis JB, Rossouw LM, Smit J, Lichter G. (1989). Prosthetic status and treatment
needs of the adult population of South Africa. National Oral Health Survey: 93-101.
Felton DA. (2009). Edentulism and comorbid factors. J Prosthodont; 18: 88–96.
Geerts G. (2013). Occlusal contacts on dentures registered intra-orally and using clinical
remounts. Abstract no.11, IADR SA Division.
Goiato MC, Filho HG, dos Saantos DM, Barão AR and Júnior ACF (2011) Insertion and
follow-up of complete dentures: a literature review. Gerodontology; 28: 197-204
Jacobson TE, Krol AJ. (1983). A contemporary review of the factors involved in complete
dentures. Part II: Stability. J Prosthet Dent; 49: 165-172.
Kerstein RB. (2008). Articulating paper mark misconceptions and computerized occlusal
analysis technology. Dent Implantol Update; 19: 41-46.

45
Louw NP, Moola MH. (1979). The dental needs and demands of the Cape Coloured people
in the Cape Peninsula. J Dent Assoc S Afr; 34: 7-15.
Millstein P, Maya A. (2001). An evaluation of occlusal contact marking indicators: a
descriptive quantitative method. J Am Dent Ass; 132: 1280-1286.
Millstein P. (2008). Know your indicator. J Mass Dent Soc; 56: 30-1.
Oral Health – Healthy People 2010: Objectives for Improving Health Provincial
Government of the Western Cape, Department of Health. 2010. Strategic Plan 2010- 2014.
Cape Town (PGWC 2010).
Saraçoglu A, Özpinar B. (2002). In vivo and in vitro evaluation of occlusal indicator
sensitivity. J Prosthet Dent; 88: 522-526.
Schelb E, Kaiser DA, Bruki CE. (1985). Thickness and marking characteristics of occlusal
registration strips. J Prosthet Dent; 54: 122-126.
Sharma A, Rahul GR, Poduval ST, Shetty K, Gupta B, Rajora V. (2013). History of
materials used for recording static and dynamic occlusal contact marks: a literature review.
J Clin Exp Dent; 5: 48-53.
Shigli K, Angadi GS, Hedge P. (2008). The effect of remount procedures on patient
comfort for complete denture treatment. J Prosthet Dent; 99: 66-72.

46
Takai A, Nakano M, Bando E, Hewlett ER. (1993). Evaluation of three occlusal
examination methods used to record tooth contacts in lateral excursive movements. J
Prosthet Dent; 70: 500-505.
Van Wyk CW, Farman AG, Staz J. (1977). Oral health status of institutionalized elderly
Cape Coloureds from the Cape Peninsula of South Africa. Community Dent Oral
Epidemiol; 5:179-184.
Watermeyer GJJ, Thomas CJ, Van Wyk CW. (1981). The oral health status of elderly
whites in the Cape Peninsula area. J Dent Assoc S Afr; 36: 861-866.
Wilson J, Rees JS. (2006) Eur J Prosthodont Rest Dent; 4: 146-150.

47
APPENDICES
APPENDIX A: Cover Letter
Private Bag X1, Tygerberg 7505
South Africa
Telephone: +27 21 937 3170
Fax: +27 862746550
Email: [email protected]
Information form
Dear colleagues / students
I, Sandile Mpungose, am a Magister Chirurgiae Dentium (MChD) student at the
University of the Western Cape (UWC), student number: 2231806.
I am conducting a study with the title: “Complete denture occlusion: an inter- and intra-
observer analysis amongst different groups at a university setting”.
As the title explains, this study will look at the reliability among different groups of
clinicians and students in the identification of articulating paper marks made on complete
dentures. For this purpose, I need you to look at a series of 14 dentures and identify the
markings made by articulating paper on denture teeth that you would consider for occlusal
adjustment. This will have to be done on 4 occasions, each 2 weeks apart.
Your participation is voluntary and your identity will not be disclosed. The information
supplied will remain confidential.
Restorative Dentistry
Faculty of Dentistry & WHO Collaborating Centre for Oral Health
48
Your participation for the full duration of this study would be greatly appreciated. But,
should you wish to withdraw your participation from this study, you can do so at any time
without any negative consequences.
For further information, you can contact me at 0729176295 or
If you choose to partake in this study, please sign the consent form.
Thank you for spending time in making this an effective study.
Kind Regards
Sandile Mpungose

49
Consent form
I, ………………………………………………, agree to take part in the study with the
title: “Complete denture occlusion: an inter- and intra-observer analysis” performed
by Sandile Mpungose.
I have read and I understand the requirements and conditions of the study.
…………………………………………. ……………………………………
Signature participant Date
…………………………………………. ……………………………………
Signature researcher Date

50
APPENDIX B: QUESTIONNAIRE
Staff No: ………………………………
Research Questionnaire
1. Number of years in clinical practice : ………….… yrs
2. Do you work full-time or part-time as a clinician : …………….-time
3. What percentage (%) of your time contributed to complete dentures?
Complete dentures
Total 100%
4. Based on the markings made by articulating paper on the denture(s), draw on the
diagram the markings you would grind in order to make the occlusion more even.
5. Please note that there could be more than one marking on a tooth.

51
Student No: ………………………………….
Research Questionnaire
1. Year of study: BChD ………
2. What percentage (%) of your time contributed to complete dentures?
Complete dentures
Total 100%
3. Based on the markings made by articulating paper on the denture(s), draw on the
diagram the markings you would grind in order to make the occlusion more even.
4. Please note that there could be more than one marking on a tooth.