Embed Size (px)
DESCRIPTION
Complemento edição 42 da Revista Exame PME
Citation preview
Consumer Shopping Experiences, Preferences, and Behaviors
A consumer research study commissioned by ATGOctober 2010
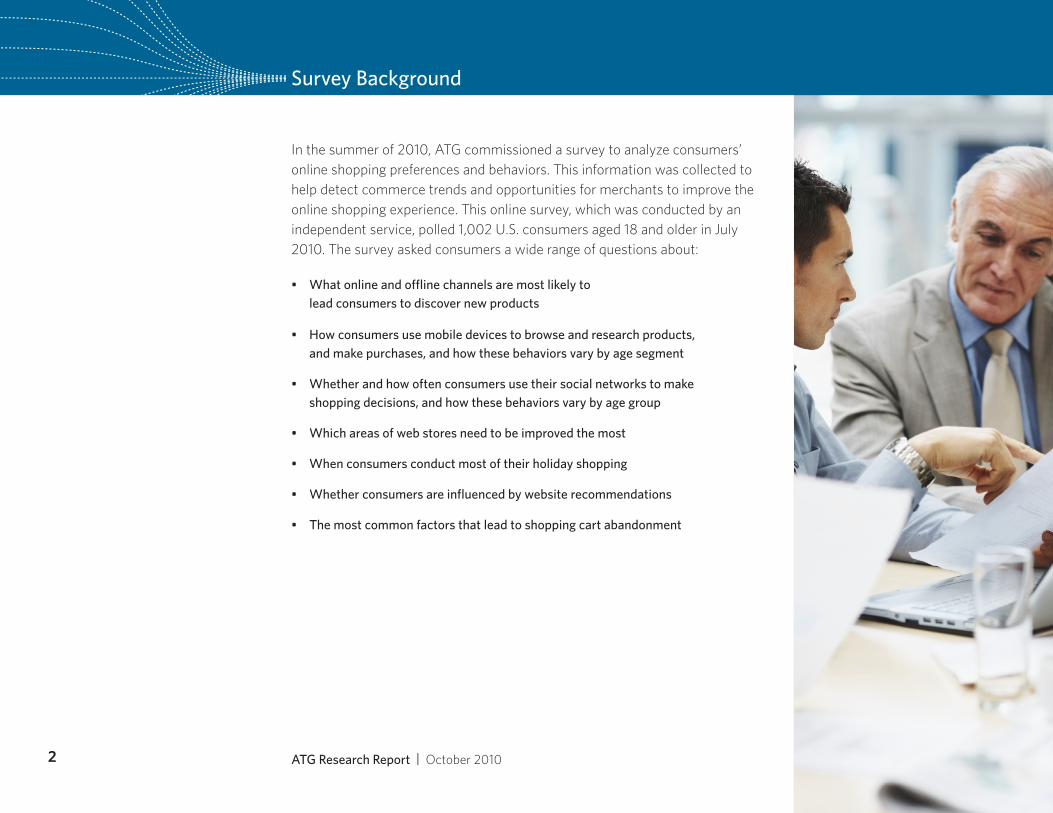
Survey Background
In the summer of 2010, ATG commissioned a survey to analyze consumers’ online shopping preferences and behaviors. This information was collected to help detect commerce trends and opportunities for merchants to improve the online shopping experience. This online survey, which was conducted by an independent service, polled 1,002 U.S. consumers aged 18 and older in July 2010. The survey asked consumers a wide range of questions about:
What online and offline channels are most likely to •lead consumers to discover new products
How consumers use mobile devices to browse and research products, •and make purchases, and how these behaviors vary by age segment
Whether and how often consumers use their social networks to make •shopping decisions, and how these behaviors vary by age group
Which areas of web stores need to be improved the most•
When consumers conduct most of their holiday shopping•
Whether consumers are influenced by website recommendations•
The most common factors that lead to shopping cart abandonment•
ATG Research Report | October 20102
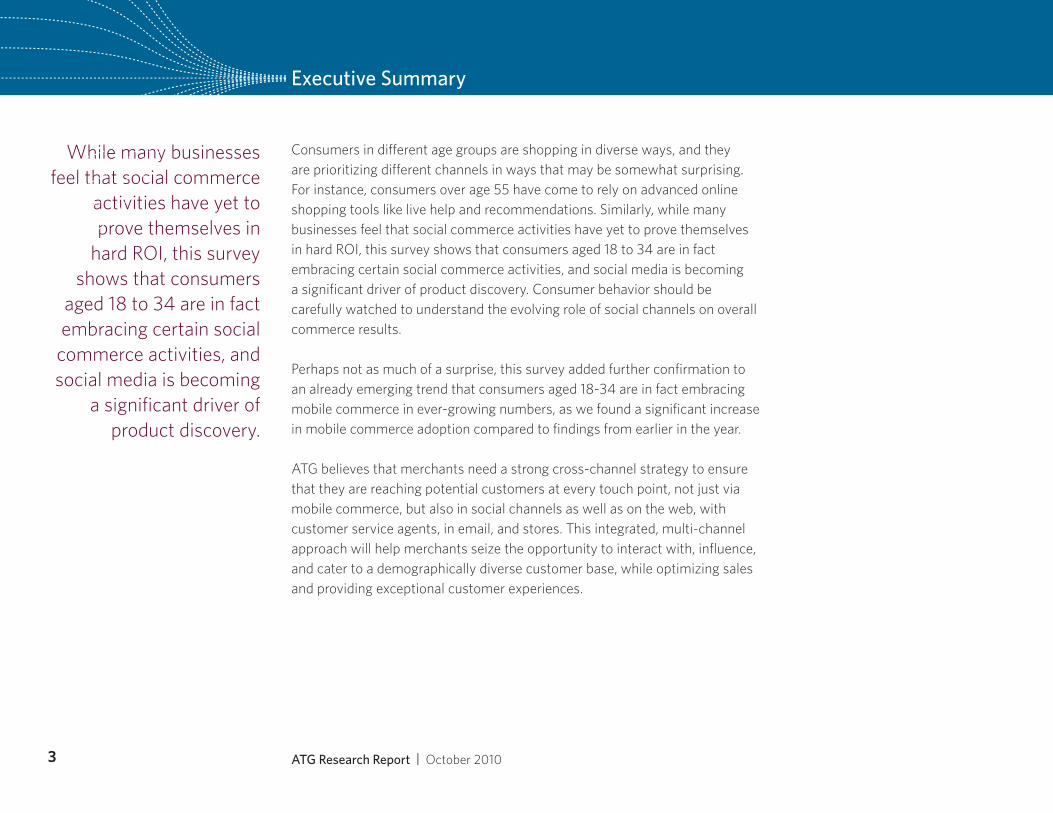
While many businesses feel that social commerce
activities have yet to prove themselves in
hard ROI, this survey shows that consumers
aged 18 to 34 are in fact embracing certain social
commerce activities, and social media is becoming
a significant driver of product discovery.
Executive Summary
Consumers in different age groups are shopping in diverse ways, and they are prioritizing different channels in ways that may be somewhat surprising. For instance, consumers over age 55 have come to rely on advanced online shopping tools like live help and recommendations. Similarly, while many businesses feel that social commerce activities have yet to prove themselves in hard ROI, this survey shows that consumers aged 18 to 34 are in fact embracing certain social commerce activities, and social media is becoming a significant driver of product discovery. Consumer behavior should be carefully watched to understand the evolving role of social channels on overall commerce results.
Perhaps not as much of a surprise, this survey added further confirmation to an already emerging trend that consumers aged 18-34 are in fact embracing mobile commerce in ever-growing numbers, as we found a significant increase in mobile commerce adoption compared to findings from earlier in the year.
ATG believes that merchants need a strong cross-channel strategy to ensure that they are reaching potential customers at every touch point, not just via mobile commerce, but also in social channels as well as on the web, with customer service agents, in email, and stores. This integrated, multi-channel approach will help merchants seize the opportunity to interact with, influence, and cater to a demographically diverse customer base, while optimizing sales and providing exceptional customer experiences.
3 ATG Research Report | October 2010
37% of consumers aged 18-34 said it
was “important” or “very important” that merchants provide an
opportunity to interact through social networks.
Executive Summary
Key findings of the survey include:
About 29% of respondents aged 18-34 said they have discovered a product or service through a social network. Merchants have a substantial opportunity to drive sales through this channel. Half of consumers aged 18-34 are using social networks, especially Facebook, in their shopping-related activities. In fact, 50% of this age group are using Facebook to “like” merchants, interact with other consumers and friends about products, post images and reviews, seek customer service, look for coupons, and post messages to a merchant’s fan page. 37% of consumers in this age group said it was “important” or “very important” that merchants provide an opportunity to interact through social networks.
About 41% of consumers aged 18-34 are using their mobile device to complete purchases of products and services with varying frequencies. This is a significant increase from the 23% in this same age group that indicated they are making mobile purchases at least four times a year in an ATG-sponsored consumer survey released in the spring 2010. This change is consistent with other industry observations that mobile commerce, as a share of overall revenue, is growing extremely rapidly over the course of weeks and months, not years. Customers are quickly coming to expect a mobile commerce experience that’s as consistent and satisfying as what they find in the web channel.
Across all age groups, men are more likely to make purchases on their mobile devices, with 19% of men saying they have made mobile purchases at least once, compared to 8.5% of women. Younger consumers are using tablet devices, including iPads, in higher numbers.
ATG Research Report | October 20104
Consumers identified “more detailed product
information,” “better search capabilities,” and “provide customers with
live help options” as the areas most needing
improvement.
Executive Summary
46% of 18-34 year-olds are using their mobile devices to receive text notifications from merchants, search for coupons, browse through merchants’ collections, and seek ratings and reviews. Merchants should consider how to maximize mobile commerce experiences with targeted mobile promotions, personalized mobile applications, and support for mobile live help.
Most web stores can be improved in some way, according to consumers. Across all age groups, about 80% of respondents said most web stores need enhancements and upgrades. Consumers identified “more detailed product information,” “better search capabilities,” and “provide customers with live help options” as the areas most needing improvement.
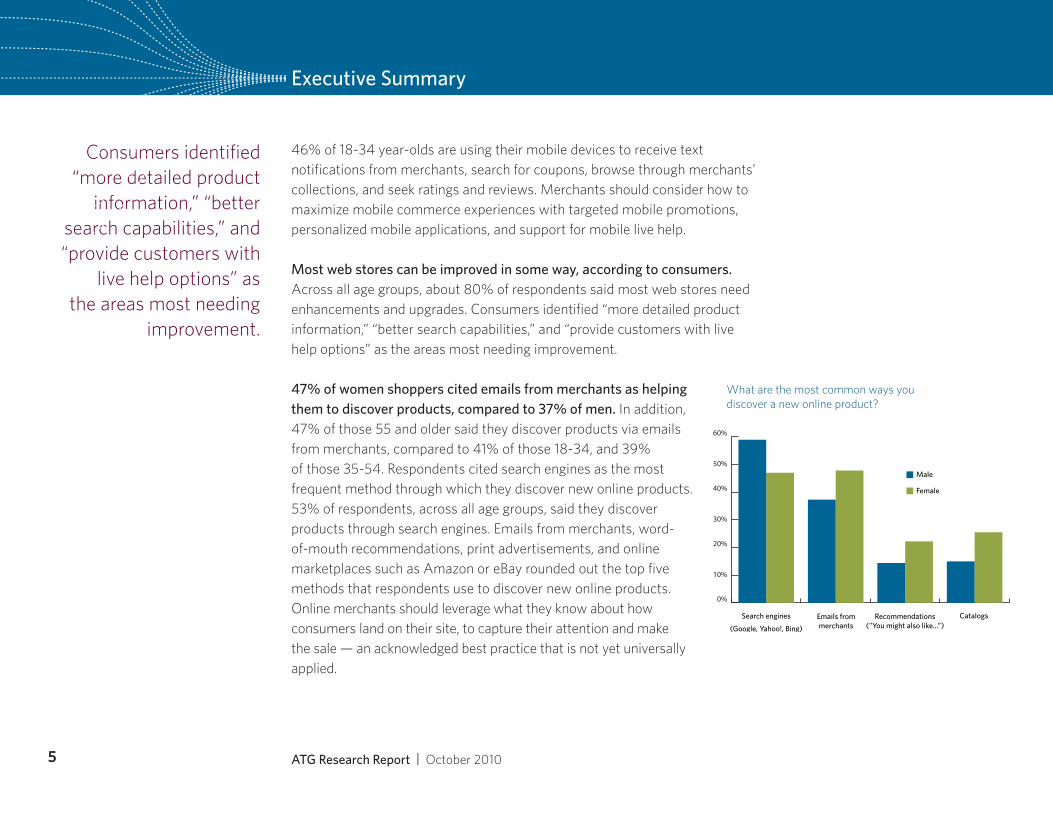
47% of women shoppers cited emails from merchants as helping them to discover products, compared to 37% of men. In addition, 47% of those 55 and older said they discover products via emails from merchants, compared to 41% of those 18-34, and 39% of those 35-54. Respondents cited search engines as the most frequent method through which they discover new online products. 53% of respondents, across all age groups, said they discover products through search engines. Emails from merchants, word-of-mouth recommendations, print advertisements, and online marketplaces such as Amazon or eBay rounded out the top five methods that respondents use to discover new online products. Online merchants should leverage what they know about how consumers land on their site, to capture their attention and make the sale — an acknowledged best practice that is not yet universally applied.
ATG Research Report | October 20105
0%
10%
20%
30%
40%
50%
60%
Search engines
(Google, Yahoo!, Bing)Emails frommerchants
Recommendations(”You might also like...”)
Catalogs
Male
Female
What are the most common ways you discover a new online product?
Research Highlights
Most consumers are starting their holiday shopping before the post-Thanksgiving sales, and the web dominates as the channel of choice to conduct holiday shopping activities. Just 22% of respondents plan to wait until “Black Friday” (the Friday after Thanksgiving) or “Cyber Monday” (the Monday following Black Friday) to do holiday shopping. When asked which channels shoppers plan to use to do the most holiday shopping this year, 84% (across all age groups) plan to use the web most frequently. “In the store” was the second preference, cited by 56%, and catalogs were ranked third at 32%. By comparison, a consumer survey conducted by Accenture in September 2010 also found that a large majority of respondents would purchase holiday gifts online in 2010.
ATG Research Report | October 20106
Research Highlights
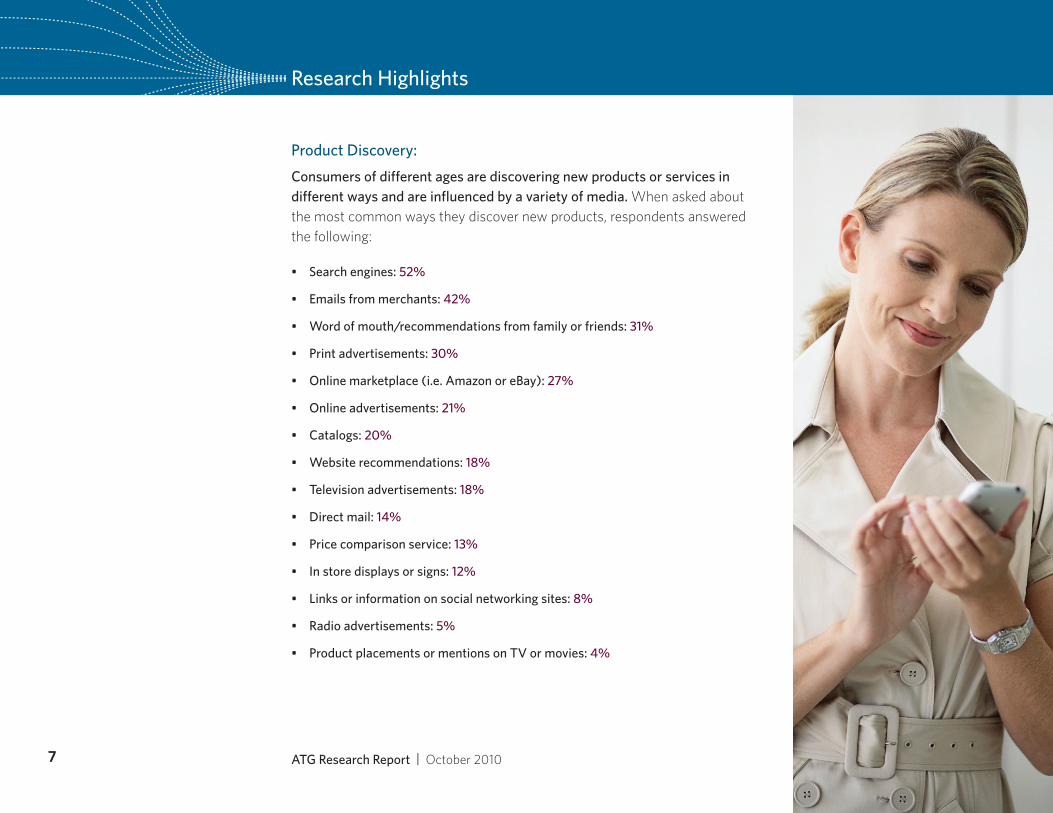
Product Discovery:
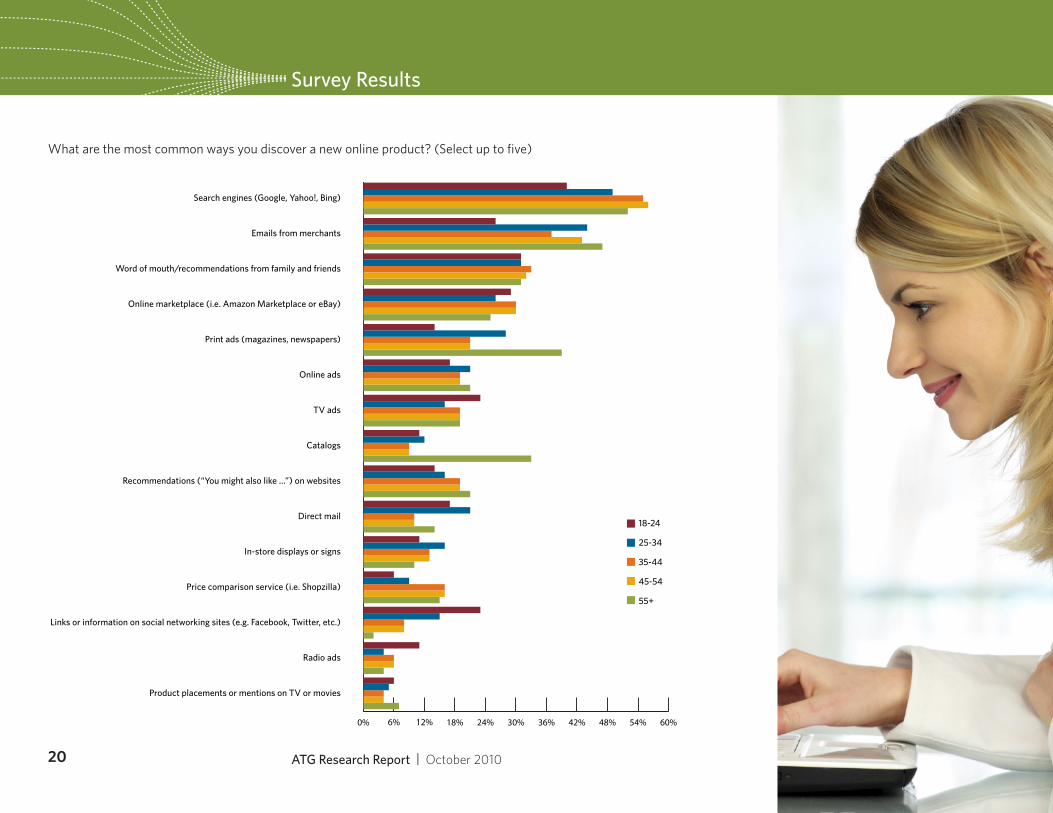
Consumers of different ages are discovering new products or services in different ways and are influenced by a variety of media. When asked about the most common ways they discover new products, respondents answered the following:
Search engines: • 52%
Emails from merchants: • 42%
Word of mouth/recommendations from family or friends: • 31%
Print advertisements: • 30%
Online marketplace (i.e. Amazon or eBay): • 27%
Online advertisements: • 21%
Catalogs: • 20%
Website recommendations: • 18%
Television advertisements: • 18%
Direct mail: • 14%
Price comparison service: • 13%
In store displays or signs: • 12%
Links or information on social networking sites: • 8%
Radio advertisements: • 5%
Product placements or mentions • on TV or movies: 4%
7 ATG Research Report | October 2010
Younger consumers are more likely than older
consumers to discover new products through
social networking sites. Those over age 55, while
they haven’t embraced social and mobile in
large numbers, are still looking for a strong
online experience, including helpful website
recommendations.
Research Highlights
Men and women shoppers cited different media to discover products. 47% of women cited emails from merchants as helping them discover new online products, compared to 37% of men. Women were more likely to discover new products in catalogs (26% compared to 15% of men), and were also more likely to cite website recommendations as another influencer (22% of women compared to 14% of men). Men were more likely to rely on search engines to discover new products (59% compared to 47% of women).
There are also stark differences in how different age groups discover new online products.
20% of consumers aged 18-34 cited • direct mail, compared to 11% in the 35-54 age group, and 14% in the 55 and older group.
Younger consumers were slightly less likely to discover products through •search engines. 47% in the 18-34 age group said search engines, compared to 55% in the 35-54 group, and 52% in the 55 and older segment.
47% of those 55 and older cited • emails from merchants, compared to 41% of those 18-34, and 39% of those 35-54.
17% of those 18-34 cited information on • social networking sites, while just 8% of those 35-54 and just 2% of those 55 and older said social sites played a role in their discovery of new products or services.
Older consumers rely more on • print advertisements (in magazines and newspapers). 39% of those 55 and older cited print ads, compared to 26% in the 35-54 group, and 26% in the 18-34 segment.
Younger consumers were less likely to use a• price comparison service. Just 8% of those 18-34 cited these services, compared to 15% of those 35-54, and 15% of those 55 and older.
8 ATG Research Report | October 2010
Research Highlights
Website recommendations• are slightly more influential to older consumers. 21% of those 55 and older cited recommendations, compared to 16% of those 18-34, and 17% of those 35-54.
Use of • catalogs to discover products also skews older. 33% of consumers 55 and older cited catalogs, compared to 15% of those 35-54, and 12% of those 18-34.
Since search engines assume such a critical role in the product discovery process, e-tailers and other merchants should be paying attention to referring keywords and using what they know about how a consumer found their site to capture their attention and make a sale. Merchants can take advantage of automated merchandising solutions that make product recommendations based on what keywords a consumer used in a search engine to arrive at the merchant’s web store.
Younger consumers are more likely than older consumers to discover new products through social networking sites. Those over age 55, while they haven’t embraced social and mobile in large numbers, are still looking for a strong online experience, including helpful website recommendations.
When asked whether they had ever discovered a new product or service through a social network, the respondents who answered “yes” broke down by age group as follows:
18-34: • 29%
35-44: • 16%
45-54: • 14%
55 and older: • 4%
9 ATG Research Report | October 2010
In Shop.org’s annual “State of Retailing Online”
survey of merchants, 28% of retailers reported
that social commerce had helped them grow their business, but few had a
system for measuring sales from social media
involvement.
Research Highlights
Social Commerce
Even beyond product discovery, consumers between the ages of 18 and 34 are adopting social media into their overall commerce activities. Half of consumers in this younger age group are using their social networks as a trusted resource, seeking advice and learning about the experiences of other consumers for items they are interested in purchasing.
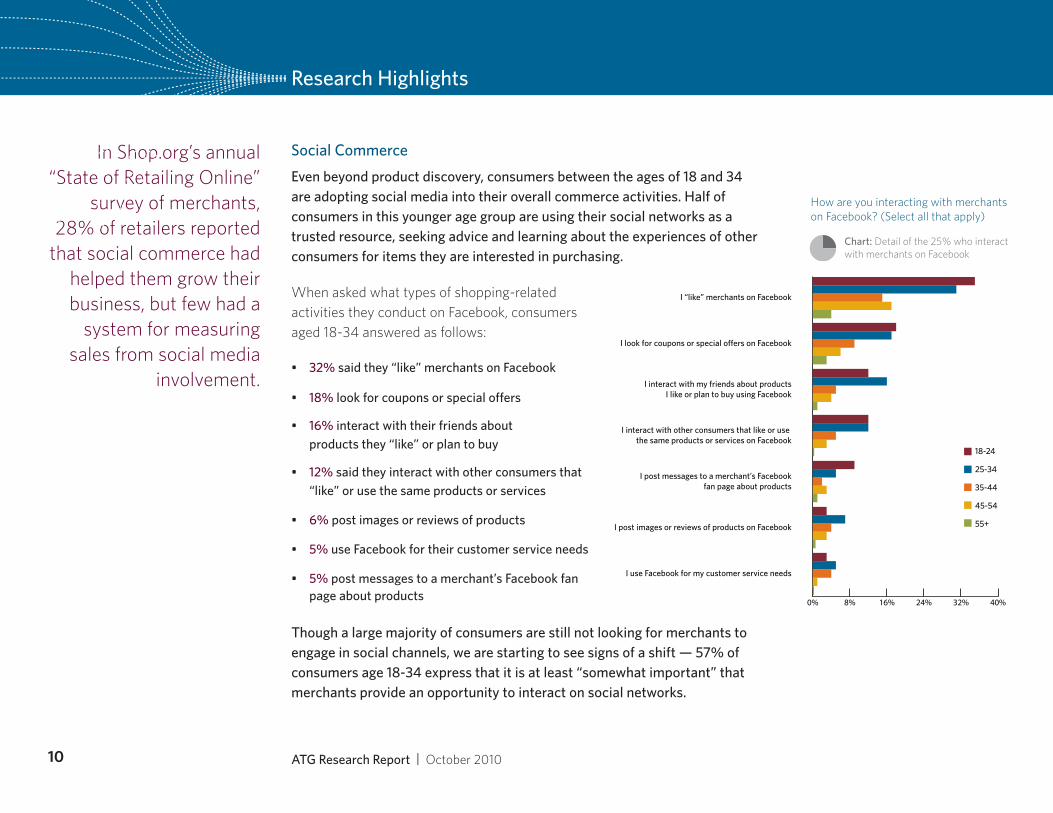
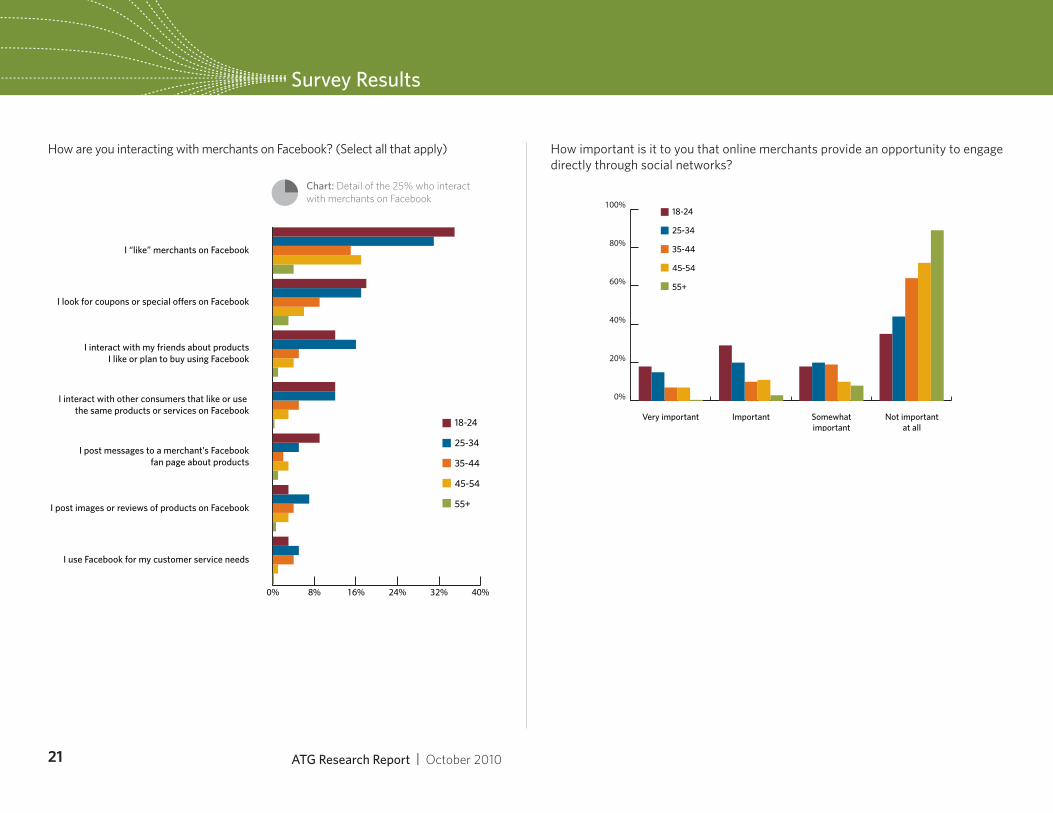
When asked what types of shopping-related activities they conduct on Facebook, consumers aged 18-34 answered as follows:
32%• said they “like” merchants on Facebook
18%• look for coupons or special offers
16%• interact with their friends about products they “like” or plan to buy
12%• said they interact with other consumers that “like” or use the same products or services
6%• post images or reviews of products
5%• use Facebook for their customer service needs
5%• post messages to a merchant’s Facebook fan page about products
Though a large majority of consumers are still not looking for merchants to engage in social channels, we are starting to see signs of a shift — 57% of consumers age 18-34 express that it is at least “somewhat important” that merchants provide an opportunity to interact on social networks.
10 ATG Research Report | October 2010
0% 8% 16% 24% 32% 40%
I interact with my friends about productsI like or plan to buy using Facebook
I look for coupons or special offers on Facebook
I “like” merchants on Facebook
I interact with other consumers that like or use the same products or services on Facebook
I post messages to a merchant’s Facebookfan page about products
I post images or reviews of products on Facebook
I use Facebook for my customer service needs
18-24
25-34
35-44
45-54
55+
How are you interacting with merchants on Facebook? (Select all that apply)
Chart: Detail of the 25% who interact with merchants on Facebook
Research Highlights
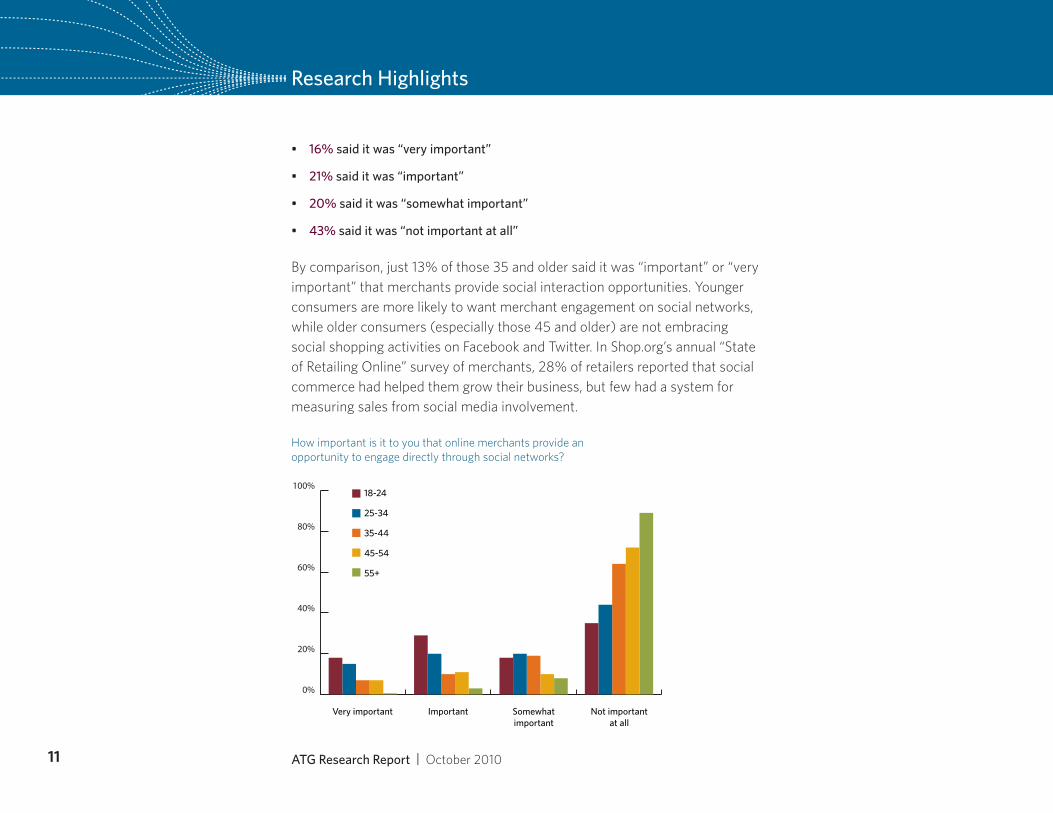
16%• said it was “very important”
21%• said it was “important”
20%• said it was “somewhat important”
43%• said it was “not important at all”
By comparison, just 13% of those 35 and older said it was “important” or “very important” that merchants provide social interaction opportunities. Younger consumers are more likely to want merchant engagement on social networks, while older consumers (especially those 45 and older) are not embracing social shopping activities on Facebook and Twitter. In Shop.org’s annual “State of Retailing Online” survey of merchants, 28% of retailers reported that social commerce had helped them grow their business, but few had a system for measuring sales from social media involvement.
11 ATG Research Report | October 2010
0%
20%
40%
60%
80%
100%
Very important Important Somewhatimportant
Not importantat all
18-24
25-34
35-44
45-54
55+
How important is it to you that online merchants provide an opportunity to engage directly through social networks?
37% of respondents said they use mobile devices
to browse or research products and services. This figure has grown
from 27%, reported in another ATG consumer
survey conducted earlier this year.
Research Highlights
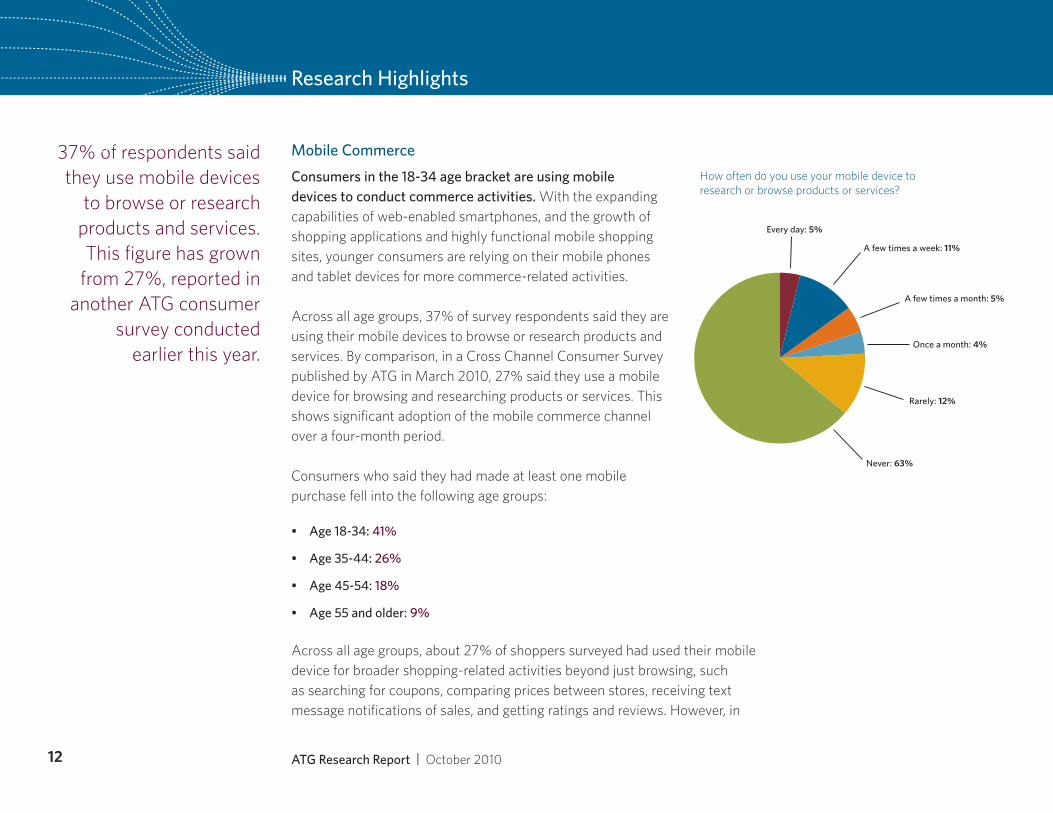
Mobile Commerce
Consumers in the 18-34 age bracket are using mobile devices to conduct commerce activities. With the expanding capabilities of web-enabled smartphones, and the growth of shopping applications and highly functional mobile shopping sites, younger consumers are relying on their mobile phones and tablet devices for more commerce-related activities.
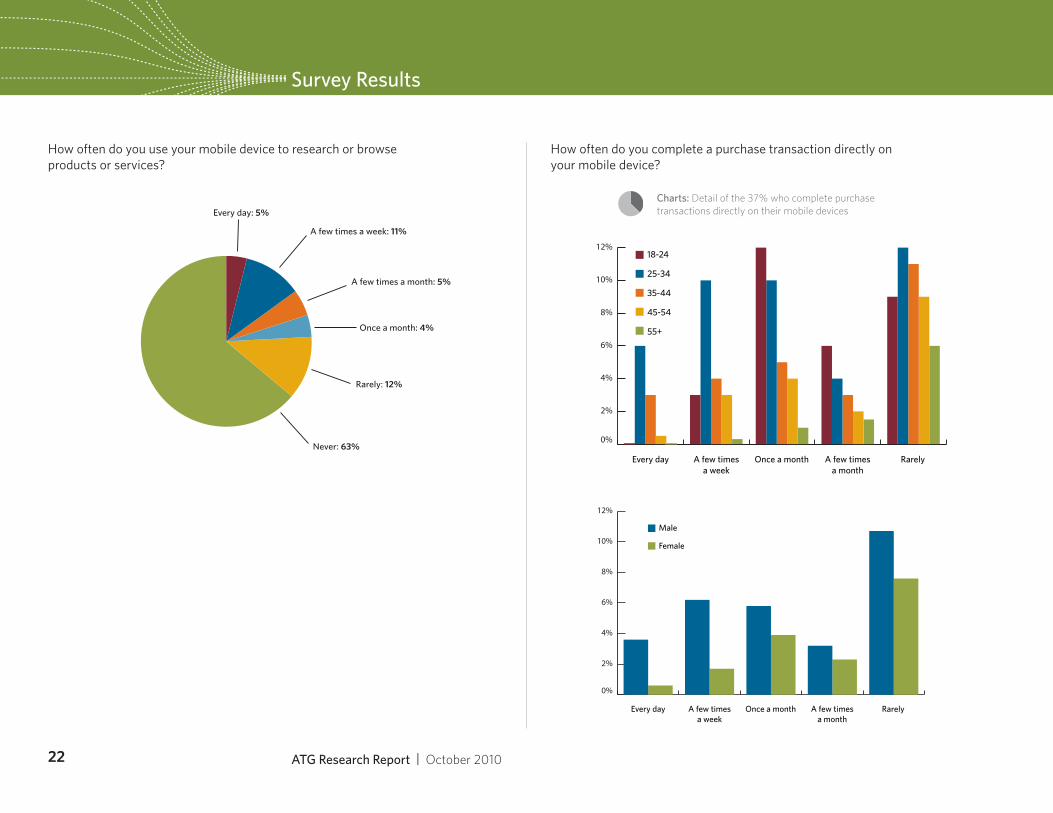
Across all age groups, 37% of survey respondents said they are using their mobile devices to browse or research products and services. By comparison, in a Cross Channel Consumer Survey published by ATG in March 2010, 27% said they use a mobile device for browsing and researching products or services. This shows significant adoption of the mobile commerce channel over a four-month period.
Consumers who said they had made at least one mobile purchase fell into the following age groups:
Age 18-34: • 41%
Age 35-44: • 26%
Age 45-54: • 18%
Age 55 and older: • 9%
Across all age groups, about 27% of shoppers surveyed had used their mobile device for broader shopping-related activities beyond just browsing, such as searching for coupons, comparing prices between stores, receiving text message notifications of sales, and getting ratings and reviews. However, in
Never: 63%
Every day: 5%
A few times a week: 11%
A few times a month: 5%
Once a month: 4%
Rarely: 12%
How often do you use your mobile device to research or browse products or services?
12 ATG Research Report | October 2010
Research Highlights
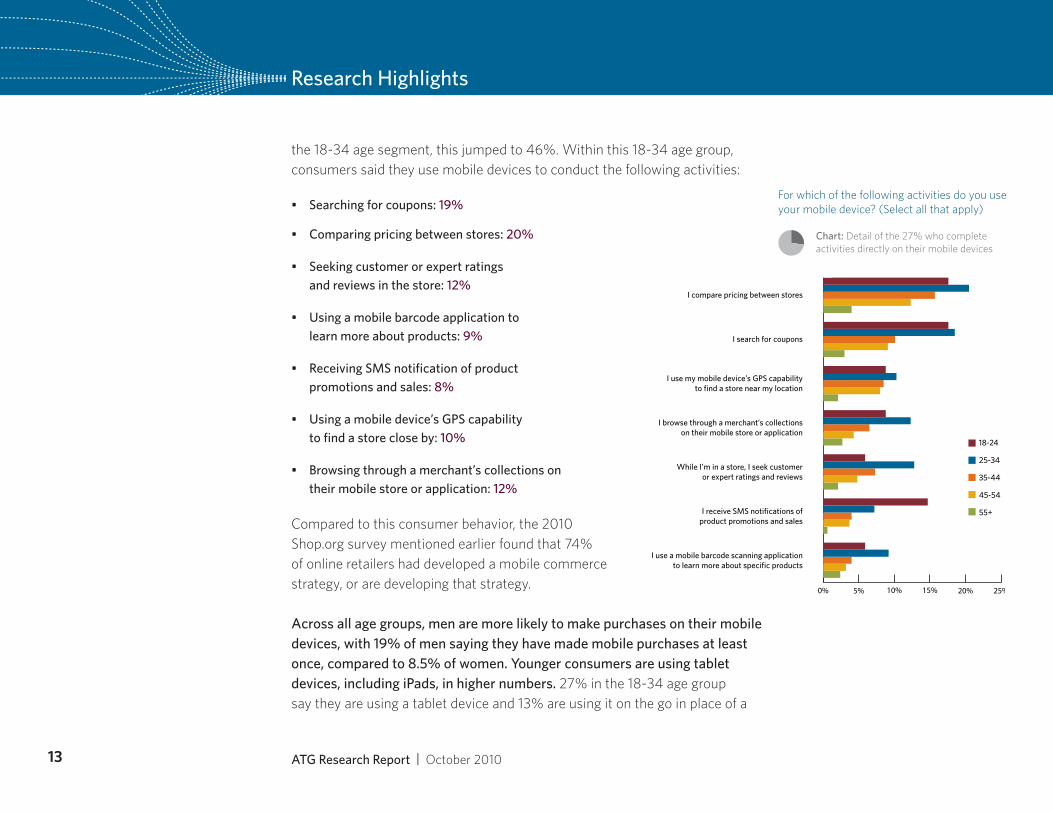
the 18-34 age segment, this jumped to 46%. Within this 18-34 age group, consumers said they use mobile devices to conduct the following activities:
Searching for coupons: • 19%
Comparing pricing between stores: • 20%
Seeking customer or expert ratings •and reviews in the store: 12%
Using a mobile barcode application to •learn more about products: 9%
Receiving SMS notification of product •promotions and sales: 8%
Using a mobile device’s GPS capability •to find a store close by: 10%
Browsing through a merchant’s collections on •their mobile store or application: 12%
Compared to this consumer behavior, the 2010 Shop.org survey mentioned earlier found that 74% of online retailers had developed a mobile commerce strategy, or are developing that strategy.
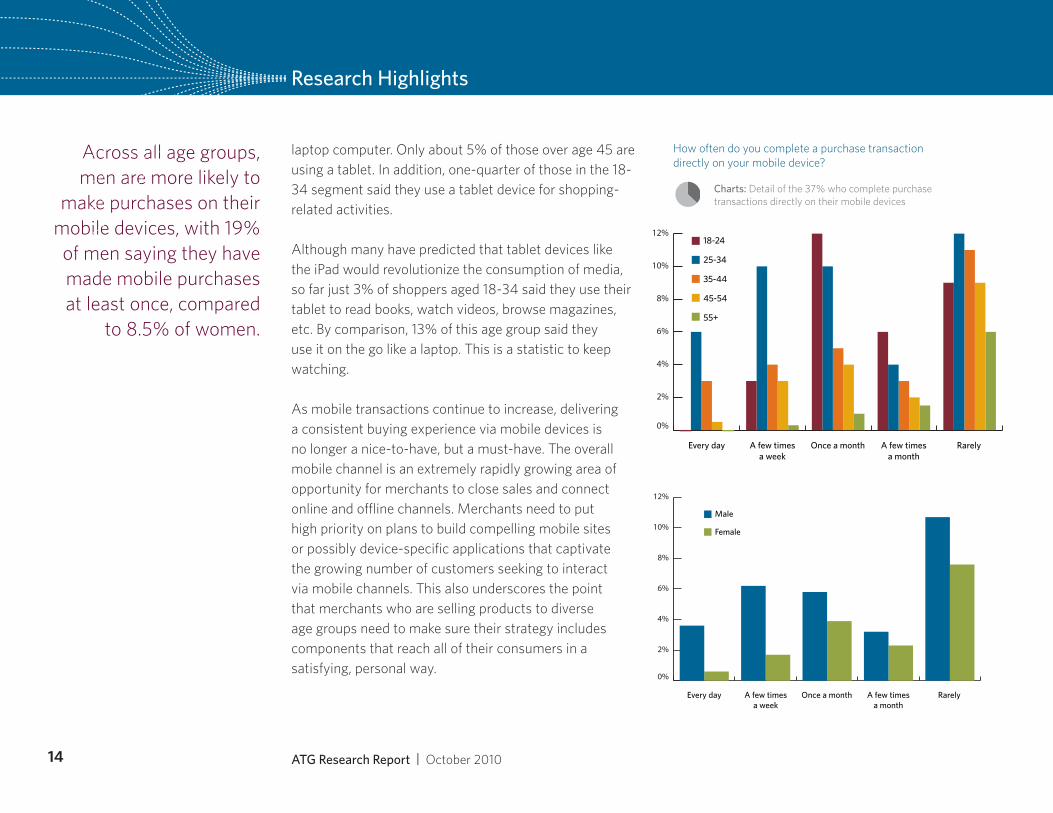
Across all age groups, men are more likely to make purchases on their mobile devices, with 19% of men saying they have made mobile purchases at least once, compared to 8.5% of women. Younger consumers are using tablet devices, including iPads, in higher numbers. 27% in the 18-34 age group say they are using a tablet device and 13% are using it on the go in place of a
13 ATG Research Report | October 2010
0% 5% 10% 15% 20% 25%
I use my mobile device’s GPS capabilityto find a store near my location
I search for coupons
I compare pricing between stores
I browse through a merchant’s collectionson their mobile store or application
While I’m in a store, I seek customeror expert ratings and reviews
I receive SMS notifications ofproduct promotions and sales
I use a mobile barcode scanning applicationto learn more about specific products
18-24
25-34
35-44
45-54
55+
For which of the following activities do you use your mobile device? (Select all that apply)
Chart: Detail of the 27% who complete activities directly on their mobile devices
0%
2%
4%
6%
8%
10%
12%
Every day A few timesa week
Once a month A few timesa month
Rarely
Male
Female
0%
2%
4%
6%
8%
10%
12%
Every day A few timesa week
Once a month A few timesa month
Rarely
18-24
25-34
35-44
45-54
55+
How often do you complete a purchase transaction directly on your mobile device?
Across all age groups, men are more likely to
make purchases on their mobile devices, with 19% of men saying they have made mobile purchases at least once, compared
to 8.5% of women.
Research Highlights
laptop computer. Only about 5% of those over age 45 are using a tablet. In addition, one-quarter of those in the 18-34 segment said they use a tablet device for shopping-related activities.
Although many have predicted that tablet devices like the iPad would revolutionize the consumption of media, so far just 3% of shoppers aged 18-34 said they use their tablet to read books, watch videos, browse magazines, etc. By comparison, 13% of this age group said they use it on the go like a laptop. This is a statistic to keep watching.
As mobile transactions continue to increase, delivering a consistent buying experience via mobile devices is no longer a nice-to-have, but a must-have. The overall mobile channel is an extremely rapidly growing area of opportunity for merchants to close sales and connect online and offline channels. Merchants need to put high priority on plans to build compelling mobile sites or possibly device-specific applications that captivate the growing number of customers seeking to interact via mobile channels. This also underscores the point that merchants who are selling products to diverse age groups need to make sure their strategy includes components that reach all of their consumers in a satisfying, personal way.
14 ATG Research Report | October 2010
Charts: Detail of the 37% who complete purchase transactions directly on their mobile devices
About 40% of those aged 55 and older cited more
live help options as an important upgrade for
merchants.
Research Highlights
Web Store Satisfaction
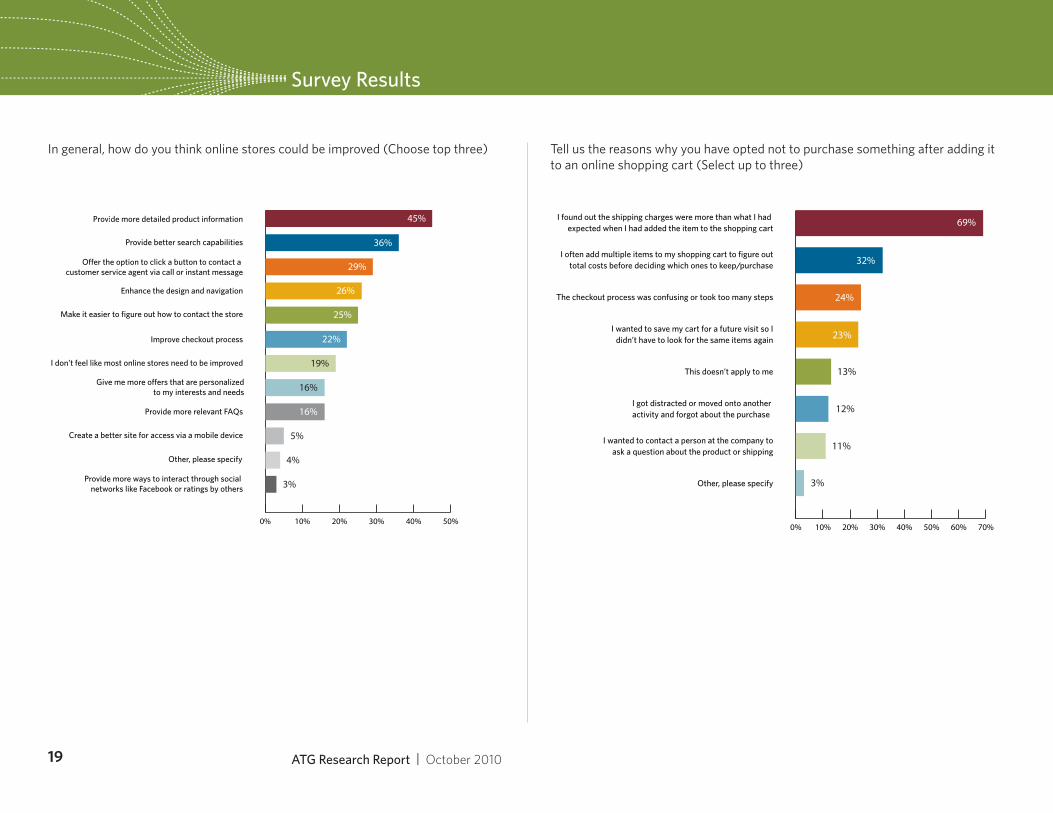
A majority of consumers of all ages feel that the online shopping experience in most web stores can be improved. 80% of respondents cited at least one area where most merchants should make web store upgrades.
When asked how they thought most online stores could be improved, consumers cited the following:
“Provide more detailed product information”: • 45%
“Provide better search capabilities”: • 36%
“Provide customers with live help options”:• 29%
“Enhance the design and navigation”: • 26%
“Make it easier to find out how to contact the store”: • 25%
“Improve checkout process”: • 22%
“Give more offers that are personalized to my interests or needs”: • 16%
“Provide more relevant FAQs”: • 16%
“Provide a better site for access via a mobile device”: • 5%
“Provide more ways to interact through social networks •like Facebook or ratings by others”: 3%
22% of those in the 18-34 age group want more “personalized offers,” compared to just 5% of those 35 and older. Merchants who need to reach this 18-34 age group should take advantage of flexible merchandising tools that allow them to segment and target their customers to cater to what they want and expect. About 40% of those aged 55 and older cited more live help options as an important upgrade for merchants. 26% of respondents said that shipping/pick-up options and convenience were the most important factor of their online shopping experience, aside from price.
15 ATG Research Report | October 2010
Research Highlights
Shopping Cart Abandonment
Consumers tend to abandon a purchase after adding items to an online shopping cart for various reasons, but unexpected shipping charges were the biggest factor. Survey respondents were asked to give reasons why they opted not to purchase something after adding it to an online shopping cart, and answered as follows:
70%• abandoned their carts because they learned that shipping charges were more than they expected
32%• said they add multiple items to their carts to figure out costs before ultimately deciding what to purchase
24%• said the checkout process was too confusing or took too many steps
23%• wanted to save their carts for a future visit so they didn’t need to find the same products again
Merchants have an opportunity to prevent shopping cart abandonment by presenting multiple shipping options and offers during the final stages of the checkout process. Free shipping offers will likely resonate with shoppers this holiday season once again.
16 ATG Research Report | October 2010
Research Highlights
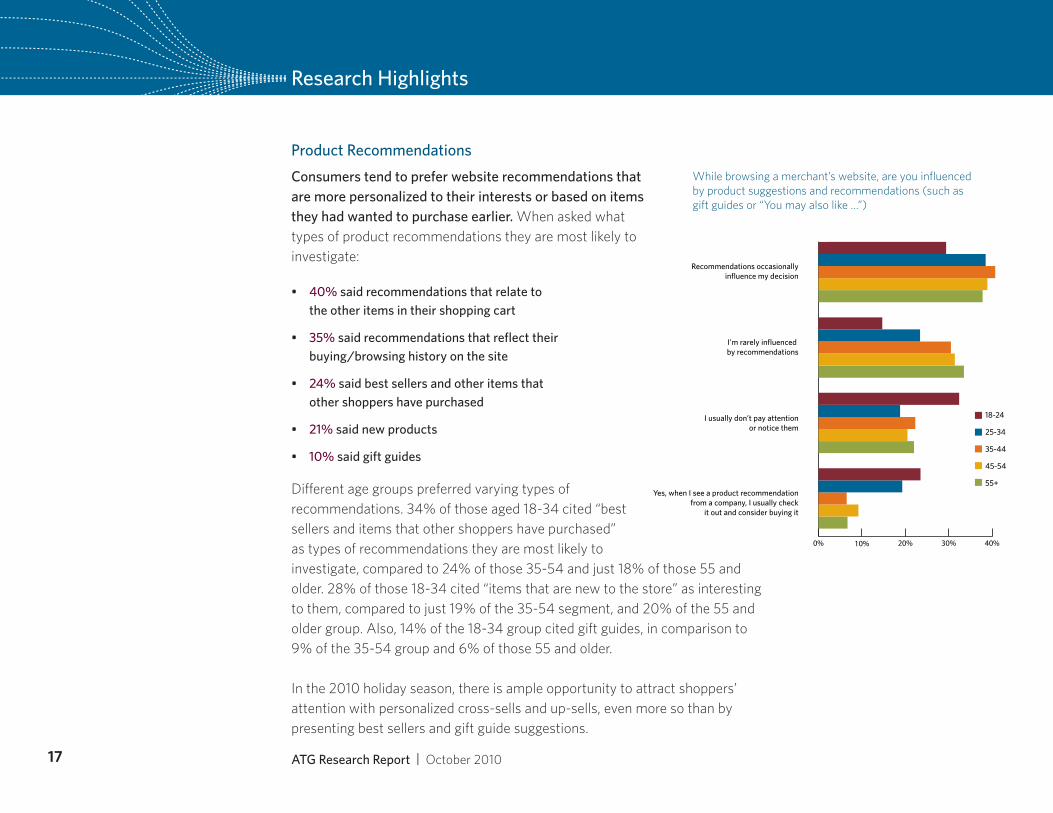
Product Recommendations
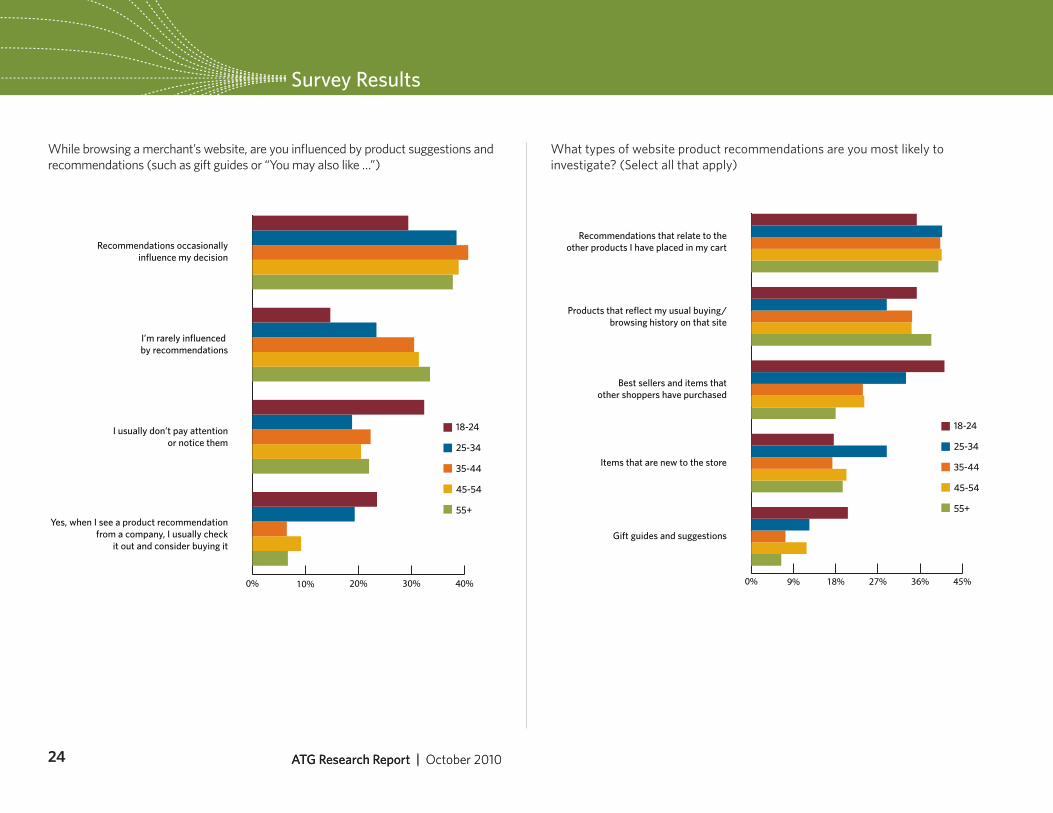
Consumers tend to prefer website recommendations that are more personalized to their interests or based on items they had wanted to purchase earlier. When asked what types of product recommendations they are most likely to investigate:
40%• said recommendations that relate to the other items in their shopping cart
35%• said recommendations that reflect their buying/browsing history on the site
24% • said best sellers and other items that other shoppers have purchased
21%• said new products
10%• said gift guides
Different age groups preferred varying types of recommendations. 34% of those aged 18-34 cited “best sellers and items that other shoppers have purchased” as types of recommendations they are most likely to investigate, compared to 24% of those 35-54 and just 18% of those 55 and older. 28% of those 18-34 cited “items that are new to the store” as interesting to them, compared to just 19% of the 35-54 segment, and 20% of the 55 and older group. Also, 14% of the 18-34 group cited gift guides, in comparison to 9% of the 35-54 group and 6% of those 55 and older.
In the 2010 holiday season, there is ample opportunity to attract shoppers’ attention with personalized cross-sells and up-sells, even more so than by presenting best sellers and gift guide suggestions.
0% 10% 20% 30% 40%
I usually don’t pay attentionor notice them
I’m rarely influenced by recommendations
Recommendations occasionallyinfluence my decision
Yes, when I see a product recommendationfrom a company, I usually check
it out and consider buying it
18-24
25-34
35-44
45-54
55+
While browsing a merchant’s website, are you influenced by product suggestions and recommendations (such as gift guides or “You may also like …”)
17 ATG Research Report | October 2010
When asked which channels shoppers plan
to use the most to do holiday shopping this
year, more respondents cited the web than stores.
Research Highlights
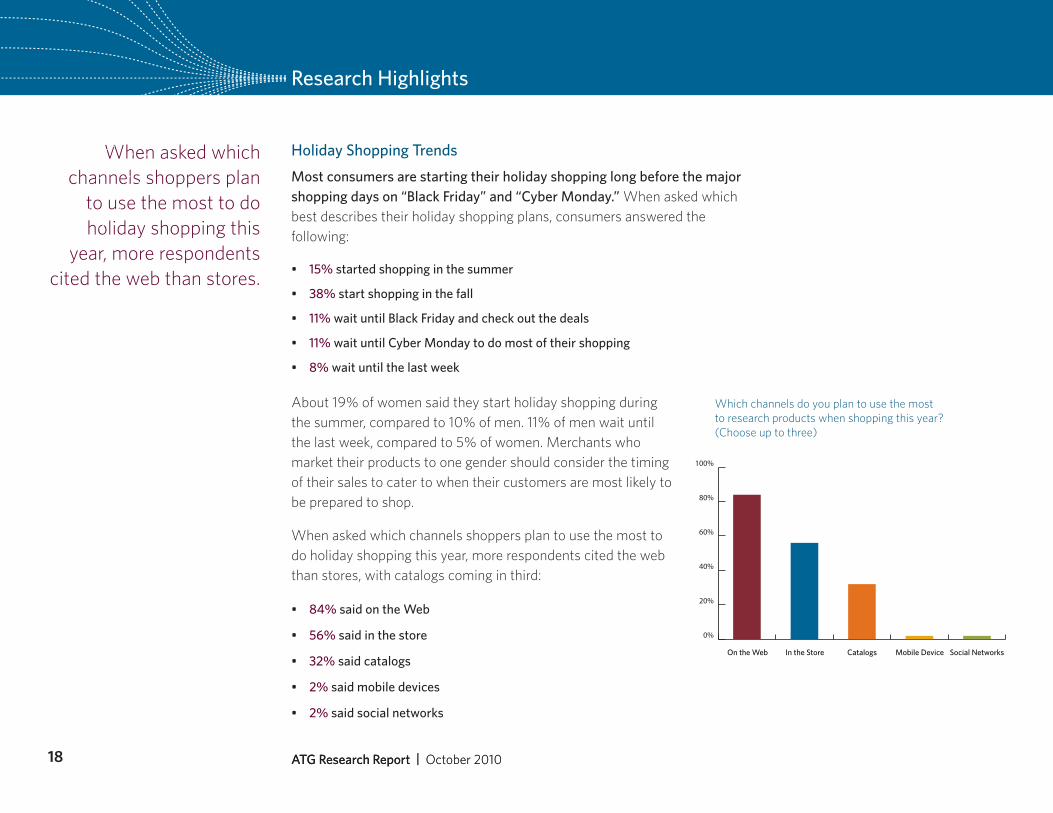
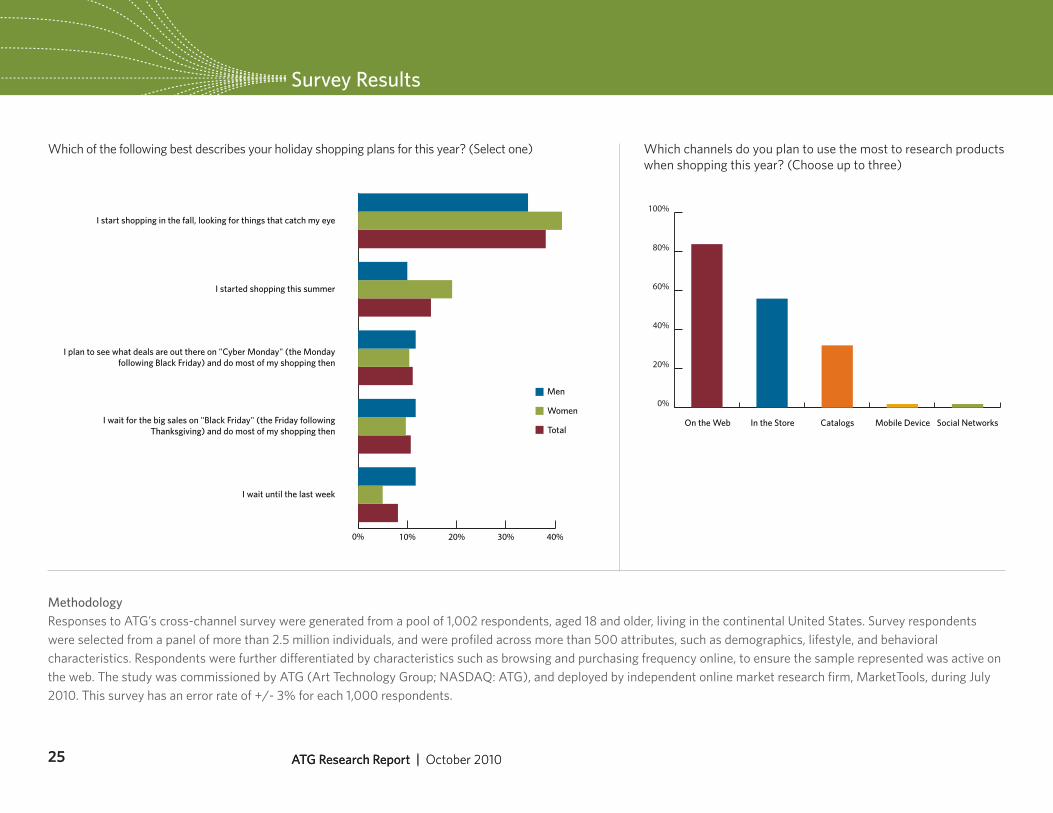
Holiday Shopping Trends
Most consumers are starting their holiday shopping long before the major shopping days on “Black Friday” and “Cyber Monday.” When asked which best describes their holiday shopping plans, consumers answered the following:
15%• started shopping in the summer
38%• start shopping in the fall
11%• wait until Black Friday and check out the deals
11%• wait until Cyber Monday to do most of their shopping
8%• wait until the last week
About 19% of women said they start holiday shopping during the summer, compared to 10% of men. 11% of men wait until the last week, compared to 5% of women. Merchants who market their products to one gender should consider the timing of their sales to cater to when their customers are most likely to be prepared to shop.
When asked which channels shoppers plan to use the most to do holiday shopping this year, more respondents cited the web than stores, with catalogs coming in third:
84%• said on the Web
56%• said in the store
32%• said catalogs
2%• said mobile devices
2% • said social networks
ATG Research Report | October 201018 ATG Research Report | October 2010
0%
20%
40%
60%
80%
100%
On the Web In the Store Catalogs Mobile Device Social Networks
Which channels do you plan to use the most to research products when shopping this year? (Choose up to three)
0% 10% 20% 30% 40% 50%
36%
45%
29%
26%
25%
22%
19%
16%
16%
5%
4%
3%
Offer the option to click a button to contact a customer service agent via call or instant message
Provide better search capabilities
Provide more detailed product information
Enhance the design and navigation
Make it easier to figure out how to contact the store
Improve checkout process
Give me more offers that are personalizedto my interests and needs
I don’t feel like most online stores need to be improved
Provide more relevant FAQs
Create a better site for access via a mobile device
Other, please specify
Provide more ways to interact through social networks like Facebook or ratings by others
0% 10% 20% 30% 40% 50% 60% 70%
36%
69%
32%
24%
25%
23%
13%
12%
11%
3%
I often add multiple items to my shopping cart to figure outtotal costs before deciding which ones to keep/purchase
I found out the shipping charges were more than what I had expected when I had added the item to the shopping cart
The checkout process was confusing or took too many steps
I wanted to save my cart for a future visit so Ididn’t have to look for the same items again
This doesn’t apply to me
I got distracted or moved onto another activity and forgot about the purchase
I wanted to contact a person at the company toask a question about the product or shipping
Other, please specify
Survey Results
19 ATG Research Report | October 2010
In general, how do you think online stores could be improved (Choose top three) Tell us the reasons why you have opted not to purchase something after adding it to an online shopping cart (Select up to three)
0% 6% 12% 18% 24% 30% 36% 42% 48% 54% 60%
Word of mouth/recommendations from family and friends
Emails from merchants
Search engines (Google, Yahoo!, Bing)
Online marketplace (i.e. Amazon Marketplace or eBay)
Print ads (magazines, newspapers)
Online ads
TV ads
Catalogs
18-24
25-34
35-44
45-54
55+
Recommendations (“You might also like …”) on websites
Direct mail
In-store displays or signs
Price comparison service (i.e. Shopzilla)
Links or information on social networking sites (e.g. Facebook, Twitter, etc.)
Radio ads
Product placements or mentions on TV or movies
Survey Results
20 ATG Research Report | October 2010
What are the most common ways you discover a new online product? (Select up to five)
0%
20%
40%
60%
80%
100%
Very important Important Somewhatimportant
Not importantat all
18-24
25-34
35-44
45-54
55+
0% 8% 16% 24% 32% 40%
I interact with my friends about productsI like or plan to buy using Facebook
I look for coupons or special offers on Facebook
I “like” merchants on Facebook
I interact with other consumers that like or use the same products or services on Facebook
I post messages to a merchant’s Facebookfan page about products
I post images or reviews of products on Facebook
I use Facebook for my customer service needs
18-24
25-34
35-44
45-54
55+
Survey ResultsSurvey Results
21 ATG Research Report | October 2010
Chart: Detail of the 25% who interact with merchants on Facebook
How important is it to you that online merchants provide an opportunity to engage directly through social networks?
How are you interacting with merchants on Facebook? (Select all that apply)
Never: 63%
Every day: 5%
A few times a week: 11%
A few times a month: 5%
Once a month: 4%
Rarely: 12%
0%
2%
4%
6%
8%
10%
12%
Every day A few timesa week
Once a month A few timesa month
Rarely
Male
Female
0%
2%
4%
6%
8%
10%
12%
Every day A few timesa week
Once a month A few timesa month
Rarely
18-24
25-34
35-44
45-54
55+
Charts: Detail of the 37% who complete purchase transactions directly on their mobile devices
Survey Results
22 ATG Research Report | October 2010
How often do you use your mobile device to research or browse products or services?
How often do you complete a purchase transaction directly on your mobile device?
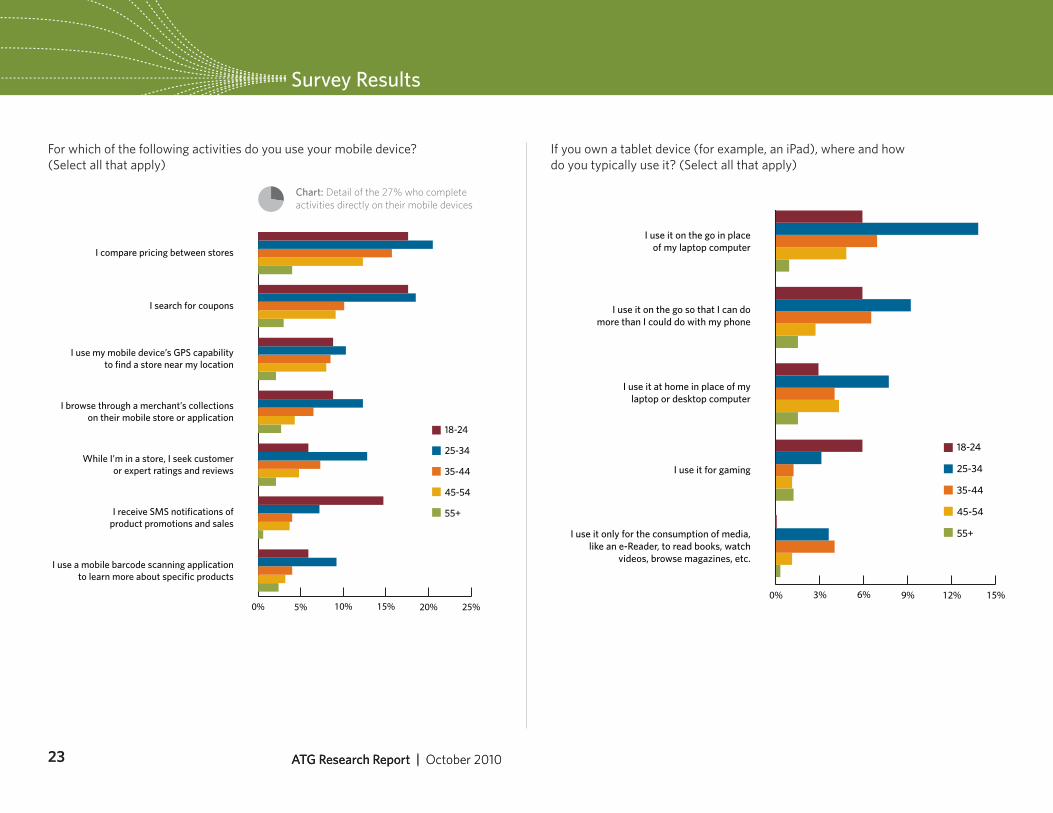
Chart: Detail of the 27% who complete activities directly on their mobile devices
Survey ResultsSurvey Results
ATG Research Report | October 201023 ATG Research Report | October 2010
For which of the following activities do you use your mobile device? (Select all that apply)
0% 5% 10% 15% 20% 25%
I use my mobile device’s GPS capabilityto find a store near my location
I search for coupons
I compare pricing between stores
I browse through a merchant’s collectionson their mobile store or application
While I’m in a store, I seek customeror expert ratings and reviews
I receive SMS notifications ofproduct promotions and sales
I use a mobile barcode scanning applicationto learn more about specific products
18-24
25-34
35-44
45-54
55+
If you own a tablet device (for example, an iPad), where and how do you typically use it? (Select all that apply)
0% 3% 6% 9% 12% 15%
I use it at home in place of mylaptop or desktop computer
I use it on the go so that I can domore than I could do with my phone
I use it on the go in placeof my laptop computer
I use it for gaming
I use it only for the consumption of media,like an e-Reader, to read books, watch
videos, browse magazines, etc.
18-24
25-34
35-44
45-54
55+
Survey ResultsSurvey Results
ATG Research Report | October 201024 ATG Research Report | October 2010
0% 10% 20% 30% 40%
I usually don’t pay attentionor notice them
I’m rarely influenced by recommendations
Recommendations occasionallyinfluence my decision
Yes, when I see a product recommendationfrom a company, I usually check
it out and consider buying it
18-24
25-34
35-44
45-54
55+
0% 9% 18% 27% 36% 45%
Best sellers and items thatother shoppers have purchased
Products that reflect my usual buying/browsing history on that site
Recommendations that relate to theother products I have placed in my cart
Items that are new to the store
Gift guides and suggestions
18-24
25-34
35-44
45-54
55+
What types of website product recommendations are you most likely to investigate? (Select all that apply)
While browsing a merchant’s website, are you influenced by product suggestions and recommendations (such as gift guides or “You may also like …”)
0%
20%
40%
60%
80%
100%
On the Web In the Store Catalogs Mobile Device Social Networks
MethodologyResponses to ATG’s cross-channel survey were generated from a pool of 1,002 respondents, aged 18 and older, living in the continental United States. Survey respondents were selected from a panel of more than 2.5 million individuals, and were profiled across more than 500 attributes, such as demographics, lifestyle, and behavioral characteristics. Respondents were further differentiated by characteristics such as browsing and purchasing frequency online, to ensure the sample represented was active on the web. The study was commissioned by ATG (Art Technology Group; NASDAQ: ATG), and deployed by independent online market research firm, MarketTools, during July 2010. This survey has an error rate of +/- 3% for each 1,000 respondents.
Survey ResultsSurvey Results
ATG Research Report | October 201025 ATG Research Report | October 2010
0% 10% 20% 30% 40%
I wait for the big sales on "Black Friday" (the Friday followingThanksgiving) and do most of my shopping then
I plan to see what deals are out there on "Cyber Monday" (the Mondayfollowing Black Friday) and do most of my shopping then
I started shopping this summer
I start shopping in the fall, looking for things that catch my eye
I wait until the last week
Men
Women
Total
Which channels do you plan to use the most to research products when shopping this year? (Choose up to three)
Which of the following best describes your holiday shopping plans for this year? (Select one)

Worldwide HeadquartersArt Technology Group, Inc. One Main Street Cambridge, MA 021421-800-RING-ATGwww.atg.com
European HeadquartersArt Technology Group (Europe), Ltd.Apex Plaza, Forbury Road Reading RG1 1AX UK +44 (0) 118 956 5000www.atg.com
© 2010 Art Technology Group, Inc.
ATG, Art Technology Group and the ATG logo are
registered trademarks of Art Technology Group.
All other trademarks are the property of their
respective holders. AT10R08