Embed Size (px)
Citation preview

Network Innovation Competition 2017 WPD/EN/NIC/04 Non‐Confidential

Page 2 of 100
Project Code/Version Number: WPD/EN/NIC/04
1. Project Summary
1.1. Project Title
Holistic Active and Reactive Project (HARP)
1.2. Project Explanation
We will test a device known as a Unified Power Flow Controller that can automatically re-direct power flow to manage peaks that constrain the capacity of networks. It will release capacity to accommodate future growth in embedded, and particularly intermittent, generation and electricity demand from new low carbon technology.
1.3. Funding licensee:
Western Power Distribution (East Midlands) plc. on behalf of Mott MacDonald Ltd.
1.4. Project description:
1.4.1. The Problem As ever more embedded generation is connected to the distribution network, controlling power flows on the 132kV or 66kV “backbone” of the network to meet demand and generation peaks becomes more challenging. This backbone will also need to meet the increased peak demands of electric vehicles and heat pumps. These demand and generation peaks manifest as difficult to predict short-term constraints on cables or overhead lines, limiting the available capacity. Laying new cables or upgrading overhead lines to increase capacity to meet transitory peak demand is time-consuming, costly and under-utilised at times outside the peaks. 1.4.2. The Method HARP will install a “Unified Power Flow Controller (UPFC)” onto this backbone. This device is highly flexible, smoothing fluctuations in power flows and re-directing power flows away from constrained parts of the network. The project will:
• Conduct modelling to finalise equipment specifications • Procure and install the device • Record the before and after state of the network • Conduct trials to control the power flows on the network • Demonstrate additional services which the device can
offer to the System Operator (National Grid) • Develop specifications and procedures for future
‘business-as-usual’ deployment.

Page 3 of 100
1.4.3. The Solution The UPFC uses similar technology to that used in High Voltage Direct Current networks. It can:
• Control power flows across circuits • Reduce intermittent peaks on the network • Prevent pinch points arising at the interface with the
transmission network • Respond near-instantaneously to changing system
requirements. 1.4.4. The Benefits By controlling power the UPFC will:
• Maintain network loading within existing limits, avoiding costly and intrusive upgrades
• Release capacity for embedded generators • Support National Grid to maintain a stable system
voltage. By avoiding/deferring reinforcement, the project is expected to break-even by 2031, accumulate £34.4m of net benefits by 2040, and facilitate a reduction of at least 118,000 tonnes of CO2 equivalent.
1.5. Funding
1.5.1 NIC Funding Request (£k)
14, 445 1.5.2 Network Licensee Compulsory Contribution (£k)
1,624
1.5.3 Network Licensee Extra Contribution (£k)
- 1.5.4 External Funding – excluding from NICs (£k):
134
1.5.5. Total Project Costs (£k)
16,379
1.6. List of Project Partners, External Funders and Project Supporters (and value of contribution)
Project Partners: Mott MacDonald
1.7 Timescale
1.7.1. Project Start Date
02/01/2018 1.7.2. Project End Date
30/06/2022

Page 4 of 100
1.8. Project Manager Contact Details
1.8.1. Contact Name & Job Title
Martin Wilcox (Project Director)
1.8.2. Email & Telephone Number
[email protected] 01273 365338
1.8.3. Contact Address
Mott MacDonald Victory House Trafalgar Place Brighton BN1 4FY
1.9: Cross Sector Projects (only complete this section if your project is a Cross Sector Project, i.e. involves both the Gas and Electricity NICs).
1.9.1. Funding requested the from the [Gas/Electricity] NIC (£k, please state which other competition)
N/A
1.9.2. Please confirm whether or not this [Gas/Electricity] NIC Project could proceed in the absence of funding being awarded for the other Project.
N/A
1.10 Technology Readiness Level (TRL)
1.10.1. TRL at Project Start Date
7 1.10.2. TRL at Project End Date
9
Page 5 of 100
Section 2: Project Description
2.1. Aims and objectives
The aim of the HARP project is to prove the technical and business case viability of deploying a Universal Power Flow Controller device on the sub-transmission parts, the backbone, of the electricity distribution networks.
The purpose of the device is to more easily overcome some of the short term capacity constraints on this network, rather than using the traditional solution of cable and overhead line upgrades. A faster and lower cost upgrade allows the network to support the continued and increased installation of distributed low carbon electricity generation. It will also provide a means to prepare the sub-transmission networks to carry the increased peak demands of electric vehicles and heat pumps.
Objectives: The objectives of the project are to:
a) Model the power flows and demand constraints on typical 132kV and 66kV distribution networks
b) Procure and deploy a Universal Power Flow Controller device onto the GB distribution network
c) Conduct trials to increase the effective capacity at the trial location to mitigate the short-term temperature constraints on cables and overhead lines by diverting power flows through alternative circuits
d) Conduct trials to demonstrate that the UPFC can provide additional services and help the System Operator to reduce voltage fluctuations at the point where the transmission network supplies the distribution network, both short-term fluctuations and longer duration voltage dips;
e) Demonstrate the viability of the UPFC business case to provide a lower cost option to traditional network upgrade solutions.
The Problem(s) which needs to be resolved The transmission networks were originally designed to transport electricity generated from coal-fired power plants in the Midlands and North of England to customers across the country. The power flows on the transmission networks interfaced with distribution networks at grid supply points which continued the transportation of power down the chain to end customers.
These networks are now performing a significantly different role, allowing power generation connections across the distribution network, leading to new power flows across both the distribution and transmission networks. These networks will also need to accommodate the growth in energy usage to decarbonise transport through increased use of electric vehicles.
The backbone of the distribution networks is a network layer which operates directly underneath the 275kV and 400kV transmission networks. This “sub-transmission” network operates at 132kV or 66kV and is owned and operated by the 12 distribution network licensees in England & Wales, and by the two Scottish transmission companies in Scotland.

Page 6 of 100
This backbone has ultimate responsibility to support all downstream demand, including any new demand increases created from, for instance, growth in electric vehicles; and to carry any surplus renewable generation to where it can be consumed.
It is having to do this in increasingly changing circumstances: Western Power Distribution’s (WPD’s) network, for example, currently serves 3.4GW of solar generation, 1.0GW of onshore wind, and has seen 1.2GW of battery storage accept a connection offer on its networks. Over a short period of time, this has grown from zero, on a network previously designed to meet customer demand consumption of 14.1GW in the winter (and 5GW in the summer).
The minute-by-minute flows on the sub-transmission network can be peaky and unpredictable, affected by the weather and capricious effects of solar and wind output. This can lead to constraints on the network which may be limited duration or only exist for short periods of the year.
The real need of this sub-transmission network is to be able to re-direct power, and deliver it to where it is needed. Historically this has been a simple passive role, but the location of distributed generation and increases in the demand may be on different parts of the network. As a result, new generation which is added may overload certain parts of the sub-transmission network whilst other parts are under-utilised; and new demand is pushing the network to its limits in some locations.
The conventional approach of upgrading existing overhead lines, building entirely new overhead lines, or installing new underground cables is both costly and inflexible. These conventional approaches involve replacing or upgrading routes which may be in excess of 20km from point-to-point, and require consent and support from landowners in the case of overhead lines. The most cost-effective routes for new cables will follow existing roadways, but will, as a result, cause extended periods of roadworks and disruption for the local community. Conventional approaches provide more capacity, but do not allow more control to divert power. These increases come in large increments which in the short to medium term may be under-utilised. To give an example: one of our case studies shows that adding a bigger conductor provides 180MW (which may be under-utilised) compared with 60MW of flexible capacity which we are more confident of being utilised. Furthermore, conventional reinforcements are locked into one part of the network; we aim to make the UPFC re-locatable so that it could be re-deployed to an alternative site as requirements change.
These problems are illustrated in three case studies which we refer to throughout the document and which we use to develop our business case in Section 3.
Case study 1 has come about through increasing demand. It shows the inflexibility of conventional reinforcement, since having carried out an recent upgrade by installing an underground cable in 2014, another further underground cable will soon be required at a cost of £11.6m. Meanwhile, other parts of the network are under-utilised.
Case study 2 has come about through increasing embedded generation connecting to the distribution network. In areas where there is more generation than customers can consume, and with no means to re-route the power, it simply feeds onto the sub-transmission “backbone” and can overload parts of it. In some instances,

Page 7 of 100
upgrading the network to cope with this overspill by conventional means would cost as much as £35m.
Case study 3 has also come about through increasing embedded generation. In this case, the impact on the distribution networks is similar to Case Study 1. An overhead line upgrade or cable upgrade is required. But case study 3 illustrates instances in which this simply moves the constraint on to another part of the network, and the overspill of power flow can lead to constraints at the transmission network interface. The additional works required on the transmission network are estimated to cost £15.6m.
Where network constraints (as per case study 2 and 3) exist embedded generators have the opportunity to look for alternative, better locations with lower costs of connection, but this opportunity is gradually becoming limited. As we show in Section 4(a), significant parts of the country are struggling to provide new capacity to embedded generators. The Committee on Climate Change, however, emphasise the vital role which new, additional, solar and onshore wind plants connected to the distribution network will have to play in decarbonisation of energy production, replacing conventional fossil fuel generating plant as it retires1.
A cheaper, more flexible alternative to conventional reinforcement is required to re-route power, which can continue to adapt during its lifetime to changing needs on the sub-transmission network. It can also be used to compliment traditional reinforcement if needed at a later date.
The Method(s) being trialled to solve the Problem A Unified Power Flow Controller (UPFC) is a device which can flexibly route power around a network, with the ability to adapt to changing circumstances during its lifetime.
We show in Section 3.2 that around 40-50% of the sub-transmission networks are wired similar to “ring roads”. By connecting the UPFC at one point on this ring road, it acts to divert traffic (or in this case, power) round the side of the ring road which is less heavily congested. In this way, it can remove the need to provide additional capacity in overhead lines and cables which would otherwise need to be upgraded.
The UPFC can change this routing at different times of the day; during different seasons; and for differing maintenance and outage situations. It is also less likely to move constraints to different parts of the network when reinforcing one part of the network and then finding that the next part of the network becomes congested. Even when installed at one specific location on the ring road, the UPFC can relieve congestion more broadly around the ring road by forcing some of the power flow around the alternative route.
The UPFC is also capable and ready to provide other services which may increasingly be required in future from distribution networks or their customers – specifically, services to provide reactive power to support the system voltage particularly during the night, and to assist with short-duration voltage disturbances. Market arrangements to provide these services are being established by other projects previously awarded by the Expert
1 “Power Sector Scenarios for the Fifth Carbon Budget”, Committee on Climate Change, October 2015, Figure 4.2

Page 8 of 100
Panel, such as Phoenix (System security and Synchronous Compensators) and Transmission and Distribution Interface (TDI 2.0). This project will concentrate on demonstrating the technical capability of the UPFC to provide these services.
The Development or Demonstration being undertaken The project will:
Finalise selection of the trial site, for which two candidate locations have been identified
Finalise the specification for the UPFC to meet the needs of the trial site, and write or modify WPD’s operational policy and guidance as required
Issue an ITT to suppliers with whom WPD has already engaged through a Request for Information process (and to any other manufactures able to pre-qualify early in 2018) and appoint a manufacturer
Complete detailed design of the UPFC
Manufacture the UPFC
Conduct factory testing of the UPFC against GB network requirements
Install and commission of the UPFC on the WPD network
Carry out trials and associated simulations to demonstrate and confirm that the device delivers the functionality required to address the project objectives
Create policy and guidance documents on the most effective use and configuration of the UPFC
Disseminate the learning from the project.
The Solution(s) which will be enabled by solving the Problem. We have carried out bottom-up analysis in Section 3.2 of the backbone network throughout England & Wales. WPD has separately worked closely with National Grid and renewables consultancy Regen to develop future plans for its backbone networks in three of its four regions and to elicit stakeholder support2,3,4. Both exercises confirmed that significant works will be required on the sub-transmission network by 2030.
The Project will demonstrate the technical capability and business case for the UPFC to direct power flow to areas of demand, to mitigate the short-term temperature constraints on cables and overhead lines by diverting power flows through alternative circuits, and to provide additional services and help to the System Operator to reduce voltage fluctuations.
Once rolled out at the scale we estimate in Section 3, this Method will deliver the following outcomes:
2 “Shaping Subtransmission to 2030 – South West - Report July 2016”, Western Power Distribution, July 2016, available from www.westernpower.co.uk 3 “Shaping Subtransmission to 2030 – South Wales - Report January 2017”, Western Power Distribution, January 2017 available from www.westernpower.co.uk 4 “Shaping Subtransmission to 2030 – East Midlands - Report July 2017”, Western Power Distribution, July 2017 available from www.westernpower.co.uk

Page 9 of 100
· Provide new capacity for 23 areas of the country currently struggling toaccommodate new embedded generation and accommodate increasing demand
· Avoid costly, lengthy and intrusive upgrade works by concentrating constructionat 23 self-contained substation sites
· Avoid upgrades to the assets used to interface the 275kV and 400kV networks tothe backbone network (at 11 of the 23 areas of the country)
· Provide capacity for an additional 852MW of embedded generation to connect tothe distribution networks and contribute to replacing retiring power plants,generating a carbon saving of at least 118,000 tonnes of CO2 equivalent.
· Provide a new option for National Grid to procure support services to assist it tooperate the network in each of these regions.
2.2. Technical description of Project
The configuration of sub-transmission networks in Great Britain
Various network topologies are used in the sub-transmission networks in Great Britain;they can be operated in rings (also known as “meshed”) or in a radial configuration. Aradial type network is the simplest topology. It involves a series of networks and sub-networks that begin with a power source and distribute electricity through networksacross progressively lower voltages. An example of the radial topology is shown on theleft of Figure 2.1. A meshed topology is an alternative scheme where substations areinterconnected forming rings (and/or additional interconnections) where there can bevarious paths for power flow. An example of a meshed topology is shown below on theright of Figure 2.1.
Figure 2.1: Radial and meshed topologies
A full summary of network types can be found in Appendix 10.10. Radial networks aresimple but can be inflexible. In radial networks there are no options to change thenetwork configuration if faults occur, which is why they are built with two parallel cablesor overhead lines to provide back-up if one should experience a fault. Meshed topologieshave some advantages over radial topologies as there are alternative paths for power toflow. Meshed topologies create the possibility that surplus embedded generation may beconsumed at another substation further around the ring. They also create the possibilitythat additional demand shares out in way which avoids upgrades. But, as currentlybuilt, the sub-transmission networks have no ability to re-direct power and
Key: 132kV 33kV
X
132kV overhead lines orcables
Distributed generation (DG)X
Distributed generation (DG)Consumer Load
Transformers at theinterface with the 275kV or
400kV network275kV or 400kV
Sub-transmissionRing serving twodistribution substations

Page 10 of 100
make sure that this happens. Devices such as the UPFC allow us to ‘tame’ meshed networks to better utilise their flexibility.
A UPFC installation in a meshed network controls the power flow on the rings and reduces fluctuations in power flows.
How a UPFC works
A UPFC is able to “push and pull” power around a ring. It does this by tapping off a small amount of power from the network. It then re-generates this power into a control voltage which can be used to influence power flowing along the line. UPFCs have been installed in the US, Korea and China but have not been demonstrated in Europe. Table 2.1 compares the capabilities of a UPFC to other technical and commercial solutions:
Table 2.1: Table demonstrating the features of UPFCs and other solutions
UPFCs are able to provide both fine resolution and fast-acting power control when compared with a quadrature booster. In a normal situation where a 132kV or 66kV ring network is fully intact with both sides of the ring operating, the speed of the solution is not material, and a quadrature booster can provide similar (although less fine resolution) control. However, once a network suffers an outage the speed of the UPFC can allow the ring to remain loaded, and prevent outages to generation, to a greater extent than a quadrature booster. This is discussed in more detail in Appendix 10.9.
A UPFC is built from two Voltage Source Converters (VSCs) connected in shunt and in series electrical configurations. The shunt section is able to provide reactive power compensation. This allows MW and MVar flow down the series line to be independently controlled, and allows dedicated reactive power support to be provided at the 132kV or 66kV busbar. Since this busbar is connected via Super-Grid Transformers to National Grid’s 275kV or 400kV network, it is an effective means of supporting transmission.
Function Capabilities with respect to this function
UPFC Quad
Booster
Line/Cable STATCOM Commercial
(ANM or
DSR)
Real power flow
control
(Fast)
(Slow)
‐
Reactive Power
Compensation - ‐ To be
trialled
Real and reactive
power control
(Independent
control)
‐ ‐ ‐
Damping of voltage
fluctuations ‐ ‐ To be
trialled
No build solution ‐ ‐ ‐ ‐

Page 11 of 100
The first potential trial site: the circuit between Evesham and Feckenham
Using the process described in Appendix 10.10, we have currently identified two candidate sites for the trial. Maps and more detailed single line diagrams (SLDs) of the sites are provided in Appendices 10.2 and 10.3, and indicative layouts of the UPFC are included in Appendix 10.3. Both sites require an extension to the substation or a new substation; as such, details of land ownership are also included in Appendix 10.2.
The ring formed between Feckenham and Evesham substation is the basis for our case study 1. It is a site which exhibits a meshed topology, as shown in Figure 2.2.
Figure 2.2: UPFC location on the Feckenham network, with the separate rings highlighted
In 2015 the 66kV network from Feckenham was re-configured and reinforced. Permissions for an overhead line route were difficult to obtain. As such, a 21km cable route was installed at a cost of £11.6m. Installation of the new cable circuit ensures the network is compliant with security-of-supply standards. The capacity of the network is presently limited due to poor power-sharing between the overhead circuits and cable circuit. This is restricting connection of further generation, and will ultimately limit further demand connections unless a further cable is installed at similar cost.
The second potential trial site: the feeder between Stamford and Peterborough North between WPD and UKPN
Figure 2.3 shows the grid supply point Walpole. Walpole is a shared user site between WPD (East Midlands) and Eastern Power Networks. It represents Case Study 2. If additional generation in excess of 25MW seeks to connect to the network at Stamford it creates “spill” across the boundary with UKPN and onto the Peterborough North busbars. The cost of upgrading UKPN’s network to cope with this additional “spill” is prohibitive, of the order of £35m, since its network is constrained.

Page 12 of 100
Figure 2.3: UPFC location on the Walpole network
Operating regime for the UPFC
The UPFC can provide several functions, some simultaneously, by use of the control system which governs its operation. An example operating regime is shown in the table below. This table forms the basis for our break-even analysis in Section 3, where we explore the benefit of income from services to National Grid. At today’s prices reported in National Grid’s market report, the UPFC might expect to receive £3/MVar/hour. We have validated this with Graham Stein, responsible for network capability at National Grid, while preparing this bid. A letter of support is attached in Appendix 10.11.
Time of day 0000 – 0730 0730 – 1200 1200 – 1800 1800 – 2359 Season Winter Assist National
Grid Reduce energy lost to heat
Protect voltage disturbances
Control power supplying demand
Reduce energy lost to heat
Protect voltage disturbances
Reduce energy lost to heat
Autumn and Spring
Assist National Grid
Reduce energy lost to heat
Protect voltage disturbances
Control of power flow from solar PV
Reduce energy lost to heat
Protect voltage disturbances
Reduce energy lost to heat
Summer Assist National Grid
Reduce energy lost to heat
Protect voltage disturbances
Control of active power flow from solar
Optimise power factor
Protect voltage disturbances
Reduce energy lost to heat
Table 2.2: Potential UPFC operating regime

Page 13 of 100
The UPFC “punches above its weight”
A steady-state model of the UPFC has been developed by Mott MacDonald and integrated into a model of various WPD sub-transmission networks. When utilised in a meshed network, the UPFC can have significant impact on the power flow in the line where it is installed. Whilst the effects are specific to each site, the UPFC is frequently able to divert and control power greater than the proposed rating of the converters in the device itself (which we have sized at 25 MVA each).
As such, we can be confident that we have sized the device adequately, since the UPFC “punches above its weight” and has a greater impact than might be expected.
2.3. Description of design of trials
The trials will be investigating the operation of the UPFC and how effective it is. We intend to model the UPFC, measure the problems on the network and then use the UPFC to mitigate these problems.
For a UPFC to benefit the distribution network, two elements require to be met. These are the correct topology and network constraints. We set out in detail in Appendix 10, section 10.6, how we have sifted and identified potential trial sites.
Trials will be conducted for up to two years to demonstrate the following:
Release capacity on overhead lines by managing real power flow, and control of reverse power flow seen by the upstream Super-Grid Transformers by managing real power flow on rings which run between two GSPs;
Demonstrate increased generation capacity on overhead lines by managing reactive power
Demonstrate provision of reactive power to transmission network system
Investigate ability to control/dampen voltage disturbances
It is envisaged the trials will be conducted over various stages:
Tendering, pre-installation, installation testing and commissioning
Measurement phase
Validation phase
Roll-out and optimisation phase
The trials and methods are described below.
Tendering, pre-installation, installation testing and commissioning
Establish point of connection and develop detailed design, scope/schedule of works and UPFC equipment schedule and detailed bill of materials.
Install real-time measurement equipment at the incomer and feeders to enable data analysis of power flow, voltage, current, losses and power quality.
Develop detailed protection settings, logic, and secondary design to implement UPFC equipment.

Page 14 of 100
Complete initial power system studies implementing UPFC model and latest real-time measurement data and identify suitable operating points for UPFC. These will feed into the UPFC control device for installation.
Complete Factory Acceptance Tests (FAT) and Site Acceptance Tests (SAT).
Measurement phase
The measurement and validation phases will split into eight nominal trial windows, in which variations on the operating strategy in Table 2.2 are run.
Within the trial windows we will continue to take detailed real-time measurements and demonstrate the UPFC control of real power, reactive power management at GSP and damping abilities to network transient disturbances.
Vary the network configuration and monitor how the UPFC can control power flow in the event of outages to lines, supergrid transformers and other compensation equipment.
Complete the measurements for various network configurations at different times of day and during different seasons.
Complete the measurements with and without the UPFC in circuit to demonstrate the controlling abilities of the UPFC.
Validation phase
Based on the real-time measurements obtained during the trial windows, validate and verify the response within power system study software.
The measurements obtained will allow a detailed model of the UPFC to be developed which closely matches the real response of the system.
Once verified using the measured data, the control parameters can be fine-tuned to allow optimum control of the UPFC installation.
Roll-out and optimisation phase
Based on the learning developed from the trials identify other suitable sites to benefit from UPFC installation.
Develop learning materials for other DNOs explain where the UPFC has most benefits; its value over traditional solutions; and the quantification of benefits.
Write operational policy and guidance which can be adopted by other DNOs.
2.4. Changes since Initial Screening Process (ISP)
The project is now also considering a 66kV trial site. The ISP referenced only 132kV. Both voltages are part of the sub-transmission network and are functionally the same.
The cost of the project has been revised based upon a Request for Information (RFI) circulated to manufacturers, and bottom-up costs of civils, installation works and ancillary equipment required. We have increased our NIC Funding Request from £13.5m to £14.4m, in line with these revised, more accurate, estimates.

Page 15 of 100
Section 3: Project business case
The HARP project will demonstrate a solution which:
Is applicable to significant proportion of Great Britain’s sub-transmission distribution networks and 132kV transmission networks
Can be rolled out to, by our estimates, 23 sites across Great Britain between completion of the project in 2022 and 2040
Reaches break-even point with respect to its NIC Funding Request between 2025 and 2027
Is likely to be built off-site and delivered as building blocks in standard ISO shipping containers (as offered by one manufacturer in response to our RFI)
As a result, can deliver capacity to generators up to 2 years sooner.
Delivers substantial non-quantified benefits to the wider customer base by avoiding the disruption to landowners and roadworks associated with conventional overhead line and cable construction
Delivers additional non-quantified benefits to renewable generation customers by offering a degree of protection from voltage disturbances on the network.
The break-even point is accelerated towards the earlier end of this range if:
subsequent installations consistently earn reactive power income, or
cost reductions driven by the High Voltage Direct Current (HVDC) market exceed our expectations, or
if additional examples of extreme constraints costing £35m+ to solve through conventional means emerge.
3.1. Structure of this section
This section describes the method by which we have assessed the applicability of the Solution to the networks across England and Wales. We have not conducted an applicability analysis for Scotland. However, with a similar network configuration in the Scottish licence area and following initial engagement with Scottish and Southern Energy Networks, there are likely to be instances in Scotland where a UPFC could be deployed.
The section then explains three case studies on which we have based the business case. Appendix 10.09 explains our rationale for identifying the most efficient solution currently available to address these case studies.
The section then summarises the Solution costs, the treatment of “First of a Kind” costs and the potential for technology cost reduction. The section summarises the parameters used to calculate the financial benefits, capacity released and carbon savings provided in Appendix 10.1.
Finally, the section concludes by presenting the break-even point for the project, and the major influences on the break-even point. Where necessary, references are made to further details in Appendix 10.1.

Page 16 of 100
3.2. Replicability to Great Britain
Our assessment of applicability of the Solution was based on analysis of all 12 licence areas representing the sub-transmission distribution networks in England and Wales.
We carried out an initial review of WPD’s four licence areas (East Midlands, West Midlands, South Wales and the South West) in order to identify the number of sub-transmission networks which:
Have been built to distribute power radially to consumers from a Grid Supply Point (GSP) connected to the 275kV or 400kV transmission network;
Have been built as a ring starting from and ending at the same Grid Supply Point, supplying lower voltage networks and consumers along the ring;
Have been built as a ring starting from one Grid Supply Point and ending at a different Grid Supply Point at which the ring connects once again to the 275kV or 400kV transmission network.
On the networks which were built as a ring (“meshed”) we sought evidence of stress on the underlying distribution network or at the interface with the 275kV or 400kV transmission network. We gathered evidence on power generated by renewables flowing in the reverse direction through the underlying Bulk Supply Points (BSPs) which interface the 132kV and 33kV networks; high levels of renewable generation connections activity at the BSPs; and any references in assessments which National Grid carry out of their boundary to WPD’s East Midlands and West Midlands network, or in Statements of Work issued by National Grid to support WPD to fulfil connection requests. The process was formalised as a scoring methodology and is explained in detail in Appendix 10, section 10.6.
Nine GSPs in WPD’s licence areas show attributes of stress, including Feckenham from which a ring runs via Evesham out from Feckenham and back to Feckenham; and Walpole from which a ring runs via Stamford to UK Power Networks and back to Walpole.
DNO Location Radial Meshed to same GSP*
Meshed between GSPs*
Exhibiting Stress
Electricity North West - 11 6 7 -
Northern Power Grid Northeast 6 3 Yorkshire 17 5 2
East 15 11 10 5
UK Power Networks London 11 8 9 - South East 8 5 7 -
Scottish and Southern SSE South 14 5 5 5 SP Energy Network Manweb 7 7 -
WPD
West Midlands 6 8 7 2 East Midlands 10 4 13 1 South Wales 4 4 8 2 South West 2 2 7 4
Total 111 68 73 21 * GSPs may appear in both lists, having both types of ring present at the same GSP
Table 3.1: Summary of meshing on UK Grid Supply Points

Page 17 of 100
We then carried out a qualitative, not scored, assessment of stress on several other licence areas. We recognised subsequent to this initial analysis that two sites in the South West WPD licence area were counted twice, and reduced the total in Table 3-1 to 21 sites. Given that we have not analysed potential in Scotland at this stage, we have assumed for the purposes of the cost-benefit analysis a total potential of 23 sites.
3.3 Case studies used to assess costs and benefits
We have developed the business case based on three case studies.
Case study 1
The first case is representative of the situation at Evesham. The situation at Evesham is driven by the need to provide sufficient capacity for demand customers, but in the process creates additional capacity to accommodate new renewable generation.
The 66kV overhead line ring from Feckenham has had to be re-configured and reinforced to continue to meet the security of supply requirements of Energy Network Association Engineering Recommendation P2/6. Permissions for an overhead line route were difficult to obtain. As such, a 21km cable route was installed in 2014 at a cost of £10.75m, equivalent to £11.6m in 2018 prices. Under certain outage situations, even this new circuit risks being overloaded in the near future at times of maximum demand due to poor power-sharing between the overhead circuits and cable circuit. Table 3-2 illustrates the impact of poor power-sharing. An additional 27 MVA of load will push the rating of the Feckenham-EveshamA cable circuit over its rating.
Location From Feckenham HAYFTEE FeckenhamT Feckenham Location To EveshamA EveshamB HAYFTEE FeckenhamT
Rating (IPSA) (MVA) 104.9 91 91 91
No
UPF
C
MVA 104.06 46.54 47.53 48.56
% Rating 99.2 51.1 52.2 53.4 Poor Sharing
UPF
C MVA 74.23 78.62 81.56 82.59
% Rating 70.8 86.4 89.6 90.8 Even Sharing
Table 3.2: Effectiveness of the UPFC at Evesham
The conventional solution identified by WPD would be to install a further 66kV cable, along the same route. This would create capacity for both demand customers (and capacity to accommodate power generated by renewables) of 68MW. Recently a 20MVA battery application was accepted which has reduced the remaining capacity to 7MVA.
Installed in series with the existing cable route, the UPFC is able to resolve the poor power sharing highlighted above, and to create 40MW of capacity for renewables to connect to Evesham substation and its subsidiary substations.
Case study 2
The second case represents the situation at Stamford. Stamford is one of WPD’s substations on a ring which runs from Walpole GSP and which also serves UK Power

Page 18 of 100
Networks’ (UKPN) Peterborough North substation before returning to Walpole GSP. Additional generation in excess of 25MW at Stamford creates “spill” across the boundary with UKPN and onto the Peterborough North substation. The cost of upgrading UKPN’s network to cope with this additional “spill” is prohibitive, of the order of £35m, since its network is constrained. The solutions considered by UKPN are shown below (dashed lines). On the left, an additional overhead line circuit would be built with a length of 33-37km depending on route chosen; and on the right, the ring would terminate at a new GSP which would need to be constructed by the transmission operator.
Figure 3.1: UKPN’s conventional reinforcement solutions
The role of the UPFC is to act as a throttle to prevent power spill on to UKPN’s constrained network. By steering the power generated by renewables, it is able to create 60MW of capacity for new renewable connections at Stamford or slightly less capacity (50MW, 40MW, and 27MW respectively) at each of the three neighbouring WPD substations on the ring between Walpole and Stamford.
Case study 3
The third case represents a ring from one GSP to another GSP. Based on our scored analysis of WPD’s networks, and our qualitative analysis of the other licence areas, some GSPs exhibit not only constraints on capacity of overhead lines, but also significant levels of power flowing in the “reverse” direction from the distribution network to the transmission network. In this case, the conventional solution is to upgrade the overhead line route as well as to install an additional Super-Grid Transformer (SGT). The capacity generated is likely to be limited by the overhead line and not the new SGT. As such, we have modelled this at the same rating as the cable circuit modelled in Case study 1.
Figure 3.2: Network configuration between GSPs
Key: 132kV 33kV
X X
Key: 132kV 33kV
X

Page 19 of 100
Summary
The apportionment of the different cases used in the business case are shown in the table below before discounting and the effect of price reductions driven by the wider market for similar technology. Section 5.2 demonstrated that there were roughly equal numbers of rings which run out from and back to the same GSP (Case study 1 and Case study 2) as rings which run from one GSP to another (Case study 3). We conservatively include only one example of an “extreme” constraint represented by Case study 2.
Case Study 1 2 3 Instances 11 1 11 23 Capacity released by Base Case (MW) 68 180 68
Capacity released by the UPFC (MW) 32 60 40 Conventional cost (2018 prices) £11.6m £35m £15.6m Scaled up conventional cost (2018 prices) £127.6m £35m £171.6m £334m UPFC unit cost (2018 prices) £12.7m £12.7m £12.7m Scaled up UPFC unit cost (2018 prices) £139.7m £12.7m £139.7m £292m
Table 3.3: Case study summary
3.4 Solution costs and first-of-a-kind costs
We have carried out a conservative cost-benefit analysis by taking the more expensive of two prices we were provide through our Request for Information (RFI) exercise. We expect at the Invitation to Tender (ITT) stage in 2018 to achieve savings in the price of the UPFC and its immediate equipment (£9.74m) assumed here, and to therefore have a larger contingency fund than modelled below.
Cost category Supplier #1 Supplier #2 Value used in CBA
Repeat cost
Design Activities £0.61 £0.51 £0.61 50%
Site purchase, clearance and preparation
£1.25 £1.21 £1.25 100%
UPFC cost £9.70 £9.74 £9.74 75% by 2040
Ancillary equipment and building £2.06 £0.87 £2.06 31%
Installation £0.73 £0.58 £0.73 100%
Programme management, learning & dissemination
£1.10 £1.10 £1.10 0%
Contingency £0.82 £0.77 £0.75 0%
Total £16.27 £14.77 £16.24 Table 3.4: Summary of first of a kind costs
The final column (“repeat cost”) shows the cost of repeating each element of work. A number of elements such as Programme management, Learning & Dissemination and Contingency are marked as First-of-a-Kind costs which would not be repeated, and other costs such as Front-end Engineering Design (FEED) are marked as achieving a saving with respect to the first trial.

Page 20 of 100
We believe that there is a strong case that the price of the UPFC unit itself will decrease.As discussed in Section 2.2, UPFCs are based on Voltage-Source Converter (VSC)technology. VSCs are based on a “building block” known as a “valve”. In order to createa functioning unit, many valves must be supported by external switchgear, interfacingtransformers, computer equipment to generating timing signals, and cooling apparatus.
We have analysed market data which forecasts that the total number of “valve” modulesdeployed will have multiplied by almost ten-fold between 2010 and 2024. We believethat this will lead to cost reductions which may reach a 25% cost reduction by 2040. Thegraph below illustrates the progress in installation cost as a result of these adjustments:
Figure 3.3: breakdown of UPFC costs
3.5 Break-even analysis
The table below summarises the break-even analysis for the project. The mostsignificant factor in achieving an earlier break-even point is the number of instances of“extreme” constraints such as that currently being experienced at Stamford. These arepresented as individual items and their effects in combination are greater.
Scenario Break-even NPV at2040
Base scenario summarised in this section and inAppendix 10 2027 8 units £34.4m
All subsequent installations earn income fromdelivering reactive power 2027 8 units £40.6m
Price reduction by 2040 increases from 25% to 33% 2027 8 units £38.2mA second major (£35m+) constraint is identifiedrequiring reinforcement by 2026 2025 2 units £47.2m
Table 3.5: summary of break even and NPV costs
Toral Project Cost Cost of an installationonce proven successful
Cost of an installation in2025
FEED
Detailed design
Land purchase
Site surveys
Site clearance and preparation (incl. earthing grid)
Core HVDC equipment cost
Balance of plant cost
Building (if required)
Installation
Telecomms costs and DNO SCADA equipment
Construction oversight and commissioning
Programme management
Learning & dissemination
Contingency

Page 21 of 100
Section 4: Benefits, timeliness, and partners
(a) Accelerates the development of a low carbon energy sector and/or delivers environmental benefits whilst having the potential to deliver net financial benefits to future and/or existing Customers
Distributed generation connecting to the Distribution Networks has contributed a significant proportion of the UK’s overall growth in renewable power generation. In particular, generation from both small-scale residential photo-voltaics (PV) and large-scale commercial PV have grown rapidly over the last few years, highlighted in blue below. As we discuss in Section 4(b) it is expected to increase once again after a recent slowing in applications for new solar PV connections.
Figure 4.1: Growth of renewable generation sources
Source: Digest of UK Energy Statistics
This is creating significant pressure on distribution networks across the country, as shown by the heat maps published on the following pages. Whilst these heat maps represent constraints at a number of different voltage levels, they are a leading indicator that surplus and excess power will be generated which will rely on the 132kV network, and potentially on the transmission network, to export it to other demand centres.
-
10,000
20,000
30,000
40,000
50,000
60,000
70,000
80,000
90,000
2009 2010 2011 2012 2013 2014 2015 p
Re
new
ab
le g
ene
ratio
n (G
Wh)
Onshore Wind Offshore Wind Shoreline wave / tidal
Solar photovoltaics Hydro Landfill gas
Sewage sludge digestion Energy from waste Co-firing with fossil fuels
Animal Biomass (non-AD) Anaerobic Digestion Plant Biomass

Page 22 of 100
Figure 4.2: Illustrative ‘heat map’ of distributed generation connection constraints on the GB electricity distribution network.
Source: GB DNO generation availability maps as of June 2017 combined by Mott MacDonald

Page 23 of 100
Figure 4.3: HARP potential trial site locations within WPD network area
Source: WPD generation availability map (June 2017) combined by Mott MacDonald
The HARP project, once rolled out to 23 sites across the GB, is expected to avoid in excess of 440,000 tonnes of CO2 emissions by 2040. This is achieved by allowing renewable generation to displace other higher-carbon sources of electricity generation. Carbon savings have been calculated assuming the capacity created is taken up by commercial solar PV, operating at industry standard capacity factor, and which is a zero carbon source of generation. The carbon this offsets is calculated using grid carbon intensity figures published by National Grid alongside their Future Energy Scenarios.
The UPFC solution itself is estimated to have an embedded 240 tonnes of CO2 equivalent (tCO2e), noting that a majority of this is recyclable steel, copper and oil at end of life. The site installation and associated electrical equipment is estimated to have an embedded carbon of around 1420 tCO2e (this figure includes for the greenhouse gas SF6 in the circuit breakers as well as CO2). For 23 sites these create a total of around 38,180 tCO2e, which is less than 10% of the estimated 440,000 tonnes savings in CO2 emissions.
The net benefit is thus over 400,000 tonnes of CO2 emissions by 2040.
The HARP project will also contribute an environmental benefit through not having to reconductor or rebuild lines stretching across the UK countryside.
(b) Provides value for money to electricity distribution/transmission Customers
The HARP project will have a Direct Impact on the Distribution Network by altering the flow of both active and reactive power on the selected 66kV cable at the preferred trial

Page 24 of 100
site Evesham and Feckenham or on the 132kV overhead line at the reserve trial site between Stamford and Peterborough North.
The HARP project has already:
Validated its size and scale by simulation
Has pre-qualified suppliers through a competitive process
Is following industry-standard procurement process and contractual arrangements designed to deliver best value
Has substantiated its cost estimates against other benchmarks.
Scale and size
We have substantiated through simulations that a device containing Voltage Source Converters each rated at 25MVA can provide a meaningful increase in capacity. We have considered a device containing 50MVA converters but have found that its ability to steer power becomes constrained by the capacity of other assets on the network. As such, the rating 25MVA appears to be economic, have a smaller footprint, and may be more likely to be delivered in standard ISO shipping containers to aid construction. Further detail of the models we have built and will offer to the project can be found in Appendix 12.
Supplier selection
A total of six manufacturers were informally approached early in 2017 in order to gather an early understanding of the supply chain and budgetary estimates. A Request for Information (RFI) was subsequently issued to the wider market both via the UVDB Achilles database, and via the Energy Networks Associations’ collaboration portal.
Two responses were received to the RFI, of which both have been pre-qualified. Letters of support from each of these respondents are attached in the Appendices. A third response was received from a manufacturer expressing future interest in the project but not a formal response to the RFI. The two respondents were able to demonstrate a track record of installing one and in the process of constructing a second UPFC; or were able to demonstrate a track record of installations of STATCOM devices based on Voltage-Source Converter technology. The conversion of this technology to operate as a UPFC only requires modifications to the overarching control system, and not to any underlying components.
Procurement approach
The procurement process for HARP follows industry standard open competitive procurement with the process managed by WPDs procurement team through the Achilles procurement portal.
The first stage of this process has been completed with a call for Requests for Information. As part of this RFI process respondents had to complete both a company information and technical question set. The company information confirmed the company legal, financial and insurance status, organisational capacity and quality processes (including for health and safety, environmental, equal opportunities, ethics and business continuity).

Page 25 of 100
Technical criteria included previous similar reference projects and client reference contacts, staff qualification and experience and technology readiness level(s) for the proposed solution and components.
The next stage in procurement will be to seek firm offers for the supply and operation of the equipment against the final design and performance criteria. As part of this process additional manufacturers will be offered a second opportunity to pre-qualify for the final procurement stage. Offering this second pre-qualification opportunity enables the widest possible competition to enable all manufacturers to respond given the certainty of HARP project funding.
Validity of cost estimates
The UPFC equipment cost estimates from manufacturers have been obtained from the initial stage of an open competitive procurement. No manufacturer has applied any discount to their pricing. We would fully expect a discount of the quoted estimates in a response to the next stage of procurement when firm funding for the project is in place. In accordance with the Network Innovation Competition governance any project surplus as a result of a discount will be returned to customers.
Other contractor cost estimates for civil works have been calculated using industry standard data against manufacturer site requirements, with indexation appropriate to the construction timetable. Four specialist teams estimated the costings for:
Land purchase using Land Registry data
Building costs were estimated using industry-standard data book "SPONS" against each manufacturer’s site requirements.
Civil works site preparation, site survey requirements, and civils works themselves (earthing, foundations, fencing, etc) were priced using Mott MacDonald’s experience and then validated with WPD’s construction team.
Additional electrical equipment for connection to the distribution network, protection and control systems and telecoms with reference to actual data from previous UK substation projects for which Mott MacDonald has been the principal designer (primarily from National Grid South East Substation alliance where we were also the cost management lead).
The HARP project capital cost has been sized between the total outturn estimates for the manufacturer’s solutions. Accordingly the more expensive manufacturer(s) will need to offer a discount to remain competitive.
Contingency has been included in the estimates to cover:
Differences between the preferred and reserve sites
Differences between the two manufacturer's quotes and any differences in ancillary switchgear required to ensure customers are not affected when maintenance on the UPFC needs to be carried out.
15% contingency on person-hour estimates.
The HARP project funding profile assumes that at least 20% of the manufacturers' fee will be held back until successful commissioning.

Page 26 of 100
Mott MacDonald as a project partner is providing much of the project management and engineering team. Mott MacDonald’s cost is a fixed fee arrangement to the project to provide cost certainty and is described in full in Appendix 10.8. Their fee has been calculated by work package to support each project stage and reviewed internally against standard company governance to provide assurance that the level is appropriate to the scope of work and budget.
As a 3rd-party led project, WPD have reviewed the effort allocation against previous WPD-led projects (FLEXDGRID) and found the effort to be appropriate.
(d) Is innovative (i.e. not business as usual) and has an unproven business case where the innovation risk warrants a limited Development or Demonstration Project to demonstrate its effectiveness
A total of six UPFC deployments have taken place or are under construction in the US, Korea and China, at voltage levels including 154kV and 220kV. There have been additional examples of UPFCs being installed at voltages lower than 132kV to support traction supplies, specifically in China. As such, the volume of worldwide installations, the new voltage level, and the adaption to UK network characteristics represent a number of firsts compared to conventional network reinforcement options.
There is a commercial risk associated with whether the device can be used to provide reactive power to the System Operator (National Grid), for what duration and availability, and for what level of income.
There are technical risks associated with the integration of the UPFC with existing network devices (such as protection schemes and protection equipment). Whilst some best practice has been shared by the CIGRE working group, no standard equipment specification, operations or maintenance policies exist.
Finally there are operational risks for DNOs since they do not have the same level of experience with Voltage Source Converter (VSC) technology on which UPFCs are based, and which the Transmission Network Operators (TNOs) have more experience with.
The combination of these factors would lead a GB DNO today to add a “risk premium” when comparing the installation of a UPFC with conventional reinforcement with a known asset life and known reliability. The DNO would pursue conventional reinforcement, even if the headline price of the device and its installation was competitive.
The project will address these gaps in the industry's knowledge by developing device specifications, equipment approvals, operational policies and information about reliability. This will commence at very outset of the project by publishing tender documentation with Project Deliverable (1.). The project will conclude with a comprehensive toolkit for Distribution Network Operators as Project Deliverable (2.). The toolkit will allow them to evaluate potential sites for UPFC installations, model them using them current modelling tools, to design daily and seasonal operating regimes for the device, and to operate and maintain a typical UPFC.
(e) Involvement of other partners and external funding
WPD issued an open call for solutions to the challenges of active power control, reactive power control and voltage and phase angle stability on the 132kV network. Third parties

Page 27 of 100
were invited to submit their proposals to lead a bid which warranted Network Innovation Competition funding.
A total of 20 submissions were received, of which 7 were shortlisted and this proposal, submitted by Mott MacDonald, was selected for progression.
Mott MacDonald will act as programme manager and principal designer for the HARP project. Mott MacDonald will support WPD’s operations team during equipment installation, acceptance, commissioning and operation. They will work alongside WPD’s innovation team to present and disseminate the findings.
Mott MacDonald is supporting the project through discounted fee rates and contributions of project management and network studies time, providing an external funding contribution of £134,424, which equates to 12% of their fee to the project.
This contribution is made through:
£17,025 of project management time to routine project manager activity support
£15,735 of engineering time for network studies and model development
£7,315 of their Knowledge Manager’s time to assist the learning and dissemination activity and production of knowledge products
£94,349 through using fees at significant discount to market rates.
(f) Relevance and timing
The project is timely for four primary reasons:
The cost of solar generation is reaching parity with other conventional generation, which will drive renewed uptake of commercial solar generation;
The reactive power demands of the transmission network managed the GB System Operator are increasing and are taking on a level of urgency;
The growth in the use of Voltage-Source Converter technology offers the opportunity to take the advantage of cost reductions for the first time.
The historic growth of renewable generation has started to trigger substantial reinforcement costs on the 132kV network
Solar generation is reaching grid parity
The following graph is re-published from the Power Sector Scenarios used to inform the fifth “Carbon Budget” and was produced by the Committee on Climate Change in October 2015. The Committee on Climate Change estimate that Large Scale Solar PV generation (which is likely to connect to distribution networks) will reach cost parity without support from subsidies by the early 2020s. As such, the HARP project will have, by 2021, provided and additional tool to Distribution Network Operators to accommodate a renewed uptake of solar generation, and to better control the transmission/distribution interface.

Page 28 of 100
Figure 4.5: Estimated grid parity of various technology types
Source: “Power Sector Scenarios for the Fifth Carbon Budget”, Committee on Climate Change, October 2015,
The reactive power demands across the GB are taking on a level of urgency
The graph below is re-published from National Grid’s System Operability Framework, issued in 2016. It emphasises the long-term trend which is being observed that the transmission network is increasingly having to operate in a way in which it was not first designed, with reactive power compensation requirements changing. Older static compensation equipment is likely to only be able to provide on type or other – positive or negative Vars – with the risk that older equipment becomes surplus to requirements and new equipment has to be procured, or new alternative sources of reactive power compensation found from generators and distribution networks. The UPFC is one such alternative source of reactive power compensation.
Onshore wind
Large Scale Solar PV
Nuclear power
CCS
Offshore
Tidal Lagoons
2015
2016
2017
2018
2019
2020
2021
2022
2023
2024
2025
2026
2027
2028
2029
2030
2031
2032
2033
2034
2035
2036
2037
2038
2039
2040
Nuclear subsidy free but unavailable
Coal CCSGas CCS

Page 29 of 100
Figure 4.6: Daily minimum reactive power demand (2005-2016)
Source: “System Operability Framework”, National Grid, 2016
National Grid have recently issued the consultation document: System Needs and Product Strategy (SNAPS), reviewing their commercial products. It cites reactive power as a product that needs to be reviewed and National Grid’s aim is to ‘create a market that values reactive power’ by the end of 2018/19.
The growth in the use of Voltage-Source Converter technology
Voltage-Source Converter technology is increasingly being used to connect offshore wind and to build converter stations required to operate interconnectors between countries and over long transmission routes. As we shown in Appendix 10, section 10.10.7, the installed base is expected to have grown 10-fold between 2010 and 2024.
As such we believe that we can substantiate a 25% reduction in the cost of a UPFC compared to this first GB pilot by 2040. Further details can be found in supporting Appendix 10.
Potential alternatives
One potential alternative to divert active power flow on 132kV networks is to use a quadrature boosters. This alternative has been discounted following modelling of typical network situations being experienced by WPD A more detailed assessment is contained in Appendix 9. The appendix also discusses alternatives by which reactive power and voltage disturbances can be addressed.

Page 30 of 100
Section 5: Knowledge dissemination
This project conforms with the default IPR requirements as set out in the Network Innovation Competition Governance Document v3.
5.1. Learning generated
The project has been designed to demonstrate and understand the technical and commercial suitability of UPFCs on the distribution network. The project will deliver significant new learning on the employment and effectiveness of UPFCs to regulators, DNOs and industry:
Through being a first-of-kind deployment in the UK, HARP will generate knowledge of UPFC deployment and effectiveness on the GB distribution network and of the impact at the interface with the transmission network.
With only a limited deployment of UPFCs on distribution networks in Asia, HARP will provide real-world data for the future development and manufacture of UPFCs, lowering the development risks and thus development costs for manufacturers. HARP will also demonstrate a commercial framework and market for the UK.
HARP will develop a set of learning including network models (including modelling procedures and techniques), specifications, policies and implementation guides for the future deployment of UPFCs on the GB distribution network.
Generation of knowledge about power electronics connected on distribution networks around the building, ongoing maintenance and reliability.
Methodologies for the testing procedures and verification of the devices performance at Factory Acceptance Tests and Site Acceptance Tests.
Proof of business case as an alternative to conventional reinforcement and exploration of the reactive power market.
We foresee other areas in the country where similar drivers are emerging. An example is the transmission corridors where power flows are changing as the country shifts to rely more on new nuclear and on renewable generation in Scotland, as distributed generation is increasing. Other examples include North Wales into England via Shrewsbury; in the West Country driven by Hinkley Point C and the solar roll-out; and through Wiltshire and Hampshire.

Page 31 of 100
The knowledge and learning generated by this project will enable other DNOs to procure, deploy and operate UPFC devices on their networks.
Activity Learning Beneficiary
Design
Network model DNOs Academia
Specifications DNOs Industry
Site selection methodology DNOs
Procurement
Equipment procurement, construction commissioning, Factory Acceptance Test, System Acceptance Test experience
DNOs Industry
Trials (general)
Equipment performance, availability and reliability records
DNOs Industry
Before and after network performance data
Regulator DNOs Industry Academia
Operating manual – operating regime (daily & seasonal)
DNOs Industry
Trial periods Demonstration trials: daily and seasonal performance data
DNOs Industry
Project (general)
Communications and Knowledge Management Plan, Progress and close-down reports, Good practice guide
DNOs Academia
Table 5.1: Summary of learning and beneficiary
5.2. Learning dissemination
As the trial will be the first of its kind in Great Britain, there is significant learning on the design, installation and deployment of UPFCs on the GB distribution network for DNOs, the TSO and the Regulator. Secondly, with only limited installations on distribution networks in Asia, the project will provide data for industry to further develop UPFC performance
Learning will be recorded from the outset of the project. The learning will be disseminated in a variety of means across DNOs, industry, academia and to the Regulator. A key project delivery is a deployment toolset incorporating the knowledge gained to assist DNO conduct any future UPFC deployment.
Mott MacDonald’s project team includes a Knowledge Management professional who will assist the project team in identifying and capturing learning throughout the project.
Figure 5.2 shows the learning strategy including the key dissemination means.

Page 32 of 100
Figure 5.2: Learning Strategy
The beneficiaries of the learning are expected to be:
Regulators and associated departments & bodies: The trial can enable Ofgem to gain valuable information regarding the potential of alternatives to network reinforcement and their costs. Furthermore, the trial findings will enable the Department of Business, Energy and Industrial Strategy, to help inform the strategic view in regard to the future potential deployment of DG. Regulators such as the Health and Safety Executive (HSE) will gain better insight to the safety risks/benefit of installing UPFCs on the distribution network.
Industry groups & professional bodies: These stakeholders can benefit from learning related to new design standards related to UPFCs and various system configurations. Specifically, technical forums such as the Electricity Network Association (ENA), Institution of Engineering and Technology (IET), CIGRE and CIRED will benefit from engagement on the impact of the project on managing power flows.

Page 33 of 100
Current and future DG customers: The project will reach out to the renewables community through conferences and organisations such as RenewableUK
Academic institutions: This Project will accelerate the use of power electronics on distribution networks. Electrical engineering departments and institutions will get access to trial data and findings, network models and the project results to further influence the way we design, build and operate and manage distribution networks.
Other manufacturers: HARP will demonstrate the need, technical/commercial feasibility, and benefits of UPFC products, not just to the project participants and GB DNO community, but also to third parties who could bring competing UPFC technologies to market. The learning from this project will de-risk, remove technical and regulatory barriers, and stimulate further innovation across the market in the development of UPFC technology.
Communications and Knowledge Management Plan Knowledge capture is a fundamental element of the Project and requires a robust methodology and plan for delivery. In order to achieve this, Mott MacDonald will use the approach proven for knowledge capture and dissemination developed and utilised on other WPD LCN Fund and NIC projects.
New knowledge will be generated that relates to various stakeholders. A stakeholder map and Responsibility, Accountability, Consult and Inform (RACI) model5 will be produced. This mapping and the RACI analysis will inform the communications plan to match the project activity and learning requirements with learning generated in a timely manner.
Knowledge will generally be of two forms: planned and unplanned. Planned knowledge is that expected to be captured in line with the Knowledge Management Plan. Unplanned knowledge is the informal and experiential learning gained by team members. This will be captured and documented under Mott MacDonald monthly project control meeting process, which has a specific ‘lessons learnt’ activity for project team members led by the project manager. This unplanned knowledge will be summarised in the quarterly reporting process when team members will contribute to the analysis and reports.
Learning will be available through open access on the WPD Innovation Website and ENA Smart Grid Portal, and will be published and presented through at least the following key channels:
LCNI conference
WPD twice annually balancing act events
Mott MacDonald annual power electronics seminar
Network Licensee Collaboration Portal
5 RACI – Responsibility, Accountability, Control and Inform. The RACI model is a tool used for identifying project delivery roles and activities and communication requirements to avoid confusion and omission of roles and responsibilities during a project.

Page 34 of 100
5.3. IPR
A condition of our pre-qualification process for suppliers was that they confirmed their acceptance of the Default IPR arrangements as set out in the Network Innovation Competition governance document. These arrangements will be reflected in final contracts with suppliers, and additionally will specify that:
Reliability and availability data whilst on trial is not proprietary
Analysis of performance on trial is not proprietary
Manufacturer model and other site performance data is not proprietary
Mott MacDonald confirm acceptance of the Default IPR arrangements and agree to fair and reasonable use of existing background IPR built up during the bid stages. This background IPR includes the UPFC system model developed during preparation of the submission.

Page 35 of 100
Section 6: Project Readiness
WPD and our partner Mott MacDonald are confident that the project can start promptly due to the significant amount of preparatory work conducted to support the Submission.
6.1 Evidence of why the Project can start in a timely manner
Both WPD and Mott MacDonald manage and deliver complex engineering development projects. Both companies have proven and accredited project governance, project management and quality assurance systems in place along with highly qualified and experienced staff.
Additionally, a significant level of preparatory activity and planning for project implementation has been conducted and reviewed as part of the Submission preparation. The outcome of this work is:
Senior management commitment from WPD and Mott MacDonald
A clearly defined project governance structure and management processes
Experienced and qualified named staff allocated to the project
Initial procurement stages completed
Initial design analysis completed
6.1.1 Senior Management commitment from both WPD and Mott MacDonald Senior management from both WPD and Mott MacDonald are fully engaged with the HARP project, having been involved from project inception, and throughout the entirety of the bid process. These managers are responsible for ensuring appropriate resources are allocated to the project and for the performance of the delivery team.
Development of the Submission and its supporting evidence has been conducted in accordance with standard company governance with senior level and independent review of the technical analysis, project plan, project costs and risks. The senior manager in each organisation responsible for the delivery of the project and their allocated delivery team have approved the Submission content.
WPD have issued a Letter of Intent to appoint Mott MacDonald for the Project Management and Consultancy to execute the project.
6.1.2 Clearly defined project governance structure and management processes Mott MacDonald project delivery is governed by our accredited Business Management System. The three key elements to the project governance and management are:
A project organisation with clearly defined roles and responsibilities, including for quality assurance and project accountability
A specific Project Plan of Work detailing how the project will be implemented
A specific Knowledge Management and Communications Plan involving all stakeholders

Page 36 of 100
Our project organisation with named staff is shown in Appendix 10.7. The project will be governed by a Project Board with both WPD and Mott MacDonald senior representatives, focussed on the project progress and outputs towards its objectives.
The WPD project team will oversee delivery of the project by Mott MacDonald and provide interfaces to the appropriate customer-facing, health and safety and engineering approvals teams within WPD. They will also review the project progress and give Mott MacDonald appropriate guidance and support for the successful delivery of the project.
The Mott MacDonald project director, Dr Martin Wilcox, is a previous head of innovation at a DNO and is responsible for the resourcing and skills of the project team.
The Mott MacDonald project manager, Kenny Taylor, is a highly experienced power system engineer. Kenny will lead and manage the day-to-day execution of the project.
The project will be executed under both Mott MacDonald and WPD quality assurance systems. For Mott MacDonald this commences with a specific Project Plan of Work, agreed with WPD, detailing the project activity, review and approvals processes, milestones and deliverables and applicable codes and standards. This project plan or work is accompanied by the Project Schedule and the Risk and Opportunity Register. The high level RACIS matrix for the HARP project is shown in Table 6.1:
Task MM OEM WPD
Planning studies A, R S C Land referencing and planning applications S - A, R Specification A, R C C Site surveys A, R - I Detailed design - UPFC C A, R C Detailed design – civils and balance of plant A R C Construction I A, R C Construction supervision A, R - C Factory Acceptance Tests R A I Site Acceptance Test S R A Commissioning S R A Prepare trial plan A C C Oversee trials and perform analysis A, R I C Prepare reports and conclusions, disseminate to the wider industry R C A
Project management and governance R C A CDM PD PC Cl
Key: R - Responsible A - Accountable C - Consult I - Inform S - Support PD - Principal Designer PC - Principal Contractor Cl - Client
Table 6.1: Initial RACIS matrix for NIC HARP

Page 37 of 100
The detailed project schedule is at Appendix 10.4. A high level summary is shown at Figure 6.1.
Figure 6.1: HARP Project Plan
A Knowledge Management and Communications Plan will be produced. This will detail the learning expected to be produced by the project, how and when this learning will captured and how and when the learning will be disseminated. The detailed and specific learning requirements will be agreed with stakeholders during the project design phase, and re-validated annually.
Similarly the communications requirements for all stakeholders for successful project execution will be captured and itemised. This will include NIC report requirements, internal reporting between Mott MacDonald and WPD, and project specific WPD and customer requirements.
This will include the communications responsibilities and timetable for key project activities including for:
WPD and National Grid network planners for network outage for UPFC commissioning

Page 38 of 100
Local authorities, landowners, neighbours and customers for planning consents,
WPD operations staff for monitoring of the UPFC once live on the network
6.1.3 Experienced and qualified named staff allocated to the project The named project staff have significant experience in UK distribution and transmission system and substation design, construction and assurance. All named staff on the project team are allocated to this project within the long-term resource plan and will be available for the project. The lead discipline staff summaries are show in the Table 6.2.
Role Experience WPD Project Director Roger Hey
Roger has worked in the energy industry for over 20 years, with East Midlands Electricity, Powergen, E.ON and now WPD. He initially trained as an operational engineer delivering networks construction and maintenance activities, and subsequently working in DNO Control Room and Telecommunications. Roger now leads the WPD Future Networks Programme, responsible for the business’s innovation strategy, delivery of demonstration projects and implementation of new solutions into core business activities.
WPD Project Manager Steven Gough
Steven has worked with WPD starting with sponsorship through Southampton University Power Academy. He has since worked as a Design Engineer and Asset Management Engineer in Primary System Design team. For the last 5 years he has managed NIA projects within the Future Networks Team. Current projects are focussed on integration of Distributed Generation onto the network and instigating business change by rolling out Alternative Connections and is leading on the largest Active Network Management area to date.
Project Director Martin Wilcox
Chartered electrical and electronic engineer, with 7 years’ experience in regulated utilities as Head of Innovation and 17 years’ experience in project management in applied research in the energy sector, leading private sector research and innovation teams. Led projects which won the Industry Innovation Award at the 2014 European Utility Industry Awards, the Innovation Award at the 2014 Energy Institute awards, and the Smart Utility award at the Utility Week 2015.
Project Manager Kenny Taylor
MSc qualified power systems lead engineer, leading teams and projects on power systems analysis and system protection as well as practical experience in power system troubleshooting, test and commissioning. Power system expertise across all voltages for both onshore distribution and transmission and offshore oil platforms. Extensive power system monitoring through use of power analysers to assess power system performance and quality of power supply and validate systems’ software models.
Technical Assurance Paul Fletcher
Over 30 years’ experience in the UK electricity supply industry. An authority on the design and specification of AIS/GIS transmission substations and FACTS equipment (MSCs, SVCs, HVDC) having also served on a number of CIGRÉ and standards Committees.

Page 39 of 100
Role Experience Business Assurance Guy Doyle
Chief economist of Power unit responsible for energy and carbon market analysis, models and advising on market regulation, design, restructuring and forecasting studies. Special advisor on training and capacity building. Currently serving on the UK Government’s Panel of Technical Experts covering aspects relating to electricity market reform.
Power Systems Graeme Farquhar
Electrical engineer specialising in system analysis for both onshore and offshore electrical power systems. Power system study experience includes steady state, dynamic transient analysis, harmonic analysis, arc flash and protection studies for islanded and grid connected systems.
Power Systems Engineering Martin Ferguson
Highly experienced HVDC engineer with in-depth skills in design of HVDC transmission systems. Has acted as a design engineer for full chain of transmission and distribution system from 11kV through to 400kV across AC and DC systems. Experience in tender preparation and assessment and working for clients as lead engineer on project teams.
Electrical Engineering Peter Lear
Chartered electrical engineer with a range of experience of transmission and distribution systems, including front end design, detailed design and network planning. Technical experience has focused on substation design, including primary and secondary electrical systems.
Control & Protection Jim Pechey
Wide range of experience in the specification, design, design audit and commissioning of transmission and distribution systems especially substation equipment. Skilled in the design and setting of protection systems. Qualified to National Grid’s TP141 Commissioning Advanced Management Standard.
Civil Engineering Caroline Pye
Chartered civil engineer with 15 years’ experience conducting structural and civil engineering design including for high voltage electricity substations, commercial development, civil and residential developments. Conducted design assurance for National Grid and UK DNO substations.
Environmental Nicola Catt
Environmental consultant experienced in environmental management systems, legislation and compliance for energy and water projects. Most recently worked within National Grid South East Electricity Alliance (SEESA) conducting construction environmental monitoring across a wide range of sites, project management and development consent orders.
Planning Advisor Jonathon Douglas-Green
Mott MacDonald’s practice leader for planning, permitting and licensing. Leads on UK town planning and development management producing planning applications for major road schemes, railway and planning statements for energy projects through the DCO process.
Financial Analyst Andrew Conway
Senior regulatory consultant with experience in sustainable energy policy, market, and regulatory analysis. Key skills include techno-economic analysis: demand and price projections, policy impact analysis, power dispatch analysis, energy market and regulatory analysis.
Knowledge Manager Raymond Olayinka
Over nine years’ work experience within knowledge management roles. He has developed and overseen knowledge and learning initiatives at corporate levels working in partnership with stakeholders. He holds a Bachelors in Civil Engineering, Masters in Business Administration, and a PhD in Knowledge Management.
Table 6.2: Named staff profiles for HARP project team

Page 40 of 100
6.1.4 Initial procurement stages completed As part of the Submission preparation the procurement process for the UPFC equipment manufacture, installation and operation has been started. A Request for Information for a UPFC specified for the UK distribution network in support of this project was issued in May 2017 two responses received in June 2017. A third response indicating future potential interest was also received.
The information received has been used to inform HARP project costings and, scheduling as well as refining the site and equipment requirements.
Evidence of the supplier interest and ability to supply is attached at Appendix 10.12.
Initial land reference searches for land ownership in the vicinity of the selected sites have been completed. At this stage there are no known barriers to procuring land for siting the UPFC equipment.
Using Mott MacDonald’s experience gained of the planning process for electricity substations, we have conducted an Initial Project Environmental Review for the two candidate trial sites to confirm that from a desk-top review there are no known significant environmental issues.
No standard power system analysis model is available for a UPFC in traditional network design packages (e.g. DigSilent, IPSA). Requesting a model from a manufacturer pre-contract award was unlikely to happen due to IPR constraints. Waiting for such a model until contract award introduced schedule and design risk to the project. Mott MacDonald developed a UPFC simulation model based on our own network modelling experience and the available academic literature. A summary of the model was sent to the invited manufacturers for comment as part of the RFI process. Having this model now de-risks the tender specification activity, enables independent assurance checks on any manufacturer’s design performance and provides an early knowledge deliverable from the project for DNOs, industry and academia.
6.2 Evidence of the measures a Network Licensee will employ to minimise the possibility of cost overruns or shortfalls in Direct Benefits
The following key points outline the measures that WPD and Mott MacDonald have employed or will use to minimise cost overruns and shortfalls in direct benefits:
The initial RFI procurement stage has provided market information to inform costs. Continued use of the standard open procurement process following the design phase will be used to obtain best pricing.
Equipment costs have been taken from the vendor RFI response and compared with Direct Current equipment pricing estimates derived from Mott MacDonald’s market knowledge.
Site construction costs have been compiled against vendor site footprint and building requirements using industry standard pricing norms ("SPONS").
Costs have been validated against other similar projects (WPD, Mott MacDonald National Grid for substations and civils). Additionally, all costs have been independently reviewed for completeness and reasonableness by a senior technical specialist under the standard Mott MacDonald governance process.

Page 41 of 100
Project team resources have been costed using both a bottom-up and top-down approach using labour rates agreed with WPD benchmarked against other transmission and distribution projects. Mott MacDonald will provide the project management and engineering consultancy under lump-sum arrangements to provide certainty of project team cost.
All project costs have been allocated and broken down against specific work packages to provide greater visibility and enable tracking. Standard robust project governance will be used to track and report cost out-turn monthly and senior management.
Contracting models are not yet fixed so the project retains adaptability to adopt the best turn-key EPC or sub-package construction approach to best fit the project requirements. The manufacturer/EPC contracts will contain standard industry commercial and contract incentive mechanisms such as performance bonds, milestone payments and liquidated damages.
The detailed design phase will reduce remaining uncertainty in the project at an early stage.
The risk register identifies key costing risks, with an appropriately allocated owner to manage the risk and ensure that the specific and timely key mitigation activities are completed.
The risk register identifies key project activities that may impact on achievement of Direct Benefits, with an appropriately allocated owner to manage the risk and ensure that the specific and timely key mitigation activities are completed.
The project costs include a mid-point contingency estimate against the two manufacturer site requirements of £115,000. This contingency is to cover additional access, drainage and telecoms requirements depending on the specific ground location of the site.
6.3 A verification of all information included in the proposal (the processes a Network Licensee has in place to ensure the accuracy of information can be detailed in the appendices)
It is confirmed that:
The Submission has been prepared by Mott MacDonald in conjunction with WPD, with information provided from potential project collaborators and equipment suppliers.
The bid has been prepared by an experienced team of engineers, in partnership with dedicated Project Managers from Mott MacDonald and WPD
The technical evidence, specifications, network models and final submission proposal has been through independent checking processes and peer review processes to ensure the accuracy of information
The technical sections of the Full Submission Pro-forma have been reviewed by the project Technical and Business Case assurers, who were not directly involved in the bid formulation
The Project submission has been reviewed and signed off by Mott MacDonald Divisional Manager and WPD’s Operations Director.

Page 42 of 100
6.4 How the Project plan would still deliver learning in the event that the take up of low carbon technologies and renewable energy in the Trial area is lower than anticipated in the Full Submission
At present, both trial sites have a high percentage of installed DG to demand. From National Grid, peak demand is 151 MW in 2016 rising to 157 MW in 2023 at Feckenham with a current installed DG capacity of 108 MW. Minimum demand is typically 30% of peak winter demand. Approximately 40% of this installed generation is intermittent solar. Accepted connections at Feckenham connecting substations would increase the installed generation by 246 MW and increase the total installed intermittent DG to 80%.
The peak demand at Walpole is 236 MW in 2016 rising to 249 MW in 2023. Minimum demand is typically 30% of peak winter demand. There is currently 207 MW of generation installed at Walpole connecting substations, 30% of which is intermittent solar. Should accepted connections be installed, the total DG installed would increase by 182 MW with intermittent solar accounting for 39% of the total generation.
At both trial sites, there is sufficient intermittent generation at present currently installed to measure and demonstrate effects without waiting for additional solar connections.
6.5 The processes in place to identify circumstances where the most appropriate course of action will be to suspend the Project, pending permission from Ofgem that it can be halted.
The initial process is proactive risk management by the Mott MacDonald project manager and project director. Risk review and assessment of mitigation activities is a primary role for the project manager. Such reviews are evidenced in the project documentation within the Mott MacDonald quality system at the Monthly Project Control Meetings.
The monthly reports and risk register will be reviewed by the Mott MacDonald and WPD project directors and Technical and Business Case assurers, with particular attention paid to risk materialising and project progress and cost outturn against schedules, for early warning of potential issues.
The Project Board will approve key progression decision gates based on evidence for:
Tender release
Award of manufacture contract
Factory Acceptance
Site Acceptance
Six-monthly trial intervals
The Quarterly reports will be reviewed by the Project Board, with the project directors reporting to the Project Board. Particular attention will be paid to the success of risk mitigation actions, emerging risks, and project progress and achievement against the plan.
Mott MacDonald will commission an annual review to feed into Project Board, with a short paper on the state of market and key industry trends and changes.

Page 43 of 100
Section 7: Regulatory issues
We do not foresee any derogations or exemptions required to deliver the project.
A number of other Network Innovation Competition and/or Low Carbon Network Fund projects are working with National Grid on the topic of reactive power provision and support for voltage fluctuations. Specific examples are Phoenix (System security and Synchronous Compensators) and Transmission and Distribution Interface (TDI 2.0).
We would expect to follow any regulatory approaches which those projects have agreed with the system operator National Grid and/or Ofgem.

Page 44 of 100
Section 8: Customer Impact
The project will not make any changes to the charging arrangements for either distribution customers (via the Distribution Use of System Charge) nor to charging arrangements for connecting customers (such as renewable generators).
This section explains the measures that have been taken to avoid interruptions, both during the construction stages and trial phase of the project. It also outlines a number of beneficial impacts for stakeholders of carrying out reinforcement at a single, contained location as opposed to overhead line or cable upgrades.
8.1 Measures taken to avoid outages
Resilience of the 132kV network and alignment with the outage season
The Distribution Network Operators' 132kV and 66kV networks are, apart from isolated cases on the Scottish islands, designed in such a way that one part of a 132kV ring can be taken out of service for maintenance or upgrade work, whilst the remainder remains energised, in line with P2/6. The same capacity as before is available for demand customers. On circuits which are loaded above half of their normal rating during periods of peak renewable generation, outages are pre-arranged with generators in order to ensure that loading remains with the rating of the remaining circuits.
Distribution Network Operators reduce the impact of faults occurring during a maintenance or construction outage by concentrating their works into an "outage season" between Spring and Autumn in which the load from demand customers is at its lowest.
Our first measure to reduce the impact of outages during the construction phase has been to align our programme with the existing outage season. The core period of commissioning during which outages will be required is scheduled (see line 141 of the programme) in May 2020. All communication with customers will take place through WPD's existing outage management team and according to WPD's processes.
Build off-line
Our Request for Information (RFI) sought indicative designs from manufacturers. We have checked the manufacturer's proposals in order to ensure that they are suitable to build off-line. By building on a separate piece of land, next to but away from the existing WPD substation, it prevents the need to take outages in order to gain access around or work safely in the presence of existing, energised, equipment. Building on a separate piece of land will mean specific planning consent will be required. The nature and size of the works means this is expected to be a minor planning application and appropriate time has been programmed in the project schedule.
Switchgear designed to quickly restore the network to its pre-trial state
We have taken the manufacturer's responses to the RFI and checked that they included all the necessary switchgear to ensure that:
the UPFC can be commissioned with minimal outages
the network can be automatically switched back to its conventional pre-trial state in event of a fault in the UPFC
the network can be switched back to its pre-trial state during maintenance on the UPFC, or, in the event that the UPFC causes persistent issues.

Page 45 of 100
We have based our design for the switchgear arrangements in Figure 8.1 on industry best practice as set out in CIGRE brochure 160 "Unified Power Flow Controller (UPFC)".
Figure 8.1: UPFC installation switchgear arrangement to restore network connectivity
In normal operation, circuit breakers CB1 and CB2 will be closed, and their associated disconnectors will be closed. The disconnectors either side of CB3 will also be closed, but circuit breaker CB3 will be open. As such, the UPFC will be connected to the line on either side and all current will flow through the series transformer within the UPFC.
The network can be returned to its pre-trial state by opening circuit breakers CB1 and CB2, and then closing circuit breaker CB3. This will be programmed to take place automatically in event of a fault. During longer periods of maintenance on the UPFC, or if the UPFC causes persistent issues, the disconnectors either side of the UPFC can be opened to fully isolate the equipment and allow work to be carried out on it.
Where necessary, we have included additional budget to bring the manufacturer's indicative designs up to the standard shown here.
Inclusion of industry standard protection equipment
Our RFI specified a number of standards with which the manufacturers shall have to comply. The manufacturer's quotations have included protection (such as surge arrestors to mitigate the effects of a lightning strike) in accordance with industry best practice. Similarly, our estimate for budgets for construction have included physical site security to protect the site from vandalism and theft.
8.2 Stakeholder benefits
There are significant benefits to customers by concentrating works to upgrade the network at a single site, on which the UPFC is constructed, when compared with the conventional reinforcement options of laying a new 132kV cable or upgrading sections of 132kV overhead line.
The most cost-effective routes for new cables will follow existing roadways, but will, as a result, cause extended periods of streetworks and disruption for the local community. Route lengths of 20km are not uncommon. Upgrading overhead lines can be an extended process as access is agreed with multiple landowners along the overhead line route, and where route lengths of 30-35km are not uncommon. The needs of these landowners may differ and in particular farmers will be sensitive to growing seasons for crops. It is unlikely to be able to fully avoid damage to the landowner's land under the line as access is required for vehicles and equipment.
The device will also deliver benefits for the System Operator.
UPFC
CB3
CB1 CB2
Disconnector

Page 46 of 100
Section 9: Project Deliverables
Reference Project
Deliverable Deadline Evidence
NIC funding request
(%, must
add to 100%)
1
Project design and study information for installation & commissioning
30/03/18 1. Design documentation 2. Network Model 3. Knowledge Management and Communications Plan
3%
2
Tender process completed with supplier under contract
30/11/18 Tender documentation
Agreed contract
12%
3 UPFC installed and connected at trial site
31/08/20 1. FAT Report 2. Site installation report 3. SAT report
60%
4
Trial Report 1
(month 38)
28/02/21 Q1 and Q2 trials data, analysis and summary reports
Report of the trials and learning
5%
5
Trial Report 2
(month 43)
31/07/21 Q3 and Q4 trials data, analysis and summary reports
Report of the trials and learning
4%
6
Trial Report 3
(month 49)
31/01/22 Q5 and Q6 trials data, analysis and summary reports
Report of the trials and learning
4%
7
Trial Report 4
(month 54)
30/06/22 Q7 and Q8 trials data, analysis and summary reports
Report of the trials and learning
4%

Page 47 of 100
Reference Project
Deliverable Deadline Evidence
NIC funding request
(%, must
add to 100%)
8
Replicability report 30/04/19 This report will provide an update to the work presented in the bid document concerning replicability to other networks across the GB.
2%
9 Dynamic model of network issues / voltage disturbance
30/06/22 Model
Report of findings
3%
10
DNO deployment toolset created
Network model
Tactics manual
Site selection tool
Specification
Operating manual
Internal policy
Best practice guide
30/06/22 Tools demonstrated and summary report on the toolset created
3%
[Note this is a common Project Deliverable to be included by all Network Licensees as drafted below]
N/A
Comply with knowledge transfer requirements of the Governance Document.
End of project
1. Annual Project Progress Reports which comply with the requirements of the Governance Document.
2. Completed Close Down Report which complies with the requirements of the Governance Document.
3. Evidence of attendance and participation in the Annual Conference as described in the Governance Document.
N/A

Page 48 of 100
Section 10: Appendices
Appendix 10.1 Benefits Tables
Appendix 10.2 Maps
A. Map and land Referencing for Potential Site – Evesham
B. Map and land Referencing for Potential Site - Stamford
Appendix 10.3 Network Diagrams
Single Line Diagram – Evesham
Single Line Diagram – Stamford
Manufacturer 1 – Layout Drawing
Manufacturer 2 – Layout Drawing
Appendix 10.4 Detailed Project Plan
Appendix 10.5 Risk Register
Appendix 10.6 Contingency Plan
Appendix 10.7 Organogram
Appendix 10.8 Further details on Project Partners
Appendix 10.9 Further details on the Estimates a Network Licensee Calculated the base case costs
Appendix 10.10 A Summary of the NPV Analysis
Appendix 10.11 Letters of Support
Appendix 10.12 Technical Annex

Appendix 10.01 Page 49 of 100
KEY
Method Method name
Method 1 Unified Power Flow Controller (UPFC)
Method 2 [Not used]
Method 3 [Not used]

Appendix 10.01 Page 50 of 100
Electricity NIC – financial benefits
Scale Method Method Cost
Base Case Cost
Notes Cross-references
2030 2040 2050
Post-trial solution (individual deployment)
Method 1 12.33 11.59 ‐0.23 ‐0.83 ‐1.36
This represents an instance of our Case Study 1, installed in 2019 but without first-of-a-kind costs. Case Study 2 and Case Study 3 examples are net positive in their own right at the scale of am individual installation. The UPFC is modelled with a lifetime of 30 years and sufficient maintenance expenditure to refresh the control systems during its life, based on experience of other power electronic solutions.
The Method Cost is explained in Section 3. An explanation of the Base Cost for Case Study 1, which was used here, is explained in Section 3. All other financial parameters are explained in Appendix 10.10.
Method 2
Method 3
Licensee scale If applicable, indicate the number of relevant sites on the Licensees’ network.
Method 1 24.30 27.19 2.64 3.46 4.05
(Number of sites:_2) This represents one instance of our Case Study 1, and one instance of Case Study 3. In Case Study 3 there are additional benefits from deferring upgrades to assets on the transmission network. The net benefit is extended over time in the event that the solution has a lifetime longer than 30 years.
The analysis of other licence areas is summarised in Section 3. This analysis substantiates our selection of 2 sites (licence area) and 23 sites (GB wide). The quantitative scoring methodology used to analyse WPD’s four licence areas is explained in Appendix 10.10.
Method 2
Method 3
GB rollout scale If applicable, indicate the number of relevant sites on the GB network.
Method 1 257.92 334.06 2.64 34.40 38.95
(Number of sites:_23) This represents:
11 instances of Case Study 1, 1 instance of Case Study 2, and 11 instances of Case Study 3
The three case studies used to develop the business case are described in Section 3. The analysis of network types to support our division of the 23 sites into instances of each case study is described in Appendix 10.10 and Section 3.
Method 2
Method 3

Appendix 10.01 Page 51 of 100
Electricity NIC – capacity released [if applicable]
Scale Method Method Cost
Base Case Cost
Notes Cross-references 2030 2040 2050
Post-trial solution (individual deployment)
Method 1 12.33 11.59 -36 -36 -68 This represents an instance of our Case Study 1, installed in 2019 but without first-of-a-kind costs. UPFC releases capacity of 32MVA and a conventional solution releases capacity of 68MVA. The UPFC is modelled with a lifetime of 30 years, and so its capacity is removed in 2049.
An explanation of the capacity released in Case Study 1, which was used here, is explained in Section 3.
Method 2
Method 3
Licensee scale If applicable, indicate the number of relevant sites on the Licensees’ network.
Method 1 24.30 27.19 -72 -72 -104 (Number of sites:_2) The capacity is retained over time in the event that the solution has a lifetime longer than 30 years. This represents one instance of our Case Study 1, and one instance of Case Study 3. Each of these release the same capacity but Case Study 3 involves upgrades to transmission assets in order to achieve it.
The analysis of other licence areas is summarised in Section 3. This analysis substantiates our selection of 2 sites (licence area) and 23 sites (GB wide). The quantitative scoring methodlogy used to analyse WPD’s four licence areas is explained in Appendix 10.10.
Method 2
Method 3
GB rollout scale If applicable, indicate the number of relevant sites on the GB network.
Method 1 257.92 334.06 -476 -824 -824 (Number of sites:_23) This represents:
11 instances of Case Study 1, 1 instance of Case Study 2, and 11 instances of Case Study 3
The three case studies used to develop the business case are described in Section 3 along with the capacity released by the UPFC and the conventional solution. The analysis of network types to support our division of the 23 sites into instances of each case study is described in Appendix 10.10 and Section 3.
Method 2
Method 3

Appendix 10.01 Page 52 of 100
Electricity NIC – carbon and/or environmental benefits
Scale Method Method Cost
Base Case Cost
Notes Cross-references
2030 2040 2050
Post-trial solution (individual deployment)
Method 1 12.33 11.59 52.5 69.5 74.2 Expressed as 1000's of tonnes CO2 equivalent (ktonnes CO2e) Carbon savings are expressed in gross terms and are not netted off compared with the Base Case solution. Carbon savings are reduced in the event that the UK follows a pathway better than National Grid’s “Slow Progression” pathway, so that carbon intensity of electricity generation is lower than assumed here.
Method 2
Method 3
Licensee scale If applicable, indicate the number of relevant sites on the Licensees’ network.
Method 1 24.30 27.19 83.7 117.7 127.4 (Number of sites:_2) Carbon benefits continue in the event that the solution has a lifetime longer than 30 years
Method 2
Method 3
GB rollout scale If applicable, indicate the number of relevant sites on the GB network.
Method 1 257.92 334.06 118.2 440.8 573.6 (Number of sites:_23) Carbon benefits are modelled on a simplified assumption that all capacity released is used by solar generation. Use by other Low Carbon Technologies (such as Electric Vehicles and heat pumps) and increase in demand from non low carbon sources has not been modelled and may reduce the benefit.
Method 2
Method 3
If applicable, indicate any environmental benefits which cannot be expressed as tCO2e.
The project delivers substantial non-quantified benefits to the wider customer base by avoiding the disruption to landowners and roadworks associated with conventional overhead line and cable construction.

Appendix 10.02 Page 53 of 100
Appendix10.2: Maps
This appendix contains land refencing maps for the two potential trial sites. The maps illustrate the land ownership boundaries around the sites.
Further detail on the land ownership and leaseholders has been researched through the Land Registry. We have included an except with the names of landowners removed, and a full copy is available on request.
The site diagrams show the existing equipment and electricity transmission and distribution lines, along with illustrative site footprints for the two manufacturer’s solutions. The footprints are indicative for size only and do not imply the final location of any trial site.
A. Land referencing map for Evesham trial site Site diagram for Evesham trial site
B. Land referencing map for Stamford trial site Site diagram for Stamford trial site

Appendix 10.03 Page 60 of 100
Appendix10.3: Diagrams
This appendix contains engineering layout single line diagrams for the two potential trial sites and the manufacturer illustrative equipment layouts.
A. Single Line Diagram – Evesham
B. Single Line Diagram – Stamford
C. Manufacturer 1 – Layout Drawing
D. Manufacturer 2 – Layout Drawing

ID Task Mode
Work package
Task Name Duration Start Finish
1 HARP 1226 days Tue 02/01/18 Tue 13/09/22
2 Milestones 1226 days Tue 02/01/18 Tue 13/09/22
3 Project Award 1 day Tue 02/01/18Tue 02/01/18
4 PD1 Project design information pack 1 day Fri 30/03/18 Fri 30/03/18
5 PD2 Tender process completed with supplier under contra1 day Fri 30/11/18 Fri 30/11/18
6 PD3 UPFC installed and connected at trial site 1 day Mon 31/08/20Mon 31/08/20
7 PD4 Trial report 1 (Q1 & Q2) 1 day Mon 01/03/21Mon 01/03/21
8 PD5 Trial report 2 (Q3 & Q4) 1 day Mon 02/08/21Mon 02/08/21
9 PD6 Trial report 3 (Q5 & Q6) 1 day Mon 31/01/22Mon 31/01/22
10 PD7 Trial report 4 (Q7 & Q8) 1 day Thu 30/06/22 Thu 30/06/22
11 PD8 Replicability report 1 day Tue 30/04/19 Tue 30/04/19
12 PD9 Dynamic model of network issues / voltage disturban1 day Thu 30/06/22 Thu 30/06/22
13 PD10 DNO deployment toolset created 1 day Thu 30/06/22 Thu 30/06/22
14 Close down report 1 day Tue 13/09/22 Tue 13/09/22
15 WP1 Project Management & Governance 1219 days Wed 10/01/18Mon 12/09/22
16 Kick‐off meeting 2 days Wed 10/01/18 Thu 11/01/18
17 Project management, progress calls & meetings 1157 days Fri 12/01/18 Mon 20/06/22
18 Monthly Progress Report 1130 days Sun 28/01/18 Sat 28/05/22
72 Quarterly Review 1109 days Sun 28/01/18 Thu 28/04/22
91 Close down report preparation 60 days Tue 21/06/22 Mon 12/09/22
92 WP2 Learning 1174 days Fri 12/01/18 Wed 13/07/22
93 Comms & KM Plan 10 days Fri 12/01/18 Thu 25/01/18
94 Stakeholder workshop 826 days Mon 16/04/18Mon 14/06/21
95 Stakeholder workshop 1 2 days Mon 16/04/18 Tue 17/04/18
96 Stakeholder workshop 2 2 days Mon 15/04/19 Tue 16/04/19
97 Stakeholder workshop 3 2 days Mon 20/04/20 Tue 21/04/20
98 Stakeholder workshop 4 2 days Mon 19/04/21 Tue 20/04/21
99 WPD Balancing Act 786 days Mon 11/06/18Mon 14/06/21
104 LCNI conference presentation 786 days Mon 15/10/18Mon 18/10/21
109 MM Power Electronics Seminar 781 days Wed 21/11/18Wed 17/11/21
114 Conclusion workshop 2 days Tue 12/07/22 Wed 13/07/22
115 WP3 Studies 302 days Fri 12/01/18 Mon 11/03/19
116 Planning studies 30 days Fri 12/01/18 Thu 22/02/18
117 Land referencing 10 days Fri 12/01/18 Thu 25/01/18
118 Land purchase 85 days Tue 13/11/18 Mon 11/03/19
119 Environmental studies 45 days Fri 12/01/18 Thu 15/03/18
120 Planning application preparation 20 days Fri 16/03/18 Thu 12/04/18
121 Outline Planning Application period 40 days Fri 13/04/18 Thu 07/06/18
122 Network Modelling 45 days Wed 07/03/18 Tue 08/05/18
123 WP4 Design 269 days Wed 24/01/18Mon 04/02/19
124 Site Surveys ‐ subcontractor 30 days Wed 24/01/18 Tue 06/03/18
125 UPFC Specification 20 days Wed 31/01/18 Tue 27/02/18
126 Civil & Structural specification 20 days Wed 31/01/18 Tue 27/02/18
127 Design Review/support with contractor 60 days Tue 13/11/18 Mon 04/02/19
128 Design Review #1 2 days Tue 18/12/18 Wed 19/12/18
129 Design Review #2 2 days Tue 29/01/19 Wed 30/01/19
130 WP5 Procurement 184 days Wed 28/02/18Mon 12/11/18
131 Tender preparation 30 days Wed 28/02/18 Tue 10/04/18
02/01
Jan Mar May Jul Sep Nov Jan Mar May Jul Sep Nov Jan Mar May Jul Sep Nov Jan Mar May Jul Sep Nov Jan Mar May Jul1st Quarter 3rd Quarter 1st Quarter 3rd Quarter 1st Quarter 3rd Quarter 1st Quarter 3rd Quarter 1st Quarter 3rd Quart
Task
Split
Milestone
Summary
Project Summary
External Tasks
External Milestone
Inactive Task
Inactive Milestone
Inactive Summary
Manual Task
Duration‐only
Manual Summary Rollup
Manual Summary
Start‐only
Finish‐only
Deadline
Critical
Critical Split
Progress
Appendix 10.4 - Project Plan
Page 1
Project: Project PlanDate: Mon 16/10/17

ID Task Mode
Work package
Task Name Duration Start Finish
132 RFQ released 1 day Fri 08/06/18 Fri 08/06/18
133 Tender period 30 days Mon 11/06/18 Fri 20/07/18
134 Tender assessment 15 days Mon 23/07/18 Fri 10/08/18
135 Tender negotiation & BAFO 45 days Mon 13/08/18 Fri 12/10/18
136 BAFO Assessment 20 days Mon 15/10/18 Fri 09/11/18
137 Contract Award 1 day Mon 12/11/18Mon 12/11/18
138 WP6 Construction & Installation 380 days Tue 13/11/18 Mon 27/04/20
139 Agree outage window with planners 15 days Tue 13/11/18 Mon 03/12/18
140 Contractor design period 60 days Tue 13/11/18 Mon 04/02/19
141 Contractor materials procurement 60 days Tue 05/02/19 Mon 29/04/19
142 Contractor manufacture period 60 days Tue 30/04/19 Mon 22/07/19
143 Contractor FAT 15 days Tue 23/07/19 Mon 12/08/19
144 Shipping 60 days Tue 13/08/19 Mon 04/11/19
145 Detailed Planning Application preparation 15 days Tue 05/02/19 Mon 25/02/19
146 Detailed Planning Application period 40 days Tue 26/02/19 Mon 22/04/19
147 Site Preparation 30 days Tue 12/03/19 Mon 22/04/19
148 Civil works ‐ groundworks & fencing 95 days Tue 23/04/19 Mon 02/09/19
149 Civil works ‐ building 80 days Tue 03/09/19 Mon 23/12/19
150 UPFC Equipment installation on site 90 days Tue 24/12/19 Mon 27/04/20
151 Electrical AIS equipment installation on site 90 days Tue 24/12/19 Mon 27/04/20
152 WP7 Commissioning 70 days Tue 28/04/20 Mon 03/08/20
153 Contractor ‐ Connection to Network 40 days Tue 28/04/20 Mon 22/06/20
154 Contractor ‐ System Test 20 days Tue 23/06/20 Mon 20/07/20
155 Site Acceptance Test 10 days Tue 21/07/20 Mon 03/08/20
156 WP8 Trial Design 60 days Tue 05/02/19 Mon 29/04/19
157 Trials design 60 days Tue 05/02/19 Mon 29/04/19
158 WP9 Trial Execution 495 days Tue 04/08/20 Mon 27/06/22
159 Configuration & set‐ up 10 days Tue 04/08/20 Mon 17/08/20
160 Q1 trial period ‐ checks and analysis 50 days Tue 18/08/20 Mon 26/10/20
161 Reconfiguration & set up 10 days Tue 27/10/20 Mon 09/11/20
162 Q2 trial period ‐ checks and analysis 50 days Tue 10/11/20 Mon 18/01/21
163 Trial report 1 (Q1 & Q2) 15 days Tue 19/01/21 Mon 08/02/21
164 Reconfiguration & set up 10 days Tue 19/01/21 Mon 01/02/21
165 Q3 trial period ‐ checks and analysis 50 days Tue 02/02/21 Mon 12/04/21
166 Reconfiguration & set up 10 days Tue 13/04/21 Mon 26/04/21
167 Q4 trial period ‐ checks and analysis 50 days Tue 27/04/21 Mon 05/07/21
168 Trial report 2 (Q3 & Q4) 15 days Tue 06/07/21 Mon 26/07/21
169 Reconfiguration & set up 10 days Tue 06/07/21 Mon 19/07/21
170 Q5 trial period ‐ checks and analysis 50 days Tue 20/07/21 Mon 27/09/21
171 Reconfiguration & set up 10 days Tue 28/09/21 Mon 11/10/21
172 Q6 trial period ‐ checks and analysis 50 days Tue 12/10/21 Mon 20/12/21
173 Trial report 3 (Q5 & Q6) 15 days Tue 21/12/21 Mon 10/01/22
174 Reconfiguration & set up 10 days Tue 21/12/21 Mon 03/01/22
175 Q7 trial period ‐ checks and analysis 50 days Tue 04/01/22 Mon 14/03/22
176 Reconfiguration & set up 10 days Tue 15/03/22 Mon 28/03/22
177 Q8 trial period ‐ checks and analysis 50 days Tue 29/03/22 Mon 06/06/22
178 Trial report 4 (Q7 & Q8) 15 days Tue 07/06/22 Mon 27/06/22
179 Close down and disconnection 10 days Tue 07/06/22 Mon 20/06/22
Jan Mar May Jul Sep Nov Jan Mar May Jul Sep Nov Jan Mar May Jul Sep Nov Jan Mar May Jul Sep Nov Jan Mar May Jul1st Quarter 3rd Quarter 1st Quarter 3rd Quarter 1st Quarter 3rd Quarter 1st Quarter 3rd Quarter 1st Quarter 3rd Quart
Task
Split
Milestone
Summary
Project Summary
External Tasks
External Milestone
Inactive Task
Inactive Milestone
Inactive Summary
Manual Task
Duration‐only
Manual Summary Rollup
Manual Summary
Start‐only
Finish‐only
Deadline
Critical
Critical Split
Progress
Appendix 10.4 - Project Plan
Page 2
Project: Project PlanDate: Mon 16/10/17

Appendix 10.5: Risk Register
High Level Definition Cause Effect"There is a risk that..." Review Date "...because of..." "...leading to..."
Next No.Dropdown
list
1=Timebound/One-off2=Ongoing/Recurring
3=Not started
Responsible formgmt.
Details of the RiskScore 1-5
(see guide)Score 1-5
(see guide)Score 1-5
(see guide)Auto
CalculatedWho raised
the Risk?when was it
raised?
When does this risk becomerelevant (e.g.: installation
risks will not occur until theafter the procurement
process)
Target Datefor
Resolution
Last date therisk wasupdated
Date risk ratingshould be reviewed
What will Trigger the Risk?What will happen if it
occurs?How will this Risk be avoided?
R001 Raised 1 PDThe electrical location selected for the UPFC installation is sub-
optimal3 3 2 18 PD 30/05/2017 31/05/2017 23/06/2017 31/07/2017 31/12/2018
Errors in analysis, assumptions ordata on network rating
Reduced benefit inbusiness case
1. Request line rating information2. Independent check and approval of line construction and rating information
R002 Raised 1 PDThe business case is double counting the benefit of swinging active
power and providing reactive power5 3 4 60 PD 30/05/2017 31/05/2017 07/08/2017 31/07/2017 30/09/2017 Errors in analysis or assumptions
Reduced benefit inbusiness case
1. Independent analysis outside of immediate Mott MacDonald team of modellingassumptions
R003 Raised 1 PDVoltage disturbances tripping off distributed generators are not an
issue on the network3 4 4 48 PD 30/05/2017 31/05/2017 23/06/2017 31/07/2017 30/09/2017 Lack of evidence of occurrence
Reduced benefit inbusiness case
1. Will be carried out as a demonstration only.2. Early discussion with WPD of running arrangements at Feckenham which wouldallow this feature to be demonstrated.3. Walpole (reserve) site as a mid-line location is easier to demonstrate.
R004 Raised 1 PD The UPFC is not able to resolve or reduce voltage disturbances 3 4 3 36 PD 30/05/2017 31/05/2017 31/03/2018 31/07/2017 31/03/2018Inability to model management of
voltage disturbanceReduced benefit in
business case1. Develop specific (dynamic) model to determine management of voltage disturbances2. Independent review of model assumptions and outcomes
R005 Raised 1 PDDistributed generators are willing to wait (and pay for)
overheadline or underground cable reinforcement5 3 3 45 PD 30/05/2017 31/05/2017 23/06/2017 31/07/2017 30/10/2017
No evidence that distributedgenerators are willing to pay for line
reinforcement to achieve a timelyconnection
Undermining of businesscase
1. Project sites have been moved to locations which require strategic reinforcement tomeet P2/6 or where customer-funded reinforcement is prohibitive.2. Continue to monitor the connections market via WPD stakeholder events.
R006 Raised 1 PD The business case cost-benefit analysis returns an incorrect result 3 3 2 18 PD 30/05/2017 31/05/2017 23/06/2017 31/07/2017 30/09/2017 Errors in formulae or assumptions Errors in business case 1. Independent analysis of modelling assumptions and calculations
R007 Raised 1 PD UPFC capacity is used more quickly than expected 5 3 1 15 PD 30/05/2017 31/05/2017 31/12/2018 31/07/2017 31/12/2018Distributed generation growth being
faster than expectedReduced benefit in
business case
1. Modelling of uptake in renewables and methodology available for SWales and Swest2. Similar analysis for Midlands likely to be complete by WPD before funding award.3. Continue to monitor levels of connections activity in the trial regions
R008 Raised 1 PDThis project's access to trading reactive power (and the resultingincome stream) is the first time such an approach has been used
3 4 4 48 PD 30/05/2017 31/05/2017 23/06/2017 31/07/2017 30/09/2017National Grid has not purchased
reactive power before
The project would need tobe estlablished as atransparent "pilot"
alongside pilots endorsedby the GBSO
1. Discussion already held with National Grid regarding status as an innovation "pilot".2. National Grid consultation on ancillary services launched with end Septemberconclusion.
R009 Raised 1 PDBusiness case savings do not accrue to WPD (i.e. distribution)
customers4 3 1 12 PD 30/05/2017 31/05/2017 23/06/2017 31/07/2017 30/06/2018
Higher proportion ofsavings/benefits accrue to
transmission network
Reduced benefit inbusiness case
1. Specific analysis of power system model2. Specific analysis of cost-benefit model
R010 Raised 1 PDThe cost of circuit (line or cable) reinforcement is lower than
assumed in the cost-benefit model3 3 4 36 PD 30/05/2017 31/05/2017 23/06/2017 31/07/2017 30/09/2017
Lack of evidence of linereinforcement costs
Reduced benefit inbusiness case
1. WPD to review line reinforcement cost estimates2. Independent review of level of reinforcement required assumptions.
R011 Closed 1 PD Too few suppliers respond to procurement RFI/RFQ 5 4 4 80 PD 30/05/2017 31/05/2017 21/06/2017 30/05/2017 Lack of interest or lack of product
Unable to proceed withproject as unable to
provide sufficientconfidence in NIC
submission
1. Review RFI tracking2. Contact other suppliers to ensure aware of RFI
R012 Raised 1 PDUnable to identify or secure a physical site for UPFC installation at
preferred trial sites5 4 3 60 PD 30/05/2017 31/05/2017 21/08/2017 31/07/2017 21/08/2017
Land referencing unable to identifyappropriate site or availability
Alternative sites to beidentified, delaying
project
1. Land referencing analysis prior to NIC submission2. Engagement with WPD consents team and (if they advise) engagement with landowner prior to NIC award
R013 Raised 1 PD UPFC installation building/shelter costs increase 3 3 2 18 PD 30/05/2017 31/05/2017 30/06/2018 31/07/2017 31/03/2018More complex building required
(HVAC etc) or market costs(materials/labour) increase
Increased projectimplementation costs and
reduced business casebenefit
1. Triangulation of cost estimates (WPD, MM experience of other substation clients,etc)2. Carry out site surveys (geotechnical) and provide to bidders at tender stage.
R014 Raised 1 PD UPFC installation groundworks and earthing grid costs increase 3 3 2 18 PD 30/05/2017 31/05/2017 30/09/2017 31/07/2017 30/09/2017More complex ground
works/earthing required or marketcosts (materials/labour) increase
Increased projectimplementation costs and
reduced business casebenefit
1. Triangulation of cost estimates (WPD, MM experience of other substation clients,etc)2. Carry out site surveys (geotechnical) and provide to bidders at tender stage.3. Mott MacDonald to carry out "Front End Engineering Design" to create a robusttender pack for bidders to price.
R015 Raised 1 PD UPFC installation telecoms and IT costs increase 3 3 2 18 PD 30/05/2017 31/05/2017 30/06/2018 31/07/2017 30/09/2017More complex telecom and IT
infrastructure required or marketcosts (labour) increase
Increased projectimplementation costs and
reduced business casebenefit
1. Triangulation of cost estimates (WPD, MM experience of other substation clients,etc)2. Carry out site surveys (geotechnical) and provide to bidders at tender stage.3. Mott MacDonald to carry out "Front End Engineering Design" to create a robusttender pack for bidders to price against.
R016 Raised 1 PDUnable to substantiate UPFC future cost reductions (economy of
scale)4 3 1 12 PD 30/05/2017 31/05/2017 23/06/2017 31/07/2017 30/06/2018 Lack of cost information
Reduced benefit inbusiness case and reduced
confidence in projectviability
1. Continue to monitor industry references (e.g. ENTSO-E) and OEM cost estimatesthroughout the project
Risk Ref. No. Raised byRatingProximityProbabilityImpactRisk Frequency OwnerRisk Status Raised on Target Date Last Updated Mitigation Action PlanRisk Start Date

Appendix 10.5: Risk Register
High Level Definition Cause Effect"There is a risk that..." Review Date "...because of..." "...leading to..."
Next No.Dropdown
list
1=Timebound/One-off2=Ongoing/Recurring
3=Not started
Responsible formgmt.
Details of the RiskScore 1-5
(see guide)Score 1-5
(see guide)Score 1-5
(see guide)Auto
CalculatedWho raised
the Risk?when was it
raised?
When does this risk becomerelevant (e.g.: installation
risks will not occur until theafter the procurement
process)
Target Datefor
Resolution
Last date therisk wasupdated
Date risk ratingshould be reviewed
What will Trigger the Risk?What will happen if it
occurs?How will this Risk be avoided?
Risk Ref. No. Raised byRatingProximityProbabilityImpactRisk Frequency OwnerRisk Status Raised on Target Date Last Updated Mitigation Action PlanRisk Start Date
R017 Raised 1 PDToo many functions for the UPFC to perform at any one time
(operating regime)4 3 2 24 PD 30/05/2017 31/05/2017 23/06/2017 31/07/2017 30/06/2018
1. UPFC can only manage one powerflow tasks at any given time
2. Lack of SCADA information toconfigure UPFC
Conflict between tasks orsub-optimal performance
against networkconditions
1. Conservative assumption used that reactive power will only be required during earlyhours of the morning.2. Use half-hourly SCADA data for previous years to analyse any potential conflicts earlyin the project.
R018 Raised 2 PD Obtaining planning permissions (consents) take longer 4 3 3 36 PD 23/06/2017 28/01/2018 21/08/2017 31/07/2017 30/09/2017Local authority planning cycle
and/or additional/updatedsubmissions required
delay in procurement withconsequential delay ininstallation and trials
1.Carry out desktop environmental and planning review at two candidate sites.2. Planning requirements in Communications plan (RACI)3. Schedule contingency for planning approvals
R019 Raised 2 PD Environmental surveys take longer 4 3 3 36 PD 23/06/2017 28/01/2018 21/08/2017 31/07/2017 30/09/2017Increased land area purchase toobtain site or special conditions
identified
Delay in procurement withconsequential delay ininstallation and trials
1. Carry out desktop environmental and planning review at two candidate sites.
R020 Raised 2 PD Equipment manufacture and delivery take longer 4 2 1 8 PD 23/06/2017 30/03/2019 30/06/2019 31/07/2017 31/03/2018Lack of availability of
materials/delivery distance (Asia)
Delay in procurement withconsequential delay ininstallation and trials
1. Project timetable in tender2. Delivery guarantees/incentives/penalties in contract
R021 Raised 2 PD Control system software design and delivery take longer 4 3 1 12 PD 23/06/2017 30/03/2019 30/06/2018 31/07/2017 31/03/2018 Project specific requirementsDelay in procurement with
consequential delay ininstallation and trials
1. Project timetable in tender2. Delivery guarantees/incentives/penalties in contract
R022 Raised 2 PD WPD planned outage schedule changes 3 2 3 18 PD 23/06/2017 30/06/2019 30/09/2019 31/07/2017 31/12/2017Other network requirements and
constraints
Delay in procurement withconsequential delay ininstallation and trials
1. Early request for outage to ensure request is in the system as soon as possible2. Early engagement with WPD network planners3. WPD network planners in Comms Plan as stakeholder
R023 Raised 2 PDAdditional data/time is required for a trial function to provide
confidence in findings3 3 1 9 PD 23/06/2017 30/03/2020 31/12/2018 31/07/2017 30/06/2018
Network performance/conditionsdoes not provide sufficient
instances of event to control
Delay/deferment/cancellation of other functional
trials
1. Two-year trial period to cover all seasons and demand profiles2. Weekly data review to confirm achieved data sets3. Quarterly trial reconfiguration to enable re-plan of activity to meet deficient dataareas
R024 Raised 2 PDAdditional effort required on site to resolve commissioning or trial
issues3 3 1 9 PD 23/06/2017 30/09/2019 30/03/2020 31/07/2017 31/12/2018
Problems in commissioning, SAT ortrial set-up
Delay / deferment /cancellation of other
functional trials
1. FAT to replicate network conditions as far as possible2. Contingency in effort planning
R025 Raised 2 PD Learning requirements inadequately identified 3 3 2 18 PD 23/06/2017 30/03/2018 30/06/2018 31/07/2017 30/06/2018Inexperience of project team inquality/type of learning capture
required
Failure to meet learningperformance objectives
and thus milestonepayment
1. Mobilisation to include learning requirements workshop with WPD2. Knowledge Management and Communications plan to document learningresponsibility and requirements3. Progress reports to include learning section
R026 Raised 2 PD Learning deliverables quality is unsatisfactory 4 4 1 16 PD 23/06/2017 30/06/2018 30/06/2018 31/07/2017 28/02/2018
Inexperience of project team inrecording & producing quality/type
of learning deliverable output(recording, capturing,content/style/format)
Failure to meet learningperformance objectives
and thus milestonepayment
1. Mobilisation to include Ofgem learning requirements workshop (with WPD?)2. Knowledge Management and Communications plan to document learningresponsibility and requirements3. Progress reports to include learning section
R027 Raised 2 PDThe payment profile against milestones creates significant cost of
capital (UPFC CAPEX recovery)4 4 4 64 PD 23/06/2017 29/07/2017 07/08/2017 31/07/2017 30/09/2017
Ofgem rejects project payment plan/ cost split across objectives
WPD cost1. WPD input to "Section 9: Project Deliverables" milestone planning2. Cost of capital included in WPD project costs
R028 Raised 1 PDSupply chain unable to UPFC and ancillary works on a turn-key
basis2 2 2 8 PD 29/06/2017 31/03/2018 31/03/2018 31/07/2017 31/12/2017 Tender issued
Delay whilst re-factoringas equipment supply and
civils contracts
1. Keep manufacturers who responded to RFI abreast of progress.2. Early engagement with supply chain following funding award.
R029 Raised 1 PDUPFC price increases at tender above highest price already
received at RFI5 2 2 20 PD 29/06/2017 31/03/2018 30/06/2018 31/07/2017 31/03/2018 Tenders returned.
Significant re-planning tounderstand whether
project can meet budget.
1. Requested within the RFI that manufacturers stated whether they had applieddiscounts.2. None had at this stage, suggesting prices should move downwards.

Appendix 10.5: Risk register
Ref No. Status Owner Assumption Date Raised Expiry Date Comments Review Date by OwnerReview Date by Project/
Programme BoardDate Closed
WstmImpacted
Next No. Drop-DownResponsible for
mgmntDetails of Assumption Date identified
Date ofExpiry
Status CommentsDate last reviewed by
OwnerDate last reviewed Date Closed
WorkstreamImpacted
A001 Raised PD Planning is a minor planningapplication as <1 hectare and below
220kV
29/06/2017
1 of 1

Appendix 10.06 Page 71 of 100
Appendix 10.6: Contingency plan
Mott MacDonald has developed and maintained a risk register during the bid phase and which has informed Review Point meetings held with Western Power Distribution (WPD).
The risk register, attached as Appendix 10.5, scores risks according to their impact on a score of 1-5, probability on a score of 1-5 and proximity in time. Proximity is weighted from a score of 5 for risks potentially materialising within the next 1 week, to a score of 1 for risks which will not materialise for at least a year. The highest score on this scale is 5 x 5 x 5 = 125.
Mott MacDonald has active contingency plans in place for each of the highest rated risks scoring between 60-80 points, as set out below. These contingency plans will be updated on an ongoing basis throughout the project.
In the event that a contingency plan has to be executed, a mobilisation meeting will be held to review and refine the contingency plan. This will agree the approach, maximise knowledge capture from the change of circumstances and assess potential opportunities.
Too few suppliers respond to procurement RFI/RFQ (risk R011)
We have sought to mitigate this risk by engaging early on with the supply chain and issuing a Request for Information (RFI) with a full set of project and procurement timelines to potential manufacturers.
If one or more of the existing manufacturers were to exit the process, or new information comes to light which raises doubts about their suitability to deliver, WPD and Mott MacDonald will seek in the first instance to communicate with the manufacturer and address the concerns raised. Our contingency plan will pre-qualify additional manufacturers through the standard procurement processes. If new manufacturers do not come forward, the project can be halted during H1 2018 with limited expenditure.
Unable to identify or secure a physical site for UPFC installation at preferred trial sites (risk R012)
We have sought to mitigate this risk by both seeking different trial locations within WPD’s West Midlands, East Midlands and South Wales licence areas. At the short-listed locations, we have sought WPD’s recommendations on potential sites which are both electrically suitable and stand a good chance of success. Other sites were ruled out where WPD knew of other development taking place on existing greenfield sites, meaning that they will no longer be available, or where landowner consents have been difficult.
We have designed our project plan such that outline planning approval and land purchase are carried out prior to tender. In the event that these cannot be achieved, the project can be halted with no contractual commitments to manufacturers. Learning and procurement documentation templates will still be available from the tender document preparation and planning application as reference tools for future projects. A post project
Appendix 10.06 Page 72 of 100
review will be held to capture knowledge developed and lessons learned which can be applied in future.
The business case is double counting the benefit of swinging active power and providing reactive power (risk R002)
We currently assume a reactive power service which is available for some hours of each day, and for some seasons of the year, would be acceptable and attractive to the System Operator. This assumption allows us to be confident that we are not double-counting benefits from services which need to be delivered at the same time and are calling on the UPFC with conflicting requirements.
As an option, we have sought and received indicative layouts from manufacturers for installations which provide a UPFC augmented by conventional reactive power equipment. Most manufacturers of UPFC are also able to provide conventional reactive power equipment. As such, in the case that the System Operator is only able to accept services on a 24/7 basis, our contingency plan would be to model the business case for, but not build, a UPFC augmented by reactive power compensation. This will allow the System Operator and other DNOs to evaluate the suitability of this alternative solution for a large-scale roll-out, and rely on the HARP project to demonstrate the technical suitability of the UPFC device itself.
The payment profile against milestones creates significant cost of capital (UPFC CAPEX recovery) (risk R027)
We have proposed a division of milestones in Section 9 which reflects the high expenditure during the manufacturing and installation phase. If this payment profile is not acceptable to the expert panel, we will seek to negotiate performance bonds, payment milestones, and liquidated damages for the construction phase and/or performance incentives for the operational phase in order to meet the Expert Panel’s requirements whilst achieving a reasonable commercial position for WPD. If this cannot be achieved, Mott MacDonald and WPD would seek to submit a change request to Ofgem which demonstrates that the position that we have reached is reasonable and remains in the best interest of customers.

Appendix 10.07 Page 73 of 100
Appendix10.7: Organogram
The organisation chart shows the project team structure, including named lead staff:

Appendix 10.08 Page 74 of 100
Appendix10.8: Further details of Project Partner
Mott MacDonald is a global management, development and engineering consultancy with over 50 years expertise in power sector engineering across both electricity transmission and distribution and in renewable and thermal energy generation. Their energy division is headquartered in Brighton, with principal offices in Glasgow, Altrincham and York.
Mott MacDonald is a specialist energy framework supplier for the Department of Business, Energy and Industrial Strategy. They have been a long-term alliance partner and key framework supplier to National Grid for sub-station and cable design, design assurance and installation works.
Mott MacDonald has significant experience in power electronic solutions: Within the UK they are technical advisor to the ElecLink Channel Tunnel interconnector project, preparing the specification and tenders, and are now supervising construction and installation of the link. They prepared the tender evaluation process for the Western Link High Voltage Direct Current link and carried out design assurance of civil works, control and protection. Mott MacDonald has also provided feasibility studies and advice to Npower Renewables on power electronic solutions for reactive power compensation and for the interconnection to the mainland of Gywnt Y Mor off-shore wind farm.
Mott MacDonald will act as programme manager and principal designer for the HARP project. Mott MacDonald will support WPD’s operations team during equipment installation, acceptance, commissioning and operation. They will work alongside WPD’s innovation team to present and disseminate the findings.
Specifically, Mott MacDonald will prepare the design and survey specifications and technical tender documentation and assist in the tender evaluation. Following contractor selection Mott MacDonald will work with the selected manufacturer to finalise the specification of the equipment, carry out detailed design and then to oversee factory testing, on-site construction and commissioning to manage compliance with the against the project schedule, cost and performance criteria. They will design the trial plan, oversee trials and analysis and will prepare reports and conclusions.
A breakdown of Mott MacDonald’s project engineering effort by grade is illustrated below. The listing of the Work Packages can be found in section 6.1.2, Figure 6.2.
This effort is being provided under a fixed fee arrangement of £1.114million excluding expenses. Mott MacDonald is contributing £134,424 to the project, which equates to 12% of their fee to the project. This contribution is made through:
• £17,025 of project management time to routine project manager activity support
• £15,735 of engineering time for network studies and model development
• £7,315 of their Knowledge Manager’s time to assist the learning and dissemination activity and production of knowledge products
• £94,349 through using fees at significant discount to market rates.

Appendix 10.08 Page 75 of 100
WP1 WP2 WP3 WP4 WP5 WP6 WP7 WP8 WP9 Total %
A 63 18 81 5% B 17 8 3 5 2 12 47 3% C 219 47 18 44 50.5 52 22 30 112 594.5 36% D 15 22 44 46 18 62 40 30 388 665 40% E 2 22 5 5 8 30 80 152 9% F 32 12 2 4 4 54 3% G 36 16 1 3 3 2 4 65 4%
Total 382 125 88 100 85.5 128 64 90 596 1658.5 % 23% 8% 5% 6% 5% 8% 4% 5% 36%
Table 10-8.1: breakdown of Mott MacDonald effort (days)
Figure 10-8.1: Breakdown of Mott MacDonald project team effort The cost of each grade has been benchmarked and discounted against framework rates for other UK Government and UK utility companies:
OFGEM (2015)
SONI (2016)
SSE (2016)
Average Commercial
Rate
Discounted HARP
(2018) A Partner / Director £1250 £1200 £1225 £1,080 B Principal Consultant £950 £960 £850 £920 £875 C Senior Consultant £850 £809 £750 £803 £775 D Consultant £665 £590 £650 £635 £570 E Graduate £450 £500 £475 £385 F Draughtsperson - £385 G Subject Matter Expert £1095 £1120 £1107.50 £1,030
Table 10-8.3: Mott MacDonald project rates comparison
Contractual Arrangement

Appendix 10.08 Page 76 of 100
Mott MacDonald has prepared the HARP NIC submission under a contractual Collaboration Agreement. WPD have issued a Letter of Intent to appoint Mott MacDonald as programme manager and engineering advisor once the HARP project has been selected. Outline contractual terms have been discussed between the two companies.
Royalties
We did not require manufacturers to commit to a royalties arrangement within our Request for Information (RFI). In some cases, movement on other items such as delay damages may be more beneficial to GB consumers (protecting them from expenditure during the project itself) than royalties (which depend upon future revenues). As such we propose to negotiate these items as a package with manufacturers.
Mott MacDonald offer the following royalties arrangement on overseas sales:
Cumulative non-UK revenues earned (on UPFC design projects which are net profitable after tax)
Royalty returned (% of Mott MacDonald revenue
£0k - £250k equivalent 0% £250k - £1m equivalent 2% In excess of £1m equivalent 4%
Table 10-8.4: Mott MacDonald royalty arrangement
The royalties arrangement will start from the point at which the HARP project reaches its commissioning milestone (deliverable 3 set out in the table in Section 9). It will apply to all non-UK projects which have specifically selected UPFCs for further study or design. It will apply exclusively to the Mott MacDonald revenues (costs plus profits excluding local taxes) earned from the client’s UPFC project and will not apply to the wider project spend by the overseas client (for example, the expenditure in purchasing a UPFC itself).
The royalty will not be payable until and unless all Mott MacDonald’s costs have been recovered on a project, but the royalty will be paid before Mott MacDonald retains any profit from a project.
As a worked example, where Mott MacDonald have been paid £750k by clients the royalty will be 2% of this £750k revenue, so £15,000. The royalties arrangement will continue for five years, or the point at which the last Network Innovation Competition Funding Direction is issued, whichever is sooner.
Royalties will be paid to WPD in arrears and will be distributed to customers through the NIC royalties arrangement. Royalties will be paid following receipt of the final payment from the client with respect to each overseas project. Royalties will be calculated in the local currency in which the work was charged and after any applicable taxes related to that jurisdiction. Mott MacDonald will pay the royalty in GBP sterling in the prevailing exchange rate calculated on the date of payment received from the overseas client, to reflect its exposure to exchange rates.
We are not able to extend this royalty to “optioneering” projects. A large number of projects may require UPFCs to be considered as one of many solutions in the study, and we are not able to forecast or control the amount of work that this would generate.

Appendix 10.09 Page 77 of 100
10.9 Selection of Base Case
This Appendix discusses technologies able to provide similar technical capabilities to theUnified Power Flow Controller. It explains why we have used conventional reinforcementas the Base Case rather than these alternative technologies.
Alternative solutions capable of providing management of active power flow
Two technologies capable of being used to manage active power flow are ThyristorSwitched Series Capacitors (TSSC) or a phase-shifting transformer (PST). A TSSC is onlyable to reduce the impedance of an overhead line and not increase it. As such, it has lesscapability than a PST or UPFC. We concentrate this discussion on the PST.
PSTs or quadrature boosters are in use on the 132kV transmission network in Scotland,on circuits between Erochty and Tummel (two units), on the circuit from Beauly to Shin(two units), on the circuit from Erochty to Killin, and at Fiddes on the Scottish Hydrotransmission network, and at Tongland substation on the Scottish Power network. A PSThas also been installed at 33kV on UK Power Networks’ distribution network.
Based on budgetary pricing received from four manufacturers, the price of a 132kVquadrature booster with similar power flow control capabilities as the series section ofthe UPFC we are proposing costs £2.25m - £3.5m, including commissioning butexcluding civils works, ancillary switchgear and road transport from a UK port to thesubstation. We quantified the civil works based on dimensions provided alongside thebudgetary pricing and quantified the ancillary switchgear based on a typical arrangementof circuit breakers and disconnectors specified by National Grid. Using the same unitcosts for land, switchgear and civil works as we used to develop our UPFC proposal, anda budget of £0.25m for the necessary control system integration, we estimate the“turnkey” cost of installing a 132kV quadrature booster to be £5.0m - £6.3m.
Consideration 1: Range of control required
We set out in Section 3 the approach by which we analysed the DNO’s networks andidentified rings which run from one Grid Supply Point (GSP) to another or from one GridSupply Point (GSP) back to itself. The role of an active power flow device, whether a PSTor the UPFC is to adjust the flow of power by either, in the case of a TSSC, adjusting theimpedance of the circuit, or in the case of PST or the UPFC by inserting a voltage acrossa transformer connected in series with the circuit. We modelled a UPFC in a sample ofcases, and modelled a UPFC and a PST in an identical case on the ring at Walpole.
As we studied the voltage necessary to influence power flows, it became clear that theangle of the voltage which the UPFC injected across the series transformer was differentin different cases. The table on the next page shows an example from the section of thering at Walpole running from Walpole via substations at South Holland, Spalding,Bourne, or Stamford. The phase angle is measured as the phase angle of the voltagedeveloped across the series transformer with the sending end of the overhead line andthe Walpole busbar having a phase angle zero degrees. Depending on where capacity isrequired, the optimal phase angle varies from 70 degrees to 100 degrees.
Other studies were carried out with the UPFC sited on other rings, and depending on thesimulation scenario, showed variations of 150-180 degrees, 315-355 degrees, and 140-320 to optimise capacity on the surrounding circuits and according to where new

Appendix 10.09 Page 78 of 100
demand or new requests for generation connections arose. We also show in the table theinjected voltage magnitude to have greatest effect. When generation is not generating,the UPFC would reduce the injected voltage magnitude and change the phase angle tocarry out another function, such as reducing the energy lost to heating effects in lines.
Aim: Manage flow on the ring running from South Holland back to Walpole
Substation Generationadded
Injectedvoltage angle
Injected voltagemagnitude
South Holland 40 MW @ 0.95 pf 70 0.09 p.u.
Spalding 49 MW @ 0.95 pf 70 0.09 p.u.
Bourne 65 MW @ 0.95 pf 70 0.09 p.u.
Stamford 80 MW @ 0.95 pf 95-100 0.09 p.u.
Another example of our simulations is shown below. In this case a single phase anglewas appropriate, but not one that is readily available from a PST:
Aim: Manage flow on the underground cable from Evesham to Feckenham
Substation Generationadded
Injectedvoltage angle
Injected voltagemagnitude
Pershore 100 MW @ 0.95 pf 220 0.08
Strensham 70 MW @ 0.95 pf 220 0.08
Evesham 40 MW @ 0.95 pf 220 0.08
The limitations associated with PSTs are that:
· they are wound three-phase components and can only be purchased in phaseangle increments of 30degrees, according to the arrangement of the windings.
· a PST once purchased is only able to vary the magnitude not the phase angle ofthe voltage which it introduces across the series transformer. A UPFC is able tocontrol both magnitude and phase of this introduced voltage.
We explicitly modelled a PST operating in an identical case as the simulations above,managing the flow from South Holland back to Walpole. Different units with windingarrangements of 30degrees, 60degree, 90 degrees and 120 degrees were modelled:
Substation 30 degrees 60 degrees 90 degrees 120 degreesSouth Holland 28 MW @ 0.95pf 39 MW @ 0.95pf 37 MW @ 0.95pf 21 MW @ 0.95pf
Spalding 34 MW @ 0.95pf 48 MW @ 0.95pf 46 MW @ 0.95pf 28 MW @ 0.95pf
Bourne 45 MW @ 0.95pf 63 MW @ 0.95pf 58 MW @ 0.95pf 35 MW @ 0.95pf
Stamford 62 MW @ 0.95pf 66 MW @ 0.95pf 80 MW @ 0.95pf 56 MW @ 0.95pf
In this case a choice of a winding arrangement of 90 degrees would have deliveredsimilar benefit to the UPFC. In general, the closest available winding arrangement maylimit capacity by up to 10-20MW per substation compared to an “optimum” angle.

Appendix 10.09 Page 79 of 100
Consideration 2: Dynamic response in the event of an outage
Our case studies discussed in Section 2.2 concern rings on the 132kV or 66kV networkformed of overhead lines (at Walpole) or both overhead lines and cable (at Evesham).
The convention amongst the UK Distribution Network Operators (DNOs) is thatdistributed generation is able to be accommodated to the full (duplicate) capacity of thecircuit. In the case of rings, this means that generation can be added to the extent thatboth directions around the ring are fully loaded. In the case of demand, each side of thering is only loaded to half of its capacity to ensure that demand can be fed from theother side of the ring in the event of a fault.
As such, the capacity of the overhead lines forming the ring or parts of the ring affect:
· The amount of distributed generation that would potentially have to be removed(tripped) following a fault on the ring;
· The amount of demand which can be supported by the ring.
Overhead lines when fully loaded heat up over a timeframe of tens of minutes, duringwhich they expand and sag, meaning that they are closer to the ground. In extremescenarios this may permanently damage the line through annealing the metal of theconductor. For the rare occasions on which a fault occurs, a level of risk that the weatheris adverse and preventing the line from cooling, and that a sufficiently tall vehicle, or aperson carrying implements, is passing underneath and could come close enough to the(now lower hanging) line to cause a flash-over is agreed in the industry to be acceptable.
Western Power Distribution is thus able to operate 132kV and 66kV overhead lines witha higher capacity or “rating” following a fault. In the case of a typical construction(175mm2 Lynx ACSR) operating in the summer, this rating is 7% higher than the intactrating and is 465A. Western Power Distribution stipulate the additional load on the lineshould be reduced “as soon as practicable” and in any circumstance within 24hours. Thisis documented within the Company Directive “Standard Technique SD8A/2: Relating torevision of overhead line ratings”, and goes some way to minimising the amount ofgeneration which would have to be removed, and increasing the amount of demandwhich can be supported.
National Grid (the transmission operator) go one step further and point out that if theline is not running at full capacity prior to the fault, it is therefore not operating at its fulldesign temperature. It will therefore take longer before the heating effect has causedthe line to sag. This is documented in Technical Guidance Note TGN(E) 26 “Currentratings for overhead lines”.
To give an example from this document, the same conductor (1x175mm2 Lynx operatingat 132kV) line will have a post-fault continuous rating which of 465A, identical to theWPD calculation. Loads of up to 625A can be place upon the line if the line was runningat only 84% of its original capacity before the fault, and if the load can be certain to beremoved within 3 mins. Loads of up to 495A can be placed upon the line if the load canonly be certain to be removed within 10 mins. Loads up to 470A can be placed upon theline if the load can only be certain to be removed within 20 mins.
A quadrature booster, even with automated control, cannot guarantee to operate within3 minutes, since the number of taps required will depend on the tap setting in which the

Appendix 10.09 Page 80 of 100
device finds itself when the fault occurs. As such it is likely to be limited to a 10 minuterating. A quadrature booster without automated control and relying on manual controlvia SCADA from the control room could only be expected to operate within 20 mins.
A UPFC could be guaranteed to operate within 3mins. It therefore is able to supportgreater amounts of renewable generation and demand, knowing that a fast-actingmethod is available to reduced load on overhead lines following a fault and ensuring thatthe line can be brought back within its post-fault continuous rating. In the exampleabove, the difference between a 3 minute rating of 625A and a 10 minute rating of 495Ais equivalent to 30MVA of generation or demand which can be supported.
The cable sections within a ring have a slower thermal time constant and are unlikely tobenefit in the same way. The exception is where cables have been designed to run closerto their maximum load during normal operation than the overhead lines on the ring, inwhich case their time to reach critical temperature may also need to be considered.
Consideration 3: Dynamic response in the event of voltage disturbance
Since they are mechanical devices, PSTs are not able to introduce a voltage across theseries transformer which can change rapidly enough to counteract the effects of voltagedisturbances occurring on the network.
Alternative solutions able to provide reactive power statically and dynamically
The most comprehensive device able provide reactive power both on a steady-statebasis and on a dynamic basis to assist with voltage fluctuations is a STATCOM.
Based on budgetary pricing received from four manufacturers, the price of a 132kVSTATCOM with similar reactive power capabilities as the shunt section of the UPFC weare proposing costs £3.3m - £4.8m, including the interfacing transformer but excludingcivils works, ancillary switchgear and road transport from a UK port to the substation.Using the same unit costs for land, switchgear and civil works as we used to develop ourUPFC proposal, and a budget of £0.25m for the necessary control system integration, weestimate the “turnkey” cost of installing a 132kV STATCOM to be £5.7m - £7.22m.
A STATCOM is not able to provide support to active power flow along the line, since it isconnected as a shunt device.
Conclusions
We conclude that the most comprehensive alternative remains conventionalreinforcement, for the reason that it:
· creates significant capacity
· is less dependent on where future demand or connections requests emerge withinthe network being reinforced
· creates sufficient capacity as to wholly remove the concerns about capacity overthe timescales of a few minutes following a fault.
Our base case assumes that alternative sources of reactive power would be procured bythe system operator National Grid.

Appendix 10.10 Page 81 of 100
Appendix10.10: Calculation of the cost and benefit of the Unified Power Flow Controller (UPFC)
This appendix provides further detail of the approach taken to calculating the costs and benefits stated in Section 3 and Appendix 10.1.
10.10.1 Contents of this annex
This section explains:
the different value streams which contribute to the cost-benefit calculation;
the basis on which capacity and carbon calculations were carried out at the scale of the trial site;
how the Base Case costs and Method costs were calculated at the scale of the trial site;
the nature of the wider 132kV distribution networks in England and Wales and the 132kV transmission network in Scotland, and the applicability of the UPFC across Great Britain;
the way in which a programme of subsequent UPFC installations was forecast (the “roll-out intensity”);
the basis for including future cost reductions during the roll-out of subsequent installations.
The appendix firstly sets out several limitations on the method used.
10.10.2. Limitations of the approach
The calculations carried out to develop the business case have the following known limitations:
the roll-out intensity and future price reductions are developed independently of one another. As such, future price reductions only represent the price reductions associated with the wider power electronics market, rather than specific experience being developer of UPFC installs. We believe that this is a reasonable approach and that the wider market will be by far the dominant factor in driving price reductions.
the assumptions about the length of overhead line which would need to be replaced in each case study are adopted and applied across the GB. In practice, the length of line needing replacement would vary from location to location.
the approach assumes that thermal capacity on the 132kV overhead lines, reverse power flow in the transmission operator’s Super-Grid Transformers (SGTs) and requirements for reactive power are all required by the same energisation date. Whilst our quantitative scoring of Grid Supply Points and networks in WPD’s network areas looked for these situations, in practice these may occur at different times.
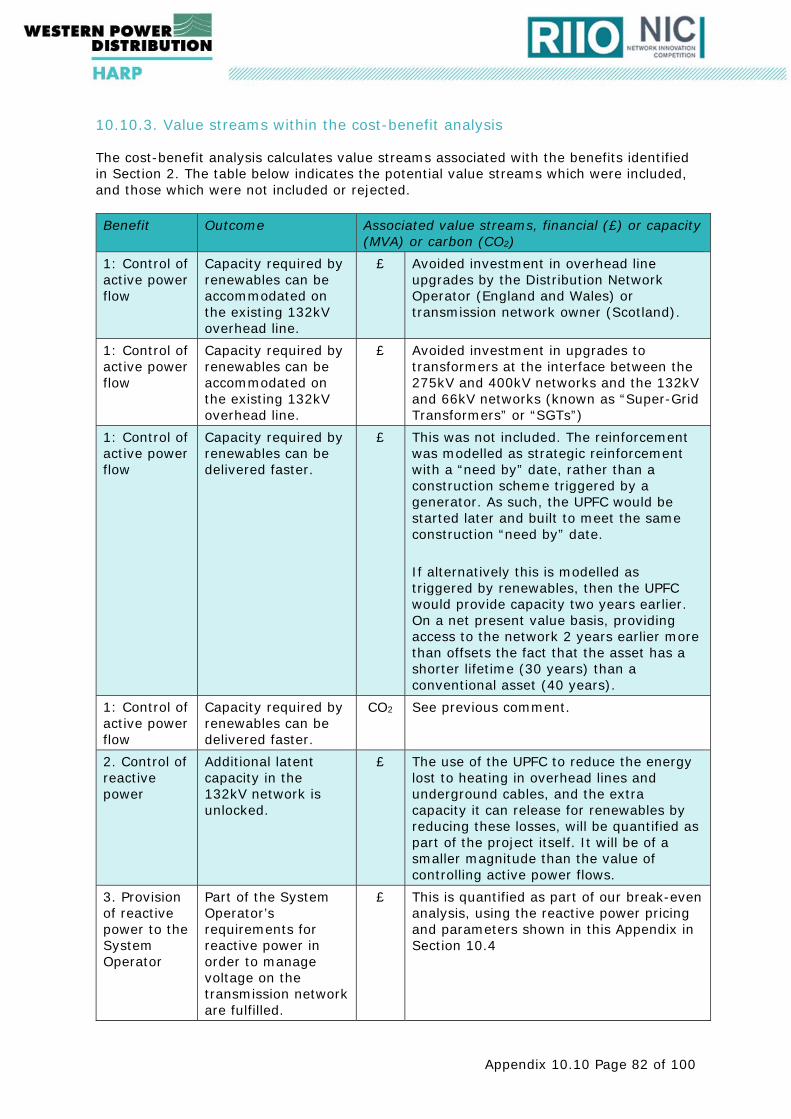
Appendix 10.10 Page 82 of 100
10.10.3. Value streams within the cost-benefit analysis
The cost-benefit analysis calculates value streams associated with the benefits identified in Section 2. The table below indicates the potential value streams which were included, and those which were not included or rejected.
Benefit Outcome Associated value streams, financial (£) or capacity (MVA) or carbon (CO2)
1: Control of active power flow
Capacity required by renewables can be accommodated on the existing 132kV overhead line.
£ Avoided investment in overhead line upgrades by the Distribution Network Operator (England and Wales) or transmission network owner (Scotland).
1: Control of active power flow
Capacity required by renewables can be accommodated on the existing 132kV overhead line.
£ Avoided investment in upgrades to transformers at the interface between the 275kV and 400kV networks and the 132kV and 66kV networks (known as “Super-Grid Transformers” or “SGTs”)
1: Control of active power flow
Capacity required by renewables can be delivered faster.
£ This was not included. The reinforcement was modelled as strategic reinforcement with a “need by” date, rather than a construction scheme triggered by a generator. As such, the UPFC would be started later and built to meet the same construction “need by” date. If alternatively this is modelled as triggered by renewables, then the UPFC would provide capacity two years earlier. On a net present value basis, providing access to the network 2 years earlier more than offsets the fact that the asset has a shorter lifetime (30 years) than a conventional asset (40 years).
1: Control of active power flow
Capacity required by renewables can be delivered faster.
CO2 See previous comment.
2. Control of reactive power
Additional latent capacity in the 132kV network is unlocked.
£ The use of the UPFC to reduce the energy lost to heating in overhead lines and underground cables, and the extra capacity it can release for renewables by reducing these losses, will be quantified as part of the project itself. It will be of a smaller magnitude than the value of controlling active power flows.
3. Provision of reactive power to the System Operator
Part of the System Operator’s requirements for reactive power in order to manage voltage on the transmission network are fulfilled.
£ This is quantified as part of our break-even analysis, using the reactive power pricing and parameters shown in this Appendix in Section 10.4

Appendix 10.10 Page 83 of 100
Benefit Outcome Associated value streams, financial (£) or capacity (MVA) or carbon (CO2)
4. Investigate ability to dampen voltage disturbances
Meets an increasing need for plant which can react rapidly (within tens of milliseconds) and which is currently serviced only by STATCOMs on the transmission networks.
£ This has not been quantified and will be the subject of technical feasibility trials only within the project.
4. Investigate ability to dampen voltage disturbances
Meets an increasing need for plant which can react rapidly (within tens of milliseconds) and which is currently serviced only by STATCOMs on the transmission networks.
CO2 See previous comment.
10.10.4 Calculation of Base Case and Method costs at the scale of the trial site
Section 3 sets out the way in which the business case draws on three case studies. The assumptions and constants within these calculations are shown below:
Parameter Value Reference Case study 1 feeder length needing reinforcement 21km [1] Case study 1 cost of reinforcement £10.75m
(2015 prices) [1]
Case study 1 indexation applied to reinforcement costs
RPI
Case study 2 feeder length needing reinforcement if a new GSP is not established
33-37km [2]
Case study 2 cost of reinforcement either by establishing a new GSP or reinforcing feeders
£35m [2]
Case study 3 feeder length needing reinforcement 21km Based on Case Study 1
Case study 3 cost of feeder reinforcement £10.75m (2015 prices
Based on Case Study 1
Case study 3 indexation applied to reinforcement costs
RPI
Case study 3 cost of SGT reinforcement £4m [3] SGT configuration and capacity (prior to upgrade) 400/132 kV
5 x 240 MVA

Appendix 10.10 Page 84 of 100
Parameter Value Reference SGT configuration and capacity (following upgrade) 400/132 kV
6 x 240 MVA
Increase in SGT capacity 180MVA Reactive power revenue (£/MVar/hour) (2017) £3.09 [4] Carbon Price (2017) £24.53 [5] Capitalisation rate 80% [5] Weighted Average Cost of Capital 3.90% [6] Discount factor (first 30 years) 3.5% Discount factor (30 years+) 3.0%
References: [1] Actuals of the previous cable reinforcement scheme [2] Discussions with WPD system designers [3] "North West Coast Connections: Appendix 4 Technical and Cost Report", National
Grid, August 2014 [4] Discussions with Graham Stein, National Grid (System Operator), 30 May 2017 [5] “Schedule 2A: Modifications to the special conditions of the electricity distribution
licences held by the four licensees owned by WPD”, Ofgem, page 143 [6] “Financing the Plan”, RIIO-ED1 business plan, April 2014, Western Power Distribution
10.10.5 Applicability to other 132kV sites in the UK
There are five main transmission topologies utilised within the UK. The Unified Power Flow Controller (UPFC) can bring benefit to some, but not all, of these topologies. The proportions of each topologies will be used as part of replicability calculation to the entire GB network. The topologies are described below with figures to demonstrate the topology.
Topology 1
The Double Radial Circuit
Key: 132kV 33kV
X
132kV double circuit
SGTs SGTs
Distributed generation (DG)
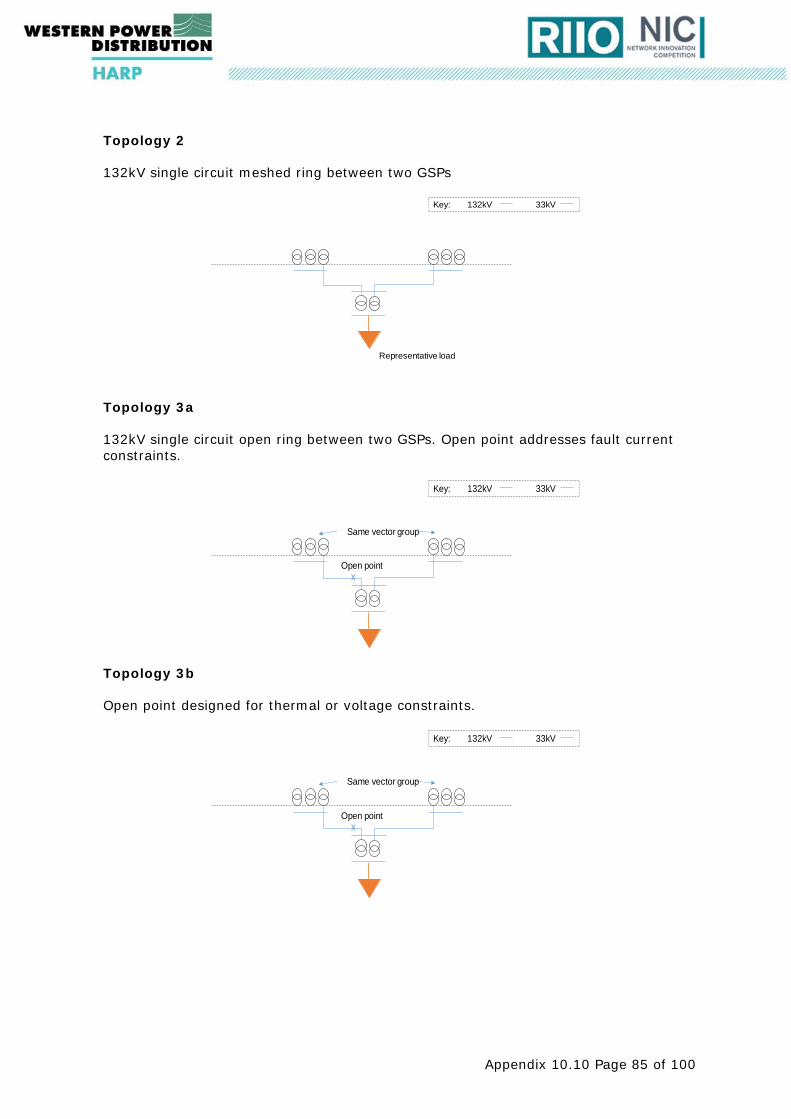
Appendix 10.10 Page 85 of 100
Topology 2
132kV single circuit meshed ring between two GSPs
Topology 3a
132kV single circuit open ring between two GSPs. Open point addresses fault current constraints.
Topology 3b
Open point designed for thermal or voltage constraints.
Key: 132kV 33kV
Representative load
Key: 132kV 33kV
XOpen point
Same vector group
Key: 132kV 33kV
XOpen point
Same vector group

Appendix 10.10 Page 86 of 100
Topology 4
Single circuit meshed ring on same GSP.
Topology 5
Single circuit radial. Special case only seen in e.g. Western Isles of Scotland
For a UPFC to benefit the transmission network, two elements require to be met. These are the correct topology and network constraints.
The UPFC has benefit to 132kV networks which are running as a mesh or can be configured as a mesh as this gives an increased number of paths/rings to divert power flow. The UPFC can be deployed in topologies 2, 3b and 4. The UPFC is not suited to radial networks as there is no scope to divert power causing an imbalance of power transmitted on the other parallel radial line. The UPFC is therefore not cost effective for topologies 1, 3a and 5. Thus, only topologies 2, 3b and 4 are considered for the GB business case.
In addition to the network operating under the correct topology, a number of network issues and constraints should also be met such as:-
Reverse power flow at GSP.
Potential voltage constraints.
Potential thermal overloads.
Grid/fault level constraints.
Key: 132kV 33kV
X
Key: 132kV 33kV
132kV single circuit
Low demand area which can still be restored in timescales required by P2/6 using alternative generation or has a derogation from P2/6
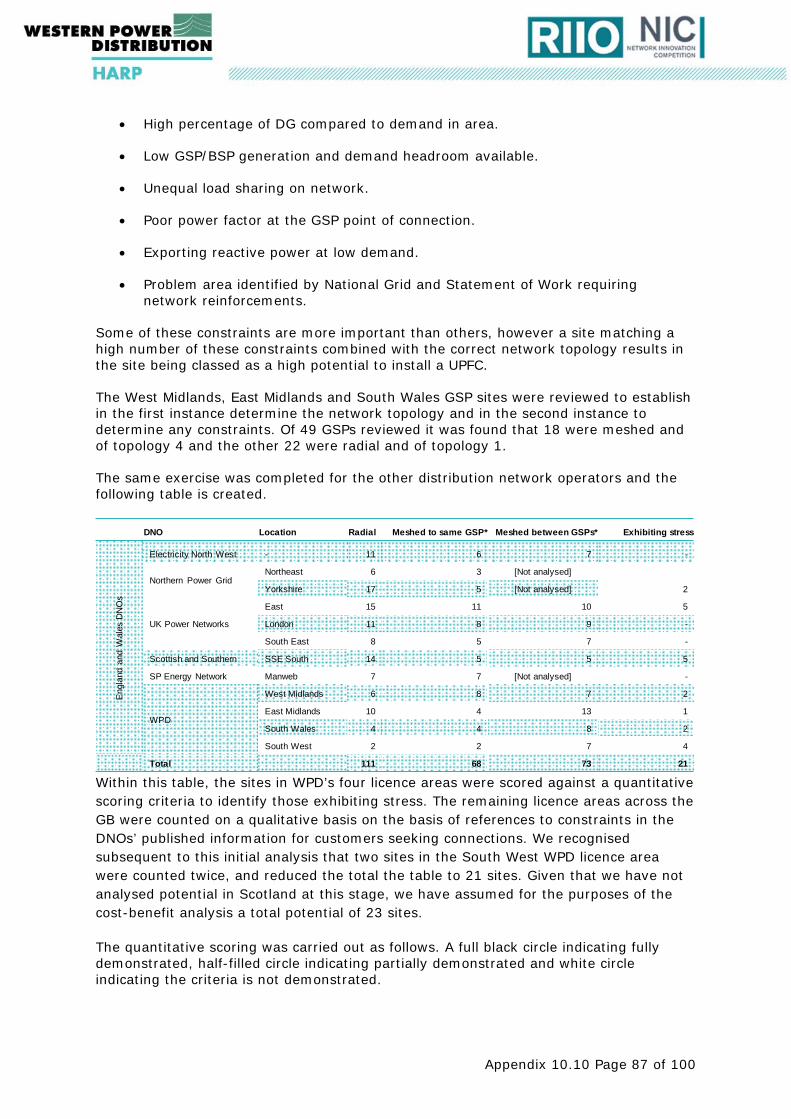
Appendix 10.10 Page 87 of 100
High percentage of DG compared to demand in area.
Low GSP/BSP generation and demand headroom available.
Unequal load sharing on network.
Poor power factor at the GSP point of connection.
Exporting reactive power at low demand.
Problem area identified by National Grid and Statement of Work requiring network reinforcements.
Some of these constraints are more important than others, however a site matching a high number of these constraints combined with the correct network topology results in the site being classed as a high potential to install a UPFC.
The West Midlands, East Midlands and South Wales GSP sites were reviewed to establish in the first instance determine the network topology and in the second instance to determine any constraints. Of 49 GSPs reviewed it was found that 18 were meshed and of topology 4 and the other 22 were radial and of topology 1.
The same exercise was completed for the other distribution network operators and the following table is created.
Within this table, the sites in WPD’s four licence areas were scored against a quantitative scoring criteria to identify those exhibiting stress. The remaining licence areas across the GB were counted on a qualitative basis on the basis of references to constraints in the DNOs’ published information for customers seeking connections. We recognised subsequent to this initial analysis that two sites in the South West WPD licence area were counted twice, and reduced the total the table to 21 sites. Given that we have not analysed potential in Scotland at this stage, we have assumed for the purposes of the cost-benefit analysis a total potential of 23 sites.
The quantitative scoring was carried out as follows. A full black circle indicating fully demonstrated, half-filled circle indicating partially demonstrated and white circle indicating the criteria is not demonstrated.
DNO Location Radial Meshed to same GSP* Meshed between GSPs* Exhibiting stress
Eng
land
and
Wal
es D
NO
s
Electricity North West - 11 6 7 -
Northern Power GridNortheast 6 3 [Not analysed]
2Yorkshire 17 5 [Not analysed]
UK Power Networks
East 15 11 10 5
London 11 8 9 -
South East 8 5 7 -
Scottish and Southern SSE South 14 5 5 5
SP Energy Network Manweb 7 7 [Not analysed] -
WPD
West Midlands 6 8 7 2
East Midlands 10 4 13 1
South Wales 4 4 8 2
South West 2 2 7 4
Total 111 68 73 21

Appendix 10.10 Page 88 of 100
○◔◑◕● Based on the constraint analysis a further three topology 4 sites were discounted as they showed little constraints. A summary of the 13 key topology 4 sites left to review for WPD is shown below.
RPF scores the Reverse Power Flow instances at GSPs and surrounding connected BSPs. Increasing reverse power flow is an issue to National Grid and any additional distributed generation added to the area may result in the reverse power capability being reached, resulting in mitigation methods in the form of management through an ANM scheme.
VC identifies if there are any Voltage Constraints on any of the 132 kV rings or surrounding circuits stepped down from 132 kV.
TO identifies Thermal Overloads on any of the 132 kV rings or surrounding circuits stepped down from 132 kV.
GC scores for any Grid Constraint or fault level limitation at the GSPs.
Constraints and RPF are taken from the Distributed Generation Constraint maps and are based on the existing generation connected to the networks, plus the generation not yet connected but holding an accepted connection offer from WPD.
%DG-Demand identifies where the currently installed and accepted applications for generation in the area exceeds or is a high percentage of the load demand within the area. If levels of DG continue to rise there is potential for reverse power flow to increase.

Appendix 10.10 Page 89 of 100
NG Compliance is a score against National Grid’s assessment to whether each Connection Point is non-compliant with the National Electricity Transmission System (NETS) Security and Quality of Supply Standard (SQSS).
GSP/BSP demand headroom identifies if there is a low potential for load connections in the area.
GSP/BSP generation headroom identifies if there is a low potential for load connections in the area.
Unequal sharing on the 132 kV network identifies if there is one side of the 132 kV ring which are loaded more than the other side leading to increased losses. Existing IPSA models were used to review and score.
Poor power factor at 132 kV identifies if there is a poor power factor at the GSP. A poor power factor can limit the active power flow capability through the supergrid transformers. Existing IPSA models were used to review and score.
Site Rin
g
RP
F
VC
TO GC
%D
G -
De
ma
nd
NG
Com
plia
nce
GSP
/B
SP
De
ma
nd
Hea
dro
om
GSP
/B
SP
Ge
nera
tion
H
ead
roo
m
Une
qua
l sh
arin
g o
n 1
32
kV n
etw
ork
Po
or P
ower
Fac
tor
on
132
kV
Net
wo
rk
Exp
orti
ng
MV
Ars
Pro
ble
m a
rea
nam
ed
by
Nat
ion
al G
rid
Sta
tem
ent
of
Wo
rks
Feckenham (66 kV)
Pembroke
Swansea NorthShrewsbury
WalpoleIronbridge
Aberthaw
Cardiff East
Bishops WoodEast ClaydonPennGrendonCellarhead
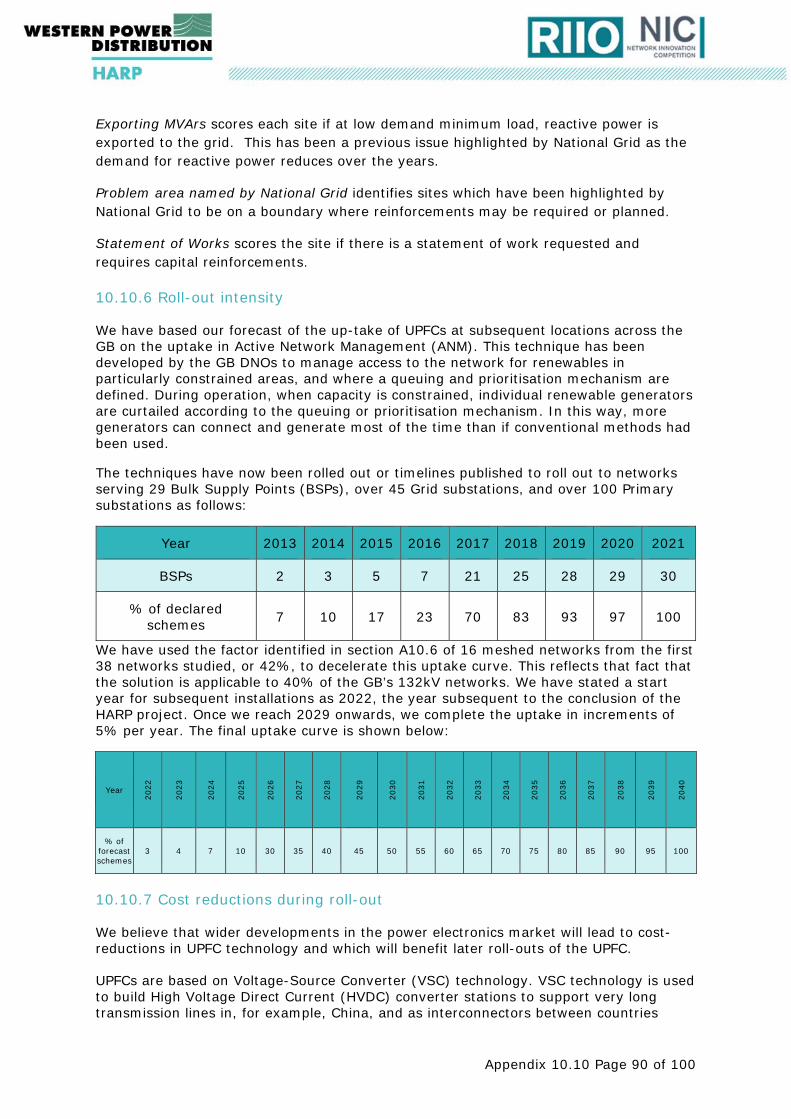
Appendix 10.10 Page 90 of 100
Exporting MVArs scores each site if at low demand minimum load, reactive power is exported to the grid. This has been a previous issue highlighted by National Grid as the demand for reactive power reduces over the years.
Problem area named by National Grid identifies sites which have been highlighted by National Grid to be on a boundary where reinforcements may be required or planned.
Statement of Works scores the site if there is a statement of work requested and requires capital reinforcements.
10.10.6 Roll-out intensity
We have based our forecast of the up-take of UPFCs at subsequent locations across the GB on the uptake in Active Network Management (ANM). This technique has been developed by the GB DNOs to manage access to the network for renewables in particularly constrained areas, and where a queuing and prioritisation mechanism are defined. During operation, when capacity is constrained, individual renewable generators are curtailed according to the queuing or prioritisation mechanism. In this way, more generators can connect and generate most of the time than if conventional methods had been used.
The techniques have now been rolled out or timelines published to roll out to networks serving 29 Bulk Supply Points (BSPs), over 45 Grid substations, and over 100 Primary substations as follows:
Year 2013 2014 2015 2016 2017 2018 2019 2020 2021
BSPs 2 3 5 7 21 25 28 29 30
% of declared schemes 7 10 17 23 70 83 93 97 100
We have used the factor identified in section A10.6 of 16 meshed networks from the first 38 networks studied, or 42%, to decelerate this uptake curve. This reflects that fact that the solution is applicable to 40% of the GB’s 132kV networks. We have stated a start year for subsequent installations as 2022, the year subsequent to the conclusion of the HARP project. Once we reach 2029 onwards, we complete the uptake in increments of 5% per year. The final uptake curve is shown below:
Year
2022
2023
2024
2025
2026
2027
2028
2029
2030
2031
2032
2033
2034
2035
2036
2037
2038
2039
2040
% of forecast schemes
3 4 7 10 30 35 40 45 50 55 60 65 70 75 80 85 90 95 100
10.10.7 Cost reductions during roll-out
We believe that wider developments in the power electronics market will lead to cost-reductions in UPFC technology and which will benefit later roll-outs of the UPFC.
UPFCs are based on Voltage-Source Converter (VSC) technology. VSC technology is used to build High Voltage Direct Current (HVDC) converter stations to support very long transmission lines in, for example, China, and as interconnectors between countries

Appendix 10.10 Page 91 of 100
power markets. VSC technology is also used to build STATCOMS used typically on the transmission network, and in some cases is used to build DC links to offshore wind farms.
Voltage source converters are based on a “building block” known as a “valve”. In order to create a functioning unit, many valves must be supported by external switchgear, interfacing transformers, computer equipment to generating timing signals, and cooling apparatus. Within each valve are components known as Insulated Gate Bipolar Transistors (IGBTs) or more recent variants.
The graph below shows the increase in cumulative shipments and forecast shipments of valves. This is derived from announced HVDC schemes, their voltage rating and the number of converter stations. There is a direct correlation between the voltage rating and the number of valves, although this will vary from one manufacturer to another.
We believe it is reasonable that this increase in shipments, already nearly 10-fold between 2010 and 2024, can lead to a 25% cost reduction by 2040.
0.00
2.00
4.00
6.00
8.00
10.00
12.00
2010 2011 2012 2013 2014 2015 2016 2017 2018 2019 2020 2021 2022 2024
Estimate of cumulative volumes of valve modules shippedVolumes normalised to 2010 (2010 = 1.0)
Represents growth from projects not yet announced

Appendix10.11: Letters of support
This appendix contains statements of support and intent from two manufacturers which responded to our Request for Information (RFI), UK network operators and the GB system operator (National Grid).


Registered Office: Newington House 237 Southwark Bridge Road London SE1 6NP
Registered in England and Wales No: 3870728
Return Address: UK Power Networks Energy House Hazelwick Avenue Crawley West Sussex RH10 1EX [email protected]
Company: UK Power Networks (Operations) Limited
Steven Gough Western Power Distribution Avonbank, Feeder Road Bristol BS2 0TB 14 September 2017 Dear Steven, Future use of Unified Power Flow Controller Thank you for your enquiry about the future use of Unified Power Flow Controllers (UPFC). At UK Power Networks we recognise the challenges of balancing networks to release capacity. We have investigated this using Quadrature Boosters at 33kV in our Flexible Plug and Play project and with Smart Wire Power Guardians in our Load Share project. We are looking to develop and demonstrate tools to do this at lower voltages in our Active Response project. We are interested in learning related to the practical implementation of UPFCs and detailed further information on how best to build a UPFC. This, alongside the performance data collected and disseminated as part of your HARP project, would give us additional options to consider when looking to balance power flows on our network. We would be particularly interested in data related to the additional technical and commercial benefits of the additional functionality a UPFC has over alternative options. We continue to look for innovative learning from other licensees to fast follow deployment on our networks, adding to our toolbox of smart solutions. We will always choose the lowest cost technically suitable product in the interests of customer bills, as such we would be very interested in the final method cost of your solution which would drive our deployment scalability. Provided the UPFC is proven to be reliable and effective at manipulating the network’s power flows and the method cost offers best value to customers, we would implement UPFCs on our network. Yours sincerely,
Ian Cooper Innovation Lead – Opportunities and Bids UK Power Networks

National Grid House
Warwick Technology Park
Gallows Hill, Warwick
CV34 6DA
National Grid plc
Registered Office: 1-3 Strand, London WC2N 5EH
Registered in England and Wales, No 4031152
Western Power Distribution
Avonbank,
Feeder Road
Bristol,
BS2 0TB
29 September 2017
Graham Stein
Network Operabilty Manager
Network Capability Electricity
System Operator
telephone: +44 (0) 7785 950722
www.nationalgrid.com
Dear Steven,
Future use of Unified Power Flow Controllers and Reactive Power
Thank you for your enquiry about the future use Unified Power Flow Controllers (UPFC) and
the future need of Reactive Power services. We are very interested in the outcomes of your
project which will allow us to see a practical implementation of the UPFCs. We would be
willing to work with WPD to test of impact of the UPFC’s reactive power on the transmission
grid as part of the HARP project. This, alongside the wider performance data collected and
disseminated as part of the project, would give us sufficient confidence in evaluation support
capability from UPFC if they are offered in the future.
National Grid is working hard to develop Reactive Power services to meet the challenges of
the new and changing energy landscape. We plan to design and implement a new reactive
market over the course of 2018/19. We are also working hard with all of the distribution
licensees to facilitate appropriate whole system solutions, and your project will help inform
the industry’s thinking in this area. We will also be able to help by sharing learning from our
Power Potential project, which is testing the technical and commercial potential for the
delivery of reactive power and voltage control capability to the transmission network, as
provided by distributed energy resources.
Yours Sincerely
Graham Stein

Appendix 10.14 Page 97 of 100
10.12 UPFC Steady-state Modelling
This Appendix discusses the steady-state modelling of the UPFC in power system study software. The modelling is based on technical literature documents “Power flow control with UPFC” by R. Sadikovic and “Injection Power UPFC Model For Incorporation Of Unified Power Flow Controller In Load Flow Studies” by M. Z. EL-Sadek, M. Abo-Zahhad, A. Ahmed and H.E. Zidan. All figures have been reproduced from this second paper unless referenced.
Procedure and Assumptions
A methodology to model a unified power flow controller (UPFC) is detailed with some analysis completed for the proposed sites.
The UPFC basic circuit is shown below and consists of two switching converters operated from a common DC link provided by a DC storage capacitor. Converter 2 provides the main function by injecting an AC voltage with controllable magnitude and phase angle in series with the transmission line via a series transformer. Converter 1 will supply or absorb the real power demanded by converter 2 at the common DC link. Converter 1 can also generate or absorb controllable reactive power and provide shunt reactive power compensation for the line. There are therefore three controllable elements of the UPFC: AC voltage with controllable magnitude (r) and phase angle (θ) in series with the transmission line and Qshunt.
UPFC Rating
The methodology and flow chart shown on the following page is used to determine the rating of the UPFC. In general, a series transformer reactance and system base is selected. An estimate of converter rating Ss and a maximum magnitude of series inject voltage rmax is chosen. Load flows are computed by changing the angle θ from 0 – 360 keeping the magnitude of r at rmax. The series converter powers are calculated at each load flow and are compared to the initial estimate Ss. Ss is then reviewed against the calculated powers to find a rating close to what the converter is operating at. A script was developed to run the methodology.
At this stage, only the series element was utilised i.e. Qsh=0 MVAr.
The assumption that the series transformer reactance was 10% i.e. 0.1 pu remained for all analysis.
The analysis was completed for proposed sites at Feckenham and Walpole.

Appendix 10.14 Page 98 of 100
Feckenham/Evesham
For Feckenham the proposed location is on the cable incomer to Evesham from Feckenham.
Assuming the cable from Feckenham to Evesham is at its rated capacity, installing the UPFC could relieve some of the power flow through the cable by diverting power elsewhere around the ring via Strensham and Pershore. The graphs on the following page show the Power Flow curves for the line from Evesham to Feckenham whilst varying the operating angle of the UPFC. The loading of the series and shunt converters is also shown as well as a PQ curve showing the operating envelope for the UPFC and the line rating constraint determining the operating region.

Appendix 10.14 Page 99 of 100
‐140
‐120
‐100
‐80
‐60
‐40
‐20
0
0 50 100 150 200 250 300 350
Line P
‐100
‐80
‐60
‐40
‐20
0
20
40
60
0 50 100 150 200 250 300 350
Line Q
‐15
‐10
‐5
0
5
10
15
20
0 50 100 150 200 250 300 350
Series Converter Loading
Pcon2 (MW)Qcon2 (MVAr)Scon2 (MVA)
‐10
‐8
‐6
‐4
‐2
0
2
4
6
8
10
0 50 100 150 200 250 300 350
Shunt Converter Loading
Pcon1 (MW) Qcon1 (MVAr) Scon1 (MVA)
‐100
‐80
‐60
‐40
‐20
0
20
40
60
‐140 ‐120 ‐100 ‐80 ‐60 ‐40 ‐20 0
Line Reactive Power (M
VAr)
Line Power (MW)
Line PQ Operation with UPFC
Line PQ Line Rating
Operating Region

Appendix 10.14 Page 100 of 100
Assuming the cable from Feckenham to Evesham is at its rated capacity installing the UPFC could ensure that 40 MW of generation could be added at Evesham by rediverting some of the power flow elsewhere around the ring via Strensham and Pershore. The load flow results below demonstrate this. Without the UPFC, adding 40 MW at Evesham when the cable from Feckenham to Evesham is at its rated capacity causes the cable to be loaded to approximately 133%. Installing the UPFC can bring the power flow back within the rating of the cable by diverting the power flow elsewhere.
Location From Location To Rating (IPSA) (MVA) No UPFC UPFC
MW MVAr MVA % Rating MW MVAr MVA % Rating
PershoreTEE Feckenham 85 ‐15.56 ‐7.72 17.37 20.4 ‐1.13 ‐0.60 1.28 1.5
PershoreTee Rotherdale 91 ‐5.14 ‐0.09 5.14 5.6 ‐19.52 ‐7.21 20.80 22.9
Rotherdale Pershore 91 ‐5.14 ‐0.03 5.14 5.6 ‐19.55 ‐7.28 20.86 22.9
Strensham Pershore 73 18.36 4.01 18.80 25.7 33.01 11.93 35.10 48.1
EveshamA Strensham 73 46.85 14.64 49.09 67.2 62.28 24.62 66.97 91.7
Feckenham EveshamA 77.5 ‐96.01 ‐37.68 103.14 133.1 ‐45.85 ‐7.10 46.39 59.9
EveshamB HAYFTEE 90 43.92 16.27 46.84 52.0 78.09 40.87 88.14 97.9
HAYFTEE FeckenhamT 90 43.58 15.36 46.21 51.3 76.98 36.97 85.40 94.9
Feckenham FeckenhamT 90 ‐42.14 ‐13.92 44.38 49.3 ‐74.53 ‐31.57 80.94 89.9