Embed Size (px)
Citation preview
Competency Assessment in Nursing Using Simulation:
A Generalizability Study and Scenario Validation Process
by
Janet Elaine O’Brien
A Dissertation Presented in Partial Fulfillment
Of the Requirements for the Degree
Doctor of Philosophy
Approved July 2014 by the
Graduate Supervisory Committee:
Marilyn Thompson, Co-Chair
Debra Hagler, Co-Chair
Samuel Green
ARIZONA STATE UNIVERSITY
August 2014
i
ABSTRACT
The measurement of competency in nursing is critical to ensure safe and effective care of
patients. This study had two purposes. First, the psychometric characteristics of the
Nursing Performance Profile (NPP), an instrument used to measure nursing competency,
were evaluated using generalizability theory and a sample of 18 nurses in the Measuring
Competency with Simulation (MCWS) Phase I dataset. The relative magnitudes of
various error sources and their interactions were estimated in a generalizability study
involving a fully crossed, three-facet random design with nurse participants as the object
of measurement and scenarios, raters, and items as the three facets. A design
corresponding to that of the MCWS Phase I data—involving three scenarios, three raters,
and 41 items—showed nurse participants contributed the greatest proportion to total
variance (50.00%), followed, in decreasing magnitude, by: rater (19.40%), the two-way
participant x scenario interaction (12.93%), and the two-way participant x rater
interaction (8.62%). The generalizability (G) coefficient was .65 and the dependability
coefficient was .50. In decision study designs minimizing number of scenarios, the
desired generalizability coefficients of .70 and .80 were reached at three scenarios with
five raters, and five scenarios with nine raters, respectively. In designs minimizing
number of raters, G coefficients of .72 and .80 were reached at three raters and five
scenarios and four raters and nine scenarios, respectively. A dependability coefficient of
.71 was attained with six scenarios and nine raters or seven raters and nine scenarios.
Achieving high reliability with designs involving fewer raters may be possible with
enhanced rater training to decrease variance components for rater main and interaction
effects. The second part of this study involved the design and implementation of a
ii
validation process for evidence-based human patient simulation scenarios in assessment
of nursing competency. A team of experts validated the new scenario using a modified
Delphi technique, involving three rounds of iterative feedback and revisions. In tandem,
the psychometric study of the NPP and the development of a validation process for
human patient simulation scenarios both advance and encourage best practices for
studying the validity of simulation-based assessments.

iii
This dissertation is dedicated to my children, Ceara and Aidan, and my husband,
Chris. Hoping to contribute something to this world, to perhaps make them proud of me,
has always been a driving force.
iv
ACKNOWLEDGMENTS
I would like to thank my committee members for the time, guidance, and
feedback they provided in the completion of this dissertation. My co-chairs, Dr. Marilyn
Thompson and Dr. Debra Hagler, were especially instrumental in providing detailed
feedback and in answering many questions. Their encouragement was deeply
appreciated. Along with Dr. Samuel Green, their suggestions and advice guided me
through the development of an idea, the exploration of possible research topics, and the
painful deliberations involved in defending a dissertation proposal.
This study would not have been possible without the generosity of the Measuring
Competency with Simulation (MCWS) Phase I Study group, which included Dr. Debra
Hagler, Ms. Beatrice Kastenbaum, Dr. Janine Hinton, Dr. Pamela Randolph, Dr. Mary
Mays, and Ms. Ruth Brooks, among others, who allowed me to use data from their
project to conduct my own secondary analysis. The Nursing Performance Profile (NPP)
and three simulation scenarios were developed during the MCWS Phase I project by the
Arizona State Board of Nursing (ASBN), Arizona State University, and Scottsdale
Community College, with funding from the National Council of State Boards of Nursing
(NCSBN) Center for Regulatory Excellence. Their groundbreaking work allowed me to
build upon their efforts. I am especially thankful for the role Ms. Kastenbaum played in
offering me opportunities to observe evaluations of simulations and in sharing her own
instruments, which heavily influenced my current study, and finally provided a focus for
my interests in assessment using simulation.
v
TABLE OF CONTENTS
Page
LIST OF TABLES……………………………………………………………………….. x
LIST OF FIGURES……………………………………………………………………… xi
CHAPTER
1 INTRODUCTION……………………………………………………….…….…. 1
REVIEW OF THE LITERATURE……………………….………........................ 4
Competency of Healthcare Professionals……………….………………...….. 5
Measuring Competency in Healthcare Through Simulation…….......…. 7
Measurement Issues in Observation-Based Assessment………….………… 10
Reliability…………………………………………………….……….. 15
Inter-Rater Reliability………………………………….………. 18
Other Sources of Variability Affecting Reliability…….……….. 19
Generalizability Theory………………………...………….……. 19
Validity………………………………………………………….…….. 26
Delphi Technique…………………..……………..……….….… 28
Designing an Observation-Based Assessment System in Healthcare
Using Simulation………………………………………………….………… 31
Nursing Performance Profile……………………………………….……….. 33
PURPOSE OF THE STUDY…………………………………………….……... 36
2 METHODS……………………………………………………………….….….. 40
Part I: Reliability Analysis of MCWS Phase I Data………………….……... 40
Participants…………………………………………………….…...…. 40
vi
CHAPTER Page
Raters…………………………………………………………….……. 41
Measures……………………………………………………….……… 42
Instrumentation……………………………………………....…..42
Scenarios……………………………………………...….………45
Procedure……………………………………………………….……... 46
Analysis……………………………………………………….………. 47
Missing Data…………………………………………….….…….47
Descriptive Statistics…………………………………….….……50
G Study………………………………………………….…….….50
D Studies……………………………………………………...…..54
Part II: Design of a Validation Process for Simulation Scenario
Development…………………………………………………………….…... 57
3 RESULTS – RELIABILITY ANALYSIS OF MCWS PHASE I DATA…….… 62
Participants……………………………………………………………….….. 62
Raters………………………………………………………………………... 62
Missing Data………………………………………………………………… 63
Descriptive Statistics………………………………………………………… 65
Generalizability Study………………………………………………………. 70
Decision Studies…………………………………………………………….. 71
D Study Set 1………………………………………………….…...….. 73
D Study Sets 2 – 10………………………………………………....…. 76
Reliability Coefficients and Increasing Number of Scenarios…...76
vii
CHAPTER Page
Standard Errors of Measurement………………………………..77
Reliability Coefficients and Increasing Number of Raters….…..78
Comparison of D Studies – Increasing Scenarios Versus
Increasing Raters……………………………………………….. 86
4 RESULTS - DESIGN OF A VALIDATION PROCESS FOR
SIMULATION SCENARIO DEVELOPMENT…………………………..…… 93
Round One………………………………………………………………….. 95
Background and Vital Signs………………………..………………… 96
Physician’s Orders and Medication Administration Record………….. 97
Nurses’ Flow Sheet and Nurses’ Notes……….………………………. 98
Scenario Progression Outline – Report…………………………..…… 98
Scenario Progression Outline – Expected Participant Actions/
Interventions…………………………………………………………... 98
Round Two…………………………………………………………………. 99
Background and Vital Signs…………..……………………………... 100
Physician’s Orders…………………..………………………………. 100
Medication Administration Record…………………………….……. 101
Wells Score Sheet…………………..………………………………... 102
Lab Tests……………..……………………………………………… 102
Nurses’ Flow Sheet and Nurses’ Notes……………………………… 102
Weight Based Heparin Protocol………………..…………………….. 102
Scenario Progression Outline – Report………………………….…… 103
viii
CHAPTER Page
Scenario Progression Outline – Script…………..…………………... 103
Scenario Progression Outline – Expected Participant
Actions/Interventions…..……………………………………………. 104
Round Three…….………………………………………………………..... 104
Background and Vital Signs……………..…………..……………… 105
Physician’s Orders………………...……………………...………….. 105
Scenario Report………………………………..……………………... 105
5 DISCUSSION………………………………………………………………….. 107
Generalizability Study……………………………………………………... 107
Main Effect Variance Components………………………………..… 107
Interaction Variance Components…………………………………… 111
Decision Studies…………………………………………………………….113
Variance Components for a D Study Design With Three Scenarios
and Three Raters……………………………………………………... 114
Coefficients for a D Study Design With Three Scenarios and
Three Raters………………………………………………………….. 116
Prior MCWS Phase I Study Analyses………………………………... 117
Effect on Reliability of Various D Study Designs…………………… 118
Validation of a Scenario…………………………………………………….120
Relationship to Other Measures……………………………………… 120
Grounded in Theory and Evidence-Based Practices…………………. 122
Validation Using the Modified Delphi Technique……………………122

ix
CHAPTER Page
Limitations of the Study…………………………………………….…..…. 124
Directions for Future Research………………………………………….… 125
Implications for Practice……………………..……………………………. 128
REFERENCES………………………………………………………………………... 131
APPENDIX
A IRB DOCUMENTATION…………………………………………………….. 143
B PERMISSION TO USE COPYRIGHTED MCWS TEMPLATE…………….. 148
C MEDICAL RECORD AND SIMULATION SCENARIO……………………. 150
D RECRUITMENT NARRATIVE……………………………………………… 173
E CONFIDENTIALITY FORM………………………………………………… 175
F CONSENT FORM……………………………………………………………. 177
G FEEDBACK FORM – ROUND 1……………………………………………. 179
H INSTRUCTIONS – ROUND 1…………………………………………..…… 184
I FEEDBACK FORM – ROUND 2……………………………………………. 187
J INSTRUCTIONS – ROUND 2……………………………………………….. 201
K FEEDBACK FORM – ROUND 3…………………………………………….. 203
x
LIST OF TABLES
Table Page
1. Missing Data by Scenario and Rater…………………………………..….…. 64
2. Item Means and Standard Deviations by Scenario and Rater…………..…… 67
3. G Study Variance Component Estimates and Percent of Total Variance
for p x s x r x i Design………………………………………………………. 71
4. D Study Designs…………………………………………………………….. 73
5. D Studies Variance Components Estimates for Fully Crossed, Random
Facets p x S x R x I Designs – D Study Set 1……………………………….. 74
6. D Studies Variance Components Estimates for Fully Crossed, Random
Facets p x S x R x I Designs – D Study Sets 2 – 4………………………….. 79
7. D Studies Variance Components Estimates for Fully Crossed, Random
Facets p x S x R x I Designs – D Study Sets 5 – 7………………………..… 80
8. D Studies Variance Components Estimates for Fully Crossed, Random
Facets p x S x R x I Designs – D Study Sets 8 – 10………………………… 81
9. Comparison of Reliability Estimates for Different Combinations of
Scenarios and Raters………………………………………………………… 89
10. Validation Team Agreement Using Kappa and Percent Agreement
Per Round…………………………………………………………………… 97
xi
LIST OF FIGURES
Figure Page
1. Estimated G and Dependability Coefficients for p x S x R x I D Study
Set 1…………………………………………………………………………. 75
2. Relative and Absolute SEMs for p x S x R x I D Study Set 1………………. 75
3. Estimated G Coefficients for p x S x R x I D Study Sets 2 – 10…………..... 82
4. Relative SEMs for p x S x R x I D Study Sets 2 – 10……………………….. 83
5. Estimated Dependability Coefficients for p x S x R x I D Study
Sets 2 – 10…………………………………………………………………… 84
6. Absolute SEMs for p x S x R x I D Study Sets 2 – 10………………...……. 85
7. Estimated G Coefficients for p x S x R x I D Studies……….………...……..91
8. Estimated Dependability Coefficients for p x S x R x I D Studies………….. 92
1
Chapter 1
Introduction
According to the Standards for Educational and Psychological Testing
(Standards), assessment is “any systematic method of obtaining information from tests
and other sources, used to draw inferences about characteristics of people, objects, or
programs” (American Educational Research Association [AERA], American
Psychological Association [APA], & National Council on Measurement in Education
[NCME], 1999, p. 172). Knowledge and ability may be successfully measured by a
written exam, one type of assessment format used in many disciplines. Paper-and-pencil
tests frequently deal with one topic or problem at a time, allowing the test taker to
demonstrate basic knowledge in a straightforward manner. However, knowledge that can
be demonstrated through the answering of written questions may not translate into
successful demonstration and application of the type of knowledge and skills needed in
active practice situations for professions such as teaching, aviation, or healthcare.
Observation-based forms of assessment may be better suited for measuring competency
in professional practice contexts that require the simultaneous use of critical thinking and
psychomotor skills in the application of learned concepts, as well as the demonstration of
professionalism and skilled communication (Boulet et al., 2003; Goodstone &
Goodstone, 2013; Katz, Peifer, & Armstrong, 2010; Swanson & Stillman, 1990).
To evaluate the performance of individuals in fields in which these types of
complex behaviors are common, an observation-based assessment may involve practice
in a real-life situation, such as in education, in which student teachers are observed and
evaluated by their mentoring teachers, principals, and college supervisors. As a parallel
2
seen in aviation, instructors evaluate student pilots as they demonstrate skills in flight
simulators or while flying a plane. In healthcare, professionals’ clinical abilities and
knowledge often are assessed in clinical settings; for example, supervising clinicians
observe and evaluate nurses and physicians during actual patient encounters.
However, in healthcare, clinical opportunities to practice skills are not readily
available, and ensuring patient safety prevents the assessment of many high-risk skills in
the clinical environment. As a result, simulation is increasingly being used for
assessment. In simulation, patient care takes place in an environment that is as realistic as
possible, yet safe, so that students may make errors and receive constructive feedback for
improving their skills and knowledge without endangering a patient’s life, while also
preventing exposure to pathogens transmitted by blood and other body fluids. Alinier and
Platt (2013) define simulation “as being a technique that recreates a situation or
environment to allow learners (in the widest sense of the term) to experience an event or
situation for the purpose of assimilating knowledge, developing or acquiring cognitive
and psychomotor skills, practicing, testing, or to gain understanding of systems or human
actions and behaviors” (p. 1). Simulated encounters may be part of the formative
assessment provided in an educational curriculum or may be used as a summative
evaluation component required for graduation, certification, or licensure (Alinier & Platt,
2013; Sando et al., 2013; Ziv, Berkenstadt, & Eisenberg, 2013).
To provide accurate and meaningful assessment results, reliable and valid
methods to measure competency are critical. Unfortunately, few validated and reliable
instruments are available in healthcare for the assessment of simulated performances and
their outcomes. The need for research in this area is widely recognized (Aronson, Glynn,
3
& Squires, 2012; Boulet & Murray, 2010; Boulet et al., 2011; Cant, McKenna, & Cooper,
2013; Foronda, Liu, & Bauman, 2013; Kardong-Edgren, Adamson, & Fitzgerald, 2010;
Manser, 2008; Manz, Hercinger, Todd, Hawkins, & Parsons, 2013; Prion & Adamson,
2012; Schaefer et al., 2011, Wilkinson, 2013). With the encouragement of groups such as
the Pew Health Professions Commission, the American Nurses Association, and the
Institute of Medicine (Decker, Utterback, Thomas, Mitchell, & Sportsman, 2011),
researchers are developing guidelines and methods to assess competency in healthcare
professions, especially in medical education (Boulet & Murray, 2010). However, efforts
to develop instruments to measure competency in nursing are relatively new and few
instruments have been fully evaluated for reliability and validity (Elfrink Cordi,
Leighton, Ryan-Wenger, Doyle, & Ravert, 2012; Kardong-Edgren et al., 2010; Prion &
Adamson, 2012).
The purpose of this study was to design procedures to optimize the development
and validation of instruments for assessing performance competency in healthcare
simulation contexts. I undertook this study with the substantive aim of furthering the
development of the Nursing Performance Profile (NPP), an instrument for measuring an
individual’s nursing competency that uses three existing patient simulation scenarios and
multiple raters. The current study was conducted in two distinct but complementary
phases: 1) assessment of the psychometric characteristics of the NPP and 2) the design of
a validation process for scenario development and the implementation of this process to
create a new scenario for the NPP.
First, the psychometric characteristics of the NPP were evaluated using extant
data in a secondary analysis. In the current study, I used generalizability theory to
4
estimate the relative magnitudes of various error sources and their interactions, and to
determine the optimum number of scenarios and raters needed to achieve sufficiently
high score reliability.
Second, I established an optimal process for developing and validating simulation
scenarios for measuring nurse competency. I used a modified Delphi technique to reach
group consensus among an expert panel of nurses who were experienced in simulation.
Using evidence-based practice guidelines and the collaborative process of reaching
consensus using the modified Delphi technique, I created an additional scenario to be
incorporated into the NPP. In this process, I developed a storyboard involving commonly
expected signs and symptoms for a patient with a specific medical condition and
identified expected nursing behaviors and actions needed for safe care of the patient.
Review of the Literature
To provide context for this study, it is important to understand the current state of
competency assessment in healthcare and the role of simulation in learning and
evaluation in healthcare professions. Measurement issues in observation-based
assessment, such as bias, reliability, and validity are explored. Analyses of reliability,
such as inter-rater reliability and measures of internal consistency, have limitations in
estimating sources of error, so generalizability theory is described and proposed as an
appropriate approach for analyzing reliability in observation-based assessment. The
modified Delphi technique is reviewed as a validation process for the development of
scenarios to be used in simulation-based competency assessment. Suggestions for
designing an observation-based assessment system in healthcare using simulation are
outlined and types of scales used in these systems are described. Last, the Nursing
5
Performance Profile, an instrument used to measure competency in nursing, is presented.
The purpose of the study is then delineated.
Competency of Healthcare Professionals
Evaluating the competency of healthcare professionals is a critical issue that
regulatory boards have debated for some time (Decker et al., 2011). In 1995, the Pew
Health Professions Commission (1995) recommended in their report, “Reforming Health
Care Workforce Regulation: Policy Considerations for the 21st Century,” that state boards
address competency requirements of healthcare professionals. In 1999, the Institute of
Medicine (IOM) shocked the medical and lay community with its findings of widespread
medical errors in the report, To Err is Human; Building a Safer Health System
(Wakefield, 2000), and in 2001, the IOM further remarked on the expanding knowledge
base in healthcare and voiced concerns that licensure and scope-of-practice laws needed
to address competency issues (Decker et al., 2011).
Reviewing many recommendations, Decker et al. (2011) proposes a definition of
continued competency in nursing to involve the assimilation of evidence-based
knowledge, nursing skills, communication and collaboration abilities, critical and
reflective thinking, and values, while practicing safe patient care. Ensuring that newly
graduated healthcare professionals are ready to care for patients safely, effectively, and
efficiently is a challenge faced by facilities and regulatory boards and measuring
continuing competency of nurses and other healthcare professionals is critical to ensure
that skills and knowledge keep pace with modern medicine and technology.
One area of concern for educational institutions, healthcare facilities, and
regulatory boards is the gap between newly graduated nurses’ knowledge base and the
6
minimum level needed to practice independently (Berkow, Virkstis, Stewart, & Conway,
2009; Hughes, Smith, Sheffield, & Wier, 2013). Unfortunately, the lack of evidence-
based performance measures has made it difficult to prescribe solutions (Burns & Poster,
2008). Nursing school curricula provide a strong theoretical base for students and
exposure to clinical settings allows at least some opportunity to practice skills on patients
while in school. Also, the National Council for State Boards of Nursing (NCSBN)
administers a written exam, the National Council Licensure Examination for Registered
Nurses (NCLEX-RN), which nurses must pass before state boards will grant licensure.
However, sufficient opportunities to apply critical thinking and clinical reasoning needed
to practice safely, effectively, and efficiently often occur only during post-graduate
clinical practice (Burns & Poster, 2008; Darcy Mahoney, Hancock, Iorianni-Cimbak, &
Curley, 2013; Schatz, Marraffino, Allen, & Tanaka, 2013). In recent years, the gap
between nursing school and the workplace unfortunately appears to be widening (Hughes
et al., 2013). As new graduates struggle to apply theory learned in school to actual
clinical practice, challenges faced by inexperienced nurses are exacerbated by the higher
acuity levels of patients in today’s hospitals (Rogers, Hwang, Scott, Aiken, & Dinges,
2004). As reported by the Nursing Executive Center (2008), whereas almost 90% of
academic leaders believe their graduates are ready to care for patients safely and
effectively, only 10% of hospital leaders agree (Ashcraft et al., 2013; Berkow et al.,
2009). Compounded with an ongoing nursing shortage that is predicted to reach between
300,000 to one million nurses by 2030 (Juraschek, Zhang, Ranganathan, & Lin, 2012;
Schatz et al., 2013), the theory-practice gap poses a great challenge to educational
institutions and regulatory boards to ensure that our healthcare system has an adequate
7
number of qualified registered nurses prepared to care for an increasingly more fragile
population.
Measuring competency in healthcare through simulation. Ensuring
competency is a concern shared by all healthcare professions, and in response, various
boards, institutes, and think tanks have addressed these issues by developing guidelines
for continuing competency. Further, the development of valid and reliable methods of
evaluating competency has been undertaken by researchers in various healthcare
professions, e.g., in medical education (Boulet, Smee, Dillon, & Gimpel, 2009),
anesthesiology (Boulet & Murray, 2010; Weller et al., 2005), in the treatment of trauma
patients (Decker et al., 2011), and in the practice of specific skills, such as thoracentesis
(a procedure to remove fluid between the lung and chest wall (Decker at al., 2011).
Measuring competency in fields such as medicine or nursing has unique
challenges. Opportunities to observe the student or healthcare professional perform skills
and apply knowledge while assessing and managing the care of patients must be
available. Opportunities are difficult to plan for and concern for the safety of patients
prevents many skills from being practiced or observed. In addition, standardized
conditions must be provided for the participants being evaluated. The care of real patients
thus does not provide sufficient opportunities for thorough competency evaluation.
Alternatively, competency of healthcare students and professionals can be evaluated
using standardized patients or human patient simulators (HPSs; Holmboe, Rizzolo,
Sachdeva, Rosenberg, & Ziv, 2011). Simulation in clinical education is a process that
allows learners to integrate the acquisition of knowledge and psychomotor skills in the
understanding of humans (Alinier & Platt, 2013). Gaba (2004) described simulation as
8
“…a technique – not a technology – to replace or amplify real experiences with guided
experiences that evoke or replicate substantial aspects of the real world in a fully
interactive manner” (p. i2). Standardized patients, used extensively in medical education
and to a lesser extent in nursing education, are trained to respond to questions and
simulate physical symptoms in a uniform manner, providing each student with the same
opportunity to assess and manage care (Boulet et al., 2009). Human patient simulators,
widely used in nursing and medical education and in hospitals for staff development, are
mannequins which are controlled by trained staff or faculty. The HPSs present with
standardized physical symptoms and responses to treatment, enabling the healthcare
student or professional to assess and manage their care (Goodstone & Goodstone, 2013).
The use of standardized patients for formative assessment has a long history in
medical education, but their advent into high-stakes exams for licensure is relatively
recent (Boulet et al., 2009). Advances in technology have produced high-fidelity HPSs
that provide a realistic patient encounter. Physiological responses may be simulated and
many skills can be performed on the mannequins that were previously impossible
(Ashcraft et al., 2013; Katz et al., 2010).
The use of HPSs in nursing education has been documented to be extremely
valuable for learning, especially given constraints posed by limited clinical time for
students in hospitals. Research in simulation has shown improved mastery of learning
objectives, increased confidence and skill development, and the opportunity to be
exposed to patient conditions and situations that otherwise would not be available in the
hospital clinical situation (Lindsey & Jenkins, 2013; Salas, Paige, & Rosen, 2013).
Lindsey and Jenkins (2013) report positive changes in baccalaureate nursing students’
9
knowledge and clinical judgment as a result of clinical simulations involving rapid
response systems. Research focused on clinical simulation in nursing has increased over
the last decade, although the development of instruments to measure the learning that
takes place or the level of competency attained has not kept pace (Manz et al., 2013), and
the majority of the instruments that are available have not undergone systematic
psychometric testing (Elfrink Cordi et al., 2012; Kardong-Edgren et al., 2010; Prion &
Adamson, 2012). Systematic reviews on simulation in nursing and other health sciences
have reported a lack of measurement tools to evaluate competency using high-fidelity
simulation (Harder, 2010; Yuan, Williams, & Fang, 2011). To help address this
shortcoming, a new column was started last year in the journal Clinical Simulation in
Nursing for the sole purpose of promoting research methodology and data analysis in
simulation (Prion & Adamson, 2012). Still, the use of simulation for evaluation remains
in the early stages of development, with most instruments described in the literature being
focused on self-reports of satisfaction and confidence (Hughes et al., 2013) or low-level
learning (Adamson, Kardong-Edgren, & Willhaus, 2012), rather than on overall
competency.
The development of measurement instruments is a resource intensive endeavor
requiring the creation of scenarios, the assistance of content experts, a strong
methodological framework, the identification of evidence-based competencies, the
recruiting and training of raters, and an available pool of participants to pilot the
instrument and scenarios (Boulet & Murray, 2010; Hinton et al., 2012; McGaghie &
Issenberg, 2009; Randolph et al., 2012; Rosen et al., 2008). Then, extensive reliability
and validity testing is needed, followed by an iterative process of revisions and continued
10
piloting. Given the relatively recent advent of high fidelity HPSs into healthcare, the
development of valid and reliable instruments is in its initial stages.
Measurement Issues in Observation-Based Assessment
Observation-based assessment is subject to many challenges, including bias and
subjectivity issues related to the lack of standardization. These issues are also concerns
with written assessments. However, researchers have long understood these concerns
with written assessments, and a great deal of research has been undertaken to address
them through the use of statistical analysis and the testing of validity and reliability
(Saewert & Rockstraw, 2012).
Problems with observation-based assessment in education are well documented
(Waters, 2011). Rater subjectivity may result in bias, and although standardization
through rater training and ‘objective’ instruments may improve the reliability of
observation-based assessments, limitations still abound. Although well-developed
instruments may help decrease the subjectivity of judgments, raters’ preconceptions and
biases as well as human limitations in observation still plague the usefulness of those
instruments (Waters, 2011). Advances in technology have the potential of improving the
effectiveness of observation-based assessment. For example, a video observation tool for
classrooms was developed in conjunction with the 2009 Bill and Melinda Gates
Foundation’s Measures of Effective Teaching (MET) project (Waters, 2011). While
providing the capability of capturing data more thoroughly than a human observer, the
recording of observations with technology certainly doesn’t eliminate the problems of
subjective assessment. Similar tools for the video recording of encounters are available in
the healthcare education arena, such as Meti LearningSpace (CAE Healthcare, 2012),
11
Educational Management Solutions’ Orion system (Education Management Solutions,
2013), and the Event Triggered Digital Camera System (KB Port, 2013).
In some professions, such as education, observation-based assessments have been
used for decades (Simon & Boyer, 1974), yet there is still a need for instruments and
assessment processes that provide reliable and valid data. In education, Hill,
Charalambous, and Kraft (2012) describe how the interest in using observation for
teacher development and evaluation has grown in recent years, yet many of the available
observational instruments lack reliable scoring systems. They argue for the need for
observational systems, not merely instruments. Developing effective observational
systems requires a rigorous instrument development process focused on measuring
intended constructs, and must include focused attention on rater qualifications and
training, issues that impact the reliability and validity of the systems.
Failing to adequately address reliability and validity issues is common in
observation-based assessment in healthcare. In medicine, several tools have been
developed for the assessment of clinical performance in work-based assessment of
clinical encounters, such as the mini-clinical evaluation exercise (mini-CEX), yet very
little has been reported on their validity and reliability (Pelgrim et al., 2011). One
comprehensive review of the literature (Pelgrim et al., 2011) identified 39 articles that
addressed 18 assessment instruments for physicians or medical students used to evaluate
performance in the clinical setting. Reliability of only four instruments was addressed in
eight articles. Pelgrim et al. (2011) reported that most studies they reviewed indicated
acceptable reliability can be achieved after 10 clinical encounters, however most studies
didn’t report the number of raters used or validity testing of the instruments. Pelgrim et
12
al. found only one study (Margolis et al., 2006) that examined the reliability of increasing
the number of encounters compared to the reliability of increasing the number of raters.
They also found that rater training was generally minimal. Pelgrim et al. concluded that
understanding the effects of rater training on inter-rater reliability requires more research.
Although developers of competency-based assessments in the clinical setting have
made little progress in addressing psychometric issues of validity and reliability,
advances have been more significant regarding the use of simulation-based competency
assessment in medical education. In the US, allopathic students take Part 2 of the
USMLE (United States Medical Licensing Examination) and osteopathic students take
Part 2 of the COMLEX (Comprehensive Osteopathic Medical Licensing Examination of
the United States) during their fourth year of medical school (Boulet et al., 2009). Both
exams include a performance evaluation of clinical skills involving standardized patients.
With the implementation of competency exams for both osteopathic and allopathic
boards in the last decade, the need for careful development of valid and reliable
instruments was recognized and significant research was devoted to the development of
instruments in medical education (Gimpel, Boulet, & Errichetti, 2003). However, the
National Council of State Boards of Nursing (NCSBN) has not yet implemented a similar
practical examination for licensure, and nursing is reportedly the only health profession
that does not require one in the U.S. (Kardong-Edgren, Hanberg, Keenan, Ackerman, &
Chambers, 2011).
One major reason for this delay in nursing competency assessment has been the
relatively recent availability of high-fidelity HPSs and the subsequent lag in development
of instruments for providing reliable and valid data for competency measurement.
13
However, attention to reliability and validity issues continues to progress slowly. One
reason is that content experts typically responsible for developing simulations may not
have the psychometric background needed to assess validity and reliability. Simulations
designed to be used with high-fidelity HPSs are becoming commonplace, yet insufficient
attention is usually paid to the assessment of the simulation experience. As we move
toward a time when simulation may be used in high-stakes exams for state licensing in
nursing, “to design a rich simulation environment, to collect data without consideration of
how the data will be evaluated, and hoping psychometricians will somehow ‘figure out
how to score it’ is a bad way to build assessments” (Mislevy, 2011, p. 20). As simulations
are designed, collaboration among the users, the experts, and psychometricians is critical
from the very beginning of the process.
In a recent review of the literature, Kardong-Edgren et al. (2010) reviewed 22
instruments used in HPS, categorized by learning domains (cognitive, psychomotor, and
affective) and those developed for individual or group evaluation. They reviewed articles
in nursing and medical education journals, as well as two simulation journals (Simulation
in Healthcare and Clinical Simulation in Nursing). Of the 22 developed instruments, only
11 authors reported either reliability or validation studies. When reported, reliability was
estimated using coefficient alpha, rater consistency, or percentage agreement. Most often,
only expert review or development was noted in support of validity, although four
authors reported they examined construct validity.
In a more recent study, Adamson et al. (2012) reviewed 48 new instruments used
to evaluate simulation. The majority of instruments were found to focus on participant
reaction and learning, rather than on performance. As Adamson et al. noted, “reaction
14
and learning are often the low-hanging fruit of simulation evaluation” (p. e5), and they
subsequently challenged researchers and practitioners to develop evaluation instruments
targeting participant behaviors and patient outcomes. Reports of reliability and validity
testing were often vague or nonexistent. Cronbach’s alpha was often the sole evidence of
reliability provided (alpha was reported for 16 of the 48 instruments) and, when validity
was even mentioned, only content validity was examined. Reliability was not mentioned
for 20 of the 48 instruments and validity was not mentioned for 31 of the instruments. In
a comprehensive (unpublished) review of the literature from January 2000 until July
2012, 14 instruments that assessed undergraduate nursing students using high-fidelity
simulation were identified in the literature. Reliability was mentioned for 9 of the 14
instruments, but values were reported for only 6 instruments. Of the nine instruments for
which reliability was reportedly evaluated, the type of reliability estimate was not
specified for five of the instruments, while two types of reliability estimates were
calculated for two instruments. Percent agreement was calculated for two instruments,
Cronbach’s alpha for two instruments, the kappa coefficient for one instrument, and the
intraclass correlation coefficient (ICC) for one instrument. Validity testing was
mentioned for only 10 of the 14 instruments; most of these studies only reported content
validity, whereas more than one source of validity was mentioned for only two
instruments. Repeatedly, researchers report insufficient attention to the use and reporting
of validity and reliability testing in observation-based assessment using simulation
(Adamson & Kardong-Edgren, 2012; Cook, Brydges, Zendejas, Hamstra, & Hatala,
2013).
15
Reliability. Reliability in measurement refers to the consistency of data when a
group or population undergoes repeated testing (AERA et al., 1999). If an individual is
assessed repeatedly using the same test, it is probable that his or her score will vary
across the repeated measures as a result of many factors unrelated to the measurement
process or purpose. Because of the variation seen in scores, individual scores and mean
scores of groups always contain measurement error (AERA et al., 1999). Two types of
error affect measurement: random and nonrandom (or systematic). Random error is
inconsistent and unpredictable; all measurement has at least some random error
(Carmines & Zeller, 1979). Random error may include elements such as changes in
attention or motivation (AERA et al., 1999). The amount of random error present is
inversely related to the reliability of the instrument (Carmines & Zeller, 1979).
Nonrandom error, on the other hand, is systematic in its biasing effect. This may involve
issues such as rater or measurement bias. If scores on a test are consistently lower or
higher due to another unintended variable, validity may be affected because another
concept is being reflected by the data in addition to the intended construct (Carmines &
Zeller, 1979). Systematic measurement error is not detected in reliability analyses, but
still affects the interpretability of the measure, and hence its validity, and is considered
construct-irrelevant variance (Axelson & Kreiter, 2009).
In Classical Test Theory (CTT), the true score is the mean score obtained if a
person takes the same test an infinite number of times. Differences among student scores
are reflected by differences in true scores. The difference between an individual’s true
score and his or her observed score is considered measurement error and can be
expressed by the equation, X = T + E, where X = the observed score, T = true score, and
16
E = error score (Brennan, 2011; Harvill, 1991). Extending this concept to a population,
the true score distribution across a group of people is the true score variance, 𝜎𝑇2, the
dispersion of error scores is the error variance, 𝜎𝐸2, and the variation in observed scores is
observed score variance, 𝜎𝑋2. Therefore, the observed score variance is the sum of true
score variance and error variance, σ𝑋2 = σ𝑇
2 + σ𝐸2 (AERA et al., 1999; Axelson & Kreiter,
2009; Harvill, 1991).
The reliability of a test may be expressed using several different expressions. In
CTT, the reliability coefficient of a test, ρ𝑋,𝑇2 , is the ratio of true score variance to the
observed score variance (Harvill, 1991), or the squared correlation of observed and true
scores (Brennan, 2011), ρ𝑋,𝑇2 = σ𝑇
2 / σ𝑋2 . Reliability quantifies how much of the observed
score variance is due to true score variance. Reliability values range from 0 to +1.0. In a
hypothetical situation with no measurement error, the observed score variance equals true
score variance, and reliability equals 1.0. Conversely, if the correlation between observed
and true scores is 0, reliability is 0.
Various ways exist to estimate reliability. One method is to have individuals take
two “randomly parallel” tests. Randomly parallel tests denote that the tests were
developed through a random sample of items from the same item bank. Parallel
measurements have identical true scores and equal variances (Carmines & Zeller, 1979).
If both tests are administered to the same group, the correlation between the two tests is
an estimate of the reliability of the scores (Axelson & Kreiter, 2009). An example of
parallel measurements in observation-based assessment using simulation is when
participants are observed engaging in different scenarios and are evaluated by trained
raters using an instrument assessing competency. The correlation of scores from the two
17
scenarios would be an estimate of their reliability. High reliability would indicate the two
scenarios are parallel.
Reliability estimated by taking the same test, or engaging in the same rated
scenario over multiple occasions is termed test–retest reliability. However, if only one
testing session is available, an alternative is to examine internal consistency. One
approach is the split-half method, in which the assessment is divided into two random
halves which are then used as approximations to alternative forms (Carmines & Zeller,
1979). Application of the Spearman-Brown Prophesy formula is used after calculating the
correlation between scores in the two sections to provide an estimate of reliability for the
whole test. Another common method estimating the internal consistency of item
responses obtained with an instrument is to calculate the average correlation across all
possible splits. Coefficient alpha (or Cronbach’s alpha) is an index of reliability that uses
this method and is often used to estimate inter-rater reliability. As the mean correlation
among items and number of items increases, alpha increases (Carmines & Zeller, 1979).
Inter-rater reliability will be discussed more thoroughly in the next section, due to its
relevance to observation-based assessment.
A reliability coefficient provides information regarding measurement error for a
group, but it cannot be used for individual score interpretation (Harvill, 1991). Rather, the
standard error of measurement (SEM) is used for this purpose. As defined by the
Standards (AERA et al., 1999), the SEM is “the standard deviation of an individual’s
observed scores from repeated administrations of a test (or parallel forms of a test) under
identical conditions” (p. 182). The SEM is a measure of the variability of errors of
18
measurement. The square root of the error variance, √σ𝐸2 , results in the equation for SEM
(Brennan, 2011; Harvill, 1991):
SEM = σE = σX √1 − ρ𝑋,𝑇2 . (1)
The SEM is a measure of the reliability of an individual’s score and can be used to form
confidence intervals for scores.
Inter-rater reliability. A popular method to evaluate reliability in observation-
based assessment is inter-rater reliability (IRR), a measure of the degree that various
raters agree when using an instrument to measure performance. Inter-rater reliability is
not the only source of reliability in this situation, yet it is often the only one reported in
studies. In teacher assessment, for example, other sources of variability that affect
reliability may include the lessons and interactions between raters, teachers, and lessons
(Hill et al., 2012). Similarly, in healthcare contexts, the numbers and types of scenarios
in simulations may affect the reliability of observation-based measures of clinical
performance. Inter-rater reliability can be calculated through various statistics. One of the
simplest methods is to measure consensus with the percent agreement among raters. If
estimating the consistency of scores is desired, statistics such as Pearson’s r, Spearman’s
rho, or Cronbach’s coefficient alpha may be used. Pearson’s r may be used with interval
levels of measurement; Spearman’s rho is based on rank ordering of data; and coefficient
alpha averages correlations across all raters. Finally, generalizability theory is useful
when sources of variability in addition to raters are considered and a more comprehensive
way of reliability estimation is needed.(Axelson & Kreiter, 2009).
19
Other sources of variability affecting reliability. Using measures such as
coefficient alpha or percent agreement to calculate inter-rater reliability limits analyses in
observation-based assessment. Agreement among raters is certainly a critical component,
however, inter-rater agreement is not sufficient for making decisions regarding the
number of observations needed for establishing reliability of examinee scores in high-
stakes assessments. For example, in teacher evaluation, decisions made by state
legislators about the number of observations required have not been based on evidence
from scientific study (Hill et al., 2012). Other issues affecting the use of an instrument
pertain to its design. For example, the number of items on an instrument has been shown
to directly affect raters’ cognitive load (Hill et al., 2012). Rater fatigue due to lengthy
instruments can adversely affect the reliability of data. The number of items on teacher
evaluation instruments varies considerably, yet Hill et al. (2012) found no studies
examining how the number of items on teacher evaluation instruments might affect
raters’ performance and evaluation scores. Rater fatigue and memory limitations due to
length of the instrument are important considerations, but may not affect inter-rater
reliability statistics. To the contrary, high inter-rater reliability of data is still possible
with an instrument that demonstrates other reliability issues concerning scores. As noted
in the Standards (AERA et al., 1999), “high inter-rater consistency does not imply high
examinee consistency from task to task. Therefore, internal consistency within raters and
inter-rater agreement do not guarantee high reliability of examinee score” (p. 34).
Generalizability theory. Traditionally, CTT is often used as a framework to
examine reliability and measurement error (Boulet, 2005). A major limitation of this
method is that sources of error are undifferentiated. As an alternative to CTT,
20
generalizability (G) theory may be used to evaluate observational systems and improve
the estimation of reliability (Boulet & Murray, 2010; Briesch, Swaminathan, Welsh, &
Chafouleas, 2014; Hill et al., 2012; Kreiter, 2009). In G theory, analysis of variance
(ANOVA) is used to identify the various sources and magnitude of error. A difference
between ANOVA and G theory is that rather than emphasizing tests of statistical
significance (Boulet, 2005) or F tests (Brennan, 2011) as in ANOVA, G theory focuses
on the estimation of variance components (Brennan, 2001).The conceptual framework of
G theory involves universes of admissible observations, generalizability (G) studies,
universes of generalization, decision (D) studies, and universe scores (Boulet, 2005;
Brennan, 2001). The statistical estimates of importance are variance components, error
variances, and coefficient indices.
In G theory, the term universe refers to conditions of measurement. Universes of
admissible observations are those conditions, or facets, that are interchangeable and are
sources of variation in scores. The researcher is willing to exchange a sample of
observations with any other sample in the universe of admissible observations. In the
evaluation of teachers through observation of classroom interactions, possible facets may
be raters, lessons, or subject matter. In nursing competency assessment using simulation,
facets may be raters and scenarios. Facets are admissible conditions of measurement and
the investigator defines the universe for these facets. The object of measurement, on the
other hand, is not a facet. Rather, the term population refers to the object of measurement.
In the prior examples, teachers or nurses who are being observed and evaluated are the
populations of interest or objects of measurement. Using the nursing competency
21
example, if a rater (r) evaluates a single nurse (p) during one simulated scenario (s), the
resulting observed score (X) can be denoted by:
Xprs = μ + vp + vr + vs + vpr + vps + vrs + vprs, (2)
where μ is the grand mean of the population and universe and the v’s are the effects in
this design (Brennan, 2001).
Once the universes of admissible observations are identified, the next step in G
theory is to conduct a G study, where variance components are estimated. If a study
involves a sample of raters (nr) assessing a sample of experienced nurses (np) during a
sample of simulation scenarios (ns), this would be a two-facet design denoted by p x r x s.
If all levels of raters observe all levels of nurses participating in all levels of scenarios,
this is a crossed design. If the levels of a facet are only seen in combination with certain
levels of other facets, the design is nested (Boulet, 2005; Brennan, 2001). Variance
components associated with a universe of admissible observations are then estimated
(Brennan, 2001). G studies enable researchers to “…decompose variability in teacher
scores into different components (e.g., teachers, lessons, and raters), their interactions,
and measurement error” (Hill et al., 2012, p. 58). In healthcare simulation, G studies can
be used to examine measurement error within a multi-scenario assessment using multiple
raters (Boulet & Murray, 2010).
The estimates of variance components can then be operationalized to design
efficient measurement procedures and to make decisions about objects of measurement in
D studies (Brennan, 2001). This involves specifying a universe of generalization,
including any or all the facets from the universe of admissible observations. In the
nursing competency example, the researcher may want to generalize scores from the G
22
study to scores for a universe of generalization including other raters and simulation
scenarios. If these universes of facets are theoretically infinite, the model design is
considered random. If, however, the conditions of the facet used in the study include all
conditions of interest to the researcher, the facets and model design are fixed (Shavelson
& Webb, 1991). Determining if the facets are random or fixed has implications for the
generalizability of the measurement. D study designs are similar to G study designs.
However, in D studies, sample sizes may differ from those used in the G study (Kreiter,
2009) and D studies use persons’ mean scores while G studies focus on individual
observations. Thus, the design for a D study using the above nursing competency
example would be p x R x S. Uppercase letters are used for the facets of raters and
scenarios in the D study to designate mean scores.
D studies may be used in observation-based assessments to select optimal designs
and to further improve instruments used for measurement. For example, in teacher
assessments, the number of raters, number of observed lessons, and length of
observations needed to achieve optimum reliability levels may be determined. Hill et al.
(2012) describe the use of D studies for studying an instrument, the Mathematical Quality
of Instruction (MQI), used to evaluate mathematics instructors. Using feedback from
raters, rater limitations were established for maximum length of observations to be
viewed and cut scores were defined for rater inclusion based on the number of points
raters deviated from master scores and the percentage of time they deviated from the
master score. In observation-based assessment using simulation, D studies can be used to
find the best scoring design, including how many raters per interaction and number of
scenarios that should be used for high reliability (Boulet & Murray, 2010).
23
A person’s expected mean score over every possible measurement instance in a
universe of generalization is the universe score. The universe score variance is the
variance of universe scores for a population (Boulet, 2005; Brennan, 2001). The universe
score variance can be compared conceptually to CTT’s true score variance. A major
difference between CTT and G theory, though, is the partitioning of observed variance. In
CTT, observed score variance can only be divided into two parts: true score variance and
error variance. From this, the reliability coefficient is the proportion of the observed
variance that is true variance. In G theory, error variance may be partitioned into its
components so that the contributions of each facet are identified and quantified. Using the
prior example of a fully crossed, two-facet design, in G studies, the total observed score
variance is calculated by:
σ2(Xpsr) = σ2(p) + σ2
(s) + σ2(r) + σ2
(ps) + σ2(pr) + σ2
(sr) + σ2(psr), (3)
and the separate variance components are estimated using expected mean square
equations (Brennan, 2011). Estimated variance components are then “used to estimate
universe score variances, error variances, and reliability-like coefficients” (Brennan,
2011, p. 10).
In order to generalize from an observed score on a measurement sample to the
universe score, it is important to estimate the inaccuracy of this generalization, so the
measurement error is calculated (Shavelson & Webb, 1991). When making absolute
decisions, such as when a person’s absolute level of performance is measured and their
standing relative to others is irrelevant, the absolute error variance is estimated.
Continuing with the prior example of a fully crossed, two-facet design, absolute error
(Δp) is the difference between a person’s mean score over a sample of scenarios and
24
raters (XpSR) and universe score (μp), ΔpSR = XpSR – μp ,and the absolute error variance,
σ2(Δ), is the sum of all the variance components except the universe score variance, σ2(p)
(Brennan, 2011; Webb, Shavelson, & Haertel, 2006):
σ̂2(𝛥) = σ̂
2(𝑆) + σ̂2(𝑅) + σ̂2(𝑝𝑆) + σ̂2(𝑝𝑅) + σ̂2(𝑆𝑅) + σ̂2(𝑝𝑆𝑅). (4)
The square root of the absolute error variance is the estimate of the absolute SEM;
smaller SEMs translate to observed scores clustering more closely around the true score.
Confidence intervals (CIs) for universe scores may be calculated using the SEM, where
95% CI = universe score ± 1.96 X 𝑆𝐸𝑀 (Briesch et al., 2014).
If relative decisions are being made, for example, when a person’s score relative
to others in a group is calculated, then relative error variance is estimated. Relative error
(δp) is defined as the difference between a person’s observed deviation score and his or
her universe deviation score (Brennan, 2001; Brennan, 2011):
δpSR = (XpSR – μSR) – (μp - μ). (5)
The relative error variance, σ̂2(δ) ,
σ̂2(δ) = σ̂
2(𝑝𝑆) + σ̂2(𝑝𝑅) + σ̂2(𝑆𝑅) + σ̂2(𝑝𝑆𝑅), (6)
is similar to CTT error variance (Brennan, 2011). The relative SEM is calculated as the
square root of the relative error variance. and confidence intervals may be estimated
using the relative SEM.
Absolute error variance is larger than relative error variance because all sources of
variance except for person-related variance are used to calculate absolute error variance.
Only the variance components that involve an interaction with the person facet contribute
to the relative error term (Briesch et al., 2013). Since calculation of the absolute error
25
variance involves the sum of more variance components than the absolute error variance,
it is always larger.
Two types of reliability-like coefficients are calculated in G theory, dependent
upon whether interpretation is norm-referenced or criterion-referenced (Brennan, 2001).
When norm-referenced interpretations are made, scores of individuals are compared to
those of his or her peers, resulting in a relative model of measurement. In this case, the
generalizability (G) coefficient, Ερ2, is used. This is the ratio of universe score variance
to the sum of universe score variance and relative error variance (Boulet, 2005; Brennan,
2001; Kreiter, 2009):
G = Eρ2 = σ2(𝑝)
σ2(𝑝)+ σ2(δ) . (7)
For criterion-referenced interpretations, when an individual’s score is compared to
an absolute standard, an absolute model of measurement is used (Brennan, 2001), and the
index of dependability (or the dependability coefficient), phi (φ), is calculated (Boulet,
2005, Brennan, 2001; Shavelson & Webb, 1991). This is the ratio of universe score
variance to the sum of universe score variance and absolute score variance (Boulet, 2005;
Brennan, 2001; Kreiter, 2009):
Φ = = σ2(𝑝)
σ2(𝑝)+ σ2(Δ) . (8)
Since relative error variance is always smaller than absolute error variance, it
follows that the generalizability coefficient will be larger than the dependability
coefficient.
An important issue is that reliability studies of measures that rely solely on
Cronbach’s alpha or inter-rater reliability coefficients often miss critical information that
26
G studies may highlight. For example, in the teacher observation instrument study Hill et
al. (2012) examined, two items had similar inter-rater agreement (69% and 55%), yet a G
study showed that the portion of variance attributed to raters for both items was rather
low (less than 10%), while variance attributed to teachers varied tremendously (1% and
40%). Two other items each had high rater agreement (85% and 83%), yet very little of
the score variance on these items was due to teachers in the G study. The reason for high
agreement was many raters did not observe the particular element addressed by the item.
Thus, G studies allow for a clearer understanding of the instrument than is found if only
inter-rater reliability studies are used. Identifying items that have high or low rater
agreement is insufficient for understanding how well those items contribute to
measurement of the intended construct or to improvement of the quality of the
assessment instrument. Rather, identifying the magnitude of various sources of error
allows for more meaningful analysis and improvement of the instrument.
Although generalizability theory has been used to measure competency in
medicine (Boulet et al., 2003), no evidence of its use has appeared thus far in the
literature regarding measures of nursing competency. As previously noted, not even the
fundamental concept of reliability is addressed universally in research involving
competency assessment in healthcare (Adamson et al., 2012; Kardong-Edgren et al.,
2010).
Validity. Validity evidence is required when interpreting data and making
decisions based on assessment results. It is important to note that it is possible for scores
from assessments to be reliable, yet show little to no validity. According to the Standards
(AERA et al., 1999), “validity refers to the degree to which evidence and theory support
27
the interpretations of test scores entailed by proposed uses of tests” (p. 9). In observation-
based assessment, various sources of validity should be examined. A dated view of
validity was based on a three-level model, encompassing content, criterion-related, and
construct validity (Downing & Haladyna, 2009). The contemporary view, however, is
that validity is a unitary concept and various sources of evidence, e.g., content, criterion-
related, and construct validity, are required to support the validation of the data for the
intended purpose (AERA et al., 1999; Messick, 1995).
One source of validity evidence is based upon the relevance of the content of the
measure to the content domain (Goodwin, 2002). To achieve a high level of validity, the
modeling of actual practice situations is naturally a prerequisite. Boulet and Murray
(2010) propose that feedback from stakeholders will provide evidence of content validity,
whereas observation-based rubrics need to define the skill sets to be assessed and
measures must be developed using evidence such as practice-based guidelines. Ways to
gather evidence of validity may involve identifying related skills and reviewing resulting
scores for relationships among these skills.
Another source of validity evidence is based on response processes (AERA et al.,
1999; Downing & Haladyna, 2009). Through debriefing of the participants or examinees,
greater understanding of what is being measured related to the intended score
interpretations can occur. Validity evidence based on the internal structure of the
assessment must also be reviewed. Reliability of scores, item analyses, and DIF studies
are helpful in providing this needed evidence (Downing & Haladyna, 2009). In addition,
criterion validity, or the relationship between assessment scores and external measures of
28
the criteria can be examined. However, to examine criterion validity related to
instruments, other instruments with proven validity are needed (Pelgrim et al., 2011).
Last, Pelgrim et al. (2011) suggested that validity evidence based on constructs
can be determined by examining increases in scores longitudinally. If scoring directly
assesses the intended constructs, then more participants with more expertise should earn
higher scores (Boulet & Murray, 2010). In observation-based assessment of simulation in
healthcare, the strongest evidence of validity is when a relationship between simulation
performance and patient care is seen. Although few patient outcome studies are available,
Boulet and Murray (2010) reported evidence of transfer to the real world in studies that
examined error rates in anesthesia. Evidence relating scores to intended consequences is
an aspect of construct validity.
Delphi technique. An important way to improve reliability and validity in
observation-based assessment using simulation is to decrease bias (Hasson & Kenney,
2011; Rosen et al., 2008). To provide validation, it is critical to ensure simulations
include patient issues commonly seen in healthcare, rather than including only cases that
involve ‘favorite’ or random diagnoses. Also, scenarios must involve appropriate
portrayals of patient conditions and care, and identify necessary participant actions for
the assessment and management of patients. To achieve this, a review of common
medical conditions and practice guidelines is required to ensure the simulation is
evidence-based. Scenarios should be developed using a structured process that supports
validation. Boulet and Murray (2010) recommended a validation process that makes use
of an expert panel to apply a structured Delphi technique, both for identifying critical
29
skills and knowledge and for developing the appropriate simulation scenario to assess
those skills and knowledge.
Many definitions for the Delphi technique are found (Hasson & Keeney, 2011),
originating with Dalkey & Helmer’s (1963) description as “a method used to obtain the
most reliable consensus of opinion of a group of experts by a series of intensive
questionnaires interspersed with controlled feedback” (p. 458). The Delphi survey
technique is used to reach group consensus when making decisions involving a variety of
information (Hasson & Kenney, 2011). It involves input from a group of experts through
rounds of anonymous questionnaires. The selection of experts must represent a balanced
and varied group of interested and informed individuals. The participants’ anonymous
responses to the questionnaires are then summarized and provided back to the group.
Examples of questions on the questionnaire may require responses signifying agreement
to the inclusion of specific information on the proposed simulation scenario or may
solicit additional information participants deem important to include. In an iterative
process, individual opinions are processed into group consensus. Participants do not need
to meet in person and participants may change their opinions throughout the multi-stage
process of controlled feedback.
The classical Delphi technique involves communication by postal mail and a
minimum of three rounds, with the first round consisting of open-ended questions that
encourage maximum input from responders. Various forms of this technique have been
developed (Hasson & Keeney, 2011), including one referred to as the ‘Modified Delphi
Technique’ (Hasson, Keeney, & McKenna, 2000). The modified approach may be
administered in a variety of ways, including online, may involve fewer than three rounds,
30
and may be initiated with pre-existing information, which participants provide input
through rankings or other responses (Hasson & Kenney, 2011). One consideration is the
size of the group; a larger group means a greater representation of views and more data.
The sample size needs to be manageable, however, especially when qualitative
information is being gathered. The number of rounds needed depends upon several
factors, including time available, breadth and number of questions asked, and fatigue of
participants. Although four rounds were originally supported in the literature for the
classical approach, two or three rounds have more recently been supported as sufficient,
and research supports consensus as acceptable when 51% to 80% agreement has been
reached (Hasson et al., 2000). Round one data can be analyzed by grouping items and
identifying universal descriptions. Round two involves the analysis of round one results
with further requests for input, and, if three rounds are conducted, the results of round
two responses are provided via statistical information.
A modified Delphi technique is one method that can be used as a structured
validation process. Most articles found in the literature describing validation processes
used in instrument and scenario design for observation-based assessments in nursing only
mention review of content by experts. Typically, no details of the process are provided,
and evidence of validity is not thoroughly described. Using a process such as the
modified Delphi technique encourages structured expert input and decisions based upon
this input provide a strong evidence-based validation process.
31
Designing an Observation-Based Assessment System in Healthcare Using
Simulation
Educators often develop a written assessment after they have already developed
lessons and activities for teaching a concept. Only after instruction has taken place do
many educators consider how to properly assess student learning, forgetting that
assessment should be developed directly from learning objectives (Thorndike, 2005).
Unfortunately, developers of observation-based assessments using simulation often make
the same mistake, designing the assessment after they have a simulation scenario in mind
(Rosen et al., 2008). In both cases, the objectives or purposes need to be established
before the development of the assessment instrument. The next step is to specify the
knowledge and skills to be evaluated, keeping in mind the participant’s ability level
(Boulet & Murray, 2010). Only after these steps should the evaluator design the learning
material or the scenario in which the needed skills are part of the framework.
Rosen et al. (2008) describe 11 best practices in designing team performance
measurement in simulation-based training. Applicability of these measures to most types
of performance-based assessment--both formative and summative, for individual or team-
based designs--is apparent. To briefly summarize some of Rosen’s et al. best practices,
measures must first be grounded in theory (Manser, 2008; Salas, Rosen, Held, &
Weissmuller, 2009). Rosen et al. recommend reviewing the literature to find theories and
frameworks to help focus on what is important to measure. This helps avoid the common
measurement trap of simply measuring whatever is easy to measure. Also, specific
learning outcomes need to be identified. Measures for high-stakes evaluation must be
differentiated from those used in training. The validity of the measure is important to
32
ensure the measurement of intended constructs and intended competencies. Adopting
generic measurement tools may not meet this practice. If measuring team performance,
multiple levels of performance should be measured to distinguish between individual and
team level deficiencies. Next, measures need to be linked to scenario events by the
insertion of critical events. These events are linked to training objectives. Also, a focus
must be on observable behaviors. Rosen et al. warn against the bias and error seen with
some global rating scales and self-report measures. Rater training is important to obtain
high inter-rater reliability and structured observation protocols are necessary to train
observers to be consistent. Obtaining multiple measures from different sources also helps
decrease measurement error.
Two types of scales have been identified in the literature used in observation-
based assessment in healthcare using simulation assessments: 1) explicit process and 2)
implicit process (Boulet & Murray, 2010; Kerns & Dhingra, 2012). Explicit process
scales include checklists or key actions. These scales are types of analytic measurement
tools and are well-suited when objective scoring of observed behaviors is possible, such
as is typical when scoring technical skills. However, checklists may be more difficult to
use when timing or sequencing of actions is important. Also, although the objective use
of these tools is fairly straightforward, the development process can be quite subjective.
Implicit process scores involve holistic, or global, rating scales (Boulet & Murray,
2010). Holistic and global are terms that appear to be used interchangeably in the
literature. These types of scales are useful for rating an entire performance and for
complex, multidimensional constructs which cannot be reasonably broken down into
isolated key actions. Examples would be non-technical skills such as communication and
33
planning. These instruments can be psychometrically sound when rater training is
carefully conducted, bias is reduced, and validity is increased (Boulet & Murray, 2010).
Also, score equating can be conducted if differences in raters are found to be systematic,
e.g., if particular raters consistently provide higher or lower ratings.
In both types of scales, anchoring of the scale is necessary (Boulet & Murray,
2010). Anchors involve key actions for analytic tools, whereas holistic tools require
raters to be well-versed on the construct they are measuring. Raters must be able to
recognize differences in performance or behaviors. The careful training of raters is a
critical step in observation-based assessment. A quality rater training program should
involve practice rating benchmarked vignettes and measures of quality assurance, as well
as refresher training. When checklists and holistic types of scales were compared (Boulet
& Murray, 2010), the relative ranking of participant skills varied little. However, each
has advantages in certain circumstances. Key action scales seem to more easily enlist
agreement among raters as to what the ‘key actions’ actually are, while obtaining
agreement in identifying behaviors on holistic scales may be more challenging. However,
sequencing of actions is not easily accomplished with key action scales. On the other
hand, global, or holistic, scales can be psychometrically sound and may be more useful
when complex and multidimensional behaviors are being assessed.
Nursing Performance Profile
Establishing processes for measuring nursing competency is critical. This topic is
expected to be a major focus of nursing education and licensure boards in the coming
years, as the need for establishing nursing competency is paramount for ensuring safe
patient care practices. Reports have been issued by the Carnegie Foundation for the
34
Advancement of Teaching, National Council of State Boards of Nursing, and the Joint
Commission on Accreditation of Hospitals indicating the need for nurses to be better
prepared for clinical practice (Meyer, Connors, Hou, & Gajewski, 2011).
Recommendations stemming from the Carnegie Foundation Report on Nursing Education
have been made to the National Council of State Boards of Nursing to pursue the
development of a set of three national, simulation-based examinations of nursing
performance, the first to begin before students graduate from nursing school with the
third test finalizing licensure after one year of a proposed residency program (Kardong-
Edgren et al., 2011). State boards of nursing and nursing schools are increasing efforts to
develop performance-based assessments to meet this goal. A review of the literature to
identify simulation-based assessment in the regulation of healthcare professionals by
Holmboe et al. (2011) found that no states have thus far required a clinical exam for
graduating nurses. However, Drexel University has reportedly instituted a standardized-
patient-based exam as a requirement for graduation for undergraduate nurses (Holmboe
et al., 2011). Preparing for the eventuality of the use of simulation in high-stakes
summative assessment, the International Nursing Association for Clinical Simulation and
Learning (INACSL) included the “Evaluation of Expected Outcomes” in 2011 as
Standard VII of the Standards of Best Practice (The INACSL Board of Directors, 2011),
emphasizing criteria for achieving valid and reliable results. In 2013, INACSL further
strengthened their support of the development of evidence-based instruments designed to
measure outcomes using simulation in nursing, focusing on issues of reliability, validity,
and standardization (Sando et al., 2013). Organizations such as INACSL and the Society
for Simulation in Healthcare (SSH) help provide a forum for collaboration and reporting
35
of advances for researchers in observation-based assessment in simulation. Much work
still remains to be done if effective, psychometrically-sound instruments are to be
available for measuring the competency of pre-licensure and post-graduate nurses.
In response to this need, the Nursing Performance Profile (NPP) instrument was
recently developed through a collaboration of three entities: the Arizona State Board of
Nursing (ASBN), the Arizona State University, and Scottsdale Community College
(Hinton et al., 2012; Randolph et al., 2012). Funding from the National Council of State
Boards of Nursing (NCSBN) Center for Regulatory Excellence (CRE) supported the
development of an instrument that measures nine categories of clinical competence:
professional responsibility, client advocacy, attentiveness, clinical reasoning (noticing),
clinical reasoning (understanding), communication, prevention, procedural competency,
and documentation (Randolph et al., 2012). These nine categories were identified based
upon modifications of the Taxonomy of Error Root Cause Analysis and Practice
Responsibility (TERCAP) categories (Benner et al., 2006) and items from the NCSBN
survey tool, the Clinical Competency Assessment of Newly Licensed Nurses (CCANLN;
as cited in Randolph et al., 2012; NCSBN, 2007). The nine categories include 41 items
scored on a dichotomous scale. Raters determine whether a nurse’s performance on each
item indicates competent or incompetent behavior. The development and characteristics
of the NPP instrument is explained in more depth in the next chapter under
“Instrumentation”.
Next, the authors of the NPP instrument developed three scenarios that involved
common adult health situations and required nursing actions and behaviors involved in
the care of a patient. Using high-fidelity simulation, the scenarios underwent an extensive
36
validation process and the inclusion of all NPP items was supported. Data was collected
using 21 RN volunteers resulting in 63 videos using all three scenarios. Three raters,
blinded to participant ability and scenario order to prevent bias, viewed each video
independently.
Following peer review and an extensive process of data collection and analysis,
the MCWS Phase 1 study was published, and the NPP instrument has subsequently been
used, along with the original three scenarios, to provide objective data in assessing nurses
referred for evaluation from the ASBN in identifying unsafe nursing practices. Three
raters examine videos of each RN’s performance; raters are blinded to the order of the
scenarios completed by participants.
Based upon available research, the NPP instrument is one of the few instruments
that has undergone validity and reliability testing, and is the only one used to evaluate
professional nursing competency at the state level. Building upon the research and
analysis already conducted on the NPP instrument and the accompanying scenarios, the
current study was intended to provide a deeper analysis of the reliability of data obtained
by the instrument and, through the use of a Modified Delphi Technique, provide
additional validity testing in the development of a new scenario for use with the NPP
process.
Purpose of the Study
Given the importance of authentic assessment of healthcare practitioners’ skills
for interaction with and diagnosis of patients, it is critical to address the psychometric
challenges unique to the development and validation of simulation-based assessments in
the context of healthcare training. The NPP is an instrument used to assess the
37
competency of experienced registered nurses who have been referred to the Arizona State
Board of Nursing for further review of their skills and knowledge. Collaborators from the
Arizona State Board of Nursing (ASBN), Arizona State University, and Scottsdale
Community College (Randolph et al., 2012), with funding from the National Council of
State Boards of Nursing (NCSBN) Center for Regulatory Excellence (CRE; Hinton et al.,
2012; Randolph et al., 2012), developed the NPP and three simulation scenarios during
the Measuring Competency with Simulation (MCWS) Phase I project. During MCWS
Phase I, 21 volunteer registered nurses experienced three scenarios and expert nurse
supervisors rated their competency using the NPP. Reliability was examined using inter-
rater agreement, intra-rater reliability, and internal consistency of items (Hinton et al.,
2012). Inter-rater agreement was measured by the percentage of agreement by at least
two of the three raters on each item and internal consistency of items on the NPP was
estimated using Cronbach’s alpha. As noted by Boulet and Murray (2010), inter-rater
reliability is important to examining the overall reliability of data obtained by
observation-based assessment instruments, but an examination of other sources of error is
also critical to achieve a more complete understanding of an assessment’s reliability.
Measurement error associated with the scenarios has not been analyzed and the optimum
number of raters and scenarios to achieve high reliability has not been identified. The
high stakes nature for which this assessment is intended warrants further study of its
reliability. No known studies for any competency measure in nursing education or in
professional nursing practice have been found that address this issue. Although attention
to reliability and validity is increasingly being reported in the literature, often only
coefficient alpha or inter-rater reliability statistics are provided to satisfy reliability
38
testing, and usually only vague references are made to experts ensuring content validity.
No studies have discussed the need to identify a minimum number of scenarios or
minimum number of raters in order to achieve high reliability in observation-based
assessment in nursing. On the other hand, studies conducted in medical education using
standardized patients and HPSs have successfully utilized generalizability theory to
determine the number of scenarios and number of raters needed for reasonable reliability
estimates (Boulet & Murray, 2010; Boulet et al., 2003)
The purpose of the current study is twofold. First, the psychometric qualities of the
simulation-based NPP instrument were examined. In a secondary analysis of data
collected from 18 registered nurses who completed three simulation scenarios and were
each scored by three raters using the NPP instrument, generalizability theory was applied
to determine the optimal numbers of scenarios and raters required to achieve high
reliability. Generalizability theory was used to analyze the sources of variance and
determine the optimal conditions for measurement. This was accomplished through both:
(a) a generalizability (G) study, in which variance components were estimated; and (b) a
decision (D) study, in which reliability coefficients for the design used in the G study
were estimated and the effect on reliability of alternate designs was examined. Variance
components were estimated and then used to estimate error variances and reliability-like
coefficients.
Second, a protocol was developed for creating and validating simulation scenarios for
measuring nurse competency, followed by the application of this protocol to create an
additional simulation scenario for the NPP. New scenarios are desired to expand the
simulation context of the NPP for assessing nursing behaviors expected of experienced
39
nurses. The protocol included the evidence-based design of the patient’s management,
utilizing clinical guidelines from the Agency for Healthcare Research and Quality for the
content of the scenario. Inclusion of all expected nursing behaviors and actions required
for safe assessment and management of a patient hospitalized with the chosen medical
condition was ensured through validation of the scenario. This entailed comparing the
content of the scenario to content of the domain by examining practice guidelines and
actual hospital protocols. A modified Delphi technique was used in the validation
process, ensuring a structured process of obtaining input and consensus from experts in
simulation and nursing. The kappa statistic for inter-rater reliability among the expert
group and percent agreement were calculated for inclusion of key content in the scenario.
Response processes of the validation team were summarized and analyzed to determine
specific areas of agreement and identify areas for revision. Subsequent rounds were
conducted with the goal of reaching consensus on inclusion of scenario elements.
In the next chapter, the methods used to conduct both components of this study will
be described in detail.
40
Chapter 2
Methods
The purpose of this study is twofold. First, a secondary analysis was conducted to
examine the reliability of data obtained with the NPP instrument using generalizability
theory, a statistical analysis method that quantifies various sources of measurement error
in a G study and determines effects of different designs on reliability estimates in a D
study. Second, a methodology for designing a new scenario for use with the NPP was
developed and implemented for the purpose of standardizing scenario development and
validation practices for observation-based assessments that employ simulation.
Part I: Reliability Analysis of MCWS Phase I Data
Participants. Addressing the need for a process to measure the competency of
nurses undergoing investigation for practice breakdown, the Arizona State Board of
Nursing (ASBN), the Arizona State University (ASU), and Scottsdale Community
College (SCC), with funding from the National Council of State Boards of Nursing
(NCSBN) Center for Regulatory Excellence (CRE), collaborated on the Measuring
Competency with Simulation (MCWS) Phase I project (Hinton et al., 2012; Randolph et
al., 2012). The project resulted in the development of the NPP and three simulation
scenarios. The original study protocol was approved by the ASU and Maricopa County
Community College District (MCCCD) Institutional Review Boards (IRB) and
designated exempt from full review. I was later added as an investigator for secondary
analysis of the data and then received ASU IRB approval for the scenario validation
process (see Appendix A for IRB documents and communications). The MCWS Phase I
project included 21 participants. As described in the next section on raters, in order to
41
ensure the current study design was fully crossed (i.e., all raters evaluated all videos, and
thus, all scenarios), three of these participants were not included, resulting in 18
participants in this secondary analysis. All participants were practicing registered nurses
working in either academic or professional settings at the time they were involved in the
study. Demographic data were only available for 16 of the 18 participants. The mean age
of the 16 participants was 31.81, SD = 8.90. The 16 participants were 100% female and
the racial/ethnic distribution was 56.25% white, 25% Hispanic, and 18.75% black. The
majority of participants had associate’s degrees (75%) and 25% had bachelor’s degrees.
Only 10 of the 16 participants reported more than one year of experience as an RN (M =
1.35, SD = .74). The remaining six participants received their RN license less than one
year previously. The sample comprised fairly inexperienced nurses, such that they likely
resembled somewhat closely those who would be evaluated by the NPP. No simulation
experience was reported by 18.75%, some experience was reported by 68.75%, and
frequent simulation experience was reported by 12.5%.
Raters. Four subject matter experts evaluated the videos, with three of the four
raters evaluating each video. They were blinded to participant abilities and order of
scenarios, and they assessed each video independently. Each video recording was of one
nurse participant engaged in one scenario, and each participant was assessed using three
scenarios. Two of the raters viewed all 63 videos of the 21 participants and evaluated
each using the NPP instrument. However, the two other raters did not view all of the
videos. One viewed 54 videos (i.e., from 18 participants) and the other viewed 9 videos
(i.e., from 3 participants). A crossed design, where all raters viewed all videos (and thus
all scenarios), is required to fully examine the facets of raters and scenarios, so results of
42
the rater who scored three participants (nine videos) were excluded from the analysis.
The possibility of requesting the rater who completed 54 videos to return and rate the
remaining 9 videos was explored, but IRB restrictions prevented contact with the
anonymous rater. Consequently, 18 of the original 21 participants were included in the
current study, which resulted in 54 NPP forms available for analysis. The three raters
whose data were used in this secondary analysis had an average of 9.67 years (SD =
10.69) of experience in nursing, had a minimum of three years of nursing practice, had
experience evaluating nursing performance, were aged 32 to 51 years, were white and
female, and all had a bachelor’s degree.
Measures.
Instrumentation. The ASBN, the Arizona State University, and Scottsdale
Community College developed the NPP instrument with funding by the NCSBN CRE
and approval of the ASU and MCCCD IRB’s (Hinton et al., 2012; Randolph et al., 2012).
The purpose of the NPP is to differentiate between minimally competent registered
nurses and those requiring remediation. It provides evidence to nurse regulators in
investigations involving questionable nursing practice behaviors. The instrument
measures nine categories of clinical competence: professional responsibility, client
advocacy, attentiveness, clinical reasoning (noticing), clinical reasoning (understanding),
communication, prevention, procedural competency, and documentation (Randolph et al.,
2012). The nine categories were developed using the TERCAP categories (Benner et al.,
2006) and the NCSBN survey tool, the CCANLN (as cited in Randolph et al., 2012;
NCSBN, 2007).
43
The TERCAP categories are based on root cause analysis (RCA), a method
widely used in healthcare to analyze serious adverse events. The method originated with
industrial accident investigations, and is now used extensively as an error analysis tool in
healthcare (Agency for Healthcare Research & Quality, 2012). In 1997, in an effort to
improve patient safety, the Joint Commission on the Accreditation of Healthcare
Organizations (JCAHO) began requiring the use of RCA to investigate sentinel events in
hospitals (Uberoi, Swati, Gupta, & Sibal, 2007). Utilizing data gathered through this
process, TERCAP is an investigative intake instrument that was developed by the
National Council of State Boards of Nursing (NCSBN) to classify and describe the
causes of nursing practice breakdown reported to state boards of nursing (Benner et al.,
2006). It includes an in-depth analysis of nurse and patient characteristics, types of
nursing practice breakdown, and related system characteristics. The data is used in a
national database. Safe nursing practice is reflected through eight TERCAP categories:
safe medication administration, documentation, attentiveness/surveillance, clinical
reasoning, prevention, intervention, interpretation of authorized provider’s orders, and
professional responsibility/patient advocacy (Benner et al., 2006). This data informs
efforts to improve patient safety and prevent future adverse events through policy
initiatives and nursing education.
The CCANLN is a 35 item survey tool used to measure clinical competency,
practice errors, and practice breakdown risk using a Likert-type scale and is administered
to nurse-preceptor dyads (Randolph et al., 2012). The authors of the NPP received
permission to categorize CCANLN items into the modified TERCAP-based categories.
Items and categories were added and edited, resulting in the final nine-category
44
instrument consisting of 41 items. The number of items per category ranged from four to
eight. The scale was changed from a Likert-type scale to a dichotomous scale because the
purpose of the assessment was to clearly identify incompetent versus competent
behaviors and not rank behavior for each item on an ordered scale ranging from
incompetent to competent.
A pilot scenario was developed and volunteer nursing students were recorded
participating in the pilot scenario (Randolph et al., 2012). Content experts scored the
performances using the NPP instrument on two separate occasions (in order to estimate
intra-rater reliability). The mean percentage of rater agreement over all items was
reported at 92% for five raters (who were registered nurses with supervisory experience),
Cronbach’s alpha was .93, and intra-rater reliability ranged from 85% to 97%, with a
mean of 92% across all raters (Randolph et al., 2012).
Hinton et al. (2012) reported the nine categories include 41 items scored on a
dichotomous scale indicating competent or incompetent behavior and actions. Although
Randolph et al. (2012) reported that the scale used in the NPP is dichotomous, a third
rating category was also used if the rater did not believe an opportunity to observe the
behavior existed in the scenario. Each item thus had three possible responses: 1 =
performed consistently with standards of practice and was free of actions that may place
the patient at risk for harm (representing competent behavior); 0 = performed in a way
that exposed the patient to risk for harm (representing incompetent behavior); or NA = an
opportunity to observe behavior was not available in the scenario. It was also possible to
leave the item blank.
45
During development of the NPP tool, Hinton et al. (2012) reported that content
validity was assessed by a research team that examined how well each item met specific
established criteria. An iterative process of review ensued until 100% agreement was
reached on the representativeness, clarity, and consistency of each item. Werner’s five-
step process was used to establish exam criteria and scoring methods (Hinton et al.,
2012). The five steps involved: identifying minimal levels of safe, effective practice;
choosing between a global or analytical scoring method; choosing how to combine test
parts for a total passing score; determining failing standards based on specific behaviors
regardless of total score; and setting a minimal passing standard based on the overall
performance results.
The copyright holders of the NPP have not released it for publication at this point
in time, so the instrument is not included in this dissertation.
Scenarios. Three adult health, acute care scenarios were designed in the initial
study by a team of expert nurses from the ASBN, ASU, and SCC for use with the NPP
tool (Hinton et al., 2012). “Scenarios were intended to measure basic competency with
broad applicability and to provide opportunities for individual nurses to exhibit
competency on all nursing performance items” (Randolph et al., 2012, p. 544). Each
scenario was designed to include a conflict situation and opportunities for the nurse to
demonstrate patient-teaching, demonstrate at least one basic psychomotor skill, and
provide basic comfort measures. The team of expert nurses met for a “validation day”
where each scenario was run and observed by the team, ensuring that all items from the
NPP were included and the scenarios were refined. Three sets of each scenario were
developed that included name changes for the patients in each scenario as well as surface
46
changes in the content (e.g., a phone call from a friend versus a parent during the
scenario) that did not affect any substantive components. Data from the three sets were
combined for the current study. Since these scenarios are used to evaluate registered
nurses undergoing review to maintain or regain their licenses, the scenarios are not
reproduced within this dissertation.
Procedure. Each nurse participant engaged in a randomized selection of one of
the three sets and the three scenarios were presented in a randomized order. No order
effect on ratings was found in previous studies (Hinton et al., 2012; Randolph et al.,
2012). A simulation nurse specialist was trained to conduct the simulations using
standardized cues and responses. Simulation nurse specialists are RNs with experience
running simulations using HPSs. Participants were oriented to the simulation
environment and the simulation was recorded using Meti LearningSpace (CAE
Healthcare, 2012), an audiovisual and center management system that provides recording
and tracking services that integrates with the HPS, at one facility, and a customized
system at a second facility. All nurse participants and staff involved in the study signed
non-disclosure forms.
Later, the videos were organized in random order by participant and by scenario.
Raters were blinded to the order and independently viewed each video. In the original
analysis of the data (M. Mays, personal communication, May 30, 2013; Randolph et al.,
2012), inter-rater reliability was estimated in the following way. The percent of videos
per item on which at least 2 raters provided identical ratings was calculated. For example,
on item 1, at least 2 raters agreed on the rating for 95% of the videos. Then, the mean
percent agreement over all 41 items was calculated (99.12%, SD = 2.18) (M. Mays,
47
personal communication, May 30, 2013). The internal consistency estimate of reliability
of the 41 items, computed using Cronbach’s alpha, was .93 with a range of .85 to .97 for
individual raters (Randolph et al., 2012). When the 41 items were collapsed into nine
categories, alpha was .87.
The authors examined construct validity by comparing pass rates of specific items
with those seen in other studies (Hinton et al., 2012; Randolph et al., 2012). Using
ANOVA to examine differences based upon experience level of RN’s, evidence of
criterion validity was obtained.
Analysis. Extant data from the MCWS Phase I project were reviewed. Following
a missing data analysis, descriptive statistics were calculated. Next, a G study was
conducted to estimate variance components and reliability-like coefficients. The last part
of the analysis involved a D study to determine the effect of varying the number of raters
and scenarios on reliability.
Missing data. Of the 54 NPP forms used in this study, 11 forms across eight nurse
participants had missing data, resulting in 12 missing responses from raters. Raters had
the choice of scoring each item as 1 (competent performance), 0 (incompetent
performance), or NA (no opportunity to observe behavior in the scenario). It was
unknown why raters chose to leave 12 responses blank, however a discussion with one of
the researchers (J. Hinton, personal communication, September 7, 2013) and personal
experience using the NPP instrument supports the assertion that when raters were unsure
if the item should appropriately be scored 0, 1, or NA, they may have decided to leave the
response blank. The 12 missing responses accounted for .18% of the 6642 possible
responses to the 41 items by the 3 raters for the 18 participants and 3 scenarios.
48
Raters marked 71 responses ‘NA’ (1.07% of the 6642 possible responses). After
an extensive review of the responses, items, and available explanatory comments
recorded by raters, I decided to treat the ‘NA’ responses as missing data for the following
reasons. First, the NPP instrument is described by the authors (Hinton et al., 2012;
Randolph et al., 2012) as a dichotomous scale, which indicates the data were not intended
to be treated as categorical with an unordered NA response option. Second, an in-depth
review of the scenarios and the NPP scale show that opportunities exist for nurses to
exhibit the behaviors described in all items. Third, when raters explained why they
marked an item ‘NA,’ typically some ambiguity was noted. For example, Item 2,
“Initiates and monitors correct IV fluids per orders and medication administration
record,” was marked ‘NA’ 18 times. Rater comments were available for 10 of the 18
instances. Nine of the comments indicated that the behavior was not seen, e.g., “Did not
see her check IVF.” It is not clear if this means the rater couldn’t judge if the behavior
occurred because it was impossible to see if the nurse checked the IV fluids, or if the rater
knew for certain that the nurse didn’t check the IV fluids. If the rater was sure that the
nurse had not checked the fluids, though, the rater should have marked ‘0’ for the item.
It’s more likely that the rater was not sure because she couldn’t see if the behavior
occurred. One comment was, “Never checked IVF.” It’s not clear why this item was not
marked ‘0’.
Item 11, “Recognizes when care demands have exceeded nurse’s capacity,” was
marked ‘NA’ 13 times by one rater. She made an explanatory comment seven times,
including one comment of “Unsure”. The other six comments were variations of, “Did
not need help.” However, each scenario includes a situation where the nurse, if
49
performing competently and safely, should request assistance at least once, ranging from
requesting a respiratory therapist to administer a medication to notifying the doctor of the
patient’s condition and/or the nurse’s actions in managing the care of the patient.
In all of these instances, one acceptable interpretation of the ‘NA’ responses is
that the rater did not want this item to affect the overall score for the nurse, regardless of
the reason for marking ‘NA.’ Therefore, in order to ensure that items marked ‘NA’ do not
weigh the overall mean either toward ‘0’ or ‘1’, I have chosen to treat the ‘NA’ data as
missing data. This choice also maintains the authors’ intention of interpreting the scale as
dichotomous.
Missing data, including ‘NA’ responses, totaled 83 data points (1.25% of the 6642
possible data points). A one-way ANOVA was conducted to evaluate the relationship
between the number of missing scores on an evaluation and the evaluation’s mean score
to determine if participants with missing scores performed differently than participants
without missing scores. A nonsignificant ANOVA was consistent with the assumption
that missing ratings were missing at random (MAR). Various methods of imputing
missing data were considered. Precedence for estimating missing data and ‘NA’ data in
generalizability analyses using mean item values has been described in the literature
(Jippes, 2012; Stora, Hagtvet, & Heyerdahl, 2013). Other reported methods of dealing
with this issue are to use the grand mean (Bloch & Norman, 2012) or the median score
for all respondents (Van Agt, Essink-Bot, Krabbe, & Bonsel, 1994). Although various
methods exist to estimate missing data, Tabachnick and Fidell (2007) state that if 5% or
less of data points are missing from a large data set, “…almost any procedure for
handling missing values yields similar results” (p. 63). Methodologists favor methods of
50
handling missing data that produce unbiased parameter estimates if assumptions are met;
two suggested techniques that accomplish this include maximum likelihood and multiple
imputation (MI; Enders, 2010). Multiple imputation was chosen to compute unbiased
estimates; an additional benefit of MI is it performs well with small sample sizes
(Wayman, 2003).
Missing data were imputed using multiple imputation in SPSS v. 21. Five data
sets were imputed and imputed values were not rounded (Enders, 2010). Each data set
was used to run separate G studies using GENOVA (Center for Advanced Studies in
Measurement and Assessment, 2013; Crick & Brennan, 1983) and the resulting estimated
variance components were then combined using Rubin’s rules (Rubin, 1987; Wayman,
2003).
Descriptive statistics. Item and category means and standard deviations were
calculated across scenarios and raters. Means and standard deviations were also
calculated for each item and category, by scenario across raters, and by scenario for each
rater. In addition, scenario means and standard deviations were calculated for each rater
across items, and across items and raters.
G study. The design for the G study includes a three-facet universe, representing
three conditions of measurement: raters, scenarios, and items. The universe of admissible
observations is defined by all admissible RN raters, allowing generalization from a
sample of RN raters to a universe of all RN raters. The raters included a wide range of
experience and ages, but were not diverse in terms of race or gender. Also, the minimum
level of education was a bachelor’s degree. Thus, the universe of RN raters to which this
study may be generalized should reflect the demographics of the study raters.
51
The universe of admissible observations is also defined by all admissible
simulation scenarios, with generalization from a sample of simulation scenarios to a
universe of all possible simulation scenarios. The content of the three scenarios reflected
a variety of common diagnoses and patient profiles seen in adult health, acute care units
in hospitals. The universe of scenarios to which this study may be generalized thus
includes diagnoses and patient profiles that are commonly found in adult health, acute
care hospital units.
The third universe of admissible observations is defined by all admissible items,
generalizing from a sample of items to all possible items that may be used to assess
nursing competency. The 41 items of the NPP instrument were developed using the
TERCAP categories and the CCANLN survey tool. These items represent a sample of
possible items in the universe of items that could be used to assess nursing competency. It
is also possible that fewer than 41 items may be sufficient to assess competency.
Since all raters evaluated all scenarios and all participants using all 41 items on
the NPP instrument, raters were crossed with scenarios and items, resulting in a p x s x r
x i design, where p = nurse participants, s = scenarios, r = raters, and i = items. Also, the
sample of scenarios, raters, and items used were considered to be exchangeable with any
other sample of scenarios, raters, and items in the defined universes for these facets, so
the design is classified as random.
The RNs who participated and were evaluated by raters in the study were the
object of measurement; generalization from the sample of participants to a population of
all RNs with similar demographic characteristics would be appropriate.
52
Using the software program GENOVA (Brennan, 2001; Center for Advanced
Studies in Measurement and Assessment, 2013; Crick & Brennan, 1983), 15 sources of
variability were explored for this three-facet design, including the universe-score
variability and 14 sources associated with the three facets. They were: the main effects
for scenario (s), rater (r), and item (i); six 2-way interactions; four 3-way interactions;
and the residual for the rater–scenario–participant-item interaction. Variances were
estimated for each effect. Total estimated variance, σ̂2 (Xpsri), was the sum of the 15
estimated variance components:
σ̂2 (Xpsri) = σ̂
2 (p) + σ̂
2 (s) + σ̂
2 (r) + σ̂
2 (i) + σ̂
2 (ps) + σ̂
2 (pr) + σ̂
2 (pi) + σ̂
2 (sr) +
σ̂2
(si) + σ̂2
(ri) + σ̂2
(psr) + σ̂2
(psi) + σ̂2
(pri) + σ̂2
(sri) + σ̂2
(psri,e). (9)
Various researchers, such as Shavelson and Webb (1991), use the notation, σ̂2
(psri,e), to
represent the interaction (or residual) variance component, while Brennan (2001) and
others use σ̂2
(psri). The variance components were estimated by employing expected mean
square (EMS) equations.
The estimated variance component for persons (or universe-score variance) is
interpreted as follows. For each nurse in the population, if the nurse’s mean score (or
expected score) over all scenarios, all raters, and all items in the universes of admissible
observations is calculated, the variance of the mean scores (over the population of nurses)
is σ2(p).
The main effect variance components of scenario, rater, and item facets are
interpreted similarly. The interpretations of particular variance components are as
follows: the main effect for raters represents rater inconsistencies, the main effect for
scenarios indicates differences in scenario difficulty that have a consistent effect over all
53
participants, and the main effect for items reflects variation in item difficulty across all
participants.
Interpretations of interactions are slightly more complex. The participant–scenario
interaction indicates differences in participant performance for different scenarios – in
other words, when participants’ overall scores are ranked differently by scenario. The
participant-rater interaction reflects differences among raters for different participants, or
whether raters ranked participants more or less stringently. The participant-item
interaction describes whether participants found different items more or less difficult, so
that items were ranked differently in difficulty by participant. The scenario-rater
interaction describes differences in scoring among raters for different scenarios, while the
scenario-item interaction reflects differences in ranking of items by scenario. The last
two-way interaction, the rater-item interaction, describes how differently raters scored
items over all participants.
The most complex interactions to explain are the three-way interactions. The
participant-scenario-rater interaction describes variation in rater scoring of participants
for different scenarios. The participant-scenario-item interaction reflects differences in
item difficulty among the scenarios for participants. If some raters score different items
more stringently for some participants than other raters, this is described by the
participant-rater-item interaction. And the last three-way interaction, scenario-rater-item,
describes differences in ranking of items by different raters for different scenarios. Last,
the four-way interaction of participant-scenario-rater-item includes the interaction plus a
residual, which quantifies any unmeasured variation sources and random events.
54
D studies. D studies were conducted to generalize nurses’ scores based on the
specific scenarios, raters, and items in the current measurement procedure to all nurses’
scores for a universe of generalization that involves many other scenarios, raters, and
items. This resulted in a random model with the random facets of scenario, rater, and
items. The D study design is p x S x R x I. Two differences characterize the D study from
a G study. First, the sample sizes of scenarios, raters, and items do not need to be the
same as those for the G study. Second, in a D study, the focus is on mean scores for
persons, not single participant-scenario-rater-item observations.
The variance components estimated in the G study were used to obtain estimated
D study variance components. The assumption was made that the population and all
facets in the universe of generalization are infinite, so the variance components are
random effects variance components. The intent of the NPP instrument is to determine if
nurses have met a minimal level of competency (Hinton et al., 2012; Randolph et al.,
2012) and competency is determined based on agreement of at least two out of three
raters. Determining an absolute level of performance constitutes an absolute decision.
Estimating measurement error for absolute interpretations of scores involves the
calculation of absolute error variance, which is the sum of all variance components
except the object of measurement, σ̂2(𝑝). In the D study, the variance of the absolute
errors, σ̂2(𝛥), was estimated using the equation,
σ̂2(𝛥) = σ̂
2(𝑆) + σ̂2(𝑅) + σ̂2(𝐼) + σ̂2(𝑝𝑆) + σ̂2(𝑝𝑅) + σ̂
2(𝑝𝐼) + σ̂2(𝑆𝑅) + σ̂
2(𝑆𝐼) +
σ̂2(𝑅𝐼) + σ̂2(𝑝𝑆𝑅) + σ̂
2(𝑝𝑆𝐼) + σ̂2(𝑝𝑅𝐼) + σ̂2(𝑆𝑅𝐼) + σ̂2(𝑝𝑆𝑅𝐼, 𝑒) . (10)
The absolute error variance was estimated for one to nine raters across number of
scenarios ranging from one to nine.
55
It is possible that the NPP instrument and resulting data could involve relative
decisions, such as the comparison of levels of competency of various nurses, so relative
error variance was also estimated. Relative error variance is the sum of all variance
components that include interactions of the participant with the facets. The variance of
the relative errors, σ̂2 (δ), was estimated using the equation:
σ̂2(δ) = σ̂
2(𝑝𝑆) + σ̂2(𝑝𝑅) + σ̂
2(𝑝𝐼) + σ̂2(𝑝𝑆𝑅) +
σ̂2(𝑝𝑆𝐼) + σ̂
2(𝑝𝑅𝐼) + σ̂2 (𝑝𝑆𝑅𝐼, 𝑒) (11)
Last, two reliability-like coefficients were estimated for each D study design. The
index of dependability, phi (φ̂), is a reliability-like coefficient used in generalizability
theory when absolute error variance is a component and absolute decisions are important.
It is the ratio of universe score variance, σ2(τ) or σ
2(p), to the sum of universe score
variance and absolute error variance:
φ̂ = σ̂(𝑝)
σ̂2(𝑝)+ σ̂2(Δ)
. (12)
The G coefficient, Ερ̂2, was also estimated to broaden available interpretations to
include those made on a relative scale. The G coefficient is the ratio of universe score
variance to the sum of universe score variance and relative error variance:
Eρ̂2 = σ̂
2(𝑝)
σ̂2(𝑝)+ σ̂2(δ)
. (13)
The effect of varying the sample sizes for raters and scenarios while keeping
items constant at 41 (the number of items on the NPP instrument) on φ̂ and Ε�̂�2 was
evaluated to determine the most efficient and effective combination of raters and
scenarios in terms of obtaining high reliability and identifying when adding raters and/or
scenarios failed to substantially improve reliability.
56
Johnson, Penny, and Gordon (2009) report acceptable minimum reliability levels
in the literature. For research studies and low-stakes assessments, a minimum reliability
of .70 has been advised, and for high-stakes exams, a minimum reliability of .85 to .90
has been suggested. Researchers do not present different minimum values for
generalizability and dependability coefficients, however, the generalizability coefficient
is typically considered to be analogous to the reliability coefficient in Classical Test
Theory (Shavelson & Webb, 1991). The type of decisions, relative or absolute, drive the
selection of the type of coefficient, generalizability or dependability, used for
interpretation.
Ten sets of D studies (see Table 4 in Chapter 5) were conducted that included
nine individual D studies per set. In the first set, the effect on the coefficients and SEMs
were examined when both the number of raters and number of scenarios were increased
from one to nine at the same time. In D study Sets 2 – 10, the number of scenarios was
held constant in each set while the number of raters was increased from one to nine. For
example, in the first D study in Set 2, one scenario and one rater were included in the
design. In the second D study in Set 2, the number of scenarios was held constant at one
while the number of raters increased to two. In the third D study in Set 2, one scenario
and three raters were in the design. Raters were increased in each subsequent D study in
Set 2 while scenarios remained constant. Then, in D study Set 3, the number of scenarios
was increased to two. This number remained constant throughout the set, while the
number of raters was increased from one to nine in each individual study. This process
was continued through D study Set 10, when the number of scenarios was held constant
at nine. The purpose of D study Sets 2 – 10 was to evaluate the effect of increasing the
57
number of raters while keeping the number of scenarios constant within each set.
Additional sets of D studies were conducted, keeping number of raters constant in each
set, while increasing the number of scenarios. These D studies actually duplicated
individual D studies in Sets 1 – 10, so were not shown in this study, but were useful for
developing tables, figures, and analyzing data.
Part II: Design of a Validation Process for Simulation Scenario Development
The second part of this study involved the establishment of a validation process
for scenario development. The identification of key components to include in a
simulation for the measurement of nursing competency using high-fidelity human patient
simulators (HPSs) should be based upon a structured process, and multiple sources of
evidence must be used in validation of the scenario development process (AERA et al.,
1999; Downing & Haladyna, 2009; Messick, 1995). Multiple sources of evidence include
content, response process, and relationships to outside measures (exhibiting criterion
validity). The components of the scenarios and expectations of the nurse participant must
be evidence-based and the scenario must include opportunities for the participant to
demonstrate competency on all items included on the NPP instrument.
First, in order to ensure the scenario involved a medical condition commonly seen
in adult health, acute care facilities, a literature review was conducted and major medical
conditions seen in this setting were identified. Venous thromboembolism, including deep
venous thrombosis (DVT) and pulmonary embolism (PE), was reported to be the third
most common vascular condition in the United States (Walling, 2005). DVT is also one
of the top 10 high-risk, high-volume patient conditions (Burns & Poster, 2008). An
estimated 300,000 to 600,000 people in the U.S. are affected by DVT or PE each year
58
and, together, they are responsible for 60,000 to 100,000 deaths per year (Centers for
Disease Control and Prevention, 2012; U.S. Department of Health and Human Services,
2008). Due to its prevalence, deep vein thrombosis was chosen as a medical diagnosis
and clinical practice guidelines from the Agency for Healthcare Research and Quality and
current authentic hospital protocols were reviewed to identify relevant signs, symptoms,
tests, and management protocols, thus providing evidence supportive of the accurate
depiction of a patient presenting with a DVT. Input and feedback was further provided by
a registered nurse expert with experience and credentials in adult health, education, and
simulation. Use of clinical practice guidelines, a literature review, and content expertise
provided evidence of content validity.
The previously validated instrument, the Nursing Performance Profile (NPP), was
used in conjunction with the scenario to ensure content related to expected nursing
participant behaviors. As the scenario was developed, components were mapped to each
item on the NPP to ascertain that opportunities were available for the nurse participants to
demonstrate competency and safe behavior for each of the 41 items on the NPP. The
structure of the new scenario followed the structure of existing scenarios used for
assessment of nursing competency with the NPP instrument. The format for the health
record components was validated in prior research (Hinton et al., 2012; Randolph et al.,
2012), and included the sections of: background and vital signs, physician orders,
medication administration record, laboratory tests, nurse flow sheet, and nurse notes. The
structure of the scenario design was also previously validated (Hinton et al., 2012;
Randolph et al., 2012) and included the sections: report, manikin settings and situation,
script, and expected participant actions/interventions. Basing the structure of the new
59
scenario upon an external measure (the existing scenarios and the NPP instrument)
provided evidence of criterion validity. Permission was granted by the MCWS Phase I
Study group to use the existing medical record and scenario template (see Appendix B).
Content validity was ensured through a detailed review of each component of the
scenario by a team of expert nurses. This method is advocated by simulation researchers
(Shelestak & Voshall, 2014) to ensure content validity of simulation scenarios. The team
was selected based on predetermined criteria. Only nurses who had a minimum of three
years of experience in adult health, acute care nursing and a minimum of one year of
experience in simulation and nursing supervision were considered. Of the five nurses
invited to be part of the validation team, three nurses consented. The resulting validation
team exceeded the minimum criteria for all areas of inclusion. The minimum years of
experience in adult health clinical settings was 25 and all nurses had at least six years of
experience supervising students in this setting and at least two years of simulation
experience.
Each member of the validation team was provided opportunities to offer feedback
on every detail of the scenario over a series of three rounds of validation. The goal was to
reach a majority agreement on each element of the scenario and chart. Feedback forms
for each round were designed. A list of questions was developed to query the team about
included items in the storyboard and to confirm the identification of competency items
from the NPP instrument. The team was asked to review each element of the storyboard
and determine if they represented clinical elements and appropriate nursing care
encountered in actual patient settings. The team was directed to indicate if each
component should be included in the scenario with one of three categorical responses:
60
‘accept as written,’ ‘accept with changes,’ or ‘delete content.’ If they answered ‘accept
with changes,’ they were asked to provide the suggested change. In addition to their
evaluation of these components, they were requested to provide input for additional
elements to ensure the scenario was evidence-based and allowed for sufficient
opportunities for the nurse participants to demonstrate competency when evaluated by the
NPP instrument. Concurrent validity is evidenced by the generalizability of the
simulation-based clinical expectations to those encountered in real patient care settings
(Issenberg, McGaghie, Petrusa, Gordon, & Scalese, 2005).
A modified Delphi technique was used in this validation process to ensure the
process of obtaining input and consensus was structured. The use of a modified Delphi
technique maintained anonymity of team members (the identity of each was not revealed
to the other members of the team), which encouraged honest, unbiased feedback, critical
for a validation process. In the first round, the scenario was sent to each team member
electronically and feedback was requested. The team had a month to process information,
review evidence, and respond. A content analysis was conducted on the responses to the
questions to determine inter-rater reliability using the kappa coefficient. Due to a paradox
that occurs when high agreement and prevalence of one category exist (Feinstein &
Cicchetti, 1990; Viera & Garrett, 2005), kappa was found to be unusually low, so percent
agreement was also calculated in each round and found to be a more interpretable
finding.
In Round 2, feedback from Round 1 was summarized and provided back to the
validation team. Suggested refinements and changes to the scenario were included and
feedback was requested in a similar fashion to the first round; one month was allowed for
61
Round 2 review by the validation team. Feedback on the second round was aggregated,
agreement using kappa and percent agreement were calculated, and areas of disagreement
were identified. In Round 3, the team was asked to agree or disagree with suggested
resolutions, based upon majority agreement from Round 2. When majority agreement on
an item was not available, a solution based upon team member provision of evidence was
selected and presented in Round 3. Only nine items required feedback in Round 3 and the
team had one week to review the items. The final scenario was then provided to the
original research group composed of the ASBN, ASU, and SCC researchers for pilot
testing.
62
Chapter 3
Results – Reliability Analysis of MCWS Phase I Data
This presentation of results is organized according to the two parts of the study.
This chapter includes a reliability analysis of the extant MCWS Phase I data and begins
with a description of the study participants’ and raters’ characteristics, including ages,
nursing experience, and simulation experience. Next, results of a missing data analysis
are presented. Descriptive statistics for items and categories are reviewed. Last, G study
and D study results are examined. Results of the validation process for simulation
scenario development are presented in the following chapter.
Participants
As described in the methods section, participants in this study were 18 licensed
registered nurses. Among the 16 participants who provided demographic data, ages
ranged from 22 to 54 (M = 31.81, SD = 8.90) and all were female. Based on participants’
self-reported race/ethnicity, the sample was 56.25% white, 25% Hispanic, and 18.75%
black. Most had earned associate’s degrees (75%) and the remainder (25%) had earned
bachelor’s degrees; all participants completed their nursing education in the United
States. Most nurses reported having some experience with simulation (68.70%), whereas
12.50% reported having frequent experience and 18.75% indicated they had no
experience with simulation. Of the 10 participants who reported their experience as RNs,
experience ranged from 0 to 30 months (M = 16.20 months, SD = 8.97).
Raters
Data provided by three raters were used in this study. The raters’ mean age was
43.00 (SD = 9.85) and their mean years of experience as an RN was 9.67 (SD = 10.69).
63
All were white and female. Each had a bachelors’ degree and completed their nursing
education in the United States. All three raters reported occasional simulation experience.
Missing Data
As reported in the methods section, .18% of the 6642 possible ratings from the
41-item NPP instruments used to rate the 18 participants were left blank; a total of 12
responses were missing. In addition, 70 responses were marked ‘NA,’ accounting for
1.05% of the 6642 possible responses. As explained in the methods section, these two
categories of responses were combined and treated as missing data, resulting in 82
missing data points (1.23% of the total possible responses). The number of missing data
points per item ranged from 0 to 18 (M = 2.00, SD = 4.07). Twenty-six items had no
missing data. Six items had more than five missing data responses. The items with the
most missing responses were Item 2, ‘Initiates and monitors correct IV fluids per orders
and medication administration record,’ and Item 11, ‘Recognizes when care demands
have exceeded nurse’s capacity,’ with 18 and 13 missing responses, respectively. The
next highest number of missing items was for Item 41, ‘Correctly records telephone
orders,’ with 10 missing responses and Item 36, ‘Delegates/coordinates aspects of care
appropriately,’ with nine missing responses. Two items had seven missing responses
each: Item 19, ‘Demonstrates application of infection control principles’ and Item 34,
‘Communicates effectively with physician.’
See Table 1 for descriptive statistics by scenario and rater. Broken down by rater,
Rater 1 had 63 missing ratings (76.83% of the missing data), whereas Raters 2 and 3 had
7 (8.54%) and 12 (14.63%) missing ratings, respectively. The maximum number of item
ratings any one rater failed to provide for a participant on a scenario was four. By
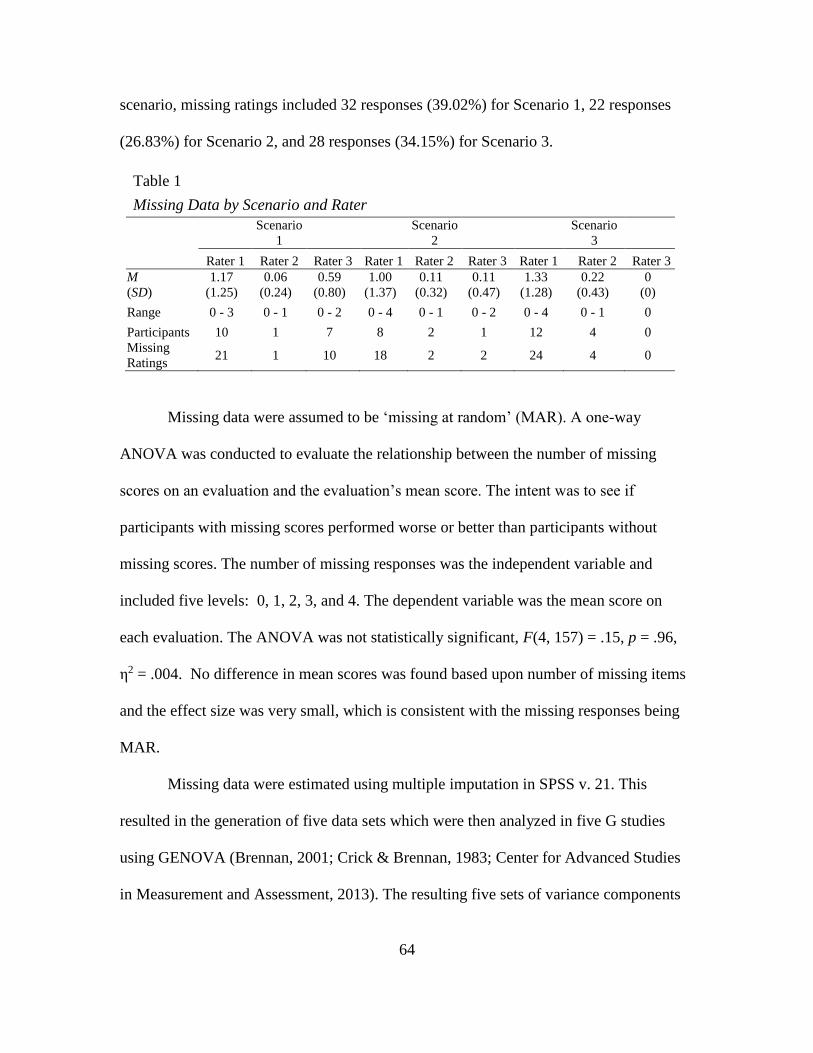
64
scenario, missing ratings included 32 responses (39.02%) for Scenario 1, 22 responses
(26.83%) for Scenario 2, and 28 responses (34.15%) for Scenario 3.
Table 1
Missing Data by Scenario and Rater
Scenario
1
Scenario
2
Scenario
3
Rater 1 Rater 2 Rater 3 Rater 1 Rater 2 Rater 3 Rater 1 Rater 2 Rater 3
M
(SD)
1.17
(1.25)
0.06
(0.24)
0.59
(0.80)
1.00
(1.37)
0.11
(0.32)
0.11
(0.47)
1.33
(1.28)
0.22
(0.43)
0
(0)
Range 0 - 3 0 - 1 0 - 2 0 - 4 0 - 1 0 - 2 0 - 4 0 - 1 0
Participants 10 1 7 8 2 1 12 4 0
Missing
Ratings 21 1 10 18 2 2 24 4 0
Missing data were assumed to be ‘missing at random’ (MAR). A one-way
ANOVA was conducted to evaluate the relationship between the number of missing
scores on an evaluation and the evaluation’s mean score. The intent was to see if
participants with missing scores performed worse or better than participants without
missing scores. The number of missing responses was the independent variable and
included five levels: 0, 1, 2, 3, and 4. The dependent variable was the mean score on
each evaluation. The ANOVA was not statistically significant, F(4, 157) = .15, p = .96,
η2 = .004. No difference in mean scores was found based upon number of missing items
and the effect size was very small, which is consistent with the missing responses being
MAR.
Missing data were estimated using multiple imputation in SPSS v. 21. This
resulted in the generation of five data sets which were then analyzed in five G studies
using GENOVA (Brennan, 2001; Crick & Brennan, 1983; Center for Advanced Studies
in Measurement and Assessment, 2013). The resulting five sets of variance components
65
were combined using Rubin’s (1987) rules (Enders, 2010; Wayman, 2003) and were then
used to conduct D studies using GENOVA.
Descriptive Statistics
Item and category means, representing the proportion of participants who
received a score of “1”, and standard deviations were calculated and are shown in Table 2
for each scenario and rater. The numbers of missing scores per item/rater/scenario are
also indicated on Table 2 by superscript. If an item did not have any missing data, no
numeric superscript is shown.
The mean scenario scores averaged over all participants, raters, and items ranged
from .67 (SD = .13) for Scenario 1 (a patient with diabetes) to .73 (SD = .11) for Scenario
3 (a patient with a fracture). Mean scores across participants for the scenarios based on
individual raters ranged from .58 (SD = .20; Rater 3 for Scenario 1) to .86 (SD = .15;
Rater 2 for Scenario 3). All three raters’ mean scores were lowest for Scenario 1 and
highest for Scenario 3. Rater 3’s mean scores were lowest of the three raters for every
scenario, ranging from .58 (SD = .20) for Scenario 1 to .66 (SD = .20) for Scenario 3,
whereas Rater 2’s mean scores were the highest for all scenarios, ranging from .82 (SD =
.14) for Scenario 1 to .86 (SD = .15) for Scenario 3.
Category mean scores averaged over all scenarios and raters ranged from .34 (SD
= .03) for Category H (Documentation) to .88 (SD = .02) for Category E (Professional
Responsibility). The mean scores for Category H averaged over all raters ranged from .31
(SD = .19) for Scenario 1 to .36 (SD = .17) for Scenario 3. The mean scores for Category
E ranged from .85 (SD = .12) for Scenario 2 to .90 (SD = .04) for Scenario 1. Other
categories with high mean scores averaged over all raters and all scenarios were:
66
Category F (Client Advocacy; M = .86, SD = .04), Category C (Attentiveness; M = .83,
SD = .04) and Category G (Communication; M = .75, SD = .07). Lower mean scores were
exhibited in: Category D (Prevention; M = .62, SD = .02), Category A (Procedural
Competency; M = .64, SD = .02), and Category B (Clinical Reasoning; M = .70, SD =
.06).
Item mean scores averaged over all scenarios and raters ranged from .30 (SD =
.11) for Item 40, ‘Documents medication administration appropriately,’ to .93 (SD = .04,
SD = .02, respectively) for two items: Item 25, ‘Respects client rights,’ and Item 27,
‘Intervenes on client’s behalf.’ Item 40 is within Category H (Documentation), the
category exhibiting the lowest mean score overall. Items 25 and 27 are within the two
categories with the highest mean scores, Category E (Professional Responsibility) and
Category F (Client Advocacy), respectively.
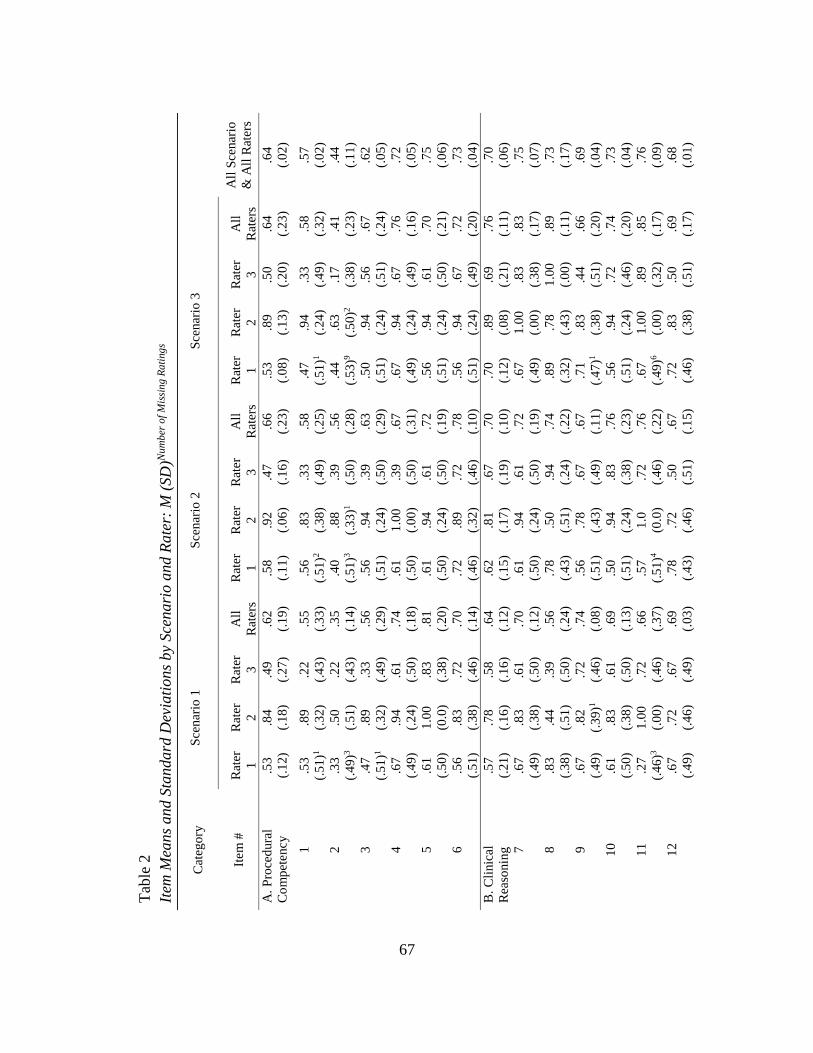
67
Tab
le 2
Item
Mea
ns
and S
tandard
Dev
iati
ons
by
Sce
nari
o a
nd R
ate
r: M
(SD
)Nu
mb
er o
f M
issi
ng R
ati
ng
s
Cat
ego
ry
Sce
nar
io 1
Sce
nar
io 2
Sce
nar
io 3
Item
#
Rat
er
1
Rat
er
2
Rat
er
3
All
Rat
ers
Rat
er
1
Rat
er
2
Rat
er
3
All
Rat
ers
Rat
er
1
Rat
er
2
Rat
er
3
All
Rat
ers
All
Sce
nar
io
& A
ll R
ater
s
A.
Pro
ced
ura
l
Co
mp
etency
.53
(.1
2)
.84
(.1
8)
.49
(.2
7)
.62
(.1
9)
.58
(.1
1)
.92
(.0
6)
.47
(.1
6)
.66
(.2
3)
.53
(.0
8)
.89
(.1
3)
.50
(.2
0)
.64
(.2
3)
.64
(.0
2)
1
.53
(.5
1)1
.89
(.3
2)
.22
(.4
3)
.55
(.3
3)
.56
(.5
1)2
.83
(.3
8)
.33
(.4
9)
.58
(.2
5)
.47
(.5
1)1
.94
(.2
4)
.33
(.4
9)
.58
(.3
2)
.57
(.0
2)
2
.33
(.4
9)3
.50
(.5
1)
.22
(.4
3)
.35
(.1
4)
.40
(.5
1)3
.88
(.3
3)1
.39
(.5
0)
.56
(.2
8)
.44
(.5
3)9
.63
(.5
0)2
.17
(.3
8)
.41
(.2
3)
.44
(.1
1)
3
.47
(.5
1)1
.89
(.3
2)
.33
(.4
9)
.56
(.2
9)
.56
(.5
1)
.94
(.2
4)
.39
(.5
0)
.63
(.2
9)
.50
(.5
1)
.94
(.2
4)
.56
(.5
1)
.67
(.2
4)
.62
(.0
5)
4
.67
(.4
9)
.94
(.2
4)
.61
(.5
0)
.74
(.1
8)
.61
(.5
0)
1.0
0
(.0
0)
.39
(.5
0)
.67
(.3
1)
.67
(.4
9)
.94
(.2
4)
.67
(.4
9)
.76
(.1
6)
.72
(.0
5)
5
.61
(.5
0)
1.0
0
(0.0
)
.83
(.3
8)
.81
(.2
0)
.61
(.5
0)
.94
(.2
4)
.61
(.5
0)
.72
(.1
9)
.56
(.5
1)
.94
(.2
4)
.61
(.5
0)
.70
(.2
1)
.75
(.0
6)
6
.56
(.5
1)
.83
(.3
8)
.72
(.4
6)
.70
(.1
4)
.72
(.4
6)
.89
(.3
2)
.72
(.4
6)
.78
(.1
0)
.56
(.5
1)
.94
(.2
4)
.67
(.4
9)
.72
(.2
0)
.73
(.0
4)
B.
Cli
nic
al
Rea
sonin
g
.57
(.2
1)
.78
(.1
6)
.58
(.1
6)
.64
(.1
2)
.62
(.1
5)
.81
(.1
7)
.67
(.1
9)
.70
(.1
0)
.70
(.1
2)
.89
(.0
8)
.69
(.2
1)
.76
(.1
1)
.70
(.0
6)
7
.67
(.4
9)
.83
(.3
8)
.61
(.5
0)
.70
(.1
2)
.61
(.5
0)
.94
(.2
4)
.61
(.5
0)
.72
(.1
9)
.67
(.4
9)
1.0
0
(.0
0)
.83
(.3
8)
.83
(.1
7)
.75
(.0
7)
8
.83
(.3
8)
.44
(.5
1)
.39
(.5
0)
.56
(.2
4)
.78
(.4
3)
.50
(.5
1)
.94
(.2
4)
.74
(.2
2)
.89
(.3
2)
.78
(.4
3)
1.0
0
(.0
0)
.89
(.1
1)
.73
(.1
7)
9
.67
(.4
9)
.82
(.3
9)1
.72
(.4
6)
.74
(.0
8)
.56
(.5
1)
.78
(.4
3)
.67
(.4
9)
.67
(.1
1)
.71
(.4
7)1
.83
(.3
8)
.44
(.5
1)
.66
(.2
0)
.69
(.0
4)
10
.61
(.5
0)
.83
(.3
8)
.61
(.5
0)
.69
(.1
3)
.50
(.5
1)
.94
(.2
4)
.83
(.3
8)
.76
(.2
3)
.56
(.5
1)
.94
(.2
4)
.72
(.4
6)
.74
(.2
0)
.73
(.0
4)
11
.27
(.4
6)3
1.0
0
(.0
0)
.72
(.4
6)
.66
(.3
7)
.57
(.5
1)4
1.0
(0.0
)
.72
(.4
6)
.76
(.2
2)
.67
(.4
9)6
1.0
0
(.0
0)
.89
(.3
2)
.85
(.1
7)
.76
(.0
9)
12
.67
(.4
9)
.72
(.4
6)
.67
(.4
9)
.69
(.0
3)
.78
(.4
3)
.72
(.4
6)
.50
(.5
1)
.67
(.1
5)
.72
(.4
6)
.83
(.3
8)
.50
(.5
1)
.69
(.1
7)
.68
(.0
1)
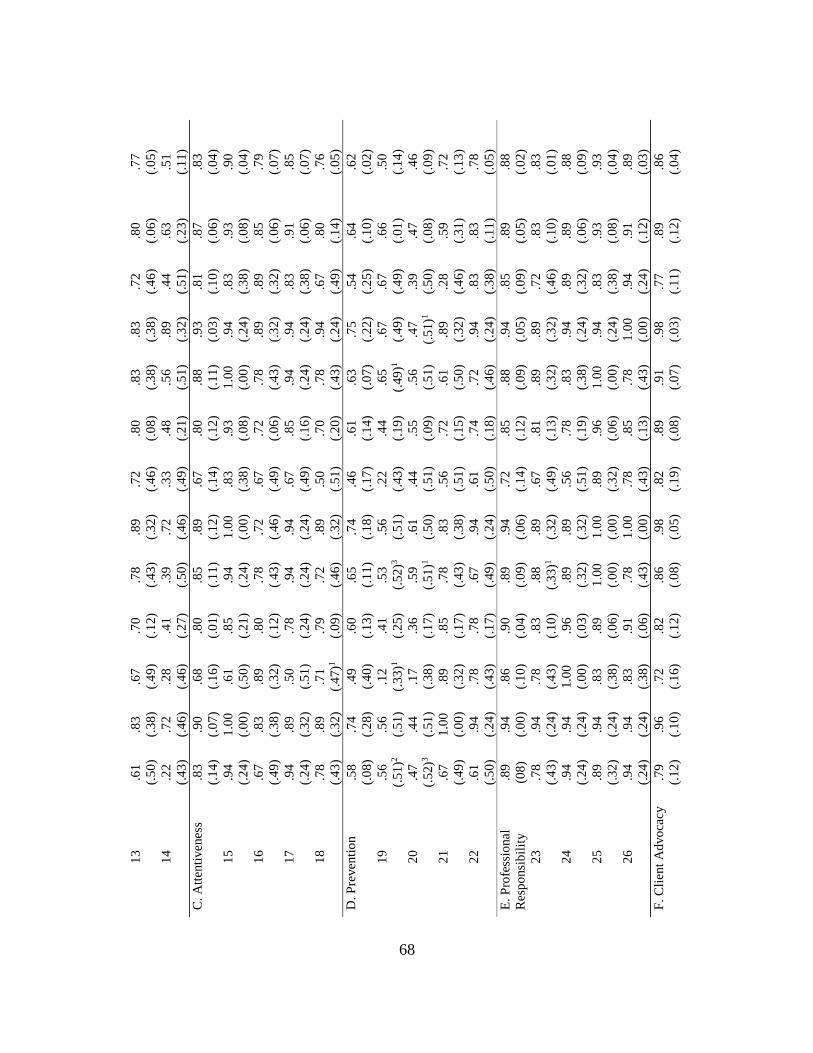
68
13
.61
(.5
0)
.83
(.3
8)
.67
(.4
9)
.70
(.1
2)
.78
(.4
3)
.89
(.3
2)
.72
(.4
6)
.80
(.0
8)
.83
(.3
8)
.83
(.3
8)
.72
(.4
6)
.80
(.0
6)
.77
(.0
5)
14
.22
(.4
3)
.72
(.4
6)
.28
(.4
6)
.41
(.2
7)
.39
(.5
0)
.72
(.4
6)
.33
(.4
9)
.48
(.2
1)
.56
(.5
1)
.89
(.3
2)
.44
(.5
1)
.63
(.2
3)
.51
(.1
1)
C.
Att
enti
venes
s .8
3
(.1
4)
.90
(.0
7)
.68
(.1
6)
.80
(.0
1)
.85
(.1
1)
.89
(.1
2)
.67
(.1
4)
.80
(.1
2)
.88
(.1
1)
.93
(.0
3)
.81
(.1
0)
.87
(.0
6)
.83
(.0
4)
15
.94
(.2
4)
1.0
0
(.0
0)
.61
(.5
0)
.85
(.2
1)
.94
(.2
4)
1.0
0
(.0
0)
.83
(.3
8)
.93
(.0
8)
1.0
0
(.0
0)
.94
(.2
4)
.83
(.3
8)
.93
(.0
8)
.90
(.0
4)
16
.67
(.4
9)
.83
(.3
8)
.89
(.3
2)
.80
(.1
2)
.78
(.4
3)
.72
(.4
6)
.67
(.4
9)
.72
(.0
6)
.78
(.4
3)
.89
(.3
2)
.89
(.3
2)
.85
(.0
6)
.79
(.0
7)
17
.94
(.2
4)
.89
(.3
2)
.50
(.5
1)
.78
(.2
4)
.94
(.2
4)
.94
(.2
4)
.67
(.4
9)
.85
(.1
6)
.94
(.2
4)
.94
(.2
4)
.83
(.3
8)
.91
(.0
6)
.85
(.0
7)
18
.78
(.4
3)
.89
(.3
2)
.71
(.4
7)1
.79
(.0
9)
.72
(.4
6)
.89
(.3
2)
.50
(.5
1)
.70
(.2
0)
.78
(.4
3)
.94
(.2
4)
.67
(.4
9)
.80
(.1
4)
.76
(.0
5)
D.
Pre
ven
tio
n
.58
(.0
8)
.74
(.2
8)
.49
(.4
0)
.60
(.1
3)
.65
(.1
1)
.74
(.1
8)
.46
(.1
7)
.61
(.1
4)
.63
(.0
7)
.75
(.2
2)
.54
(.2
5)
.64
(.1
0)
.62
(.0
2)
19
.56
(.5
1)2
.56
(.5
1)
.12
(.3
3)1
.41
(.2
5)
.53
(.5
2)3
.56
(.5
1)
.22
(.4
3)
.44
(.1
9)
.65
(.4
9)1
.67
(.4
9)
.67
(.4
9)
.66
(.0
1)
.50
(.1
4)
20
.47
(.5
2)3
.44
(.5
1)
.17
(.3
8)
.36
(.1
7)
.59
(.5
1)1
.61
(.5
0)
.44
(.5
1)
.55
(.0
9)
.56
(.5
1)
.47
(.5
1)1
.39
(.5
0)
.47
(.0
8)
.46
(.0
9)
21
.67
(.4
9)
1.0
0
(.0
0)
.89
(.3
2)
.85
(.1
7)
.78
(.4
3)
.83
(.3
8)
.56
(.5
1)
.72
(.1
5)
.61
(.5
0)
.89
(.3
2)
.28
(.4
6)
.59
(.3
1)
.72
(.1
3)
22
.61
(.5
0)
.94
(.2
4)
.78
(.4
3)
.78
(.1
7)
.67
(.4
9)
.94
(.2
4)
.61
(.5
0)
.74
(.1
8)
.72
(.4
6)
.94
(.2
4)
.83
(.3
8)
.83
(.1
1)
.78
(.0
5)
E.
Pro
fess
ional
Res
po
nsi
bil
ity
.89
(08
)
.94
(.0
0)
.86
(.1
0)
.90
(.0
4)
.89
(.0
9)
.94
(.0
6)
.72
(.1
4)
.85
(.1
2)
.88
(.0
9)
.94
(.0
5)
.85
(.0
9)
.89
(.0
5)
.88
(.0
2)
23
.78
(.4
3)
.94
(.2
4)
.78
(.4
3)
.83
(.1
0)
.88
(.3
3)1
.89
(.3
2)
.67
(.4
9)
.81
(.1
3)
.89
(.3
2)
.89
(.3
2)
.72
(.4
6)
.83
(.1
0)
.83
(.0
1)
24
.94
(.2
4)
.94
(.2
4)
1.0
0
(.0
0)
.96
(.0
3)
.89
(.3
2)
.89
(.3
2)
.56
(.5
1)
.78
(.1
9)
.83
(.3
8)
.94
(.2
4)
.89
(.3
2)
.89
(.0
6)
.88
(.0
9)
25
.89
(.3
2)
.94
(.2
4)
.83
(.3
8)
.89
(.0
6)
1.0
0
(.0
0)
1.0
0
(.0
0)
.89
(.3
2)
.96
(.0
6)
1.0
0
(.0
0)
.94
(.2
4)
.83
(.3
8)
.93
(.0
8)
.93
(.0
4)
26
.94
(.2
4)
.94
(.2
4)
.83
(.3
8)
.91
(.0
6)
.78
(.4
3)
1.0
0
(.0
0)
.78
(.4
3)
.85
(.1
3)
.78
(.4
3)
1.0
0
(.0
0)
.94
(.2
4)
.91
(.1
2)
.89
(.0
3)
F.
Cli
ent
Ad
vo
cacy
.7
9
(.1
2)
.96
(.1
0)
.72
(.1
6)
.82
(.1
2)
.86
(.0
8)
.98
(.0
5)
.82
(.1
9)
.89
(.0
8)
.91
(.0
7)
.98
(.0
3)
.77
(.1
1)
.89
(.1
2)
.86
(.0
4)
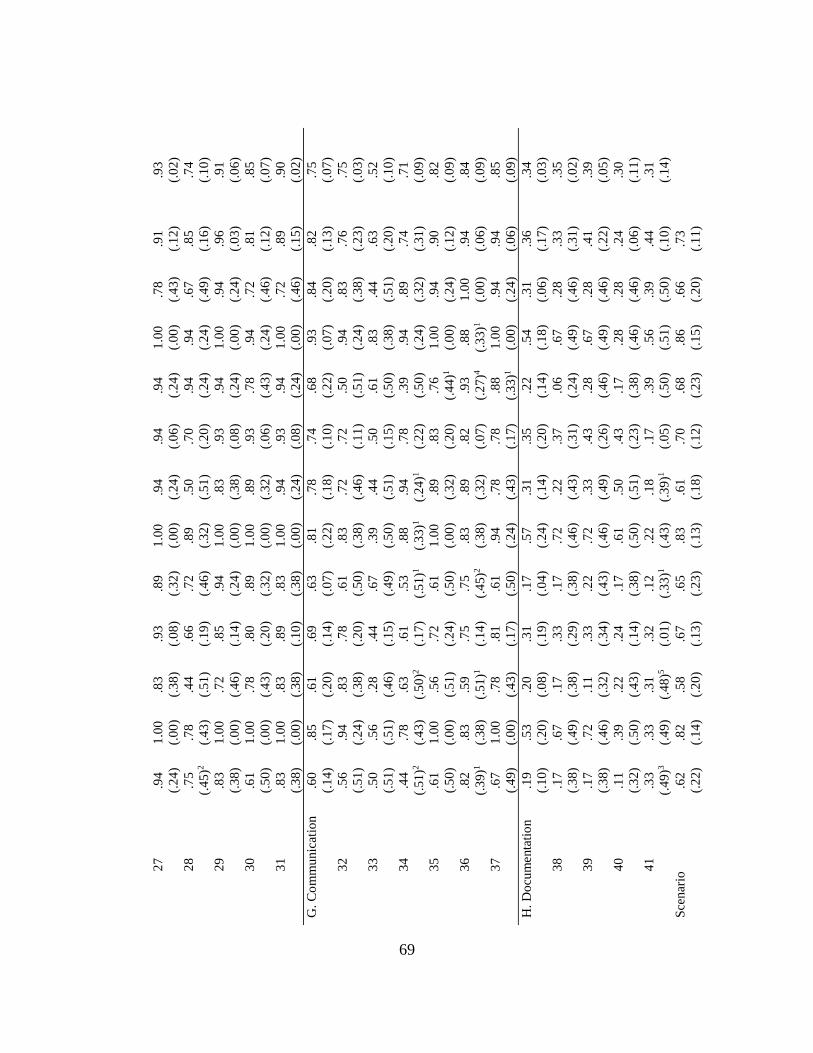
69
27
.94
(.2
4)
1.0
0
(.0
0)
.83
(.3
8)
.93
(.0
8)
.89
(.3
2)
1.0
0
(.0
0)
.94
(.2
4)
.94
(.0
6)
.94
(.2
4)
1.0
0
(.0
0)
.78
(.4
3)
.91
(.1
2)
.93
(.0
2)
28
.75
(.4
5)2
.78
(.4
3)
.44
(.5
1)
.66
(.1
9)
.72
(.4
6)
.89
(.3
2)
.50
(.5
1)
.70
(.2
0)
.94
(.2
4)
.94
(.2
4)
.67
(.4
9)
.85
(.1
6)
.74
(.1
0)
29
.83
(.3
8)
1.0
0
(.0
0)
.72
(.4
6)
.85
(.1
4)
.94
(.2
4)
1.0
0
(.0
0)
.83
(.3
8)
.93
(.0
8)
.94
(.2
4)
1.0
0
(.0
0)
.94
(.2
4)
.96
(.0
3)
.91
(.0
6)
30
.61
(.5
0)
1.0
0
(.0
0)
.78
(.4
3)
.80
(.2
0)
.89
(.3
2)
1.0
0
(.0
0)
.89
(.3
2)
.93
(.0
6)
.78
(.4
3)
.94
(.2
4)
.72
(.4
6)
.81
(.1
2)
.85
(.0
7)
31
.83
(.3
8)
1.0
0
(.0
0)
.83
(.3
8)
.89
(.1
0)
.83
(.3
8)
1.0
0
(.0
0)
.94
(.2
4)
.93
(.0
8)
.94
(.2
4)
1.0
0
(.0
0)
.72
(.4
6)
.89
(.1
5)
.90
(.0
2)
G.
Co
mm
unic
atio
n
.60
(.1
4)
.85
(.1
7)
.61
(.2
0)
.69
(.1
4)
.63
(.0
7)
.81
(.2
2)
.78
(.1
8)
.74
(.1
0)
.68
(.2
2)
.93
(.0
7)
.84
(.2
0)
.82
(.1
3)
.75
(.0
7)
32
.56
(.5
1)
.94
(.2
4)
.83
(.3
8)
.78
(.2
0)
.61
(.5
0)
.83
(.3
8)
.72
(.4
6)
.72
(.1
1)
.50
(.5
1)
.94
(.2
4)
.83
(.3
8)
.76
(.2
3)
.75
(.0
3)
33
.50
(.5
1)
.56
(.5
1)
.28
(.4
6)
.44
(.1
5)
.67
(.4
9)
.39
(.5
0)
.44
(.5
1)
.50
(.1
5)
.61
(.5
0)
.83
(.3
8)
.44
(.5
1)
.63
(.2
0)
.52
(.1
0)
34
.44
(.5
1)2
.78
(.4
3)
.63
(.5
0)2
.61
(.1
7)
.53
(.5
1)1
.88
(.3
3)1
.94
(.2
4)1
.78
(.2
2)
.39
(.5
0)
.94
(.2
4)
.89
(.3
2)
.74
(.3
1)
.71
(.0
9)
35
.61
(.5
0)
1.0
0
(.0
0)
.56
(.5
1)
.72
(.2
4)
.61
(.5
0)
1.0
0
(.0
0)
.89
(.3
2)
.83
(.2
0)
.76
(.4
4)1
1.0
0
(.0
0)
.94
(.2
4)
.90
(.1
2)
.82
(.0
9)
36
.82
(.3
9)1
.83
(.3
8)
.59
(.5
1)1
.75
(.1
4)
.75
(.4
5)2
.83
(.3
8)
.89
(.3
2)
.82
(.0
7)
.93
(.2
7)4
.88
(.3
3)1
1.0
0
(.0
0)
.94
(.0
6)
.84
(.0
9)
37
.67
(.4
9)
1.0
0
(.0
0)
.78
(.4
3)
.81
(.1
7)
.61
(.5
0)
.94
(.2
4)
.78
(.4
3)
.78
(.1
7)
.88
(.3
3)1
1.0
0
(.0
0)
.94
(.2
4)
.94
(.0
6)
.85
(.0
9)
H.
Do
cum
enta
tio
n
.19
(.1
0)
.53
(.2
0)
.20
(.0
8)
.31
(.1
9)
.17
(.0
4)
.57
(.2
4)
.31
(.1
4)
.35
(.2
0)
.22
(.1
4)
.54
(.1
8)
.31
(.0
6)
.36
(.1
7)
.34
(.0
3)
38
.17
(.3
8)
.67
(.4
9)
.17
(.3
8)
.33
(.2
9)
.17
(.3
8)
.72
(.4
6)
.22
(.4
3)
.37
(.3
1)
.06
(.2
4)
.67
(.4
9)
.28
(.4
6)
.33
(.3
1)
.35
(.0
2)
39
.17
(.3
8)
.72
(.4
6)
.11
(.3
2)
.33
(.3
4)
.22
(.4
3)
.72
(.4
6)
.33
(.4
9)
.43
(.2
6)
.28
(.4
6)
.67
(.4
9)
.28
(.4
6)
.41
(.2
2)
.39
(.0
5)
40
.11
(.3
2)
.39
(.5
0)
.22
(.4
3)
.24
(.1
4)
.17
(.3
8)
.61
(.5
0)
.50
(.5
1)
.43
(.2
3)
.17
(.3
8)
.28
(.4
6)
.28
(.4
6)
.24
(.0
6)
.30
(.1
1)
41
.33
(.4
9)3
.33
(.4
9)
.31
(.4
8)5
.32
(.0
1)
.12
(.3
3)1
.22
(.4
3)
.18
(.3
9)1
.17
(.0
5)
.39
(.5
0)
.56
(.5
1)
.39
(.5
0)
.44
(.1
0)
.31
(.1
4)
Sce
nar
io
.62
(.2
2)
.82
(.1
4)
.58
(.2
0)
.67
(.1
3)
.65
(.2
3)
.83
(.1
3)
.61
(.1
8)
.70
(.1
2)
.68
(.2
3)
.86
(.1
5)
.66
(.2
0)
.73
(.1
1)
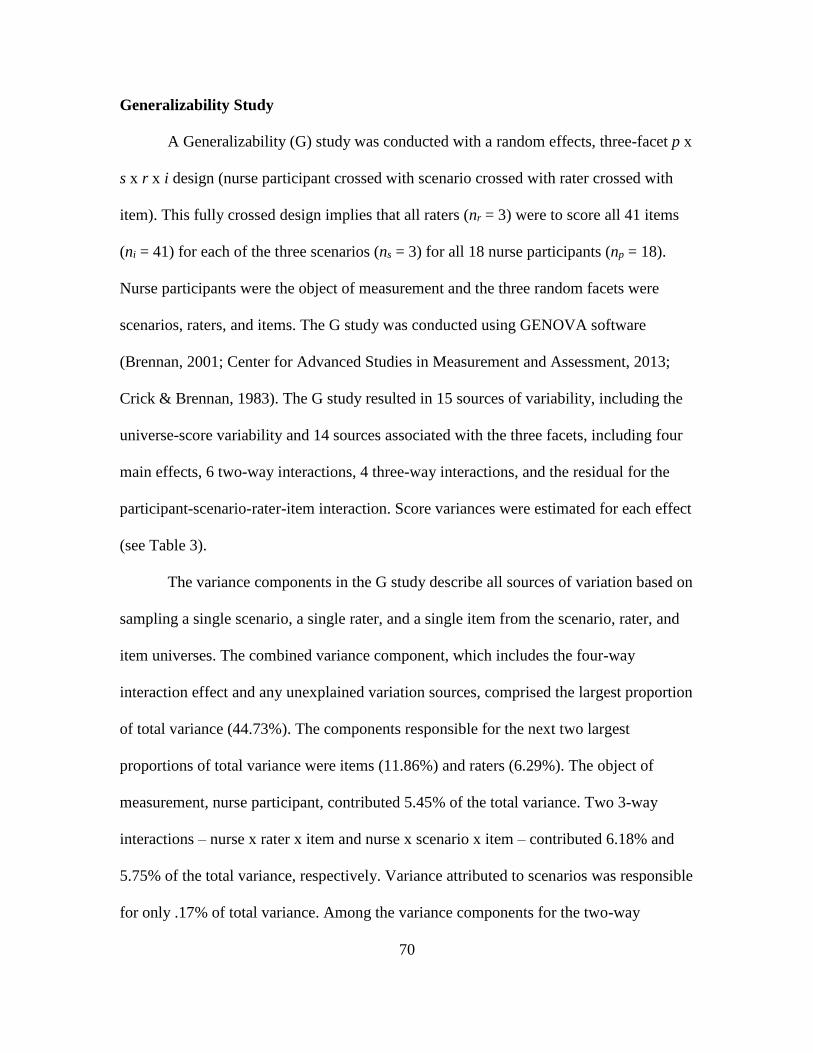
70
Generalizability Study
A Generalizability (G) study was conducted with a random effects, three-facet p x
s x r x i design (nurse participant crossed with scenario crossed with rater crossed with
item). This fully crossed design implies that all raters (nr = 3) were to score all 41 items
(ni = 41) for each of the three scenarios (ns = 3) for all 18 nurse participants (np = 18).
Nurse participants were the object of measurement and the three random facets were
scenarios, raters, and items. The G study was conducted using GENOVA software
(Brennan, 2001; Center for Advanced Studies in Measurement and Assessment, 2013;
Crick & Brennan, 1983). The G study resulted in 15 sources of variability, including the
universe-score variability and 14 sources associated with the three facets, including four
main effects, 6 two-way interactions, 4 three-way interactions, and the residual for the
participant-scenario-rater-item interaction. Score variances were estimated for each effect
(see Table 3).
The variance components in the G study describe all sources of variation based on
sampling a single scenario, a single rater, and a single item from the scenario, rater, and
item universes. The combined variance component, which includes the four-way
interaction effect and any unexplained variation sources, comprised the largest proportion
of total variance (44.73%). The components responsible for the next two largest
proportions of total variance were items (11.86%) and raters (6.29%). The object of
measurement, nurse participant, contributed 5.45% of the total variance. Two 3-way
interactions – nurse x rater x item and nurse x scenario x item – contributed 6.18% and
5.75% of the total variance, respectively. Variance attributed to scenarios was responsible
for only .17% of total variance. Among the variance components for the two-way
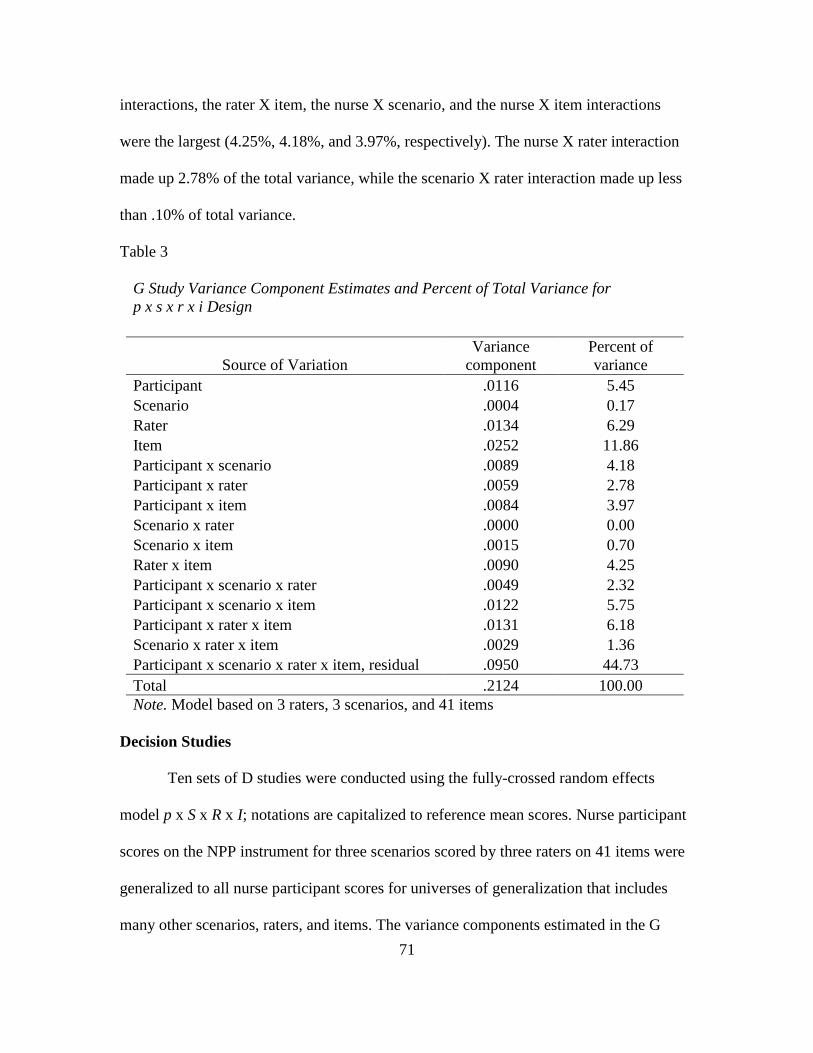
71
interactions, the rater X item, the nurse X scenario, and the nurse X item interactions
were the largest (4.25%, 4.18%, and 3.97%, respectively). The nurse X rater interaction
made up 2.78% of the total variance, while the scenario X rater interaction made up less
than .10% of total variance.
Table 3
G Study Variance Component Estimates and Percent of Total Variance for
p x s x r x i Design
Source of Variation
Variance
component
Percent of
variance
Participant .0116 5.45
Scenario .0004 0.17
Rater .0134 6.29
Item .0252 11.86
Participant x scenario .0089 4.18
Participant x rater .0059 2.78
Participant x item .0084 3.97
Scenario x rater .0000 0.00
Scenario x item .0015 0.70
Rater x item .0090 4.25
Participant x scenario x rater .0049 2.32
Participant x scenario x item .0122 5.75
Participant x rater x item .0131 6.18
Scenario x rater x item .0029 1.36
Participant x scenario x rater x item, residual .0950 44.73
Total .2124 100.00
Note. Model based on 3 raters, 3 scenarios, and 41 items
Decision Studies
Ten sets of D studies were conducted using the fully-crossed random effects
model p x S x R x I; notations are capitalized to reference mean scores. Nurse participant
scores on the NPP instrument for three scenarios scored by three raters on 41 items were
generalized to all nurse participant scores for universes of generalization that includes
many other scenarios, raters, and items. The variance components estimated in the G
72
study were used to estimate D study variance components. The G coefficient, Ερ̂2, and
index of dependability, φ̂, were estimated for each design, as well as the relative (�̂�2(𝛿))
and absolute (�̂�2(𝛥)) error variances, to allow for both relative and absolute
interpretations.
Among the D studies conducted was a D study with the same random effects
design as the G study, including three scenarios, three raters, and 41 items. The resulting
generalizability coefficient, Ερ̂2, was .65 with 95% CI [.49, .81] (relative SEM = .08), and
the dependability coefficient, phi (φ̂,), was .50 with 95% CI [.28, .72] (absolute SEM =
.11).
Sets of D study designs for different numbers of raters and scenarios are listed in
Table 4. Each of the ten sets includes nine D studies. The number of items for all designs
was constant at 41. First, in D study Set 1, the number of scenarios and the number of
raters increased simultaneously from one to nine. The purpose of this set of D studies was
to examine the effect of increasing both the number of scenarios and the number of raters
together. Then, in Sets 2 through 10, the number of scenarios was held constant at 1, 2, 3,
4, 5, 6, 7, 8, and 9 while increasing the number of raters from one to nine. The effect of
increasing the number of raters while holding the number of scenarios constant at
different levels was examined. Additional D studies were conducted holding the number
of raters constant at 1, 2, 3, 4, 5 6, 7, 8, and 9 while increasing the number of scenarios
from one to nine. This allowed the examination of the effect of increasing the number of
scenarios while holding the number of raters constant. However, even though the context
was different and provided additional information discussed in this study, the additional
D studies duplicated studies from Sets 2 – 10, so they are not shown separately.
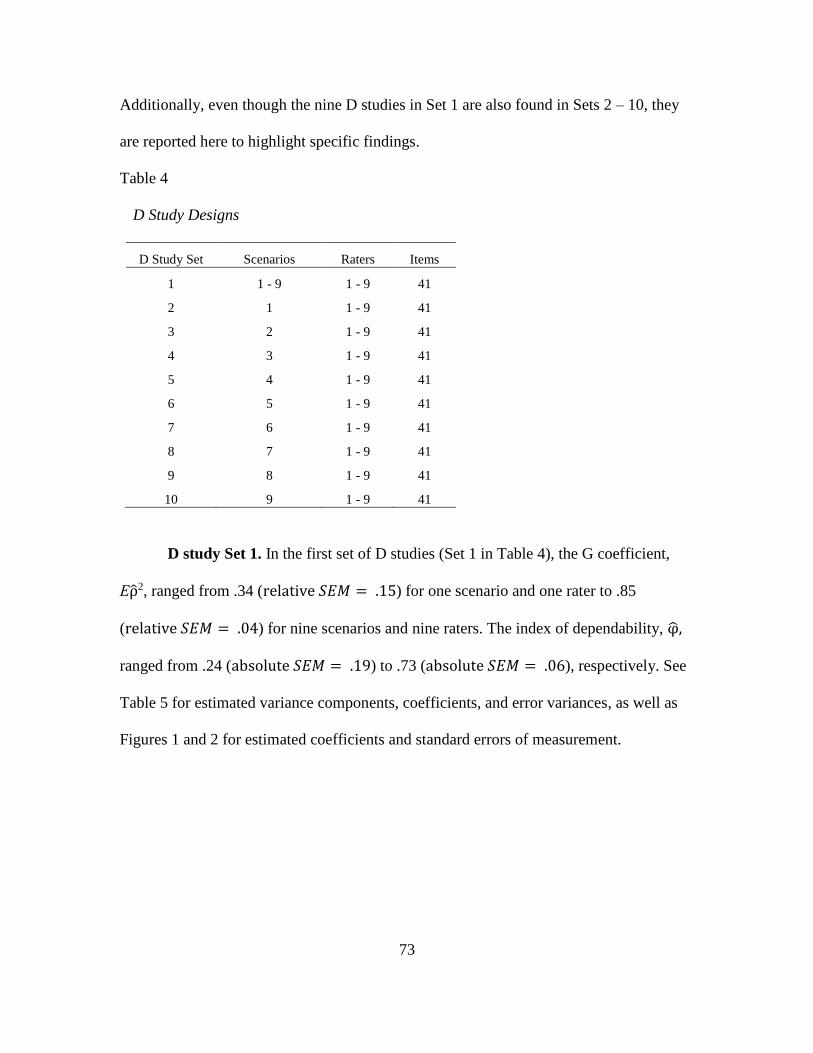
73
Additionally, even though the nine D studies in Set 1 are also found in Sets 2 – 10, they
are reported here to highlight specific findings.
Table 4
D Study Designs
D Study Set Scenarios Raters Items
1 1 - 9 1 - 9 41
2 1 1 - 9 41
3 2 1 - 9 41
4 3 1 - 9 41
5 4 1 - 9 41
6 5 1 - 9 41
7 6 1 - 9 41
8 7 1 - 9 41
9 8 1 - 9 41
10 9 1 - 9 41
D study Set 1. In the first set of D studies (Set 1 in Table 4), the G coefficient,
Ερ̂2, ranged from .34 (relative 𝑆𝐸𝑀 = .15) for one scenario and one rater to .85
(relative 𝑆𝐸𝑀 = .04) for nine scenarios and nine raters. The index of dependability, φ̂,
ranged from .24 (absolute 𝑆𝐸𝑀 = .19) to .73 (absolute 𝑆𝐸𝑀 = .06), respectively. See
Table 5 for estimated variance components, coefficients, and error variances, as well as
Figures 1 and 2 for estimated coefficients and standard errors of measurement.
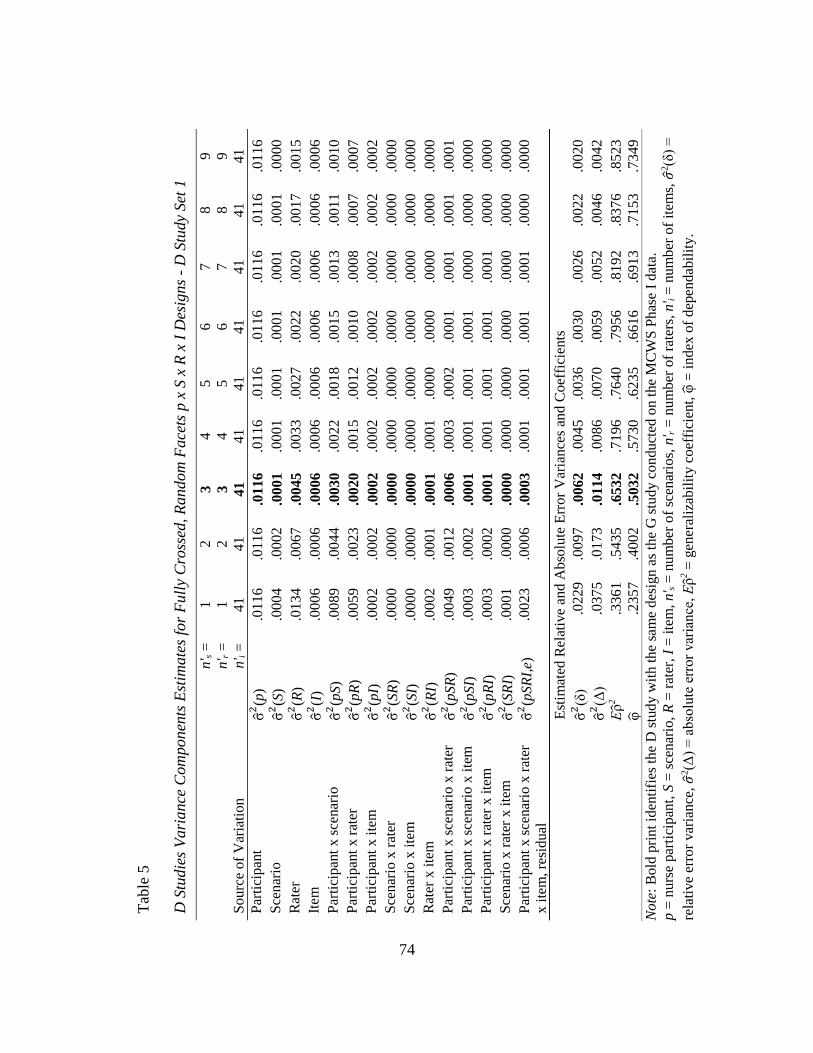
74
Tab
le 5
D S
tudie
s V
ari
ance
Com
ponen
ts E
stim
ate
s fo
r F
ull
y C
ross
ed,
Random
Face
ts p
x S
x R
x I
Des
ign
s -
D S
tud
y S
et 1
n' s =
1
2
3
4
5
6
7
8
9
n' r =
1
2
3
4
5
6
7
8
9
Sourc
e o
f V
aria
tio
n
n' i
=
41
41
41
41
41
4
1
41
4
1
41
Par
tici
pan
t σ̂
2(p
) .0
116
.0116
.0116
.0116
.0116
.01
16
.01
16
.01
16
.01
16
Sce
nar
io
σ̂2(S
) .0
004
.0002
.0001
.0001
.0001
.00
01
.00
01
.00
01
.00
00
Rat
er
σ̂2(R
) .0
134
.0067
.0045
.0033
.0027
.00
22
.00
20
.00
17
.00
15
Item
σ̂
2(I
) .0
006
.0006
.0006
.0006
.0006
.00
06
.00
06
.00
06
.00
06
Par
tici
pan
t x
sce
nar
io
σ̂2(p
S)
.0089
.0044
.0030
.0022
.0018
.00
15
.00
13
.00
11
.00
10
Par
tici
pan
t x
rat
er
σ̂2(p
R)
.0059
.0023
.0020
.0015
.0012
.00
10
.00
08
.00
07
.00
07
Par
tici
pan
t x
ite
m
σ̂2(p
I)
.0002
.0002
.0002
.0002
.0002
.00
02
.00
02
.00
02
.00
02
Sce
nar
io x
rat
er
σ̂2(S
R)
.0000
.0000
.0000
.0000
.0000
.00
00
.00
00
.00
00
.00
00
Sce
nar
io x
ite
m
σ̂2(S
I)
.0000
.0000
.0000
.0000
.0000
.00
00
.00
00
.00
00
.00
00
Rat
er x
ite
m
σ̂2(R
I)
.0002
.0001
.0001
.0001
.0000
.00
00
.00
00
.00
00
.00
00
Par
tici
pan
t x
sce
nar
io x
rat
er
σ̂2(p
SR
) .0
049
.0012
.0006
.0003
.0002
.00
01
.00
01
.00
01
.00
01
Par
tici
pan
t x
sce
nar
io x
ite
m
σ̂2(p
SI)
.0
003
.0002
.0001
.0001
.0001
.00
01
.00
00
.00
00
.00
00
Par
tici
pan
t x
rat
er x
ite
m
σ̂2(p
RI)
.0
003
.0002
.0001
.0001
.0001
.00
01
.00
01
.00
00
.00
00
Sce
nar
io x
rat
er x
ite
m
σ̂2(S
RI)
.0
001
.0000
.0000
.0000
.0000
.00
00
.00
00
.00
00
.00
00
Par
tici
pan
t x
sce
nar
io x
rat
er
x i
tem
, re
sid
ual
σ̂
2(p
SR
I,e)
.0
023
.0006
.0003
.0001
.0001
.00
01
.00
01
.00
00
.00
00
Est
imat
ed R
elat
ive
and A
bso
lute
Err
or
Var
iance
s an
d C
oef
fici
ents
σ̂
2(δ
) .0
229
.0097
.0062
.0045
.0036
.00
30
.00
26
.00
22
.00
20
σ̂
2(Δ
) .0
375
.0173
.0114
.0086
.0070
.00
59
.00
52
.00
46
.00
42
Ε
ρ̂2
.3361
.5435
.6532
.7196
.7640
.79
56
.81
92
.83
76
.85
23
φ̂
.2
357
.4002
.5032
.5730
.6235
.66
16
.69
13
.71
53
.73
49
Note
: B
old
pri
nt
iden
tifi
es t
he
D s
tud
y w
ith
th
e sa
me
des
ign
as
the
G s
tud
y c
on
duct
ed o
n t
he
MC
WS
Phas
e I
dat
a.
p =
nu
rse
par
tici
pan
t, S
= s
cen
ario
, R
= r
ater
, I
= i
tem
, n' s =
num
ber
of
scen
ario
s, n
' r =
num
ber
of
rate
rs, n
' i =
nu
mb
er o
f it
ems,
𝜎2(δ
) =
rela
tive
erro
r var
ian
ce,
𝜎2(Δ
) =
ab
solu
te e
rror
var
iance
, Ε
ρ̂2 =
gen
eral
izab
ilit
y c
oef
fici
ent,
φ̂ =
in
dex
of
dep
end
abil
ity.
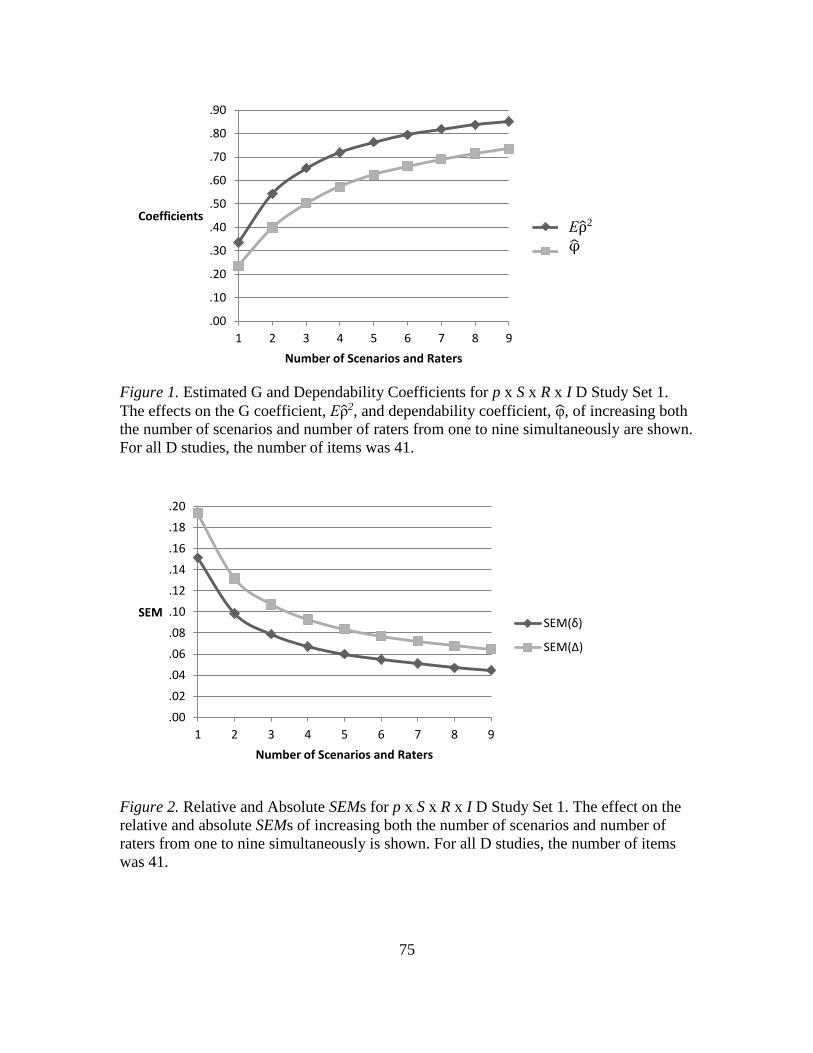
75
Figure 1. Estimated G and Dependability Coefficients for p x S x R x I D Study Set 1.
The effects on the G coefficient, Ερ̂2, and dependability coefficient, φ̂, of increasing both
the number of scenarios and number of raters from one to nine simultaneously are shown.
For all D studies, the number of items was 41.
Figure 2. Relative and Absolute SEMs for p x S x R x I D Study Set 1. The effect on the
relative and absolute SEMs of increasing both the number of scenarios and number of
raters from one to nine simultaneously is shown. For all D studies, the number of items
was 41.
.00
.10
.20
.30
.40
.50
.60
.70
.80
.90
1 2 3 4 5 6 7 8 9
Coefficients
Number of Scenarios and Raters
Ερ2
φ
.00
.02
.04
.06
.08
.10
.12
.14
.16
.18
.20
1 2 3 4 5 6 7 8 9
SEM
Number of Scenarios and Raters
SEM(δ)
SEM(Δ)
Ερ̂2
φ̂
76
D study Sets 2 - 10. D study Sets 2 through 10 are presented next. Each set
includes nine separate D study designs. Within each set, the number of scenarios was
held constant for all nine D studies, while the number of raters was increased from one to
nine. In each of these designs, the number of items was held constant at 41. See Tables 6
– 8 and Figures 3 - 6 for a sample of the estimated variance components, G coefficients,
indices of dependability, and estimated error variances; the tables display results for one,
three, six, and nine raters. The figures report estimated standard errors of measurement
(SEMs; the square roots of the estimated error variances), rather than estimated error
variances. In all cases, increasing the number of scenarios or the number of raters
improved reliability. As the number of scenarios or raters increased, the G coefficient and
index of dependability increased and estimated variance components and SEMs
decreased.
In Figures 3 – 6, the x-axis represents increasing numbers of raters for each
trajectory. Each trajectory represents a different number of scenarios ranging from one to
nine. Figures 3 and 5 illustrate the generalizability and dependability coefficients,
respectively, while Figures 4 and 6 portray the relative and absolute SEMs, respectively.
In Figures 3 and 5, the reliability coefficients increased more slowly as the number of
raters increased beyond two raters, as can be seen in the change in slope of all lines.
Reliability increases further diminished above three raters.
Reliability coefficients and increasing number of scenarios. As the number of
scenarios increased, incremental gains in reliability coefficients diminished, holding the
number of raters constant, as is illustrated by the decreasing distance between the
trajectories in Figures 3 and 5. Distance between the trajectories noticeably decreased
77
between two to three scenarios and from three to four scenarios, signifying diminishing
improvement in reliability for both the generalizability coefficient and the dependability
coefficient. For example, for a design with three scenarios and one to nine raters (D study
Set 4), the G coefficient ranged from .49 to .73 and phi ranged from .31 to .63,
respectively. With six scenarios, the G coefficient increased to .56 for one rater and .82
for nine raters, while the dependability coefficient increased to .33 for one rater and .71
for nine raters. When the number of scenarios increased to nine, the G and dependability
coefficients increased to .58 and .34 for one rater and .85 and .73 for nine raters,
respectively. Although both coefficients increased as the number of scenarios increased,
the rate of increase diminished as the number of scenarios increased.
However, with each incremental increase of one scenario, reliability coefficients
increased at an increasing rate with each additional rater. When only one scenario was
involved in the design, increasing the number of raters from one to nine improved the G
coefficient by .18 and the dependability coefficient by .23. When the design included
three scenarios, increasing the number of raters from one to nine improved the G
coefficient by .24 and the dependability coefficient by .34. Reliability coefficients
continued to increase in this manner through nine scenarios. With nine scenarios, the G
and dependability coefficients increased by .27 and .40, respectively, from one to nine
raters.
Standard errors of measurement. For each level of scenario, the estimated
relative and absolute SEMs decreased in magnitude with increasing number of raters (see
Figures 4 and 6). As number of raters increased above two, the relative and absolute
SEMs continued to decrease, but at a diminishing rate, as seen by a noticeable change in
78
the slope (i.e., tangent to the curve). Another noticeable decrease in slope occurred above
three raters. For example, with three scenarios, the relative SEM was .11, .08, and .06
with one, three, and nine raters, respectively. The absolute SEM was .16, .11, and .08
with one, three, and nine raters, respectively.
Increasing the number of scenarios also resulted in decreased SEMs, with declines
noticeably diminishing with more than two, and again with more than three, scenarios, as
seen by decreasing distance between the trajectories at these levels of scenarios. For
example, with three raters, relative SEMs were .12, .08, and .06 for one, three, and nine
scenarios, respectively. The absolute SEMs for three raters were .14, .11, and .09 for one,
three, and nine scenarios, respectively.
Reliability coefficients and increasing number of raters. With each incremental
increase of one rater (for levels of one to six raters), reliability coefficients improved at
an increasing rate from one to nine scenarios. From six to nine raters, the generalizability
coefficient continued to increase, but at a constant rate. With each incremental increase of
one rater (for levels of one to nine raters), the dependability coefficient improved at an
increasing rate from one to nine scenarios. For example, when only one rater was
involved in the design, increasing the number of scenarios from one to nine improved the
G coefficient by .24 and the dependability coefficient by .10. For a design with three
raters, increasing the number of scenarios from one to nine improved the G coefficient by
.31 and the dependability coefficient by .20. With nine raters, the G coefficient increased
by.33 and the dependability coefficient by .27 from one to nine scenarios.
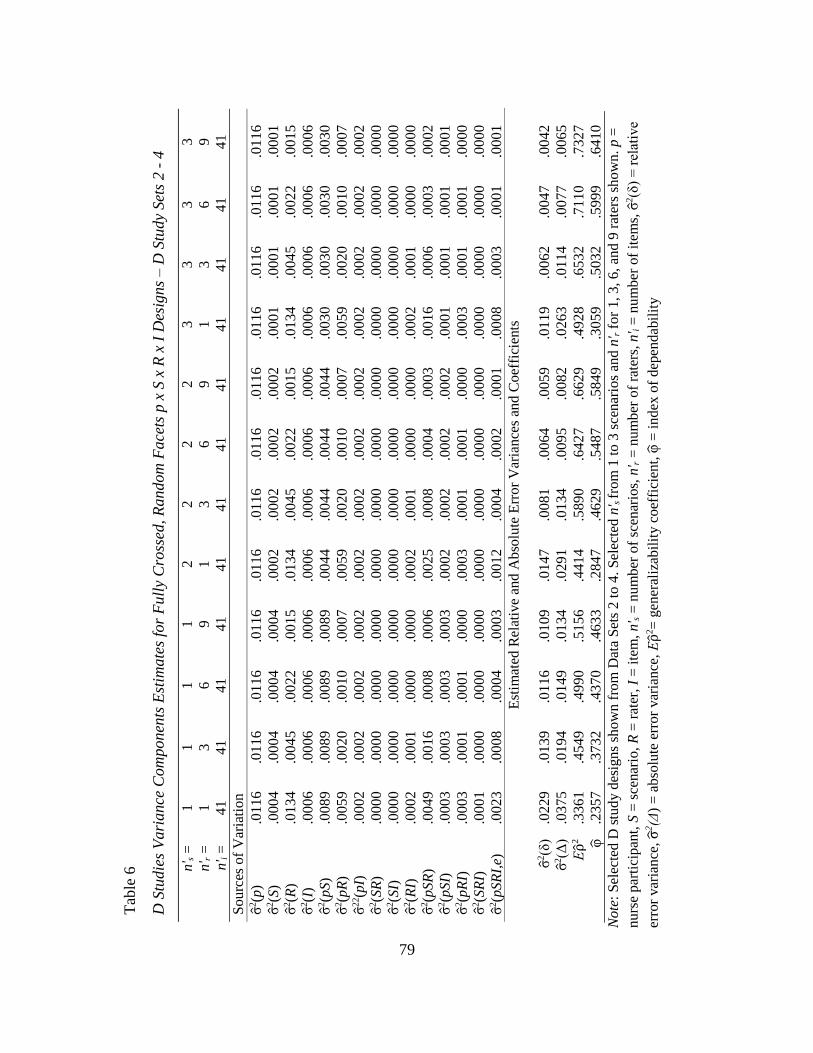
79
Tab
le 6
D S
tudie
s V
ari
ance
Com
ponen
ts E
stim
ate
s fo
r F
ull
y C
ross
ed, R
andom
Face
ts p
x S
x R
x I
Des
igns – D
Stu
dy
Set
s 2 -
4
n' s =
1
1
1
1
2
2
2
2
3
3
3
3
n' r =
1
3
6
9
1
3
6
9
1
3
6
9
n' i
=
41
41
41
41
41
41
41
41
4
1
41
41
41
Sourc
es o
f V
aria
tion
σ̂2(p
) .0
11
6
.01
16
.0116
.0116
.0116
.0116
.0116
.0116
.01
16
.01
16
.01
16
.01
16
σ̂2(S
) .0
00
4
.00
04
.0004
.0004
.0002
.0002
.0002
.0002
.00
01
.00
01
.00
01
.00
01
σ̂2(R
) .0
13
4
.00
45
.0022
.0015
.0134
.0045
.0022
.0015
.01
34
.00
45
.00
22
.00
15
σ̂2(I
) .0
00
6
.00
06
.0006
.0006
.0006
.0006
.0006
.0006
.00
06
.00
06
.00
06
.00
06
σ̂2(p
S)
.00
89
.00
89
.0089
.0089
.0044
.0044
.0044
.0044
.00
30
.00
30
.00
30
.00
30
σ̂2(p
R)
.00
59
.00
20
.0010
.0007
.0059
.0020
.0010
.0007
.00
59
.00
20
.00
10
.00
07
σ̂2
2(p
I)
.00
02
.00
02
.0002
.0002
.0002
.0002
.0002
.0002
.00
02
.00
02
.00
02
.00
02
σ̂2(S
R)
.00
00
.00
00
.0000
.0000
.0000
.0000
.0000
.0000
.00
00
.00
00
.00
00
.00
00
σ̂2(S
I)
.0000
.0000
.0000
.0000
.0000
.0000
.0000
.0000
.0000
.0000
.0000
.0000
σ̂2(R
I)
.00
02
.00
01
.0000
.0000
.0002
.0001
.0000
.0000
.00
02
.00
01
.00
00
.00
00
σ̂2(p
SR
) .0
04
9
.00
16
.0008
.0006
.0025
.0008
.0004
.0003
.00
16
.00
06
.00
03
.00
02
σ̂2(p
SI)
.0
00
3
.00
03
.0003
.0003
.0002
.0002
.0002
.0002
.00
01
.00
01
.00
01
.00
01
σ̂2(p
RI)
.0
00
3
.00
01
.0001
.0000
.0003
.0001
.0001
.0000
.00
03
.00
01
.00
01
.00
00
σ̂2(S
RI)
.0
00
1
.00
00
.0000
.0000
.0000
.0000
.0000
.0000
.00
00
.00
00
.00
00
.00
00
σ̂2(p
SR
I,e)
.0
02
3
.00
08
.0004
.0003
.0012
.0004
.0002
.0001
.00
08
.00
03
.00
01
.00
01
Est
imat
ed R
elat
ive
and A
bso
lute
Err
or
Var
iance
s an
d C
oef
fici
ents
σ̂2(δ
) .0
22
9
.01
39
.0116
.0109
.0147
.0081
.0064
.0059
.01
19
.00
62
.00
47
.00
42
σ̂2(Δ
) .0
37
5
.01
94
.0149
.0134
.0291
.0134
.0095
.0082
.02
63
.01
14
.00
77
.00
65
Ερ̂
2
.33
61
.45
49
.4990
.5156
.4414
.5890
.6427
.6629
.49
28
.65
32
.71
10
.73
27
φ̂
.2
357
.37
32
.4370
.4633
.2847
.4629
.5487
.5849
.30
59
.50
32
.59
99
.64
10
Note
: S
elec
ted
D s
tud
y d
esig
ns
sho
wn f
rom
Dat
a S
ets
2 t
o 4
. S
elec
ted n
' s fro
m 1
to 3
sce
nar
ios
and
n' r f
or
1, 3
, 6
, an
d 9
rat
ers
sho
wn
. p
=
nurs
e par
tici
pan
t, S
= s
cenar
io,
R =
rat
er, I
= i
tem
, n' s =
num
ber
of
scen
ario
s, n
' r =
num
ber
of
rate
rs, n
' i =
nu
mb
er o
f it
ems,
σ̂2(δ
) =
rel
ativ
e
erro
r var
ian
ce,
σ̂2(Δ
) =
ab
solu
te e
rro
r var
iance
, Ε
ρ̂2=
gen
eral
izab
ilit
y c
oef
fici
ent,
φ̂ =
index
of
dep
end
abil
ity
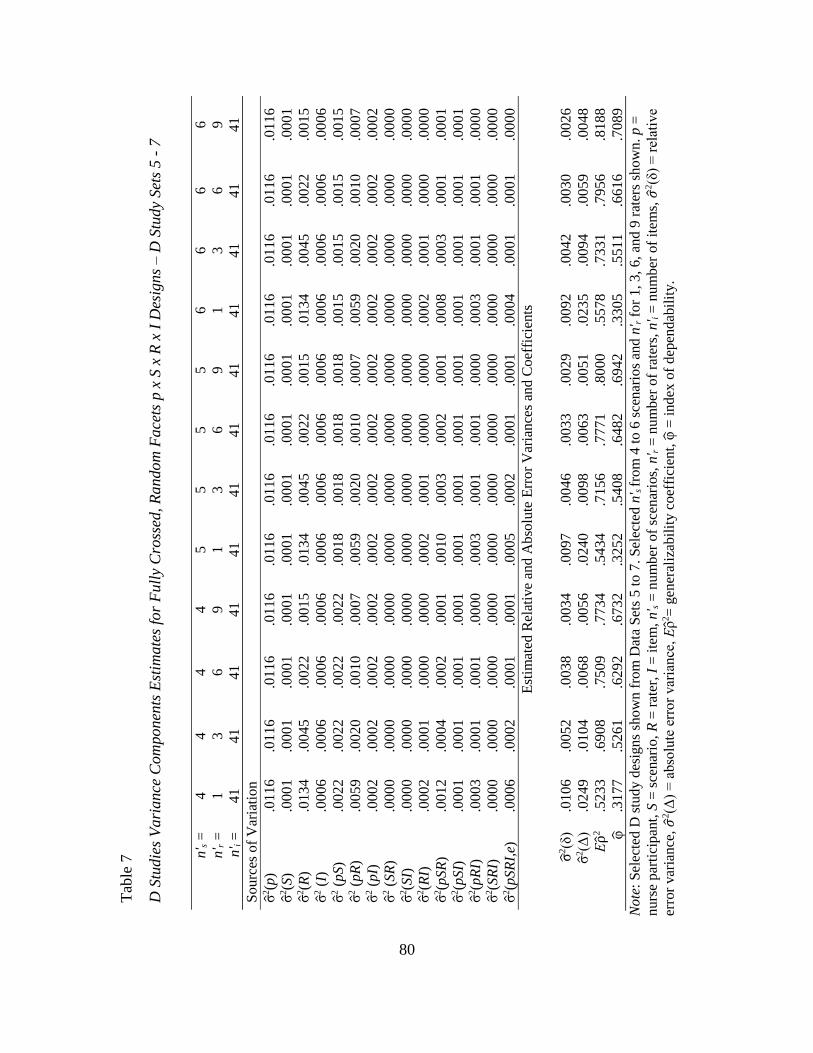
80
Tab
le 7
D S
tudie
s V
ari
ance
Com
ponen
ts E
stim
ate
s fo
r F
ull
y C
ross
ed, R
andom
Face
ts p
x S
x R
x I
Des
igns – D
Stu
dy
Set
s 5 -
7
n' s =
4
4
4
4
5
5
5
5
6
6
6
6
n' r =
1
3
6
9
1
3
6
9
1
3
6
9
n' i
=
41
41
41
41
41
41
41
41
41
41
4
1
41
Sourc
es o
f V
aria
tio
n
σ̂2(p
) .0
11
6
.01
16
.0116
.0116
.0116
.0116
.0116
.011
6
.01
16
.01
16
.01
16
.01
16
σ̂2(S
) .0
00
1
.00
01
.0001
.0001
.0001
.0001
.0001
.000
1
.00
01
.00
01
.00
01
.00
01
σ̂2(R
) .0
13
4
.00
45
.0022
.0015
.0134
.0045
.0022
.001
5
.01
34
.00
45
.00
22
.00
15
σ̂2 (
I)
.0006
.0006
.0006
.0006
.0006
.0006
.0006
.0006
.0006
.0006
.0006
.0006
σ̂2 (
pS)
.00
22
.00
22
.0022
.0022
.0018
.0018
.0018
.001
8
.00
15
.00
15
.00
15
.00
15
σ̂2 (
pR
) .0
05
9
.00
20
.0010
.0007
.0059
.0020
.0010
.000
7
.00
59
.00
20
.00
10
.00
07
σ̂2 (
pI)
.0
00
2
.00
02
.0002
.0002
.0002
.0002
.0002
.000
2
.00
02
.00
02
.00
02
.00
02
σ̂2 (
SR
) .0
00
0
.00
00
.0000
.0000
.0000
.0000
.0000
.000
0
.00
00
.00
00
.00
00
.00
00
σ̂2(S
I)
.00
00
.00
00
.0000
.0000
.0000
.0000
.0000
.000
0
.00
00
.00
00
.00
00
.00
00
σ̂2(R
I)
.00
02
.00
01
.0000
.0000
.0002
.0001
.0000
.000
0
.00
02
.00
01
.00
00
.00
00
σ̂2(p
SR
) .0
01
2
.00
04
.0002
.0001
.0010
.0003
.0002
.000
1
.00
08
.00
03
.00
01
.00
01
σ̂2(p
SI)
.0
00
1
.00
01
.0001
.0001
.0001
.0001
.0001
.000
1
.00
01
.00
01
.00
01
.00
01
σ̂2(p
RI)
.0
003
.0001
.0001
.0000
.0003
.0001
.0001
.0000
.0003
.0001
.0001
.0000
σ̂2(S
RI)
.0
00
0
.00
00
.0000
.0000
.0000
.0000
.0000
.000
0
.00
00
.00
00
.00
00
.00
00
σ̂2(p
SR
I,e)
.0
00
6
.00
02
.0001
.0001
.0005
.0002
.0001
.000
1
.00
04
.00
01
.00
01
.00
00
Est
imat
ed R
elat
ive
and A
bso
lute
Err
or
Var
iance
s an
d C
oef
fici
ents
σ̂2(δ
) .0
10
6
.00
52
.0038
.0034
.0097
.0046
.0033
.002
9
.00
92
.00
42
.00
30
.00
26
σ̂2(Δ
) .0
24
9
.01
04
.0068
.0056
.0240
.0098
.0063
.005
1
.02
35
.00
94
.00
59
.00
48
Ερ̂
2
.52
33
.69
08
.7509
.7734
.5434
.7156
.7771
.800
0
.55
78
.73
31
.79
56
.81
88
φ̂
.31
77
.52
61
.6292
.6732
.3252
.5408
.6482
.694
2
.33
05
.55
11
.66
16
.70
89
Note
: S
elec
ted
D s
tud
y d
esig
ns
sho
wn f
rom
Dat
a S
ets
5 t
o 7
. S
elec
ted n
' s fro
m 4
to 6
sce
nar
ios
and
n' r f
or
1, 3
, 6
, an
d 9
rat
ers
sho
wn
. p
=
nurs
e p
arti
cip
ant,
S =
sce
nar
io,
R =
rat
er, I
= i
tem
, n' s =
num
ber
of
scen
ario
s, n
' r =
num
ber
of
rate
rs, n
' i =
nu
mb
er o
f it
ems,
𝜎2(δ
) =
rel
ativ
e
erro
r var
ian
ce,
𝜎2(Δ
) =
abso
lute
err
or
var
iance
, Ε
ρ̂2=
gen
eral
izab
ilit
y c
oef
fici
ent,
φ̂ =
index
of
dep
end
abil
ity.
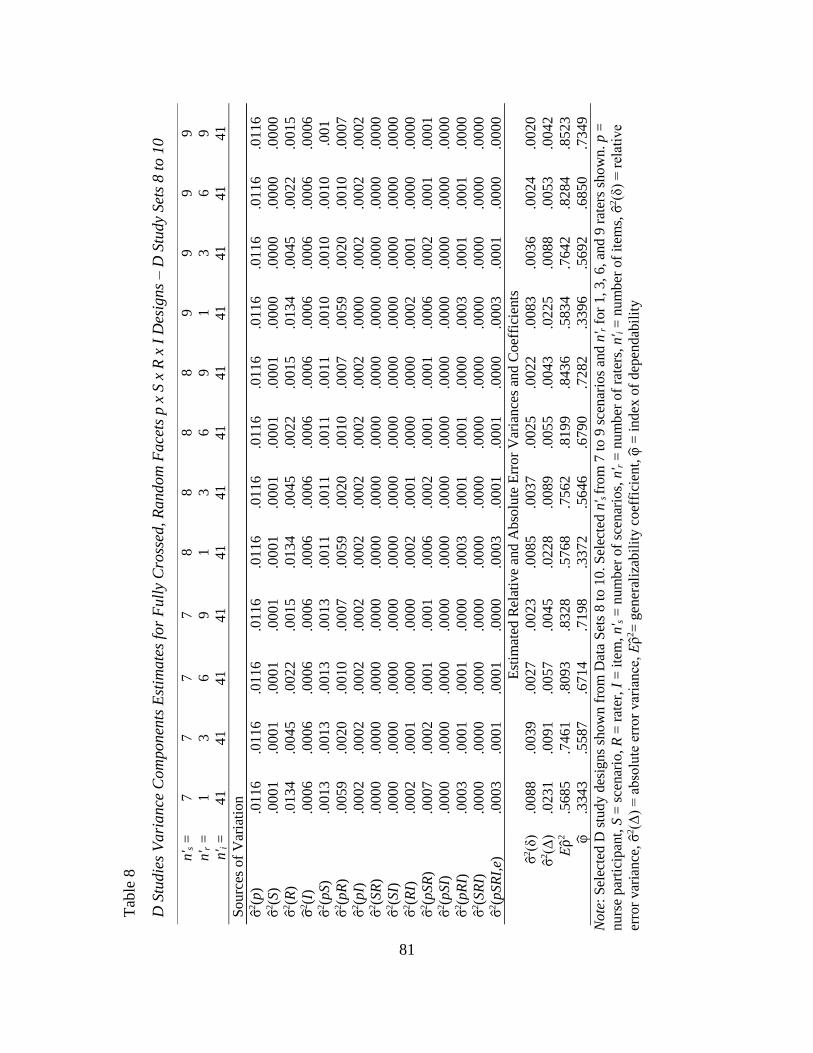
81
Tab
le 8
D S
tudie
s V
ari
ance
Com
ponen
ts E
stim
ate
s fo
r F
ull
y C
ross
ed, R
andom
Face
ts p
x S
x R
x I
Des
igns – D
Stu
dy
Set
s 8 t
o 1
0
n' s =
7
7
7
7
8
8
8
8
9
9
9
9
n' r =
1
3
6
9
1
3
6
9
1
3
6
9
n' i
=
41
41
41
41
41
41
41
41
4
1
41
4
1
41
Sourc
es o
f V
aria
tio
n
σ̂2(p
) .0
11
6
.01
16
.0116
.0116
.0116
.0116
.0116
.011
6
.01
16
.01
16
.01
16
.01
16
σ̂2(S
) .0
00
1
.00
01
.0001
.0001
.0001
.0001
.0001
.000
1
.00
00
.00
00
.00
00
.00
00
σ̂2(R
) .0
13
4
.00
45
.0022
.0015
.0134
.0045
.0022
.001
5
.01
34
.00
45
.00
22
.00
15
σ̂2(I
) .0
00
6
.00
06
.0006
.0006
.0006
.0006
.0006
.000
6
.00
06
.00
06
.00
06
.00
06
σ̂2(p
S)
.00
13
.00
13
.0013
.0013
.0011
.0011
.0011
.001
1
.00
10
.00
10
.00
10
.00
1
σ̂2(p
R)
.00
59
.00
20
.0010
.0007
.0059
.0020
.0010
.000
7
.00
59
.00
20
.00
10
.00
07
σ̂2(p
I)
.00
02
.00
02
.0002
.0002
.0002
.0002
.0002
.000
2
.00
00
.00
02
.00
02
.00
02
σ̂2(S
R)
.00
00
.00
00
.0000
.0000
.0000
.0000
.0000
.000
0
.00
00
.00
00
.00
00
.00
00
σ̂2(S
I)
.00
00
.00
00
.0000
.0000
.0000
.0000
.0000
.000
0
.00
00
.00
00
.00
00
.00
00
σ̂2(R
I)
.00
02
.00
01
.0000
.0000
.0002
.0001
.0000
.000
0
.00
02
.00
01
.00
00
.00
00
σ̂2(p
SR
) .0
00
7
.00
02
.0001
.0001
.0006
.0002
.0001
.000
1
.00
06
.00
02
.00
01
.00
01
σ̂2(p
SI)
.0
00
0
.00
00
.0000
.0000
.0000
.0000
.0000
.000
0
.00
00
.00
00
.00
00
.00
00
σ̂2(p
RI)
.0
00
3
.00
01
.0001
.0000
.0003
.0001
.0001
.000
0
.00
03
.00
01
.00
01
.00
00
σ̂2(S
RI)
.0
00
0
.00
00
.0000
.0000
.0000
.0000
.0000
.000
0
.00
00
.00
00
.00
00
.00
00
σ̂2(p
SR
I,e)
.0
00
3
.00
01
.0001
.0000
.0003
.0001
.0001
.000
0
.00
03
.00
01
.00
00
.00
00
E
stim
ated
Rel
ativ
e an
d A
bso
lute
Err
or
Var
iance
s an
d C
oef
fici
ents
σ̂2(δ
) .0
08
8
.00
39
.0027
.0023
.0085
.0037
.0025
.002
2
.00
83
.00
36
.00
24
.00
20
σ̂2(Δ
) .0
23
1
.00
91
.0057
.0045
.0228
.0089
.0055
.004
3
.02
25
.00
88
.00
53
.00
42
Ερ̂
2
.56
85
.74
61
.8093
.8328
.5768
.7562
.8199
.843
6
.58
34
.76
42
.82
84
.85
23
φ̂
.33
43
.55
87
.6714
.7198
.3372
.5646
.6790
.728
2
.33
96
.56
92
.68
50
.73
49
Note
: S
elec
ted
D s
tud
y d
esig
ns
sho
wn
fro
m D
ata
Set
s 8 t
o 1
0. S
elec
ted n
' s fro
m 7
to 9
sce
nar
ios
and
n' r f
or
1, 3
, 6
, an
d 9
rat
ers
sho
wn
. p
=
nurs
e par
tici
pan
t, S
= s
cenar
io,
R =
rat
er, I
= i
tem
, n' s =
num
ber
of
scen
ario
s, n
' r =
num
ber
of
rate
rs, n
' i =
nu
mb
er o
f it
ems,
σ̂2(δ
) =
rel
ativ
e
erro
r var
ian
ce, σ̂
2(Δ
) =
abso
lute
err
or
var
iance
, Ε
ρ̂2=
gen
eral
izab
ilit
y c
oef
fici
ent,
φ̂ =
index
of
dep
end
abil
ity
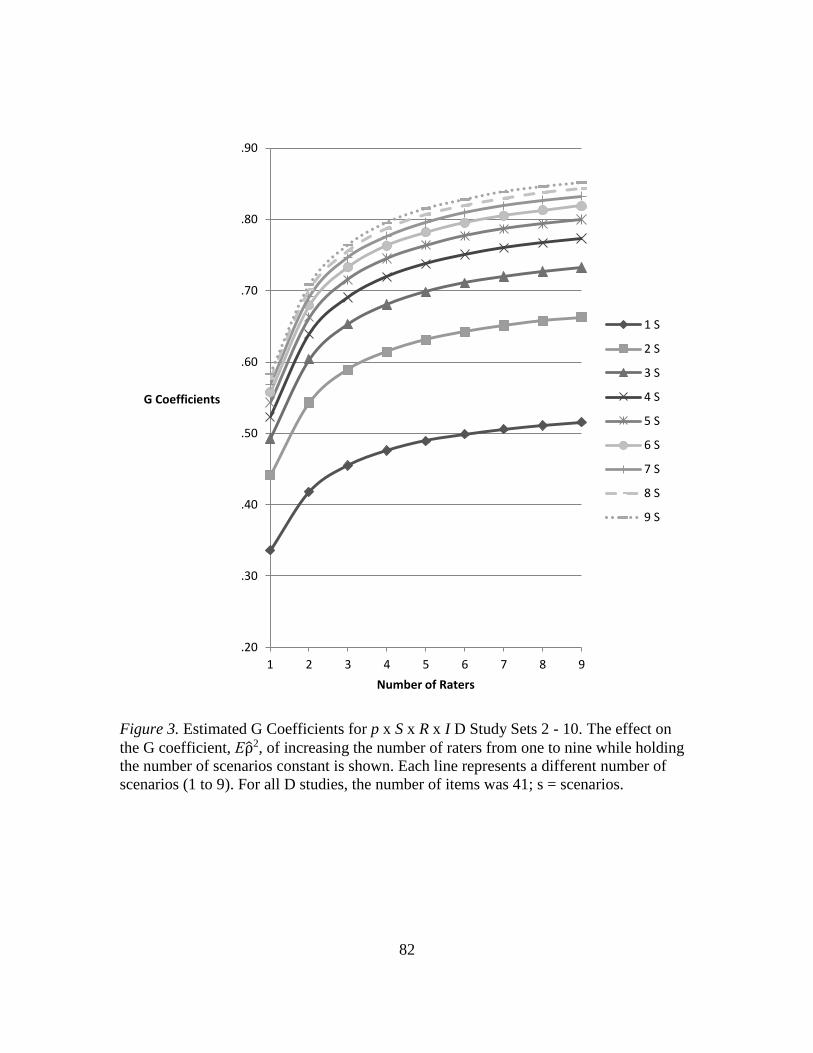
82
Figure 3. Estimated G Coefficients for p x S x R x I D Study Sets 2 - 10. The effect on
the G coefficient, Ερ̂2, of increasing the number of raters from one to nine while holding
the number of scenarios constant is shown. Each line represents a different number of
scenarios (1 to 9). For all D studies, the number of items was 41; s = scenarios.
.20
.30
.40
.50
.60
.70
.80
.90
1 2 3 4 5 6 7 8 9
G Coefficients
Number of Raters
1 S
2 S
3 S
4 S
5 S
6 S
7 S
8 S
9 S
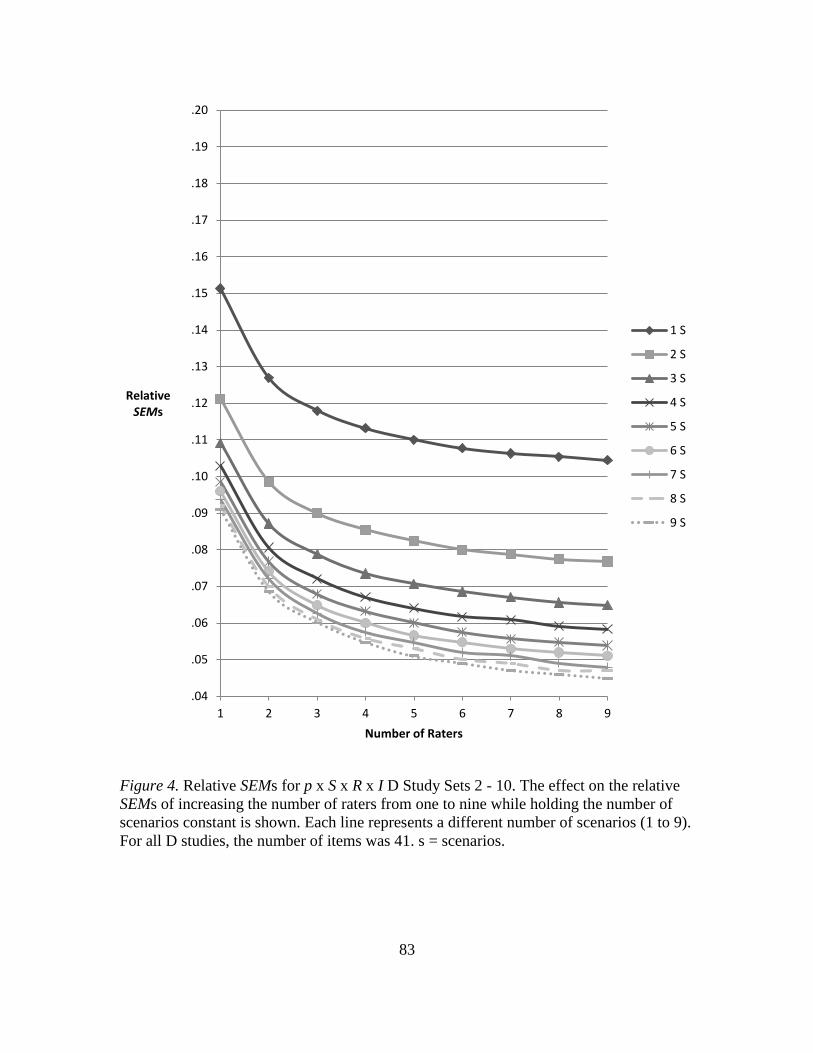
83
Figure 4. Relative SEMs for p x S x R x I D Study Sets 2 - 10. The effect on the relative
SEMs of increasing the number of raters from one to nine while holding the number of
scenarios constant is shown. Each line represents a different number of scenarios (1 to 9).
For all D studies, the number of items was 41. s = scenarios.
.04
.05
.06
.07
.08
.09
.10
.11
.12
.13
.14
.15
.16
.17
.18
.19
.20
1 2 3 4 5 6 7 8 9
RelativeSEMs
Number of Raters
1 S
2 S
3 S
4 S
5 S
6 S
7 S
8 S
9 S
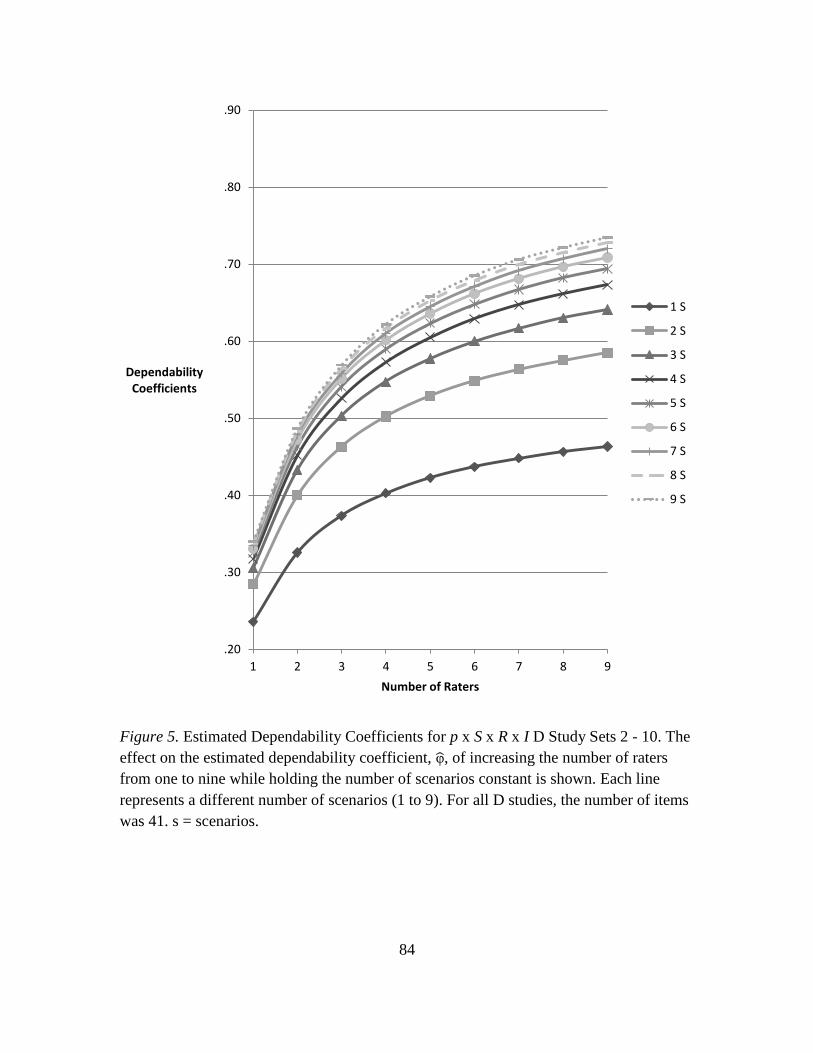
84
Figure 5. Estimated Dependability Coefficients for p x S x R x I D Study Sets 2 - 10. The
effect on the estimated dependability coefficient, φ̂, of increasing the number of raters
from one to nine while holding the number of scenarios constant is shown. Each line
represents a different number of scenarios (1 to 9). For all D studies, the number of items
was 41. s = scenarios.
.20
.30
.40
.50
.60
.70
.80
.90
1 2 3 4 5 6 7 8 9
DependabilityCoefficients
Number of Raters
1 S
2 S
3 S
4 S
5 S
6 S
7 S
8 S
9 S
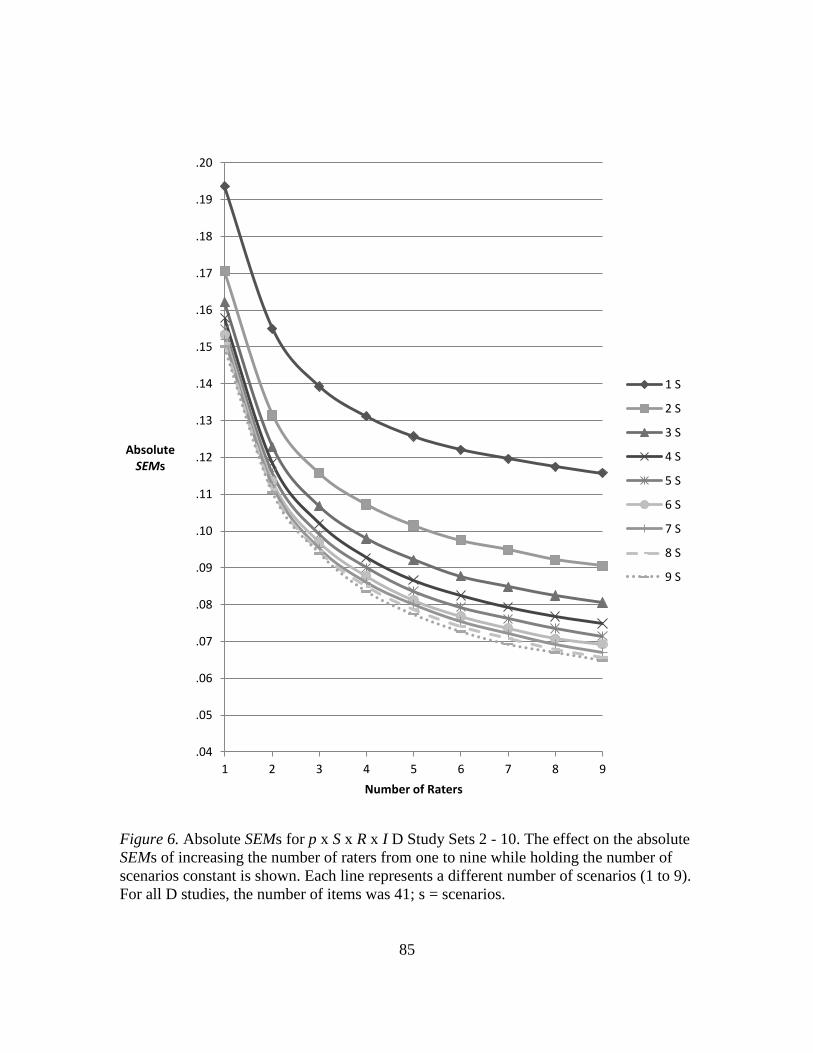
85
Figure 6. Absolute SEMs for p x S x R x I D Study Sets 2 - 10. The effect on the absolute
SEMs of increasing the number of raters from one to nine while holding the number of
scenarios constant is shown. Each line represents a different number of scenarios (1 to 9).
For all D studies, the number of items was 41; s = scenarios.
.04
.05
.06
.07
.08
.09
.10
.11
.12
.13
.14
.15
.16
.17
.18
.19
.20
1 2 3 4 5 6 7 8 9
AbsoluteSEMs
Number of Raters
1 S
2 S
3 S
4 S
5 S
6 S
7 S
8 S
9 S
86
Comparison of D studies – increasing scenarios versus increasing raters. The
effect on reliability of increasing the number of scenarios while holding raters constant
was compared to the effect of increasing the number of raters while holding scenarios
constant at different levels of each facet. Selected designs are shown in Table 9 and in
Figures 7 and 8 for comparison purposes.
As expected, the estimated generalizability (G) coefficient was greater than the
estimated dependability coefficient (phi), in all studies, since fewer sources of error
variance are used to calculate relative error variance, which in turn is used to calculate the
G coefficient. Absolute error variance contains more sources of error variance and is used
to calculate phi (see Equations 10 and 11).
In all designs, increasing the number of raters from one to nine while holding the
number of scenarios constant resulted in greater increases in phi than in the G coefficient.
For example, when one rater was in the design, phi improved by .22 (from .24 to .46),
while the G coefficient improved by .18 (from .34 to .52). At higher levels of scenarios,
this difference became more pronounced. For example, a design with four scenarios
resulted in phi improving by .35 (from .32 to .67) from one to nine raters and a design
with nine scenarios resulted in an increase of .39 (from .34 to .73). The G coefficient also
improved, but less than phi; with four scenarios, the G coefficient increased by .25 (from
.52 to .77) from one to nine raters, and with nine scenarios, it improved by .27 (from .58
to .85) from one to nine raters. The reason phi responded more to increases in raters than
did the G coefficient is based on information provided by the G study. The estimated
variance component for raters was the third largest component in the G study and
contributed 6.29% of total variance (see Table 3). The variance component for the main
87
effect of raters contributes to absolute error variance, but not relative error variance.
Therefore, increasing the number of raters resulted in decreased error variance
attributable to raters, which decreased absolute error variance, and, as a result,
contributed to greater increases in phi than in the G coefficient. However, increasing the
number of raters also affected the variance components for two- and three-way
interactions involving raters. The absolute error variance is affected by all interactions
and the relative error variance is affected by any interactions involving participants, so
both types of error variances were further impacted by resulting decreases in these
variance components, further increasing both the G coefficient and phi.
In contrast, in all designs, increasing the number of scenarios from one to nine
while holding the number of raters constant resulted in larger increases for the G
coefficient than for phi. For example, in a design with one rater, increasing the number of
scenarios from one to nine caused the G coefficient to increase .24 (from .34 to .58),
while phi only increased .10 (from .24 to only .34). Increasing the number of scenarios
resulted in decreases in the estimated variance components for the main effect of
scenarios and any interactions involving scenarios. The variance component for scenarios
affects the absolute error variance, but not the relative error variance (see Equations 10
and 11). However, in the G study, the estimated variance component for scenarios only
contributed .17% of total variance, thus increasing the number of scenarios in the design
did not have as great of an impact on decreasing the absolute error variance as did
increasing the number of raters. However, six variance components for interactions
involving scenarios contributed 14.31% of total variance (excluding the combined four-
way interaction and residual variance component), so increasing the number of scenarios
88
still had an impact on both error variances (three of the variance components involving
interactions with scenario impacted relative error variance).
The effect of increasing raters contrasted with the effect of increasing scenarios is
seen when one facet is held constant at lower levels, while the other facet is increased.
Figures 7 and 8 illustrate this contrast for G and dependability coefficients, respectively.
In Figure 7b, in designs with one, two, or three raters, increasing scenarios was more
effective at increasing the G coefficient than in a design (Figure 7a) with one, two, or
three scenarios when raters were increased. On the other hand, in Figure 8a, in a design
with one, two, or three scenarios, increasing raters was more effective at increasing the
dependability coefficient than in a design (Figure 8b) with one, two, or three raters when
scenarios were increased. However, in both sets of figures, the contrast between designs
was not as distinctive for higher levels of each facet.
In D study designs intended to minimize the number of raters while maximizing
reliability coefficients, G coefficients of .70 or greater were calculated for a D study
including two raters and a minimum of nine scenarios (Ερ̂2 = .71). When number of raters
increased to three, a minimum of five scenarios resulted in a G coefficient of .72, which
was equivalent to the G coefficient for a D study design with four raters and four
scenarios. The G coefficient didn’t reach .80 or higher until a minimum of four raters and
nine scenarios were in the design (Ερ̂2 = .81).
The minimum number of scenarios needed to reach a generalizability coefficient
of .70 in the current D study designs was three. As mentioned, five raters were required
for this level of reliability. Additionally, the minimum number of scenarios required to
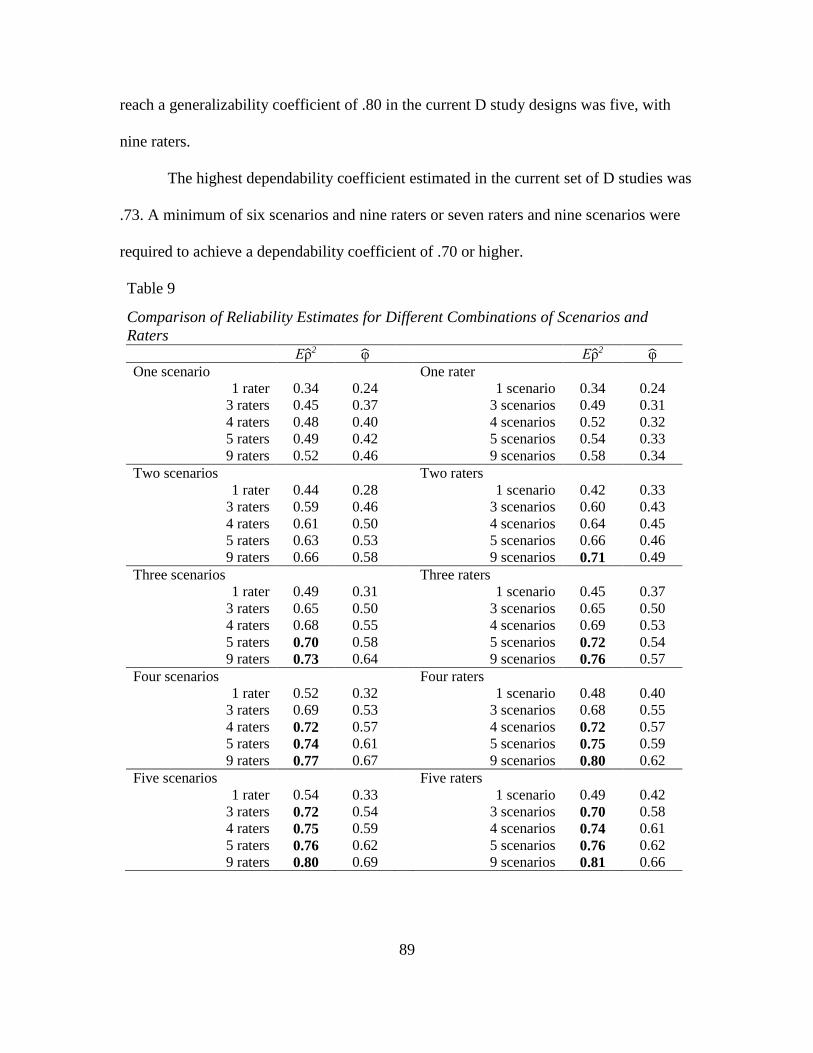
89
reach a generalizability coefficient of .80 in the current D study designs was five, with
nine raters.
The highest dependability coefficient estimated in the current set of D studies was
.73. A minimum of six scenarios and nine raters or seven raters and nine scenarios were
required to achieve a dependability coefficient of .70 or higher.
Table 9
Comparison of Reliability Estimates for Different Combinations of Scenarios and
Raters
Ερ̂2 φ̂ Ερ̂2 φ̂
One scenario One rater
1 rater 0.34 0.24 1 scenario 0.34 0.24
3 raters 0.45 0.37 3 scenarios 0.49 0.31
4 raters 0.48 0.40 4 scenarios 0.52 0.32
5 raters 0.49 0.42 5 scenarios 0.54 0.33
9 raters 0.52 0.46 9 scenarios 0.58 0.34
Two scenarios Two raters
1 rater 0.44 0.28 1 scenario 0.42 0.33
3 raters 0.59 0.46 3 scenarios 0.60 0.43
4 raters 0.61 0.50 4 scenarios 0.64 0.45
5 raters 0.63 0.53 5 scenarios 0.66 0.46
9 raters 0.66 0.58 9 scenarios 0.71 0.49
Three scenarios Three raters
1 rater 0.49 0.31 1 scenario 0.45 0.37
3 raters 0.65 0.50 3 scenarios 0.65 0.50
4 raters 0.68 0.55 4 scenarios 0.69 0.53
5 raters 0.70 0.58 5 scenarios 0.72 0.54
9 raters 0.73 0.64 9 scenarios 0.76 0.57
Four scenarios Four raters
1 rater 0.52 0.32 1 scenario 0.48 0.40
3 raters 0.69 0.53 3 scenarios 0.68 0.55
4 raters 0.72 0.57 4 scenarios 0.72 0.57
5 raters 0.74 0.61 5 scenarios 0.75 0.59
9 raters 0.77 0.67 9 scenarios 0.80 0.62
Five scenarios Five raters
1 rater 0.54 0.33 1 scenario 0.49 0.42
3 raters 0.72 0.54 3 scenarios 0.70 0.58
4 raters 0.75 0.59 4 scenarios 0.74 0.61
5 raters 0.76 0.62 5 scenarios 0.76 0.62
9 raters 0.80 0.69 9 scenarios 0.81 0.66
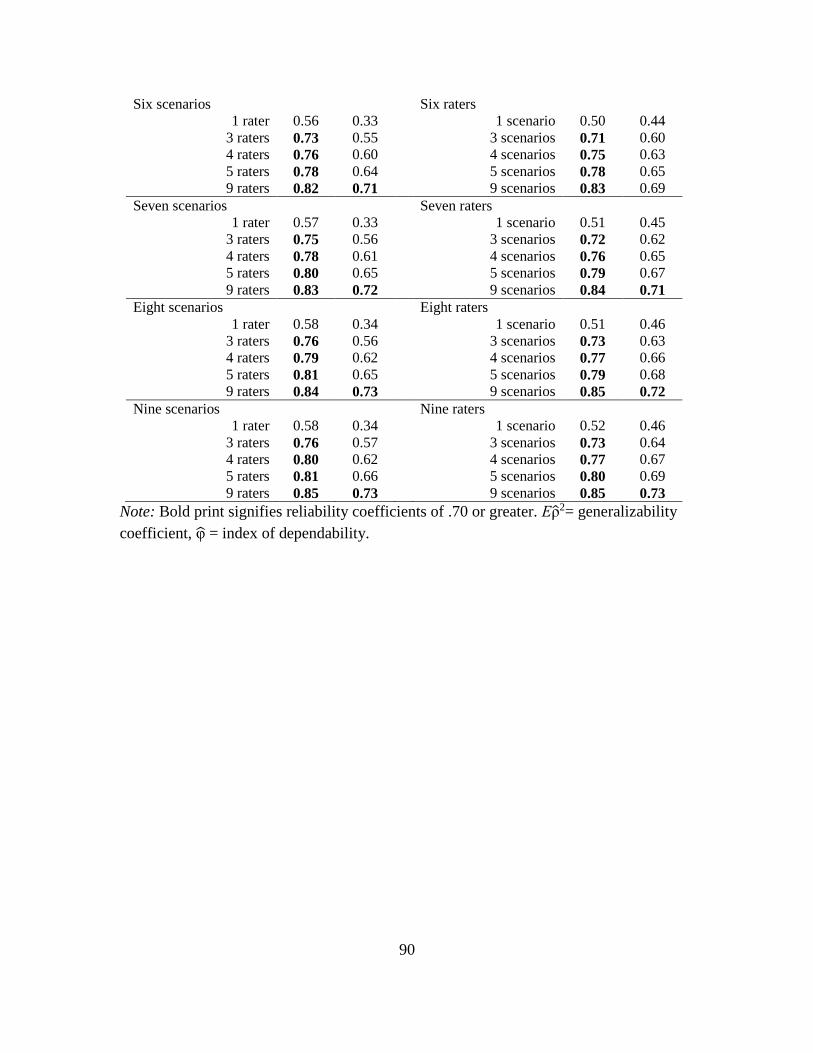
90
Six scenarios Six raters
1 rater 0.56 0.33 1 scenario 0.50 0.44
3 raters 0.73 0.55 3 scenarios 0.71 0.60
4 raters 0.76 0.60 4 scenarios 0.75 0.63
5 raters 0.78 0.64 5 scenarios 0.78 0.65
9 raters 0.82 0.71 9 scenarios 0.83 0.69
Seven scenarios Seven raters
1 rater 0.57 0.33 1 scenario 0.51 0.45
3 raters 0.75 0.56 3 scenarios 0.72 0.62
4 raters 0.78 0.61 4 scenarios 0.76 0.65
5 raters 0.80 0.65 5 scenarios 0.79 0.67
9 raters 0.83 0.72 9 scenarios 0.84 0.71
Eight scenarios Eight raters
1 rater 0.58 0.34 1 scenario 0.51 0.46
3 raters 0.76 0.56 3 scenarios 0.73 0.63
4 raters 0.79 0.62 4 scenarios 0.77 0.66
5 raters 0.81 0.65 5 scenarios 0.79 0.68
9 raters 0.84 0.73 9 scenarios 0.85 0.72
Nine scenarios Nine raters
1 rater 0.58 0.34 1 scenario 0.52 0.46
3 raters 0.76 0.57 3 scenarios 0.73 0.64
4 raters 0.80 0.62 4 scenarios 0.77 0.67
5 raters 0.81 0.66 5 scenarios 0.80 0.69
9 raters 0.85 0.73 9 scenarios 0.85 0.73
Note: Bold print signifies reliability coefficients of .70 or greater. Ερ̂2= generalizability
coefficient, φ̂ = index of dependability.
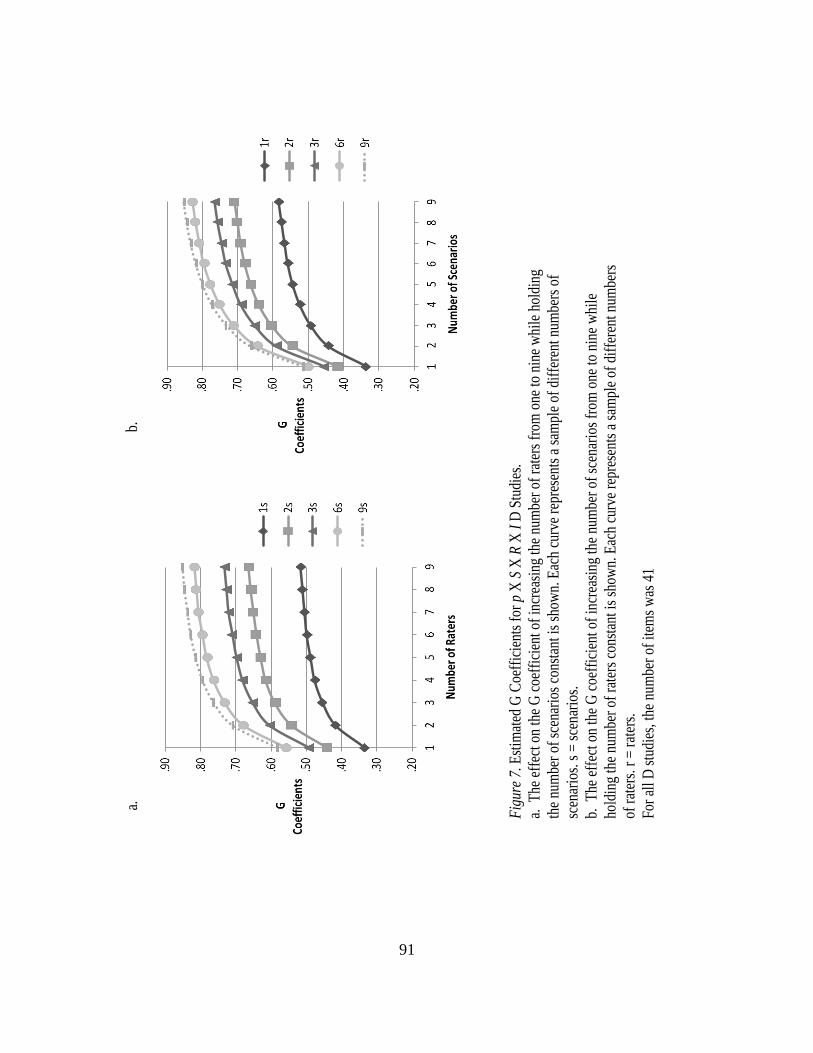
91
Fig
ure
7. E
stim
ated
G C
oeff
icie
nts
for
p X
S X
R X
I D
Stu
dies
.
a. T
he e
ffec
t on
the
G c
oeff
icie
nt o
f in
crea
sing
the
num
ber
of r
ater
s fr
om o
ne to
nin
e w
hile
hol
ding
the
num
ber
of s
cena
rios
con
stan
t is
show
n. E
ach
curv
e re
pres
ents
a s
ampl
e of
dif
fere
nt n
umbe
rs o
f
scen
ario
s. s
= s
cena
rios
.
b. T
he e
ffec
t on
the
G c
oeff
icie
nt o
f in
crea
sing
the
num
ber
of s
cena
rios
fro
m o
ne to
nin
e w
hile
hold
ing
the
num
ber
of r
ater
s co
nsta
nt is
sho
wn.
Eac
h cu
rve
repr
esen
ts a
sam
ple
of d
iffe
rent
num
bers
of r
ater
s. r
= r
ater
s.
For
all
D s
tudi
es, t
he n
umbe
r of
item
s w
as 4
1
a.
b.
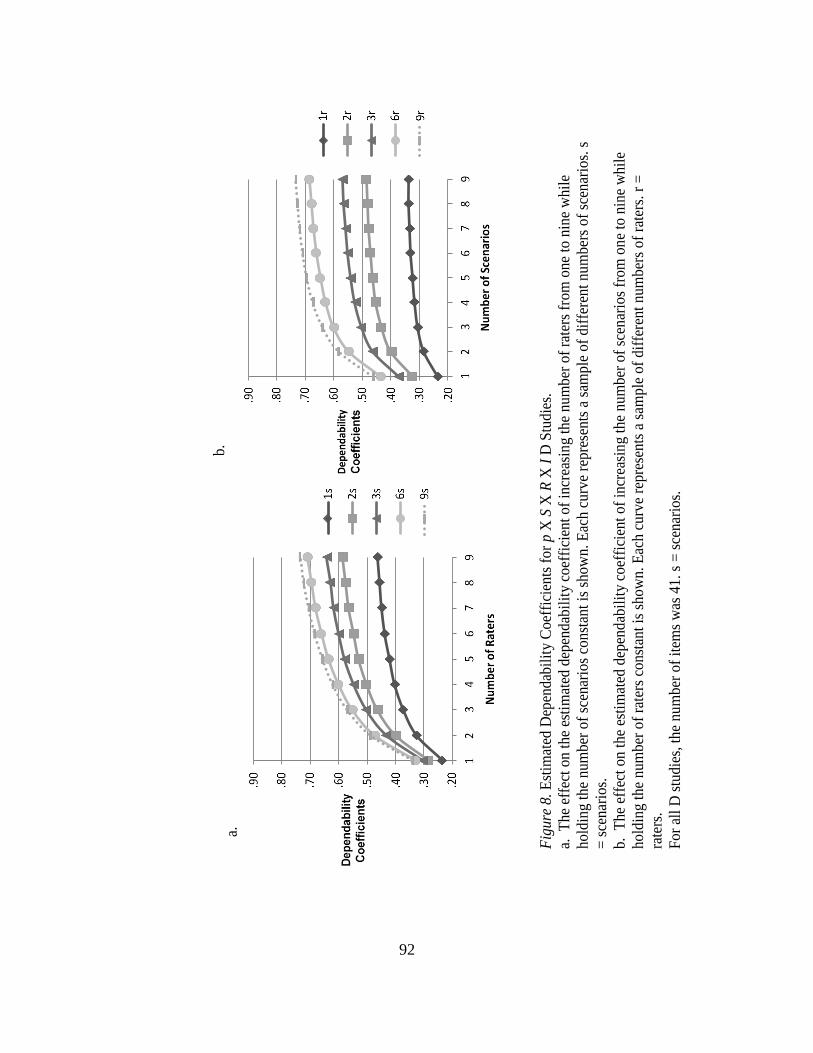
92
Fig
ure
8. E
stim
ated
Dep
endab
ilit
y C
oef
fici
ents
fo
r p X
S X
R X
I D
Stu
die
s.
a. T
he
effe
ct o
n t
he
esti
mat
ed d
epen
dab
ilit
y co
effi
cien
t of
incr
easi
ng
the
num
ber
of
rate
rs f
rom
one
to n
ine
whil
e
hold
ing
the
num
ber
of
scen
ario
s co
nst
ant
is s
how
n. E
ach c
urv
e re
pre
sents
a s
ample
of
dif
fere
nt
nu
mber
s of
scen
ario
s. s
= s
cenar
ios.
b. T
he
effe
ct o
n t
he
esti
mat
ed d
epen
dab
ilit
y co
effi
cien
t of
incr
easi
ng
the
num
ber
of
scen
ario
s fr
om
on
e to
nin
e w
hil
e
hold
ing
the
num
ber
of
rate
rs c
onst
ant
is s
how
n. E
ach c
urv
e re
pre
sents
a s
ample
of
dif
fere
nt
num
ber
s of
rate
rs.
r =
rate
rs.
For
all
D s
tudie
s, t
he
nu
mber
of
item
s w
as 4
1. s
= s
cenar
ios.
b.
a.
93
Chapter 4
Results - Design of a Validation Process for Simulation Scenario Development
As described in the methods chapter, the validation process began with a review
of the literature to identify medical conditions commonly seen among adult patients in
acute care facilities. With 300,000 to 600,000 people in the U.S. affected by deep venous
thrombosis (DVT) or pulmonary embolism each year (Centers for Disease Control and
Prevention, 2012), and with DVT identified as one of the top 10 high-risk, high-volume
patient conditions (Burns & Poster, 2008) in United States hospitals, deep venous
thrombosis (DVT) was chosen as the medical diagnosis for the scenario. Next, common
signs and symptoms, as well as medical tests and management protocols were identified
in research articles from peer-reviewed journals (Walling, 2005), the National Center for
Biotechnology Information (U.S. Department of Health and Human Services, 2008), and
clinical practice guidelines from the Agency for Healthcare Research and Quality
(Holbrook et al., 2012; Kearon et al., 2012). A medical record and simulation scenario
(see Appendix C) were developed. Common aspects of nursing care for a patient with a
DVT were identified, including the administration of anticoagulants, such as warfarin or
heparin, which is carefully titrated to prevent further blood clot formation while avoiding
complications of bleeding. Patient management includes monitoring of diagnostic tests,
patient assessment, pain control, and teaching. The following medical record components
were developed utilizing the NPP template for medical records (MCWS, 2008):
background and vital signs, physician orders, medication administration record,
laboratory tests, nurse flow sheet, nurse notes, and a weight-based heparin protocol for
DVT. In addition, the simulation scenario, utilizing the NPP template for simulation
94
scenarios (MCWS, 2008), was developed and included the following components:
outline, manikin settings and situation, script, and expected participant
actions/interventions. The expected participant actions/interventions were mapped to
corresponding items on the NPP instrument. The scenario was designed to allow the
opportunity to demonstrate competence for each item.
Nursing faculty members at ASU who had at least three years of experience in
adult health nursing, at least one year of experience supervising nurses, and at least one
years of experience using simulation were identified. Five nurses meeting these criteria
were invited to participate as members of the validation team for the new NPP scenario.
The possible future use of the scenario for evaluating nursing competency and the
validation process using a Modified Delphi Technique to solicit feedback from the team
members were explained. See Appendix D for the recruitment narrative. A gift card for
$25, to be provided following participation in the validation process, was offered. Three
of the nurses agreed to participate on the validation team and completed confidentiality
and consent forms (see Appendices E and F, respectively). The three members of the
validation team each reported a minimum of the following experiential attributes: 25
years of experience in adult health clinical settings (M = 33.67, SD = 7.57), 28 years of
RN experience (M = 34.67, SD = 5.86), two years of experience in simulation using HPS
(M = 5.00 years, SD = 4.36), six years supervising students in adult health settings (M =
10.67, SD = 5.03), and two years of experience supervising students in simulation (M =
5.00, SD = 4.36).
The modified Delphi technique was used to gather feedback and edit the medical
record and simulation scenario over three rounds. Complete agreement among the three
95
team members was reached on 70.59%, 58.33%, and 77.78% of the items in Rounds 1 –
3, respectively, and a majority of the team members (two out of three) agreed on 100%,
91.67%, and 100% of the items in each round, respectively (see Table 10). Specific
findings are presented next.
Round One
For Round 1, a form was designed to solicit feedback from, and to measure
agreement among, the validation team members. Evidence-based practice references for
scenario content were identified. The scenario, feedback form (see Appendix G), NPP
instrument, and instructions (see Appendix H) were sent to each team member. The
validation team member was asked to use knowledge of evidence-based practices to
critically evaluate the content of the scenario and provide feedback. Each section of the
scenario was identified on the feedback form and team members were asked to check one
of three responses for each section: 1 (accept as written), 2 (accept with changes), or 3
(delete content). The validation team was instructed to choose Option 1 if the nurse was
satisfied with the content as written and did not feel any changes were needed. This
option indicated that the team member felt the medical record and scenario content was
based on evidence and was congruent with typical patient presentations and acceptable
standards of care, given the medical diagnosis of DVT. They were instructed to choose
Option 2 if the nurse felt the content was partially or mostly acceptable, but needed to be
edited. Participants were asked to describe the recommended changes and provide an
evidence-based reference for suggested edits. Last, they were instructed to choose Option
3 if the nurse felt content in a section needed to be deleted, rather than edited.
Participants were instructed to identify the content to be deleted with a rationale for its
96
suggested deletion. The feedback form contained 17 items that required responses; each
item represented one section of the medical record and scenario. Team members were
asked to return the completed form in one month.
At the conclusion of Round 1, feedback from the validation team was reviewed.
The kappa statistic was calculated to measure agreement using the three categories for the
17 items on the form. Kappa was .51, p < .01. Kappa was lower than expected, possibly
due to a paradox that occurs when high agreement and prevalence of one category is
present (Feinstein & Cicchetti, 1990; Viera & Garrett, 2005), thus its interpretation here
should be made with caution. All three team members agreed on 70.59% of the items (12
of 17 items) and two agreed on 29.41% of the items (five of 17 items; see Table 10). All
three members chose Option 1 (no changes needed) for 52.94% of the items (nine of the
17 items) and all three chose Option 2 (indicating revisions were needed) for 17.65% of
the items (three of the 17 items): background and vital signs, physician orders, and the
medication administration record. Two members agreed that no changes were needed for
the remaining 29.41% of the items (five of the 17 items), however one member felt that
edits were needed for these five sections. None of the team members felt that any part of
the sections should be deleted. Specific feedback is described next.
Background and vital signs. In Round 1, one team member requested changes in
background information that included: addition of height to the admission criteria,
addition of screening for alcohol use and substance use, and addition of a Wells score
sheet (a DVT risk scale). These changes were made and additional feedback was
solicited in Round 2. One member asked if the wording in the scenario should be
changed to the use of the term “VTE” or “DVT and PE” instead of “DVT”. “VTE,” or
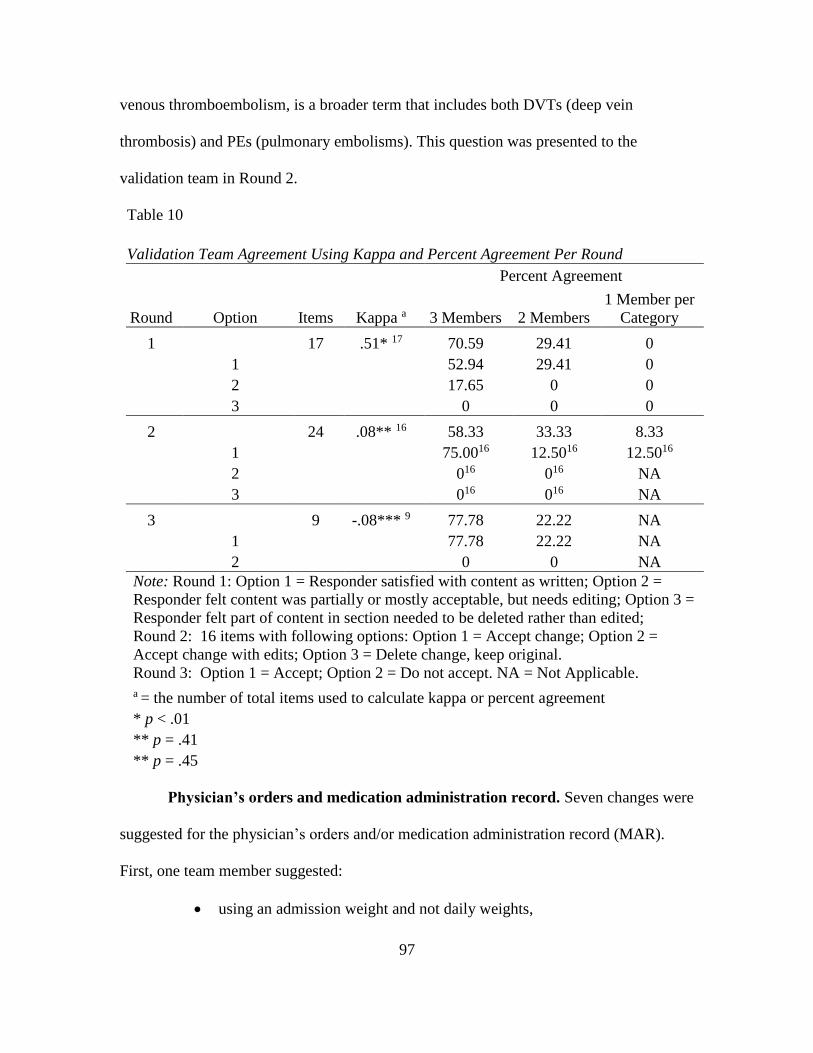
97
venous thromboembolism, is a broader term that includes both DVTs (deep vein
thrombosis) and PEs (pulmonary embolisms). This question was presented to the
validation team in Round 2.
Table 10
Validation Team Agreement Using Kappa and Percent Agreement Per Round
Percent Agreement
Round Option Items Kappa a 3 Members 2 Members
1 Member per
Category
1 17 .51* 17 70.59 29.41 0
1 52.94 29.41 0
2 17.65 0 0
3 0 0 0
2 24 .08** 16 58.33 33.33 8.33
1 75.0016 12.5016 12.5016
2 016 016 NA
3 016 016 NA
3 9 -.08*** 9 77.78 22.22 NA
1 77.78 22.22 NA
2 0 0 NA
Note: Round 1: Option 1 = Responder satisfied with content as written; Option 2 =
Responder felt content was partially or mostly acceptable, but needs editing; Option 3 =
Responder felt part of content in section needed to be deleted rather than edited;
Round 2: 16 items with following options: Option 1 = Accept change; Option 2 =
Accept change with edits; Option 3 = Delete change, keep original.
Round 3: Option 1 = Accept; Option 2 = Do not accept. NA = Not Applicable.
a = the number of total items used to calculate kappa or percent agreement
* p < .01
** p = .41
** p = .45
Physician’s orders and medication administration record. Seven changes were
suggested for the physician’s orders and/or medication administration record (MAR).
First, one team member suggested:
using an admission weight and not daily weights,
98
changing the diet to a low vitamin K diet,
changing the frequency of vital signs to be taken from every two hours to
every four or six hours,
adding a urinalysis to the ordered lab tests, and
changing the dosage and timing of the warfarin medication order.
Two team members questioned the aPTT and PT/INR lab orders.
All three members suggested changes to the heparin protocol orders and how
heparin should appear on the MAR. In addition, I identified a possible change to the
physician’s orders involving measurement of calves and thighs and use of thigh-high
TED hose or below-the-knee compression stockings.
Applicable portions of the medical record (physician’s orders, medication
administration record, lab results, and weight based heparin protocol – for DVT form)
were edited. A Wells score sheet (a DVT risk scale) was added. Team members were
requested to provide feedback on all changes to the scenario in Round 2.
Nurses’ flow sheet and nurses’ notes. One member requested the measurement
of both legs to be added for baseline documentation along with location of marking. This
information was added and feedback on this change was requested in Round 2.
Scenario progression outline – report. One team member wanted to add
dialogue regarding future travel parameters to the report. Feedback was requested in
Round 2 regarding adding this information to the report or to the scenario dialogue or
neither section.
Scenario progression outline – expected participant actions/interventions.
One team member suggested adding a component addressing ambulation and need to
99
explore fear and an offer of assistance in ambulation. I identified an existing component
that addresses this information and added information with more specific focus on these
areas. Feedback was requested in Round 2.
Round Two
Revisions to the scenario were made based on Round 1 feedback. A new feedback
form (see Appendix I) was developed for Round 2 addressing any items that had not
received total consensus in Round 1. On the feedback form for Round 2, team members
were requested to review suggested changes to the medical record and scenario based
upon their feedback during Round 1. In addition, I identified a few changes to the
medical record and requested feedback. The edited scenario, feedback form, and
instructions (see Appendix J) were sent to the validation team and feedback was
requested in one month.
The Round 2 feedback form included 24 items. For 16 of the items, team
members were given the option to ‘accept the change to the chart/scenario,’ ‘accept the
change with edits,’ or ‘delete the change and keep the original version.’ If they chose to
accept the change with edits, they were requested to provide the edits. Eight items were
either worded as open-ended questions or the response options differed from those noted
for the other 16 items. The feedback results for these eight items are provided here, but
they are not included in the kappa computation, since the response options differed from
the group of 16 items.
After the feedback forms were returned, all responses were reviewed and
aggregated. Kappa was calculated to measure agreement on the 16 items using the three
categories of agreement (accept change, accept change with edits, or delete change and
100
keep original); kappa was .08, p = .41. Kappa was not interpretable due to the paradox,
previously mentioned, that occurs when high agreement and prevalence of one category
is present (Feinstein & Cicchetti, 1990; Viera & Garrett, 2005). Extremely low or a
negative kappa result under these conditions and an alternative method should be used to
measure agreement. All three raters agreed on 12 of the 16 items (75%) used to calculate
kappa. Two of the raters agreed on two (12.5%) of the remaining four items. When all 24
items were used to calculate percent agreement, all three members agreed on 58.33% of
the items (14 of 24 items; see Table 10) and two members agreed on 33.33% (8 out of
24) of the items.
Background and vital signs. Three items on the Round 2 feedback form dealt
with the background and vital signs section of the medical record. For the first item, all
three team members accepted the suggested edit, “add height to admission criteria.” The
second item, “add alcohol use and illicit drug use to background,” did not result in
agreement among the members. One person accepted the change, one suggested
accepting it with further edits, and one wanted to delete the change and accept the
original version which did not include this information. These two items were used in the
kappa computation. A third item was phrased as an open-ended question and asked
responders to determine if the term “DVT” should be changed to “VTE” or “DVT and
PE.” Two members wanted to keep the wording as it was, using “DVT”, and one wanted
to change the wording, but did not specify the change to be made.
Physician’s orders. Nine items on the feedback form related to the physician’s
orders. Six items used the three response options noted earlier and were used to compute
kappa.
101
One team member accepted the change to the order for compression stockings
(one member wanted further edits and one member did not accept the change and wanted
the original version).
Two members agreed to:
add an order for daily weights (the third member wanted admission
weight only),
keep the original order for the weight-based heparin protocol (the third
member suggested changing the medication to a low molecular weight
heparin, such as enoxaparin), and
edit the lab orders (the third member wanted to keep the original order for
aPTT and PT/INR, tests that measure blood coagulation).
Three members agreed to:
add an order for a diet with low vitamin K,
change the vital sign frequency ordered,
add leg measurements,
add a urinalysis order, and
edit the warfarin order (warfarin [or Coumadin] is a medication used to
prevent further blood clots; changes included altering the dose and not
starting the warfarin until later).
Medication administration record (MAR). Two items on the feedback form
pertained to the MAR. The response options did not match the format used for items
included in the kappa calculation. In the first item, respondents were asked if the warfarin
order should be changed and, if so, to identify changes. One member wanted to keep the
102
original order and two respondents suggested changes, including not starting warfarin on
day one and dose changes.
In the second item, team members were asked to determine if the heparin order
should be included on the MAR and to develop the order, if included. Two members
offered different orders. The third member did not answer the question because she
previously said she wanted a different medication ordered, and did not want heparin
ordered.
Wells score sheet. The validation team was asked if a Wells score sheet should
be added to the scenario and were provided the score sheet to review. All three
respondents agreed that the sheet should be added and no edits were needed. This item
was used in the kappa calculation.
Lab tests. One item involved adding a urinalysis test to the lab results. All three
members approved the change and this item was used in the kappa calculation.
Nurses’ flow sheet and nurses’ notes. Two items involved changes to the
nurses’ flow sheet and the nurses’ notes. All three members approved of adding
measurements for the legs to the baseline documentation on the nurses’ flow sheet and all
three also approved changes to the nurses’ notes involving leg measurements. Both items
were used in the kappa calculation.
Weight based heparin protocol. Two items referenced changes to the weight
based heparin protocol provided in the medical record. One item was worded with the
response options used to calculate kappa. When asked if they approved of a change in
wording involving the use of the admission weight rather than the patient’s current
weight on the protocol, two respondents wanted to make the change and one wanted to
103
keep the original wording. In the second item, respondents were asked for any further
changes to the protocol. One member wanted to keep the original version and two wanted
to make changes. However, one of these team members did not describe the changes –
presumably since the member previously wanted to change the medication, it may be
inferred that the member intended to indicate that the protocol would be deleted. The
change suggested by the other respondent included adding a lab test to the protocol.
Scenario progression outline – report. One item on the feedback form
referenced changes to the report. This item was not used to calculate kappa because it
was not in the described format used for the 16 items noted earlier. Respondents were
asked if they wanted to make changes based upon comments by one of the team members
in the first round. The changes requested referenced the need for travel parameters in the
patient’s future, so respondents were asked in Round 2 to specify any needed changes.
One member wanted to keep the original version; one wanted to change the report, but
didn’t specify the changes; and one suggested a list of changes, including “ambulation
exercises, TED hose application prior to flight, leg exercises, assess leg tenderness,
swelling, etc.” I felt these changes were more applicable to expected behaviors of the
nurse participant than to needed information for the report.
Scenario progression outline – script. Two items pertained to the scenario script
and had responses that allowed them to be included in the kappa calculation. One item
included adding a comment that the patient needs to travel a long distance in three
months and wonders how he’ll be able to do so. All three respondents approved of this
change. A second item was a script change that pertained to adding possible physician
104
responses when the nurse calls regarding the heparin protocol orders. All three
respondents approved these changes.
Scenario progression outline – expected participant actions/interventions.
One item on the feedback form pertained to the expected participant
actions/interventions. All three respondents approved of the change, “engages in patient
teaching about ambulation, offers assistance, and addresses patient fears.” This item was
included in the kappa calculation.
Round Three
In Round 3, a feedback form (see Appendix K) including nine items was sent to
the validation team. The items involved resolutions to issues which did not have complete
agreement in the previous round. The results from Round 2 were described, including
how many team members chose different options, and a solution was proposed. The team
members were told that “100% consensus” was a goal. If a majority of the three team
members chose one option for an item in Round 2, this was the solution proposed in
Round 3. The team members were asked to choose either ‘accept’ or ‘do not accept’ for
each proposal. The team members were asked to choose ‘accept’ if they felt the proposal
was an acceptable choice. If they strongly felt the proposed solution should not be
accepted, they were directed to choose ‘do not accept.’ If a solution in Round 2 was not
favored by a majority of the team members, a solution was proposed in Round 3 based
upon a review of evidence-based practices. Kappa for Round 3 was -.08 (p = .45) and
was not interpretable based upon high agreement and prevalence of one category. All
raters agreed on seven of the nine items (77.78%). Two raters agreed on two of the nine
items (22.22%).
105
Background and vital signs. Two items referenced the background and vital
signs section of the medical record. First, all members agreed to include alcohol and drug
use in the background information. Second, all members agreed to use the term, “DVT,”
instead of “VTE” throughout the medical record.
Physician’s orders. Six items were on the feedback form for Round 3 for
physician’s orders. Some of these items would result in changes in the MAR in order to
ensure congruency in the medical record. All members agreed to accept:
‘daily weights’ in the orders,
the order for heparin and the weight-based heparin protocol,
the use of the admission weight on the heparin protocol, and
mention that the D-dimer and ultrasound tests had been performed in the
emergency room prior to admission to the floor to explain why the results were in
the medical record.
Two members agreed to:
accept an order for below-the-knee compression stocking for the unaffected leg
and no stocking for the affected leg (one member wanted the stockings used on
both legs), and
eliminate warfarin from the physician’s orders (one member wanted to keep the
order but change the dosage).
Scenario report. One item was included in Round 3 for the scenario report. In
Round 2, one member asked to have additional information added to the report regarding
travel parameters, ambulation exercises, use of TED hose before flights, leg exercises,
and assessment of tenderness and swelling. This information seemed to pertain to

106
expected behaviors of the nurse participant during the simulation rather than information
that would be spoken to the nurse participant in their initial report. I asked the validation
team if we should keep the items out of the report, except where needed to provide
information to the nurse. All respondents accepted this resolution.
107
Chapter 5
Discussion
The purpose of this study was twofold. First, generalizability theory was used to
examine the reliability of the MCWS Phase I data using the NPP instrument and three
existing scenarios. In a G study, various sources of error were examined to determine the
relative magnitude of each and a series of D studies were conducted to determine the
optimal number of scenarios and raters needed to provide an acceptable level of
reliability. Second, a protocol was developed for the design and validation of simulation
scenarios used to measure nursing competency. This protocol was applied in the
development of a scenario to be used with the NPP for assessing nursing competency.
Generalizability Study
The variance components of the G study were estimated for a design involving
one level of each facet: scenario, rater, and item. The purpose of the G study was to
examine the relative contributions of these facets and their interactions to the
generalizability of nurse participant scores using the NPP instrument (see Table 3). The G
study included 15 sources of variability. The relative magnitudes of the estimated
variance components were evaluated by examining the contribution of each component to
total variance (Brennan, 2001).
Main effect variance components. Researchers typically hope to maximize the
proportion of variance attributed to the object of measurement. The object of
measurement for the G study was nurse participant and the nurse participant component
was the estimated variance of nurse participant mean scores (Shavelson & Webb, 1991).
The percent of total variance attributed to nurse participants was 5.45% of total variance,
108
which was less than the proportion attributed to raters (6.29%) and items (11.86%). This
component reflects differences among the nurse participants, a figure lower than would
be expected when assessing nursing competency if the sample included participants who
exhibited a wide range of levels of nursing competency. One possible explanation for this
relatively small proportion of total variance is that the experience levels of nurses in this
analysis sample varied minimally, with all nurse participants having 2.5 years or less of
experience as an RN. Since nurses who were actually under investigation by the ASBN
could not be recruited for the MCWS Phase I study, a sample of recent graduates was
deliberately chosen to represent a population of minimally competent nurses (D. Hagler,
personal communication, May 8, 2014). However, this limited range of length and
diversity of nurse experience likely decreased, to an extent, the variability of nursing
behaviors observed. Another explanation is that the variance of design facets
overshadowed the variance attributed to participants in the G study. For example, greater
variability in raters and items resulted in larger variance components for these facets than
for nurse participants.
The variance components in the G study were based on sampling a single
scenario, a single rater, and a single item from the universes of all possible scenarios,
raters, and items. In the G study, the relative magnitude of each facet’s contribution to
measurement error was estimated, and then, in subsequent D studies, designs were
explored with the intent of minimizing unwanted sources of error attributed to the facets.
As levels of facets that were responsible for larger proportions of total variance in the G
study were increased in the D studies, the percent of total variance attributable to nurse
109
participants increased (as expected), since the absolute magnitude of the estimated
variance component for nurse participants did not change.
The scenario component was the estimated variance of scenario mean scores. The
estimated variance component for scenarios was .17% of total variance, indicative of
little variability in difficulty among scenarios. The low percentage of variability
attributable to scenarios may be interpreted as consistency in the level of difficulty across
scenarios when scores from all nurse participants and raters were averaged. However,
variance components for interactions involving scenarios were appreciably higher and
will be discussed later.
The proportion of estimated variance attributed to raters was 6.29% of total
variance, contributing a greater proportion of total variance than participants (5.45%).
This is interpreted to mean that rater stringency, i.e., rater mean scores, was more
variable than nurse participant competency. Decreasing the variability attributable to
raters must be a goal of any system intended to measure nursing competency, and
identifying the number of raters needed to improve reliability was one of the goals of the
D studies.
The estimated variance component for items contributed 11.86% of the total
variance. The variance component for the item effect indicates how much items differ
from each other in difficulty; in other words, the proportion of nurses whose
behavior/actions were considered safe varied from item to item. Nurses were scored safe
on certain items more often than on other items. The magnitude of item variance was
approximately twice as large as rater variance or nurse participant variance. The large
range in item mean scores reflects this finding. An item mean score represents the
110
proportion of scores that were marked ‘1,’ signifying competent behavior, across
participants, across scenarios, and across raters. Overall, nurses demonstrated higher
levels of competency on items that measured professional responsibility, client advocacy,
professionalism, communication, and attentiveness than on those that measured
documentation, prevention, procedural competency, and clinical reasoning. The
categories and items on the NPP are meant to capture specific types of unsafe behavior
indicating nursing incompetency (Hinton et al., 2012; Randolph et al., 2012). The NPP is
based upon TERCAP (Benner et al., 2006), the NCSBN instrument used to classify and
describe causes of nursing practice breakdown reported to state boards of nursing, and the
CCANLN survey tool (as cited in Randolph et al., 2012; NCSBN, 2007) that measures
clinical competency, practice errors, and practice breakdown risk. As nursing behaviors
may typically range across the incompetent/competent spectrum, the purpose of the NPP
is to identify the specific behaviors exhibited by nurses that are safe and unsafe.
Remediation efforts informed by the results of the NPP are thereby more effective as
specific competencies may be targeted for improvement. Since the estimated variance
components in a G study are based on the sampling of only one item, one rater, and one
scenario, it is not surprising that mean scores would vary a great deal for items. Since any
assessment instrument is unlikely to have only one item, and the NPP has 41 items,
ensuring the D study designs had sufficiently high levels of items to decrease the
variability of this facet was accomplished by using the same number of items (41) as the
NPP instrument. Since alternate instrument designs were not the focus of this study, the
number of items was held constant in all D studies.
111
Interaction variance components. Two other estimated variance components
were greater than the nurse participant variance component, but less than the components
for raters and items. The participant x scenario x item interaction variance component
contributed 5.75% of the total variance. This indicates variability of nurse participant
scores on items for different scenarios. In other words, some nurses scored better on some
items (using the mean score from all three raters) for one scenario than they did on the
same items for another scenario. Each nurse participant’s ability to exhibit safe behavior
on the same type of competency varied somewhat, depending on the context of the
scenario, perhaps indicating familiarity with the medical diagnosis of the patient was
related to ability to display competency. Second, the participant x rater x item interaction
variance component contributed 6.18% of total variance. This is interpreted as variability
among raters when scoring the same item for the same nurse participant across scenarios.
For example, if one rater assigned a mean score of 1 for an item for a nurse participant
across scenarios, and another rater assigned a mean score of 0 for the same item and
nurse, and a third rater assigned a mean score of .5 for that item and nurse, this would
result in variability that negatively impacts reliability. Since the estimated variance
component for the participant x rater x item interaction contributed a relatively high
proportion of total variance, this indicates inconsistency among raters in scoring items for
the same participant. Later, increasing levels of scenarios and/or raters in the D studies
resulted in decreased estimated variance components for the associated interactions:
participant x scenario x item and/or participant x rater x item, respectively.
Among the estimated variance components for the two-way interactions, the rater
x item interaction, the participant x scenario interaction, and the participant x item
112
interaction contributed the most to total variance (4.25%, 4.18%, and 3.97%,
respectively). The rater x item estimated variance component indicates that item ranking
varied from rater to rater. Of the two-way interactions involving rater, this contributed the
largest proportion to total variance. In other words, when raters’ scores for items are
averaged over all participants and scenarios, items were ranked differently by each rater.
Given the high proportion of total variance of the participant x rater x item interaction
mentioned previously, this is not surprising. Raters differed in how they scored items in
general, and they also differed in how they scored items for specific participants. The
participant x scenario estimated variance component indicates the relative difficulty of
scenarios varied for nurse participants and their relative standing differed from scenario
to scenario. This reflects the variability in difficulty of each scenario experienced by
different nurses. The participant x item estimated variance component shows the relative
standing of nurses also differed from item to item; in other words, various items were
more or less difficult for each nurse participant.
The participant x rater variance component is reflective of how the relative rating
of nurse participants by raters varies. The contribution of this source of variability was
2.78%, less than other two way interactions involving the participant, which indicates
participants’ mean scores by raters across scenarios were more similar in ranking than
participants’ rankings for scenarios or items. However, raters’ similarity in ranking of
participants doesn’t translate into similar scoring of individual items.
The scenario x item variance component was small, contributing only .70% to
total variance, indicating that item ranking across participants and across raters varied
113
little from scenario to scenario. In other words, item mean scores, calculated using results
from all participants and raters, were ranked similarly in each scenario.
The estimated variance component for the scenario x rater interaction contributed
less than .00001% of total variance, indicating there was little variability among the raters
in the ranking of their scores for the different scenarios. All raters’ mean scenario scores
across participants and items were lowest for Scenario 1 (a patient with diabetes) and
highest for Scenario 3 (a patient with a fracture). Rater 3’s mean scores were lowest of
the three raters for every scenario (.58, .61, and .66 for Scenarios 1 – 3, respectively) and
Rater 2’s mean scores were highest for all scenarios (.82, .83, and .86, respectively).
The remaining estimated variance components for the three-way interactions
contributed less to overall variance than all but three of the other variance components
(scenario, scenario x rater, and scenario x item). The participant x scenario x rater
estimated variance component contributed 2.32% to total variance, whereas the scenario
x rater x item component contributed 1.36% to total variance. Each of these estimates
was less than half the magnitude of the next largest three-way estimate, and signified
little variation in ranking of mean scenario scores by raters for different participants and
little variation in ranking of item scores by raters for different scenarios. In other words,
raters’ mean scores for participants were generally ranked similarly across scenarios and
raters’ mean scores for items were generally ranked similarly across scenarios.
Decision Studies
After variance components were estimated in the G study, 10 sets of D studies
were conducted to explore the effects of various designs on reliability coefficients and
SEMs. Since the NPP instrument was intended to be used in all designs in this study and
114
it has 41 items, the level of items was held constant at 41 for all D studies. A major
objective was to identify the minimum number of scenarios and raters needed to obtain
sufficiently high reliability. The development of validated scenarios and the training and
use of raters are resource-intensive endeavors. Additionally, the administration of the
scenarios and the subsequent time needed to score the nurse participants’ performances
by raters requires further use of resources in terms of facility space, technology, staff, and
time. Identifying the minimum numbers of scenarios and raters needed to produce
reliable data for making valid decisions is a critical component for any system of
observation-based assessment involving simulation (Schuwirth & van der Vleuten, 2003).
The D studies conducted were thus intended to identify the effects of different designs on
reliability of the simulation-based assessment.
Variance components for a D study design with three scenarios and three
raters. G study results inform decisions regarding D study designs for the purpose of
decreasing targeted estimated variance components. Increasing the levels of those facets
in the D studies that contributed most to the total variance in the G study reduces the
proportion of total variance contributed by that facet. In the G study, the two largest
estimated variance components were for items (11.86%) and the combined four-way
interaction/residual (44.73%). In all D studies, increasing the number of items to 41 (the
number of items on the NPP instrument) resulted in significant decreases in the percent of
total variance contributed by items. Increasing the number of scenarios and raters in the
D studies also decreased the share of total variance of those facets. As a result, in the D
study design including three scenarios and three raters (the design used to collect sample
data in the G study), the estimated variance component that contributed the most to both
115
relative and absolute error variances was the nurse participant, responsible for 50.00% of
total variance. The proportion of total variance contributed by items was only 2.59%,
reflecting the effect of increasing the number of items to 41, while the proportion of total
variance attributed to scenarios was .43%. Although this was an increase in proportion of
total variance compared to the G study (.17%), it was a decrease in absolute magnitude.
Since the share of error variance contributed by scenario was so low in the G study, and it
remained relatively low in the D studies, this was not a concern. In the design involving
three scenarios and three raters, the second largest estimated variance component was
raters (19.40%). Improving rater performance or collecting data from additional raters
may reduce the effect of rater-related variance (Briesch et al., 2014), resulting in
decreased error variances and increased coefficients.
The third largest contributor (12.93%) to total variance was the participant x
scenario estimated variance component. This indicated that mean participant scores were
rank ordered differently for the various scenarios, meaning participants varied in how
difficult they found the different scenarios. When considered with the fact that the
estimated variance component for scenarios composed only .43% of total variance, this
does not mean that the scenarios were widely different in difficulty level from each other,
across participants and raters. Rather, participants had strengths and weaknesses that
were more evident in some scenarios than in others. This has important implications for
the need to include sufficient numbers of scenarios to ensure adequate opportunity for
nurses to display competency. This will be discussed further later.
The fourth largest component (8.62%) was the participant x rater estimated
variance. Mean nurse participant scores across scenarios were ranked differently by
116
individual raters. Improving consistency of rater scoring would result in a decrease in the
participant x rater estimated variance component. This would result in more similarity
among raters in how participants are rank ordered and would decrease the participant x
rater estimated variance component.
The remainder of the estimated variance components combined composed only
9.05% of total variance, with the largest being the participant x scenario x rater
component, contributing 2.59% of the total variance. This component describes the
variable ranking of participants by rater and by scenario. For example, Rater A may
assign the same mean score for a participant for Scenarios X and Y, but Rater 2 may
score the same participant lower on Scenario X and higher on Scenario Y.
Coefficients for a D study design with three scenarios and three raters. As
seen in Table 5, the generalizability coefficient for the D study design involving three
scenarios, three raters, and 41 items was .65 (SEM = .0787) and the dependability
coefficient was .50 (SEM = .1068). Generalizability and dependability coefficients are
considered analogous to reliability coefficients. Although no universal standard exists to
define adequate reliability, some researchers have suggested minimum levels based upon
how the measure is being used (Briesch et al., 2014). For example, Ram et al. (1999)
proposed a minimum coefficient of .80 for high-stakes exams, while Johnson, Penny, and
Gordon (2009) reported minimum levels of .70 have been accepted for research studies
and low-stakes assessments and .85 to .90 for high-stakes exams (Briesch et al., 2014).
The literature does not distinguish between G and dependability coefficients in G theory
when minimum levels of reliability are recommended. However, Shavelson and Webb
(1991) report that the G coefficient is considered analogous to the reliability coefficient
117
in Classical Test Theory, so it is logical to infer these minimum levels may be applied to
values of the G coefficient.
Prior MCWS Phase I study analyses. Using recommendations reported in the
literature, the design used to collect the MCWS Phase I data resulted in lower reliability
coefficients than desired for either low or high stakes exams. Analyses for this data
previously reported in the literature described reliability in terms of the percent of items
for which two out of three raters agreed (Hinton et al., 2012). If one of the three raters
disagreed, agreement was reported as 100% based on majority agreement. With three
raters scoring every item, a minimum of two raters will almost always agree on a score of
0 or 1, when those are the intended options. Excluding instances when NA was selected
or an item was left blank, a minimum of two raters will necessarily agree 100% of the
time. This does not translate into an interpretation that the data are highly reliable, since
disagreement by one of the three raters has been discounted and not measured. Measuring
inter-rater reliability of data by three raters requires that all three raters’ responses be
included in the analysis.
Recognizing the need for consensus in determining minimal levels of competency
using the NPP, the scoring protocol for a nurse’s performance requires that at least two
out of three raters agree on a failing score for an item in order for a failing score to be
recorded on that item in the final report (D. Hagler, personal communication, May 8,
2014). This procedure ensures that a majority of raters are in agreement when evaluating
each nurse’s competency. The NPP is not used as a high stakes exam by the ASBN.
Rather, information from the NPP is used in conjunction with other investigative data to
118
determine remediation procedures and to assist in making decisions about licensure
(Randolph, 2013).
Effect on reliability of various D study designs. In addition to estimating the
reliability of data for the design used in the MCWS Phase I study, the reliability of other
designs was also examined. Returning to the purpose of the D studies, the effect of
increasing the number of scenarios and/or raters on reliability was examined. Since
increasing the levels of the facet that contributed the most to total variance would result
in a decrease in the associated error variance and thus an increase in the reliability-like
coefficient(s) affected by that variance component, a comparison of different designs was
conducted (see Table 13). In various D studies, the number of scenarios and number of
raters were increased simultaneously and separately in order to compare the effects on
reliability.
Identifying the ‘best’ D study design depends upon several factors. First, the type
of decisions – relative or absolute – that will be made are considered. This factor
determines which coefficient is more interpretable – the G coefficient for relative
decisions or the index of dependability for absolute decisions. If both types of decisions
may be made, then both types of coefficients should be examined. Second, the minimum
acceptable level for the reliability-like coefficient must be identified. Based upon current
literature, for a high-stakes exam, the minimum G coefficient may need to be as high as
.80 to .90. Third, increasing the levels of facets which explained a greater proportion of
total variance in the G study will result in greater improvement of coefficients and
decreased SEMs. Finally, availability of resources, such as raters and scenarios, must be
119
included in practical decisions regarding increasing the number of raters versus
increasing the number of scenarios.
The least number of scenarios required for a minimum G coefficient of .70 was
three scenarios, combined with a minimum of five raters. Alternatively, a design with just
two raters resulted in a G coefficient of .71, but only if eight or more scenarios were
included. To obtain a minimum G coefficient of .80, a minimum of five scenarios and
nine raters, or seven scenarios and five raters would be required. The highest G
coefficient obtained in the D studies conducted for this research project was .85 for a
design that included nine scenarios and eight raters. Research in healthcare supports these
findings regarding minimum number of simulation scenarios needed for sufficient
reliability, although fewer raters are reported for comparable reliability estimates
(Kreiter, 2009). Prior research in observation-based assessment in medicine has shown
the need for a large number of scenarios (or cases) to obtain sufficiently high reliability
(Schuwirth & van der Vleuten, 2003). For example, Schuwirth and van der Vleuten found
simulation sessions required a minimum of 12 cases with a single rater or eight cases
with two raters to reach a reliability level of .80. They explained that content specificity
and domain specificity of scenarios, where the content and domain of knowledge and
skills assessed in any one scenario can be too specific and not generalizable to participant
ability in other scenarios, is the basis for requiring a large number of scenarios or cases.
In anesthesiology, as many as 12 to 15 cases have been needed to reach sufficient
reliability (Boulet & Murphy, 2010; Weller et al., 2005).
Indices of dependability are smaller than G coefficients because the absolute error
variance used to calculate the dependability coefficient (phi) includes more sources of
120
error variance than the relative error variance used to calculate the G coefficient. Thus,
larger numbers of scenarios and raters were required to meet similar minimum levels of
reliability achieved by the G coefficient. A minimum of six scenarios and eight raters or
eight scenarios and seven raters was required to reach a phi of .70. The largest phi
obtained in the conducted D studies was .73 with eight scenarios and nine raters. None of
the D studies conducted reached sufficiently high levels of dependability coefficients for
a high-stakes exam, given the minimum level of .80 to .90 recommended in the literature.
Alternative D study designs discussed later may result in higher reliability estimates, and
other factors that improve rater scoring could positively affect results in future studies.
Validation of a Scenario
Best practices for developing observation-based assessment procedures in
healthcare using simulation (Manser, 2008; Rosen et al., 2008), as discussed in the
literature review, guided the development of a protocol for validation of simulation
scenarios. The protocol entailed the use of multiple sources of evidence in developing a
scenario validation process (AERA et al., 1999; Downing & Haladyna, 2009: Messick,
1995). Specifically, relationships to other measures were established, content of the
scenario was based upon evidence-based practices and grounded in theory, and an expert
team guided the validation using a modified Delphi technique to gather responses and
reach group consensus.
Relationship to other measures. First, the scenario content was developed using
the previously validated assessment instrument, the NPP (Hinton et al., 2012; Randolph
et al., 2012). Aligning each item on the NPP to specific content selected for the scenario
ensured nurse participants would be able to potentially pass all items on the assessment,
121
indicating competent behavior on all items. An error commonly made in healthcare
assessment using simulation is developing an instrument to measure competency after
designing or selecting scenarios (Rosen et al., 2008). This often results in a lack of
congruence between the content of the scenario and the instrument. Opportunities to
display expected behaviors that are evaluated on the instrument may not be available in
the scenario because the scenario was not designed specifically to meet the objectives
assessed by the instrument. Best practices in observation-based assessment using
simulation indicate that scenarios should be developed after the instrument used to assess
the participant is developed (Rosen et al., 2008).
A best practice used to design measurement procedures in simulation-based
assessment and training is the inclusion of critical events that link measures to scenario
events (Rosen et al., 2008). This was accomplished by designing standardized patient
cues to be verbalized during the scenario. For example, having the patient describe fear
that a blood clot may cause a stroke provides the opportunity for the nurse participant to
communicate effectively with the client (Item 32 on the NPP) and provide appropriate
client teaching (Item 33), while providing respectful and culturally responsive care (Item
29) and specific interventions tailored to the client vulnerabilities (Item 30). Critical
scenario events thus provided further linkages to the NPP instrument.
The best practice of focusing on observable behaviors (Rosen et al., 2008) was
attended to by including content in the scenario that required the participant to perform
specific tasks or exhibit particular behaviors that are observable and relate to items on the
NPP. For example, initiating the heparin protocol required the nurse participant to review
laboratory results, calculate a dosage, contact the physician to report the results, and
122
confirm the calculations and procedure. Watching the nurse’s actions, listening to the
nurse’s communications with the physician, and reading the written documentation allow
for direct observation of behaviors that are measured by items on the NPP.
Grounded in theory and evidence-based practices. Following the advice of
various researchers (Manser, 2008: Rosen et al., 2008; Salas et al., 2009) who advocate
measures be based on theory, evidence-based practice guidelines and literature from peer-
reviewed journals were utilized to identify optimum methods used in the management of
a patient with a DVT. Also, since the content of the scenario was aligned with the NPP
instrument, the theoretical underpinnings of the NPP instrument were apparent in the
expected participant behaviors in the scenario; the NPP was based upon the Taxonomy of
Error Root Causes Analysis and Practice Responsibility categories (Benner et al., 2006)
and items from the Clinical Competency Assessment of Newly Licensed Nurses
(NCSBN, 2007). Examples of scenario components drawn from these sources that offer
opportunities for the nurse participant to display competent behavior include: safe
administration of medication, interpretation of a physician’s orders, attention to the
patient’s condition and lab results, and prevention of potential complications caused by
patient behavior or inappropriate patient positioning.
Validation using the modified Delphi technique. A validation team of experts
reviewed all content of the scenario, provided feedback and suggestions, and ensured
alignment of the scenario with specific NPP instrument items. The modified Delphi
technique was used to solicit feedback and measure agreement among the team members.
First, team members were selected to represent nurse experts experienced in simulation,
adult health acute care clinical settings, and nursing supervision. Second, the modified
123
Delphi technique facilitated a structured system of iterative feedback while maintaining
anonymity among the team members. This encouraged honest deliberation and decreased
bias that could result if team members exert (intentional or unintentional) influence on
each other. Third, measurement of agreement was possible and reported in order to
provide quantitative evidence.
Complete agreement among all three team members was attained for 70.59%,
58.33%, and 77.78% of the items in Rounds 1 – 3, respectively. In each of the three
rounds, a majority (two out of three) of team members agreed on 100%, 91.67%, and
100% of the items. Results from the three rounds are not directly comparable, since
feedback was solicited on different items in each round. Initially, inter-rater agreement
was evaluated using Fleiss’ kappa, a method of measuring inter-rater reliability while
adjusting for chance agreement. However, a paradox is encountered in calculating kappa
when conditions include raters mostly choosing only one category, resulting in unusually
low kappa coefficients even though percent agreement appears high (Feinstein &
Cicchetti, 1990; Viera & Garrett, 2005). This occurred in each of the three rounds of
validation as a result of relatively high agreement and high prevalence of one category.
After three rounds, complete consensus was reached on all but two items in the
scenario. The scenario and results of the validation procedure will be submitted to the
planning group in charge of competency testing for nurses referred to the ASBN. The
next step will be further review of the scenario by the planning group to resolve the
remaining areas of disagreement, followed by pilot testing of the scenario along with
other scenarios being developed.
124
Future piloting of the scenario using participants of varied experience and ability
levels will provide evidence of construct validity, as more experienced and more
competent nurses should earn higher scores. However, anecdotal evidence of construct
validity has been reported by the ASBN supporting the structure used by the new and
existing scenarios and the data gathered using the NPP instrument in past studies
(Randolph, 2013). The ASBN recounts that nurses who were reported to the ASBN for
practice issues and subsequently evaluated in simulation, demonstrated incompetent
behavior on specific items on the NPP congruent with the behaviors that were reported
when they were referred to the ASBN, despite the fact that evaluators were blinded to the
practice complaints.
Limitations of the Study
The first part of the current study involved a secondary analysis of extant data. As
such, sample size and design of data collection were established a priori. Although
minimum sample sizes for multiple facet designs in generalizability theory have not yet
been established by researchers, a minimum of 20 persons and 2 conditions per facet has
been suggested for a one-facet design (Briesch et al., 2014). However, studies involving
fewer persons in conjunction with larger numbers of conditions per facet and a larger
number of facets have been successfully conducted, so the current study involving 18
participants was considered sufficient, although a larger sample size would have been
preferred. The need to have a fully crossed design for the G study resulted in the
elimination of data for three of the original 21 participants, since a fourth rater was
substituted for one of the original three raters for these three participants.
125
One area of possible concern was the limited range of experience of the nurse
participants. The maximum number of years of experience as an RN was reported to be
2.5 years. Including nurses with a wider range of experience may provide further
evidence of construct validity, since more experienced RNs should demonstrate higher
levels of competency than less experienced RNs.
During the validation process of the new scenario, challenges became apparent
due to adhering to a policy of anonymity among the team members. Using a modified
Delphi technique to structure the validation accomplished the goal of decreasing bias and
allowed measurement of agreement during each round, but it also prevented an
interactive flow of communication among team members during the rounds that can be
valuable in the development process. Allowing for subsequent in-person meetings
following initial anonymous rounds may provide clarification needed for quicker
resolution of areas of disagreement.
Directions for Future Research
Although generalizability theory has been used more frequently in the last 10
years (Briesch et al., 2014) in reliability studies, it is still not commonly used in research
involving the assessment of nursing competency using simulation. For example, a recent
article published in Clinical Simulation in Nursing (Shelestak & Voshall, 2014) focused
on validity and reliability concerns and described the use of Cronbach’s alpha, intraclass
correlation coefficients (ICC), kappa, and proportion of agreement as suggested methods
of assessing reliability, but did not mention generalizability theory. The valuable
contributions offered by G theory are still not being realized in the measurement of
nursing competency using simulation in the broader academic community.
126
The current study provided an in-depth analysis of reliability by examining
multiple sources of variance when assessing nursing competency using simulation. One
important finding was that the reliability measures for the current design, including three
scenarios, three raters, and 41 items, were not as high as desired for a high-stakes
assessment. Future research in this area should focus on rater training methods that would
result in decreased variance attributed to raters. The calibration of raters is an essential
component of rater training, yet lack of faculty training to improve rating reliability is
often the norm in health professions (McGaghie, Butter, & Kaye, 2009). Training to
increase awareness of specific errors raters tend to make, providing a frame of reference
using examples of differing levels of performance, and provision of intensive behavioral
observation training through the practice of scoring and discussion among raters to reach
consensus are methods used to improve rater agreement (McGaghie, et al., 2009; Tekian
& Yudkowsky, 2009). To prevent the subjective interpretation of rating scales, anchors
must be developed that establish behaviors agreed upon by raters that constitute particular
scores (Yudkowsky, 2009). Raters need sufficient preparation and continual updating to
ensure high reliability and the minimization of threats to validity. Recognizing a need to
increase rater agreement prior to evaluating nurses referred to the ASBN for practice
violations, rater training conducted subsequent to the MCWS Phase I study was enhanced
to increase consensus among raters and standardization of item interpretation for scoring
purposes (personal communication, D. Hagler, June 6, 2014).
The impact of altering the design by reducing or increasing the number of
scenarios and raters was evaluated in this study. Future research may examine the effect
of nested designs on the magnitude of SEMs and reliability coefficients. For example, the
127
effect on coefficients of having each rater score a different set of scenarios could be
examined. In a design involving six scenarios scored by three raters, each rater may score
two of the scenarios for all participants, and each rater scores a different set of two
scenarios. In this example, scenarios are nested within raters and the two conditions
necessary for a nested design are satisfied: multiple conditions of the scenario facet and
different conditions of the scenario facet are associated with each condition of the rater
facet (Shavelson & Webb, 1991). Since all raters score all nurse participants and all nurse
participants engage in all scenarios, raters are crossed with participants, and participants
are crossed with scenarios. Also, since all items are scored for each scenario and
participant by all raters, then scenarios, raters, and participants are crossed with items.
Nested designs allow for more efficient use of resources, possibly decreasing the number
of raters or scenarios needed while maintaining high reliability. In this example, raters
score only two of the six scenarios, rather than all six scenarios, for each participant.
Also, as more nurse participants are assessed in the future using simulation, administering
different sets of scenarios selected from a pool of scenarios would be advisable to
decrease widespread knowledge of scenarios inflating performance.
Researchers recognize a need for structured validation processes. This study
explored one possible procedure. A goal of this process was to enable quantitative
measurement of agreement of the validation team. Alternate methods of measuring
agreement should be explored, since kappa was not interpretable and percent agreement
does not account for chance agreement that may occur. One method proposed in the
literature is the use of a content validity index (Shelestak & Voshall, 2014), which
measures raters’ determination of the relevance of items for inclusion in the scenario.
128
One example Shelestak and Voshall (2014) describe involves a Likert-type scale from 0
(not relevant) to 3 (very relevant). Average ratings are then calculated for each item.
Another method involves development of a Likert-type scale to measure strength of
agreement and then the calculation of the Intraclass Correlation Coefficient (ICC).
Implications for Practice
Ensuring the safety of patients is a challenge faced by state boards of nursing,
healthcare facilities, and educational institutions (Scott Tilley, 2008). Measuring nursing
competency is one component of the goal of patient safety. Still, ensuring nurses at every
level, from new graduates to nurses with several decades of experience, are meeting
minimum levels of competency continues to be a challenge (Kardong-Edgren, Hayden,
Keegan, & Smiley, 2014). Clinical administrators are concerned about the education-
practice gap as they develop methods to confirm new graduates are ready to care for
high-acuity patients (Berkow, Virkstis, Stewart, & Conway, 2009; Hughes, Smith,
Sheffield, & Wier, 2013). Every year, medical technology changes, new medications are
developed, familiar medications are used in new treatment regimens, and information
expands. A continuously changing clinical environment and the need to protect patients
demand the assurance that nurses have a continuum of nursing education to maintain a
minimum level of competency. While attention to nursing competency has primarily
focused on newly graduated nurses, the need to continue to assess competency
throughout a nurse’s professional life is recognized as critical to patient safety (Scott
Tilley, 2008). The National Council Licensure Exam (NCLEX; National Council of State
Boards of Education, 2014), a written assessment, is used to ensure a minimum level of
knowledge has been achieved and marks the entry of nursing graduates into the
129
profession. In addition, some states require continuing education units (CEUs) for nurses
to maintain licensure. However, associated assessments typically require only a
demonstration of didactic knowledge on the part of the nurse, and many states, such as
Arizona, do not even require CEUs for nurses.
The need and value of measuring clinical competency by a practical exam
involving the application of knowledge and skills is apparent in healthcare.
Acknowledging the importance of clinical skills assessment, the allopathic and
osteopathic boards of medicine initiated practical skills exams for medical students in the
last decade (Boulet et al., 2009). However, in nursing, no practical skills exam is required
for licensure in any state or nationally, and nursing is reportedly the only healthcare
profession that does not require this (Kardong-Edgren, Hanberg, Keenan, Ackerman, &
Chambers, 2011).
In recent years, the use of simulation to measure competency has increased in
schools and hospitals (Boulet et al., 2009; Goodstone & Goodstone, 2013; Salas et al.,
2013). Improvements in technology have allowed for the realistic portrayal of human
patients via human patient simulators. Still, many challenges must be addressed when
designing a system for measuring competency – stakeholders must agree on definitions of
minimum competency, instruments must be developed that provide reliable and valid
interpretations of data, and scenarios must be designed that provide opportunities for the
nurse to demonstrate competency when assessed by trained raters using the instrument.
Each component of this process involves tremendous time, work, and expertise. Even
reaching consensus in defining competency has created much debate (Bing-Jonsson,
Bjork, Hofoss, Kirkevold, & Foss, 2013; Cowan, Norman, & Coopamah, 2005), and
130
validity and reliability testing of assessment data is often not conducted or reported
(Adamson & Kardong-Edgren, 2012; Cook et al., 2013). In the literature involving
instruments used to measure nursing competency, reported methods of reliability testing
have not included generalizability theory, a method that allows for the examination of
multiple sources of measurement error. Investigation of reliability is often limited to the
examination of inter-rater reliability, using coefficient alpha or percentage agreement as
measurements (Adamson et al., 2012; Hinton et al., 2012; Kardong-Edgren et al., 2010).
The reported procedures used to validate scenarios for competency assessments typically
are not detailed in the literature. Often, descriptions of validation are limited to mention
of a panel of expert nurses that reviewed the scenario, without mention of structured
procedures or explanations of how bias has been reduced (Adamson et al., 2012;
Kardong-Edgren et al., 2010; Pelgrim et al., 2011). Clear descriptions of protocols for
designing and developing simulation scenarios are meaningful contributions to the field
of competency assessment in nursing and other health care professions.
This study contributes to the research on reliability analysis of data obtained
through assessment of nursing competency using simulation. It also presents a protocol
for developing and validating scenarios used in simulation. Continued work is expected
in these areas in the future as state boards of nursing, accreditation boards, schools, and
employers look for methods to assess nursing competency that provide valid and reliable
interpretations of data.
131
References
Adamson, K., & Kardong-Edgren, S. (2012, September). A method and resources for
assessing the reliability of simulation evaluation instruments. Nursing Education
Perspectives, 33(5), 334 – 339. Retrieved from http://www.nln.org/nlnjournal/
Adamson, K., Kardong-Edgren, S., & Willhaus, J. (2012, November). An updated review
of published simulation evaluation instruments. Clinical Simulation in Nursing,
9(9), e393-e400. doi:10.1016/j.ecns.2012.09.004
Agency for Healthcare Research & Quality. (2012). Patient safety primer – root cause
analysis. AHRQ: Patient Safety Network. Retrieved from http://psnet.ahrq.gov/
printviewPrimer.aspx?primerID=10
Alinier, G., & Platt, A. (2013). International overview of high-level simulation education
initiatives in relation to critical care. Nursing in Critical Care. Advance online
publication. doi:10.1111/nicc.12030
American Educational Research Association, American Psychological Association, &
National Council on Measurement in Education. (1999). Standards for
educational and psychological testing. Washington DC: American Educational
Research Association.
Aronson, B., Glynn, B., & Squires, T. (2012). Competency assessment in simulated
response to rescue events. Clinical Simulation in Nursing 8, e289-e295.
doi:10.1016/j.ecns.2010.11.006
Ashcraft, A., Opton, L., Bridges, R., Caballero, S., Veesart, A., & Weaver, C. (2013,
Mar/Apr). Simulation evaluation using a modified Lasater clinical judgment
rubric. Nursing Education Perspectives, 34(2), 122 – 126. Retrieved from
http://www.nln.org/nlnjournal/
Axelson, R., & Kreiter, C. (2009). Reliability. In S. Downing & R. Yudkowsky (Eds.)
Assessment in health professions education. [Kindle e-Reader]. NY: Taylor &
Francis e-Library.
Benner, P., Malloch, K., Sheets, V., Bitz, K., Emrich, L., Thomas, M.,…Farrell, M.
(2006). TERCAP: Creating a national database on nursing errors. Harvard Health
Policy Review, 7(1), 48-63. Retrieved from http://nursing2015.files.wordpress.
com/2010/02/ tercap_201004141512291.pdf
Berkow, S., Virkstis, K., Stewart, J., & Conway, L. (2009). Assessing new graduate nurse
performance. Nurse Educator, 34(1), 17 – 22. doi:10.1097/01.NNE.0000343405
.90362.15
132
Bing-Jonsson, P.C., Bjork, I.T., Hofoss, D., Kirkevold, M., & Foss, C. (2013).
Instruments measuring nursing staff competence in community health care: A
systematic literature review. Home Health Care Management & Practice, 25(6),
282 – 294. doi:10.1177/1084822313494784
Bloch, R., & Norman, G. (2012). Generalizability theory for the perplexed: A practical
introduction and guide: AMEE guide no. 68. Medical Teacher, 34(11), 960 – 992.
doi:10.3109/0142159X.2012.703791
Boulet, J. (2005). Generalizability theory: Basics. In B. Everitt & Howell, D. (Eds.)
Encyclopedia of Statistics in Behavioral Science. Chichester: John Wiley & Sons,
Ltd. Vol 2, 704 – 711.
Boulet, J. R., Jeffries, P. R., Hatala, R. A., Korndorffer, J. R., Feinstein, D. M., & Roche,
J. P. (2011). Research regarding methods of assessing learning outcomes.
Simulation in Healthcare, 6(7), S48 – S51. doi:10.1097/SIH.0b013e31822237d0
Boulet, J. R., & Murray, D. J. (2010, April). Simulation-based assessment in
anesthesiology: Requirements for practical implementation. Anesthesiology,
112(4), 1041-1052. doi:10.1097/ALN.0b013e3181cea265
Boulet, J.R., Murray, D., Kras, J., Woodhouse, J., McAllister, J., & Ziv, A. (2003,
December). Reliability and validity of a simulation-based acute care skills
assessment for medical students and residents. Anesthesiology, 99(6), 1270 –
1280. Retrieved from http://journals.lww.com/anesthesiology/pages/default.aspx
Boulet, J.R., Smee, S.M., Dillan, G.F., & Gimpel, J.R. (2009). The use of standardized
patient assessments for certification and licensure decisions. Society for
Simulation in Healthcare, 4(1), 35 – 42. doi:10.1097/SIH.0b013e318182fc6c
Brennan, R. (2001). Generalizability Theory. In series: Statistics for Social Science and
Public Policy. NY: Springer.
Brennan, R. (2011). Generalizability theory and classical test theory. Applied
Measurement in Education, 24, 1 – 21. doi:10.1080/08957347.2011.532417
Briesch, A.M., Swaminathan, H., Welsh, M., Chafouleas, S.M. (2014). Generalizability
theory: A practical guide to study design, implementation, and interpretation.
Journal of School Psychology, 52, 13 – 35. doi:10.1016/j.jsp.2013.11.008
133
Burns, P., & Poster, E. (2008). Competency development in new registered nurse
graduates: Closing the gap between education and practice. The Journal of
Continuing Education in Nursing, 39(2), 67 – 73. Retrieved from http://web.
ebscohost.com.ezproxy1.lib.asu.edu/ehost/detail?sid=c45231b9-5574-4c03-b5ee-
9c491636ad85%40sessionmgr112&vid=1&hid=103&bdata=JnNpdGU9ZWhvc3
QtbGl2ZQ%3d%3d#db=rzh&jid=1FC
CAE Healthcare (2012). MetiLearning. Retrieved from http://www.meti.com/products_
learningspace.htm
Cant, R., McKenna, L., & Cooper, S. (2013). Assessing preregistration nursing students’
clinical competence: A systematic review of objective measures. International
Journal of Nursing Practice, 19, 163-176. doi:10.1111/ijn.12053
Carmines, E., & Zeller, R. (1979). Reliability and validity assessment. USA: Sage
Publications. Center for Advanced Studies in Measurement and Assessment
(2013). GENOVA suite programs. Retrieved from http://www.education.
uiowa.edu/centers/casma/computer-programs
Center for Advanced Studies in Measurement and Assessment. (2013). GENOVA.
[Computer program]. Retrieved from http://www.education.uiowa.edu/centers/
casma /computer-programs#8f748e48-f88c-6551-b2b8-ff00000648cd
Centers for Disease Control and Prevention. (2012, June 8). Deep vein thrombosis (DVT)
/ pulmonary embolism (PE) – blood clot forming in a vein. Retrieved from
http://www.cdc.gov/ncbddd/dvt/data.html
Cook, D., Brydges, R., Zendejas, B., Hamstra, S., & Hatala, R. (2013, June).
Technology-enhanced simulation to assess health professionals: A systematic
review of validity evidence, research methods, and reporting quality. Academic
Medicine, 88(6), 1 – 12. doi:10.1097/ACM.0b013e31828ffdcf
Cowan, D.T., Norman, I., & Coopamah, V.P. (2005). Competence in nursing practice: A
controversial concept – A focused review of literature. Nurse Education Today,
25, 355 – 362. doi:10.1016/j.nedt.2005.03.002
Crick, J. E., & Brennan, R. L. (1983). Manual for GENOVA: A Generalized analysis of
variance system. Iowa City, Iowa: The American College Testing Program.
Dalkey, N. C., & Helmer, O. (1963). An experimental application of the Delphi method
to the use of experts. In Management Science 9(3), 458 – 467. Retrieved from
http://mansci.journal.informs.org/content/9/3/458.short
134
Darcy Mahoney, A., Hancock, L. Iorianni-Cimbak, A., & Curley, M. (2013). Using high-
fidelity simulation to bridge clinical and classroom learning in undergraduate
pediatric nursing. Nurse Education Today, 33, 648 – 654. doi:10.1016/j.nedt.
2012.01.005
Decker, S., Utterback, V. A., Thomas, M. B., Mitchell, M., & Sportsman, S. (2011).
Assessing continued competency through simulation: A call for stringent action.
Nursing Education Perspectives, 32(2), 120-125. Retrieved from http://www.nln.
org/nlnjournal/index.htm
Downing, S. M., & Haladyna, T. M. (2009). Validity and its threats. In S. Downing & R.
Yudkowsky (Eds.), Assessment in health professions education. [Kindle e-
Reader]. NY: Routledge, Taylor, & Francis Group.
Education Management Solutions (2013). EMS introduces ORION. Retrieved from
http://www.ems-works.com/
Elfrink Cordi, V. L, Leighton, K., Ryan-Wenger, N., Doyle, T. J., & Ravert, P. (2012,
July/August). History and development of the simulation effectiveness tool
(SET). Clinical Simulation in Nursing, 8(6), e199-e210. doi:10.1016/
j.ecns.2011.12.001
Enders, C.K. (2010). Applied missing data analysis. New York: The Guilford Press.
Feinstein, A.R., & Cicchetti, D.V. (1990). High agreement but low kappa: I. The
problems of two paradoxes. Journal of Clinical Epidemiology, 43(6), 543 – 549.
Retrieved from http://www.sciencedirect.com.ezproxy1.lib.asu.edu/
science/journal/08954356
Foronda, C., Liu, S., & Bauman, E. (in press). Evaluation of simulation in undergraduate
nurse education: An integrative review. Clinical Simulation in Nursing. Retrieved
from http://www.nursingsimulation.org/article/S1876-1399(12)00357-X/abstract
Gaba, D. (2004). The future vision of simulation in health care. Quality and Safety in
Health Care, 13(Suppl 1), i2 – i10. doi:10.1136/qshc.2004.009878
Gimpel, J. R., Boulet, J. R., & Errichetti, A. M. (2003). Evaluating the clinical skills of
osteopathic medical students. The Journal of the American Osteopathic
Association, 103(6), 267-279. Retrieved from http://www.jaoa.org/
Goodstone, L., & Goodstone, M. (in press). Use of simulation to develop a medication
administration safety assessment tool. Clinical Simulation in Nursing. Retrieved
from http://www.nursingsimulation.org/article/S1876-1399(13)00088-1/abstract
135
Goodwin, L. D. (2002). Changing conceptions of measurement validity: An update on the
new Standards. Journal of Nursing Education, 41(3), 100-106. Retrieved from
http://www.healio.com/journals/jne
Harder, B. N. (2010). Use of simulation in teaching and learning in health sciences: A
systematic review. Journal of Nursing Education, 49(1), 23-28. doi:10.3928/
01484834-20090828-08
Harvill, L. (1991). An NCME instructional module on standard error of measurement.
Educational Measurement: Issues and Practices, 10(2), 33 – 41.
Hasson, F., & Keeney, S. (2011). Enhancing rigour in the Delphi technique research.
Technological Forecasting & Social Change, 78, 1695 – 1704. doi:10.1016/
j.techfore.2011.04.005
Hasson, F., Keeney, S., & McKenna, H. (2000). Research guidelines for the Delphi
survey technique. Journal of Advanced Nursing, 32(4), 1008 – 1015. Retrieved
from http://onlinelibrary.wiley.com/journal/10.1111/(ISSN)1365-2648
Hill, H. C., Charalambous, C. Y., & Kraft, M. A. (March 5, 2012). When rater reliability
is not enough: Teacher observation systems and a case for the generalizability
study. Educational Research 41(56), 56-64. doi:10.3102/0013189X12437203
Hinton, J., Mays, M., Hagler, D., Randolph, P., Brooks, R., DeFalco, N.,… Weberg, D.
(2012). Measuring post-licensure competence with simulation: The nursing
performance profile. Journal of Nursing Regulation, 3(2), 45-53. Retrieved from
http://jnr.metapress.com/home/main.mpx
Holbrook, A., Schulman, S., Witt, D.M., Vandvik, P.O., Fish, J., Kovacs, M.J.,...Guyatt,
G.H. (2012, Feb.). Chest, 141(2 suppl). E152S-84S. Retrieved from
http://www.guideline.gov/content.aspx?id=35262&search=venous+thrombosis
Holmboe, E., Rizzolo, M. A., Sachdeva, A. K., Rosenberg, M., & Ziv, A. (2011).
Simulation-based assessment and the regulation of healthcare professionals.
Simulation in Healthcare, 6, S58-S62. doi:10.1097/SIH.0b013e3182283bd7
Hughes, R., Smith, S., Sheffield, C., & Wier, G. (2013, May/June). Assessing
performance outcomes of new graduates utilizing simulation in a military
transition program. Journal for Nurses in Professional Development, 29(3), 143
– 148. doi:10.1097/NND.0b013e318291c468
136
Issenberg, S., McGaghie, W., Petrusa, E., Gordon, D., & Scalese, R. (2005). Features and
uses of high-fidelity medical simulations that lead to effective learning: A BEME
systematic review. Medical Teacher, 27(1), 10 – 28. Retrieved from
http://web.ebscohost.com.ezproxy1.lib.asu.edu/ehost/detail?sid=b7b1d318-372e-
4c6f-9282-ae68141074b5%40sessionmgr15&vid=1&hid=14&bdata=JnNpdGU
9ZWhvc3QtbGl2ZQ%3d%3d#db=aph&jid=MCH
Jippes, M. (2012). Culture matters in medical schools: How values shape a successful
curriculum change. Netherlands: M. Jippes. Retrieved from http://digitalarchive.
maastrichtuniversity.nl/fedora/get/guid:363a64da-6ac6-49b0-98f8-
ae99fcd1cf27/ASSET1
Johnson, R.L., Penny, J.A., & Gordon, B. (2009). Assessing performance: Designing,
scoring, and validating performance tasks. USA: The Guilford Press.
Juraschek, S., Zhang, X., Ranganathan, V., & Lin, V. (2012). United States registered
nurse workforce report card and short-age forecast. American Journal of
Medical Quality, 27(3), 241 – 249. Retrieved from http://ajm.sagepub.com/
Kardong-Edgren, S., Adamson, K. A., & Fitzgerald, C. (2010). A review of currently
published evaluation instruments for human patient simulation. Clinical
Simulation in Nursing, 6(1), e25-e35. doi:10.1016/j.ecns.2009.08.004
Kardon-Edgren, S., Hanberg, A. D., Keenan, C., Ackerman, A., and Chambers, K.
(2011). A discussion of high-stakes testing: An extension of a 2009 INACSL
conference roundtable. Clinical Simulation in Nursing, 7, e19-e24.
doi:10.1016/j.ecns.2010.02.002
Kardong-Edgren, S., Hayden, J., Keegan, M., & Smiley, R. (2014). Reliability and
validity testing of the Creighton Competency Evaluation Instrument for use in the
NCSBN National Simulation Study. Nursing Education Perspectives. Retrieved
from http://www.nln.org/nlnjournal/
Katz, G., Peifer, K., & Armstrong, G. (2010). Assessment of patient simulation use in
selected baccalaureate nursing programs in the United States. Simulation in
Healthcare, 5(1), 46 – 51. doi:10.1097/SIH.0b013e3181ba1f46
KB Port. (2013). ETC Fusion. Retrieved from http://www.kbport.com/products.php
Kearon, C., Akl, E.A., Comerota, A.J., Prandoni, P., Bounameaux, H., Goldhaber,
S.Z.,...Kahn, S.R. (2012, Feb.). Antithrombotic therapy for VTE disease:
Antithrombotic therapy and prevention of thrombosis, 9th ed: American College
of Chest Physicians evidence-based clinical practice guidelines. Chest, 141(2
suppl): 1 – 801. Retrieved from http://www.guideline.gov/content.aspx?
id=35262&search=venous+thrombosis
137
Kerns, L. L., & Dhingra, S. S. (2012). Reports and analysis. In L. Wilson & L. Rockstraw
(Eds.), Human simulation for nursing and health professions (pp. 69-88). NY,
NY: Springer Publishing Co.
Kreiter, C. D. (2009). Generalizability theory. In S. Downing & R. Yudkowsky (Eds.),
Assessment in health professions education. [Kindle e-Reader]. NY: Routledge,
Taylor, & Francis Group.
Lindsey, P., & Jenkins, S. (2013). Nursing students’ clinical judgment regarding rapid
response: The influence of a clinical simulation education intervention. Nursing
Forum, 48(1), 61 – 70. Retrieved from http://onlinelibrary.wiley.com
/doi/10.1111/nuf.12002/full
Manser, T. (2008). Team performance assessment in healthcare facing the challenge.
Simulation in Healthcare, 3(1), 1-3. doi:10.1097/SIH.0b013e3181663592
Manz, J., Hercinger, M., Todd, M., Hawkins, K., & Parsons, M. (2013, July). Improving
consistency of assessment of student performance during simulated experiences.
Clinical Simulation in Nursing, 9(7), e229 – e233. doi:10.1016/j.ecns.2012.02.007
Margolis, M., Clauser, B., Cuddy, M., Ciccone, A., Mee, J., Harik, P., & Hawkins, R.
(2006, October). Use of the mini-clinical evaluation exercise to rate examinee
performance on a multiple-station clinical skills examination: A validity study.
Academic Medicine, 81(10 Suppl), S56 – S60. Retrieved from http://journals.
lww.com/academicmedicine/pages/default.aspx
McGaghie, W., Butter, J., & Kaye, M. (2009). Observational assessment. In S. Downing
& R. Yudkowsky (Eds.), Assessment in health professions education. [Kindle e-
Reader]. NY: Routledge, Taylor, & Francis Group.
McGaghie, W., & Issenberg, B. (2009). Simulations in assessment. In S. Downing & R.
Yudkowsky (Eds.), Assessment in health professions education. [Kindle e-
Reader]. NY: Routledge, Taylor, & Francis Group.
MCWS. (2008). Medical Record and Scenario Template. Unpublished template for
“Measuring Competency with Simulation.”
Messick, S. (1995). Validity of psychological assessment: validation of inferences from
persons’ responses and performances as scientific inquiry into score meaning.
American Psychologist, 50(9), 741-749. Retrieved from http://search.proquest.
com.ezproxy1.lib.asu.edu/docview/614327710/ fulltextPDF?accountid=4485
Meyer, M. N., Connors, H., Hou, Q., and Gajewski, B. (2011). The effect of simulation
on clinical performance: A junior nursing student clinical comparison study.
Simulation in Healthcare, 6(5), 269-277. doi:10.1097/SIH.0b013e318223a048
138
Mislevy, R. J. (2011). Evidence-centered design for simulation-based assessment.
(CRESST Report 800). Los Angeles, CA: University of California, National
Center for Research on Evaluation, Standards, and Student Testing (CRESST).
Retrieved from http://www.cse.ucla.edu/products/reports/R800.pdf
National Council of State Boards of Nursing. (2007). Attachment C1: The impact of
transition experience on practice of newly licensed registered nurses. Business
Book: NCSBN 2007 Annual Meeting: Navigating the Evolution of Nursing
Regulation. Retrieved from https://www.ncsbn.org/2007_BusinessBook
_Section2.pdf
National Council of State Boards of Nursing. (2014). NCLEX Examinations. Retrieved
from https://www.ncsbn.org/nclex.htm
Nursing Executive Center. (2008). Bridging the preparation-practice gap. Volume I:
Quantifying new graduate nurse improvement needs. In The New Graduate Nurse
Preparation Series. Washington, DC: Advisory Board Company. Retrieved from
http://www.advisory.com/Research/ Nursing-Executive-Center/Studies/2008/
Bridging-the-Preparation-Practice-Gap-Volume-I
Pelgrim, E. A., Kramer, A. W., Mokkink, H. G., van den Elsen, L., Grol, R. P., & van der
Vleuten, C. P. (2011) In-training assessment using direct observation of single-
patient encounters: A literature review, in Advances in Health Sciences
Education, 16, 131-142. doi:10.1007/s10459-010-9235-6
Pew Health Professions Commission. (1995). Reforming health care workforce
regulation: Policy considerations for the 21st century. San Francisco: University
of California San Francisco Center for the Health Professions. Retrieved from
http://www.advisory.com/Research/Nursing-Executive-Center/Studies/2008/
Bridging-the-Preparation-Practice-Gap-Volume-I
Prion, S., & Adamson, K. (2012). Making sense of methods and measurement: The need
for rigor in simulation research. Clinical Simulation in Nursing 8, e193.
doi:10.1016/j.ecns.2012.02.005
Ram, P., Grol, R., Joost Rethans, J., Schouten, B., van der Vleuten, C., & Kester, A.
(1999). Assessment of general practitioners by video observation of
communicative and medical performance in daily practice: Issues of validity,
reliability, and feasibility. In Medical Education, 33, 447 – 454. Retrieved from
http://onlinelibrary.wiley.com/journal/10.1111/(ISSN)1365-2923
Randolph, P. (2013, September). Measuring post-licensure competence. Paper presented
at Arizona Simulation Network, Mesa, AZ.
139
Randolph, P., Hinton, J., Hagler, D., Mays, M., Kastenbaum, B., Brooks, R.,…Weberg,
D. (2012). Measuring competence: Collaboration for safety. The Journal of
Continuing Education in Nursing, 43(12), 541-547. doi:10.3928/00220124-
20121101-59
Rogers, A.E., Hwang, W., Scott, L.D., Aiken, L.H., & Dinges, D.F. (2004, July). The
working hours of hospital staff nurses and patient safety. Health Affairs, 23(4),
202 – 212. doi: 10.1377/hlthaff.23.4.202
Rosen, M. A., Salas, E., Wilson, K. A., King, H. B., Salisbury, M., Augenstein, J. S., …
Birnbach, D. J. (2008). Measuring team performance in simulation-based training:
Adoptiing best practices for healthcare. Society for Simulation in Healthcare,
3(1), 33-41. doi:10.1097/SIH.0b013e3181626276
Ruben, D.B. (1987). Multiple imputation for nonresponse in surveys. NY, NY: John
Wiley & Sons.
Saewert, K. J., & Rockstraw, L. J. (2012). Development of evaluation measures for
human simulation: The checklist. In L. Wilson & L. Rockstraw (Eds.), Human
simulation for nursing and health professions (pp. 28-36). NY, NY: Springer
Publishing Co.
Salas, E., Paige, J., & Rosen, M. (2013). Creating new realities in healthcare: The status
of simulation-based training as a patient safety improvement strategy. BMJ
Quality & Safety, 22, 449 – 452. doi:10.1136/bmjqs-2013-002112
Salas, E., Rosen, M. A., Held, J. D., & Weissmuller, J. J. (2009). Performance
measurement in simulation-based training: A review and best practices.
Simulation & Gaming, 40(3), 328-376. doi:10.1177/1046878108326734
Sando, C., Coggins, R., Meakim, C., Franklin, A., Gloe, D., Boese, T., … Borum, J.
(2013, June). Standards of best practice: Simulation standard VII: Participant
assessment and evaluation. Clinical Simulation in Nursing, 9(6S), S30 – S32.
Retrieved from http://dx.doi.org/10.1016/j.ecns.2013.04.007
Schaefer, J., Vanderbilt, A., Cason, C., Bauman, E., Glavin, R., Lee, F., & Navedo, D.
(2011). Literature Review: Instructional Design and Pedagogy Science in
Healthcare Simulation. Simulation in Healthcare, 6(7), S30-S41.
doi:10.1097/SIH.0b013e31822237b4
Schatz, S., Marraffino, A., Allen, C., & Tanaka, A. (2013). Human-systems integration,
simulation, and the nursing shortage. Proceedings of the International Symposium
of Human Factors and Ergonomics in Healthcare, 2, 135 – 142. doi:10.1177/
2327857913021026
140
Schuwirth, L.W., & van der Vleuten, C.P. (2003). The use of clinical simulations in
assessment. In Medical Education, 37(Suppl. 1), 65 – 71. Retrieved from
http://onlinelibrary.wiley.com/journal/10.1111/(ISSN)1365-2923
Scott Tilley, D.D. (2008). Competency in nursing: A concept analysis. Journal of
Continuing Education in Nursing. 39(2), 58 – 64. Retrieved from
http://web.a.ebscohost.com.ezproxy1.lib.asu.edu/ehost/detail?sid=47ba7222-
5d99-47e6-bdde-69c3d6622785%40sessionmgr4002&vid=1&hid=4204
&bdata=JnNpdGU9ZWhvc3QtbGl2ZQ%3d%3d#db=rzh&jid=1FC
Shavelson, R., & Webb, N. (1991). Generalizability Theory: A Primer. USA: Sage
Publications.
Shelestak, D., & Voshall, B. (2014). Examining validity, fidelity, and reliability of human
patient simulation. Clinical Simulation in Nursing, 10, e257 – e260.
doi:10.1016/j.ecns.2013.12.003
Simon, A., & Boyer, E. (Ed). (1974). Mirrors for behavior III. An anthology of
observation instruments. Wyncote, Pa: Communication Materials Center. (Library
of Congress Catalog Card Number 67-31735).
Stora, B., Hagtvet, K., & Heyerdahl, S. (2013). Reliability of observers’ subjective
impressions of families: A generalizability theory approach. Psychotherapy
Research, 23(4), 448 – 463. doi:10.1080/10503307.2012.733830
Swanson, D., & Stillman, P. (1990). Use of standardized patients for teaching and
assessing clinical skills. Evaluation & the Health Professions, 13, 79- 103.
doi:10.1177/ 016327879001300105
Tabachnick, B., & Fidell, L. (2007). Using multivariate statistics (5th ed.), Boston:
Pearson Education, Inc.
Tekian, A., & Yudkowsky, R. (2009). Assessment portfolios. In S. Downing & R.
Yudkowsky (Eds.), Assessment in health professions education. [Kindle e-
Reader]. NY: Routledge, Taylor, & Francis Group.
The INASCL Board of Directors (2011, August). Standard VII: Evaluation of expected
outcomes. Clinical Simulation in Nursing, 7(4S), s18-s19. doi:10.1016/
j.ecns.2011.05.011
Thorndike, R. (2005). Measurement and evaluation in psychology and education. Upper
Saddle River, New Jersey: Pearson Education, Inc.
141
Uberoi, R., Swati, E., Gupta, U., & Sibal, A. (2007, March). Root cause analysis in
healthcare. Apollo Medicine, 4(1), 72 – 75. Retrieved from http://www.apollo
medicaljournal.net/article/S0976-0016(11)60440-7/abstract
U.S. Department of Health and Human Services. (2008). The surgeon general's call to
action to prevent deep vein thrombosis and pulmonary embolism. Rockville, MD:
Office of the Surgeon General (US); 2008. Retrieved from:
http://www.ncbi.nlm.nih.gov/books/NBK44181/
Van Agt, H., Essink-Bot, M., Krabbe, P., & Bonsel, G. (1994). Test-retest reliability of
health state valuations collected with the Euroqol questionnaire. Social Science
and Medicine, 39(11). 1537 – 1544. Retrieved from http://www.journals.
elsevier.com/social-science-and-medicine/
Viera, A.J., & Garrett, J.M. (2005, May). Understanding interobserver agreement: The
kappa statistic. Family Medicine, 37(5), 360 – 363. Retrieved from
http://www.stfm.org/FamilyMedicine/Vol37Issue5
Wakefield, M. (2000, June). To err is human: An Institute of Medicine report.
Professional Psychology: Research and Practice, 31(3), 243 – 244. Retrieved
from http://search.proquest.com.ezproxy1.lib.asu.edu/docview/614509240/
fulltextPDF?accountid=4485
Walling, A. (2005, November). Deciding on hospitalization for patients with DVT.
American Family Physician, 72(9), 1845 – 1846. Retrieved from
http://www.aafp.org/ afp/2005/1101/p1845.html
Waters, J.K. (2011, May). 360 DEGREES of reflection. THE Journal, 38(5), 33-35.
Retrieved from http://web.ebscohost.com.ezproxy1.lib.asu.edu/ehost/detail?
vid=3&hid=14&sid=7bac7993-a010-4a10-807f-c64640d81bd0%40sessionmgr
15&b data=JnNpdGU9ZWhvc3QtbGl2ZQ%3d%3d#db=aph&AN=60780497
Wayman, J.C. (2003). Multiple imputation for missing data: What is it and how can I use
it? Paper presented at the 2003 Annual Meeting of the American Educational
Research Association, Chicago, Illinois.
Webb, N.M., Shavelson, R.J., & Haertel, E.H. (2006). Reliability coefficients and
generalizability theory. In C. Rao, & S. Sinharay (Eds.), Handbook of Statistics
(1st ed., Vol. 26). doi: 10.1016/S0169-7161(06)26004-8
Weller, J., Robinson, B., Jolly, B., Watterson, L., Joseph, M., Bajenov, S., . . . Larsen, P.
(2005). Psychometric characteristics of simulation-based assessment in
anaesthesia and accuracy of self-assessed scores. Anaesthesia, 60, 245 – 250.
Retrieved from http://www.aagbi.org/publications/anaesthesia
142
Wilkinson, C. (2013). Competency assessment tools for registered nurses: An integrative
review. The Journal of Continuing Education in Nursing, 44(1), 31-37.
doi:10.3928/00220124-20121102-53
Yuan, H. B., Williams, B. A., & Fang, J. B. (2011). The contribution of high-fidelity
simulation to nursing students’ confidence and competence: A systematic review.
International Nursing Review, 59(1), 26-33. Retrieved from
http://onlinelibrary.wiley.com/ journal/10.1111/(ISSN)1466-7657/issues
Yudkowsky, R. (2009). Performance tests. In S. Downing & R. Yudkowsky (Eds.),
Assessment in health professions education. [Kindle e-Reader]. NY: Routledge,
Taylor, & Francis Group.
Ziv, A., Berkenstadt, H., & Eisenberg, O. (2013). Simulation for licensure and
certification. In A. Levine, S. DeMaria, A. Schwartz, & A. Sim (Eds.), The
comprehensive textbook of healthcare simulation (pp. 161 – 170). NY: Springer.

143
APPENDIX A
IRB DOCUMENTATION
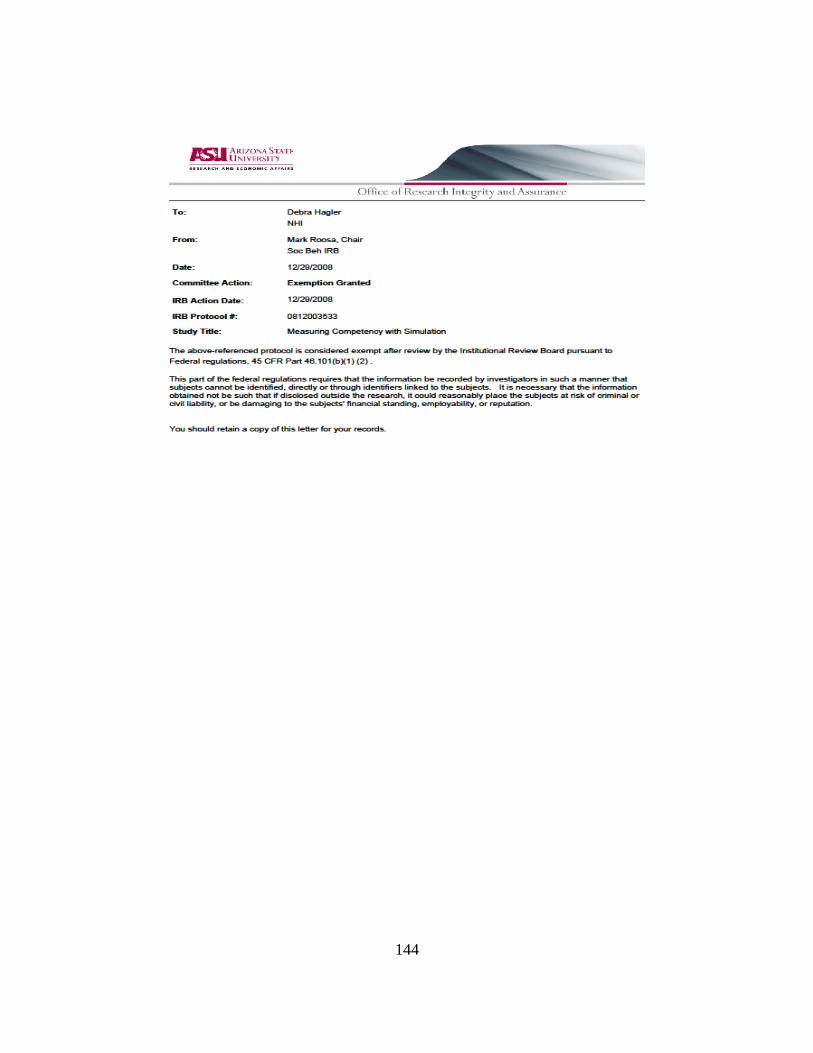
144
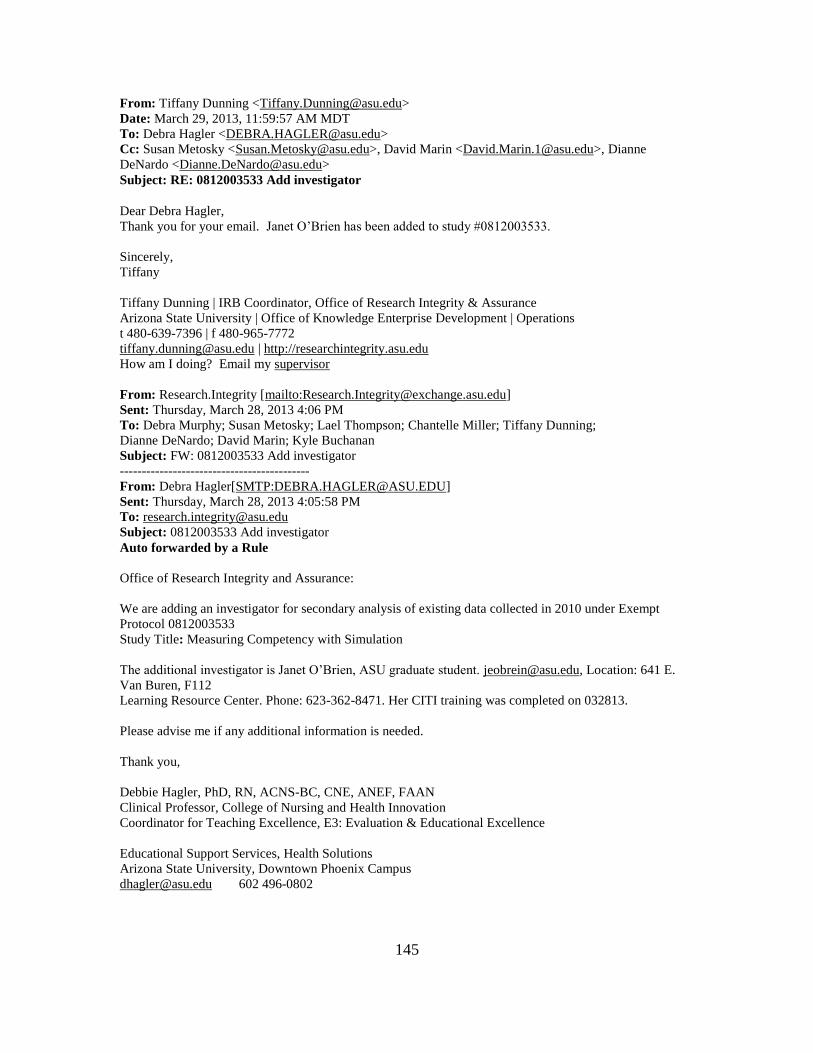
145
From: Tiffany Dunning <[email protected]>
Date: March 29, 2013, 11:59:57 AM MDT
To: Debra Hagler <[email protected]>
Cc: Susan Metosky <[email protected]>, David Marin <[email protected]>, Dianne
DeNardo <[email protected]>
Subject: RE: 0812003533 Add investigator
Dear Debra Hagler,
Thank you for your email. Janet O’Brien has been added to study #0812003533.
Sincerely,
Tiffany
Tiffany Dunning | IRB Coordinator, Office of Research Integrity & Assurance
Arizona State University | Office of Knowledge Enterprise Development | Operations
t 480-639-7396 | f 480-965-7772
[email protected] | http://researchintegrity.asu.edu
How am I doing? Email my supervisor
From: Research.Integrity [mailto:[email protected]]
Sent: Thursday, March 28, 2013 4:06 PM
To: Debra Murphy; Susan Metosky; Lael Thompson; Chantelle Miller; Tiffany Dunning;
Dianne DeNardo; David Marin; Kyle Buchanan
Subject: FW: 0812003533 Add investigator
-------------------------------------------
From: Debra Hagler[SMTP:[email protected]]
Sent: Thursday, March 28, 2013 4:05:58 PM
Subject: 0812003533 Add investigator
Auto forwarded by a Rule
Office of Research Integrity and Assurance:
We are adding an investigator for secondary analysis of existing data collected in 2010 under Exempt
Protocol 0812003533
Study Title: Measuring Competency with Simulation
The additional investigator is Janet O’Brien, ASU graduate student. [email protected], Location: 641 E.
Van Buren, F112
Learning Resource Center. Phone: 623-362-8471. Her CITI training was completed on 032813.
Please advise me if any additional information is needed.
Thank you,
Debbie Hagler, PhD, RN, ACNS-BC, CNE, ANEF, FAAN
Clinical Professor, College of Nursing and Health Innovation
Coordinator for Teaching Excellence, E3: Evaluation & Educational Excellence
Educational Support Services, Health Solutions
Arizona State University, Downtown Phoenix Campus
[email protected] 602 496-0802
146
147

148
APPENDIX B
PERMISSION TO USE COPYRIGHTED MCWS TEMPLATE
149
From: Debra Hagler
Sent: Sunday, June 15, 2014 11:25 AM
To: Janet O'Brien
Subject: RE: edits - new 'final' version
Janet O’Brien has permission from the Measuring Competency with Simulation Team to
use and publish the MCWS Scenario Template in her dissertation.
Debbie Hagler, PhD, RN, ACNS-BC, CNE, CHSE, ANEF, FAAN
Clinical Professor, College of Nursing and Health Innovation
Coordinator for Teaching Excellence
Educational Support Services
College of Health Solutions
College of Nursing & Health Innovation
500 North 3rd Street | Phoenix, AZ 85004
[email protected] 602 496-0802

150
APPENDIX C
MEDICAL RECORD AND SIMULATION SCENARIO
151
NURSING PERFORMANCE EVALUATION
SIMULATION SCENARIO SET ###
USED WITH PERMISSION OF THE MCWS PHASE I PROJECT (2008)
© MCWS 2008, NPE 2012
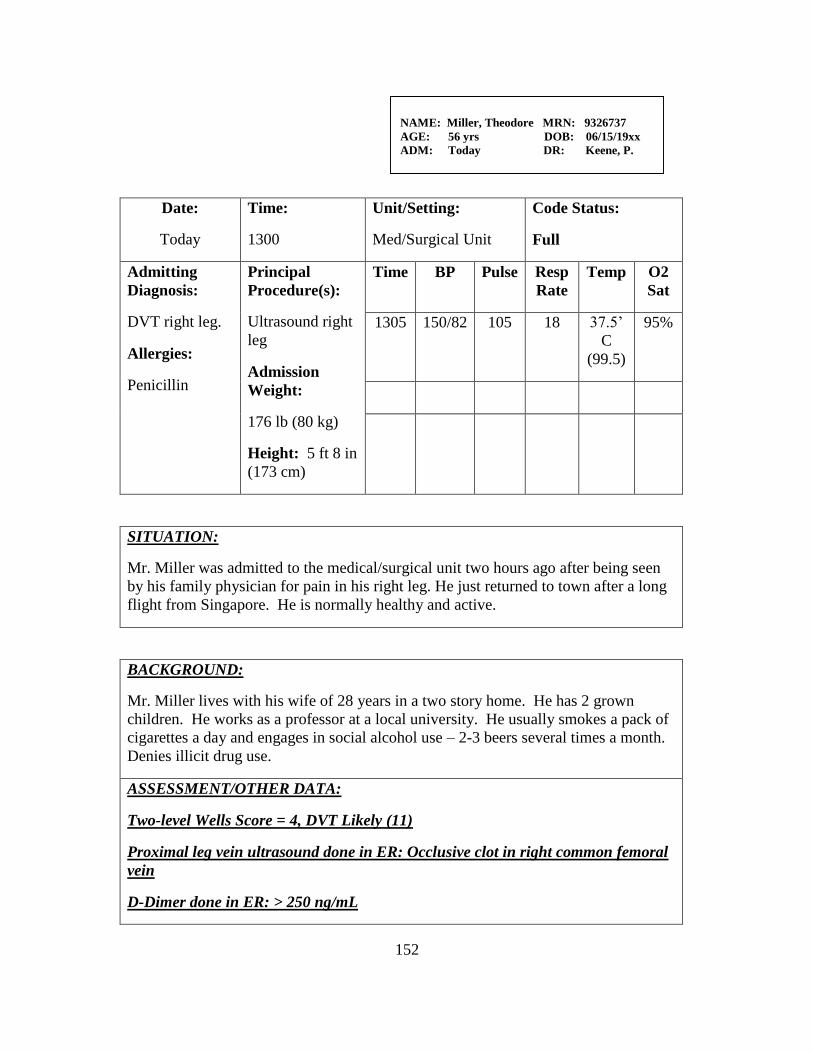
152
Date:
Today
Time:
1300
Unit/Setting:
Med/Surgical Unit
Code Status:
Full
Admitting
Diagnosis:
DVT right leg.
Allergies:
Penicillin
Principal
Procedure(s):
Ultrasound right
leg
Admission
Weight:
176 lb (80 kg)
Height: 5 ft 8 in
(173 cm)
Time BP Pulse Resp
Rate
Temp O2
Sat
1305 150/82 105 18 37.5’
C
(99.5)
95%
SITUATION:
Mr. Miller was admitted to the medical/surgical unit two hours ago after being seen
by his family physician for pain in his right leg. He just returned to town after a long
flight from Singapore. He is normally healthy and active.
BACKGROUND:
Mr. Miller lives with his wife of 28 years in a two story home. He has 2 grown
children. He works as a professor at a local university. He usually smokes a pack of
cigarettes a day and engages in social alcohol use – 2-3 beers several times a month.
Denies illicit drug use.
ASSESSMENT/OTHER DATA:
Two-level Wells Score = 4, DVT Likely (11)
Proximal leg vein ultrasound done in ER: Occlusive clot in right common femoral
vein
D-Dimer done in ER: > 250 ng/mL
NAME: Miller, Theodore MRN: 9326737
AGE: 56 yrs DOB: 06/15/19xx
ADM: Today DR: Keene, P.
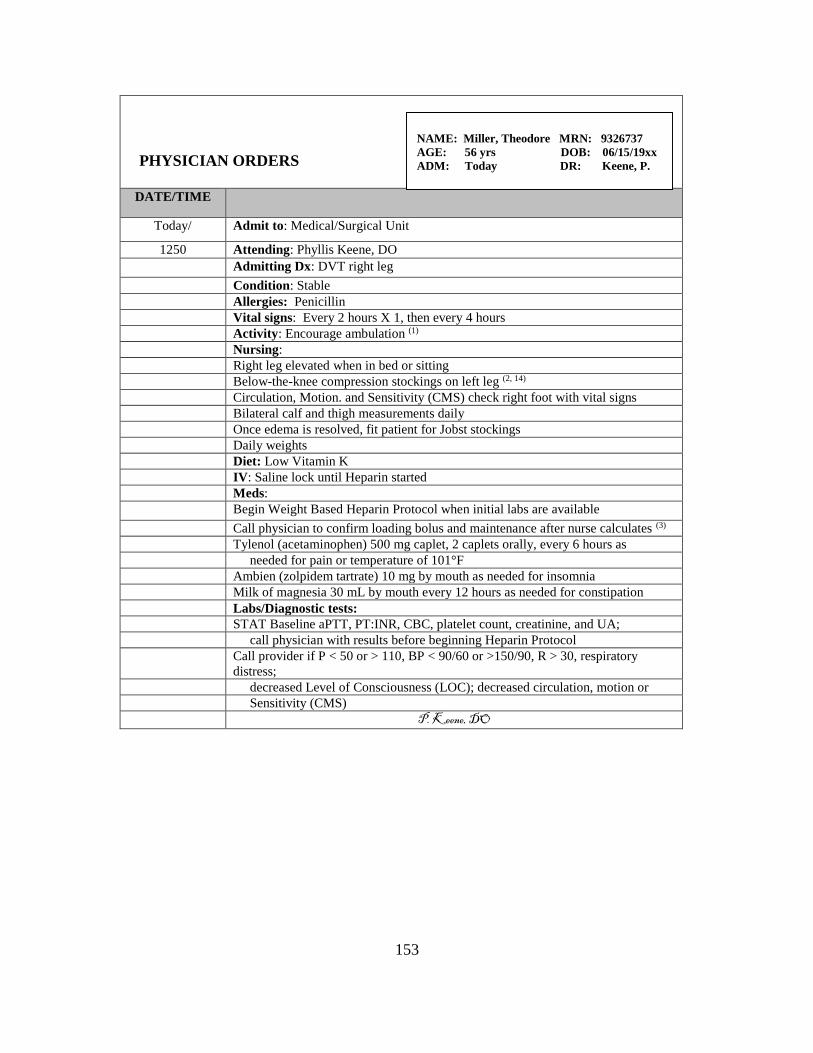
153
PHYSICIAN ORDERS
DATE/TIME
Today/ Admit to: Medical/Surgical Unit
1250 Attending: Phyllis Keene, DO
Admitting Dx: DVT right leg
Condition: Stable
Allergies: Penicillin
Vital signs: Every 2 hours X 1, then every 4 hours
Activity: Encourage ambulation (1)
Nursing:
Right leg elevated when in bed or sitting
Below-the-knee compression stockings on left leg (2, 14)
Circulation, Motion. and Sensitivity (CMS) check right foot with vital signs
Bilateral calf and thigh measurements daily
Once edema is resolved, fit patient for Jobst stockings
Daily weights
Diet: Low Vitamin K
IV: Saline lock until Heparin started
Meds:
Begin Weight Based Heparin Protocol when initial labs are available
Call physician to confirm loading bolus and maintenance after nurse calculates (3)
Tylenol (acetaminophen) 500 mg caplet, 2 caplets orally, every 6 hours as
needed for pain or temperature of 101°F
Ambien (zolpidem tartrate) 10 mg by mouth as needed for insomnia
Milk of magnesia 30 mL by mouth every 12 hours as needed for constipation
Labs/Diagnostic tests:
STAT Baseline aPTT, PT:INR, CBC, platelet count, creatinine, and UA;
call physician with results before beginning Heparin Protocol
Call provider if P < 50 or > 110, BP < 90/60 or >150/90, R > 30, respiratory
distress;
decreased Level of Consciousness (LOC); decreased circulation, motion or
Sensitivity (CMS)
P. Keene, DO
NAME: Miller, Theodore MRN: 9326737
AGE: 56 yrs DOB: 06/15/19xx
ADM: Today DR: Keene, P.
154
PHYSICIAN ORDERS
DATE/TIME
NAME: Miller, Theodore MRN: 9326737
AGE: 56 yrs DOB: 06/15/19xx
ADM: Today DR: Keene, P.
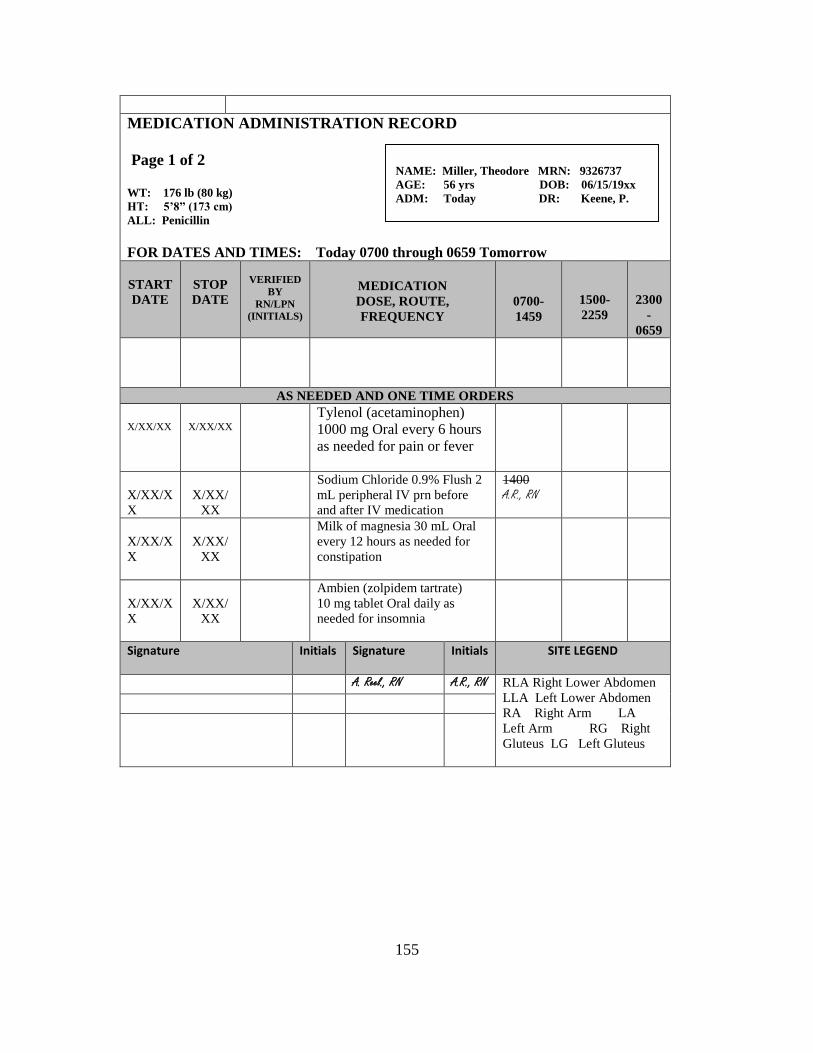
155
MEDICATION ADMINISTRATION RECORD
Page 1 of 2 WT: 176 lb (80 kg) HT: 5’8” (173 cm) ALL: Penicillin
FOR DATES AND TIMES: Today 0700 through 0659 Tomorrow
START
DATE
STOP
DATE
VERIFIED
BY
RN/LPN
(INITIALS)
MEDICATION
DOSE, ROUTE,
FREQUENCY
0700-
1459
1500-
2259
2300
-
0659
AS NEEDED AND ONE TIME ORDERS
X/XX/XX
X/XX/XX
Tylenol (acetaminophen)
1000 mg Oral every 6 hours
as needed for pain or fever
X/XX/X
X
X/XX/
XX
Sodium Chloride 0.9% Flush 2
mL peripheral IV prn before
and after IV medication
1400 A.R., RN
X/XX/X
X
X/XX/
XX
Milk of magnesia 30 mL Oral
every 12 hours as needed for
constipation
X/XX/X
X
X/XX/
XX
Ambien (zolpidem tartrate)
10 mg tablet Oral daily as
needed for insomnia
Signature Initials Signature Initials SITE LEGEND
A. Reel., RN A.R., RN RLA Right Lower Abdomen
LLA Left Lower Abdomen
RA Right Arm LA
Left Arm RG Right
Gluteus LG Left Gluteus
NAME: Miller, Theodore MRN: 9326737
AGE: 56 yrs DOB: 06/15/19xx
ADM: Today DR: Keene, P.
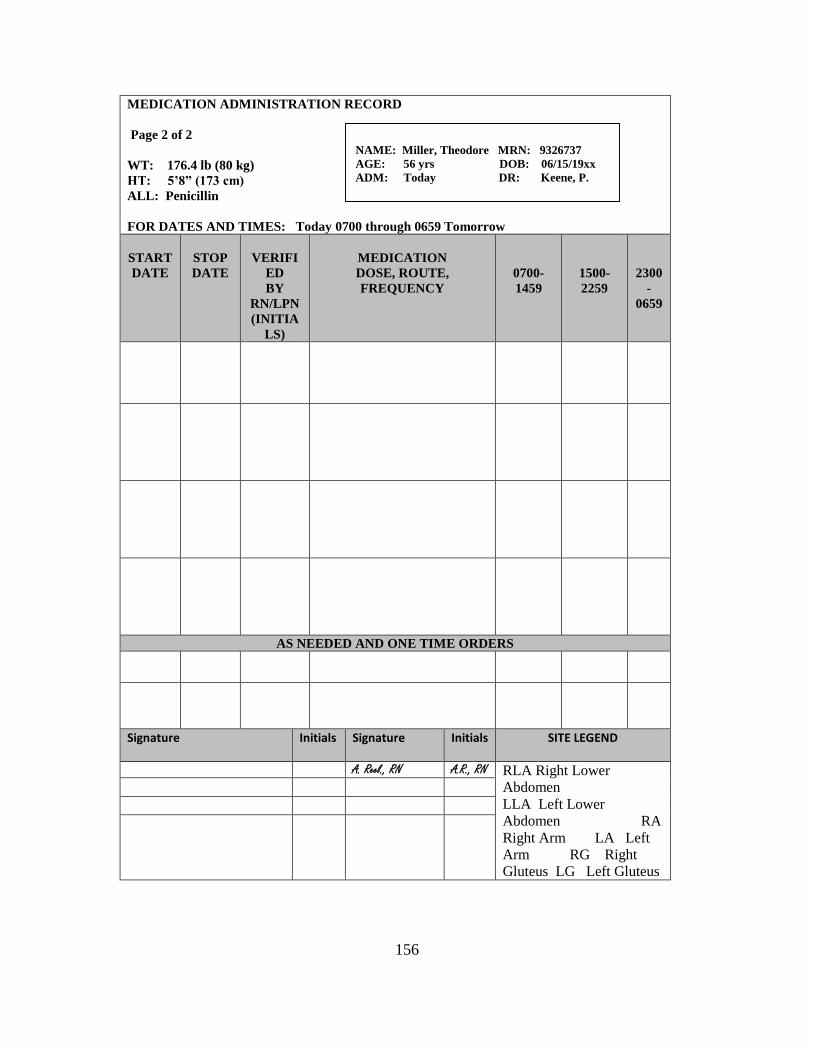
156
MEDICATION ADMINISTRATION RECORD
Page 2 of 2
WT: 176.4 lb (80 kg)
HT: 5’8” (173 cm)
ALL: Penicillin
FOR DATES AND TIMES: Today 0700 through 0659 Tomorrow
START
DATE
STOP
DATE
VERIFI
ED
BY
RN/LPN
(INITIA
LS)
MEDICATION
DOSE, ROUTE,
FREQUENCY
0700-
1459
1500-
2259
2300
-
0659
AS NEEDED AND ONE TIME ORDERS
Signature Initials Signature Initials SITE LEGEND
A. Reel., RN A.R., RN RLA Right Lower
Abdomen
LLA Left Lower
Abdomen RA
Right Arm LA Left
Arm RG Right
Gluteus LG Left Gluteus
NAME: Miller, Theodore MRN: 9326737
AGE: 56 yrs DOB: 06/15/19xx
ADM: Today DR: Keene, P.
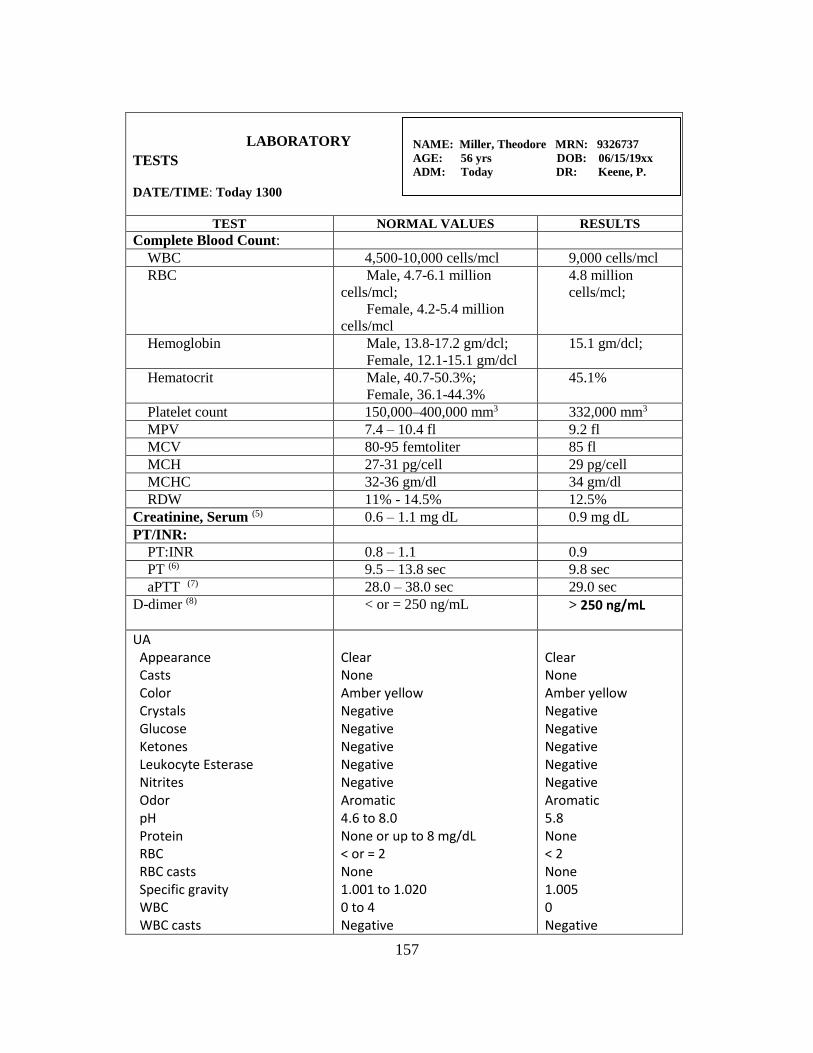
157
LABORATORY
TESTS
DATE/TIME: Today 1300
TEST NORMAL VALUES RESULTS
Complete Blood Count:
WBC 4,500-10,000 cells/mcl 9,000 cells/mcl
RBC Male, 4.7-6.1 million
cells/mcl;
Female, 4.2-5.4 million
cells/mcl
4.8 million
cells/mcl;
Hemoglobin Male, 13.8-17.2 gm/dcl;
Female, 12.1-15.1 gm/dcl
15.1 gm/dcl;
Hematocrit Male, 40.7-50.3%;
Female, 36.1-44.3%
45.1%
Platelet count 150,000–400,000 mm3 332,000 mm3
MPV 7.4 – 10.4 fl 9.2 fl
MCV 80-95 femtoliter 85 fl
MCH 27-31 pg/cell 29 pg/cell
MCHC 32-36 gm/dl 34 gm/dl
RDW 11% - 14.5% 12.5%
Creatinine, Serum (5) 0.6 – 1.1 mg dL 0.9 mg dL
PT/INR:
PT:INR 0.8 – 1.1 0.9
PT (6) 9.5 – 13.8 sec 9.8 sec
aPTT (7) 28.0 – 38.0 sec 29.0 sec
D-dimer (8) < or = 250 ng/mL > 250 ng/mL
UA Appearance Casts Color Crystals Glucose Ketones Leukocyte Esterase Nitrites Odor pH Protein RBC RBC casts Specific gravity WBC WBC casts
Clear None Amber yellow Negative Negative Negative Negative Negative Aromatic 4.6 to 8.0 None or up to 8 mg/dL < or = 2 None 1.001 to 1.020 0 to 4 Negative
Clear None Amber yellow Negative Negative Negative Negative Negative Aromatic 5.8 None < 2 None 1.005 0 Negative
NAME: Miller, Theodore MRN: 9326737
AGE: 56 yrs DOB: 06/15/19xx
ADM: Today DR: Keene, P.
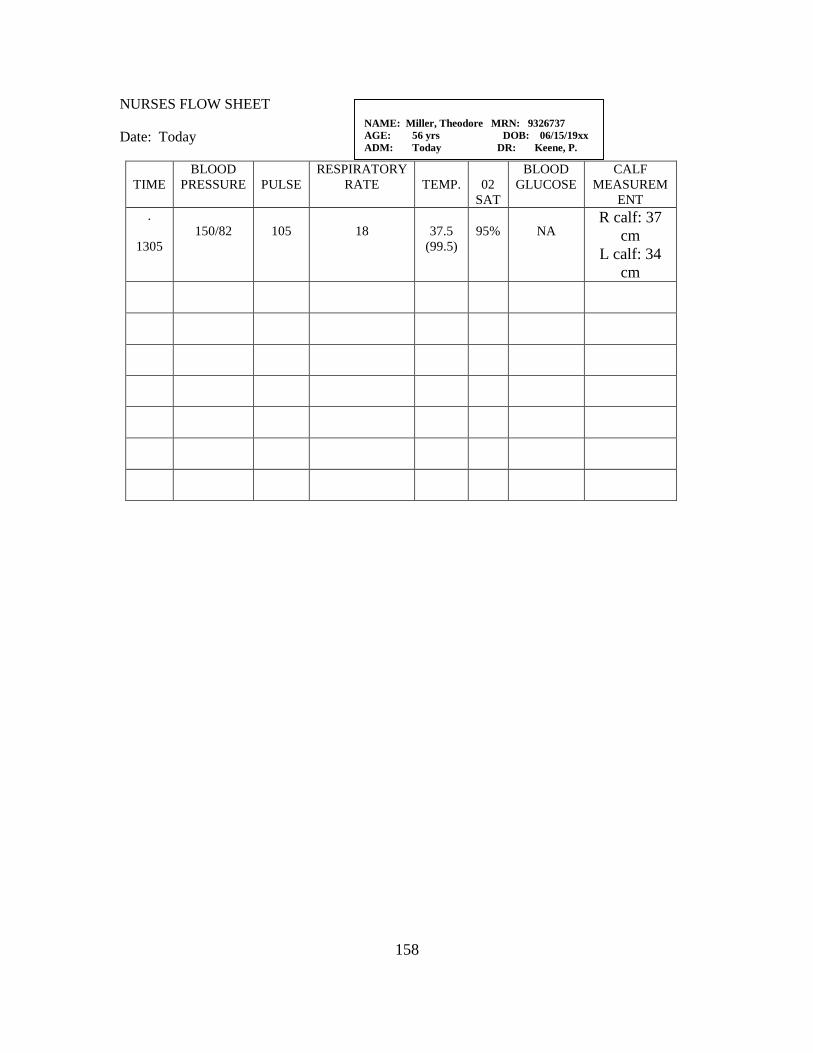
158
NURSES FLOW SHEET
Date: Today
TIME
BLOOD
PRESSURE
PULSE
RESPIRATORY
RATE
TEMP.
02
SAT
BLOOD
GLUCOSE
CALF
MEASUREM
ENT
.
1305
150/82
105
18
37.5
(99.5)
95%
NA R calf: 37
cm
L calf: 34
cm
NAME: Miller, Theodore MRN: 9326737
AGE: 56 yrs DOB: 06/15/19xx
ADM: Today DR: Keene, P.
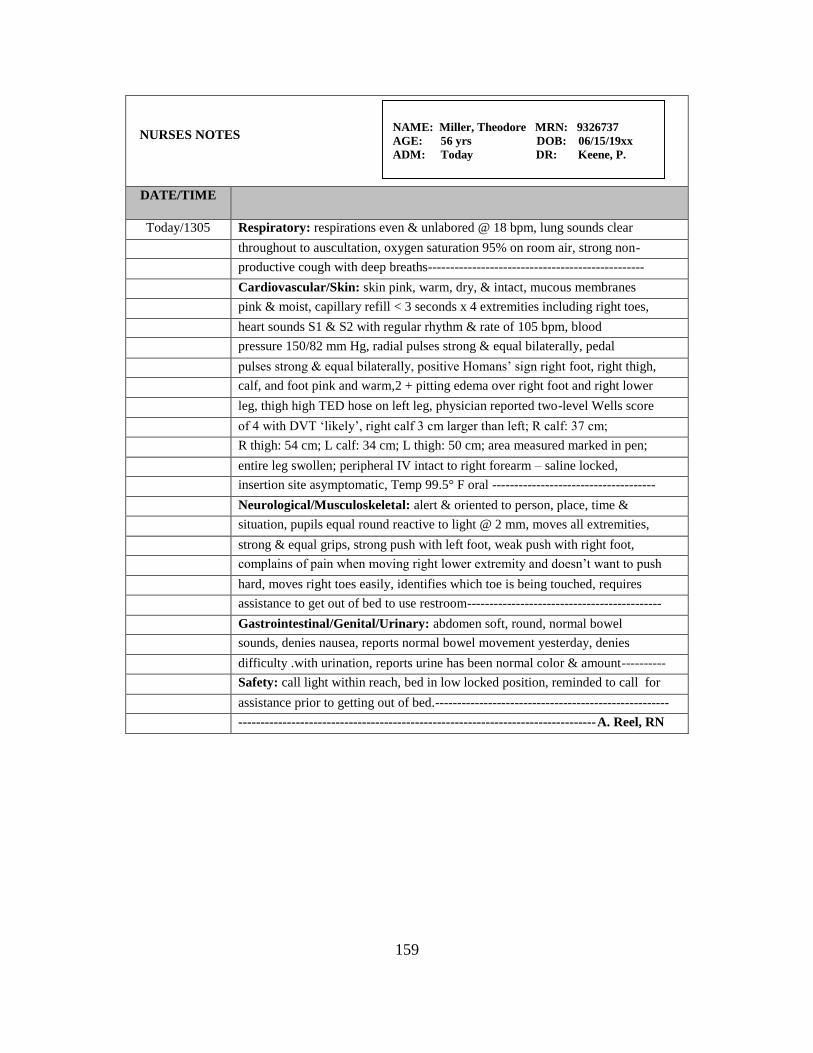
159
NURSES NOTES
DATE/TIME
Today/1305 Respiratory: respirations even & unlabored @ 18 bpm, lung sounds clear
throughout to auscultation, oxygen saturation 95% on room air, strong non-
productive cough with deep breaths-------------------------------------------------
Cardiovascular/Skin: skin pink, warm, dry, & intact, mucous membranes
pink & moist, capillary refill < 3 seconds x 4 extremities including right toes,
heart sounds S1 & S2 with regular rhythm & rate of 105 bpm, blood
pressure 150/82 mm Hg, radial pulses strong & equal bilaterally, pedal
pulses strong & equal bilaterally, positive Homans’ sign right foot, right thigh,
calf, and foot pink and warm,2 + pitting edema over right foot and right lower
leg, thigh high TED hose on left leg, physician reported two-level Wells score
of 4 with DVT ‘likely’, right calf 3 cm larger than left; R calf: 37 cm;
R thigh: 54 cm; L calf: 34 cm; L thigh: 50 cm; area measured marked in pen;
entire leg swollen; peripheral IV intact to right forearm – saline locked,
insertion site asymptomatic, Temp 99.5° F oral -------------------------------------
Neurological/Musculoskeletal: alert & oriented to person, place, time &
situation, pupils equal round reactive to light @ 2 mm, moves all extremities,
strong & equal grips, strong push with left foot, weak push with right foot,
complains of pain when moving right lower extremity and doesn’t want to push
hard, moves right toes easily, identifies which toe is being touched, requires
assistance to get out of bed to use restroom--------------------------------------------
Gastrointestinal/Genital/Urinary: abdomen soft, round, normal bowel
sounds, denies nausea, reports normal bowel movement yesterday, denies
difficulty .with urination, reports urine has been normal color & amount----------
Safety: call light within reach, bed in low locked position, reminded to call for
assistance prior to getting out of bed.-----------------------------------------------------
---------------------------------------------------------------------------------A. Reel, RN
NAME: Miller, Theodore MRN: 9326737
AGE: 56 yrs DOB: 06/15/19xx
ADM: Today DR: Keene, P.
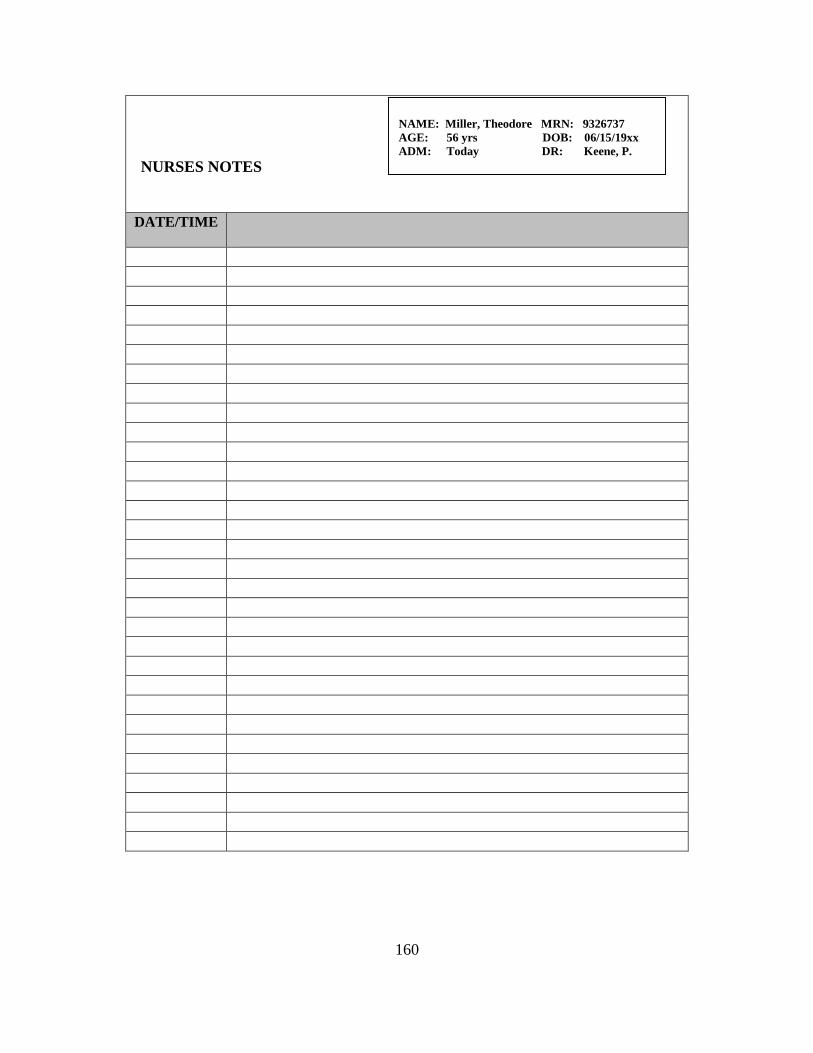
160
NURSES NOTES
DATE/TIME
NAME: Miller, Theodore MRN: 9326737
AGE: 56 yrs DOB: 06/15/19xx
ADM: Today DR: Keene, P.
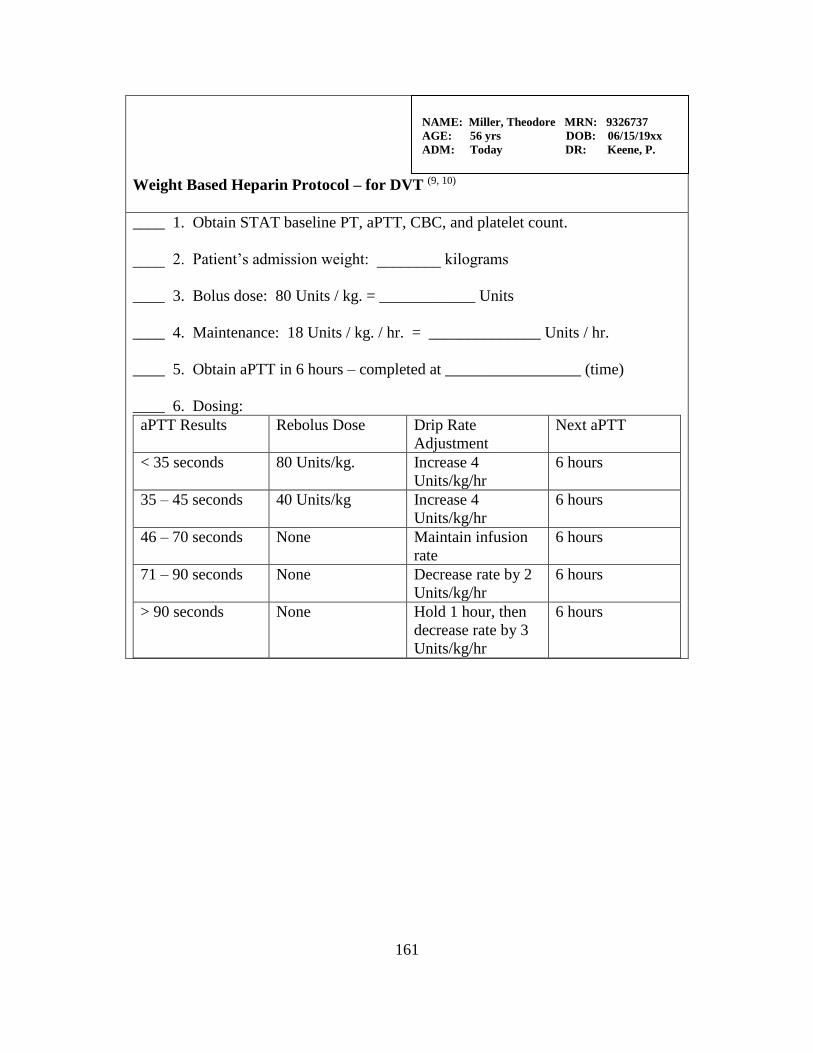
161
Weight Based Heparin Protocol – for DVT (9, 10)
____ 1. Obtain STAT baseline PT, aPTT, CBC, and platelet count.
____ 2. Patient’s admission weight: ________ kilograms
____ 3. Bolus dose: 80 Units / kg. = ____________ Units
____ 4. Maintenance: 18 Units / kg. / hr. = ______________ Units / hr.
____ 5. Obtain aPTT in 6 hours – completed at _________________ (time)
____ 6. Dosing:
aPTT Results Rebolus Dose Drip Rate
Adjustment
Next aPTT
< 35 seconds 80 Units/kg. Increase 4
Units/kg/hr
6 hours
35 – 45 seconds 40 Units/kg Increase 4
Units/kg/hr
6 hours
46 – 70 seconds None Maintain infusion
rate
6 hours
71 – 90 seconds None Decrease rate by 2
Units/kg/hr
6 hours
> 90 seconds None Hold 1 hour, then
decrease rate by 3
Units/kg/hr
6 hours
NAME: Miller, Theodore MRN: 9326737
AGE: 56 yrs DOB: 06/15/19xx
ADM: Today DR: Keene, P.
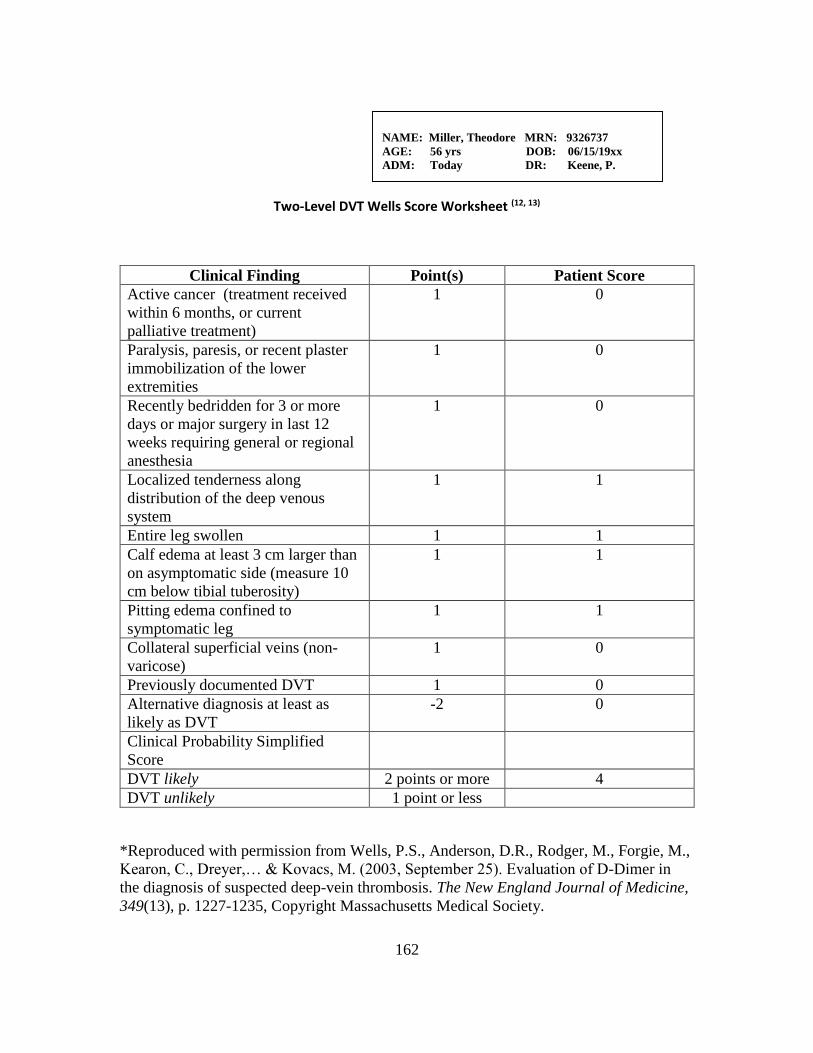
162
Two-Level DVT Wells Score Worksheet (12, 13)
Clinical Finding Point(s) Patient Score
Active cancer (treatment received
within 6 months, or current
palliative treatment)
1 0
Paralysis, paresis, or recent plaster
immobilization of the lower
extremities
1 0
Recently bedridden for 3 or more
days or major surgery in last 12
weeks requiring general or regional
anesthesia
1 0
Localized tenderness along
distribution of the deep venous
system
1 1
Entire leg swollen 1 1
Calf edema at least 3 cm larger than
on asymptomatic side (measure 10
cm below tibial tuberosity)
1 1
Pitting edema confined to
symptomatic leg
1 1
Collateral superficial veins (non-
varicose)
1 0
Previously documented DVT 1 0
Alternative diagnosis at least as
likely as DVT
-2 0
Clinical Probability Simplified
Score
DVT likely 2 points or more 4
DVT unlikely 1 point or less
*Reproduced with permission from Wells, P.S., Anderson, D.R., Rodger, M., Forgie, M.,
Kearon, C., Dreyer,… & Kovacs, M. (2003, September 25). Evaluation of D-Dimer in
the diagnosis of suspected deep-vein thrombosis. The New England Journal of Medicine,
349(13), p. 1227-1235, Copyright Massachusetts Medical Society.
NAME: Miller, Theodore MRN: 9326737
AGE: 56 yrs DOB: 06/15/19xx
ADM: Today DR: Keene, P.
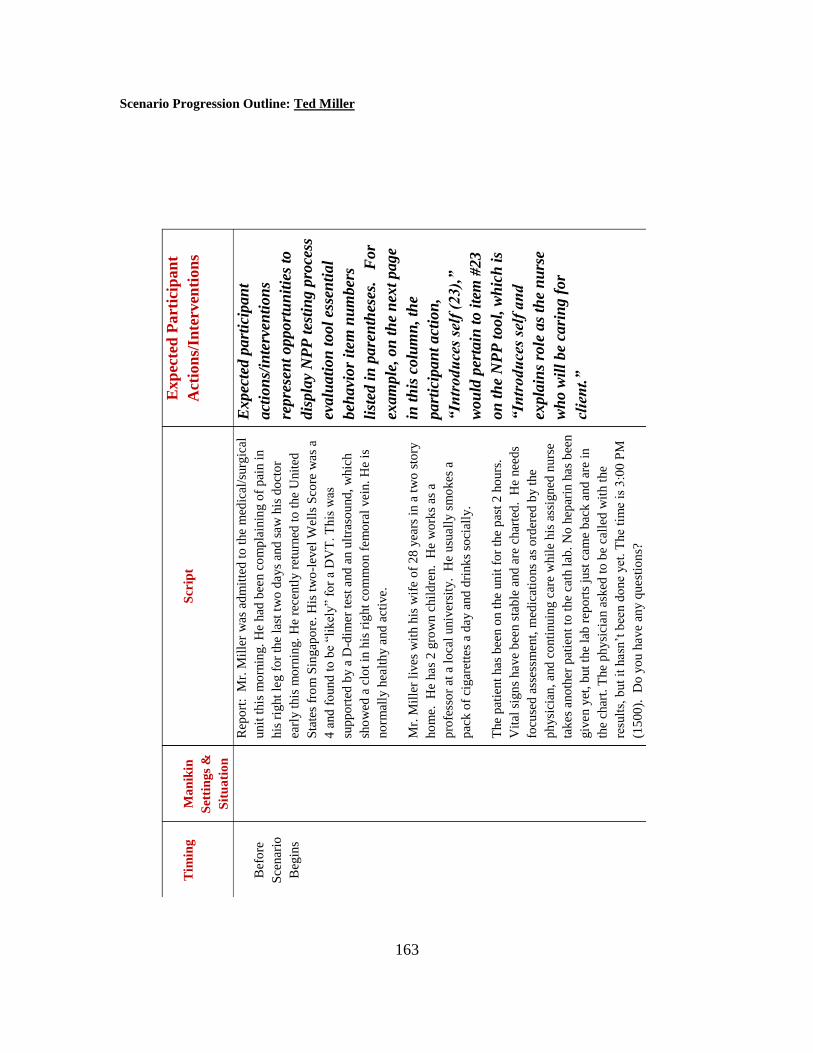
163
Scenario Progression Outline: Ted Miller
Tim
ing
Ma
nik
in
Set
tin
gs
&
Sit
ua
tio
n
Scr
ipt
Exp
ecte
d P
art
icip
an
t
Act
ion
s/In
terv
enti
on
s
Bef
ore
Sce
nar
io
Beg
ins
R
epo
rt:
Mr.
Mil
ler
was
ad
mit
ted
to
the
med
ical
/surg
ical
unit
this
mo
rnin
g.
He
had
bee
n c
om
pla
inin
g o
f p
ain i
n
his
rig
ht
leg f
or
the
last
tw
o d
ays
and
saw
his
do
cto
r
earl
y t
his
mo
rnin
g.
He
rece
ntl
y r
eturn
ed t
o t
he
Unit
ed
Sta
tes
fro
m S
ingap
ore
. H
is t
wo
-lev
el W
ells
Sco
re w
as
a
4 a
nd
fo
und
to
be
“lik
ely”
for
a D
VT
. T
his
was
sup
po
rted
by a
D-d
imer
tes
t and
an u
ltra
sou
nd
, w
hic
h
sho
wed
a c
lot
in h
is r
ight
com
mo
n f
em
ora
l vei
n.
He
is
no
rmal
ly h
ealt
hy a
nd
act
ive.
Mr.
Mil
ler
lives
wit
h h
is w
ife
of
28
yea
rs i
n a
tw
o s
tory
ho
me.
H
e has
2 g
row
n c
hil
dre
n.
He
wo
rks
as a
pro
fess
or
at a
lo
cal
univ
ersi
ty.
He
usu
all
y s
mo
kes
a
pac
k o
f ci
gar
ette
s a
day a
nd
dri
nk
s so
cial
ly.
The
pat
ient
has
bee
n o
n t
he
un
it f
or
the
pas
t 2
ho
urs
.
Vit
al s
ign
s have
bee
n s
tab
le a
nd
are
char
ted
. H
e nee
ds
focu
sed
ass
essm
ent,
med
icat
ions
as o
rder
ed b
y t
he
ph
ysi
cian
, and
co
nti
nuin
g c
are
whil
e h
is a
ssig
ned
nurs
e
takes
ano
ther
pat
ien
t to
the
cath
lab
. N
o h
epar
in h
as
bee
n
giv
en y
et,
but
the
lab
rep
ort
s ju
st c
am
e b
ack a
nd
are
in
the
char
t. T
he
ph
ysi
cian a
sked
to
be
call
ed w
ith t
he
resu
lts,
but
it h
asn
’t b
een d
one
yet
. T
he
tim
e is
3:0
0 P
M
(15
00
).
Do y
ou h
ave
any q
uest
ion
s?
Expec
ted p
art
icip
an
t
act
ion
s/in
terv
enti
on
s
repre
sen
t opport
un
itie
s to
dis
pla
y N
PP
tes
tin
g p
roce
ss
evalu
ati
on
to
ol
esse
nti
al
beh
avi
or
item
nu
mber
s
list
ed i
n p
are
nth
eses
. F
or
exam
ple
, on
th
e n
ext
page
in t
his
colu
mn
, th
e
part
icip
an
t act
ion
,
“In
trodu
ces
self
(23),
”
wou
ld p
erta
in t
o i
tem
#23
on
th
e N
PP
tool,
wh
ich
is
“In
trodu
ces
self
an
d
expla
ins
role
as
the
nu
rse
wh
o w
ill
be
cari
ng f
or
clie
nt.
”
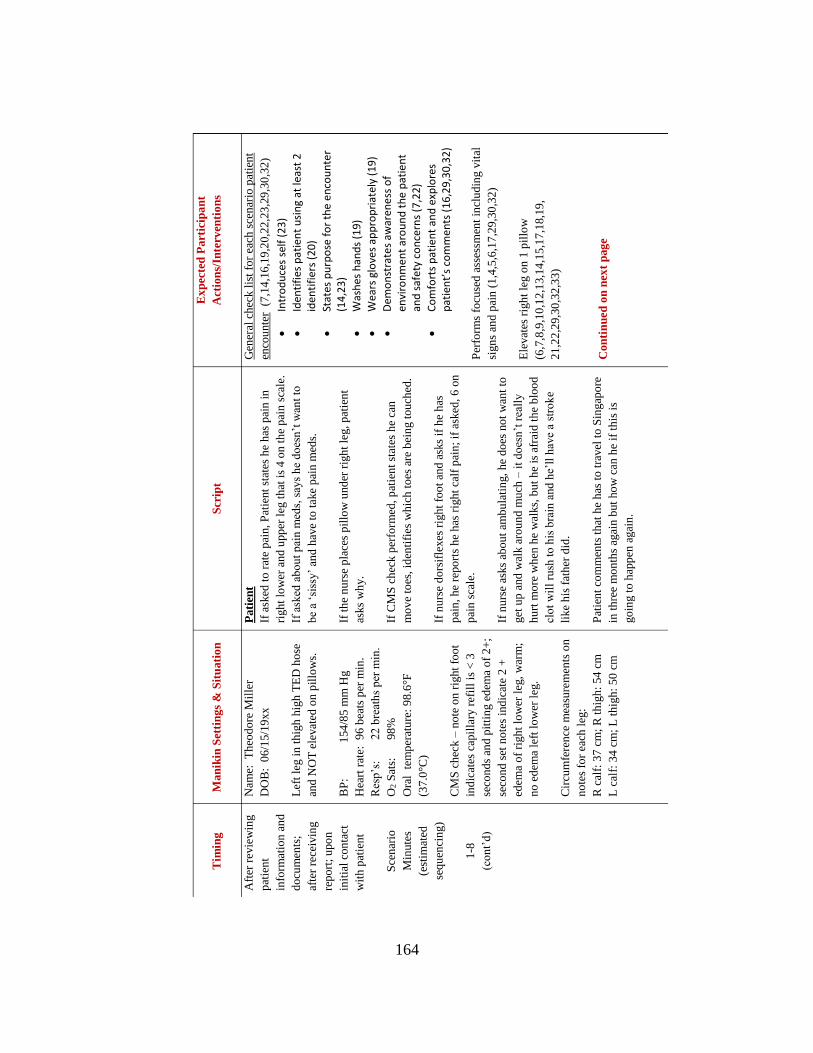
164
Tim
ing
Man
ikin
Set
tin
gs
& S
itu
ati
on
Scr
ipt
Ex
pec
ted
Part
icip
an
t
Act
ion
s/In
terv
enti
on
s
Aft
er r
evie
win
g
pat
ien
t
info
rmat
ion
an
d
do
cum
ents
;
afte
r re
ceiv
ing
rep
ort
; u
po
n
init
ial
con
tact
wit
h p
atie
nt
Sce
nar
io
Min
ute
s
(est
imat
ed
seq
uen
cin
g)
1-8
(co
nt’
d)
Nam
e:
Th
eod
ore
Mil
ler
DO
B:
06
/15/1
9xx
Lef
t le
g i
n t
hig
h h
igh
TE
D h
ose
and
NO
T e
levat
ed o
n p
illo
ws.
BP
:
154
/85
mm
Hg
Hea
rt r
ate:
9
6 b
eats
per
min
.
Res
p’s
:
22
bre
ath
s p
er m
in.
O2 S
ats:
98
%
Ora
l t
emp
erat
ure
: 9
8.6
°F
(37
.0°C
)
CM
S c
hec
k –
no
te o
n r
ight
foo
t
ind
icat
es c
apil
lary
ref
ill
is <
3
seco
nd
s an
d p
itti
ng e
dem
a o
f 2
+;
seco
nd
set
no
tes
ind
icat
e 2
+
edem
a o
f ri
gh
t lo
wer
leg
, w
arm
;
no
ed
ema
left
lo
wer
leg
.
Cir
cum
fere
nce
mea
sure
men
ts o
n
no
tes
for
each
leg
:
R c
alf:
37
cm
; R
th
igh
: 54
cm
L c
alf:
34
cm
; L
th
igh
: 5
0 c
m
Pati
ent
If a
sked
to
rat
e p
ain, P
atie
nt
stat
es h
e h
as p
ain
in
righ
t lo
wer
an
d u
pp
er l
eg t
hat
is
4 o
n t
he
pai
n s
cale
.
If a
sked
ab
ou
t p
ain
med
s, s
ays
he
do
esn
’t w
ant
to
be
a ‘s
issy
’ an
d h
ave
to t
ake
pai
n m
eds.
If t
he
nu
rse
pla
ces
pil
low
und
er r
igh
t le
g,
pat
ien
t
asks
wh
y.
If C
MS
ch
eck p
erfo
rmed
, p
atie
nt
stat
es h
e ca
n
mo
ve
toes
, id
enti
fies
wh
ich
to
es a
re b
ein
g t
ou
ched
.
If n
urs
e d
ors
ifle
xes
rig
ht
foo
t an
d a
sks
if h
e h
as
pai
n, h
e re
po
rts
he
has
rig
ht
calf
pai
n;
if a
sked
, 6
on
pai
n s
cale
.
If n
urs
e as
ks
abo
ut
amb
ula
tin
g,
he
do
es n
ot
wan
t to
get
up
and
wal
k a
rou
nd
mu
ch –
it
do
esn
’t r
eall
y
hu
rt m
ore
wh
en h
e w
alks,
bu
t h
e is
afr
aid
th
e b
loo
d
clo
t w
ill
rush
to
his
bra
in a
nd
he’
ll h
ave
a st
rok
e
like
his
fat
her
did
.
Pat
ien
t co
mm
ents
th
at h
e h
as t
o t
ravel
to
Sin
gap
ore
in t
hre
e m
on
ths
agai
n b
ut
ho
w c
an h
e if
th
is i
s
go
ing t
o h
app
en a
gai
n.
Gen
eral
ch
eck l
ist
for
each
sce
nar
io p
atie
nt
enco
unte
r (
7,1
4,1
6,1
9,2
0,2
2,2
3,2
9,3
0,3
2)
In
tro
du
ces
self
(2
3)
Id
enti
fies
pat
ien
t u
sin
g at
leas
t 2
id
enti
fier
s (2
0)
St
ates
pu
rpo
se f
or
the
en
cou
nte
r (1
4,2
3)
W
ash
es h
and
s (1
9)
W
ears
glo
ves
app
rop
riat
ely
(19
)
D
emo
nst
rate
s aw
aren
ess
of
envi
ron
me
nt
aro
un
d t
he
pat
ien
t an
d s
afet
y co
nce
rns
(7,2
2)
C
om
fort
s p
atie
nt
and
exp
lore
s p
atie
nt’
s co
mm
ents
(1
6,2
9,3
0,3
2)
Per
form
s fo
cuse
d a
sses
smen
t in
clu
din
g v
ital
sign
s an
d p
ain
(1
,4,5
,6,1
7,2
9,3
0,3
2)
Ele
vat
es r
igh
t le
g o
n 1
pil
low
(6,7
,8,9
,10
,12
,13,1
4,1
5,1
7,1
8,1
9,
21
,22
,29,3
0,3
2,3
3)
Con
tin
ued
on
nex
t p
ag
e
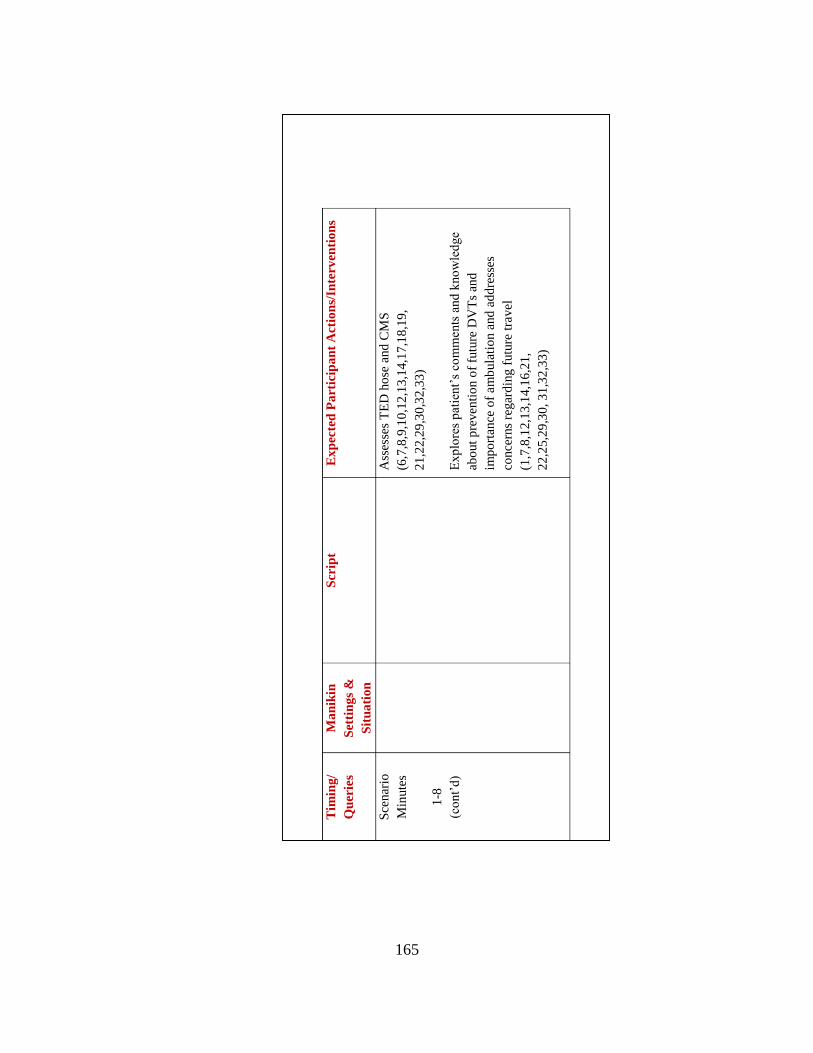
165
Tim
ing
/
Qu
erie
s
Ma
nik
in
Set
tin
gs
&
Sit
ua
tio
n
Scr
ipt
E
xp
ecte
d P
art
icip
an
t A
ctio
ns/
Inte
rven
tio
ns
Sce
nar
io
Min
ute
s
1-8
(co
nt’
d)
Ass
esse
s T
ED
ho
se a
nd
CM
S
(6,7
,8,9
,10
,12
,13
,14,1
7,1
8,1
9,
21
,22,2
9,3
0,3
2,3
3)
Exp
lore
s p
atie
nt’
s co
mm
ents
and
kno
wle
dge
abo
ut
pre
ven
tio
n o
f fu
ture
DV
Ts
and
imp
ort
ance
of
am
bula
tio
n a
nd
ad
dre
sses
conce
rns
regar
din
g f
utu
re t
rav
el
(1,7
,8,1
2,1
3,1
4,1
6,2
1,
22
,25,2
9,3
0, 3
1,3
2,3
3)
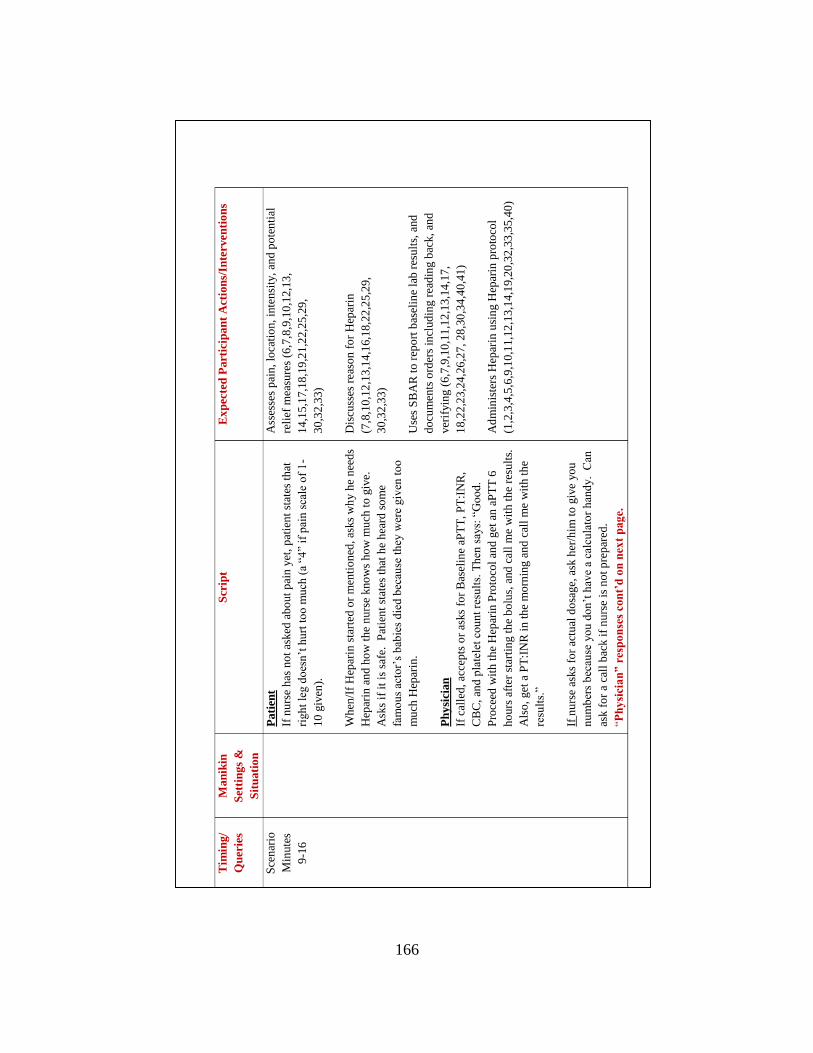
166
Tim
ing
/
Qu
erie
s
Man
ikin
Set
tin
gs
&
Sit
uati
on
Scr
ipt
E
xp
ecte
d P
art
icip
an
t A
ctio
ns/
Inte
rven
tio
ns
Sce
nar
io
Min
ute
s
9-1
6
P
ati
ent
If n
urs
e h
as n
ot
asked
ab
out
pai
n y
et,
pat
ien
t st
ates
th
at
righ
t le
g d
oes
n’t
hu
rt t
oo
mu
ch (
a “4
” if
pai
n s
cale
of
1-
10
giv
en).
Wh
en/I
f H
epar
in s
tart
ed o
r m
enti
on
ed, as
ks
wh
y h
e n
eed
s
Hep
arin
an
d h
ow
th
e n
urs
e kno
ws
ho
w m
uch
to
giv
e.
Ask
s if
it
is s
afe.
P
atie
nt
stat
es t
hat
he
hea
rd s
om
e
fam
ou
s ac
tor’
s b
abie
s d
ied
bec
ause
th
ey w
ere
giv
en t
oo
mu
ch H
epar
in.
Ph
ysi
cian
If c
alle
d,
acce
pts
or
asks
for
Bas
elin
e aP
TT
, P
T:I
NR
,
CB
C,
and
pla
tele
t co
un
t re
sult
s. T
hen
say
s: “
Go
od
.
Pro
ceed
wit
h t
he
Hep
arin
Pro
toco
l an
d g
et a
n a
PT
T 6
ho
urs
aft
er s
tart
ing t
he
bo
lus,
and
cal
l m
e w
ith
th
e re
sult
s.
Als
o,
get
a P
T:I
NR
in
th
e m
orn
ing a
nd
cal
l m
e w
ith
th
e
resu
lts.
”
If n
urs
e as
ks
for
actu
al d
osa
ge,
ask
her
/him
to
giv
e yo
u
nu
mb
ers
bec
ause
yo
u d
on
’t h
ave
a ca
lcu
lato
r h
and
y.
Can
ask f
or
a ca
ll b
ack i
f n
urs
e is
no
t p
rep
ared
.
“Ph
ysi
cia
n”
res
po
nse
s co
nt’
d o
n n
ext
pag
e.
Ass
esse
s p
ain
, lo
cati
on,
inte
nsi
ty,
and
po
ten
tial
reli
ef m
easu
res
(6,7
,8,9
,10
,12,1
3,
14
,15
,17,1
8,1
9,2
1,2
2,2
5,2
9,
30
,32
,33)
Dis
cuss
es r
easo
n f
or
Hep
arin
(7,8
,10
,12
,13
,14
,16,1
8,2
2,2
5,2
9,
30
,32
,33)
Use
s S
BA
R t
o r
epo
rt b
asel
ine
lab r
esu
lts,
and
do
cum
ents
ord
ers
incl
ud
ing r
ead
ing b
ack,
and
ver
ifyin
g (
6,7
,9,1
0,1
1,1
2,1
3,1
4,1
7,
18
,22
,23,2
4,2
6,2
7, 28
,30
,34
,40,4
1)
Ad
min
iste
rs H
epar
in u
sin
g H
epar
in p
roto
col
(1,2
,3,4
,5,6
,9,1
0,1
1,1
2,1
3,1
4,1
9,2
0,3
2,3
3,3
5,4
0)
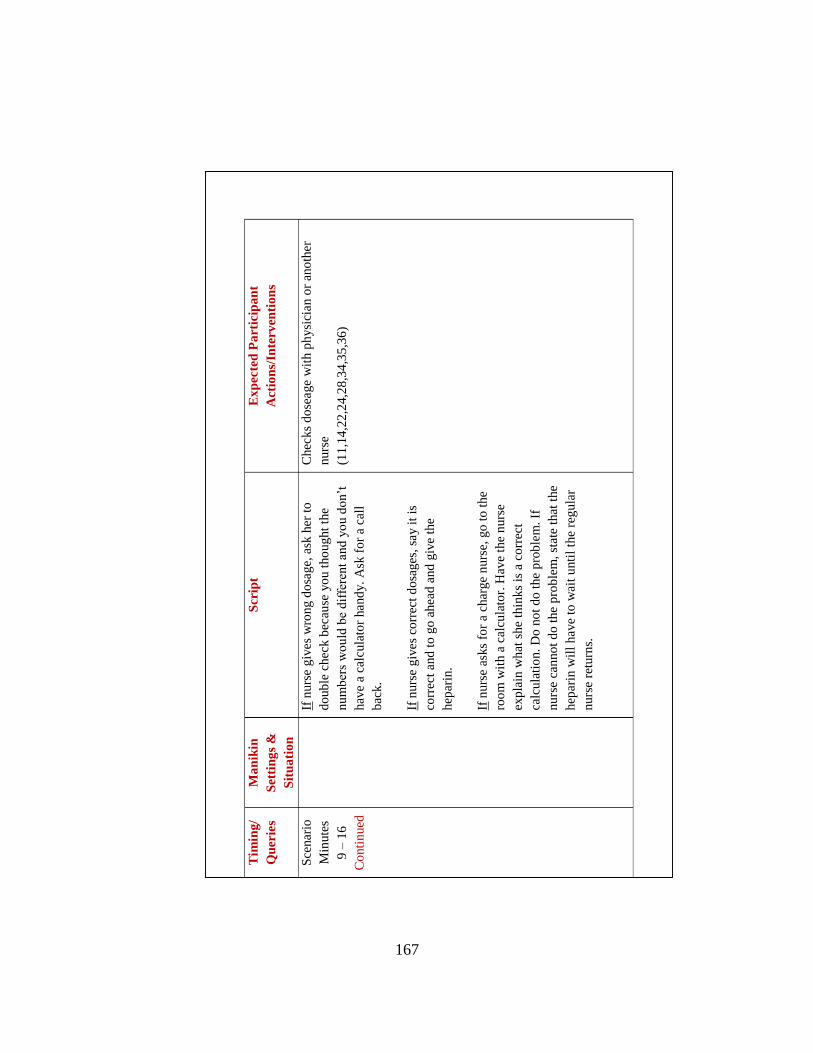
167
Tim
ing
/
Qu
erie
s
Ma
nik
in
Set
tin
gs
&
Sit
ua
tio
n
Scr
ipt
E
xp
ecte
d P
art
icip
an
t
Act
ion
s/In
terv
enti
on
s
Sce
nar
io
Min
ute
s
9 –
16
Co
nti
nued
If n
urs
e g
ives
wro
ng d
osa
ge,
ask
her
to
do
ub
le c
hec
k b
ecau
se y
ou t
ho
ug
ht
the
nu
mb
ers
wo
uld
be
dif
fere
nt
an
d y
ou d
on’t
hav
e a
calc
ula
tor
hand
y.
Ask
fo
r a
call
bac
k.
If n
urs
e g
ives
corr
ect
do
sages
, sa
y i
t is
corr
ect
and
to
go
ahea
d a
nd
giv
e th
e
hep
arin
.
If n
urs
e as
ks
for
a ch
arge
nurs
e, g
o t
o t
he
roo
m w
ith a
cal
cula
tor.
Hav
e th
e n
urs
e
exp
lain
wh
at s
he
thin
ks
is a
co
rrec
t
calc
ula
tio
n.
Do
no
t d
o t
he
pro
ble
m.
If
nurs
e ca
nno
t d
o t
he
pro
ble
m,
stat
e th
at t
he
hep
arin
wil
l have
to w
ait
unti
l th
e re
gula
r
nurs
e re
turn
s.
Chec
ks
do
seage
wit
h p
hysi
cian o
r an
oth
er
nurs
e
(11
,14
,22
,24,2
8,3
4,3
5,3
6)
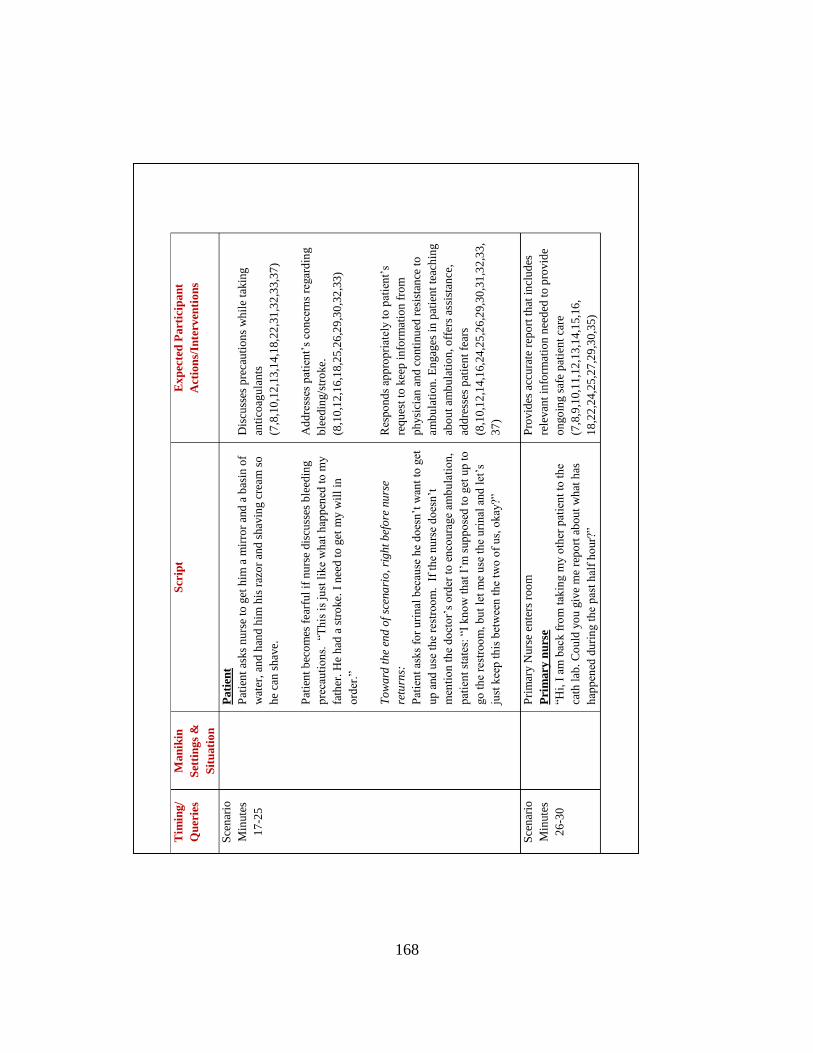
168
Tim
ing
/
Qu
erie
s
Man
ikin
Set
tin
gs
&
Sit
uati
on
Scr
ipt
E
xp
ecte
d P
art
icip
an
t
Act
ion
s/In
terv
enti
on
s
Sce
nar
io
Min
ute
s
17
-25
Pati
ent
Pat
ien
t as
ks
nu
rse
to g
et h
im a
mir
ror
and
a b
asin
of
wat
er,
and
han
d h
im h
is r
azo
r an
d s
hav
ing c
ream
so
he
can
sh
ave.
Pat
ien
t b
eco
mes
fea
rfu
l if
nu
rse
dis
cuss
es b
leed
ing
pre
cau
tio
ns.
“T
his
is
just
lik
e w
hat
hap
pen
ed t
o m
y
fath
er.
He
had
a s
tro
ke.
I n
eed
to
get
my w
ill
in
ord
er.”
To
wa
rd t
he
end
of
scen
ari
o,
rig
ht
bef
ore
nu
rse
retu
rns:
Pat
ien
t as
ks
for
uri
nal
bec
ause
he
do
esn
’t w
ant
to g
et
up
and
use
th
e re
stro
om
. I
f th
e nu
rse
do
esn
’t
men
tio
n t
he
do
cto
r’s
ord
er t
o e
nco
ura
ge
amb
ula
tio
n,
pat
ien
t st
ates
: “I
kn
ow
th
at I
’m s
up
po
sed
to g
et u
p t
o
go
th
e re
stro
om
, b
ut
let
me
use
the
uri
nal
and
let
’s
just
kee
p t
his
bet
wee
n t
he
two
of
us,
okay
?”
Dis
cuss
es p
reca
uti
on
s w
hil
e ta
kin
g
anti
coag
ula
nts
(7,8
,10
,12
,13
,14
,18,2
2,3
1,3
2,3
3,3
7)
Ad
dre
sses
pat
ien
t’s
con
cern
s re
gar
din
g
ble
edin
g/s
tro
ke.
(8,1
0,1
2,1
6,1
8,2
5,2
6,2
9,3
0,3
2,3
3)
Res
po
nd
s ap
pro
pri
atel
y t
o p
atie
nt’
s
req
ues
t to
kee
p i
nfo
rmat
ion
fro
m
ph
ysi
cian
an
d c
onti
nu
ed r
esis
tan
ce t
o
amb
ula
tion
. E
ngag
es i
n p
atie
nt
teac
hin
g
abo
ut
amb
ula
tio
n, o
ffer
s as
sist
ance
,
add
ress
es p
atie
nt
fear
s
(8,1
0,1
2,1
4,1
6,2
4,2
5,2
6,2
9,3
0,3
1,3
2,3
3,
37
)
Sce
nar
io
Min
ute
s
26
-30
P
rim
ary N
urs
e en
ters
ro
om
Pri
mary
nu
rse
“Hi,
I a
m b
ack f
rom
tak
ing m
y o
ther
pat
ien
t to
th
e
cath
lab
. C
ou
ld y
ou
giv
e m
e re
po
rt a
bou
t w
hat
has
hap
pen
ed d
uri
ng t
he
pas
t h
alf
ho
ur?
”
Pro
vid
es a
ccu
rate
rep
ort
th
at i
ncl
ud
es
rele
van
t in
form
atio
n n
eed
ed t
o p
rovid
e
on
go
ing s
afe
pat
ien
t ca
re
(7,8
,9,1
0,1
1,1
2,1
3,1
4,1
5,1
6,
18
,22
,24,2
5,2
7,2
9,3
0,3
5)
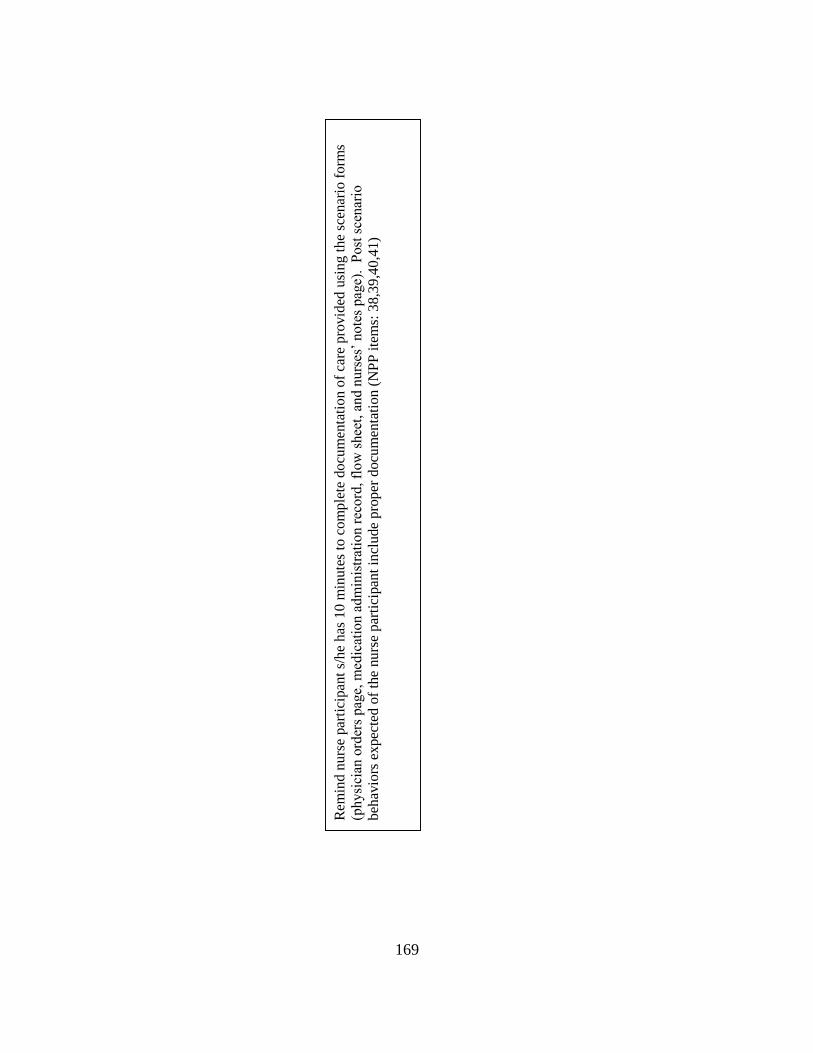
169
Rem
ind
nu
rse
par
tici
pan
t s/
he
has
10 m
inute
s to
com
ple
te d
ocu
men
tati
on o
f ca
re p
rovid
ed u
sin
g t
he
scen
ario
fo
rms
(ph
ysi
cian
ord
ers
pag
e, m
edic
atio
n a
dm
inis
trat
ion r
ecord
, fl
ow
shee
t, a
nd n
urs
es’
no
tes
pag
e).
Post
sce
nar
io
beh
avio
rs e
xpec
ted o
f th
e nurs
e par
tici
pan
t in
clude
pro
per
docu
men
tati
on (
NP
P i
tem
s: 3
8,3
9,4
0,4
1)
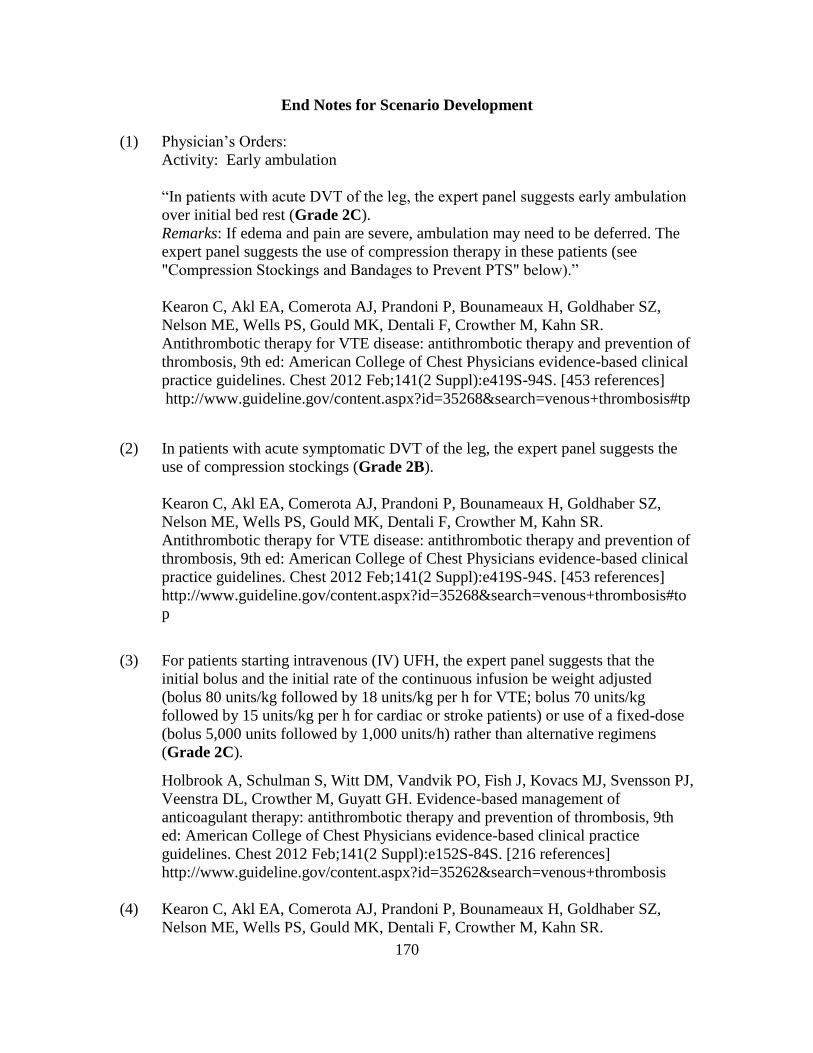
170
End Notes for Scenario Development
(1) Physician’s Orders:
Activity: Early ambulation
“In patients with acute DVT of the leg, the expert panel suggests early ambulation
over initial bed rest (Grade 2C).
Remarks: If edema and pain are severe, ambulation may need to be deferred. The
expert panel suggests the use of compression therapy in these patients (see
"Compression Stockings and Bandages to Prevent PTS" below).”
Kearon C, Akl EA, Comerota AJ, Prandoni P, Bounameaux H, Goldhaber SZ,
Nelson ME, Wells PS, Gould MK, Dentali F, Crowther M, Kahn SR.
Antithrombotic therapy for VTE disease: antithrombotic therapy and prevention of
thrombosis, 9th ed: American College of Chest Physicians evidence-based clinical
practice guidelines. Chest 2012 Feb;141(2 Suppl):e419S-94S. [453 references]
http://www.guideline.gov/content.aspx?id=35268&search=venous+thrombosis#tp
(2) In patients with acute symptomatic DVT of the leg, the expert panel suggests the
use of compression stockings (Grade 2B).
Kearon C, Akl EA, Comerota AJ, Prandoni P, Bounameaux H, Goldhaber SZ,
Nelson ME, Wells PS, Gould MK, Dentali F, Crowther M, Kahn SR.
Antithrombotic therapy for VTE disease: antithrombotic therapy and prevention of
thrombosis, 9th ed: American College of Chest Physicians evidence-based clinical
practice guidelines. Chest 2012 Feb;141(2 Suppl):e419S-94S. [453 references]
http://www.guideline.gov/content.aspx?id=35268&search=venous+thrombosis#to
p
(3) For patients starting intravenous (IV) UFH, the expert panel suggests that the
initial bolus and the initial rate of the continuous infusion be weight adjusted
(bolus 80 units/kg followed by 18 units/kg per h for VTE; bolus 70 units/kg
followed by 15 units/kg per h for cardiac or stroke patients) or use of a fixed-dose
(bolus 5,000 units followed by 1,000 units/h) rather than alternative regimens
(Grade 2C).
Holbrook A, Schulman S, Witt DM, Vandvik PO, Fish J, Kovacs MJ, Svensson PJ,
Veenstra DL, Crowther M, Guyatt GH. Evidence-based management of
anticoagulant therapy: antithrombotic therapy and prevention of thrombosis, 9th
ed: American College of Chest Physicians evidence-based clinical practice
guidelines. Chest 2012 Feb;141(2 Suppl):e152S-84S. [216 references]
http://www.guideline.gov/content.aspx?id=35262&search=venous+thrombosis
(4) Kearon C, Akl EA, Comerota AJ, Prandoni P, Bounameaux H, Goldhaber SZ,
Nelson ME, Wells PS, Gould MK, Dentali F, Crowther M, Kahn SR.
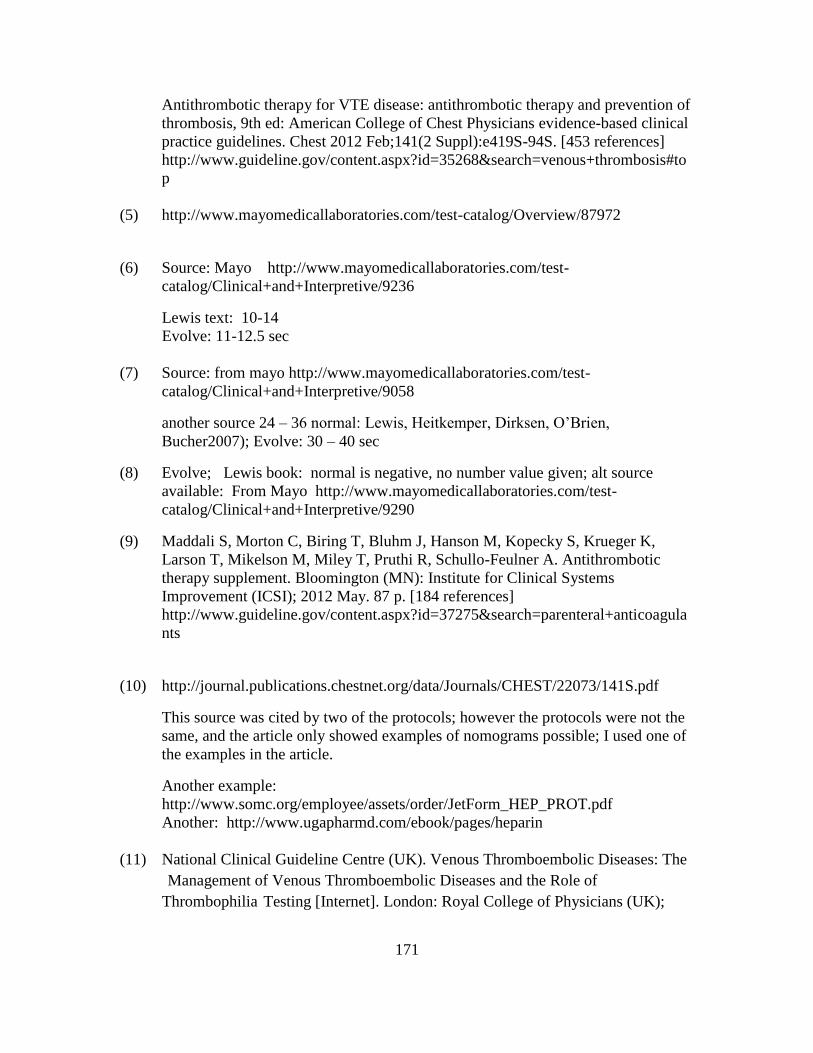
171
Antithrombotic therapy for VTE disease: antithrombotic therapy and prevention of
thrombosis, 9th ed: American College of Chest Physicians evidence-based clinical
practice guidelines. Chest 2012 Feb;141(2 Suppl):e419S-94S. [453 references]
http://www.guideline.gov/content.aspx?id=35268&search=venous+thrombosis#to
p
(5) http://www.mayomedicallaboratories.com/test-catalog/Overview/87972
(6) Source: Mayo http://www.mayomedicallaboratories.com/test-
catalog/Clinical+and+Interpretive/9236
Lewis text: 10-14
Evolve: 11-12.5 sec
(7) Source: from mayo http://www.mayomedicallaboratories.com/test-
catalog/Clinical+and+Interpretive/9058
another source 24 – 36 normal: Lewis, Heitkemper, Dirksen, O’Brien,
Bucher2007); Evolve: 30 – 40 sec
(8) Evolve; Lewis book: normal is negative, no number value given; alt source
available: From Mayo http://www.mayomedicallaboratories.com/test-
catalog/Clinical+and+Interpretive/9290
(9) Maddali S, Morton C, Biring T, Bluhm J, Hanson M, Kopecky S, Krueger K,
Larson T, Mikelson M, Miley T, Pruthi R, Schullo-Feulner A. Antithrombotic
therapy supplement. Bloomington (MN): Institute for Clinical Systems
Improvement (ICSI); 2012 May. 87 p. [184 references]
http://www.guideline.gov/content.aspx?id=37275&search=parenteral+anticoagula
nts
(10) http://journal.publications.chestnet.org/data/Journals/CHEST/22073/141S.pdf
This source was cited by two of the protocols; however the protocols were not the
same, and the article only showed examples of nomograms possible; I used one of
the examples in the article.
Another example:
http://www.somc.org/employee/assets/order/JetForm_HEP_PROT.pdf
Another: http://www.ugapharmd.com/ebook/pages/heparin
(11) National Clinical Guideline Centre (UK). Venous Thromboembolic Diseases: The
Management of Venous Thromboembolic Diseases and the Role of
Thrombophilia Testing [Internet]. London: Royal College of Physicians (UK);
172
2012 Jun. (NICE Clinical Guidelines, No. 144.) Appendix K, Two-level DVT
Wells Score. Available from: https://www.ncbi.nlm.nih.gov/books/NBK132787/
(12) Wells, P.S., Anderson, D.R., Rodger, M., Forgie, M., Kearon, C., Dreyer, J.,
Kovacs, G., Mitchell, M., Lewandowski, B., & Kovacs, M. (2003, September 25).
Evaluation of D-Dimer in the diagnosis of suspected deep-vein thrombosis. In The
New England Journal of Medicine, 349(13), p. 1227-1235.
(13) National Institute for Health and Clinical Excellence. (2012, June). Venous
thromboembolic diseases: Two-level Wells score - templates for deep vein
thrombosis and pulmonary embolism. Retrieved from
http://guidance.nice.org.uk/CG144/ Template WellsScore/doc/English
(14) Lang, E.S., & Wells, P. (2009). Deep vein thrombosis in Evidence-based
emergency medicine.Rowe, B., Lang, E., Brown, M., Houry, D., Newman, D., &
Wyer, P. (Eds.) BMJ Books. Retrieved from
http://literati.credoreference.com.ezproxy1.lib.asu.edu/content/title/wileyebem

173
APPENDIX D
RECRUITMENT NARRATIVE
174
Dear XXXXX,
As you may know, I am a graduate student under the direction of Professor Debra Hagler
in the College of Nursing and Professor Marilyn Thompson in the T. Denny Sanford
School of Social and Family Dynamics at Arizona State University. I am conducting a
research study to develop a protocol for creating and validating simulation scenarios for
measuring nurse competency. The protocol will be applied in the design of an additional
simulation scenario for use with the Nursing Performance Profile (NPP), an instrument
used to assess professional nursing competency. New scenarios are desired to expand the
simulation context of the NPP for assessing nursing behaviors expected of experienced
nurses.
I am recruiting three to five nurses who have a minimum of three years of experience in
adult health / acute care settings, and at least one year of simulation and nursing
supervision. If you agree to participate, your role will involve the completion of a
questionnaire soliciting your input and feedback on the content of a simulation scenario
to be used with the NPP. The Modified Delphi Technique will be used as a structured
method to provide validation of the scenario. If you agree to participate, a simulation
scenario will be sent to you with a questionnaire and your written responses will be
collected along with those of two to four other nurse experts. The responses of the group
will be aggregated and summarized and the scenario will be edited. It will then be
returned to you for any further feedback or input. After the first or second round of
feedback, you may be asked to meet in person with the team to discuss the simulation and
to reach a consensus. The entire process, including my analysis of the feedback, is
expected to take one to three months and may only include two or three rounds of
questionnaires, although additional rounds are possible, if needed to reach consensus.
Your participation in the process will take an estimated maximum of two hours on up to
four occasions, for a total of eight hours. You have the right not to answer any question,
and to stop participation at any time.
Your participation in this study is voluntary. In appreciation of your time, a gift card
worth $25 will be provided if you complete the study. If you have any questions
concerning the research study, please call me at (623) 362-8471.
Thank you so much for considering this request.
Regards,
Janet

175
APPENDIX E
CONFIDENTIALITY FORM
176
Assessing Nursing Competency Using Simulation: A Simulation Design Process
CONFIDENTIALITY STATEMENT
In order to maintain confidentiality, I hereby agree to refrain from discussing or disclosing
any information regarding research instruments to any individual who is not part of the
above research study. I will not make copies, electronic or paper, of any material.
_______________________ ________________________ ______________
Signature of Participant Printed Name Date
_______________________ ________________________ ______________
Signature of Witness Printed Name Date

177
APPENDIX F
CONSENT FORM
178
Assessing Nursing Competency Using Simulation: A Simulation Design Process
I am a graduate student under the direction of Professor Debra Hagler in the College of Nursing and Professor Marilyn
Thompson in the T. Denny Sanford School of Social and Family Dynamics at Arizona State University. I am
conducting a research study to develop a protocol for creating and validating simulation scenarios for measuring nurse
competency. The protocol will be applied in the design of an additional simulation scenario for use with the Nursing
Performance Profile (NPP), an instrument used to assess professional nursing competency. New scenarios are desired
to expand the simulation context of the NPP for assessing nursing behaviors expected of experienced nurses.
I am inviting your participation, which will involve the completion of a questionnaire soliciting your input and
feedback on the content of a simulation scenario to be used with the NPP. You have been chosen because of your
expertise in the areas of adult health / acute care nursing, simulation, and nursing supervision. The Modified Delphi
Technique will be used as a structured method to provide validation of the scenario. If you agree to participate, a
simulation scenario will be sent to you with a questionnaire and your written responses will be collected along with
those of two to four other nurse experts. The confidential responses of the group will be aggregated and summarized
and the scenario will be edited. It will then be returned to you for any further feedback or input. After the first or
second round of feedback, you may be asked to meet in person with the team to discuss the simulation and to reach a
consensus. The entire process, including my analysis of the feedback, is expected to take one to three months and may
only include two or three rounds of questionnaires, although additional rounds are possible, if needed to reach
consensus. Your participation in the process will take an estimated maximum of two hours on up to four occasions, for
a maximum total of eight hours. You have the right not to answer any question, and to stop participation at any time.
Your participation in this study is voluntary. If you choose not to participate or to withdraw from the study at any time,
there will be no penalty. A gift card for $25 will be provided in appreciation of your completion of the study. Although
there is no other personal benefit to you, your participation will provide valuable assistance in the development of a
new simulation scenario to be used to assess nursing competency. There are no foreseeable risks or discomforts related
to your participation.
Your written responses will be confidential, and your identity will only be shared with the team if you agree to meet in
person with the group. Any documentation or questionnaires you complete will be kept in a locked drawer, accessible
only to me. Any written feedback or responses you provide will be shared with the team without identifying you
personally. The results of this study may be used in reports, presentations, or publications but your name will not be
used.
If you have any questions concerning the research study, please contact the research team at: Debbie Hagler, PI, at
[email protected], Marilyn Thompson, co-investigator, at [email protected], or Janet O’Brien, graduate
student, at [email protected]. If you have any questions about your rights as a subject/participant in this research, or if
you feel you have been placed at risk, you can contact the Chair of the Human Subjects Institutional Review Board,
through the ASU Office of Research Integrity and Assurance, at (480) 965-6788. By signing below you are agreeing to
be part of the study.
Thank you,
Janet O’Brien, MA, MEd, RN, CHSE, Ph.D. Candidate
Measurement, Statistics, and Methodological Studies
Educational Psychology, Mary Lou Fulton Teachers College, Arizona State University
Name: _______________________________________ (printed)
Signature:______________________________________ Date:__________________

179
APPENDIX G
FEEDBACK FORM – ROUND 1
180
Feedback Form ID # (please provide the ID # assigned on your instructions):______________________________ Use this Feedback Form along with the Scenario and the NPP Instrument. Please check one of the columns (1-3) for each section. Do not leave any section blank. If you choose not to answer a question, type the word “Skip” in Column 1 for that question. Feel free to use more space than is provided if needed. Column 1: You are satisfied with the content as written. You do not feel any changes are needed. If you check column 1, do not complete columns 2 – 6. Column 2: If you feel the content is partially or mostly acceptable, but needs some editing or changes, check column 2, “Accept With Changes”. Please describe the changes in column 4. Be as specific as possible. In column 5, include the evidence-based reference for any changes in treatment or management. Columns 4 and 5 are color coded blue to show they are completed if you check column 2. Column 3: If you feel part of the content in a section needs to be deleted, rather than edited, please check column 3. Then, identify the content to be deleted in column 6 along with a rationale. Column 6 is color coded green to show it is completed if you check column 3.
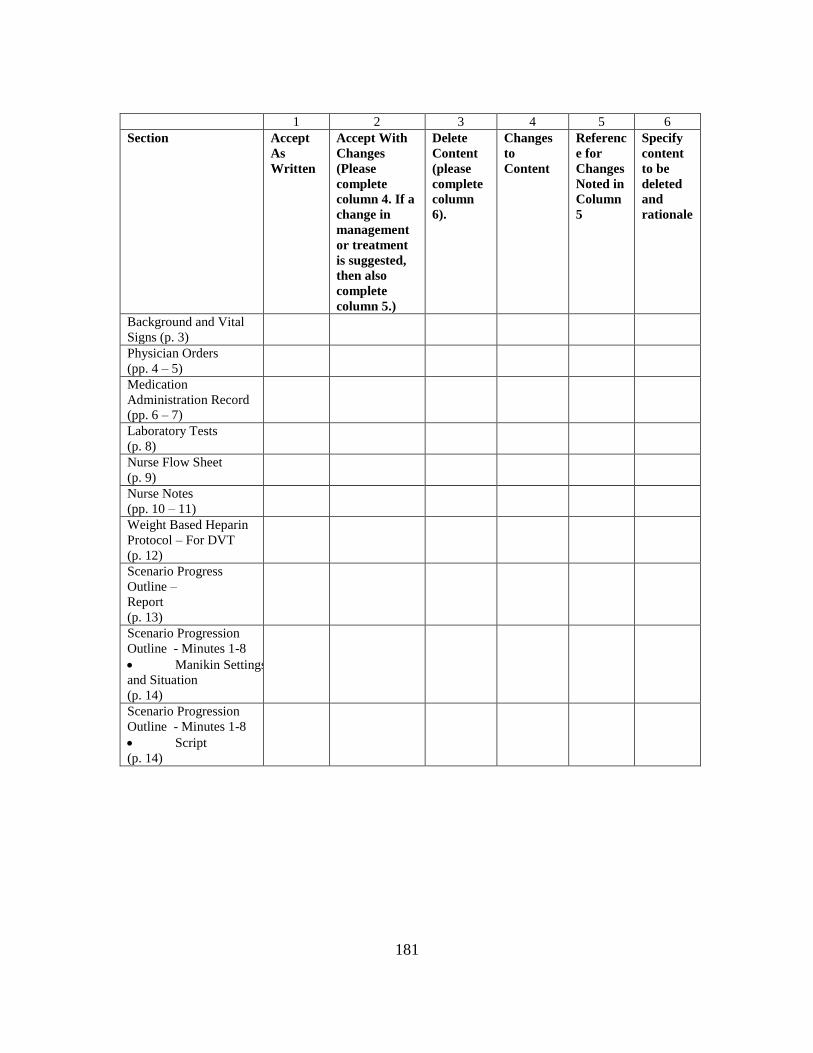
181
1 2 3 4 5 6
Section Accept
As
Written
Accept With
Changes
(Please
complete
column 4. If a
change in
management
or treatment
is suggested,
then also
complete
column 5.)
Delete
Content
(please
complete
column
6).
Changes
to
Content
Referenc
e for
Changes
Noted in
Column
5
Specify
content
to be
deleted
and
rationale
Background and Vital
Signs (p. 3)
Physician Orders
(pp. 4 – 5)
Medication
Administration Record
(pp. 6 – 7)
Laboratory Tests
(p. 8)
Nurse Flow Sheet
(p. 9)
Nurse Notes
(pp. 10 – 11)
Weight Based Heparin
Protocol – For DVT
(p. 12)
Scenario Progress
Outline –
Report
(p. 13)
Scenario Progression
Outline - Minutes 1-8
Manikin Settings
and Situation
(p. 14)
Scenario Progression
Outline - Minutes 1-8
Script
(p. 14)
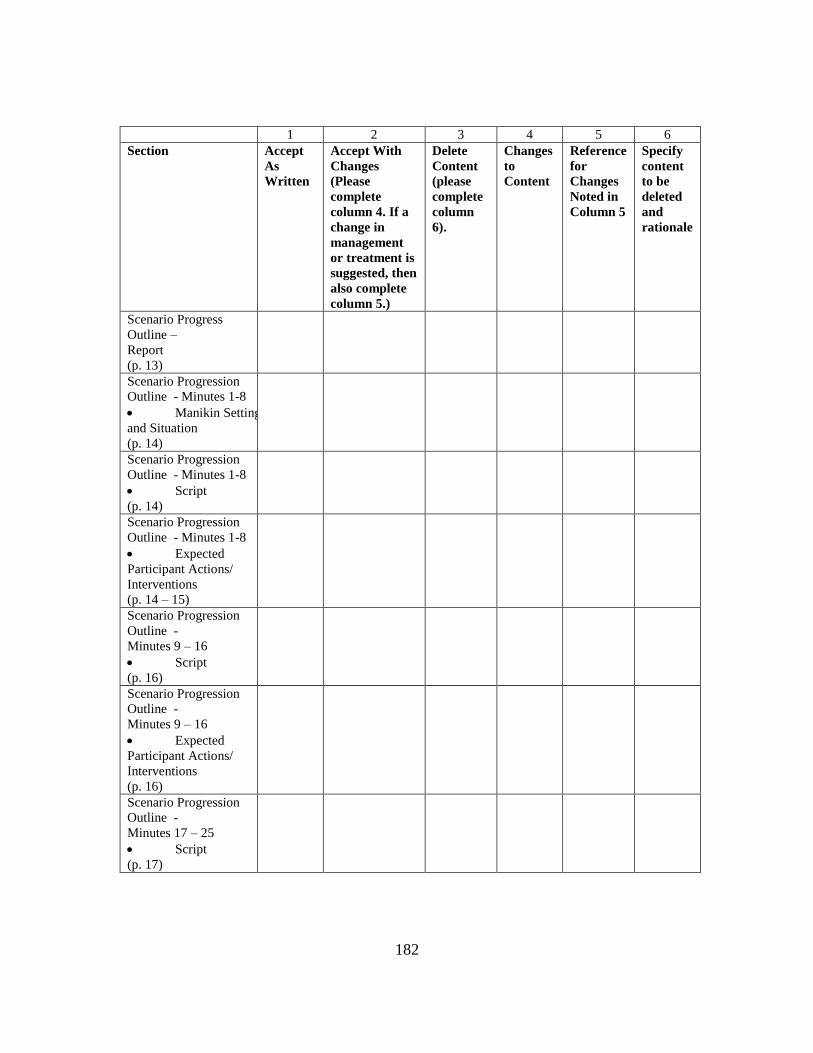
182
1 2 3 4 5 6
Section Accept
As
Written
Accept With
Changes
(Please
complete
column 4. If a
change in
management
or treatment is
suggested, then
also complete
column 5.)
Delete
Content
(please
complete
column
6).
Changes
to
Content
Reference
for
Changes
Noted in
Column 5
Specify
content
to be
deleted
and
rationale
Scenario Progress
Outline –
Report
(p. 13)
Scenario Progression
Outline - Minutes 1-8
Manikin Settings
and Situation
(p. 14)
Scenario Progression
Outline - Minutes 1-8
Script
(p. 14)
Scenario Progression
Outline - Minutes 1-8
Expected
Participant Actions/
Interventions
(p. 14 – 15)
Scenario Progression
Outline -
Minutes 9 – 16
Script
(p. 16)
Scenario Progression
Outline -
Minutes 9 – 16
Expected
Participant Actions/
Interventions
(p. 16)
Scenario Progression
Outline -
Minutes 17 – 25
Script
(p. 17)
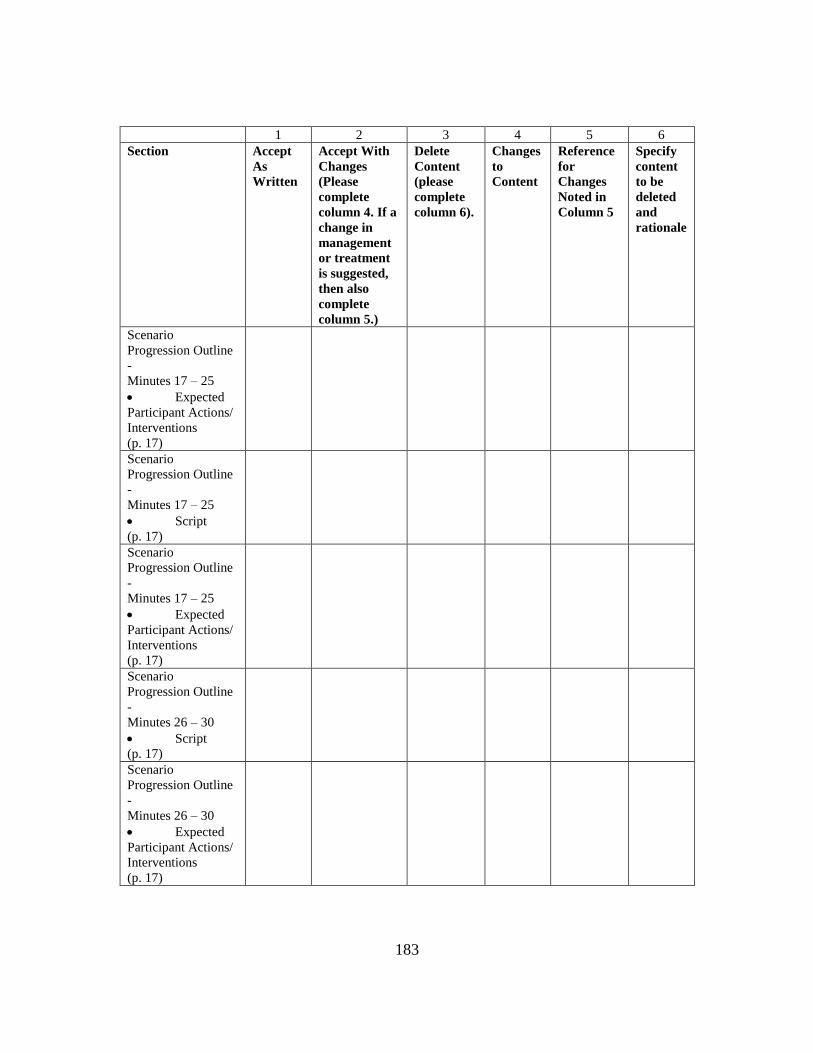
183
1 2 3 4 5 6
Section Accept
As
Written
Accept With
Changes
(Please
complete
column 4. If a
change in
management
or treatment
is suggested,
then also
complete
column 5.)
Delete
Content
(please
complete
column 6).
Changes
to
Content
Reference
for
Changes
Noted in
Column 5
Specify
content
to be
deleted
and
rationale
Scenario
Progression Outline
-
Minutes 17 – 25
Expected
Participant Actions/
Interventions
(p. 17)
Scenario
Progression Outline
-
Minutes 17 – 25
Script
(p. 17)
Scenario
Progression Outline
-
Minutes 17 – 25
Expected
Participant Actions/
Interventions
(p. 17)
Scenario
Progression Outline
-
Minutes 26 – 30
Script
(p. 17)
Scenario
Progression Outline
-
Minutes 26 – 30
Expected
Participant Actions/
Interventions
(p. 17)

184
APPENDIX H
INSTRUCTIONS – ROUND 1
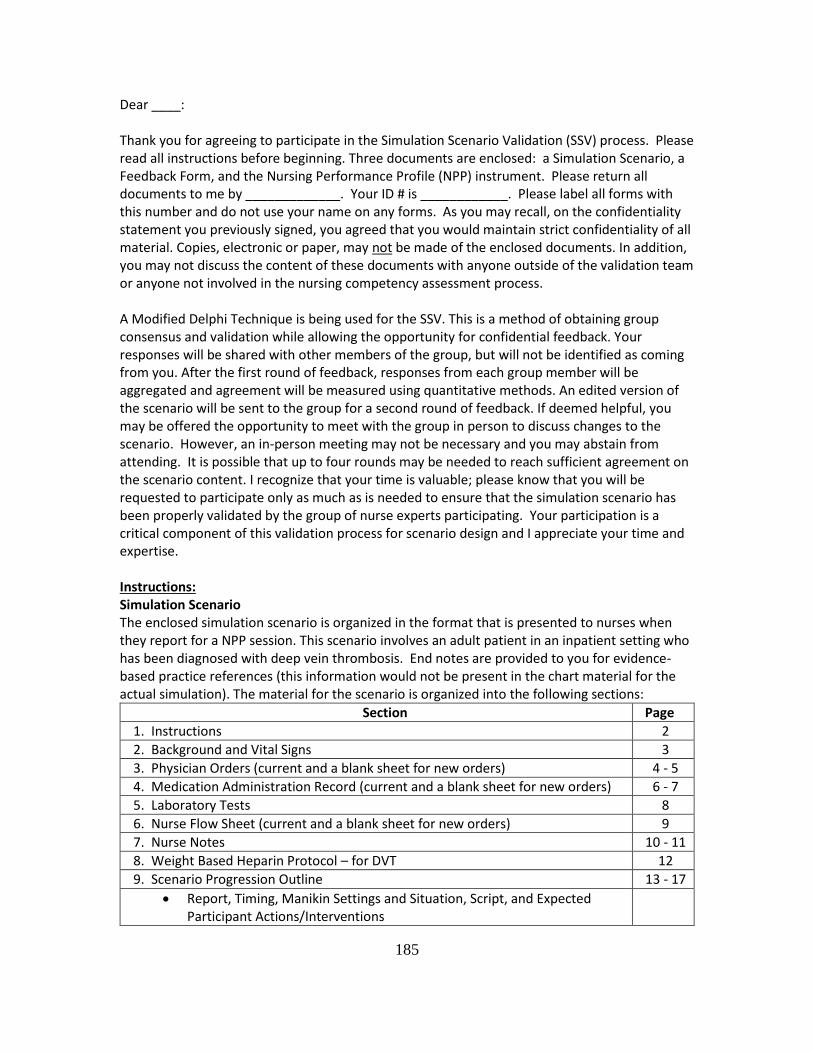
185
Dear ____: Thank you for agreeing to participate in the Simulation Scenario Validation (SSV) process. Please read all instructions before beginning. Three documents are enclosed: a Simulation Scenario, a Feedback Form, and the Nursing Performance Profile (NPP) instrument. Please return all documents to me by _____________. Your ID # is ____________. Please label all forms with this number and do not use your name on any forms. As you may recall, on the confidentiality statement you previously signed, you agreed that you would maintain strict confidentiality of all material. Copies, electronic or paper, may not be made of the enclosed documents. In addition, you may not discuss the content of these documents with anyone outside of the validation team or anyone not involved in the nursing competency assessment process. A Modified Delphi Technique is being used for the SSV. This is a method of obtaining group consensus and validation while allowing the opportunity for confidential feedback. Your responses will be shared with other members of the group, but will not be identified as coming from you. After the first round of feedback, responses from each group member will be aggregated and agreement will be measured using quantitative methods. An edited version of the scenario will be sent to the group for a second round of feedback. If deemed helpful, you may be offered the opportunity to meet with the group in person to discuss changes to the scenario. However, an in-person meeting may not be necessary and you may abstain from attending. It is possible that up to four rounds may be needed to reach sufficient agreement on the scenario content. I recognize that your time is valuable; please know that you will be requested to participate only as much as is needed to ensure that the simulation scenario has been properly validated by the group of nurse experts participating. Your participation is a critical component of this validation process for scenario design and I appreciate your time and expertise. Instructions: Simulation Scenario The enclosed simulation scenario is organized in the format that is presented to nurses when they report for a NPP session. This scenario involves an adult patient in an inpatient setting who has been diagnosed with deep vein thrombosis. End notes are provided to you for evidence-based practice references (this information would not be present in the chart material for the actual simulation). The material for the scenario is organized into the following sections:
Section Page
1. Instructions 2
2. Background and Vital Signs 3
3. Physician Orders (current and a blank sheet for new orders) 4 - 5
4. Medication Administration Record (current and a blank sheet for new orders) 6 - 7
5. Laboratory Tests 8
6. Nurse Flow Sheet (current and a blank sheet for new orders) 9
7. Nurse Notes 10 - 11
8. Weight Based Heparin Protocol – for DVT 12
9. Scenario Progression Outline 13 - 17
Report, Timing, Manikin Settings and Situation, Script, and Expected Participant Actions/Interventions
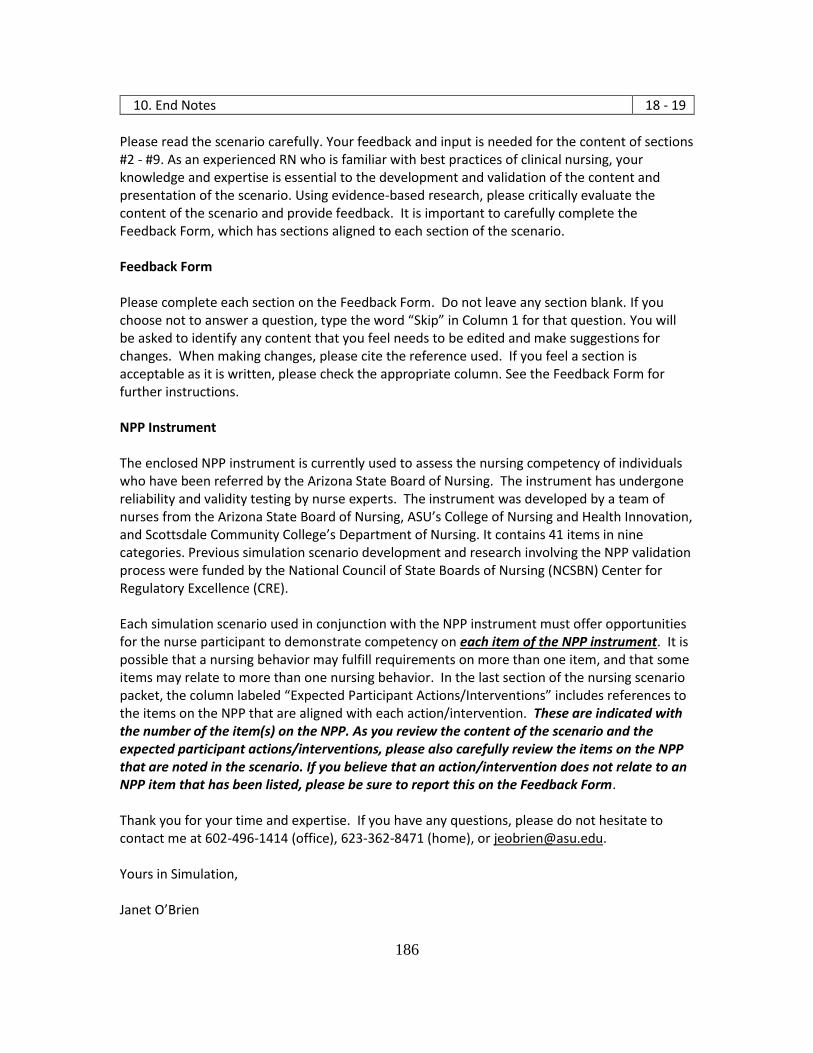
186
10. End Notes 18 - 19
Please read the scenario carefully. Your feedback and input is needed for the content of sections #2 - #9. As an experienced RN who is familiar with best practices of clinical nursing, your knowledge and expertise is essential to the development and validation of the content and presentation of the scenario. Using evidence-based research, please critically evaluate the content of the scenario and provide feedback. It is important to carefully complete the Feedback Form, which has sections aligned to each section of the scenario. Feedback Form Please complete each section on the Feedback Form. Do not leave any section blank. If you choose not to answer a question, type the word “Skip” in Column 1 for that question. You will be asked to identify any content that you feel needs to be edited and make suggestions for changes. When making changes, please cite the reference used. If you feel a section is acceptable as it is written, please check the appropriate column. See the Feedback Form for further instructions. NPP Instrument The enclosed NPP instrument is currently used to assess the nursing competency of individuals who have been referred by the Arizona State Board of Nursing. The instrument has undergone reliability and validity testing by nurse experts. The instrument was developed by a team of nurses from the Arizona State Board of Nursing, ASU’s College of Nursing and Health Innovation, and Scottsdale Community College’s Department of Nursing. It contains 41 items in nine categories. Previous simulation scenario development and research involving the NPP validation process were funded by the National Council of State Boards of Nursing (NCSBN) Center for Regulatory Excellence (CRE). Each simulation scenario used in conjunction with the NPP instrument must offer opportunities for the nurse participant to demonstrate competency on each item of the NPP instrument. It is possible that a nursing behavior may fulfill requirements on more than one item, and that some items may relate to more than one nursing behavior. In the last section of the nursing scenario packet, the column labeled “Expected Participant Actions/Interventions” includes references to the items on the NPP that are aligned with each action/intervention. These are indicated with the number of the item(s) on the NPP. As you review the content of the scenario and the expected participant actions/interventions, please also carefully review the items on the NPP that are noted in the scenario. If you believe that an action/intervention does not relate to an NPP item that has been listed, please be sure to report this on the Feedback Form. Thank you for your time and expertise. If you have any questions, please do not hesitate to contact me at 602-496-1414 (office), 623-362-8471 (home), or [email protected]. Yours in Simulation, Janet O’Brien

187
APPENDIX I
FEEDBACK FORM – ROUND 2
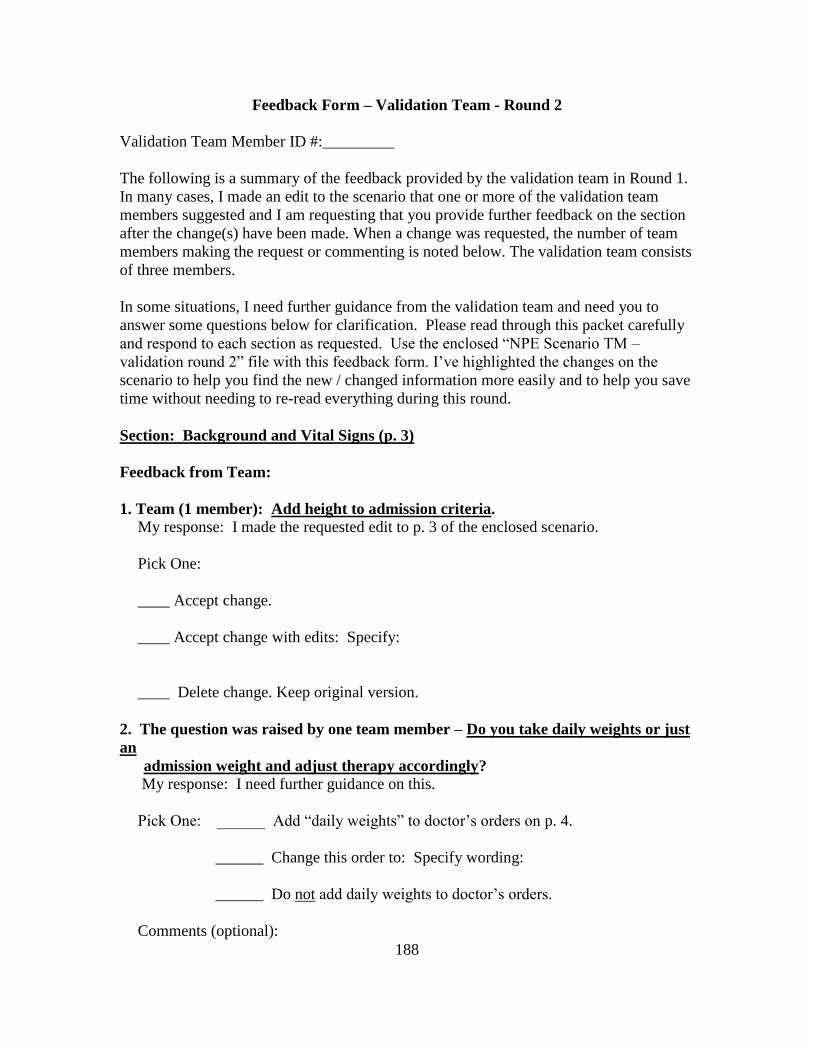
188
Feedback Form – Validation Team - Round 2
Validation Team Member ID #:_________
The following is a summary of the feedback provided by the validation team in Round 1.
In many cases, I made an edit to the scenario that one or more of the validation team
members suggested and I am requesting that you provide further feedback on the section
after the change(s) have been made. When a change was requested, the number of team
members making the request or commenting is noted below. The validation team consists
of three members.
In some situations, I need further guidance from the validation team and need you to
answer some questions below for clarification. Please read through this packet carefully
and respond to each section as requested. Use the enclosed “NPE Scenario TM –
validation round 2” file with this feedback form. I’ve highlighted the changes on the
scenario to help you find the new / changed information more easily and to help you save
time without needing to re-read everything during this round.
Section: Background and Vital Signs (p. 3)
Feedback from Team:
1. Team (1 member): Add height to admission criteria. My response: I made the requested edit to p. 3 of the enclosed scenario.
Pick One:
____ Accept change.
____ Accept change with edits: Specify:
____ Delete change. Keep original version.
2. The question was raised by one team member – Do you take daily weights or just
an
admission weight and adjust therapy accordingly? My response: I need further guidance on this.
Pick One: ______ Add “daily weights” to doctor’s orders on p. 4.
______ Change this order to: Specify wording:
______ Do not add daily weights to doctor’s orders.
Comments (optional):
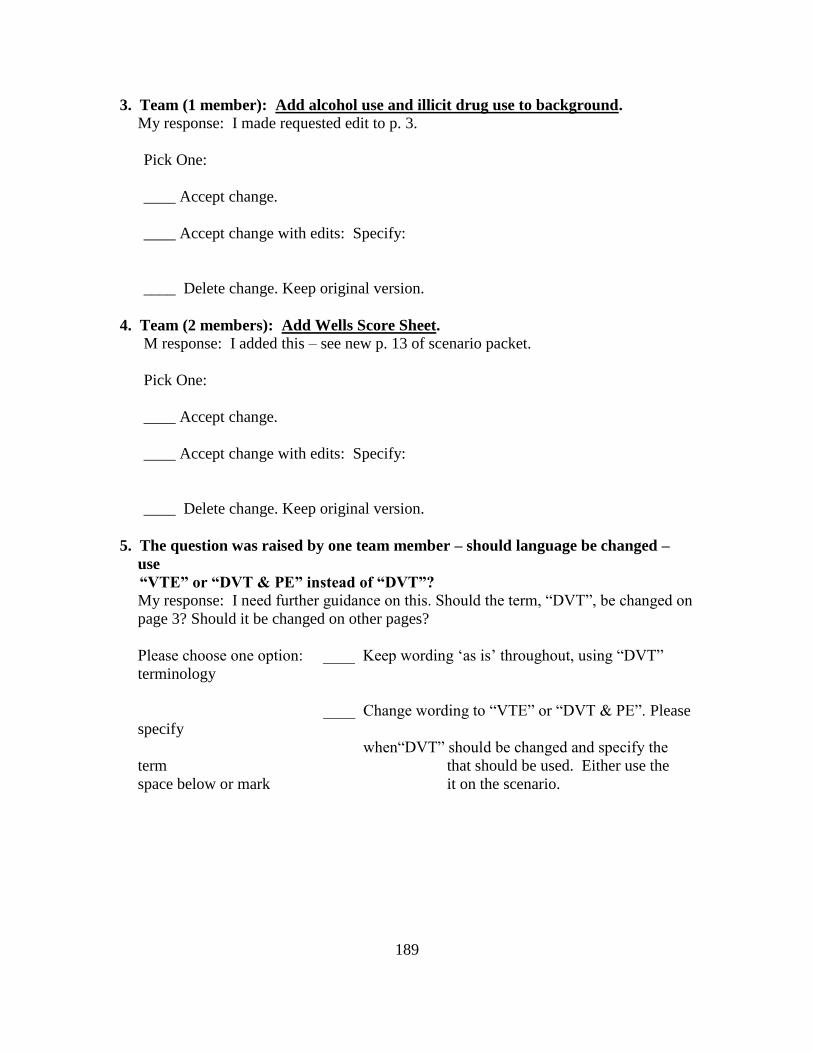
189
3. Team (1 member): Add alcohol use and illicit drug use to background. My response: I made requested edit to p. 3.
Pick One:
____ Accept change.
____ Accept change with edits: Specify:
____ Delete change. Keep original version.
4. Team (2 members): Add Wells Score Sheet. M response: I added this – see new p. 13 of scenario packet.
Pick One:
____ Accept change.
____ Accept change with edits: Specify:
____ Delete change. Keep original version.
5. The question was raised by one team member – should language be changed –
use
“VTE” or “DVT & PE” instead of “DVT”? My response: I need further guidance on this. Should the term, “DVT”, be changed on
page 3? Should it be changed on other pages?
Please choose one option: ____ Keep wording ‘as is’ throughout, using “DVT”
terminology
____ Change wording to “VTE” or “DVT & PE”. Please
specify
when“DVT” should be changed and specify the
term that should be used. Either use the
space below or mark it on the scenario.
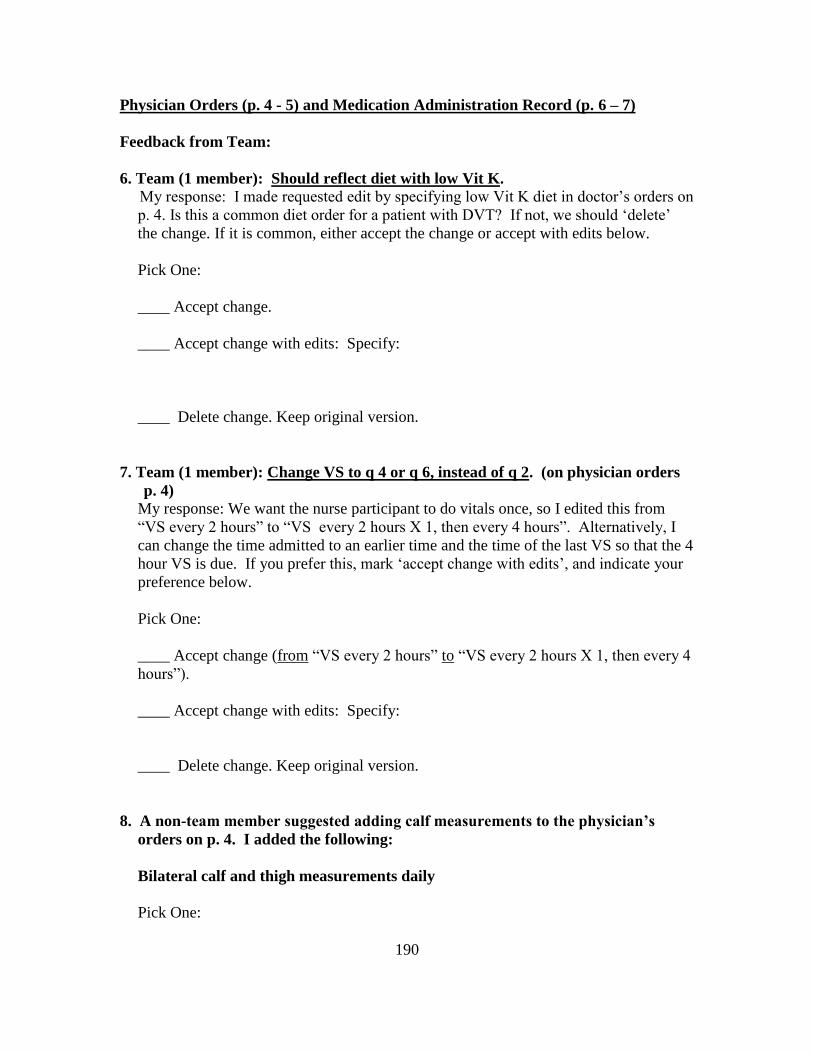
190
Physician Orders (p. 4 - 5) and Medication Administration Record (p. 6 – 7)
Feedback from Team:
6. Team (1 member): Should reflect diet with low Vit K. My response: I made requested edit by specifying low Vit K diet in doctor’s orders on
p. 4. Is this a common diet order for a patient with DVT? If not, we should ‘delete’
the change. If it is common, either accept the change or accept with edits below.
Pick One:
____ Accept change.
____ Accept change with edits: Specify:
____ Delete change. Keep original version.
7. Team (1 member): Change VS to q 4 or q 6, instead of q 2. (on physician orders
p. 4) My response: We want the nurse participant to do vitals once, so I edited this from
“VS every 2 hours” to “VS every 2 hours X 1, then every 4 hours”. Alternatively, I
can change the time admitted to an earlier time and the time of the last VS so that the 4
hour VS is due. If you prefer this, mark ‘accept change with edits’, and indicate your
preference below.
Pick One:
____ Accept change (from “VS every 2 hours” to “VS every 2 hours X 1, then every 4
hours”).
____ Accept change with edits: Specify:
____ Delete change. Keep original version.
8. A non-team member suggested adding calf measurements to the physician’s
orders on p. 4. I added the following:
Bilateral calf and thigh measurements daily
Pick One:
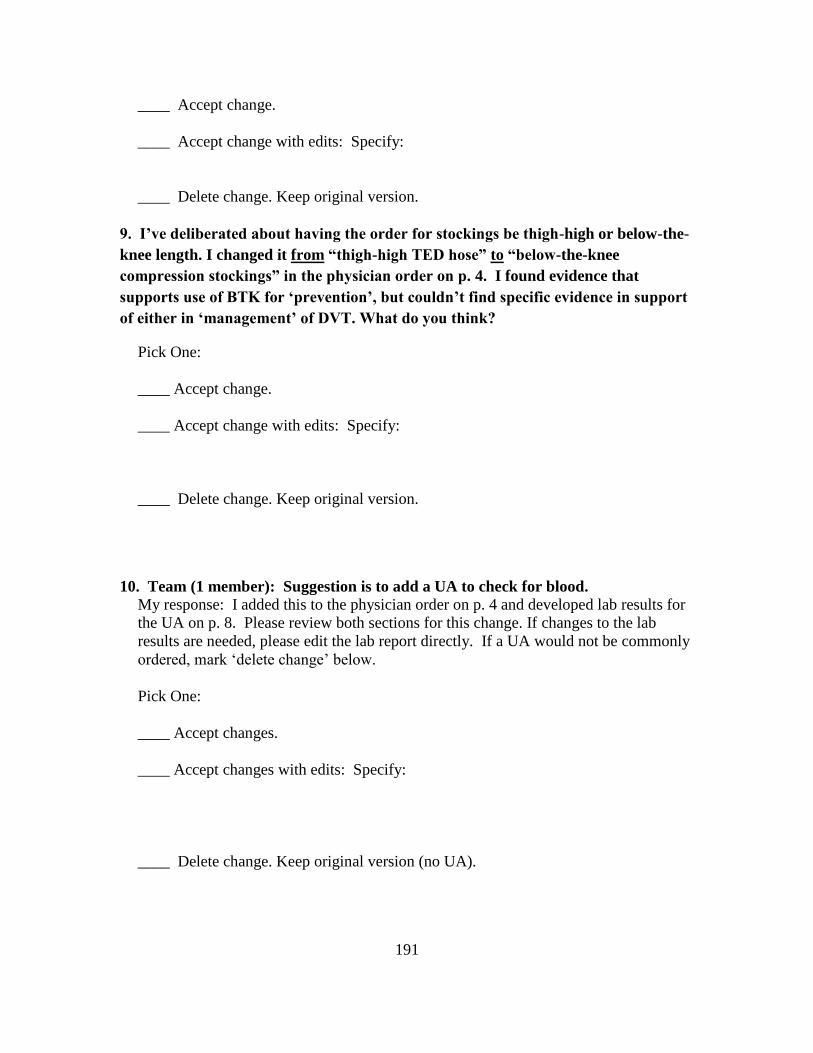
191
____ Accept change.
____ Accept change with edits: Specify:
____ Delete change. Keep original version.
9. I’ve deliberated about having the order for stockings be thigh-high or below-the-
knee length. I changed it from “thigh-high TED hose” to “below-the-knee
compression stockings” in the physician order on p. 4. I found evidence that
supports use of BTK for ‘prevention’, but couldn’t find specific evidence in support
of either in ‘management’ of DVT. What do you think?
Pick One:
____ Accept change.
____ Accept change with edits: Specify:
____ Delete change. Keep original version.
10. Team (1 member): Suggestion is to add a UA to check for blood. My response: I added this to the physician order on p. 4 and developed lab results for
the UA on p. 8. Please review both sections for this change. If changes to the lab
results are needed, please edit the lab report directly. If a UA would not be commonly
ordered, mark ‘delete change’ below.
Pick One:
____ Accept changes.
____ Accept changes with edits: Specify:
____ Delete change. Keep original version (no UA).
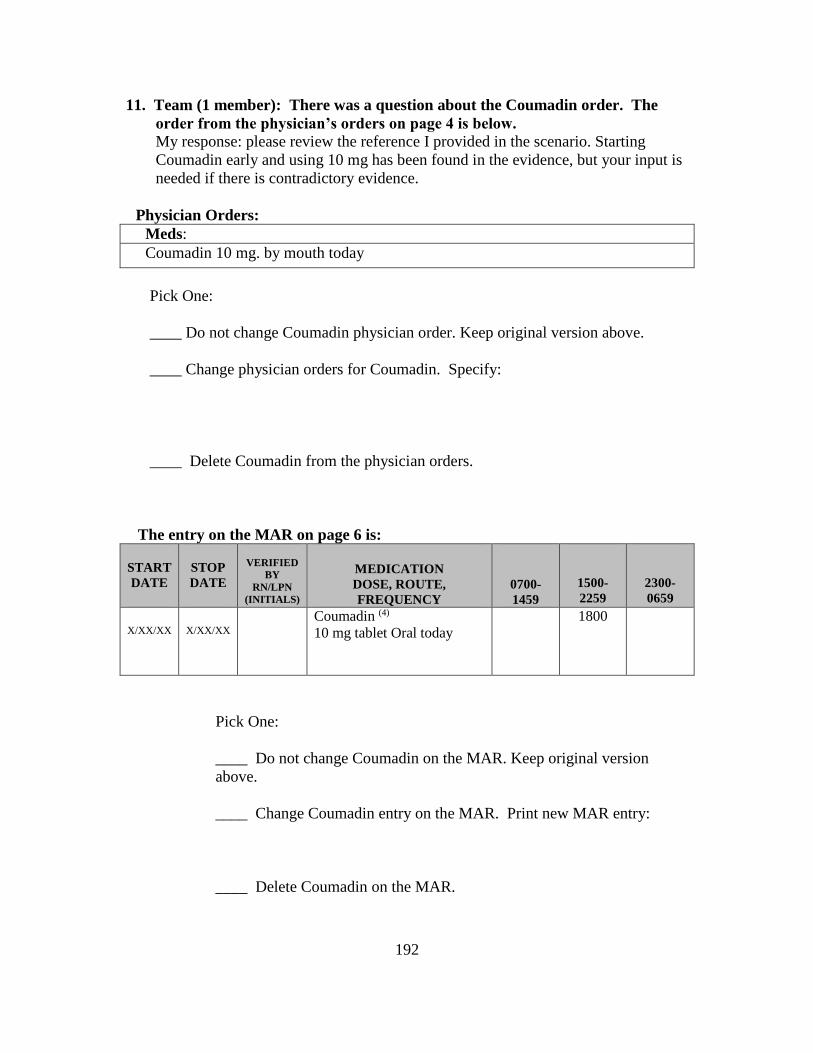
192
11. Team (1 member): There was a question about the Coumadin order. The
order from the physician’s orders on page 4 is below.
My response: please review the reference I provided in the scenario. Starting
Coumadin early and using 10 mg has been found in the evidence, but your input is
needed if there is contradictory evidence.
Physician Orders:
Meds:
Coumadin 10 mg. by mouth today
Pick One:
____ Do not change Coumadin physician order. Keep original version above.
____ Change physician orders for Coumadin. Specify:
____ Delete Coumadin from the physician orders.
The entry on the MAR on page 6 is:
START
DATE
STOP
DATE
VERIFIED
BY
RN/LPN
(INITIALS)
MEDICATION
DOSE, ROUTE,
FREQUENCY
0700-
1459
1500-
2259
2300-
0659
X/XX/XX
X/XX/XX
Coumadin (4)
10 mg tablet Oral today
1800
Pick One:
____ Do not change Coumadin on the MAR. Keep original version
above.
____ Change Coumadin entry on the MAR. Print new MAR entry:
____ Delete Coumadin on the MAR.
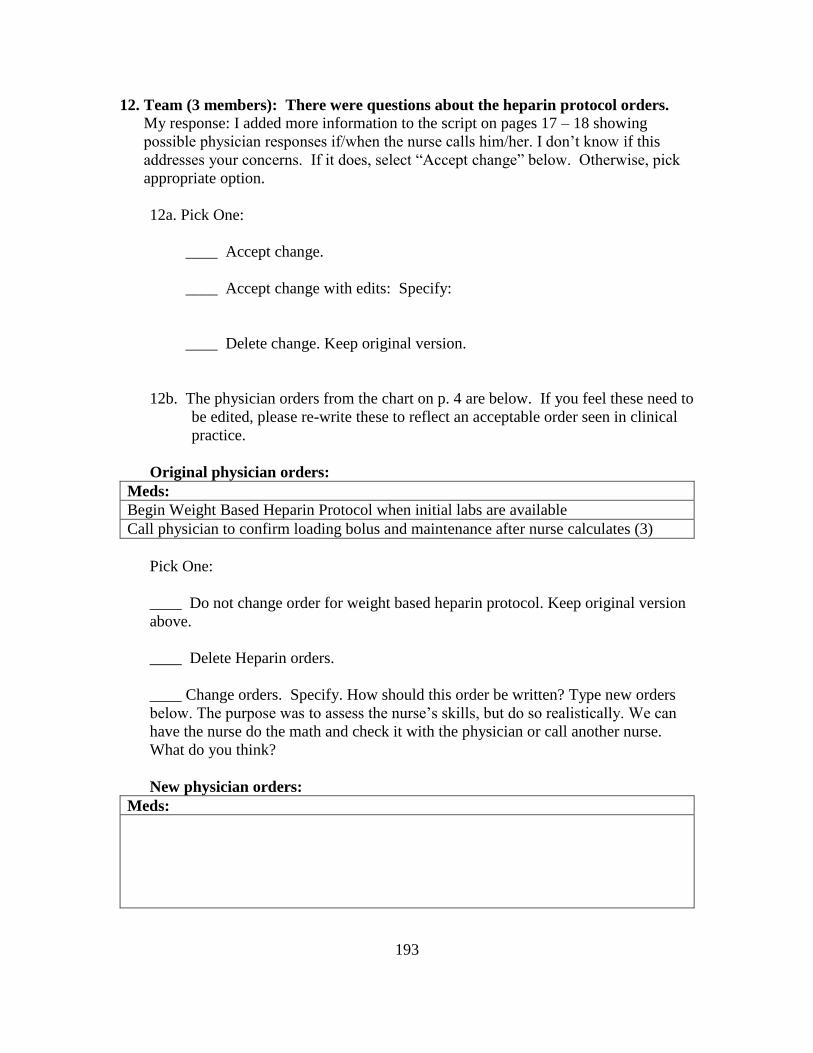
193
12. Team (3 members): There were questions about the heparin protocol orders. My response: I added more information to the script on pages 17 – 18 showing
possible physician responses if/when the nurse calls him/her. I don’t know if this
addresses your concerns. If it does, select “Accept change” below. Otherwise, pick
appropriate option.
12a. Pick One:
____ Accept change.
____ Accept change with edits: Specify:
____ Delete change. Keep original version.
12b. The physician orders from the chart on p. 4 are below. If you feel these need to
be edited, please re-write these to reflect an acceptable order seen in clinical
practice.
Original physician orders:
Meds:
Begin Weight Based Heparin Protocol when initial labs are available
Call physician to confirm loading bolus and maintenance after nurse calculates (3)
Pick One:
____ Do not change order for weight based heparin protocol. Keep original version
above.
____ Delete Heparin orders.
____ Change orders. Specify. How should this order be written? Type new orders
below. The purpose was to assess the nurse’s skills, but do so realistically. We can
have the nurse do the math and check it with the physician or call another nurse.
What do you think?
New physician orders:
Meds:
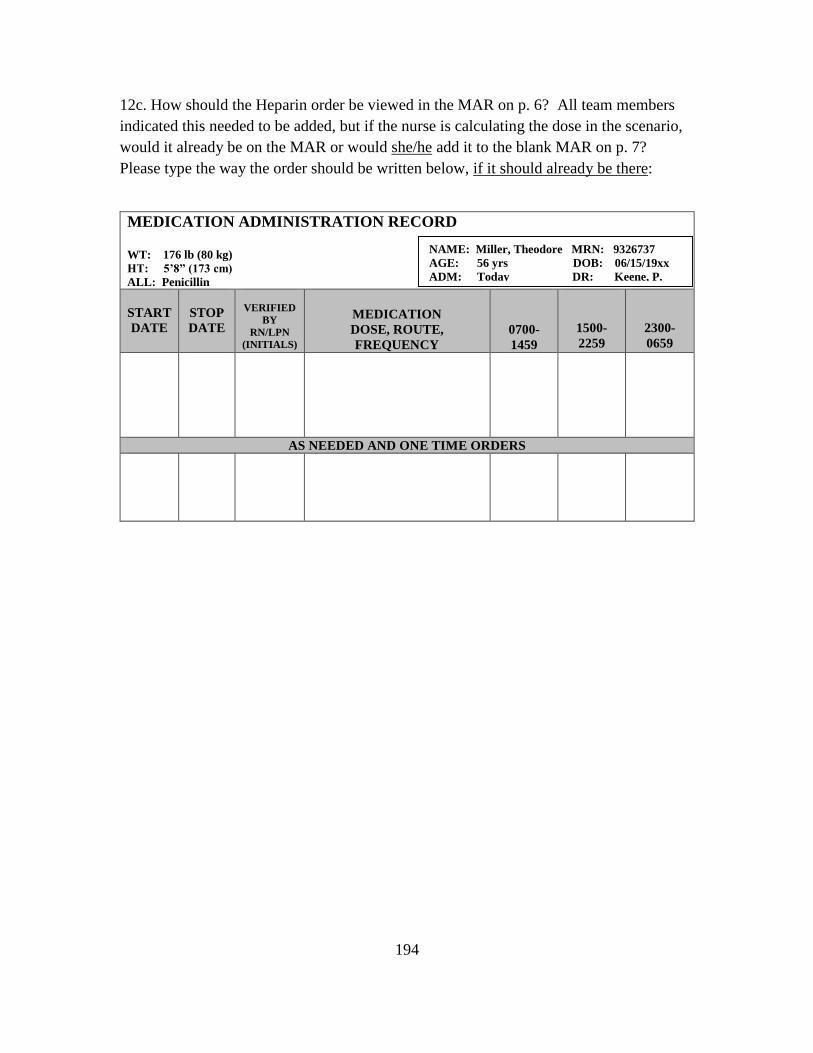
194
12c. How should the Heparin order be viewed in the MAR on p. 6? All team members
indicated this needed to be added, but if the nurse is calculating the dose in the scenario,
would it already be on the MAR or would she/he add it to the blank MAR on p. 7?
Please type the way the order should be written below, if it should already be there:
MEDICATION ADMINISTRATION RECORD WT: 176 lb (80 kg) HT: 5’8” (173 cm) ALL: Penicillin
START
DATE
STOP
DATE
VERIFIED
BY
RN/LPN
(INITIALS)
MEDICATION
DOSE, ROUTE,
FREQUENCY
0700-
1459
1500-
2259
2300-
0659
AS NEEDED AND ONE TIME ORDERS
NAME: Miller, Theodore MRN: 9326737
AGE: 56 yrs DOB: 06/15/19xx
ADM: Today DR: Keene, P.
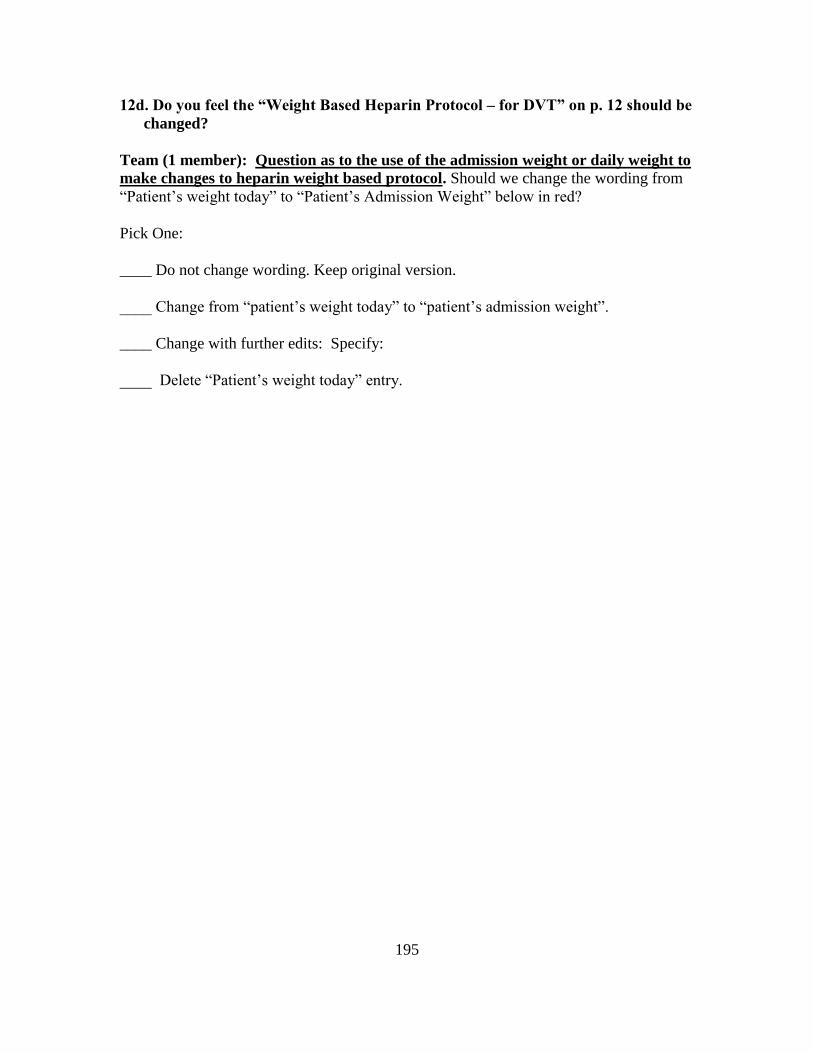
195
12d. Do you feel the “Weight Based Heparin Protocol – for DVT” on p. 12 should be
changed?
Team (1 member): Question as to the use of the admission weight or daily weight to
make changes to heparin weight based protocol. Should we change the wording from
“Patient’s weight today” to “Patient’s Admission Weight” below in red?
Pick One:
____ Do not change wording. Keep original version.
____ Change from “patient’s weight today” to “patient’s admission weight”.
____ Change with further edits: Specify:
____ Delete “Patient’s weight today” entry.
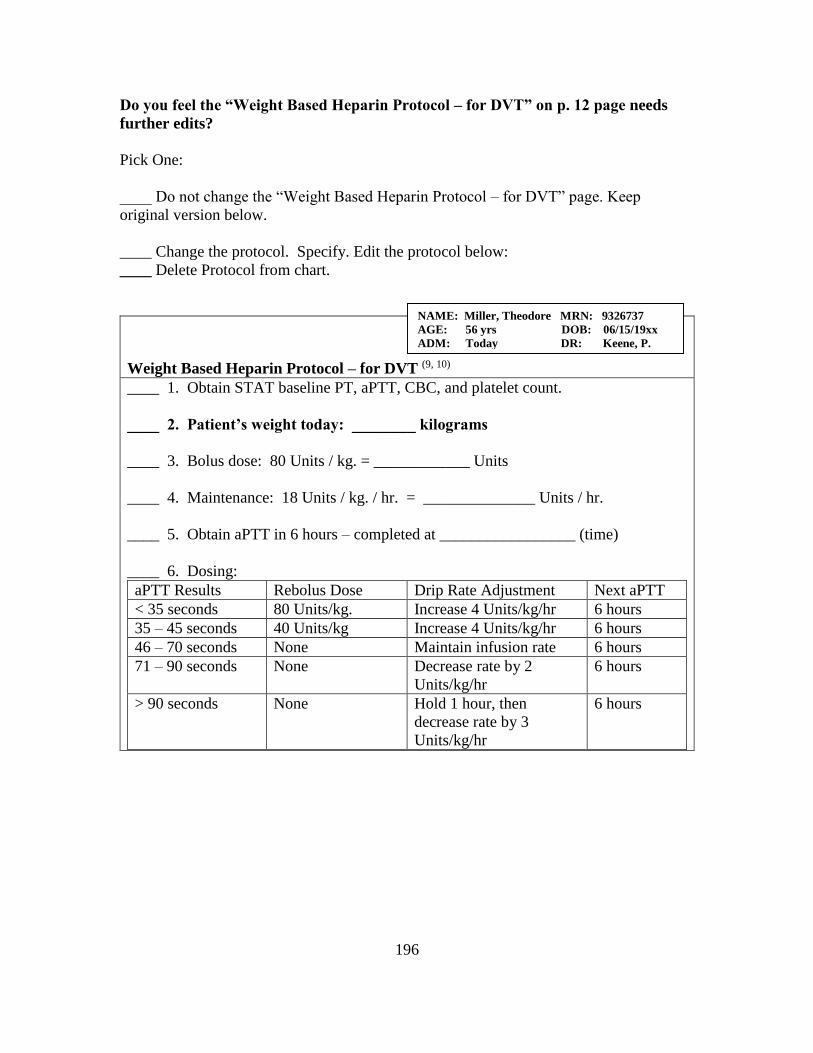
196
Do you feel the “Weight Based Heparin Protocol – for DVT” on p. 12 page needs
further edits?
Pick One:
____ Do not change the “Weight Based Heparin Protocol – for DVT” page. Keep
original version below.
____ Change the protocol. Specify. Edit the protocol below:
____ Delete Protocol from chart.
Weight Based Heparin Protocol – for DVT (9, 10)
____ 1. Obtain STAT baseline PT, aPTT, CBC, and platelet count.
____ 2. Patient’s weight today: ________ kilograms
____ 3. Bolus dose: 80 Units / kg. = ____________ Units
____ 4. Maintenance: 18 Units / kg. / hr. = ______________ Units / hr.
____ 5. Obtain aPTT in 6 hours – completed at _________________ (time)
____ 6. Dosing:
aPTT Results Rebolus Dose Drip Rate Adjustment Next aPTT
< 35 seconds 80 Units/kg. Increase 4 Units/kg/hr 6 hours
35 – 45 seconds 40 Units/kg Increase 4 Units/kg/hr 6 hours
46 – 70 seconds None Maintain infusion rate 6 hours
71 – 90 seconds None Decrease rate by 2
Units/kg/hr
6 hours
> 90 seconds None Hold 1 hour, then
decrease rate by 3
Units/kg/hr
6 hours
NAME: Miller, Theodore MRN: 9326737
AGE: 56 yrs DOB: 06/15/19xx
ADM: Today DR: Keene, P.
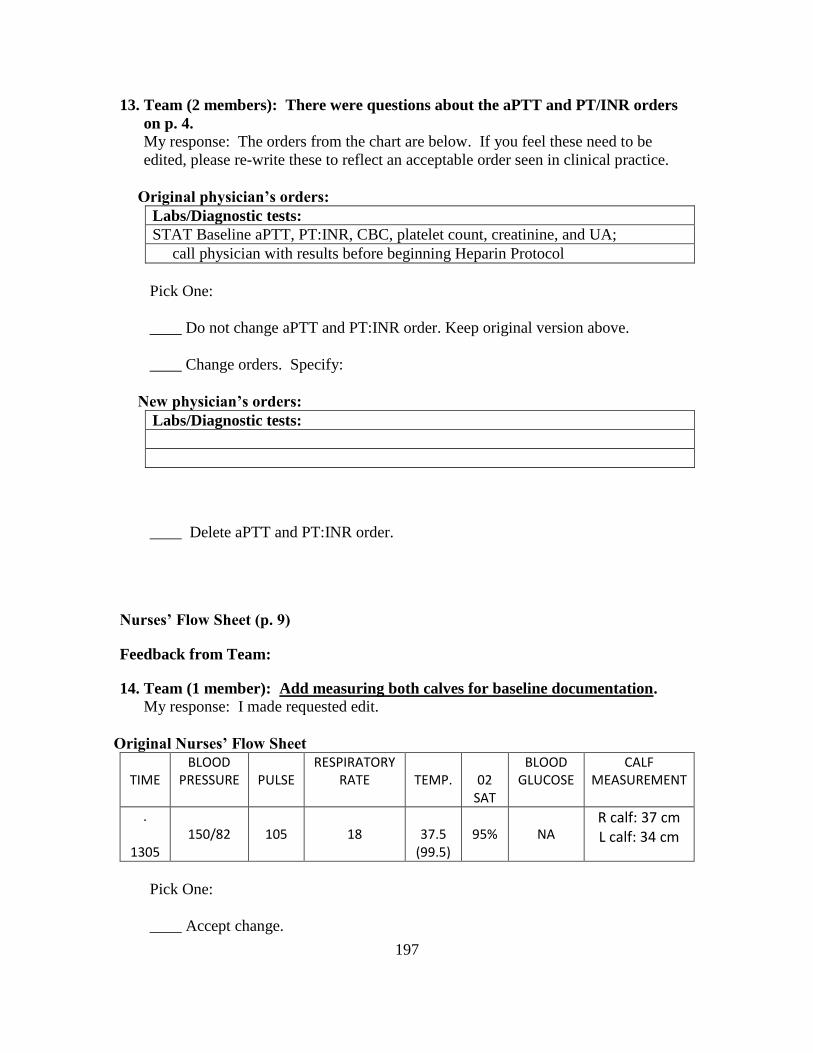
197
13. Team (2 members): There were questions about the aPTT and PT/INR orders
on p. 4. My response: The orders from the chart are below. If you feel these need to be
edited, please re-write these to reflect an acceptable order seen in clinical practice.
Original physician’s orders:
Labs/Diagnostic tests:
STAT Baseline aPTT, PT:INR, CBC, platelet count, creatinine, and UA;
call physician with results before beginning Heparin Protocol
Pick One:
____ Do not change aPTT and PT:INR order. Keep original version above.
____ Change orders. Specify:
New physician’s orders:
Labs/Diagnostic tests:
____ Delete aPTT and PT:INR order.
Nurses’ Flow Sheet (p. 9)
Feedback from Team:
14. Team (1 member): Add measuring both calves for baseline documentation. My response: I made requested edit.
Original Nurses’ Flow Sheet
TIME
BLOOD PRESSURE
PULSE
RESPIRATORY RATE
TEMP.
02
SAT
BLOOD GLUCOSE
CALF MEASUREMENT
.
1305
150/82
105
18
37.5
(99.5)
95%
NA
R calf: 37 cm L calf: 34 cm
Pick One:
____ Accept change.
198
____ Accept change with edits: Specify:
____ Delete change. Keep original version.
Nurses’ Notes (p. 10)
Feedback from Team:
15. Team (1 member): Add measurement of both legs with notation as to location of
marking for future assessment to maintain consistency of assessment. My response: I made requested edit. See added notes in red below.
Original Nurses’ Notes
Cardiovascular/Skin: skin pink, warm, dry, & intact, mucous membranes
pink & moist, capillary refill < 3 seconds x 4 extremities including right toes,
heart sounds S1 & S2 with regular rhythm & rate of 105 bpm, blood
pressure 150/82 mm Hg, radial pulses strong & equal bilaterally, pedal
pulses strong & equal bilaterally, positive Homans’ sign right foot, right thigh,
calf, and foot pink and warm,2 + pitting edema over right foot and right lower
leg, thigh high TED hose on both legs, physician reported two-level Wells score
of 4 with DVT ‘likely’, right calf 3 cm larger than left; R calf: 37 cm;
R thigh: 54 cm; L calf: 34 cm; L thigh: 50 cm; area measured marked in pen; entire
leg swollen;
peripheral IV intact to right forearm – saline locked, insertion site asymptomatic,
temp 99.5° F oral --------------------------------------------------------------------------
Pick One:
____ Accept change.
____ Accept change with edits: Specify:
____ Delete change. Keep original version.
Scenario Progression Outline - Report (now on p. 14)
199
Feedback from Team:
16a. Team (1 member): Suggestion to add dialogue regarding travel parameters in
the future. My response: I did not make changes to the report, but will do so if the
team reaches consensus that it is needed. This section is the report the nurse
participant will receive at the beginning of the scenario. However, this topic would be
a possible one for the nurse participant to bring up in an educational context with the
patient. I added this to the dialogue (see 16b below), with the patient commenting
that he needs to travel in three months to Singapore again, to give the nurse an
opportunity to educate the patient.
Pick One:
____ Do not add this information to the report.
____ Add a sentence or two to the report regarding future travel parameters. Specify:
16b.
Pick One:
____ Add the following to the scenario dialogue regarding future travel parameters on
p. 15.
Patient comments that he has to travel to Singapore in three months again
but how can he if this is going to happen again.
____ Add dialogue to the scenario dialogue, with the following edits. Specify:
____ Do not add this information to the scenario dialogue.
200
Scenario Progression Outline – Minutes 17 – 25 – Expected Participant
Actions/Interventions (now on p. 19)
Feedback from Team:
17. Team (1 member): Suggestion about missing opportunity for teaching about
ambulation and need to explore fear and offer assistance.
My response: I agree that these are expected participant actions/interventions. The
stated expected participant actions/interventions in the original script includes:
“Responds appropriately to patient’s request to keep information from physician and
continued resistance to ambulation (8,10,12,14,16,24,25,26,29,30,31,32,33,37)”
We can add the following in red to the verbiage:
Responds appropriately to patient’s request to keep information from physician and
continued resistance to ambulation. Engages in patient teaching about ambulation,
offers assistance, addresses patient fears (8,10,12,14,16,24,25,26,29,30,31,32,33,37)
Pick One:
____ Accept change (above in red).
____ Accept change with edits: Specify:
____ Delete change. Keep original version.

201
APPENDIX J
INSTRUCTIONS – ROUND 2
202
Dear xxxxxxx,
The NPP scenario has been edited based upon feedback from the NPP Scenario
Validation Team.
For round 2, please use the attached “Feedback Form – Validation Team – Round 2”. The
purpose of this form is to take you through the edits that one or more of you suggested
and to ask:
1. if the edits are acceptable to you; or
2. if you wish to make further edits; or
3. if you prefer the original wording.
To assist you in making this round more efficient, I’ve highlighted the areas on the
scenario (also attached) that involve changes from the first edition. It is hoped that this
will save you time in not needing to re-read the entire scenario again.
The Feedback Form is lengthy, but I believe the majority of it will actually take you little
time to complete. The reason for the high detail is so that I may again calculate a
reliability statistic, which will provide a quantitative component to the Modified Delphi
Technique in which you are participating.
If you would prefer that I send you the attached files in a print version, please let me
know and I will send it to you immediately.
Your time is very valuable and I appreciate your continued participation in this validation
process. You will be interested to learn that I submitted a proposal to the NLN annual
conference that will be held in Phoenix in September detailing the validation process you
are involved in and that it has been accepted. My co-presenters are Debbie Hagler and
Marilyn Thompson. Apparently, others are very interested in learning more about the
work you are engaged in!
Last, to make the small token of appreciation I will be providing at the end of the process
more meaningful, I would like to find out if you have a preferred store for your gift
card. Please provide the name of three stores that provide gift cards and I will try to
obtain the card for one of the locations.
Your ID number for the Feedback Form is:_201_. The deadline for submitting the
completed feedback form is: April 6.
Warm Regards,
Janet

203
APPENDIX K
FEEDBACK FORM – ROUND 3
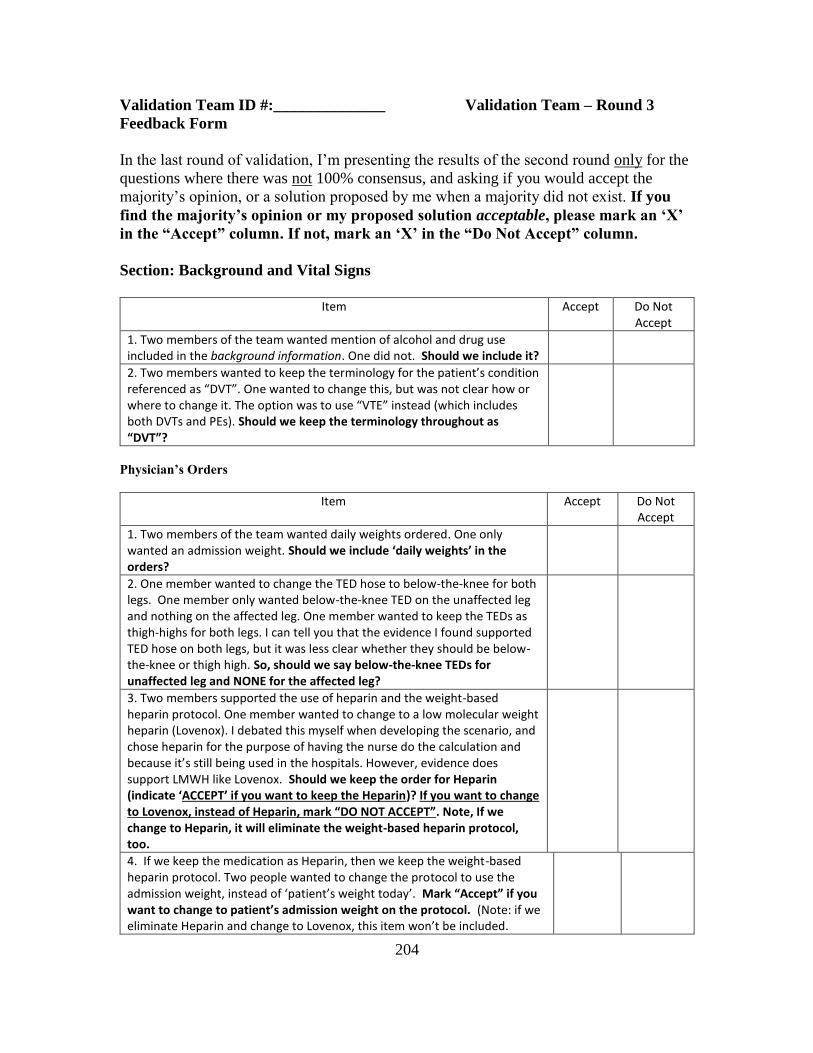
204
Validation Team ID #:______________ Validation Team – Round 3
Feedback Form
In the last round of validation, I’m presenting the results of the second round only for the
questions where there was not 100% consensus, and asking if you would accept the
majority’s opinion, or a solution proposed by me when a majority did not exist. If you
find the majority’s opinion or my proposed solution acceptable, please mark an ‘X’
in the “Accept” column. If not, mark an ‘X’ in the “Do Not Accept” column.
Section: Background and Vital Signs
Item Accept Do Not
Accept
1. Two members of the team wanted mention of alcohol and drug use included in the background information. One did not. Should we include it?
2. Two members wanted to keep the terminology for the patient’s condition referenced as “DVT”. One wanted to change this, but was not clear how or where to change it. The option was to use “VTE” instead (which includes both DVTs and PEs). Should we keep the terminology throughout as “DVT”?
Physician’s Orders
Item Accept Do Not Accept
1. Two members of the team wanted daily weights ordered. One only wanted an admission weight. Should we include ‘daily weights’ in the orders?
2. One member wanted to change the TED hose to below-the-knee for both legs. One member only wanted below-the-knee TED on the unaffected leg and nothing on the affected leg. One member wanted to keep the TEDs as thigh-highs for both legs. I can tell you that the evidence I found supported TED hose on both legs, but it was less clear whether they should be below-the-knee or thigh high. So, should we say below-the-knee TEDs for unaffected leg and NONE for the affected leg?
3. Two members supported the use of heparin and the weight-based heparin protocol. One member wanted to change to a low molecular weight heparin (Lovenox). I debated this myself when developing the scenario, and chose heparin for the purpose of having the nurse do the calculation and because it’s still being used in the hospitals. However, evidence does support LMWH like Lovenox. Should we keep the order for Heparin (indicate ‘ACCEPT’ if you want to keep the Heparin)? If you want to change to Lovenox, instead of Heparin, mark “DO NOT ACCEPT”. Note, If we change to Heparin, it will eliminate the weight-based heparin protocol, too.
4. If we keep the medication as Heparin, then we keep the weight-based heparin protocol. Two people wanted to change the protocol to use the admission weight, instead of ‘patient’s weight today’. Mark “Accept” if you want to change to patient’s admission weight on the protocol. (Note: if we eliminate Heparin and change to Lovenox, this item won’t be included.
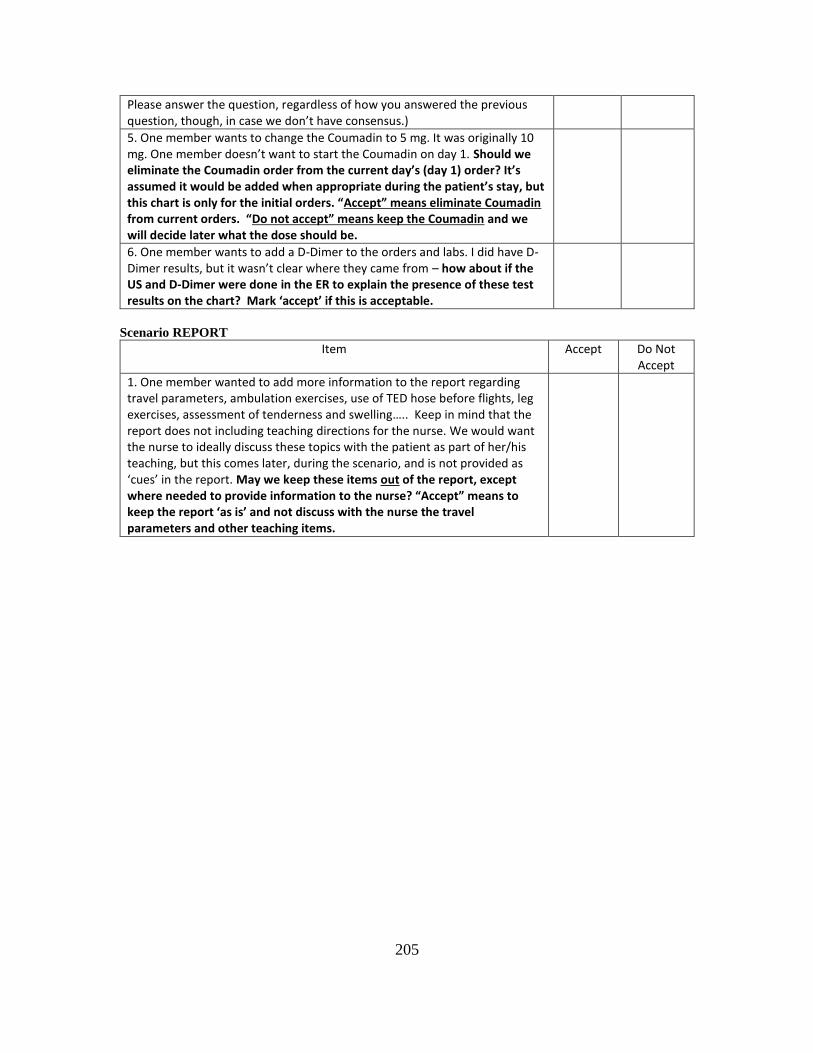
205
Please answer the question, regardless of how you answered the previous question, though, in case we don’t have consensus.)
5. One member wants to change the Coumadin to 5 mg. It was originally 10 mg. One member doesn’t want to start the Coumadin on day 1. Should we eliminate the Coumadin order from the current day’s (day 1) order? It’s assumed it would be added when appropriate during the patient’s stay, but this chart is only for the initial orders. “Accept” means eliminate Coumadin from current orders. “Do not accept” means keep the Coumadin and we will decide later what the dose should be.
6. One member wants to add a D-Dimer to the orders and labs. I did have D-Dimer results, but it wasn’t clear where they came from – how about if the US and D-Dimer were done in the ER to explain the presence of these test results on the chart? Mark ‘accept’ if this is acceptable.
Scenario REPORT
Item Accept Do Not Accept
1. One member wanted to add more information to the report regarding travel parameters, ambulation exercises, use of TED hose before flights, leg exercises, assessment of tenderness and swelling….. Keep in mind that the report does not including teaching directions for the nurse. We would want the nurse to ideally discuss these topics with the patient as part of her/his teaching, but this comes later, during the scenario, and is not provided as ‘cues’ in the report. May we keep these items out of the report, except where needed to provide information to the nurse? “Accept” means to keep the report ‘as is’ and not discuss with the nurse the travel parameters and other teaching items.