Embed Size (px)
Citation preview

TRANSPORTATION RESEARCH RECORD 1311
Comparison of the South Dakota Road Profiler with Other Rut Measurement Methods
]AMES B. DuBosE
During the fall of 1989, the Illinois Department of Transportation completed the construction of a profile-measuring van that was based on the South Dakota road profiler. One feature of the van is the ability to collect rut depths at highway speed at 2-ft intervals. The ability to collect more rut data and to do it more quickly and safely were of great interest to the department. However, no information was available that described how the data obtained with the road profiler would compare with manual rut measurements or rut measurements obtained with other automated systems. In an effort to determine if there was any correlation between the different rut-measuring methods, a number of experiments were conducted. Three method -(a) South Dakota road profiler, (b) PASCO, and (c) manual- were compared for a 7.5-mi stretch of FA 409 (US-50) in St. Clair and Clinton counties; the road profiler and manual methods were compared for all of the Interstate highways in District 5, located in east-central Illinois. In addition, the procedures used by each method were analyzed to theoretically determine how well the methods would agree and also to help explain any observed differences in the data . On the basis of the results of these experiments, recommendations were made describing the most appropriate use of the road profiler data.
During the fall of 1989, the Illinois Department of Transportation completed the construction of a profile-measuring van based on the South Dakota road profiler. One feature of the van is the ability to collect rut depths at highway speed at 2-ft intervals . The ability to collect more rut data and to do it more quickly and safely was of great interest to the department. However, no information was available that described how the data obtained with the road profiler would compare with manual rut measurements or rut measurements obtained with other automated systems.
In an effort to determine if there was any correlation between the different rut measuring methods, a number of experiments were conducted . Three methods-(a) South Dakota road profiler, (b) PASCO , and (c) manual-were compared for a 7 .5-mi stretch of FA 409 (US-50) in St. Clair and Clinton counties; the Road Profiler and manual methods were compared for all of the Interstate highways in District 5, located in east central Illinois. In addition, the procedures used by each method were analyzed to determine theoretically how well the methods would agree and also to help explain any observed differences in the data.
Illinois Department of Transportation, Bureau of Materials and Physical Research, 126 East Ash Street, Springfield, Ill. 62704-4766.
DESCRIPTION OF METHODS
The South Dakota road profiler uses three acoustic sensors to measure rut depths. These sensors are located as follows : (a) left wheelpath, (b) center of lane, (c) right wheelpath. The rut depth is defined as the average of the distances measured by the two outside sensors minus the distance measured by the center sensor. This quantity is equal to the height of the hump between the wheelpaths. Only one measurement is obtained at each location and separate readings cannot be determined for each wheelpath.
PASCO's method is a photographic one. A hair line projector is used to project a black line across the width of the pavement at night. The resulting image is then photographed using a pulse camera. For a pavement with no ruts, the black line will be perfectly straight. The line will be wavy for a rutted road. To obtain a quantitative measure of the amount of rutting present, PASCO digitizes the photographic images and corrects for the camera angle. A computer can then produce corrected images and measure the amount of rutting in each wheelpath.
The manual method is one that has been used in Illinois since 1985 . Measurements are made using a 6-ft aluminum beam and a measuring shoe. The measuring shoe looks like a miniature staircase from the side with each step representing an increment of 0.05 in . The largest increment that can be measured is 1 in. Rut readings are obtained by placing the beam across half of the lane and then randomly sliding the measuring shoe under the beam until the maximum reading is obtained. Separate measurements are made for each wheelpath.
THEORETICAL AND PRACTICAL CONSIDERATIONS
Even before conducting any field experiments , one can theorize that there will be instances where the three methods will not agree. The PASCO and manual methods measure basically the same thing, but use two different approaches. The fact that the manual readings are only recorded to the nearest 0.05 in. may affect the degree of correlation. The road profiler can only report one rut measurement at each location . This is supposed to be the average of the two wheelpath ruts, but is actually the height of the hump in the center of the lane. The following examples will illustrate that these two quantities are not the same.
2
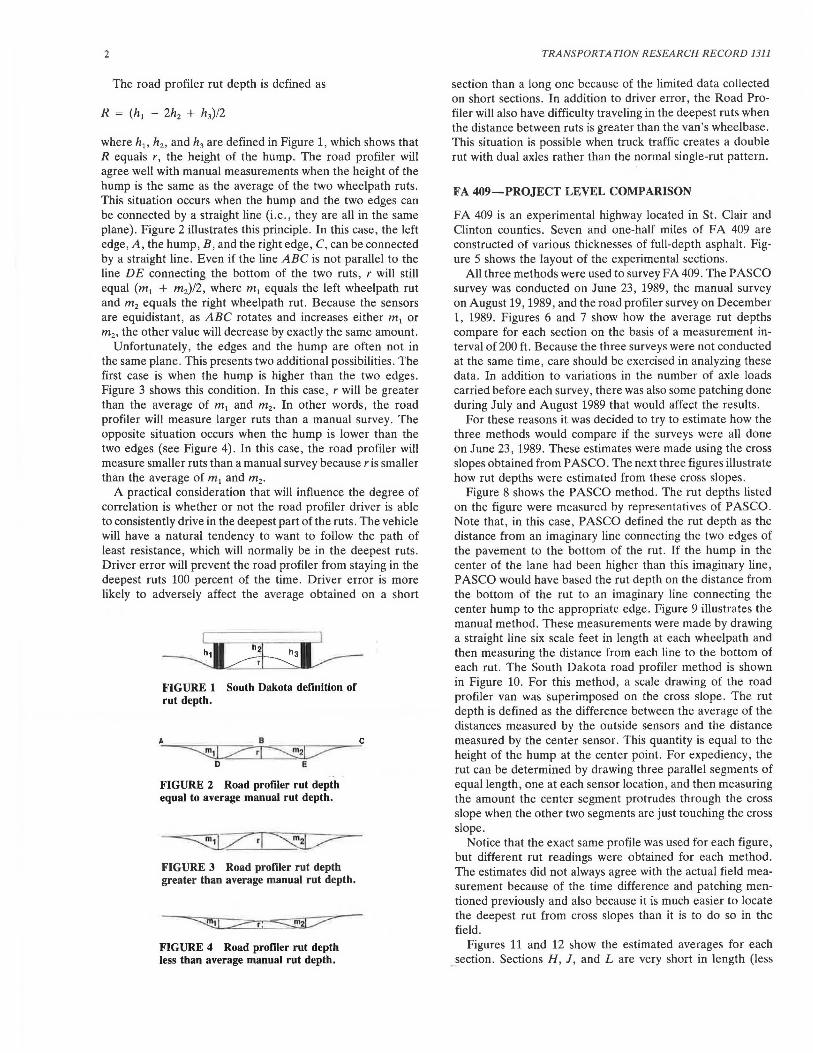
The road profiler rut depth is defined as
where ht> h2 , and h3 are defined in Figure 1, which shows that R equals r, the height of the hump. The road profiler will agree well with manual measurements when the height of the hump is the same as the average of the two wheelpath ruts . This situation occurs when the hump and the two edges can be connected by a straight line (i.e., they are all in the same plane). Figure 2 illustrates this principle. In this case, the left edge, A , the hump, B, and the right edge, C, can be connected by a straight line. Even if the line ABC is not parallel to the line DE connecting the bottom of the two ruts, r will still equal (m1 + m2)/2, where m1 equals the left wheelpath rut and m2 equals the right wheelpath rut. Because the sensors are equidistant, as ABC rotates and increases either m, or m2 , the other value will decrease by exactly the same amount.
Unfortunately, the edges and the hump are often not in the same plane. This presents two additional possibilities. The first case is when the hump is higher than the two edges. Figure 3 shows this condition. In this case, r will be greater than the average of m1 and m2 • In other words, the road profiler will measure larger ruts than a manual survey. The opposite situation occurs when the hump is lower than the two edges (see Figure 4). In this case, the road profiler will measure smaller ruts than a manual survey because r is smaller than the average of m1 and m2 •
A practical consideration that will influence the degree of correlation is whether or not the road profiler driver is able to consistently drive in the deepest part of the ruts. The vehicle will have a natural tendency to want to follow the path of least resistance, which will normally be in the deepest ruts . Driver error will prevent the road profiler from staying in the deepest ruts 100 percent of the time. Driver error is more likely to adversely affect the average obtained on a short
FIGURE I South Dakota definition of rut depth.
FIGURE 2 Road profiler rut depth equal to average manual rut depth.
FIGURE 3 Road profiler rut depth greater than average manual rut depth.
FIGURE 4 Road profller rut depth less than average manual rut depth.
TRA NSPORTATION RESEARCH RECORD 1311
section than a long one because of the limited data collected on short sections. In addition to driver error, the Road Profiler will also have difficulty traveling in the deepest ruts when the distance between ruts is greater than the van's wheelbase. This situation is possible when truck traffic creates a double rut with dual axles rather than the normal single-rut pattern.
FA 409-PROJECT LEVEL COMPARISON
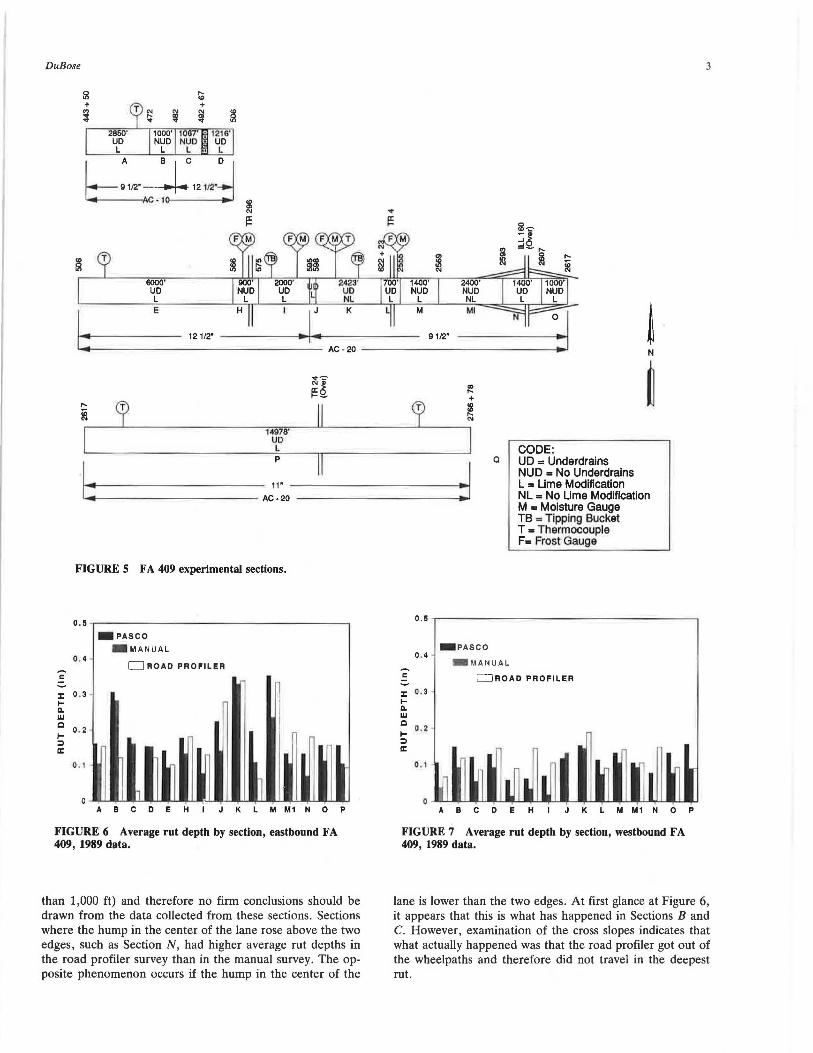
FA 409 is an experimental highway located in St . Clair and Clinton counties. Seven and one-half miles of FA 409 are constructed of various thicknesses of full-depth asphalt. Figure 5 shows the layout of the experimental sections.
All three methods were used to survey FA 409. The PASCO survey was conducted on June 23, 1989, the manual survey on August 19, 1989, and the road profiler survey on December 1, 1989. Figures 6 and 7 show how the average rut depths compare for each section on the basis of a measurement interval of 200 ft . Because the three surveys were not conducted at the same time, care should be exercised in analyzing these data. In addition to variations in the number of axle loads carried before each survey, there was also some patching done during July and August 1989 that would affect the results.
For these reasons it was decided to try to estimate how the three methods would compare if the surveys were all done on June 23, 1989. These estimates were made using the cross slopes obtained from PASCO. The next three figures illustrate how rut depths were estimated from these cross slopes.
Figure 8 shows the PASCO method. The rut depths listed on the figure were measured hy representatives of PASCO. Note that, in this case, PASCO defined the rut depth as the distance from an imaginary line connecting the two edges of the pavement to the bottom of the rut . If the hump in the center of the lane had been higher than this imaginary line, PASCO would have based the rut depth on the distance from the bottom of the rut to an imaginary line connecting the center hump to the appropriate edge. l'igure 9 illustrates the manual method. These measurements were made by drawing a straight line six scale feet in length at each wheelpath and then measuring the distance from each line to the bottom of each rut. The South Dakota road profiler method is shown in Figure 10. For this method, a scale drawing of the road profiler van was superimposed on the cross slope. The rut depth is defined as the difference between the average of the distances measured by the outside sensors and the distance measured by the center sensor. This quantity is equal to the height of the hump at the center point . For expediency, the rut can be determined by drawing three parallel segments of equal length, one at each sensor location, and then measuring the amount the center segment protrudes through the cross slope when the other two segments are just touching the cross slope.
Notice that the exact same profile was used for each figure, but different rut readings were obtained for each method. The estimates did not always agree with the actual field measurement because of the time difference and patching mentioned previously and also because it is much easier to locate the deepest rut from cross slopes than it is to do so in the field.
Figures 11 and 12 show the estimated averages for each section . Sections H, J, and L are very short in length (less
DuBose
T
T "' ~
2850' 1000' 1067' 1218' UD NUD NUD • UD L L L • L
6000' UD L E
I: AC - 20
"I""" "' .. !!=2.
::
14978' UD L p
11"
AC·20 I:
FIGURE 5 FA 409 experimental sections.
0.5 -PASCO
- MANUAL 0.4
c:::J ROAD PROFILER c -:z: 0 . 3 I-Q, w Q
0 . 2 1 I-:I a:
0 . ,
1 ~ l r A B C D E H J K L M Ml N 0 P
FIGURE 6 Average rut depth by section, eastbound FA 409, 1989 data.
than 1,000 ft) and therefore no firm conclusions should be drawn from the data collected from these sections. Sections where the hump in the center of the lane rose above the two edges, such as Section N, had higher average rut depths in the road profiler survey than in the manual survey. The opposite phenomenon occurs if the hump in the center of the
"I"
i:
~ "'
1400' 2400' NUD NUD
L NL M Ml
9112"
T
0 . 4
:z: 0. 3 I-Q, w Q 0 . 2 1-:::i a:
~ + is ~
I
:I
-PASCO
CODE: a UD = Underdrains
NUD • No Underdrains L = Lime Modification NL = No Lime Modification M = Moisture Gauge TB = Tipping Bucket T = Thermocouple F= Frost Gauge
-M ANUAL
CJ ROAD PROFILER
ABCDEH J K L M Ml N 0 P
FIGURE 7 Average rut depth by section, westbound FA 409, 1989 data.
3
lane is lower than the two edges. At first glance at Figure 6, it appears that this is what has happened in Sections B and C. However, examination of the cross slopes indicates that what actually happened was that the road profiler got out of the wheelpaths and therefore did not travel in the deepest rut.

4
(IN.)
1.00 0.75 0.50 0.25 0.00 0.25 0.50 0.75 1.00
0.24" 0.28"
=~= :-:=-- - =-=--====== -
2 3 4 6 6 7 8 9 10 11 12
(FT.)
FIGURE 8 PASCO rut depth measurement method.
(IN.)
1.00 0.75 0.50 0.20" 0.20"
0.25 r -:::::::;~::::::=-;::;-....... =-=::::::=:r:::::?--==~ 0.00 r I ___,,.,..- ---. 0 25 0.50 0.75 1.00
2 3 4 5 6 7 8 9 10 1 1 12
(FT.)
FIGURE 9 Manual rut depth measurement method.
(IN.)
1.00 0.75 0.50 0.25 0.00 0.25 0.50 0.75 1.00
0.12"
2 3 4 5 6 7 8 9 10 11 12
(FT.)
FIGURE 10 South Dakota road profiler rut depth measurement method.
DISTRICT 5 INTERSTATES-NETWORK LEVEL COMPARISON
The Interstate system in District 5 was tested with the South Dakota road profiler during December 1989. The data obtained were compared with data obtained manually during
TRANSPOR TATION RESEA RCH RECORD 1311
-PASCO - ES T M ANU AL
0 . 4 c::::J EST ROAD PROFILER
c ::. :c 0 . 3 -
""' Cl. w Q
0 . 2
""' ::I a:
0 . 1
0 A B c D E H
l j
I
K L · M · M1 N 0 P
FIGURE 11 Estimated average rut depth by section, eastbound FA 409, 6/23/89 data.
0 . 4
c
:c 0 .3
""' Cl. w Q
""' 0. 2 ::I a:
0 . 1
-PASCO
- ES T M A NUA L
c::::::::J EST ROAD PROFILER
A B C D E H K L M M1 N 0 P
FIGURE 12 Estimated average rut depth by section, westbound FA 409, 6/23/89 data.
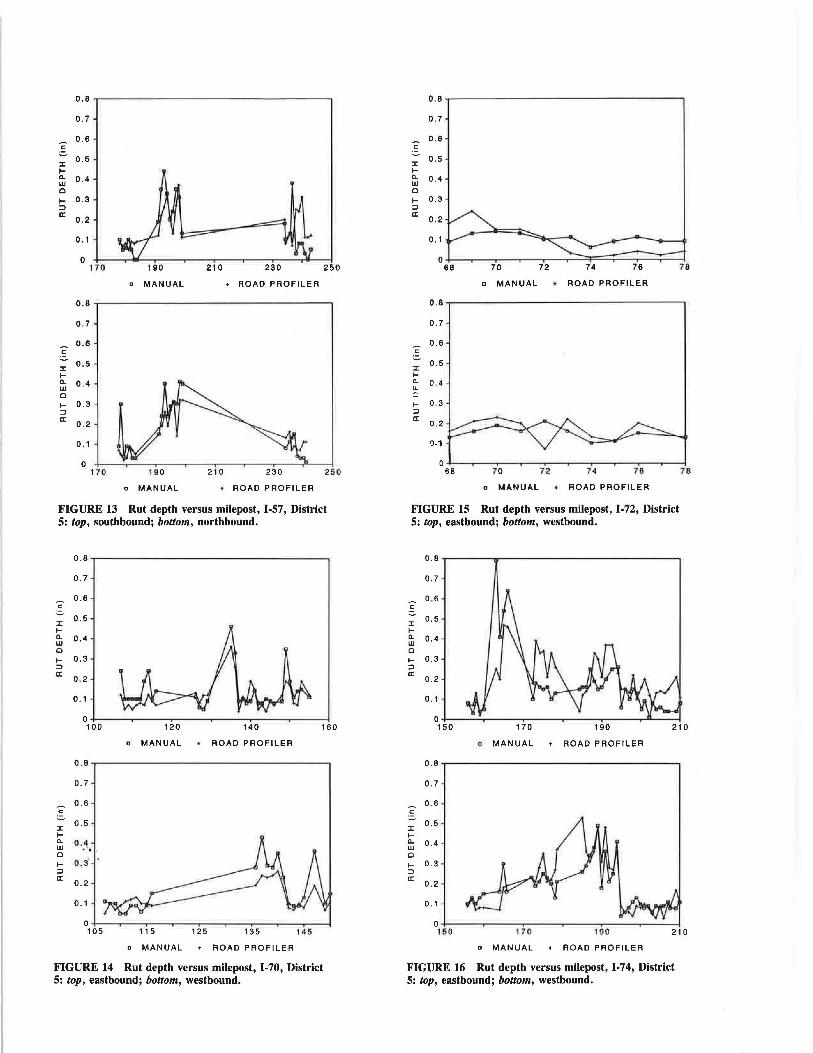
the Summer of 1989 as part of the Illinois Pavement Feedback System (IPFS). The rut values obtained from the IPFS survey were based on the average of four measurements in a 500-ft sample unit. The four measurements were taken in the following manner: one in each wheelpath at the beginning of the sample unit and one in each wheelpath at the end of the sample unit. The road profiler data were summarized at 0.1-mi (528-ft) increments on the basis of the average of 264 readings. For this comparison, the manual survey averages were compared with the road profiler average for the 0.1-mi segment that was located closest to the sample unit. The results of this comparison are plotted separately for each Interstate route and direction and are shown in Figures 13-16.
The two methods did not compare exactly , but in most cases appeared to indicate the same trends. A number of factors could have aff ted the c mparison. Comparing the average of four mea urements with the average of 264 measurements is a rather tenuous procedure for a quantity as variable as rut depth. Also, the time difference between surveys probably affected the results. However, even if all of these factors cou Id be controlled, the two methods would still not agree exactly because they do not measure ruts in the same manner. Some encouragement can at least be found in the fact that the two methods seem to indicate the same general trends.
0.8
0. 7
c 0.6
- 0.5 :i:: I-D.. 0.4 w c I- 0.3 :> a:
0.2
0.1
0 170 190 210 230 250
a MANUAL + ROAD PROFILER
0.8
0.7
c 0.6
-:i::
0 . 5 I-D.. 0.4 w c I- 0.3 :> a:
0.2
0.1
0 170 190 2 10 230 250
a MANUAL . ROAD PROFILER
FIGURE 13 Rut depth versus milepost, I-57, District 5: top, southbound; bottom, northbound.
0.8
0. 7
c 0.6
:i:: 0.5
I-D.. 0.4 w c I- 0.3 :> a:
0 . 2
0.1
0 100 120 140 160
a MANUAL ROAD PROFILER
0.8
0. 7
c 0.6
:i:: 0.5
I-D.. w c I- 0.3· :> a:
0.2
0.1
a MANUAL + ROAD PROFILER
FIGURE 14 Rut depth versus milepost, I-70, District 5: top, eastbound; bottom, westbound.
0 .8
0. 7
c 0.6
- 0.5 :i:: I-D.. 0.4 w c I- 0.3 :> a:
0.2
0.1
70 72 74 76
a MANUAL • ROAD PROFILER
0.8
0. 7
c 0.6
:i:: 0.5
I-a. 0 . 4 u.
.... 0 . 3 :> a:
0 . 2
!J-1
0 68 7 0 72 74 76
a MANUAL . ROAD PROFILER
FIGURE 15 Rut depth versus milepost, I-72, District 5: top, eastbound; bottom, westbound.
0.7
c 0 . 6
-:i:: 0.5 ID.. w c 1-:> a:
0.4
0.3
0.2
0.1
78
78
0+-~~.,-~~--.-~~~r-~~.,--~~-r-~~-;
150
0.7
c 0 . 6
-:i:: 0.5 I-D.. w c
0.4
I- 0.3 :> a:
0.2
0.1
170 190 210
a MANUAL + ROAD PROFILER
O +-~~-.-~~--.-~~~...-~~.,--~~-r-~~~
15 0 '170 190 210
a MANUAL + ROAD PROFILER
FIGURE 16 Rut depth versus milepost, I-74, District 5: top, eastbound; bottom, westbound.
6
SUMMARY
There are fundamental differences in the way the three methods discussed in this paper measure ruts . Factors such as the shape of the pavement cross slope and driver error can dramatically affect the correlation between ruts obtained using the road profiler and other methods. The stepped increment of O.OS in . used in the manual method may also affect the correlation.
P ASCO's rut measurement method appears to be an accurate one. However, this option has some other considerations that make it less attractive. It requires either buying the equipment, which is expensive, or contracting PASCO to provide the service. Contracting with PASCO is also expensive and requires advance notice to schedule a project for testing. After the project is tested , it may take several months to receive the data.
Despite its limitations, the South Dakota road profiler has some intriguing properties . Its relatively low cost and ability to collect rut data at SS mph at 2-ft intervals make its use an attractive option for state highway departments . Illinois' experience has indicated rut depth to be a highly variable property. Because of this variability, it may be more useful to the department to have a large quantity of road profiler data, even if it is less accurate, than the amount of manual data it currently can collect , which is limited by manpower constraints . In addition, because of safety constraints , high traffic areas such as the Chicago area expressways can only be surveyed using an automated method such as the South Dakota road profiler.
TRANSPORTATION RESEARCH RECORD 1311
RECOMMENDATIONS
A reasonable procedure is to use the South Dakota road profiler to collect rutting data on a network basis. After the data have been collected, they can be analyzed by the individual highway districts. Because the districts deal with these highways on a daily basis , they may have opinions about whether or not the data seem accurate. If a district feels that the data are in error, manual measurements can be taken to validate or invalidate the data.
FURTHER RESEARCH
Research should be undertaken to determine the proper definition of the rut depth. All three methods differ in the way they define the rut depth. The following questions should be studied:
1. Should rut depth measurements be relative to a level reference in order to predict the depth of water that can accumulate?
2. Is the hump in the center of the lane a useful quantity for performance prediction?
Publication of this paper sponsored by Committee on Surface Properties- Vehicle Interaction.


![(1311 AquaChile's Corporate Presentation [Sólo lectura])](https://img.pdfslide.us/doc/110x75/58a1ac921a28ab90228befdb/1311-aquachiles-corporate-presentation-solo-lectura.jpg)