Embed Size (px)
Citation preview
84 Transportation Research Record 905
Comparison of SOAP and NETSIM: Pretimed and
Actuated Signal Controls
ZOLTAN A. NEMETH AND JAMES R. MEKEMSON
Delay and fuel-consumption rates estimated by the relatively easy-to-use, deterministic Signal Operations Analysis Package (SOAP) were compared with results generated by the microscopic and stochastic Network Simulation Model (NETSIM). The study involved three cases of isolated signalized intersections: two-phase pretimed controller, two-phase fully actuated controller, and multiphase pretimed controller. More than 80 combinations of left-turning and through traffic volumes were investigated in each case. Whereas SOAP estimates excess fuel consumption at intersections, NETSIM generates total fuel consumption. The difference between the two was found to be fairly uniform and corresponded to a realistic 18-mile/gal fuel efficiency under uninterrupted 30-mph flow conditions. In terms of delay prediction, SOAP and NETSIM are found to be entirely compatible after the differences in delay definitions, SOAP's more conservative left-turn saturation-flow-rate relationship, and NETSIM's delay sensitivity to unit extensions for actuated signal controllers were taken into account. In addition, the volume/capacity ratio at which SOAP begins to overestimate delay due to the use of Webster's delay equation may be lower than now assumed. Last, the difference between SOAP and NETSIM average delays can probably be reduced by a more studied coordination between SOAP and NETSIM input parameters. Evidence is offered to the operating engineer that the easy-to-use SOAP produced results supported by the sophisticated NETSIM.
Poorly timed traffic signals result in the inefficient use of intersection capacity and contribute to delay and fuel waste. The considerable amount of research effort that has been directed in the past at the problem of efficient signal timing has resulted in a variety of tools that range from relatively easily applied computer programs to sophisticated and complex digital simulation models.
The Network Simulation Model (NETSIM) is an example of a complex digital simulation model. It was developed for the Federal Highway Administration (FHWA) (_!.). Peat, Marwick, Mitchell and Company and General Applied Science Laboratories developed the UTCS-1, the earlier version of the model. Although it is basically a network simulation model, it is also applicable to the analysis of a single signalized intersection. The Signal Operations Analysis Package (SOAP) is one example of a relatively easyto-use tool. It offers a practical method of signal timing and intersection performance evaluation in the form of a computer program. This program was developed for the Florida Department of Transportation and FHWA by the University of Florida. The implementation package has been widely distributed (2).
Although SOAP and NETSIM are very different - in their computational base, they are generally assumed to produce realistic results. Whereas SOAP is a deterministic, macroscopic model based on a set of simple equations, NETSIM is a stochastic, microscopic, digital simulation model that handles each vehicle separately. NETS IM is based on car-following and lane-changing rules; it considers different vehicle types and also recognizes conflicts between left turns and oncoming traffic as well as the impact of traffic that is backed up from the preceding intersection.
SOAP is a relatively simple method to use, whereas in comparison NETS IM is very complex. The difference raises a very intriguing question: Can SOAP and NETS IM produce compatible results under similar traffic conditions? A positive answer would of course reflect favorably on both NETSIM and SOAP.
OBJECTIVE AND SCOPE OF STUDY
The objective of this study was to apply both SOAP
and NETSIM in the analysis of a signalized intersection and compare generated delays and fuel consumption for consistency. Three cases were investigated.
Case 1 involved the intersection of two two-lane roadways. Left-turn lanes were added on all approaches. The intersection was controlled by a pretimed two-phase signal.
Case 2 involved the same intersection layout but the signal control was changed. A fully actuated two-phase traffic signal was specified in this case.
Case 3 involved the intersection of two four-lane roadways. Left-turn bays were added on each approach. The intersection was controlled by a pretimed multiphase signal. Left-turn phases were provided for all left-turning movements.
In each case, the east-west roadway was considered the minor street. Approach volumes and left-turn percentages were held constant on this roadway in each case. Seventy percent of the majorstreet volume was northbound and 30 percent was southbound. At least 80 combinations of intersection volumes and left-turn percentages were investigated in each case.
DEFINITION OF SELECTED PERFORMANCE MEASURES
Delay and fuel consumption were selected as performance measures.
Average Delay
SOAP uses the widely known Webster delay formula to estimate delay:
d = [c(l - A)2 /1(1 - Ax)] + [x2 /2q(l -x)) -0.65(c/q2 ) 113 x (2 + 5~) (!)
where
d delay per vehicle (s) on particular movement of intersection approach,
c = cycle length (s), X proportion of effective green time (g) given
to movement (i.e., g/c), q approach flow (vehicles/s) , x =degree of saturation (i.e., q/xs), and s = saturation flow (vehicles/s) •
From these average delays, total delays per approach and, by summation, total intersection delays are calculated. From total intersection delays the average delay to all vehicles passing through the intersection is cletermlned. (Further references tu average delay in this paper will be to this average delay.)
Delay is defined in SOAP as the difference in average travel time through the intersection and the travel time for a vehicle that is not stopped or slowed down by a signal.
The definition of delay in NETSIM appears to be identical: Total delay time is computed as the difference between the total travel time and idealized travel time for each link based on a designated target speed. However, a significant difference is introduced by the microscopic nature of NETSIM, in that each vehicle is assigned an individual target
Transportation Research Record 905
speed, which ranges from 75 to 127 percent of the link target speed. The travel time of a vehicle is thus influenced not only by the traffic signal, but also by friction among individual vehicles within the traffic stream. Since the total length of the upstream and downstream links simulated in NETSIM for this study amounts to 4000 ft, a significant proportion of the total delay may be unrelated to the traffic signal itself.
Delays generated by NETS IM, therefore, could be expected to be higher than delays calculated by Webster's delay equation, since the latter is based on estimated time spent in queue.
Total Delay
Total delay is defined by both NETSIM and SOAP as the product of average delay and total intersection volume.
Fuel Consumption
The definitions of fuel consumption are clearly different in the two methods.
NETSIM generates the total gallons of fuel consumed by all vehicles. The computation is based on an assumed proportion of vehicle types and corresponding fuel-consumption rates by each type during idling, accelerating, and traveling at a given speed.
SOAP, on the other hand, computes only the excess fuel consumption due to idling delays and accelerations from stopped positions. Two equations are used to calculate these two components.
If the two methods are compatible, NETSIM total fuel consumption is expected to be consistently higher than SOAP excess fuel consumption by a fairly uniform amount.
STUDY PROCEDURES
SOAP was first run to compute the optimal cycle lengths and splits for each 30-min simulation period corresponding to the different volume combinations. The signal timing selected by SOAP was then specified for NETSIM as input.
In general, inputs were specified for both NETSIM and SOAP with care in order to achieve maximum compatibility. No grades, parking, or pedestrian interference were assumed. Desired free-flow speed was specified as 30 mph.
Delays and fuel-consumption levels were then generated by both SOAP and NETSIM.
Scatter plots and regression equations were developed as a first step to establish that the patterns of delays and fuel consumption generated by the two methods under the different conditions were consistently similar and that the differences in actual values did not conflict with what is expected due to the differences in definitions, as explained above.
The regression analysis p r esented in Table 1 indicates that the differences were very consistent, and, as expected, NETSIM produced higher average delay and higher fuel consumption.
ANALYSIS OF DIFFERENCES
Average Dela y
Case 1: Pretimed Two-Phase
In Figures 1, 2, 3, and 4, average delays predicted by SOAP and NETSIM are presented related to total intersection volumes and left-turn percentages on the major roadway.
As stated earlier, directional distribution on
Table 1. Correlation between NETSIM and SOAP outputs.
Sample R2 Case Size Regression Equation SE
80 ADNET = 4.432 + l .333ADSO 0.911 l.898 FCNET = 2.903 + 5 .203FCSO 0.991 0.743
2 88 ADNET=7.832+ l.85ADSO 0.863 1.643 FCNET = 4.463 + 4.92FCSO 0.985 0.951
3 85 ADNET = -6.174 + l .294ADSO 0.936 1.602 FCNET = 19.673 + 2.800FCSO 0.991 0.689
Notes: These equations were developed for the sole purpose of testing the level of correlation. ADNET = NETSIM average delay (s); ADSO = SOAP average delay (s); FCNET = NETSIM total fuel consumption (gal); FCSO =SOAP excess fuel consumption (gal) .
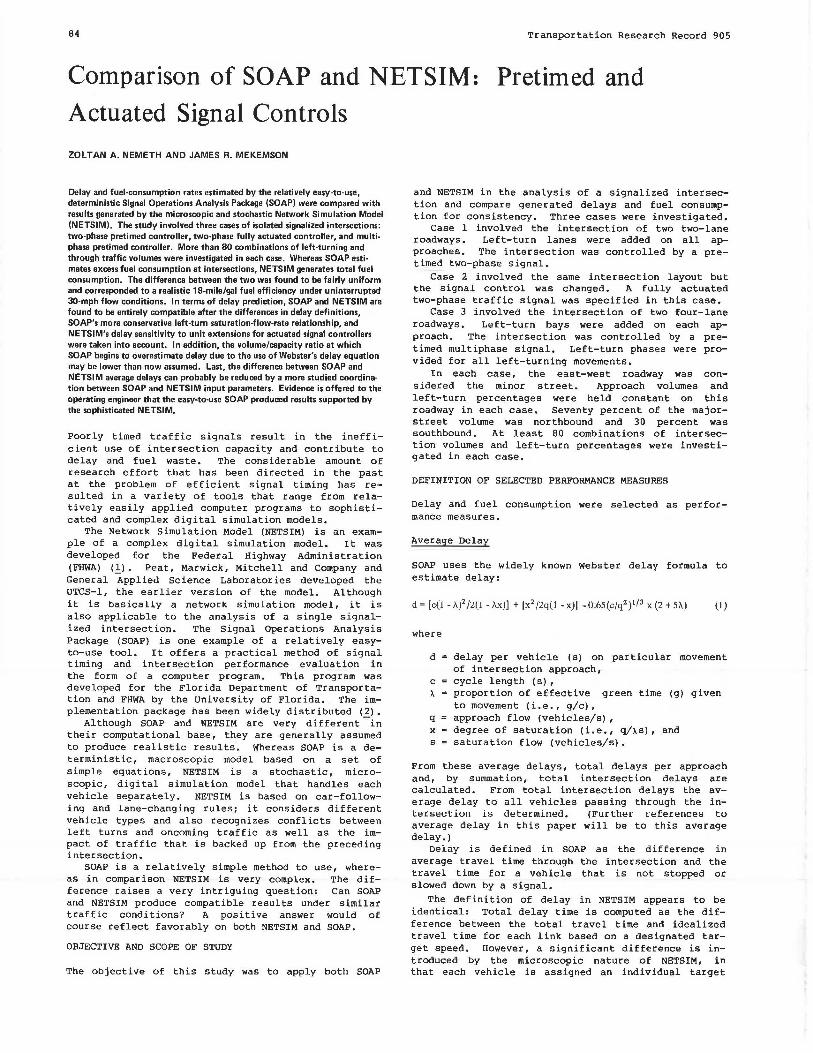
Figure 1. Average delay profiles: SBLT, 30 percent (case 1).
Figure 2. Average delay profiles: SBL T, 5 percent (case 11.
Figure 3. Average delay profiles: NBLT, 5 percent (case 11.
--- NETSIM
--SOAP
&oo'-----,400'----,-6~00---.~800
Volumes ,vph
~
~ ' "
40
~ .. 30 ,.. 0
'" Cl ., 20
"' ~ ~
---NETSIM
--SOAP
llIDQ 1600
Volumes , vph
---NETSIM
--SOAP
MOO 1600
Volumes , vph
-20
1000
'800
BS
86
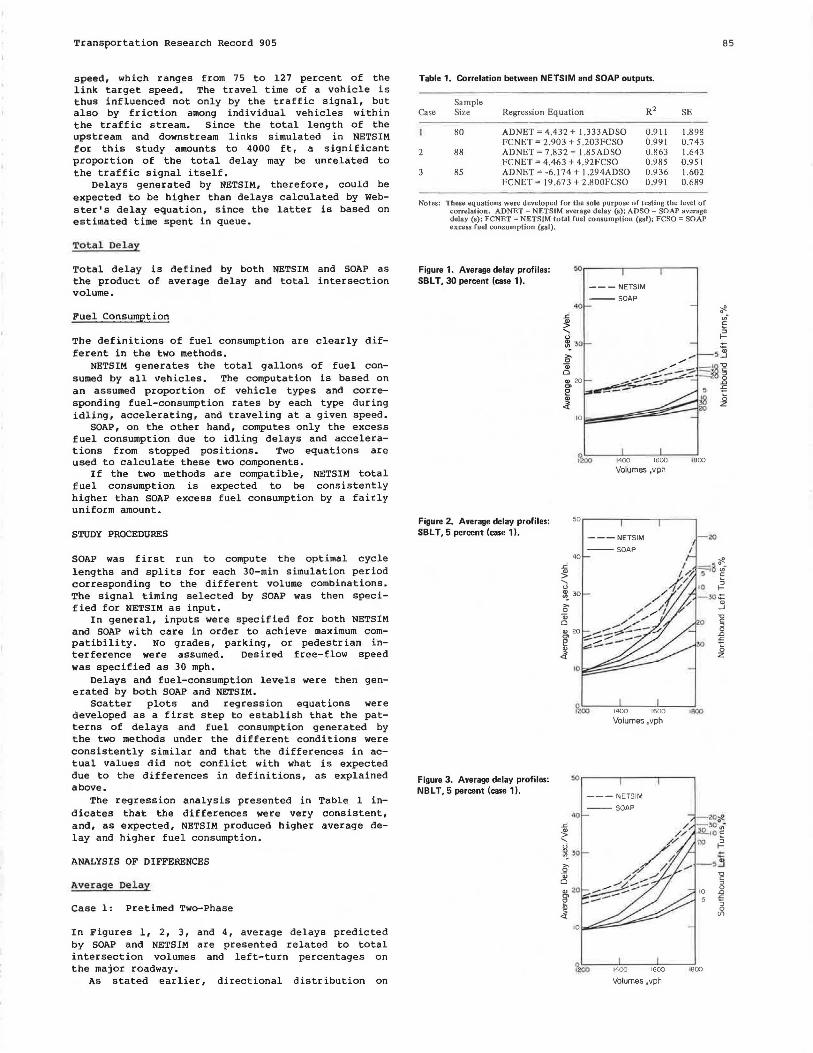
Figure 4. Average delay profiles: NBL T, 30 percent (case 1 ).
"" Cl Qi 0
•O
., 20 Cl'
j
--- NETSIM
--SOAP
1400 1600
Volumes , vph 1800
the major street was 70 percent northbound and 30 percent southbound. In Figures 1 and 2, southbound left-turn (SBLT) percentages were held constant, and northbound left-turn (NBLT) percentages and intersection volumes were varied. In Figures 3 and 4, the NBLT percentages were held constant.
The following observations can be made:
1. There is a fairly uniform 7. 5- or 8-s basic difference in average delays between SOAP and NETSIM in the lower volume range. At the specified 30-mph free-flow (or target) speed, this difference corresponds to an approximate 2.4-mph drop in average speeds within NETSIM. It is not unreasonable to assume that the simulated internal friction, as explained in the definition of NETSIM average de'lay, could realistically account for that much speed difference.
2. The second observation is that the patterns of delays predicted by SOAP and NETSIM as volumes and left-turn percentages were varied are similar in all four figures. The only major exception to this second observation is the high NETSIM delay estimate seen in Figure 2 for an intersection volume of 1800 with 20 percent NBLT. This particular data point demonstrates the highly stochastic nature of NE'l'SIM and therefore the occasional random appearance of a measure of performance outside the general pattern of results.
3. The difference in delays between NETSIM and SOAP is observed to be less uniform at the higher intersection volume levels in Figures 2 and 3. A possible explanation for the nonuniform delay differences may be the more conservative left-turn saturation-flow-rate relationship within SOAP as compared with NETSIM. This would result in higher degrees of saturation and therefore higher delay estimates in SOAP.
In general, average delays increase as intersection volumes increase. Delays, however, increase especially rapidly with increased intersection volumes when
1. SBLT percentages are high (compare Figure 1 with Figure 2 and note that SBLT percentages are 5 and 30 percent, respectively) and
2. NBLT percentages are low (compare Figure 3 with Figure 4 and note that NBLT percentages are 5 and 30 percent, respectively) •
A review of the approach-by-approach distribution of total delays at an extreme combination of northbound (5 percent) and southbound (20 percent) leftturn percentages will help to understand the above observations (intersection volume, 1800 vehicles/h;
Transportation Research Record 905
cycle length, 90 s; 82.6/17.4 percent):
major/minor green split,
Type of Delay Total Northbound
Through lane Left lane
Southbound Through lane Left lane
Minor Through lanes (each) Left lanes (each)
Hours per 30-Min Period 7.973
0.902 0 .049
0.132 1. 300
2.378 0.417
At any given approach volume, low NBLT percentages correspond to high northbound through percentages and also to high conflicts between northbound through and SBLTs. The high delay on the SBLT lane (corresponding to low NBLT) thus becomes understandable.
However, the major source of high average intersection delay is the delay on the minor street. Apparently, the long cycle time (90 s) and short minor green phase ( 17. 4 percent) created a nearly saturated condition on the minor street.
In conclusion, the pattern of average delays under various volume and left-turning percentages as calculated by the Webster delay equation in SOAP is similar to that generated by the stochastic NETSIM model for case 1. At least some of the differences in average delays (NETSIM delays are higher than SOAP delays) can be related to the travel-time delay simulated in NETSIM over the 2000-ft approach link and 2000-ft-long departure link. Some of the nonuniform delay differences might be attributed to different left-turn saturation-flow-rate relationships in the two models.
Case 2: Actuated Two-Phase
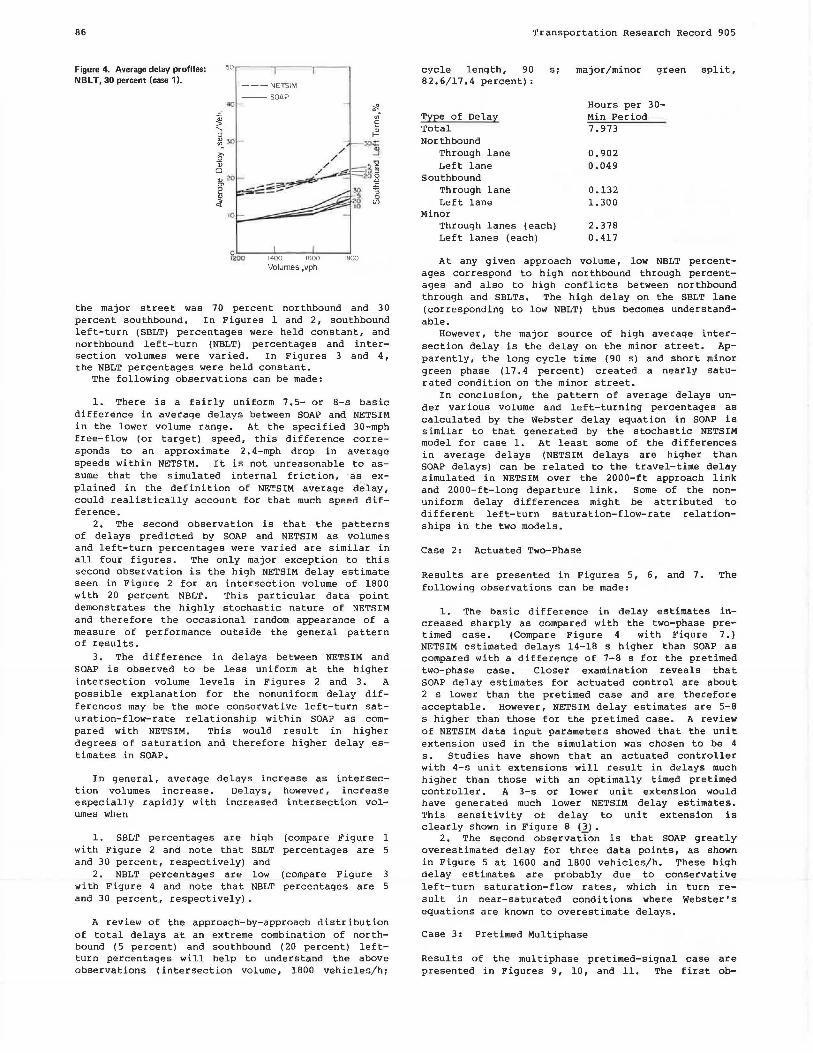
Results are presented in Figures 5, 6, and 7. The following observations can be made:
1. The basic difference in delay estimates increased sharply as compared with the two-phase pretimed case. (Compare Figure 4 with Figure 7.) NETSIM estimated delays 14-18 s higher than SOAP as compared with a difference of 7-8 s for the pretimed two-phase case. Closer examination reveals that SOAP delay estimates for actuated control are about 2 s lower than the pretimed case and are therefore acceptable. However, NETSIM delay estimates are 5-8 s higher than those for the pretimed case. A review of NETSIM data input parameters showed that the unit extension used in the simulation was chosen to be 4 s. Studies have shown that an actuated controller with 4-s unit extensions will result in delays much higher than those with an optimally timed pretimed controller. A 3-s or lower unit extension would have generated much lower NETSIM delay estimates. •rhis sensitivity of delay to unit extension is clearly shown in Figure 8 (3) •
2. The second observation is that SOAP greatly overestimated delay for three data points, as shown in Figure 5 at 1600 and 1800 vehicles/h. These high delay estimates are probably due to conservative left-turn saturation-flow rates, which in turn result in near-saturated conditions where Webster's equations are known to overestimate delays.
Case 3: Pretimed Multiphase
Results of the multiphase pretimed-signal case are presented in Figures 9, 10, and 11. The first ob-
Transportation Research Record 905
servation is that NETSIM and SOAP results are very close. NETSIM delays tend to be higher by a few seconds only, except at the highest intersection volume, at which differences in delay increase. The small delay differences at the lower volume levels are a result of reduced friction between vehicles of varying target speeds in NETSIM. This reduction in friction is due to a segregation of vehicles with respect to individual target speeds between the two lanes on each approach and exit link. In general, as volume increases, segregation of vehicles with respect to target speeds declines due to fewer lanechanging opportunities, and hence NETSIM-simulated delay increases. The patterns of delay correspond-
Figure 5. Average delay profiles: NBL T, 5 percent (case 2) .
Figure 6. Average delay profiles: NBLT, 20 percent (case 2).
Figure 7. Average delay profiles: NBLT, 30 percent (case 2).
---NETSIM
--- SOAP oo
0 1200 1400 161)()
Volumes 1 vph
50
---NETSIM
--SOAP •o
.c. ~ .._ <.l ~ .lO-.;. c
~ ~ w ~ Q) > <t
10
<> 1200 1400 1600
Volumes , vph
---NETSIM
---SOAP
1.1:100 1600
Volumes , vph
1800
a:
1800
1800
87
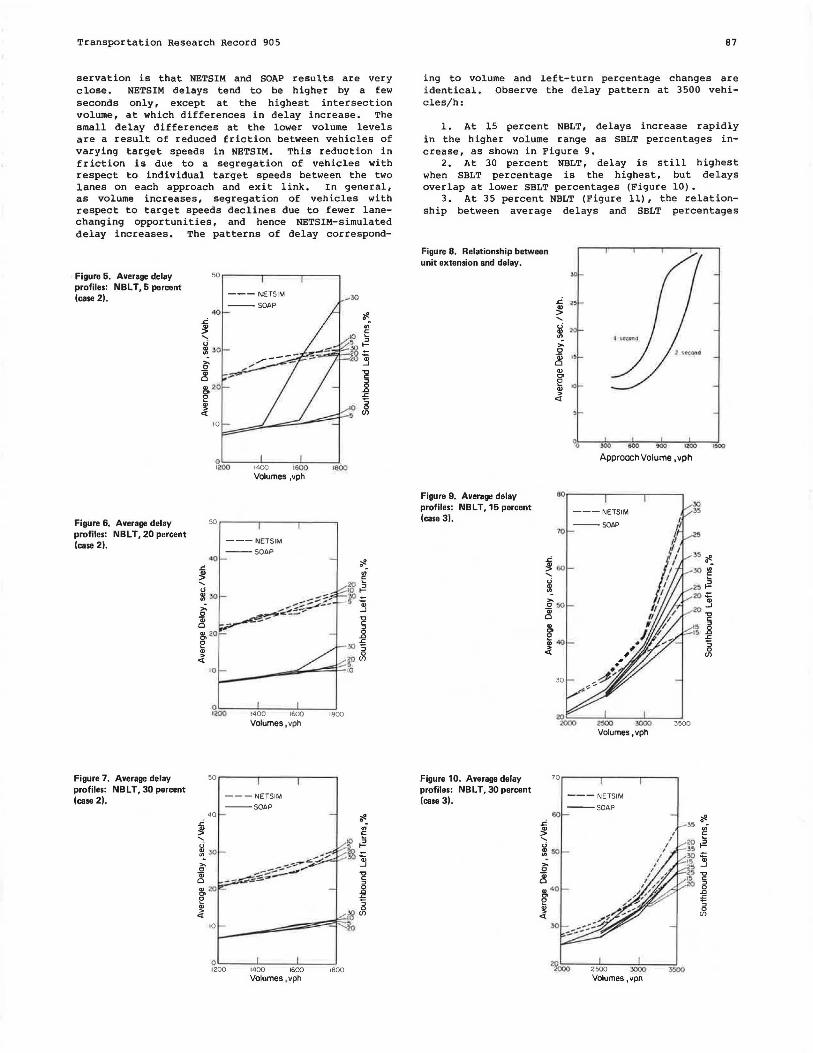
ing to volume and left-turn percentage changes are identical. Observe the delay pattern at 3500 vehicles/h:
1. At 15 percent NBLT, delays increase rapidly in the higher volume range as SBLT percentages increase, as shown in Figure 9.
2. At 30 percent NBLT, delay is still highest when SBLT percentage is the highest, but delays overlap at lower SBLT percentages (Figure 10) •
3. At 35 percent NBLT (Figure 11), the relationship between average delays and SBLT percentages
Figure 8. Relationship between unit extension and delay.
Figure 9. Average delay profiles: NBLT, 15 percent (case 3).
Figure 10. Average delay profiles: NBLT, 30 percent (case 3).
.&. ., > .._
~ ,.. 0
~ ., Cl
~ ., >
<t
"" >O
••
'°
"o 12¢0
Approach Volume , vph
2500 3000 Volumes, vph
---NETSIM
--- SOAP
3500
290oo----,2~5~00,..---~3000""",----..,-,!~. Volumes , vph
88
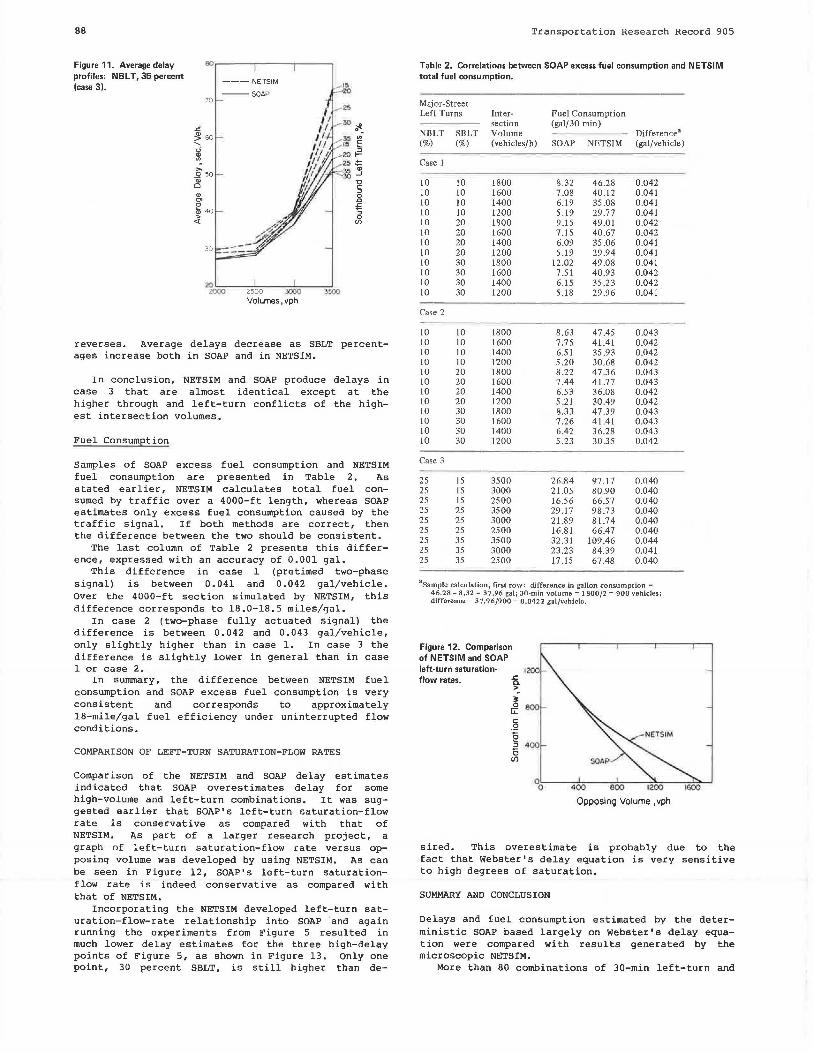
Figure 11. Average delay profiles: NBL T, 35 percent (case 3).
70
"' ..2 50 Q)
Cl Q)
"' 0 ~ 40 '.>
<I
30
---NETSIM
?0.!000'=7~-----,2-50~0,------~~.lOOO~~~-':.oo
Volumes, vph
reverses. Average delays decrease as SBLT percentages increase both in SOAP and in NETSIM.
In conclusion, NETSIM and SOAP produce delays in case 3 that are almost identical except at the higher through and left-turn conflicts of the highest intersection volumes.
Fuel Consumption
Samples of SOAP excess fuel consumption and NETSIM fuel consumption are presented in Table 2. As stated earlier, NETSIM calculates total fuel consumed by traffic over a 4000-ft length, whereas SOAP estimates only excess fuel consumption caused by the traffic signal. If both methods are correct, then the difference between the two should be consistent.
The last column of Table 2 presents this difference, expressed with an accuracy of 0.001 gal.
This difference in case 1 (pretimed two-phase signal) is between 0.041 and 0.042 gal/vehicle. Over the 4000-ft section simulated by NETSIM, this difference corresponds to 18.0-18.5 miles/gal.
In case 2 (two-phase fully actuated signal) the difference is between 0.042 and 0.043 gal/vehicle, only slightly higher than in case 1. In case 3 the difference is slightly lower in general than in case 1 or case 2.
In summary, the difference between NETSIM fuel consumption and SOAP excess fuel consumption is very consistent and corresponds to approximately 18-mile/gal fuel efficiency under uninterrupted flow conditions.
COMPARISON OF LEFT-TURN SATURATION-FLOW RATES
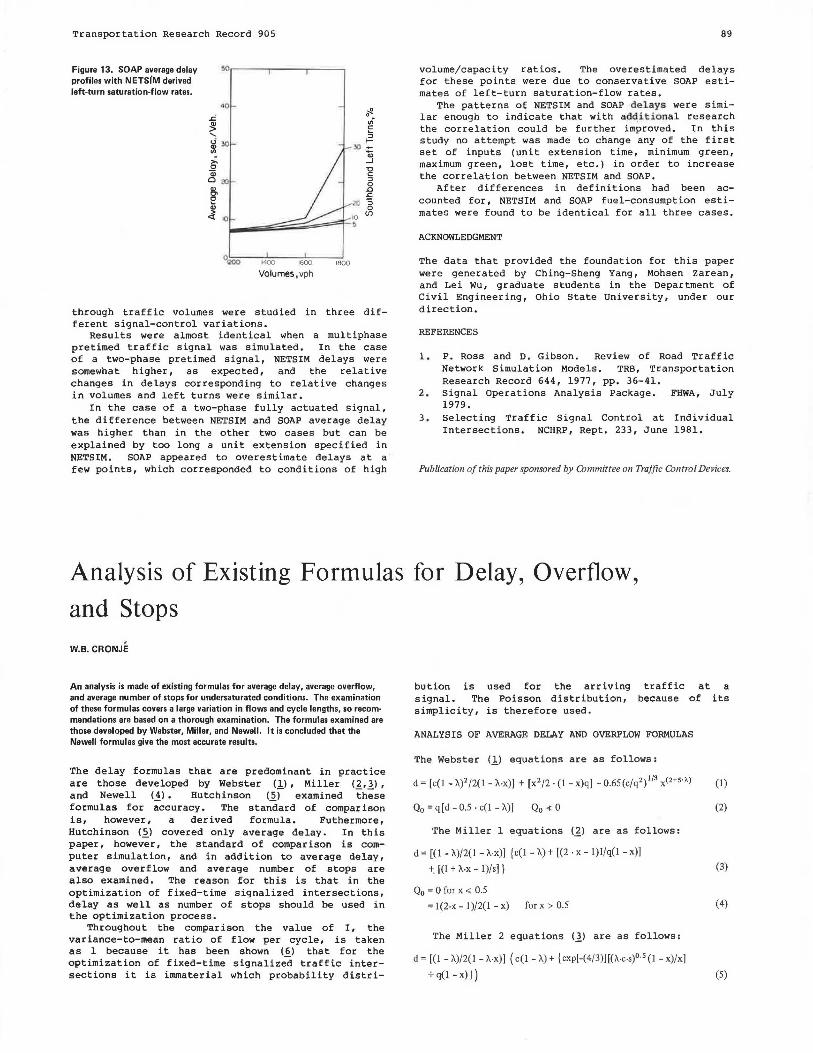
Comparison of the NETS IM and SOAP delay estimates indicated that SOAP overestimates delay for some high-volume and left-turn combinations. It was suggested earlier that SOAP's left-turn saturation-flow rate is conservative as compared with that of NETSIM. As part of a larger research project, a graph of left-turn saturation-flow rate versus opposing volume was developed by using NETSIM. As can be seen in Figure 12, SOAP' s left-turn saturationflow rate is indeed conservative as compared with that of NETSIM.
Incorporating the NETSIM developed left-turn saturation-flow-rate relationship into SOAP and again running the experiments from Figure 5 resulted in much lower delay estimates for the three high-delay points of Figure 5, as shown in Figure 13. Only one point, 30 percent SBLT, is still higher than de-
Transportation Research Record 905
Table 2. Correlations between SOAP excess fuel consumption and NETSIM total fuel consumption.
Major-Street Left Turns Inter- Fuel Consumption
section (gal/ 30 min) NBLT SBLT Volume Difference" (%) (%) (vehicles/h) SOAP NET SIM (gal/vehicle)
Case 1
10 10 J800 8.32 46.28 0.042 JO 10 1600 7.08 40.12 0.041 JO 10 1400 6.19 35.08 0.041 10 10 1200 5.19 29.77 0.041 JO 20 1800 9.15 49.01 0.042 10 20 1600 7.15 40.67 0.042 10 20 1400 6.09 35.06 0.041 JO 20 1200 5.19 29.94 0.041 10 30 1800 12.02 49.08 0.041 10 30 1600 7 .51 40.93 0.042 JO 30 1400 6.15 35.23 0.042 10 30 1200 5.18 29.96 0.041
Case 2
10 10 1800 8.63 47.45 0.043 10 10 1600 7.75 41.41 0.042 10 10 1400 6.51 35.93 0.042 10 10 1200 5.20 30.68 0.042 10 20 1800 8.22 47.36 0.043 10 20 1600 7.44 41.77 0.043 10 20 1400 6.53 36.08 0.042 10 20 1200 5.21 30.49 0.042 10 30 1800 8.33 47.39 0.043 10 30 1600 7.26 41.41 0.043 10 30 1400 6.42 36.28 0.043 10 30 1200 5.23 30.35 0.042
Case 3
25 15 3500 26,84 97.17 0.040 25 15 3000 21.05 80.90 0.040 25 J5 2500 16.56 66.57 0.040 25 25 3500 29.17 98.73 0.040 25 25 3000 21.89 81.74 0.040 25 25 2500 16.81 66.47 0.040 25 35 3500 32.31 109.46 0.044 25 35 3000 23.23 84.39 0.041 25 35 2500 17 .15 67.48 0.040
3 Sample calculation, first row: difference in gallon consumption = 46.28 - 8.32 = 37 .96 gal; 30-min volume = 1800/2 = 900 vehicles; differenm.~ - 37.96/900 - 0.0422 gal/vehicle.
Figure 12. Comparison of NETSIM and SOAP left-turn saturation- 1200
flow rates. £. >
00 ~oo eoo 1200
Opposing Volume , vph
sired. This overestimate is probably due to the fact that Webster's delay equation is very sensitive to high degrees of saturation.
SUMMARY AND CONCLUSION
Delays and fuel consumption estimated by the deterministic SOAP based largely on Webster's delay equation were compared with results generated by the microscopic NETSIM.
More than 80 combinations of 30-min left-turn and
Transportation Research Record 905
Figure 13. SOAP average delay !l<l~--~-----
profiles with NETS(M derived left-turn saturation-flow rates.
•O
OQOO 1400 1600 1800
Volumes , vph
-g :::J 0 .0 .c "S 0
Cf)
through traffic volumes were studied in three different signal-control variations.
Results were almost identical when a multiphase pretimed traffic signal was simulated. In the case of a two-phase pretimed signal, NETSIM delays were somewhat higher, as expected, and the relative changes in delays corresponding to relative changes in volumes and left turns were similar.
In the case of a two-phase fully actuated signal, the difference between NETSIM and SOAP average delay was higher than in the other two cases but can be explained by too long a unit extension specified in NETSIM. SOAP appeared to overestimate delays at a few points, which corresponded to conditions of high
89
volume/ capacity ratios. The overestimated delays for these points were due to conservative SOAP estimates of left-turn saturation-flow rates.
The patterns of NETSIM and SOAP delays were similar enough to indicate that with adqitional research the correlation could be further improved. In this study no attempt was made to change any of the first set of inputs (unit extension time, minimum green, maximum green, lost time, etc.) in order to increase the correlation between NETSIM and SOAP.
After differences in definitions had been accounted for, NETSIM and SOAP fuel-consumption estimates were found to be identical for all three cases.
ACKNOWLEDGMENT
The data that provided the foundation for this paper were generated by Ching-Sheng Yang, Mohsen zarean, and Lei Wu, graduate students in the Department of Civil Engineering, Ohio State University, under our direction.
REFERENCES
1. P. Ross and D. Gibson. Review of Road Traffic Network Simulation Models. TRB, Transportation Research Record 644, 1977, pp. 36-41.
2. Signa l Operations Analysis Package. FHWA, July 1979.
3 . Selecting Traffic Signal Control at Individual Intersections. NCHRP, Rept. 233, June 1981.
Publication of this paper sponsored by Committee on Traffic Control Devices.
Analysis of Existing Formulas for Delay, Overflow,
and Stops ' W.B. CRONJE
An analysis is made of existing formulas for average delay, average overflow, and average number of stops for undersaturated conditions. The examination of these formulas covers a large variation in flows and cycle lengths, so recommendations are based on a thorough examination. The formulas examined are those developed by Webster, Miller, and Newell. It is concluded that the Newell formulas give the most accurate results.
The are and
delay formulas that are predominant in practice those developed by Webster (1), Miller (~,_1),
Newell <i>· Hutchinson <2l examined these formulas for accuracy. The standard of comparison is, however, a derived formula. Futhermore, Hutchinson (_~) covered only average delay . In th is paper, however, the standard of comparison is computer simulation, and in addition to average delay, average overflow and average number of stops are also examined. The reason for this is that in the optimization of fixed-time signalized intersections, delay as well as number of stops should be used in the optimization process.
Throughout the comparison the value of I, the variance-to-mean ratio of flow per cycle, is taken as 1 because it has been shown (~) that for the optimization of fixed-time signalized traffic intersections it is immaterial which probability distri-
bution is used for the arriving traffic at a signal. The Poisson distribution, because of its simplicity, is therefore used.
ANALYSIS OF AVERAGE DELAY AND OVERFLOW FORMULAS
The Webs t er (.!_) equat i ons are a s fol l ows:
d = [c( l - A.)2 /2( 1 - A.·x)] + [x2 /2. (1 - x)q] - 0.65 (c/q2 )113 x<2+ s·1'.)
Q0 = q (d-0.5 · c( l - A.)]
The Mi ller 1 equations (~) a re as f ollows:
d = ((1 - A.)/2(1 - A.·x)] { c(l - A.)+ [(2 · x - 1)1/q(l - x)]
+. [(I+ A·X - 1)/s] }
Q0 = 0 for x .;; 0.5
= I(2·x - l)/2(1 - x) fo r x > 0.5
The Miller 2 equations (_1) are as follows:
d = ((1 -A.)/2(1 -A.·x)] ( c(l - A.) + { exp(-(4/3)J[(A-c-s)0· 5 (1 - x)/x)
7 q(l- x)} )
(1)
(2)
(3)
(4)
(5)