Embed Size (px)
Citation preview
Abstract— A comparative analysis of the rain attenuation
evaluated from beacon measurements and from a single
polarization S-band Radar is performed. The beacon
measurements are obtained for two slant satellite paths with
different elevation angles in the Ku- and Ka-band. The single
polarization S-band Radar reflectivity data is used to predict the
attenuation along the satellite propagation paths. This is done by
first converting the reflectivity into rain rate using the Z-R
relations suitable for the tropical region and, afterwards, by
evaluating the slant path attenuation through the integration of
the specific rain attenuation derived from the point rainfall rate.
An empirical calibration factor for the Radar reflectivity is
provided. A comparison of the rain fade suffered from the two
satellite paths is presented both on event basis and in terms of
cumulative distribution functions. The empirical calibration
factor and a single Z-R relation suitable for the tropical region are
used for rain attenuation evaluation from single polarization
Radar data.
Index Terms—Radar Reflectivity Conversion, Z-R
Relationship, Slant Path Attenuation, Beacon Measurements,
Earth-Satellite Communication
I. INTRODUCTION
he use of Ka-band (20/30 GHz) for satellite communications has attracted the interest of operators and researchers throughout the world. Its propagation
limitations were and are still being studied in the framework of research programs such as Olympus [1], ACTS [2], ITALSAT [3] and European Community Fourth Framework Projects [4]. A number of results and models are already available, providing a thorough description of the main propagation impairments [2] such as rain attenuation, gaseous absorption, cloud attenuation, scintillation, depolarization and atmospheric noise. These effects are related to the troposphere. The most effective technique used to measure rain attenuation is to conduct experiments, where the received signal strength of a satellite beacon is monitored concurrently with radar data.
The European Space Agency’s OLYMPUS project, planned for a 5 year mission, was launched in 1989. In addition to its Ku- and Ka-band communication transponders, it also carried three beacons at 12, 20 and 30 GHz for propagation research purposes. The great advantage of OLYMPUS was that all three beacon frequencies could be observed at the same time over the same orbital slot. Hence, it was possible to correlate the
Manuscript received xxx, 2011; revised xxx, 2012. The authors are with the Division of Communications Engineering, School
of Electrical and Electronic Engineering, Nanyang Technological University.
(e-mail: [email protected]).
influence of propagation impairments for each frequency band. Many universities and organizations in Europe, Canada and the US participated in this study. Apart from a multitude of locations in Europe, such as Surrey, UK, and Darmstadt, Germany, an important contribution for low-angle observations (14˚) came from Blacksburg, VA, and Ottawa, Canada. Data collected contributes to numerous cumulative attenuation statistics in significant publications in this field, such as those in [5].
Recent measurements performed over a period of more than 14 years, encompassing four different climates were carried out in Ottawa, Canada (satellite Anik F2), Aveiro, Portugal, Madrid, Spain and Toulouse, France (satellite HotBird 6 in the last three cases) [6-7]. The rainfall rate, beacon attenuation measured and fade duration are compared with those predicted by ITU-R models.
The yearly and worst month cumulative distributions of the beacon attenuation measured at Oberpfaffenhofen, Germany are compared with the prediction models of ITU-R Rec. P.564 in [1]. The OLYMPUS path had been scanned with the polarimetric C-Band weather Radar of German Aerospace Research Establishment (DLR) for several mainly convective events. A statistical comparison was done for the Radar derived attenuations with the real beacon attenuations.
The Ka-band beacon coverage using ACTS allowed the reception in a wide variety of latitudes and therefore climatic regions [2]. Comparative, cumulative measurement results for the 20 GHz beacon from 10 different cites from US are presented in [2]. The measured beacon rain attenuation for 20 GHz and 27.5 GHz from the Colorado site of the ACTS campaign, operated by Colorado State University at Fort Collins, is compared with the S-band Radar data.
There have also been notable propagation studies done in the tropical regions of Australia near Townsville (Queensland), by Kikkert et al. from James Cook University [8]. The Satellite Transmission Rain Attenuation Project (STRAP) team at James Cook University (JCU) has been involved in microwave propagation research for many years. As part of their research, an analogue Ku-band beacon receiver was developed [8] and installed at the Bukit Timah Earth station in Singapore in 1991. As Ajayi has observed and remarked in [9], the most intense tropical rainstorms are convective. In comparison to temperate rain events, the tropical rainstorms extend over a limited region, with a typical cell radius of 2 to 5 km, and often last for only 10 to 20 minutes. In satellite transmission at frequencies above 10 GHz, signal attenuation is mainly due to rain. Several slant path attenuation models, such as ITU-R Rec. P.618 [10] and Crane model [11], derived from rainfall data accumulated over many years in the temperate region, provide satisfactory accuracy.
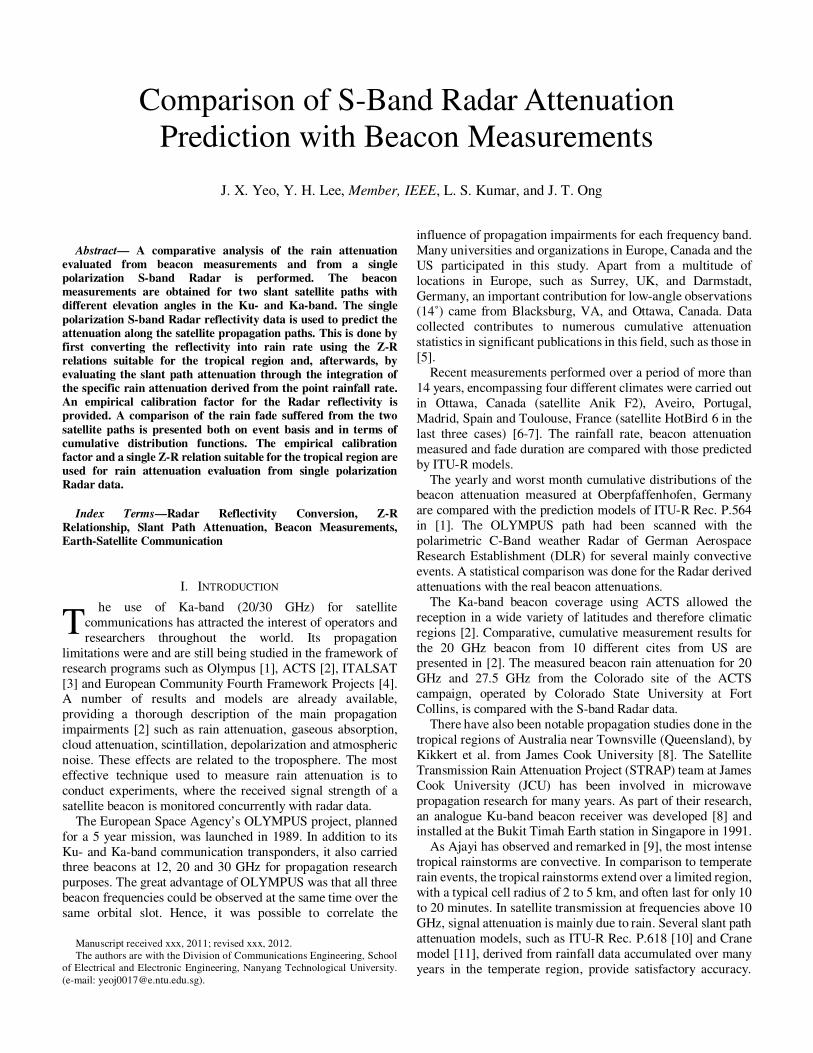
Comparison of S-Band Radar Attenuation Prediction with Beacon Measurements
J. X. Yeo, Y. H. Lee, Member, IEEE, L. S. Kumar, and J. T. Ong
T
When these models are applied to data from tropical regions, where convective rain is dominant, these model show a reduced accuracy [12-13]. Furthermore, in temperate climates, for the same rainfall rate, the attenuation decreases with elevation angle. However, in the tropics, the reverse is found to be the case [14]. This may be due to the comparatively small diameter of convective rain cells.
In a tropical country like Singapore, excessive rainfall is a frequent phenomenon throughout the year. The knowledge of the rain fade at the desired frequency of operation is critical for the design of a reliable terrestrial and/or Earth space communication link. It is of utmost importance to be able to predict accurately the possible impairment encountered on a given link.
To establish an Earth to space communication link for propagation studies is very costly. S-band Radar reflectivity data therefore becomes an attractive alternative for rain attenuation estimation and prediction. The Radar reflectivity data is commonly used for rain attenuation prediction due to the wide volume coverage of the data. The Z-R relation relates the value of the measured reflectivity to the value of the rain rate according to the general formula (1) by Marshall and Palmer [15],
� � ��� (1)
where the Radar reflectivity factor Z (mm-6m3) and the rain rate R (mm/hr), are dependent on the rain drop size distribution (DSD) [16-19]. Marshall and Palmer [15] published the Z-R relation using the exponential DSD with a set of general parameters of A = 200 and b = 1.6. This is a well-known Z-R relation that is optimized for stratiform precipitation. Battan [16] lists 69 different Z-R relations for different locations around the world with different climatic conditions. Since radar reflectivity and rain rate are functions of the DSD, and the drop size distribution depends on the rainfall process and varies geographically, there can be drastic differences in the parameters of the Z-R relation at different geographical locations [20]. Out of the 69 relations, 54 relations are derived for use in the temperate and sub-tropical region, whereas 12 relations are derived for the tropical region and 3 relations are derived for general applications.
Convective rain events are common over tropical regions. These convective events experienced in the tropical regions are known to have a different Z-R relation with respect to the stratiform rain events experienced in the temperate regions and the sub-tropical regions. Therefore, for the tropical region, a number of A and b parameters have been proposed in [21-23].
In this paper, experimental data obtained during measurement campaigns carried out in Singapore is presented. The effects of rain on communication/satellite links will be studied using the beacon receiver located at Nanyang Technological University (NTU), Singapore. The measured rain attenuation is compared with the rain attenuation evaluated from the Radar reflectivity data obtained from the Meteorological Service Division (MSD) at Changi airport, Singapore.
An analysis of rain attenuation on communication/satellite links is presented. In order to ensure the reliability of the rain attenuation derived from the Z-R relation models, satellite links are monitored and the measured data is used to validate the
results obtained from the modeled data. A comparison of the modeled rain attenuation and the measured rain attenuation is performed at two elevation angles, one in the Ku-band and one in the Ka-band.
II. DESCRIPTION OF SYSTEMS AND DATA
A. Radar Reflectivity System
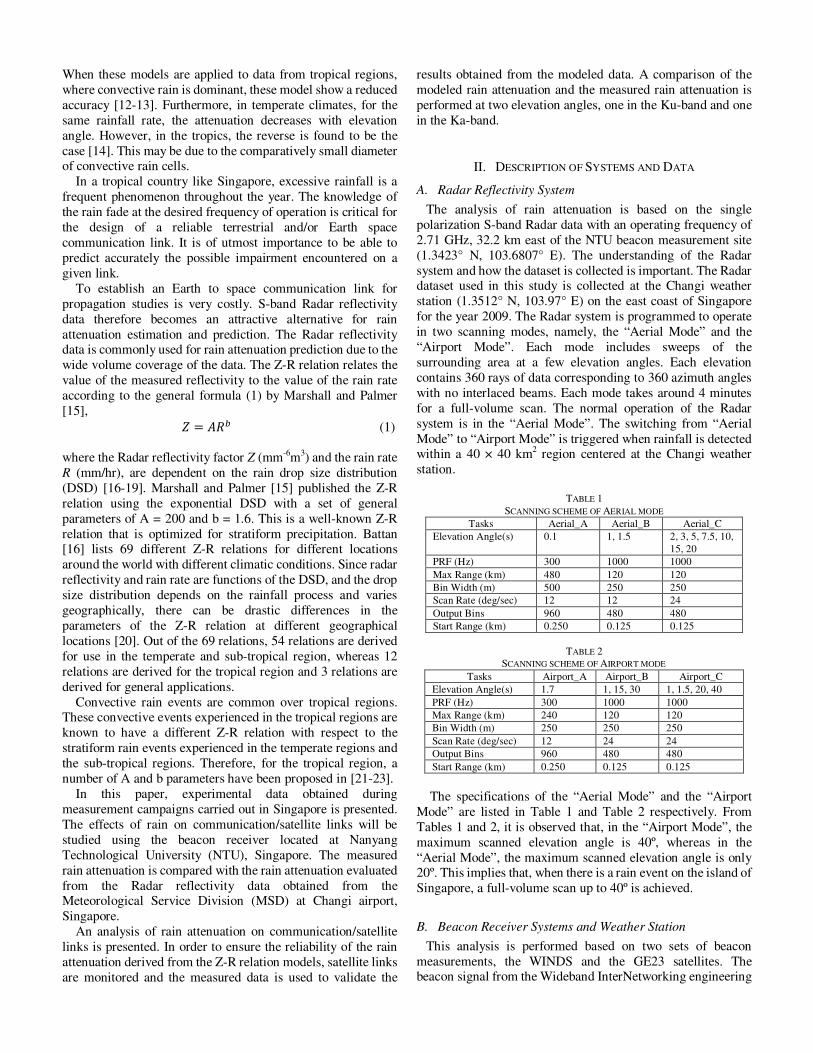
The analysis of rain attenuation is based on the single polarization S-band Radar data with an operating frequency of 2.71 GHz, 32.2 km east of the NTU beacon measurement site (1.3423° N, 103.6807° E). The understanding of the Radar system and how the dataset is collected is important. The Radar dataset used in this study is collected at the Changi weather station (1.3512° N, 103.97° E) on the east coast of Singapore for the year 2009. The Radar system is programmed to operate in two scanning modes, namely, the “Aerial Mode” and the “Airport Mode”. Each mode includes sweeps of the surrounding area at a few elevation angles. Each elevation contains 360 rays of data corresponding to 360 azimuth angles with no interlaced beams. Each mode takes around 4 minutes for a full-volume scan. The normal operation of the Radar system is in the “Aerial Mode”. The switching from “Aerial Mode” to “Airport Mode” is triggered when rainfall is detected within a 40 × 40 km2 region centered at the Changi weather station.
TABLE 1
SCANNING SCHEME OF AERIAL MODE
Tasks Aerial_A Aerial_B Aerial_C
Elevation Angle(s) 0.1 1, 1.5 2, 3, 5, 7.5, 10,
15, 20
PRF (Hz) 300 1000 1000
Max Range (km) 480 120 120
Bin Width (m) 500 250 250
Scan Rate (deg/sec) 12 12 24
Output Bins 960 480 480
Start Range (km) 0.250 0.125 0.125
TABLE 2
SCANNING SCHEME OF AIRPORT MODE
Tasks Airport_A Airport_B Airport_C
Elevation Angle(s) 1.7 1, 15, 30 1, 1.5, 20, 40
PRF (Hz) 300 1000 1000
Max Range (km) 240 120 120
Bin Width (m) 250 250 250
Scan Rate (deg/sec) 12 24 24
Output Bins 960 480 480
Start Range (km) 0.250 0.125 0.125
The specifications of the “Aerial Mode” and the “Airport
Mode” are listed in Table 1 and Table 2 respectively. From Tables 1 and 2, it is observed that, in the “Airport Mode”, the maximum scanned elevation angle is 40º, whereas in the “Aerial Mode”, the maximum scanned elevation angle is only 20º. This implies that, when there is a rain event on the island of Singapore, a full-volume scan up to 40º is achieved.
B. Beacon Receiver Systems and Weather Station
This analysis is performed based on two sets of beacon measurements, the WINDS and the GE23 satellites. The beacon signal from the Wideband InterNetworking engineering
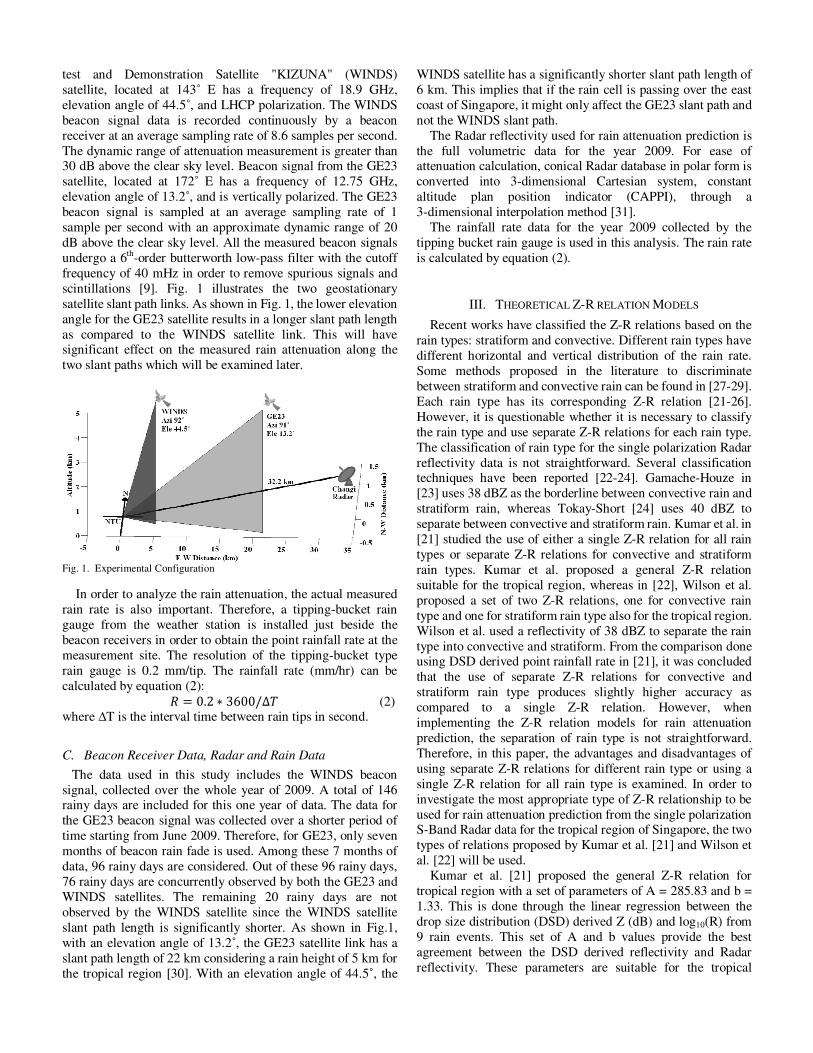
test and Demonstration Satellite "KIZUNA" (WINDS) satellite, located at 143˚ E has a frequency of 18.9 GHz, elevation angle of 44.5˚, and LHCP polarization. The WINDS beacon signal data is recorded continuously by a beacon receiver at an average sampling rate of 8.6 samples per second. The dynamic range of attenuation measurement is greater than 30 dB above the clear sky level. Beacon signal from the GE23 satellite, located at 172˚ E has a frequency of 12.75 GHz, elevation angle of 13.2˚, and is vertically polarized. The GE23 beacon signal is sampled at an average sampling rate of 1 sample per second with an approximate dynamic range of 20 dB above the clear sky level. All the measured beacon signals undergo a 6th-order butterworth low-pass filter with the cutoff frequency of 40 mHz in order to remove spurious signals and scintillations [9]. Fig. 1 illustrates the two geostationary satellite slant path links. As shown in Fig. 1, the lower elevation angle for the GE23 satellite results in a longer slant path length as compared to the WINDS satellite link. This will have significant effect on the measured rain attenuation along the two slant paths which will be examined later.
Fig. 1. Experimental Configuration
In order to analyze the rain attenuation, the actual measured rain rate is also important. Therefore, a tipping-bucket rain gauge from the weather station is installed just beside the beacon receivers in order to obtain the point rainfall rate at the measurement site. The resolution of the tipping-bucket type rain gauge is 0.2 mm/tip. The rainfall rate (mm/hr) can be calculated by equation (2):
� � 0.2 3600/∆� (2) where ∆T is the interval time between rain tips in second.
C. Beacon Receiver Data, Radar and Rain Data
The data used in this study includes the WINDS beacon signal, collected over the whole year of 2009. A total of 146 rainy days are included for this one year of data. The data for the GE23 beacon signal was collected over a shorter period of time starting from June 2009. Therefore, for GE23, only seven months of beacon rain fade is used. Among these 7 months of data, 96 rainy days are considered. Out of these 96 rainy days, 76 rainy days are concurrently observed by both the GE23 and WINDS satellites. The remaining 20 rainy days are not observed by the WINDS satellite since the WINDS satellite slant path length is significantly shorter. As shown in Fig.1, with an elevation angle of 13.2˚, the GE23 satellite link has a slant path length of 22 km considering a rain height of 5 km for the tropical region [30]. With an elevation angle of 44.5˚, the
WINDS satellite has a significantly shorter slant path length of 6 km. This implies that if the rain cell is passing over the east coast of Singapore, it might only affect the GE23 slant path and not the WINDS slant path.
The Radar reflectivity used for rain attenuation prediction is the full volumetric data for the year 2009. For ease of attenuation calculation, conical Radar database in polar form is converted into 3-dimensional Cartesian system, constant altitude plan position indicator (CAPPI), through a 3-dimensional interpolation method [31].
The rainfall rate data for the year 2009 collected by the tipping bucket rain gauge is used in this analysis. The rain rate is calculated by equation (2).
III. THEORETICAL Z-R RELATION MODELS
Recent works have classified the Z-R relations based on the rain types: stratiform and convective. Different rain types have different horizontal and vertical distribution of the rain rate. Some methods proposed in the literature to discriminate between stratiform and convective rain can be found in [27-29]. Each rain type has its corresponding Z-R relation [21-26]. However, it is questionable whether it is necessary to classify the rain type and use separate Z-R relations for each rain type. The classification of rain type for the single polarization Radar reflectivity data is not straightforward. Several classification techniques have been reported [22-24]. Gamache-Houze in [23] uses 38 dBZ as the borderline between convective rain and stratiform rain, whereas Tokay-Short [24] uses 40 dBZ to separate between convective and stratiform rain. Kumar et al. in [21] studied the use of either a single Z-R relation for all rain types or separate Z-R relations for convective and stratiform rain types. Kumar et al. proposed a general Z-R relation suitable for the tropical region, whereas in [22], Wilson et al. proposed a set of two Z-R relations, one for convective rain type and one for stratiform rain type also for the tropical region. Wilson et al. used a reflectivity of 38 dBZ to separate the rain type into convective and stratiform. From the comparison done using DSD derived point rainfall rate in [21], it was concluded that the use of separate Z-R relations for convective and stratiform rain type produces slightly higher accuracy as compared to a single Z-R relation. However, when implementing the Z-R relation models for rain attenuation prediction, the separation of rain type is not straightforward. Therefore, in this paper, the advantages and disadvantages of using separate Z-R relations for different rain type or using a single Z-R relation for all rain type is examined. In order to investigate the most appropriate type of Z-R relationship to be used for rain attenuation prediction from the single polarization S-Band Radar data for the tropical region of Singapore, the two types of relations proposed by Kumar et al. [21] and Wilson et al. [22] will be used.
Kumar et al. [21] proposed the general Z-R relation for tropical region with a set of parameters of A = 285.83 and b = 1.33. This is done through the linear regression between the drop size distribution (DSD) derived Z (dB) and log10(R) from 9 rain events. This set of A and b values provide the best agreement between the DSD derived reflectivity and Radar reflectivity. These parameters are suitable for the tropical
region since more than 80% of the rain events used are found to be convective. In [23], rain events are classified into convective and stratiform, after which a separate set of A and b parameters are proposed. A Radar reflectivity threshold of 38 dBZ is used to classify the convective and stratiform rain events.
Wilson et al. in [22] also used the reflectivity value of 38 dBZ as the threshold to distinguish the precipitation types. All the DSD minutes having reflectivity values above this threshold are assumed to be convective while those below 38
dBZ are assumed stratiform. In [22], the Z-R relation of � �
139��.� is used for the convective rain events, while the Z-R
relation of � � 330��.�� is used for the stratiform rain events. In this paper, the original Z-R relation proposed by Marshall and Palmer in [15], the single Z-R relation proposed by Kumar in [21] and the separate convective and stratiform Z-R relation proposed by Wilson [22] will be used to convert the reflectivity to rain rate.
The slant path attenuation A is calculated through the numerically summation of:
� � ∑ � ��� · ∆��
���� (3)
where � � � ∆�� � � /sin $%& is the path length affected by rain, θ is the link elevation, hR is the fixed yearly mean rain height, derived from ITU-R Rec. P.839-3 [32]. The coefficients of specific attenuation, k and α, can be obtained from the ITU-R Rec. P.838-3 [33], and are dependent on the link elevation angle, the radiowave frequency and polarization. In (3), Ri is the rainfall rate value and ∆Li is the path length at each Cartesian ith pixel along the slant path between the Earth station and the satellite. Therefore, the transmission link performance is strongly dependent on the precipitation characteristics along the slant path and affects the system performance significantly.
IV. RESULTS AND DISCUSSION
A. Calibration of Radar reflectivity
Before the reflectivity derived rain attenuation can be used for comparison with the measured rain attenuation, some calibration on the Radar reflectivity needs to be done. As mentioned by Goldhirsh [34], many of the Radar uncertainties are not correctable. In order to reduce these Radar uncertainties, an adjustment to the Radar reflectivity values is suggested in [34]. This adjustment is used to force an agreement between the Radar predicted attenuation and the beacon measured attenuation. It is common to adjust the reflectivity for Radar attenuation calculations, especially for single polarization Radar [35-37]. In [34-37], it is suggested that the adjustment ranges from 3 dB to 9 dB. In this section, in order to compare the beacon measured attenuation with the Radar predicted attenuation, the Radar reflectivity is adjusted before calculating the rainfall rate using (1) and then the slant path attenuation using (3). In general, for the WINDS satellite, the Radar reflectivity is adjusted by 7 dB and for the GE23 satellite, the Radar reflectivity is adjusted by 4 dB. The reflectivity adjustment values can be obtained by minimizing the discrepancy between the cumulative distributions of beacon measured attenuation and the Radar predicted attenuation; the results are shown in Part C of Section IV. These adjustment
values are within the range reported in the literature [34]. The difference in the reflectivity adjustment values can be explained by the Radar pulse volume averaging. The Radar reflectivity is an average over a pulse volume. Within this pulse volume, the reflectivity can be highly non-uniform, especially for high altitudes. For example, the Radar pulse volume above NTU, 32.2 km west of the Radar, is about 0.08 km3, which is approximately 10 times larger than the pulse volume at a location 10 km west of the Radar. The slant path between NTU to the WINDS satellite is at a high elevation angle of 44.5˚. Therefore, the entire slant path is within the large volume pulses. Therefore, a large reflectivity adjustment of 7 dB is required to account for the under estimation caused by the non-uniformity within the large volume pulses. For the NTU to GE23 satellite path, the path is significantly longer, it passes through both large volume pulses and small volume pulses. Therefore, the under estimation along this path is less and the reflectivity requires a smaller adjustment of 4 dB.
B. Rain Events Descriptions
Data from the 146 rainy days for the WINDS satellite and 96 days for the GE23 satellite were processed for statistical analysis. Fig. 2 to 4 show the attenuation versus time plots of the beacon measured and Radar predicted attenuation corresponding to the three sets of Z-R relationship from
Marshall-Parmer (� � 200��.' ); Kumar (� � 285.83��.�� )
and Wilson (� � 139��.� and � � 330��.��). From Fig. 2 to 4, it can be seen that, since both paths are
pointing towards the east, rain attenuation is usually observed concurrently over both links. The rain attenuation along the WINDS satellite path is expected to be significantly higher than that along the GE23 satellite path, since the WINDS satellite operates in the Ka band whereas the GE23 satellite operates in the Ku band.
However, due to the low elevation angle of 13.2° for the GE23 satellite path, the link has a long propagation distance of 22 km. The WINDS satellite has an elevation angle of 44.5°, and therefore a short propagation distance of 6 km. These propagation distances are calculated based on the yearly mean rain height. It should be noted that the rain height may vary for single rain events. Due to the significant difference in slant path length, although the frequency of the GE23 satellite is 12.75 GHz whereas the WINDS satellite is 18.9 GHz, the attenuation suffered by both links is comparable.
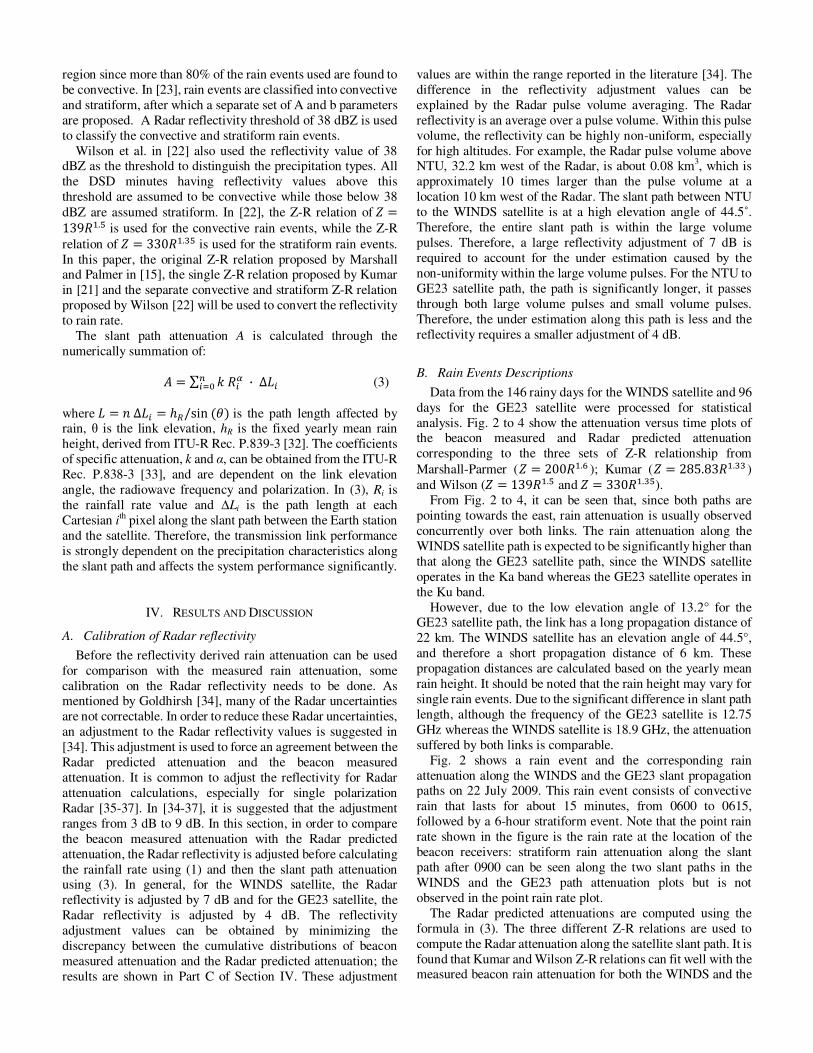
Fig. 2 shows a rain event and the corresponding rain attenuation along the WINDS and the GE23 slant propagation paths on 22 July 2009. This rain event consists of convective rain that lasts for about 15 minutes, from 0600 to 0615, followed by a 6-hour stratiform event. Note that the point rain rate shown in the figure is the rain rate at the location of the beacon receivers: stratiform rain attenuation along the slant path after 0900 can be seen along the two slant paths in the WINDS and the GE23 path attenuation plots but is not observed in the point rain rate plot.
The Radar predicted attenuations are computed using the formula in (3). The three different Z-R relations are used to compute the Radar attenuation along the satellite slant path. It is found that Kumar and Wilson Z-R relations can fit well with the measured beacon rain attenuation for both the WINDS and the
GE23 satellite paths. The attenuation using Marshall-Parmer Z-R relationship tends to underestimate the attenuation during the convective rain period.
Fig. 2. Comparison of directly measured fade event with Radar predicted for 22
July 2009 from 0500 to 1200 (Beacon measured: solid curve; M-P: diamonds; Kumar: circles; Wilson: asterisks). Top: WINDS. Bottom: GE23.
During the stratiform rain period, all 3 Z-R relations predict
the rain attenuation well. As mentioned before, since the Marshall-Parmer relation is derived from temperate (mainly stratiform) rain events, it predicts the stratiform rain attenuation well but not the convective rain attenuation. Wilson uses separate relations derived especially for the tropical climate. Therefore, it is no surprise that it provides a good prediction for
both the convective and stratiform rain attenuation. Kumar uses a single Z-R relation derived from tropical rain events. This single Z-R relation is able to predict well both the convective and stratiform rain events.
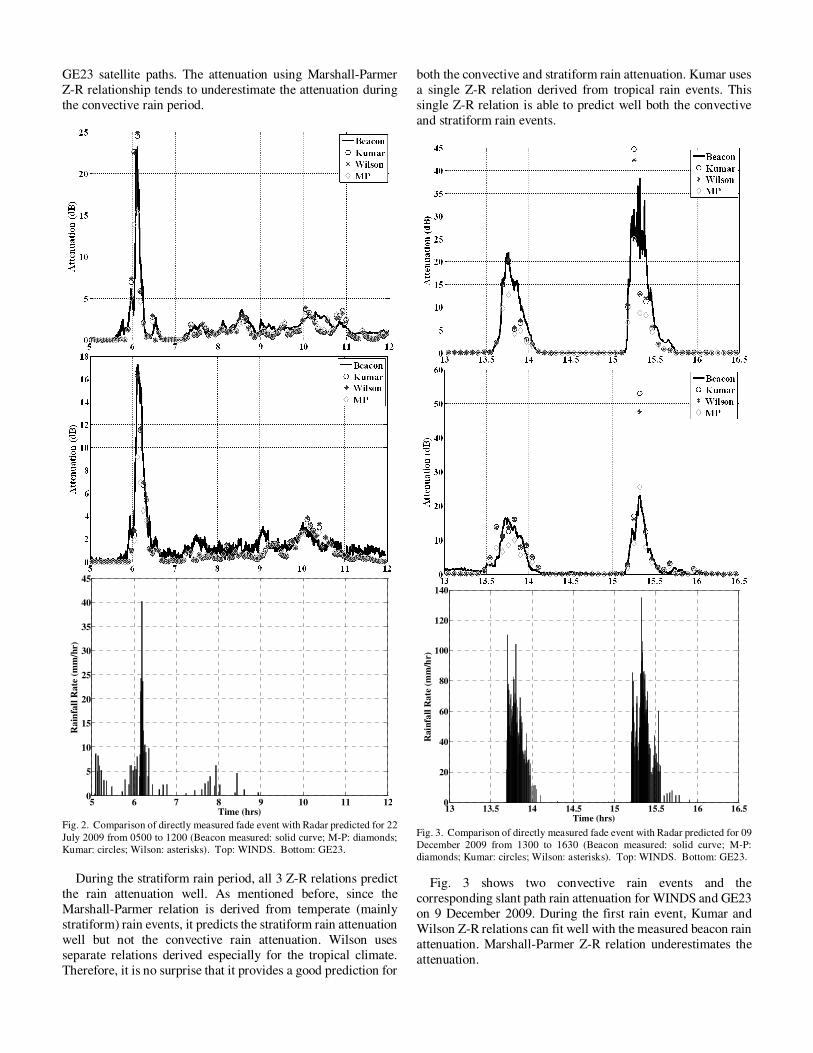
Fig. 3. Comparison of directly measured fade event with Radar predicted for 09 December 2009 from 1300 to 1630 (Beacon measured: solid curve; M-P: diamonds; Kumar: circles; Wilson: asterisks). Top: WINDS. Bottom: GE23.
Fig. 3 shows two convective rain events and the corresponding slant path rain attenuation for WINDS and GE23 on 9 December 2009. During the first rain event, Kumar and Wilson Z-R relations can fit well with the measured beacon rain attenuation. Marshall-Parmer Z-R relation underestimates the attenuation.
5 6 7 8 9 10 11 120
5
10
15
20
25
30
35
40
45
Time (hrs)
Ra
infa
ll R
ate
(m
m/h
r)
203/2009 - KaBR
13 13.5 14 14.5 15 15.5 16 16.50
20
40
60
80
100
120
140
Time (hrs)
Rain
fall
Ra
te (
mm
/hr)
During the second rain event, the point rain rate at the beacon receiver site is very high (135 mm/hr). Therefore, the rain attenuation exceeded the dynamic range of the beacon receiver system, which is 30 dB and 20 dB for WINDS and GE23 beacon receivers respectively. Since the actual maximum attenuation at 1515 is about 42 dB for the WINDS satellite path and 50 dB for the GE23 satellite path, they are both above the dynamic range of the beacon receiver systems and therefore, cannot be measured. As shown in Fig. 3, during this time period, the Radar predicted attenuation cannot be compared with the beacon measured attenuation.
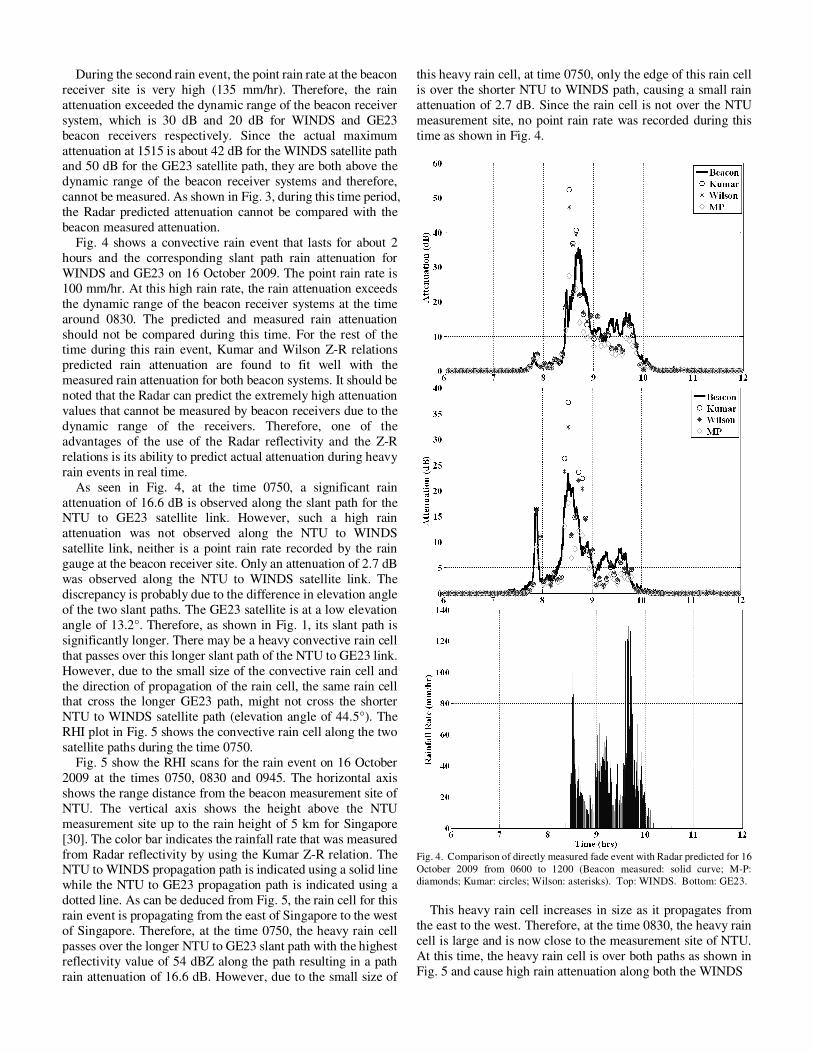
Fig. 4 shows a convective rain event that lasts for about 2 hours and the corresponding slant path rain attenuation for WINDS and GE23 on 16 October 2009. The point rain rate is 100 mm/hr. At this high rain rate, the rain attenuation exceeds the dynamic range of the beacon receiver systems at the time around 0830. The predicted and measured rain attenuation should not be compared during this time. For the rest of the time during this rain event, Kumar and Wilson Z-R relations predicted rain attenuation are found to fit well with the measured rain attenuation for both beacon systems. It should be noted that the Radar can predict the extremely high attenuation values that cannot be measured by beacon receivers due to the dynamic range of the receivers. Therefore, one of the advantages of the use of the Radar reflectivity and the Z-R relations is its ability to predict actual attenuation during heavy rain events in real time.
As seen in Fig. 4, at the time 0750, a significant rain attenuation of 16.6 dB is observed along the slant path for the NTU to GE23 satellite link. However, such a high rain attenuation was not observed along the NTU to WINDS satellite link, neither is a point rain rate recorded by the rain gauge at the beacon receiver site. Only an attenuation of 2.7 dB was observed along the NTU to WINDS satellite link. The discrepancy is probably due to the difference in elevation angle of the two slant paths. The GE23 satellite is at a low elevation angle of 13.2°. Therefore, as shown in Fig. 1, its slant path is significantly longer. There may be a heavy convective rain cell that passes over this longer slant path of the NTU to GE23 link. However, due to the small size of the convective rain cell and the direction of propagation of the rain cell, the same rain cell that cross the longer GE23 path, might not cross the shorter NTU to WINDS satellite path (elevation angle of 44.5°). The RHI plot in Fig. 5 shows the convective rain cell along the two satellite paths during the time 0750.
Fig. 5 show the RHI scans for the rain event on 16 October 2009 at the times 0750, 0830 and 0945. The horizontal axis shows the range distance from the beacon measurement site of NTU. The vertical axis shows the height above the NTU measurement site up to the rain height of 5 km for Singapore [30]. The color bar indicates the rainfall rate that was measured from Radar reflectivity by using the Kumar Z-R relation. The NTU to WINDS propagation path is indicated using a solid line while the NTU to GE23 propagation path is indicated using a dotted line. As can be deduced from Fig. 5, the rain cell for this rain event is propagating from the east of Singapore to the west of Singapore. Therefore, at the time 0750, the heavy rain cell passes over the longer NTU to GE23 slant path with the highest reflectivity value of 54 dBZ along the path resulting in a path rain attenuation of 16.6 dB. However, due to the small size of
this heavy rain cell, at time 0750, only the edge of this rain cell is over the shorter NTU to WINDS path, causing a small rain attenuation of 2.7 dB. Since the rain cell is not over the NTU measurement site, no point rain rate was recorded during this time as shown in Fig. 4.
Fig. 4. Comparison of directly measured fade event with Radar predicted for 16
October 2009 from 0600 to 1200 (Beacon measured: solid curve; M-P: diamonds; Kumar: circles; Wilson: asterisks). Top: WINDS. Bottom: GE23.
This heavy rain cell increases in size as it propagates from
the east to the west. Therefore, at the time 0830, the heavy rain cell is large and is now close to the measurement site of NTU. At this time, the heavy rain cell is over both paths as shown in Fig. 5 and cause high rain attenuation along both the WINDS
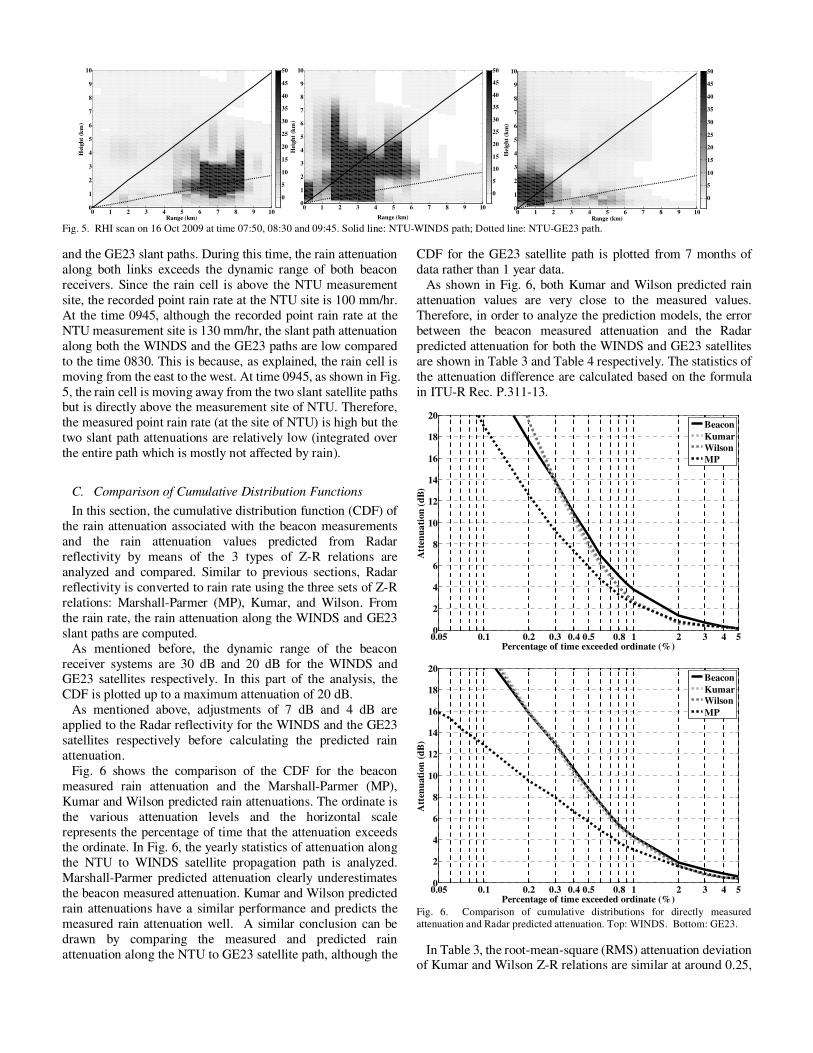
Fig. 5. RHI scan on 16 Oct 2009 at time 07:50, 08:30 and 09:45. Solid line: NTU-WINDS path; Dotted line: NTU-GE23 path.
and the GE23 slant paths. During this time, the rain attenuation along both links exceeds the dynamic range of both beacon receivers. Since the rain cell is above the NTU measurement site, the recorded point rain rate at the NTU site is 100 mm/hr. At the time 0945, although the recorded point rain rate at the NTU measurement site is 130 mm/hr, the slant path attenuation along both the WINDS and the GE23 paths are low compared to the time 0830. This is because, as explained, the rain cell is moving from the east to the west. At time 0945, as shown in Fig. 5, the rain cell is moving away from the two slant satellite paths but is directly above the measurement site of NTU. Therefore, the measured point rain rate (at the site of NTU) is high but the two slant path attenuations are relatively low (integrated over the entire path which is mostly not affected by rain).
C. Comparison of Cumulative Distribution Functions
In this section, the cumulative distribution function (CDF) of the rain attenuation associated with the beacon measurements and the rain attenuation values predicted from Radar reflectivity by means of the 3 types of Z-R relations are analyzed and compared. Similar to previous sections, Radar reflectivity is converted to rain rate using the three sets of Z-R relations: Marshall-Parmer (MP), Kumar, and Wilson. From the rain rate, the rain attenuation along the WINDS and GE23 slant paths are computed.
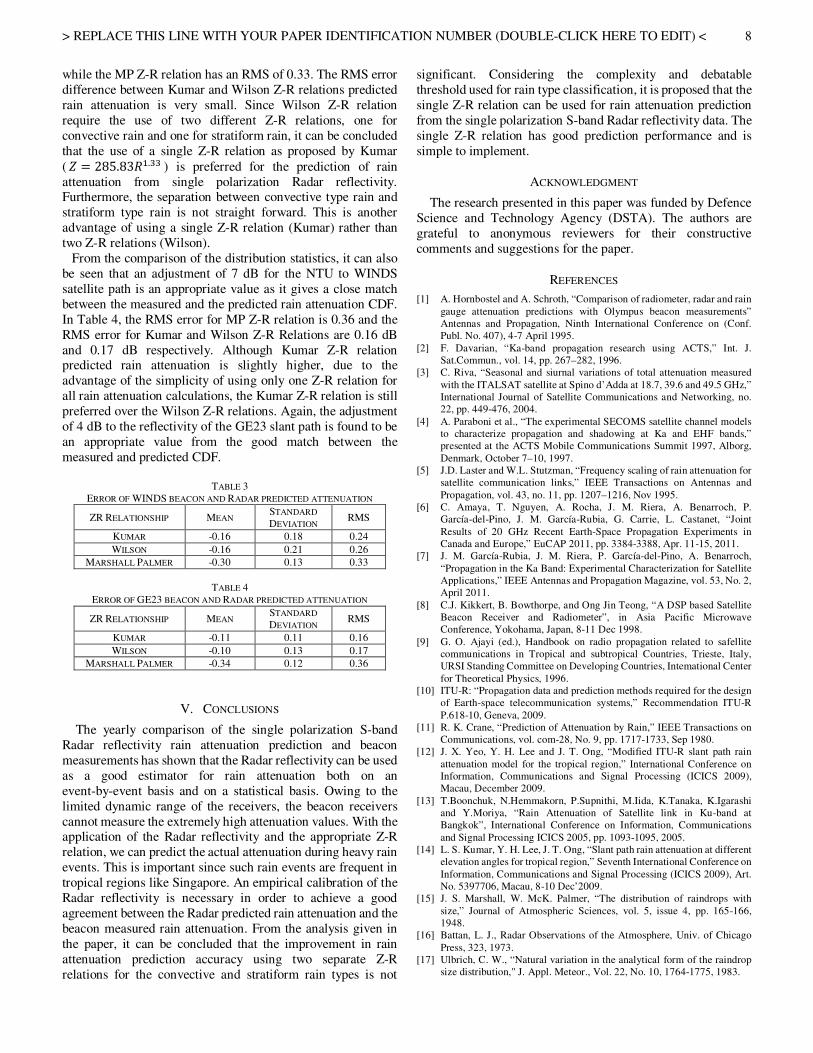
As mentioned before, the dynamic range of the beacon receiver systems are 30 dB and 20 dB for the WINDS and GE23 satellites respectively. In this part of the analysis, the CDF is plotted up to a maximum attenuation of 20 dB.
As mentioned above, adjustments of 7 dB and 4 dB are applied to the Radar reflectivity for the WINDS and the GE23 satellites respectively before calculating the predicted rain attenuation.
Fig. 6 shows the comparison of the CDF for the beacon measured rain attenuation and the Marshall-Parmer (MP), Kumar and Wilson predicted rain attenuations. The ordinate is the various attenuation levels and the horizontal scale represents the percentage of time that the attenuation exceeds the ordinate. In Fig. 6, the yearly statistics of attenuation along the NTU to WINDS satellite propagation path is analyzed. Marshall-Parmer predicted attenuation clearly underestimates the beacon measured attenuation. Kumar and Wilson predicted rain attenuations have a similar performance and predicts the measured rain attenuation well. A similar conclusion can be drawn by comparing the measured and predicted rain attenuation along the NTU to GE23 satellite path, although the
CDF for the GE23 satellite path is plotted from 7 months of data rather than 1 year data.
As shown in Fig. 6, both Kumar and Wilson predicted rain attenuation values are very close to the measured values. Therefore, in order to analyze the prediction models, the error between the beacon measured attenuation and the Radar predicted attenuation for both the WINDS and GE23 satellites are shown in Table 3 and Table 4 respectively. The statistics of the attenuation difference are calculated based on the formula in ITU-R Rec. P.311-13.
Fig. 6. Comparison of cumulative distributions for directly measured attenuation and Radar predicted attenuation. Top: WINDS. Bottom: GE23.
In Table 3, the root-mean-square (RMS) attenuation deviation of Kumar and Wilson Z-R relations are similar at around 0.25,
0 1 2 3 4 5 6 7 8 9 100
1
2
3
4
5
6
7
8
9
1016Oct2009075239
Range (km)
Hei
gh
t (k
m)
0
5
10
15
20
25
30
35
40
45
50
0 1 2 3 4 5 6 7 8 9 100
1
2
3
4
5
6
7
8
9
10
Range (km)
Hei
gh
t (k
m)
0
5
10
15
20
25
30
35
40
45
50
0 1 2 3 4 5 6 7 8 9 100
1
2
3
4
5
6
7
8
9
10
Range (km)
Heig
ht
(km
)
0
5
10
15
20
25
30
35
40
45
50
0.05 0.1 0.2 0.3 0.4 0.5 0.8 1 2 3 4 50
2
4
6
8
10
12
14
16
18
20
Percentage of time exceeded ordinate (%)
Att
enu
ati
on
(d
B)
Beacon
Kumar
Wilson
MP
0.05 0.1 0.2 0.3 0.4 0.5 0.8 1 2 3 4 50
2
4
6
8
10
12
14
16
18
20
Percentage of time exceeded ordinate (%)
Att
enu
ati
on
(d
B)
Beacon
Kumar
Wilson
MP
> REPLACE THIS LINE WITH YOUR PAPER IDENTIFICATION NUMBER (DOUBLE-CLICK HERE TO EDIT) <
8
while the MP Z-R relation has an RMS of 0.33. The RMS error difference between Kumar and Wilson Z-R relations predicted rain attenuation is very small. Since Wilson Z-R relation require the use of two different Z-R relations, one for convective rain and one for stratiform rain, it can be concluded that the use of a single Z-R relation as proposed by Kumar
( � � 285.83��.�� ) is preferred for the prediction of rain attenuation from single polarization Radar reflectivity. Furthermore, the separation between convective type rain and stratiform type rain is not straight forward. This is another advantage of using a single Z-R relation (Kumar) rather than two Z-R relations (Wilson).
From the comparison of the distribution statistics, it can also be seen that an adjustment of 7 dB for the NTU to WINDS satellite path is an appropriate value as it gives a close match between the measured and the predicted rain attenuation CDF. In Table 4, the RMS error for MP Z-R relation is 0.36 and the RMS error for Kumar and Wilson Z-R Relations are 0.16 dB and 0.17 dB respectively. Although Kumar Z-R relation predicted rain attenuation is slightly higher, due to the advantage of the simplicity of using only one Z-R relation for all rain attenuation calculations, the Kumar Z-R relation is still preferred over the Wilson Z-R relations. Again, the adjustment of 4 dB to the reflectivity of the GE23 slant path is found to be an appropriate value from the good match between the measured and predicted CDF.
TABLE 3
ERROR OF WINDS BEACON AND RADAR PREDICTED ATTENUATION
ZR RELATIONSHIP MEAN STANDARD
DEVIATION RMS
KUMAR -0.16 0.18 0.24
WILSON -0.16 0.21 0.26
MARSHALL PALMER -0.30 0.13 0.33
TABLE 4
ERROR OF GE23 BEACON AND RADAR PREDICTED ATTENUATION
ZR RELATIONSHIP MEAN STANDARD
DEVIATION RMS
KUMAR -0.11 0.11 0.16
WILSON -0.10 0.13 0.17
MARSHALL PALMER -0.34 0.12 0.36
V. CONCLUSIONS
The yearly comparison of the single polarization S-band Radar reflectivity rain attenuation prediction and beacon measurements has shown that the Radar reflectivity can be used as a good estimator for rain attenuation both on an event-by-event basis and on a statistical basis. Owing to the limited dynamic range of the receivers, the beacon receivers cannot measure the extremely high attenuation values. With the application of the Radar reflectivity and the appropriate Z-R relation, we can predict the actual attenuation during heavy rain events. This is important since such rain events are frequent in tropical regions like Singapore. An empirical calibration of the Radar reflectivity is necessary in order to achieve a good agreement between the Radar predicted rain attenuation and the beacon measured rain attenuation. From the analysis given in the paper, it can be concluded that the improvement in rain attenuation prediction accuracy using two separate Z-R relations for the convective and stratiform rain types is not
significant. Considering the complexity and debatable threshold used for rain type classification, it is proposed that the single Z-R relation can be used for rain attenuation prediction from the single polarization S-band Radar reflectivity data. The single Z-R relation has good prediction performance and is simple to implement.
ACKNOWLEDGMENT
The research presented in this paper was funded by Defence Science and Technology Agency (DSTA). The authors are grateful to anonymous reviewers for their constructive comments and suggestions for the paper.
REFERENCES
[1] A. Hornbostel and A. Schroth, “Comparison of radiometer, radar and rain
gauge attenuation predictions with Olympus beacon measurements” Antennas and Propagation, Ninth International Conference on (Conf. Publ. No. 407), 4-7 April 1995.
[2] F. Davarian, “Ka-band propagation research using ACTS,” Int. J. Sat.Commun., vol. 14, pp. 267–282, 1996.
[3] C. Riva, “Seasonal and siurnal variations of total attenuation measured
with the ITALSAT satellite at Spino d’Adda at 18.7, 39.6 and 49.5 GHz,” International Journal of Satellite Communications and Networking, no. 22, pp. 449-476, 2004.
[4] A. Paraboni et al., “The experimental SECOMS satellite channel models to characterize propagation and shadowing at Ka and EHF bands,” presented at the ACTS Mobile Communications Summit 1997, Alborg,
Denmark, October 7–10, 1997. [5] J.D. Laster and W.L. Stutzman, “Frequency scaling of rain attenuation for
satellite communication links,” IEEE Transactions on Antennas and
Propagation, vol. 43, no. 11, pp. 1207–1216, Nov 1995. [6] C. Amaya, T. Nguyen, A. Rocha, J. M. Riera, A. Benarroch, P.
García-del-Pino, J. M. García-Rubia, G. Carrie, L. Castanet, “Joint
Results of 20 GHz Recent Earth-Space Propagation Experiments in Canada and Europe,” EuCAP 2011, pp. 3384-3388, Apr. 11-15, 2011.
[7] J. M. García-Rubia, J. M. Riera, P. García-del-Pino, A. Benarroch,
“Propagation in the Ka Band: Experimental Characterization for Satellite Applications,” IEEE Antennas and Propagation Magazine, vol. 53, No. 2, April 2011.
[8] C.J. Kikkert, B. Bowthorpe, and Ong Jin Teong, “A DSP based Satellite Beacon Receiver and Radiometer”, in Asia Pacific Microwave Conference, Yokohama, Japan, 8-11 Dec 1998.
[9] G. O. Ajayi (ed.), Handbook on radio propagation related to safellite communications in Tropical and subtropical Countries, Trieste, Italy, URSI Standing Committee on Developing Countries, Intemational Center
for Theoretical Physics, 1996. [10] ITU-R: “Propagation data and prediction methods required for the design
of Earth-space telecommunication systems,” Recommendation ITU-R
P.618-10, Geneva, 2009. [11] R. K. Crane, “Prediction of Attenuation by Rain,” IEEE Transactions on
Communications, vol. com-28, No. 9, pp. 1717-1733, Sep 1980. [12] J. X. Yeo, Y. H. Lee and J. T. Ong, “Modified ITU-R slant path rain
attenuation model for the tropical region,” International Conference on Information, Communications and Signal Processing (ICICS 2009), Macau, December 2009.
[13] T.Boonchuk, N.Hemmakorn, P.Supnithi, M.Iida, K.Tanaka, K.Igarashi and Y.Moriya, “Rain Attenuation of Satellite link in Ku-band at Bangkok”, International Conference on Information, Communications
and Signal Processing ICICS 2005, pp. 1093-1095, 2005. [14] L. S. Kumar, Y. H. Lee, J. T. Ong, “Slant path rain attenuation at different
elevation angles for tropical region,” Seventh International Conference on
Information, Communications and Signal Processing (ICICS 2009), Art. No. 5397706, Macau, 8-10 Dec’2009.
[15] J. S. Marshall, W. McK. Palmer, “The distribution of raindrops with
size,” Journal of Atmospheric Sciences, vol. 5, issue 4, pp. 165-166, 1948.
[16] Battan, L. J., Radar Observations of the Atmosphere, Univ. of Chicago
Press, 323, 1973. [17] Ulbrich, C. W., “Natural variation in the analytical form of the raindrop
size distribution," J. Appl. Meteor., Vol. 22, No. 10, 1764-1775, 1983.
> REPLACE THIS LINE WITH YOUR PAPER IDENTIFICATION NUMBER (DOUBLE-CLICK HERE TO EDIT) <
9
[18] Feingold, G. and Z. Levin, “The lognormal fit to raindrop spectra from frontal convective clouds in Israel," J. Appl. Meteor., Vol. 25, 1346-1363,
1986. [19] Fujiwara, M., “Raindrop-size distribution from individual storms," J.
Atmos. Sci., Vol. 22, 585-591, 1965.
[20] G. Villarini, W. F. Krajewski, ‘Review of the different sources of uncertainty in single polarization radar-based estimates of rainfall,” Surveys in Geophysics, vol. 31, pp. 107-129, 2009.
[21] L. S. Kumar, Y. H. Lee, J. X. Yeo, J. T. Ong, “Tropical rain classification and estimation of rain from Z-R (reflectivity-rain rate) relationships,” Machine Copy for Proofreading, 2011.
[22] Wilson, C. L. and J. Tan, “The characteristics of rainfall and melting layer in Singapore: Experimental results from radar and ground instruments," 11th International Conference on Antennas and Propagation, No. 480,
852-856, Conference Publication, Apr. 17-20, 2001. [23] J. F. Gamache, A. R Houze, “Mesoscale air motions associated with a
tropical squall line,” Monthly Weather Review, vol. 110, pp. 118-135,
1982. [24] Tokay, D., A. Short, “Evidence from tropical raindrop spectra of the
origin of rain from stratiform versus convective clouds," J. Appl. Meteor.,
vol. 35, no. 3, pp. 355-371, 1996. [25] Atlas, D., C. W. Ulbrich, F. D. Marks, E. Amitai, C. R. Williams,
“Systematic variation of drop size and radar-Rainfall relations," J.
Geophysical Research, vol. 104, pp. 6155-6169, 1999. [26] Tokay, A., D. A. Short, C. R. Williams, W. L. Ecklund, K. S. Gage,
“Tropical rainfall associated with convective and stratiform clouds:
Intercomparison of disdrometer and profiler measurements," J. Appl. Meteor., vol. 38, no. 3, pp. 302-320, 1999.
[27] C. Capsoni, L. Luini, A. Paraboni, C. Riva, “Stratiform and convective
discrimination deduced from local P(R),” IEEE Transactions on Antennas and Propagation, vol. 54, issue 11, pp. 3566-3569, Nov. 2006.
[28] W. L. Stutzman and W. K. Dishman, “A simple model for the estimation
of rain induced attenuation along earth-space paths at millimeter wavelengths,” Radio Sci., vol. 17, no. 6, pp. 1465-1476, Nov.-Dec. 1982.
[29] W. Zhang, “Scattering of radiowaves by a melting layer of precipitation
in backward and forward directions,” IEEE Transactions on Antennas and Propagation, vol. 42, no. 3, pp. 347-356, Mar. 1994.
[30] T. Kozu, K. K. Reddy, S. Mori, M. Thurai, J. T. Ong, D. N. Rao and T.
Shimomai, “Seasonal and Diurnal Variations of Raindrop Size Distribution in Asian Monsoon Region,” Journal of Meteorology Society of Japan, vol. 84A, pp. 195-209, 2006.
[31] C. G. Mohr, R. L. Vaughan, “An Economical Procedure for Cartesian Interpolation and Display of Reflectivity Factor Data in Three-Dimensional Space,” Journal of Applied Meteorology, vol. 18, pp.
661-670, May 1979. [32] ITU-R: “Rain Height Model for Prediction Methods,” Recommendation
ITU-R P.839-3, Geneva, 2001.
[33] ITU-R: “Specific Attenuation Model for Rain for Use in Prediction Methods,” Recommendation ITU-R P. 838-3, Geneva, 2005.
[34] J. Goldhirsh, “A review on the application of nonattenuating frequency
radars for estimating rain attenuation and space-diversity performance,” IEEE Transactions on Geoscience Electronics, vol. GE-17, no. 4, pp. 218–239, Oct 1979.
[35] J. Goldhirsh, “Predictive methods for rain attenuation using radar and
in-situ measurements tested against the 28-GHz Comstar beacon signal,” IEEE Transactions on Antenna and Propagation, vol. AP-27, no. 3, pp. 398–406, May 1979.
[36] W. L. Stutzman, “Prediction of slant path rain propagation statistics using dual-polarized radar,” IEEE Transactions on Antenna and Propagation, vol. 38, no. 9, pp. 1384–1390, Sep 1990.
[37] A. Hornbostel, A. Schroth, “Comparison of radiometer, radar and rain gauge attenuation predictions with Olympus beacon measurements,” Ninth International Conference on Antennas and Propagation,
Conference Publication no. 407, pp. 23–26, Apr. 4-7, 1995.
Jun Xiang Yeo received the B.Eng. (Hons.) degrees in electrical and electronics engineering from the
Nanyang Technological University, Singapore, in 2007. He is currently working toward the Ph.D. degree in the School of Electrical and Electronic
Engineering, Nanyang Technological University, Singapore.
His research interests include the study of the
effects of rain on performance of satellite communication and the mitigation technique to counteract rain fades.
Yee Hui Lee (S’96–M’02) received the B.Eng. (Hons.) and M.Eng. degrees in electrical and
electronics engineering from the Nanyang Technological University, Singapore, in 1996 and 1998, respectively, and the Ph.D. degree from the
University of York, York, U.K., in 2002. Since July 2002, she has been an Assistant
Professor with the School of Electrical and
Electronic Engineering, Nanyang Technological University. Her interest is in channel characterization, rain propagation, antenna design,
electromagnetic bandgap structures, and evolutionary techniques.
Lakshmi Sutha Kumar received her B. Eng from
Bharadhidasan University, Thirichirappalli, India in 1994. She worked as a lecturer under Bharadhidasan University from 1995 to 1998 and under Pondicherry
University from 1998 to 2002 in India. She received her M.Tech degree from Vellore Institute of Technology, Vellore, India in 2005. She is currently
working towards her Ph.D. in the school of Electrical and Electronic Engineering, Nanyang Technological University, Singapore. Her research interest includes
microwave and millimeter-wave propagation and the study of the effects of rain on performance of microwave terrestrial and satellite communications.
Jin Teong Ong (M’XX) received the B.Sc. (Eng.) degree from London University, London, U.K., the
M.Sc. degree from University College, London, and the Ph.D. degree from Imperial College London, London.
He was with Cable & Wireless Worldwide PLC from 1971 to 1984. He was an Associate Professor with the School of Electrical and Electronic
Engineering, Nanyang Technological (now Nanyang Technological University), Singapore, from 1984 to 2005, and an Adjunct Associate
Professor from 2005 to 2008. He was the Head of the Division of Electronic Engineering from 1985 to 1991. He is currently the Director of research and technology of C2N Pte. Ltd.—a company set up to provide consultancy services in wireless and broadcasting systems. His research and consultancy
interests are in antenna and propagation—in system aspects of satellite, terrestrial, and free-space optical systems including the effects of rain and atmosphere; planning of broadcast services; intelligent transportation system;
EMC/I; and frequency spectrum management. Dr. Ong is a member of the Institution of Engineering and Technology.