Embed Size (px)
Citation preview

Vol.107 (3) September 2016 SOUTH AFRICAN INSTITUTE OF ELECTRICAL ENGINEERS 177
RAINFALL RATE AND ATTENUATION PERFORMANCE ANALYSIS AT MICROWAVE AND MILLIMETER BANDS FOR THE DESIGN OF TERRESTRIAL LINE-OF-SIGHT RADIO LINKS IN ETHIOPIA F. D. Diba*, T. J. Afullo ** and A. A. Alonge *** *Discipline of Electrical, Electronics and Computer Engineering, University of KwaZulu-Natal, Durban 4041, South Africa, email: [email protected] **Discipline of Electrical, Electronics and Computer Engineering, University of KwaZulu-Natal, Durban 4041, South Africa, email: [email protected] ***Discipline of Electrical, Electronics and Computer Engineering, University of KwaZulu-Natal, Durban 4041, South Africa, email: [email protected] Abstract: Rainfall is a major cause of propagation degradation in wireless communication systems at microwave and millimetre bands. While the International Telecommunications Union (ITU-R) recommends rain attenuation models based on measured rainfall and radio propagation data, the propagation model in Ethiopian context remains unstudied - with one-minute rainfall rate measurement recommended by ITU-R also unavailable. This paper thus addresses the following: the estimation of the cumulative probability distribution, giving the rainfall rate versus the percentage of time the indicated rainfall was exceeded in a year; derivation of one-minute rain rate distribution using the Rice-Holmberg (R-H) model, and then proposing the rainfall rate conversion factors for Ethiopian sites from 15-minute to one-minute integration time; developing rain rate and fade margin contour maps for Ethiopia; and modelling rain attenuation using the ITU-R method. Key words: Ethiopia Link Design, Rain rate, conversion factor, contour map, rain attenuation.
1. INTRODUCTION
The fast growth in wireless networks is leading to the saturation of the lower frequency bands (1-10 GHz).This reality has shifted emphasis to the higher frequency spectrum, especially in the region 30-100 GHz. However, atmospheric effects, especially rain is a dominant cause of signal degradation at microwave and millimetre bands, which leads to network outages. Rain attenuation is noticeable from propagation frequency above10 GHz in the temperate zone, while in tropical climate its effect is felt from 7 GHz [1]. When a microwave or millimetre wave signal travels through a rainy medium, its strength drastically weakens owing to the effect of absorption and scattering by rain drops on its amplitude and phase components [2]. In addition, rain droplets alter the polarization of the transmitted signal, resulting in depolarization effects at the receiver. Thus current microwave transmission network design needs detailed knowledge of rainfall attenuation, depolarization, and fades depth to meet the quality and reliability specifications for optimum system capacity [3]. In practice, the parameters of rainfall rate and raindrop size are investigated to improve the understanding of rainfall effects over wireless communications [4]. The study of radio wave propagation in the microwave and millimetre bands is of immense interest to both the International Telecommunications Union (ITU-R) and the International Union of Radio Science (URSI). The ITU-R, through recommendations P530-15 [5] and P618-11 [6], provides basic Line-of-Sight (LOS) link design
assumptions based on propagation prediction methods which are seldom suitable for tropical regions. It is, therefore, imperative for these regions to determine the parameters experimentally with a view to modify the ITU-R propagation prediction methods. Many researchers have studied the clear-air and rain effects on radio links in Southern Africa [7-13], Nigeria [14], and other tropical countries such as Malaysia [15] and Bangladesh [16]. However, many tropical and equatorial African regions have not been adequately studied. As a case in point there have been no investigative studies on rain attenuation effects at microwave and millimetre bands in Ethiopia. In this work, a 15 minute sampling time rain rate (R15min) cumulative distribution computed, giving the rainfall rate versus the percentage of time the indicated rainfall was exceeded in a year for several regions of Ethiopia based on data obtained from National Meteorological Agency (NMA) of Ethiopia. As one-minute integrated rainfall data is not available for Ethiopia, the measured rainfall rate was converted from the higher integration time (15 minutes in this case) to one-minute integration time, using the Rice-Holmberg (R-H) method [17]. These rainfall rate distributions were developed for ten Ethiopian locations, namaly: Addis Ababa, Adama, Arbaminch, Bahirdar, Diredawa, Dubti, Jimma, Kombolcha, Mekele and Negelle Borenna. Thereafter, a general conversion factor for the rest of the country’s locations is proposed. In addition, contour maps for rainfall rate and fade margin are developed and analysed for sites throughout Ethiopia. Based on ITU-R recommendation in [5], the specific rain attenuation for
Vol.107 (3) September 2016SOUTH AFRICAN INSTITUTE OF ELECTRICAL ENGINEERS178
frequency range of 1-300 GHz is determined in this project. Moreover, path attenuation of rainfall rate versus operation frequencies for different path lengths are estimated. Finally, regarding rainfall attenuation, it is noted that Sami Sharif [20] has done the closest work over Sudan, bordering western Ethiopia.
2. GEOGRAPHY AND CLIMATE OF ETHIOPIA
Geographically, Ethiopia is located between latitudes 30N to 180N, and longitudes 330E to 480E, with an altitude
variation from 100 meters below sea level to over 4000 metres above sea level. It is surrounded by Eritrea to the north, Djibouti to the north-east, Somalia to the east and south-east, Kenya to the south, and Sudan to the west, as shown in Fig.1. Ethiopia is generally a country of plateaus, with the Great Rift Valley separating the western and eastern highlands. The highlands slowly slope to the lowlands of Sudan to the west and Somalia to the east. The climate of the Ethiopian highlands is temperate, and of the lowlands is hot [18]. Over Ethiopia, the climatic variations tend to depend on unique features of the area. The classification of climate by Köppen (proposed in 1931), which is based on geographical elevation, was found useful in this case [19]. Thus, the three main climate classifications in Ethiopia are Class A (As, Aw (tropical), Am) climates of lowlands, varying from semi-humid to semi-arid surrounds the highlands; Class B (BWh (hot-arid), BSh (hot-semi arid) and BSk) climate in the Afar-Triangle and the Somali Region; and class C (Cwb (warm temperate), Cfb (warm temperate), Cwc) climates in the highlands, ranging from warm to cool mountains with semi-humid to humid characteristics.
3. RAIN MEASUREMENT AND DATA
PROCESSING
The cumulative distribution of rainfall rate (Rp) presents the rain intensity versus percentage of the time (over one year) (p) the indicated rain rate is exceeded. ITU-R [21] requires calculation of R0.01 mm/h to predict the attenuation due to rain. R0.01 occurs at 0.01% of the time exceedance, which can be read from the ITU-R map [21] or obtained from long-term local measurements. The parameter relies on the integration time of the rainfall measuring devices used. According to [14] and [22], the most desired integration time is one minute. Since one-minute rainfall data is unavailable in Ethiopia, converting from higher integration times to one-minute integration time is therefore required. Therefore Section 3.1 covers measurement and data processing; while section 3.2 covers 15 minute integration time rainfall distribution. 3.1 Rain Measurements and Data Processing Different devices are available to record rainfall. The NMA of Ethiopia uses two techniques to collect rain data, namely, it applies networks of rain gauges to measure rainfall intensity every 24 hours, and automated rain gauges to record rainfall intensity per 15 minute. The gauges meet the World Meteorological Organization standards. For the purpose of this paper, three years raw rainfall data collected by NMA comprising rainy and non-rainy (zero value) days is considered. Only the rain intensities with values different from zero were sorted out and processed, and then the appropriate mathematical formulation was used to calculate the required parameters.
Figure 1: Map of Ethiopia
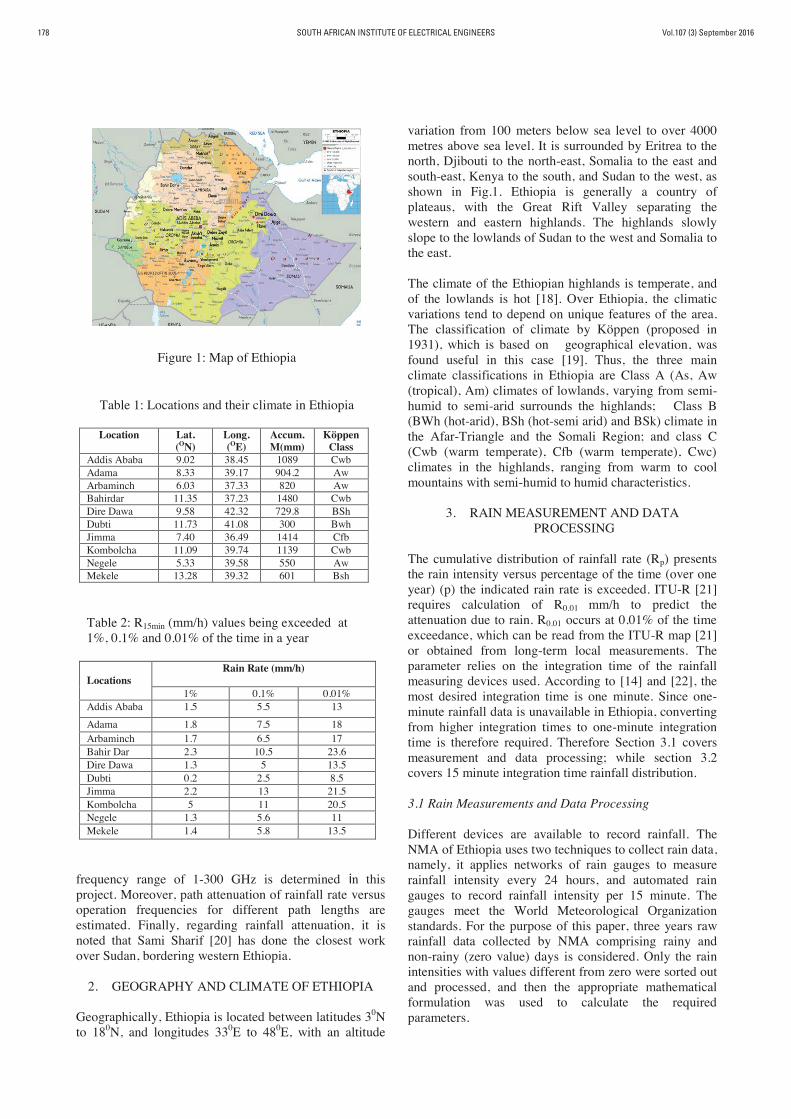
Table 1: Locations and their climate in Ethiopia
Location Lat. (ON)
Long. (OE)
Accum. M(mm)
Köppen Class
Addis Ababa 9.02 38.45 1089 Cwb Adama 8.33 39.17 904.2 Aw Arbaminch 6.03 37.33 820 Aw Bahirdar 11.35 37.23 1480 Cwb Dire Dawa 9.58 42.32 729.8 BSh Dubti 11.73 41.08 300 Bwh Jimma 7.40 36.49 1414 Cfb Kombolcha 11.09 39.74 1139 Cwb Negele 5.33 39.58 550 Aw Mekele 13.28 39.32 601 Bsh Table 2: R15min (mm/h) values being exceeded at 1%, 0.1% and 0.01% of the time in a year Locations
Rain Rate (mm/h)
1% 0.1% 0.01% Addis Ababa 1.5 5.5 13
Adama 1.8 7.5 18 Arbaminch 1.7 6.5 17 Bahir Dar 2.3 10.5 23.6 Dire Dawa 1.3 5 13.5 Dubti 0.2 2.5 8.5 Jimma 2.2 13 21.5 Kombolcha 5 11 20.5 Negele 1.3 5.6 11 Mekele 1.4 5.8 13.5

Vol.107 (3) September 2016 SOUTH AFRICAN INSTITUTE OF ELECTRICAL ENGINEERS 179
3.2 15- minute Rainfall Rate Distribution in Ethiopia The cumulative rainfall rate distribution for ten locations in Ethiopia is calculated and plotted based on the data from NMA of Ethiopia at 15 minute integration time. Figure 2 shows rain rate distribution for ten main sites of Ethiopia versus percentage of exceedance of time of the year for the 15 minute sampling rate. From Figure 2 and Table 2 the maximum value of rain rate R0.01 (R at 0.01%) is 23.6 mm/h observed at Bahirdar, while the minimum value of R0.01 is 8.5 mm/h, recorded at Dubti.
4. MODELING OF ONE-MINUTE RAINFALL RATE
CUMULATIVE DISTRIBUTION (CD)
There exist a number of rain rate distribution models for one-minute integration time. Some of these models include the Rice-Holmberg (R-H) model [17], the Kitami model [23], the Moupfouma model [24], and the Global ITU-R model [21]. The R-H model depends on the average annual precipitation and the thunderstorm ratio as the two vital parameters for estimating the rain rate from the local rain data. These parameters can either be obtained from the maps presented in [22] or estimated from the long-term average annual precipitation, the number of thunderstorm days, and the maximum monthly precipitation. The Kitami model was proposed by Ito and Hosoya [23], and it is based on two regional climatic parameters namely: the thunderstorm ratio and the average annual precipitation. Moupfouma’s model, developed by Moupfouma and Martin, offers a simple approach to the prediction of rain rate distribution for both temperate and tropical climates. Considering the variability of all the rain rate predictions, the R-H model has been determined to give a much better performance than others [25]. Hence, Section 4.1 presents the R-H rain
rate distribution model, section 4.2 discusses the conversion factors of rainfall rate from 15 minute to one–minute integration time, and section 4.3 discusses the development of the rain rate contour map. 4.1 Rice Holmberg rainfall distribution model In this work, the Rice-Holmberg model is used to determine one-minute rainfall rate cumulative distribution (CD) from local meteorological data to generate the two main parameters of distribution prediction, which are the average annual accumulated rainfall data (M), and thunderstorm ratio β. The average rainfall accumulation (M) is the sum of the thunderstorm accumulation (M1) and all other rain (M2), where:
21 MMM (1)
The thunderstorm ratio is defined as:
MM1
(2)
The number of hours of rain at one-minute periods (T1(R)) for which a surface point rainfall is exceeded is given by [17]:
]63.1exp86.1258.0[exp12.0
03.0exp03.01
RRRMRT
(3)
Hence, the percentage of time of an average year during which one-minute average rainfall rates exceed is
66.87% 1 RTP
In this work, the parameter M is measured by NMA of Ethiopia, whereas β is obtained from the map in [17], which is 0.2 for Ethiopia. Figure 3 shows the calculated R-H one minute integration time of rain rate distribution versus percentage of time exceedance for ten locations in Ethiopia. From the figure, the maximum rain rate (R) at 0.001%, 0.01%, and 0.1% of exceedance of time is in Bahirdar, while the minimum is recorded in Dubti as the values listed in Table 3 below. 4.2 Determination of Rainfall Rate Conversion Factors over Ethiopia The 15 minute rain intensity data for Ethiopian locations were obtained from the NMA of Ethiopia for a period of three years. The rainfall rate conversion from higher integration time to a smaller integration time has been
Figure 2: Cumulative rain rate distribution at 15 minute
sampling rate in Ethiopia

Vol.107 (3) September 2016SOUTH AFRICAN INSTITUTE OF ELECTRICAL ENGINEERS180
developed by many researchers [11, 22, and 24]. ITU-R P 837.6 also presents the power-law empirical conversion method for some countries, and regional maps exist
showing regional values for R0.01. The methods of Flavin [26], Segal [27], and Singh et al [28], are also based on the power-law conversion approach.
Segal developed conversion factors, p , for converting rain intensity data having an integration time of minutes to equivalent one-minute rainfall rates, as given by [27]:
pRpRp
1
(4)
where R1 and Rτ are the rainfall rates exceeded with equal probability P, for the two integration times [27]. The factor (P) is also given by the power law [28]:
bapp (5)
where P is the probability of occurrence, and a and b are the regression coefficients derived from the measured rainfall data. From Table 4, the general conversion factor for Ethiopia is given by:
4805.1151 )(199.1 pRpR (6)
Figure 4 shows the conversion factor graph for only two locations (Adama and Jimma) with their corresponding regression and correlation coefficients. 4.3 Contour Mapping of Rainfall Rate Distribution for Ethiopia In this study, the rain rates at 0.01% of time exceedance is calculated from available data for ten stations in Ethiopia. However, there is need to determine R0.01 for all locations in the country. Using spatial interpolation techniques, the unknown points all over Ethiopia are estimated. There are a number of spatial interpolation methods, such as kriging, inverse distance weighting (IDW), thin-plate spline, multiqudric, and bi-linear. From the above spatial interpolation techniques, IDW is the simplest and performs best [13, 29] and, thus, IDW is used in this work. IDW considers that the nearby values weight more to the interpolated points than the distance observations (that means the contribution of known data points are inversely proportional to the distance from the unknown location that is being predicted). The IDW expression is given by [30]:
m
N
mmn ZZ
1 (7)
Figure 3: R-H rainfall rate cumulative distribution at
one minute integration time in Ethiopia
Table 3: R1min (mm/h) for 99%, 99.9%, 99.99% availability
Locations Rain rate values at 0.1%,0.01% and 0.001% of time in a year
0.1% 0.01% 0.001% Addis Ababa 14 64 140 Adama 12 60 138 Arbaminch 11.5 58 134 Bahir Dar 17 76 155 Dire Dawa 10.5 53 130 Dubti 8 28 100 Jimma 16 73 152 Kombolcha 13.5 63.5 142 Negele 10 44 120 Mekele 10.2 46.5 123
Table 4 Values for regression and correlation coefficients for conversion factors
LOCATION a b R2
Addis Ababa 15 1.44 1.507 0.945
Adama 15 0.919 1.435 0.991
Arbaminch 15 0.926 1.435 0.962
Bahir dar 15 1.088 1.316 0.976
Dire Dawa 15 0.906 1.619 0.965
Dubti 15 8.263 0.738 0.817
Jimma 15 1.182 1.593 0.981
Kombolcha 15 1.492 1.441 0.958
Mekele 15 0.964 1.498 0.979

Vol.107 (3) September 2016 SOUTH AFRICAN INSTITUTE OF ELECTRICAL ENGINEERS 181
N
m mmm dd 1
11 (8)
11
N
mm (9)
22nmm yyxxd (10)
Here, Zn is the estimated value at point n, Zm is the observed value at the sample point m, ωm is the weight allocated to the sample points, N indicates the number of sample points, dm is the distance between m and n, β is the power parameter and (x; y) are the coordinates of the interpolation point and (xm; yn) are the coordinates of the sample points. We use two different types of software, namely, PAST version 2.17C, and MATLAB. PAST is a free software tool and it is a package used for statistical data analysis, plotting and modelling functions. Interpolation of data was done using PAST and plotting of contour maps was carried out in MATLAB. Figure 5 shows the proposed rainfall rate distribution contour map of Ethiopia of R0.01 using the R-H model. It is seen from the figure that the western and central high lands part of Ethiopia experience higher rainfall rate distribution than the eastern low lands as expected.
5. DETERMINATION OF RAIN ATTENUATION OVER ETHIOPIA
Rainfall that occurs over terrestrial radio links induces attenuation because of the electromagnetic wave scattering and absorption by rain drop particles. In order to characterize rain attenuation, ITU-R (530-15) proposed a rainfall attenuation prediction model. Therefore, Section 5.1 discusses the specific attenuation while Section 5.2 presents total rain attenuation for varying path length and frequency.
5.1 Determination of Specific Attenuation of Rainfall The attenuation due to rain for terrestrial radio links is based on R0.01, signal polarization, propagation frequency, and path length. The first step is to determine the specific rain attenuation - that is, rain attenuation per kilometre in a rainy medium. In this paper, the value of R0.01 is computed using R-H model as shown in Table 3. However, if local data is not available, R0.01 can be estimated from the ITU-R map in [21]. The specific attenuation (dB/km) is given by [31]:
01.0KRR (11)
Here R is specific attenuation, K and α are the regression coefficients which are determined as a function of frequency as given in [31] for horizontal and vertical polarization. Figures 6a and 6b show the calculated distribution of specific attenuation of rain versus frequency for ten locations in Ethiopia, namely: Addis Ababa, Adama, Arbaminch, Bahirdar, Diredawa, Dubti, Jimma, Kombolcha, Mekele and Negele Borena. In fact, these are typical locations that represent most parts of the country. Figure 6a shows the specific rain attenuation for horizontal polarization for the ten locations; while Figure 6b is for vertical polarization. Fig.6 shows the fast increase of specific attenuation for frequency ranges up to
Figure 4: 15- minute to 1-minute conversion for
Adama and Jimma
Figure 5: Contour map of rain rate using R-H model at 0.01% for Ethiopia

Vol.107 (3) September 2016SOUTH AFRICAN INSTITUTE OF ELECTRICAL ENGINEERS182
50 GHz, then a more gradual increment from 50 to 100 GHz. These values then remain practically constant for frequencies up to 150 GHz. Finally, it slowly decreases for the rest of propagation frequency. It is seen from Figure 6a that the maximum specific attenuation of 22 dB is observed in Bahirdar, while the minimum of 10 dB is estimated in Dubti at 50 GHz. From Figure 6b, the highest specific rain attenuation of 20 dB is observed in Bahirdar, while the lowest (8 dB) is observed in Dubti at the frequency of 50 GHz. From Figure 6 it is also seen the specific rain attenuation for horizontal polarization is higher than for vertical polarization, because of the fact that the raindrops have a non-spherical shape with flattened base and therefore, the horizontally polarized waves are attenuated more than the vertically polarized waves.
5.2 Determination of Rainfall Attenuation
According to the ITU-R model [5], the prediction of rainfall attenuation involves the following five steps: Step 1: Determination of the rain rate (R0.01), as seen in Table 3 and Figure 3. Step 2: Computation of specific attenuation R (dB/km), as given equation (11) above. Step 3: Calculation of the effective path length (deff) of the link which can be computed by multiplying the actual path length (d) with the distance factor r, where r is given by [5]:
dfRdr
024.0exp1579.10477.01
123.0073.001.0
633.0
(12)
Here, f is the frequency (GHz), α is the regression constant in specific attenuation, and r is less than or equal to 2.5. Step 4: Estimation of path attenuation that is exceeded 0.01% of time is given by [5]:
drA R01.0 (13) Step 5: Computation of rain attenuation for different percentages of exceedance in the range 0.001% to 1% as given by [5]:
pCCp PCAA 1032 log
101.0 (14)
00 11 12.007.0 CCC (15)
]1[546.0855.0 002 CCC (16)
]1[043.0139.0 003 CCC (17)
GHzf
GHzffC
1012.0
1010
log4.012.08.0
100
(18)
Fig. 6(a)
Fig. 6(b)
Figures 6a and b: Specific rain attenuation for
Ethiopia versus frequency for horizontal and vertical polarization

Vol.107 (3) September 2016 SOUTH AFRICAN INSTITUTE OF ELECTRICAL ENGINEERS 183
The prediction procedure outlined above is considered to be valid in all parts of the world at least for frequencies up to 100 GHz and path lengths up to 60 km [5]. Figures 7a and 7b show the rain attenuation versus link path length for horizontal and vertical polarizations for ten sites in Ethiopia over different distances. From these graphs, the rain attenuation rises sharply for the first 20 km, then increases less sharply from 20 km to 40 km and finally the attenuation settles almost to a constant. As the distance increases, the rain attenuation becomes non-uniform because of the fact that for large actual path lengths, the effective path length remains fixed. As seen in Figure 7a with horizontal polarization at distance of 20 km, the maximum rain attenuation is observed at Bahirdar at 41 dB, while the minimum is at Dubti at 16.2
dB. For vertical polarization (Figure 7b) similar distribution of rain attenuation is observed: the highest value is 35 dB in Bahirdar, and lowest value is 14.5 dB in Dubti at 20 km. comparing the two graphs, vertical polarization has lower rain attenuation than horizontal polarization, as already stated. Rainfall occurs some times of the year with varying rates from time to time, hence the rain fade margin needed to compensate for rain attenuation varies with time. Figures 8a and 8b show the fade depth at various percentages of time. Figure 8a gives the attenuation values for horizontal polarization at different percentages of time at 13 GHz and 13.34 km path length. At 0.01% of the time (99.99% availability), the maximum fade depth is 31.14 dB as observed in Bahirdar while the minimum is 12.25 dB recorded in Dubti. For vertical polarization (Figure 8b) similar distribution of rain fade is observed: the highest value is 26.25 dB in Bahirdar, and the lowest value is 10.97 dB in Dubti at the same link distance and operating frequency. Comparing the two graphs, vertical polarization has 14% lower rain attenuation than horizontal polarization.
From the rain attenuation distribution plots shown in Figures 8a and 8b above, fade margin values are determined at different percentages of time of the year for the ten geographical locations. Tables 5 and 6 give the required fade margins at 13 GHz and 13.34-km path length for the ten geographical locations in Ethiopia. The reference link availabilities are 99.999%, 99.99%, 99.9% and 99%. As seen from Tables 5 and 6, the rain fade decreases as availability reduces from 99.999% to 99%. Figures 9a and 9b show rainfall fade margin contour maps for horizontal and vertical polarization, respectively. As seen from the maps, the fade margin decreases as we move from the western to the eastern part of the country, and horizontal polarization requires a higher fade margin than vertical polarization
6. CONCLUSION In this work, the rainfall rate distributions for ten geographical locations in Ethiopia are determined at 15-minute sampling rain rate. The R-H model is then used to convert the local measurement of annual rainfall accumulation into one-minute integration time rain rate distribution. Also, the rainfall rate and fade margin contour maps at 0.01% exceedance are developed for Ethiopia. Using the ITU-R model, specific rain attenuation and total rain attenuation for terrestrial Line-of-Sight links in Ethiopia are predicted for varying frequencies and distances. It is found that the attenuation for shorter link paths is more affected by rainfall than longer distance due to non-uniformity of rain distribution over the link. In descending order, the attenuation of rainfall rate is the highest in Bahirdar, followed by Jimma, Kombolcha, AddisAbaba, Adama, Arbaminch, Diredawa, Mekele, Negele Borena and least in Dubti. The
Fig. 7(a)
Fig. 7(b)
Figures 7a and b: Attenuation versus distance at 13
GHz for Horizontal and Vertical Polarization respectively

Vol.107 (3) September 2016SOUTH AFRICAN INSTITUTE OF ELECTRICAL ENGINEERS184
data from these maps will be useful as preliminary design tools for terrestrial microwave engineers.
REFERENCES
[1] F. Moupfouma: “Improvement of a rain attenuation prediction method for terrestrial microwave links," IEEE Transactions on Ant. and Prop., Vol. 32, No. 12, pp. 1368-1372, 1984.
[2] R. E. Collin: “Antennas and Radiowave Propagation,” 401-402, McGraw Hill, ISBN 0-07-Y66156-1, 1995
[3] Khandaker Lubaba Bashar, Mohammad Mahfujur
Rashid: “Performance Analysis of Rain Fades on Microwave Earth-to-Satellite Links in Bangladesh.” International Journal of Engineering and Technology Vol. 4, No. 7, July 2014
[4] A. A. Alonge and T.J. Afullo: "Rainfall
Microstructures for Microwave and Millimeter Wave Link Budget at Tropical and Subtropical Sites," IEEE Africon, Le Meridien - Ile Maurice; Mauritius, 09 Sep - 12 Sep 2013.
[5] ITU: "Propagation Data and Prediction Methods
Required for the Design of Terrestrial Line-of-Sight Systems," in Recommendation ITU-R P. 530-15; P Series, Geneva, 2013.
[6] ITU: "Propagation Data and Prediction
MethodsRequired for the Design of Earth-Space Telecommunication Systems," in Recommendation ITU-R P.618-11; P Series, Geneva, 2013.
[7] S.J. Malinga, P.A. Owolawi and T.J.O. Afullo:
"Estimation of Terrestrial Rain Attenuation at Microwave and Millimeter Wave Signals in South Africa Using the ITU-R Model," in PIERS Proceeding, Kuala Lumpur, Malaysia, pp. 952-962, March 27-30 2012.
[8] S. Malinga, P. Owolawi and T. Afullo:
"Determination of Specific Rain Attenuation Using Different Total Cross Section Models for Southern Africa," Johannesburg; Vol. 105, pp. 20-30, March 2014.
[9] S.J. Malinga, P.A. Owolawi and T.J.O. Afullo:
"Computation of Rain Attenuation through Scattering at Microwave and Millimeter Bands in South Africa," in Progress in Electromagnetics Research Symposium Proceedings, Taipe, pp.959-970, March 25-28, 2013
[10] M. O. Fashuyi, P. A. Owolawi, and T. J. Afullo:
Rainfall rate modeling for LOS radio systems in South Africa," South African Institute of Electrical Engineering Journal, Vol. 97, No. 1, pp.74-81, March 2006.
[11] P. O. Akuon and T. J. O. Afullo: “Rain Cell Sizing
for the Design of High Capacity Radio Link Systems in South Africa,” Progress in Electromagnetics Research B, Vol. 35, pp. 263-285, 2011
[12] A. A. Alonge and T. J. Afullo: “Rainfall
Microstructural Analysis for Microwave Link Networks: Comparison at Equatorial and Subtropical
Fig. 8(a)
Fig. 8(b)
Figures 8a and b: Attenuation against exceedance for
13.34 km path distance and 13GHz propagation frequency in HP and VP respectively

Vol.107 (3) September 2016 SOUTH AFRICAN INSTITUTE OF ELECTRICAL ENGINEERS 185
Africa,” Progress in Electromagnetic Research B, Vol. 59, pp. 45 – 58, 2014.
[13] P. A. Owolawi: “Rainfall Rate Probability Density
Evaluation and Mapping for the Estimation of Rain Attenuation in South Africa and Surrounding Islands,” Progress in Electromagnetics Research, Vol. 112, pp. 155-181, 2011.
[14] G. Ajayi and E.B.C. Ofoche: "Some Tropical
Rainfall Rate Characterstics at IIe-Ife for Microwave and Millimeter Wave Applications," in Journal of Climate and Applied Meteorology, Vol. 23, 29 pp. 562-567, November 1983.
[15]U. Kesavan, A.R.Tharek and A. Rahman:
"Comparative Studies of the Rain Attenuation Predictions for Tropical Regions," in Progress in Electromagnetics Research, Vol. 18, pp. 17-30, 2011.
[16] S. Hossain: "Rain Attenuation Prediction for
Terrestrial Microwave Link in Bangladesh," in Journal of Electrical and Electronics Engineering, vol. 7, Issue: 1; pp. 63-67, May 2014.
[17] Holmberg, L, Philip, R, Nettie and Rice:
"Cumulative Time Statistics of Surface-Point Rainfall Rates," in IEEE Transactions on Communications, Vol. Com-21, No., 10, October 1973.
[18] S. Walker, Y.G. Eyesus, K. Tesfaye, E. Bekele, A.
Yeshana and G. Mamo: “The use of Agro Climatic Zones as a Basis for Tailored Seasonal Rainfall Forecasts for the Cropping Systems in the Central Rift Valley of Ethiopia," Conference: insights and Tools for Adaptation, November 2003, DOI: 10.13140/2.1.1709.1522.
[19] M. Belda, E. Holtanová, T. Halenka and J. Kalvová:
"Climate Classification Revisited: from Köppen to Trewartha," in Climate Research, Vol.59, pp.1-13, February 2014.
[20] S. M. Sharif: "Microwave Signal Attenuation Due to
Rainfall in Sudan," The six African workshop on Wireless Use of Information, vol. 6, pp. 1-6, Oct 2007.
[21]ITU: “Characteristics of precipitation for propagation
modeling,” Geneva, ITU-R P.837-6, 2012. [22] Watson, P. A., M. Gunes, B. A. Potter, B.
Sasthiaseelan and J. Leitas: “Development of a climatic map of rainfall attenuation for Europe," Post Graduate School of Electrical and Electronic Engineering, University of Bradford, No. 327, 153, 1982.
[23] Ito, C. and Y. Hosaya: “Worldwide 1-min. Rain rate
distribution prediction method which uses thunderstorm ratio as regional climatic parameter,” Electronic Letters, Vol. 35, No. 18, pp. 1585–1587, 1999.
[24] F. Moupfouma and L. Martin: “Modeling of the
rainfall rate cumulative distribution for the design of
Fig. 9(a)
Fig. 9(b)
Figure 9: Contour map of rain fade using R-H model
at 0.01% for HP and VP respectively

Vol.107 (3) September 2016SOUTH AFRICAN INSTITUTE OF ELECTRICAL ENGINEERS186
satellite and terrestrial communication systems,” International Journal of Satellite Communications, Vol. 13, No. 2, pp. 105–115, 1995.
[25] O. O., Obiyemi, J. S. Ojo, and T. S. Ibiyemi:
“Performance Analysis of Rain Rate Models for Microwave Propagation Designs over Tropical Climate,” Progress in Electromagnetics Research, Vol. 39, pp. 115–122, 2014.
[26] R. K. Flavin: “Rain attenuation considerations for
satellite paths," Australian Telecomm. Research, Vol.23, No. 2, pp. 47-55, 1982.
[27] B. Segal: “The Influence of Raingage Integration
Time on Measured Rainfall-Intensity Distribution Functions,” J. of Atmospheric and Oceanic Tech, Vol. 3, 1986, pp. 662-671, December 1986
[28] M. S. Singh, K. Tanaka and M. Lida: “Conversion of 60-, 30-, 10- and 5-minute rain rates to 1-minute rates in tropical rain rate measurement,” ETRI vol. 29, no. 4, pp. 542-544, August 2007
[29] M.O. Asiyo and T. J.O. Afullo: “Spatial Interpolation
for Mapping Geoclimatic Factor K in South Africa.” PIERS Proceedings, Taipei, March 25–28, 2013
[30] M. Azpurua and K. D. Ramos: “A comparison of
spatial interpolation methods for estimation of average electromagnetic field magnitude," Progress in Electromagnetics Research, Vol. 14, pp. 135-145, September 2010.
[31] ITU: “Specific Attenuation Model for Rain for Use
in Prediction Methods,” in Recommendation ITU-R P.838-3, Geneva, 1992-1999-2003-2005.