Embed Size (px)
Citation preview
Comparison of Multieffect Distillation and Extractive Distillation
Systems for Corn-Based Ethanol Plants
Miles Ndika Dion Ngute
Thesis submitted to the Faculty of the
Virginia Polytechnic Institute and State University
In partial fulfillment of the requirements for the degree of
Master of Science
In
Chemical Engineering
Y.A. Liu, Chair,
Stephen M. Martin
Preston L. Durrill
January 13, 2012
Blacksburg, Virginia
Key words: Azeotrope, Extractive Distillation, Multieffect Distillation, Heat Integration
Comparison of Multieffect Distillation and Extractive Distillation
Systems for Corn-Based Ethanol Plants
Miles Ndika Dion Ngute
ABSTRACT
Recent publications on ethanol production and purification shows optimized energy and
water consumptions as low as 22,000 Btu/gal ethanol and 1.54 gal water/gal ethanol respectively
using multieffect distillation. Karuppiah, et al10
use column rating and mathematical optimization
methods and shortcut design models to design evaluate and optimize the energy and water
consumption. In this work, we compare shortcut design and rigorous simulation models for an
ethanol purification distillation system, and we show that distillation systems based on shortcut
design underestimate the true energy and water consumption of the distillation system. We then
use ASPEN Plus, to design a multieffect distillation system and an extractive distillation system
using rigorous simulation and compare the two for energy and water consumptions.
We show that the extractive distillation system has lower steam and cooling water consumptions
and consequently lower energy and water consumptions than multieffect distillation in corn-to-
ethanol production and purification. We also show that the extractive distillation system is
cheaper than the multieffect distillation system on a cost per gal ethanol basis. This work gives
an energy consumption of 29987 Btu/gal ethanol and water consumptions 2.82 gal/gal ethanol
for the multieffect distillation system at a manufacturing cost of $3.03/gal ethanol. For the
extractive distillation system, we calculate an energy consumption of 28199 Btu/gal ethanol and
a water consumption of 2.79 gal/gal ethanol at a manufacturing cost of $2.88/gal ethanol.
iii
Acknowledgments
I would like to sincerely thank my advisor, Dr. Y.A. Liu, for all his advice, support and
encouragement throughout my undergraduate and graduate years and towards the completion of
my M.Sc. in Chemical Engineering. I would also like to thank the members and former members
of Dr. Liu’s group.
I also thank my family and friends for always supporting and encouraging me. They have
been of great moral and psychological support throughout all my studies in engineering.
We thank MATRIC for the opportunity to work on this project and for all the supplemental
material and guidance they provided during this project.
I also want to heartily thank Dr. Stephen Martin and Dr. Preston Durrill for serving on my
graduate committee. Both have been really instrumental throughout my undergraduate and
graduate years.
I would also like to thank the department of chemical engineering at Virginia Tech for giving me
the opportunity to complete my M.Sc. in Chemical Engineering.
iv
Table of Contents
List of Figures ...................................................................................................................................... v
List of Tables .....................................................................................................................................vii
List of Aspen Plus Simulation Files ............................................................................................. viii
1. Introduction ............................................................................................................................. 1
2. Corn-to-ethanol conversion.................................................................................................... 2
3. The Pre-distillation Section .................................................................................................... 4
4. Water-Ethanol Azeotrope ...................................................................................................... 6
5. Literature Review.................................................................................................................... 7
5.1 Process Modeling Simulator ..................................................................................................... 7
5.2 Distillation Model ...................................................................................................................... 7
5.3 Example of Shortcut design versus Rigorous Simulation ....................................................... 8
5.4 Final Calculated and Reported results .................................................................................... 15
5.5 Wastewater Treatment Option ................................................................................................ 15
6. Design Alternatives ............................................................................................................... 16
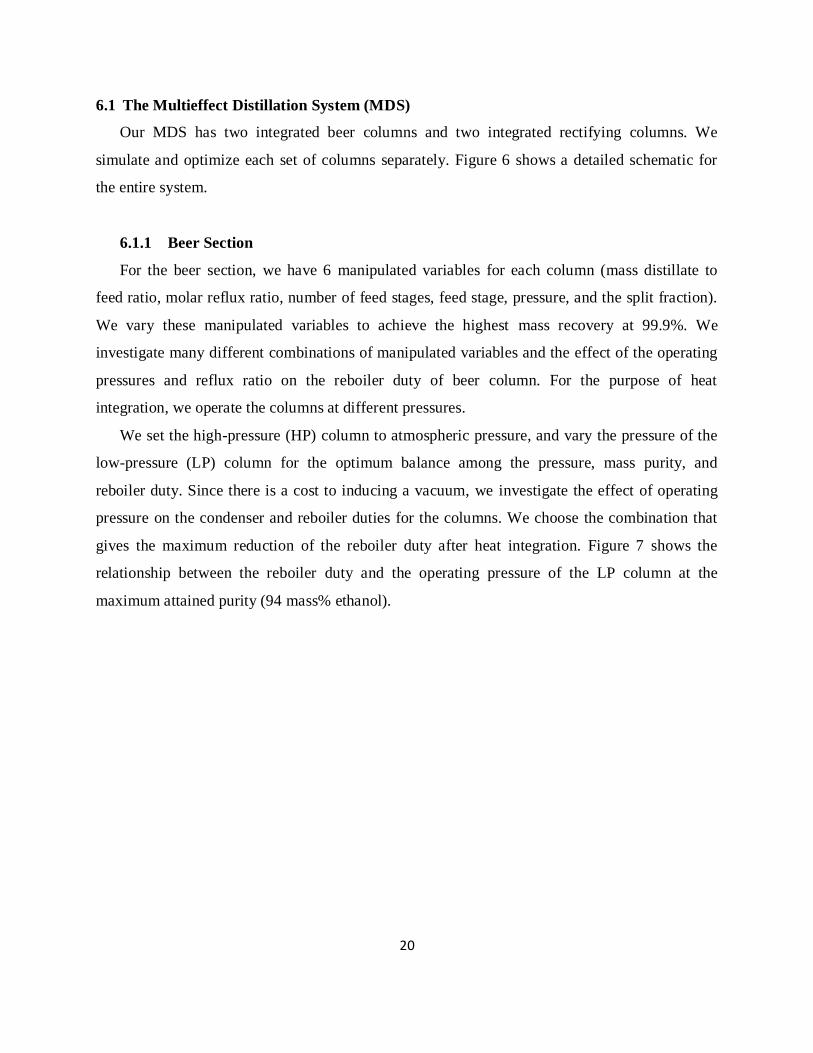
6.1 The Multieffect Distillation System (MDS) .......................................................................... 20
6.1.1 Beer Section .................................................................................................................... 20
6.1.2 Rectifying Section .......................................................................................................... 24
6.1.3 MDS Heat Integration .................................................................................................... 25
6.2 The Extractive Distillation System (EDS) ............................................................................. 28
6.3 The Post-distillation Section ................................................................................................... 30
7. Comparing Design Alternatives .......................................................................................... 32
7.1 Comparing Heat Duties ........................................................................................................... 32
7.2 Calculating Water Consumption ............................................................................................. 32
7.3 Water Consumption in Design Alternatives .......................................................................... 34
8. Reuse of Treated Wastewater ............................................................................................. 37
9. Economic Analysis ................................................................................................................ 43
10. Conclusions............................................................................................................................. 48
References .......................................................................................................................................... 49
Appendix A: List of annotated figures .......................................................................................... 55
Appendix B: Energy Consumption ................................................................................................ 68
Appendix C: Water Consumption ................................................................................................. 75
Appendix D: Economic Analysis .................................................................................................... 76
v
List of Figures
Figure 1: Pre-distillation section 5
Figure 2: Extension of water-ethanol azeotrope at 0.1 atmospheres 6
Figure 3: Results from shortcut design by DSTWU model in Aspen Plus 11
Figure 4: Results of rigorous simulation using RADFRAC model from Aspen Plus 13
Figure 5: Schematic of DOA Model 17
Figure 6: Multieffect Distillation System (MDS) 21
Figure 7: Effect of LP column operating pressure on reboiler duty 22
Figure 8: Effect of LP column operating pressure on condenser duty 23
Figure 9: Effect of beer section split ratio on energy consumption 24
Figure 10: Effect of rectifying section split ratio on energy consumption 25
Figure 11: MDS heat integration 27
Figure 12: Extractive Distillation System (EDS) 29
Figure 13: Multieffect evaporators 31
Figure 14: Comparing energy consumption 32
Figure 15: Closed loops for water in cooling tower system 34
Figure 16: Comparing water consumption 35
Figure 17: Wastewater treatment scheme 42
Appendix A: List of annotated figures 55
Figure 1: Pre-distillation section 55
Figure 2: Extension of water-ethanol azeotrope at 0.1 atmospheres 55
Figure 3: Results from shortcut design by DSTWU model in Aspen Plus 56
Figure 4: Results of rigorous simulation using RADFRAC model from Aspen Plus 57
Figure 5: Schematic of DOA Model 58
Figure 6: Multieffect Distillation System (MDS) 59
Figure 7: Effect of LP column operating pressure on reboiler duty 60
Figure 8: Effect of LP column operating pressure on condenser duty 60
Figure 9: Effect of beer section split ratio on energy consumption 61
Figure 10: Effect of rectifying section split ratio on energy consumption 62
Figure 11: MDS heat integration 63
vi
Figure 12: Extractive Distillation System (EDS) 64
Figure 13: Multieffect evaporators 64
Figure 14: Comparing energy consumption 65
Figure 15: Closed loops for water in cooling tower system 66
Figure 16: Comparing water consumption 66
Figure 17: Wastewater treatment scheme 67
vii
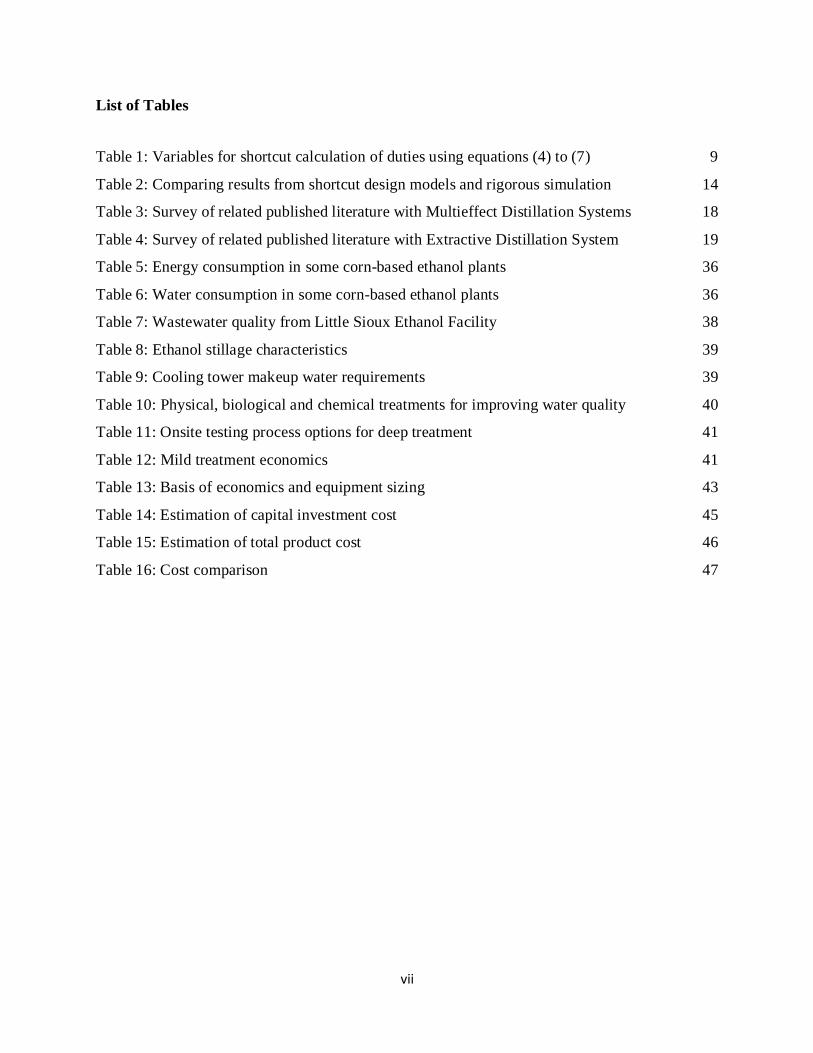
List of Tables
Table 1: Variables for shortcut calculation of duties using equations (4) to (7) 9
Table 2: Comparing results from shortcut design models and rigorous simulation 14
Table 3: Survey of related published literature with Multieffect Distillation Systems 18
Table 4: Survey of related published literature with Extractive Distillation System 19
Table 5: Energy consumption in some corn-based ethanol plants 36
Table 6: Water consumption in some corn-based ethanol plants 36
Table 7: Wastewater quality from Little Sioux Ethanol Facility 38
Table 8: Ethanol stillage characteristics 39
Table 9: Cooling tower makeup water requirements 39
Table 10: Physical, biological and chemical treatments for improving water quality 40
Table 11: Onsite testing process options for deep treatment 41
Table 12: Mild treatment economics 41
Table 13: Basis of economics and equipment sizing 43
Table 14: Estimation of capital investment cost 45
Table 15: Estimation of total product cost 46
Table 16: Cost comparison 47
viii
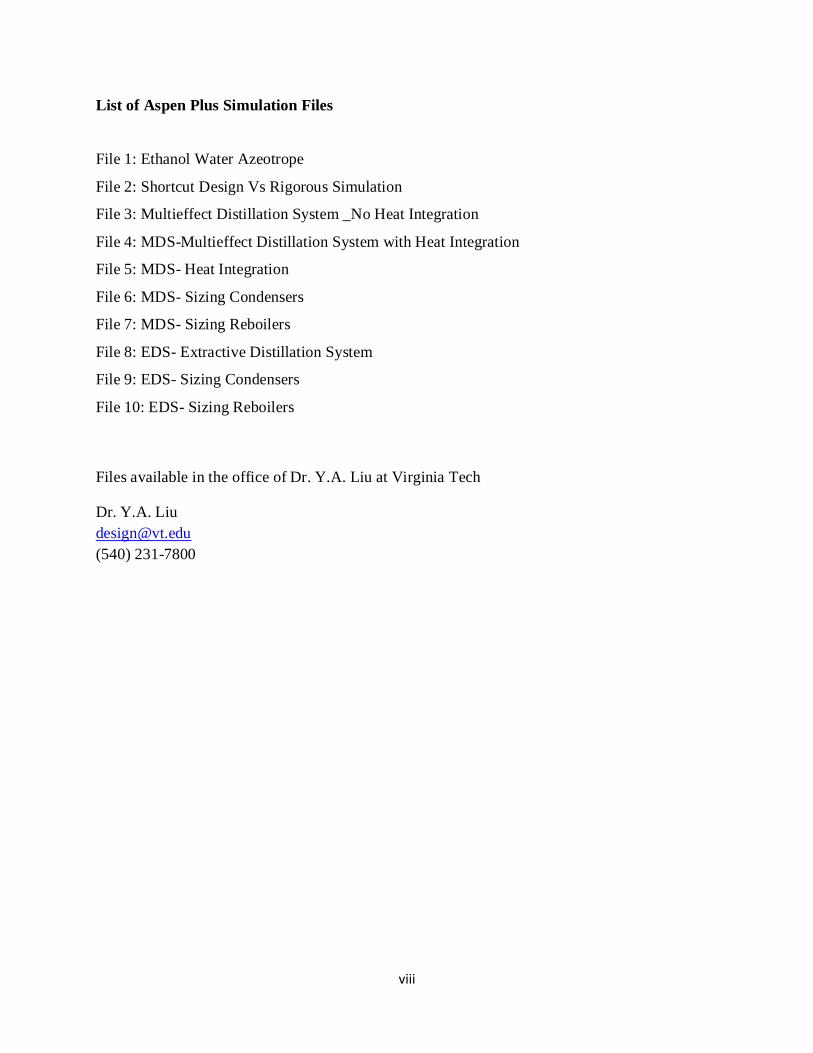
List of Aspen Plus Simulation Files
File 1: Ethanol Water Azeotrope
File 2: Shortcut Design Vs Rigorous Simulation
File 3: Multieffect Distillation System _No Heat Integration
File 4: MDS-Multieffect Distillation System with Heat Integration
File 5: MDS- Heat Integration
File 6: MDS- Sizing Condensers
File 7: MDS- Sizing Reboilers
File 8: EDS- Extractive Distillation System
File 9: EDS- Sizing Condensers
File 10: EDS- Sizing Reboilers
Files available in the office of Dr. Y.A. Liu at Virginia Tech
Dr. Y.A. Liu
(540) 231-7800
1
1. Introduction
There are two main biofuel production processes; the wet milling and the dry milling (dry
grind) processes. These processes are both water-intensive processes, but the dry grind process is
less intensive. The United States produces over 60% of its ethanol via the dry milling process.1, 2
The dry grind ethanol process starts with the whole corn kernel. The corn kernel goes
through a hammer mill where it turns to flour. It then cooks in a jet cooker where it becomes
slurry. We use enzymes to treat the slurry and we add yeast to the slurry so it ferments. The
effluent from the fermentation process contains ethanol and this is what we distill. The dry grind
process has distillers grains as a by-product. Currently most dry grind processes use 3-15 gal
water/gal ethanol. Pfromm3 reports a low value of 2.85 gal water/gal ethanol. In 2010
Grossmann4 reports the lowest values of 1.54 gal water/gal ethanol. The value Grossmann et al.,
reports comes from a shortcut design of an ethanol plant which is different from rigorous
simulations.
The main focus of this work is finding the best distillation design option that optimizes
energy and water savings in ethanol production and purification. Optimizing water and energy
savings will eventually reduce the total annual cost. To do this we propose replacing the
conventional distillation system of the dry milling process with either a multieffect distillation
system or an extractive distillation system. We compare the two distillation design alternatives
while keeping the pre-distillation sections and the post-distillation sections of the dry grind
process the same.
2
2. Corn-to-ethanol conversion
In the production of ethanol from corn, two bioprocesses must be present. The first
bioprocess is a saccharification process, which is where the cellulose and/or starch in the
corn enzymatically break down to monosaccharide components, such as glucose. The second
required bioprocess is a fermentation process, in which the monosaccharide components
(glucose) from the saccharification step convert to ethanol, normally forming carbon dioxide
as a by-product. During the simultaneous saccharification and fermentation process, the
saccharification is the rate limiting step. This is due to the difficulty in breaking down the
cellulosic material in the corn to glucose. The enzymes in the reaction act as a catalyst and
they influence the conversion of glucose from starch or cellulose2,5
. Equation (1) describes
the reaction of the saccharification step;
Starch + Water → Glucose
(1)
The glucose from this step then undergoes a two-step fermentation process. In the first
step, the glucose converts to ethanol and carbon dioxide, and leaves some NFDS (Non-
Fermentable Dissolved Solids or Sugars). NFDS are complex sugars which do not lead to the
production of alcohol (ethanol). This step consists of a biphasic aerobic and anaerobic
fermentation process. First with the aerobic fermentation process where the yeast “wakes up”
and begins to reproduce consuming some of the sugar (glucose) to produce Adenosine
Triphosphate (ATP) which is energy for reproduction. This aerobic fermentation results in
yeast growth which is essential for the next step which is anaerobic fermentation. Since the
system is not aerated, anaerobic fermentation occurs. In the anaerobic fermentation step, the
yeast cells in the absence of oxygen consume sugar (glucose) and produce ethanol and
carbon dioxide. Some starch also converts to non-fermentable sugars like xylose resulting in
some left over sugars which we term Non-Fermentable Dissolved Solids (NFDS)3.
Equation (2) specifies the reaction of the first step of the fermentation process.
Glucose → Ethanol + Carbon Dioxide + NFDS
3
(2)
During this first step of the fermentation process, 100% of the fermentable glucose
converts. In the second step, the non-fermentable dissolved solids or sugars (NFDS) convert
to a soluble protein that we will call ‘PROTSOL’. Equation (3) gives the reaction of the
second step of the fermentation process.
NFDS→PROTSOL
(3)
The saccharification and fermentation steps are the limiting steps in the production of ethanol
from corn. In this process, we model both steps as continuous processes in a continuous stirred
tank reactor4.
4
3. The Pre-distillation Section
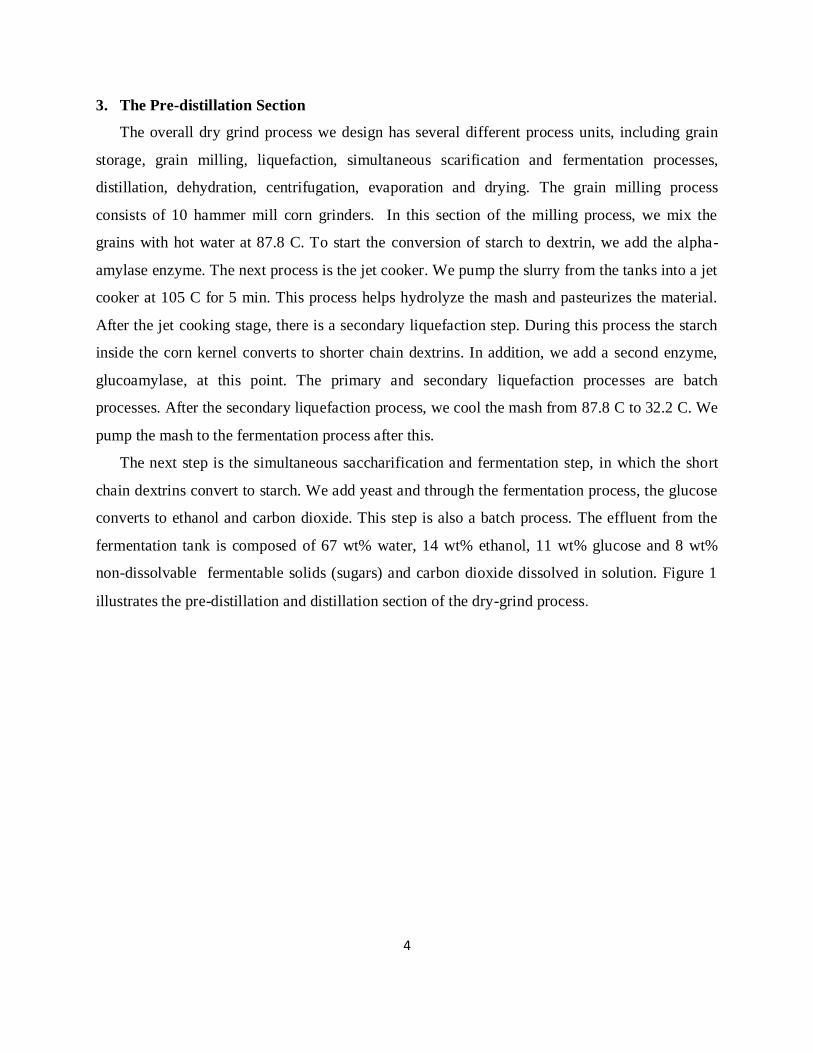
The overall dry grind process we design has several different process units, including grain
storage, grain milling, liquefaction, simultaneous scarification and fermentation processes,
distillation, dehydration, centrifugation, evaporation and drying. The grain milling process
consists of 10 hammer mill corn grinders. In this section of the milling process, we mix the
grains with hot water at 87.8 C. To start the conversion of starch to dextrin, we add the alpha-
amylase enzyme. The next process is the jet cooker. We pump the slurry from the tanks into a jet
cooker at 105 C for 5 min. This process helps hydrolyze the mash and pasteurizes the material.
After the jet cooking stage, there is a secondary liquefaction step. During this process the starch
inside the corn kernel converts to shorter chain dextrins. In addition, we add a second enzyme,
glucoamylase, at this point. The primary and secondary liquefaction processes are batch
processes. After the secondary liquefaction process, we cool the mash from 87.8 C to 32.2 C. We
pump the mash to the fermentation process after this.
The next step is the simultaneous saccharification and fermentation step, in which the short
chain dextrins convert to starch. We add yeast and through the fermentation process, the glucose
converts to ethanol and carbon dioxide. This step is also a batch process. The effluent from the
fermentation tank is composed of 67 wt% water, 14 wt% ethanol, 11 wt% glucose and 8 wt%
non-dissolvable fermentable solids (sugars) and carbon dioxide dissolved in solution. Figure 1
illustrates the pre-distillation and distillation section of the dry-grind process.
5
Figure 1-Pre-distillation section
6
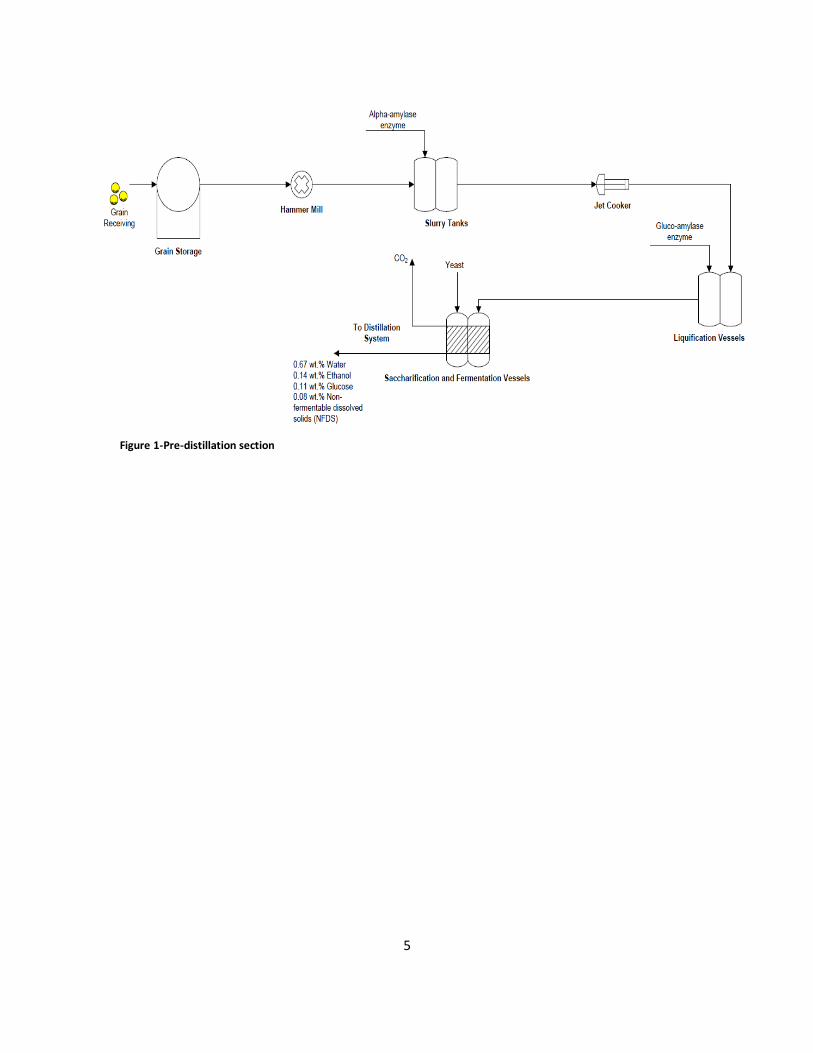
4. Water-Ethanol Azeotrope
Using the property analysis tool in ASPEN Plus, we show that an azeotrope forms between
ethanol and water at 95.6 wt % ethanol. Since an azeotrope exists between ethanol and water,
conventional distillation is not feasible in the distillation of ethanol and water. For our design
alternatives, we investigate using extractive distillation and multieffect distillation which
includes vacuum distillation. Using extractive distillation with ethylene glycol as a solvent, we
can break the azeotrope making distillation feasible. We also consider multieffect distillation
which includes vacuum distillation columns. Using a vacuum, we can extend the azeotrope
between ethanol and water. Figure 2 shows the azeotrope extended at 0.1 atmospheres.
Figure 2-Extension of water-ethanol azeotrope at 0.1 atmospheres
7
5. Literature Review
We review the published literature on ethanol production and purification using (1).
multieffect distillation systems (MDS), and (2) extractive distillation systems (EDS). We
compare the reported results of energy and water consumption for each publication on ethanol
production. We identify the type of process model used (rigorous simulation or shortcut design),
the distillation model used to design and/or optimize the distillation system, the final reported
results and the wastewater treatment option. For the extractive distillation system, we also
identify the solvent used.
5.1 Process Modeling Simulator
The reported literatures use a number of process modeling simulators, including Aspen
Plus, Aspen HYSYS, and SuperPro Designer. These simulators have mixture property and phase
equilibrium data for a wide range of components. Aspen Plus simulator contains the NIST
ThermoData Engine (TDE) which provides access to experimental mixture property and phase
equilibrium data for over 23,000 component pairs6.
5.2 Distillation Model
Rigorous models carry out stage-by-stage mass and energy balances and thermodynamic
equilibrium calculations. They can accurately and consistently describe the steady state behavior
of a wide range of components at different conditions. Shortcut models, such as the Fenske-
Underwood-Gilliand (FUG) or the Winn-Underwood-Gilliand (WUG) methods7-9
can give quick
estimates of preliminary design parameters. Given the desired key component recoveries in both
distillate and bottom products, the shortcut models calculate the minimum number of ideal stages
required, the feed-stage location, the temperatures and heat duties of both the condenser and
reboiler, the minimum reflux ratio, and the number of ideal stages required at a given operating
reflux ratio. Considering the fact that short models are based on design correlations developed
over 50 years ago, we should validate the accuracy of the preliminary design parameters by
rigorous simulations, and make adjustments if necessary.
8
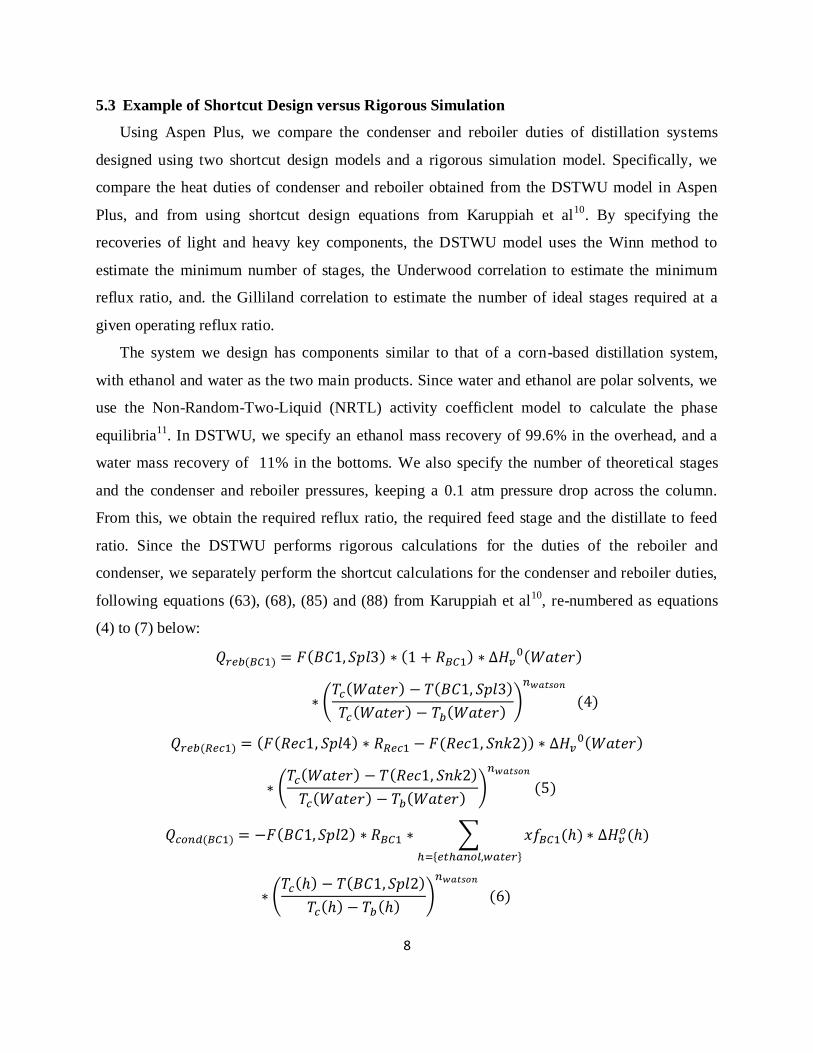
5.3 Example of Shortcut Design versus Rigorous Simulation
Using Aspen Plus, we compare the condenser and reboiler duties of distillation systems
designed using two shortcut design models and a rigorous simulation model. Specifically, we
compare the heat duties of condenser and reboiler obtained from the DSTWU model in Aspen
Plus, and from using shortcut design equations from Karuppiah et al10
. By specifying the
recoveries of light and heavy key components, the DSTWU model uses the Winn method to
estimate the minimum number of stages, the Underwood correlation to estimate the minimum
reflux ratio, and. the Gilliland correlation to estimate the number of ideal stages required at a
given operating reflux ratio.
The system we design has components similar to that of a corn-based distillation system,
with ethanol and water as the two main products. Since water and ethanol are polar solvents, we
use the Non-Random-Two-Liquid (NRTL) activity coefficlent model to calculate the phase
equilibria11
. In DSTWU, we specify an ethanol mass recovery of 99.6% in the overhead, and a
water mass recovery of 11% in the bottoms. We also specify the number of theoretical stages
and the condenser and reboiler pressures, keeping a 0.1 atm pressure drop across the column.
From this, we obtain the required reflux ratio, the required feed stage and the distillate to feed
ratio. Since the DSTWU performs rigorous calculations for the duties of the reboiler and
condenser, we separately perform the shortcut calculations for the condenser and reboiler duties,
following equations (63), (68), (85) and (88) from Karuppiah et al10
, re-numbered as equations
(4) to (7) below:
(
)
(
)
∑
{ }
(
)
9
∑
{ }
(
)
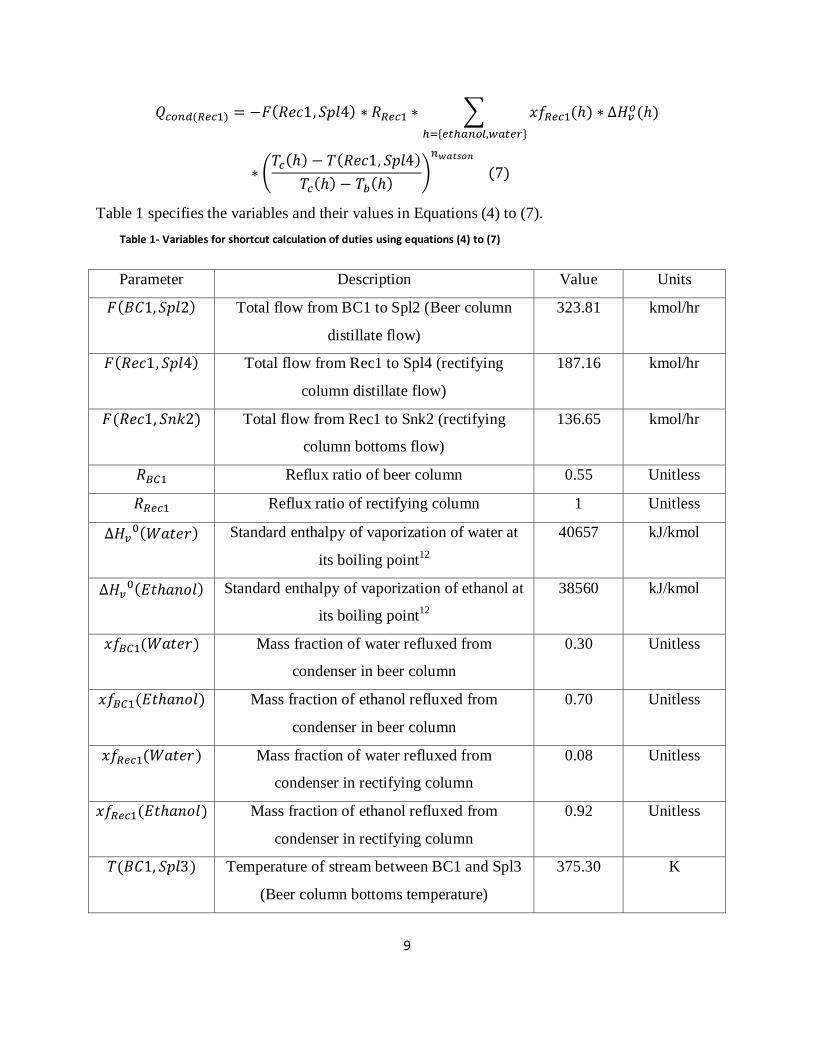
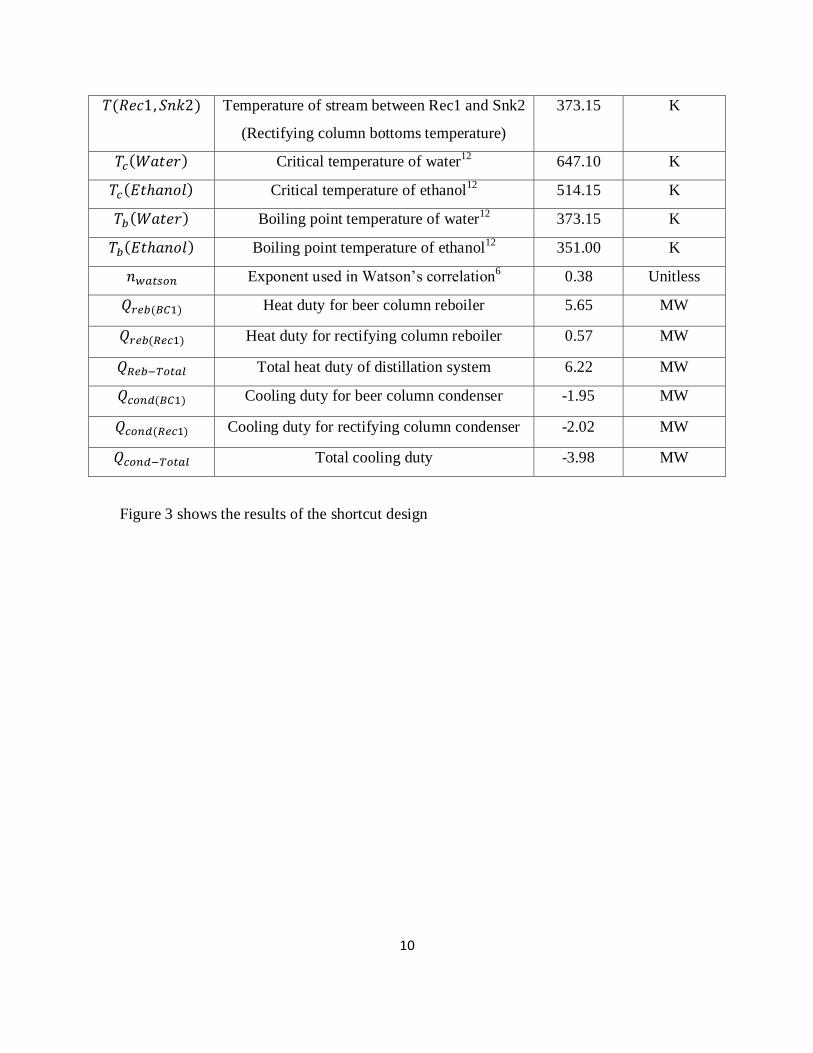
Table 1 specifies the variables and their values in Equations (4) to (7).
Table 1- Variables for shortcut calculation of duties using equations (4) to (7)
Parameter Description Value Units
Total flow from BC1 to Spl2 (Beer column
distillate flow)
323.81 kmol/hr
Total flow from Rec1 to Spl4 (rectifying
column distillate flow)
187.16 kmol/hr
Total flow from Rec1 to Snk2 (rectifying
column bottoms flow)
136.65 kmol/hr
Reflux ratio of beer column 0.55 Unitless
Reflux ratio of rectifying column 1 Unitless
Standard enthalpy of vaporization of water at
its boiling point12
40657
kJ/kmol
Standard enthalpy of vaporization of ethanol at
its boiling point12
38560 kJ/kmol
Mass fraction of water refluxed from
condenser in beer column
0.30 Unitless
Mass fraction of ethanol refluxed from
condenser in beer column
0.70 Unitless
Mass fraction of water refluxed from
condenser in rectifying column
0.08 Unitless
Mass fraction of ethanol refluxed from
condenser in rectifying column
0.92 Unitless
Temperature of stream between BC1 and Spl3
(Beer column bottoms temperature)
375.30 K
10
Temperature of stream between Rec1 and Snk2
(Rectifying column bottoms temperature)
373.15 K
Critical temperature of water12
647.10 K
Critical temperature of ethanol12
514.15 K
Boiling point temperature of water12
373.15 K
Boiling point temperature of ethanol12
351.00 K
Exponent used in Watson’s correlation6
0.38 Unitless
Heat duty for beer column reboiler 5.65 MW
Heat duty for rectifying column reboiler 0.57 MW
Total heat duty of distillation system 6.22 MW
Cooling duty for beer column condenser -1.95 MW
Cooling duty for rectifying column condenser -2.02 MW
Total cooling duty -3.98 MW
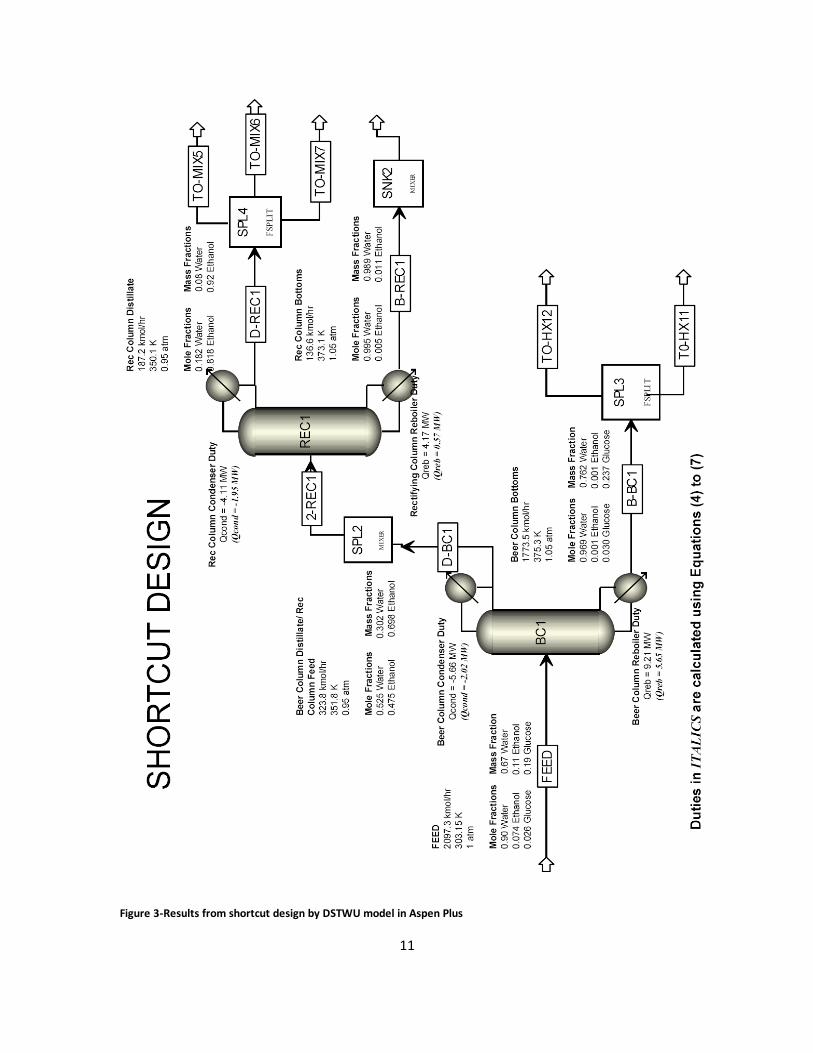
Figure 3 shows the results of the shortcut design
11
Figure 3-Results from shortcut design by DSTWU model in Aspen Plus
12
We use the results from the shortcut design to set the specifications for the rigorous
simulation, still keeping a 0.1 atm pressure drop across the column. We set the mass recovery of
both columns to 99.6% ethanol, same as the shortcut design. We also set the mass purity to the
purity obtained by the shortcut design (92.01 weight % ethanol). Figure 4 shows the flowsheet
for the rigorous simulation
13
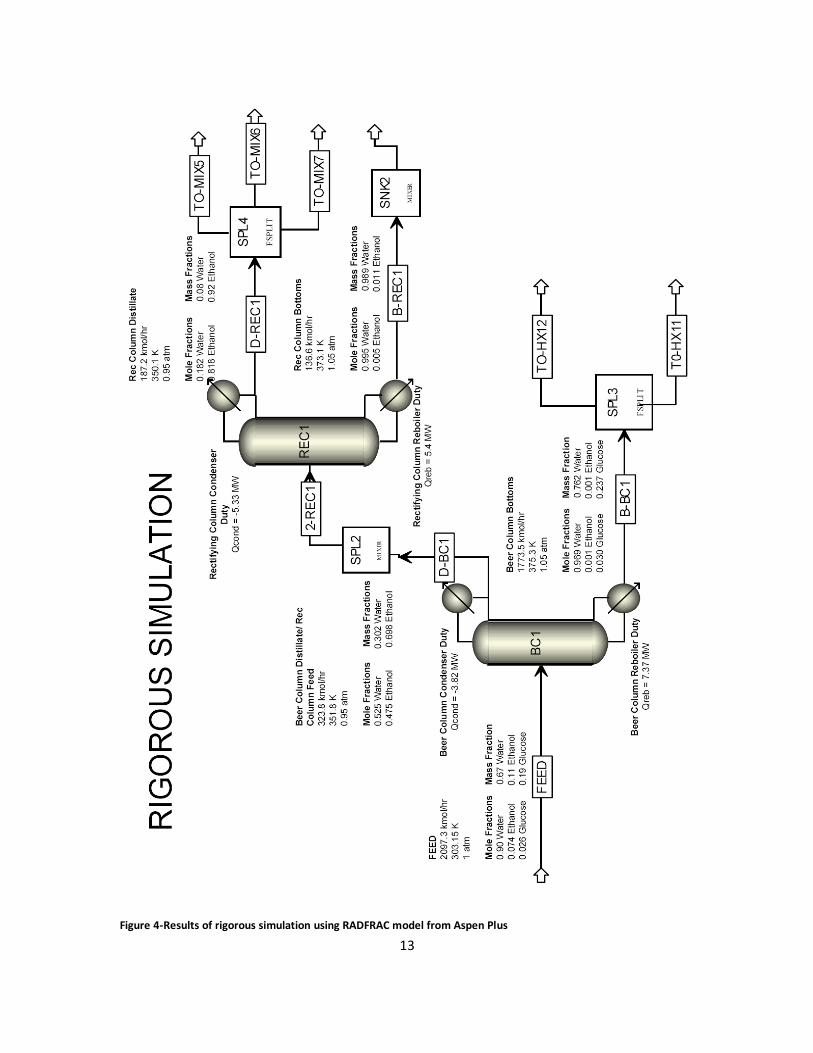
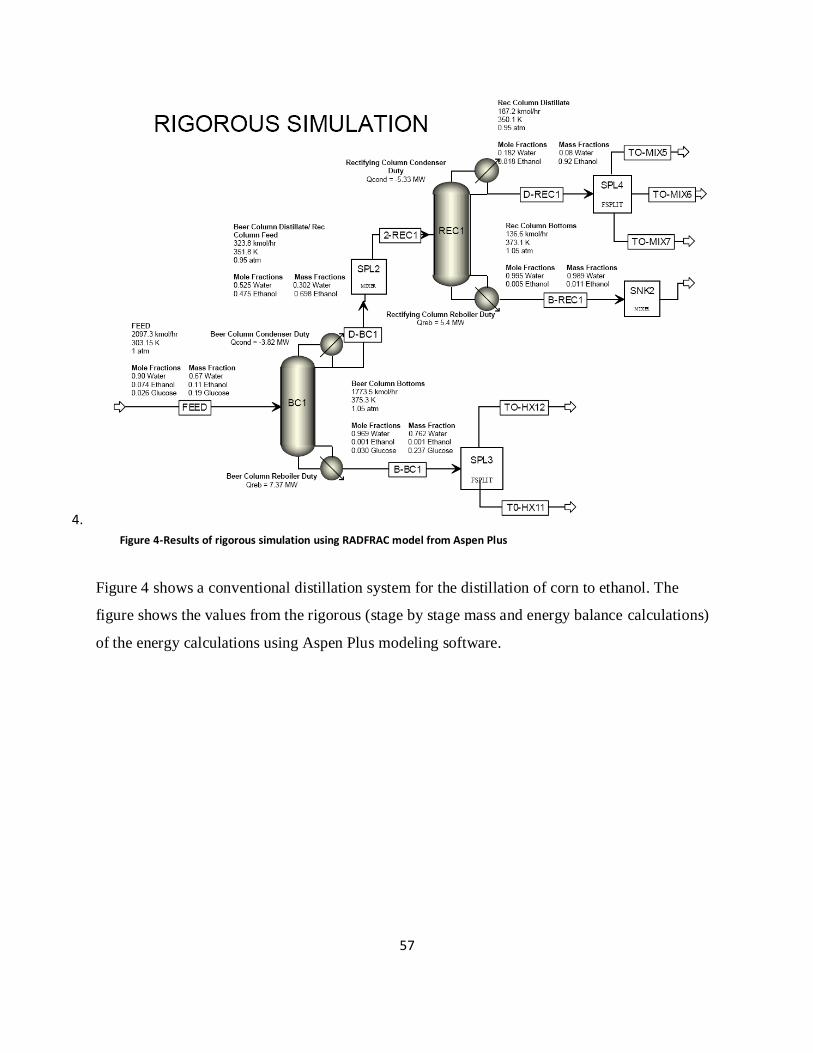
Figure 4-Results of rigorous simulation using RADFRAC model from Aspen Plus
14
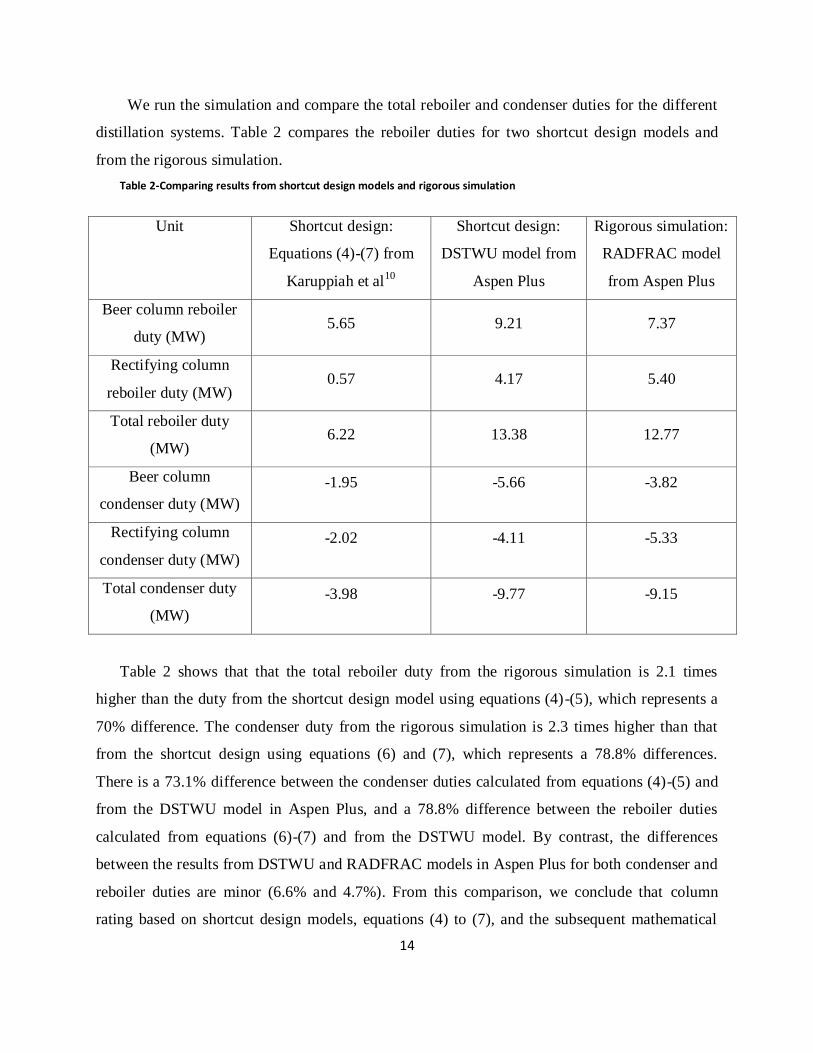
We run the simulation and compare the total reboiler and condenser duties for the different
distillation systems. Table 2 compares the reboiler duties for two shortcut design models and
from the rigorous simulation.
Table 2-Comparing results from shortcut design models and rigorous simulation
Unit Shortcut design:
Equations (4)-(7) from
Karuppiah et al10
Shortcut design:
DSTWU model from
Aspen Plus
Rigorous simulation:
RADFRAC model
from Aspen Plus
Beer column reboiler
duty (MW) 5.65 9.21 7.37
Rectifying column
reboiler duty (MW) 0.57 4.17 5.40
Total reboiler duty
(MW) 6.22 13.38 12.77
Beer column
condenser duty (MW)
-1.95 -5.66 -3.82
Rectifying column
condenser duty (MW)
-2.02 -4.11 -5.33
Total condenser duty
(MW)
-3.98 -9.77 -9.15
Table 2 shows that that the total reboiler duty from the rigorous simulation is 2.1 times
higher than the duty from the shortcut design model using equations (4)-(5), which represents a
70% difference. The condenser duty from the rigorous simulation is 2.3 times higher than that
from the shortcut design using equations (6) and (7), which represents a 78.8% differences.
There is a 73.1% difference between the condenser duties calculated from equations (4)-(5) and
from the DSTWU model in Aspen Plus, and a 78.8% difference between the reboiler duties
calculated from equations (6)-(7) and from the DSTWU model. By contrast, the differences
between the results from DSTWU and RADFRAC models in Aspen Plus for both condenser and
reboiler duties are minor (6.6% and 4.7%). From this comparison, we conclude that column
rating based on shortcut design models, equations (4) to (7), and the subsequent mathematical
15
optimization based on non-rigorous condenser and reboiler duty calculations tend to
underestimate the true energy consumption.
5.4 Final Calculated and Reported Results
We identify the key results reported: energy and water consumptions and economic analysis.
The most important change needed in the ethanol industry today is the optimization of energy
and water consumption its production. Making ethanol a more competitive fuel requires practical
and rigorous reductions in process manufacturing. Reporting a reduction in the energy and water
consumption in ethanol production is one of the key factors in determining the worth of a
particular design. In this work, the most efficient design we choose is the one with the lower
energy and/or water consumption which resulted in lower total annual costs.
5.5 Wastewater Treatment Option
The last criterion we consider in the literature review is the option of wastewater treatment.
Including a wastewater treatment option is necessary when optimizing the water consumption in
ethanol production and purification. In this work, we consider water treatment and reuse to
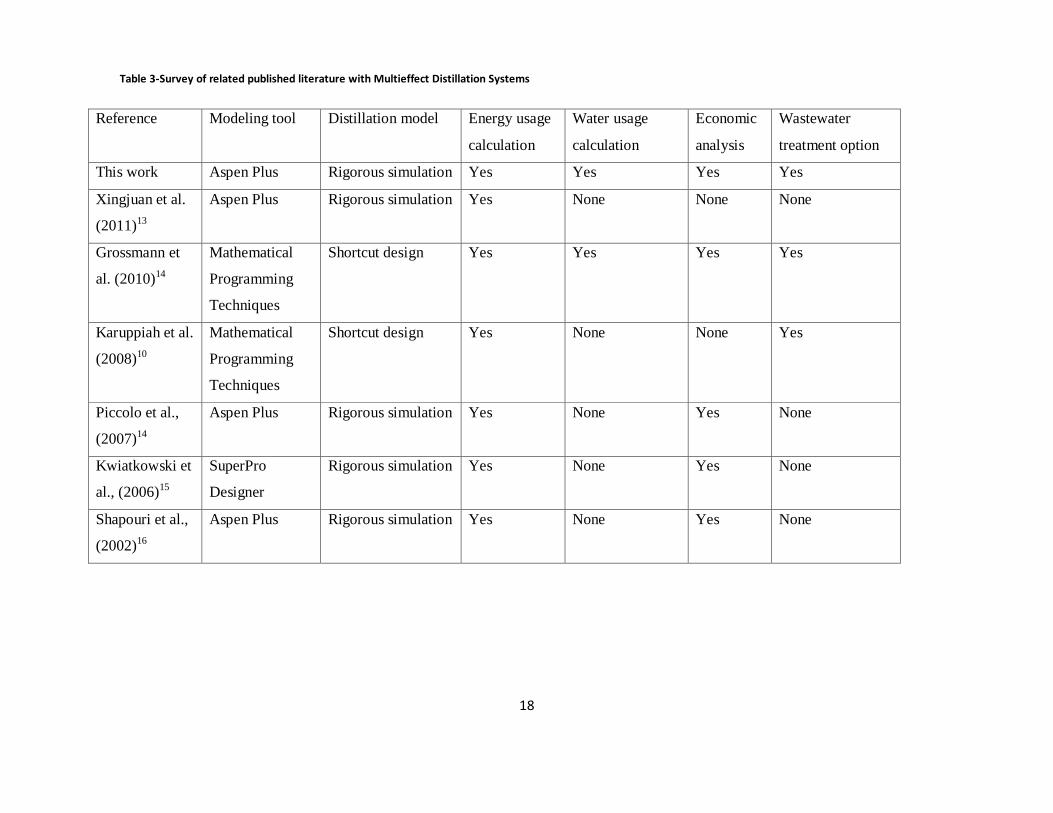
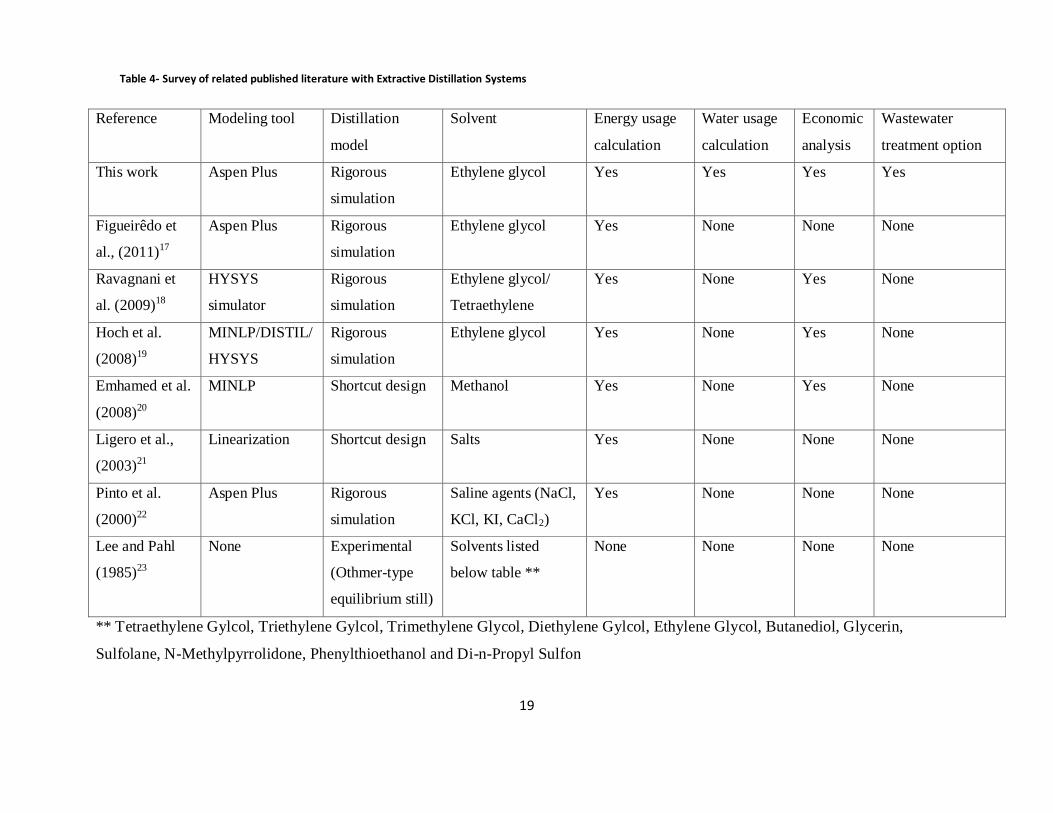
reduce the overall water consumption. Tables 3 and 4 compare the published literature and our
work based on the preceding considerations.

16
6. Design Alternatives
We model both our processes in ASPEN Plus with the help of a simulation file developed by
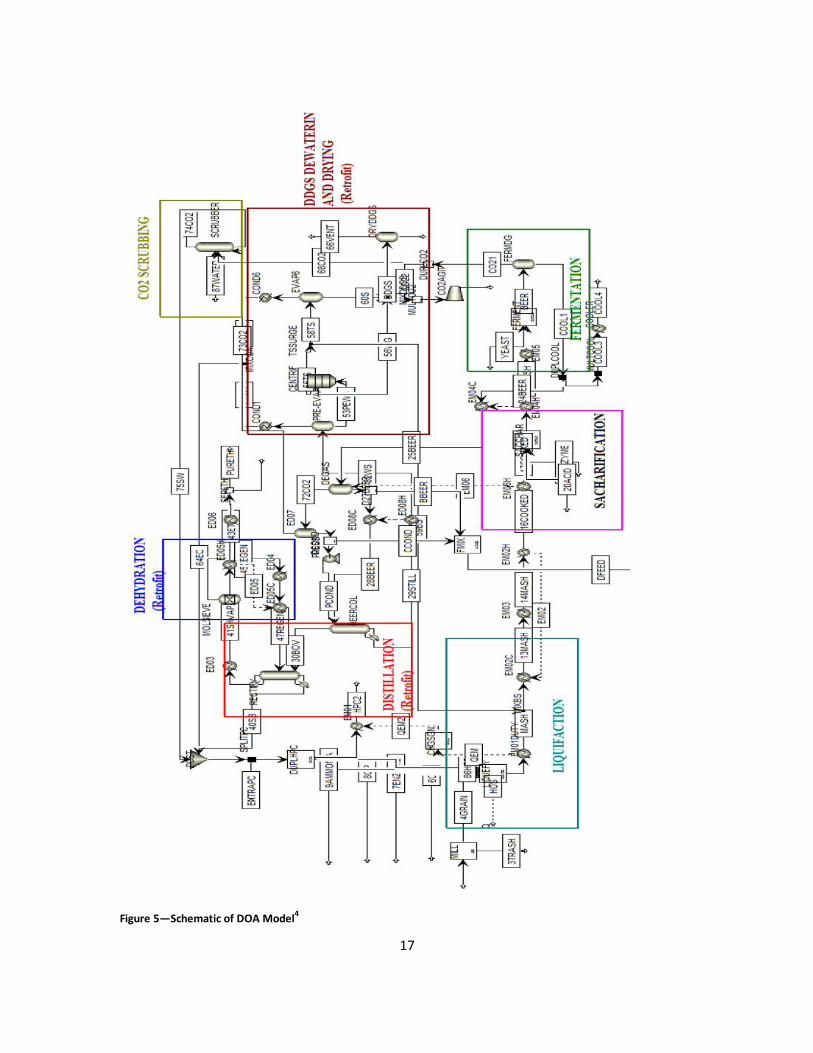
the Department of Agriculture (DOA), which we show in Figure 54. As described above the pre-
distillation section is the same for the two distillation design alternatives. Since the distillation
process is the most energy-intensive process in the corn-to-ethanol process, we focus more on
optimizing this step which would greatly reduce the energy and water consumptions for the
entire process.
17
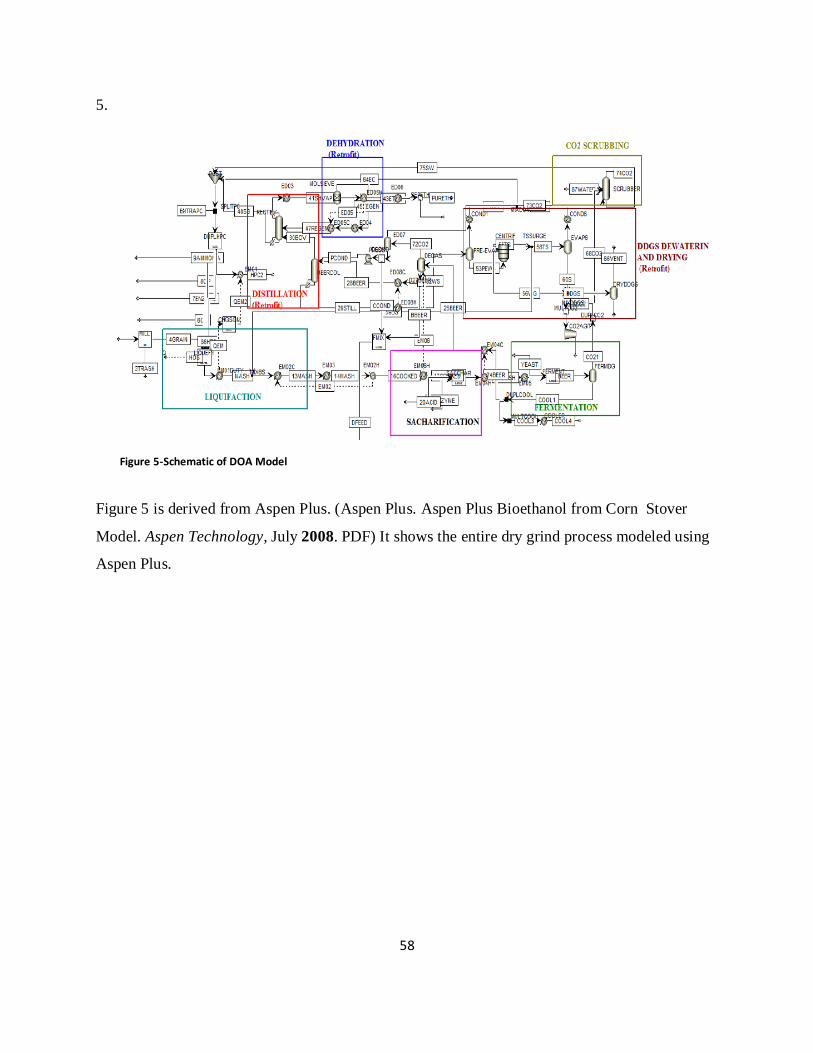
Figure 5—Schematic of DOA Model4
18
Table 3-Survey of related published literature with Multieffect Distillation Systems
Reference Modeling tool Distillation model Energy usage
calculation
Water usage
calculation
Economic
analysis
Wastewater
treatment option
This work Aspen Plus Rigorous simulation Yes Yes Yes Yes
Xingjuan et al.
(2011)13
Aspen Plus Rigorous simulation Yes None None None
Grossmann et
al. (2010)14
Mathematical
Programming
Techniques
Shortcut design Yes Yes Yes Yes
Karuppiah et al.
(2008)10
Mathematical
Programming
Techniques
Shortcut design Yes None None Yes
Piccolo et al.,
(2007)14
Aspen Plus Rigorous simulation Yes None Yes None
Kwiatkowski et
al., (2006)15
SuperPro
Designer
Rigorous simulation Yes None Yes None
Shapouri et al.,
(2002)16
Aspen Plus Rigorous simulation Yes None Yes None
19
Table 4- Survey of related published literature with Extractive Distillation Systems
Reference
Modeling tool Distillation
model
Solvent Energy usage
calculation
Water usage
calculation
Economic
analysis
Wastewater
treatment option
This work Aspen Plus Rigorous
simulation
Ethylene glycol Yes Yes Yes Yes
Figueirêdo et
al., (2011)17
Aspen Plus Rigorous
simulation
Ethylene glycol Yes None None None
Ravagnani et
al. (2009)18
HYSYS
simulator
Rigorous
simulation
Ethylene glycol/
Tetraethylene
Yes None Yes None
Hoch et al.
(2008)19
MINLP/DISTIL/
HYSYS
Rigorous
simulation
Ethylene glycol Yes None Yes None
Emhamed et al.
(2008)20
MINLP Shortcut design Methanol Yes None Yes None
Ligero et al.,
(2003)21
Linearization Shortcut design Salts Yes None None None
Pinto et al.
(2000)22
Aspen Plus Rigorous
simulation
Saline agents (NaCl,
KCl, KI, CaCl2)
Yes None None None
Lee and Pahl
(1985)23
None Experimental
(Othmer-type
equilibrium still)
Solvents listed
below table **
None None None None
** Tetraethylene Gylcol, Triethylene Gylcol, Trimethylene Glycol, Diethylene Gylcol, Ethylene Glycol, Butanediol, Glycerin,
Sulfolane, N-Methylpyrrolidone, Phenylthioethanol and Di-n-Propyl Sulfon
20
6.1 The Multieffect Distillation System (MDS)
Our MDS has two integrated beer columns and two integrated rectifying columns. We
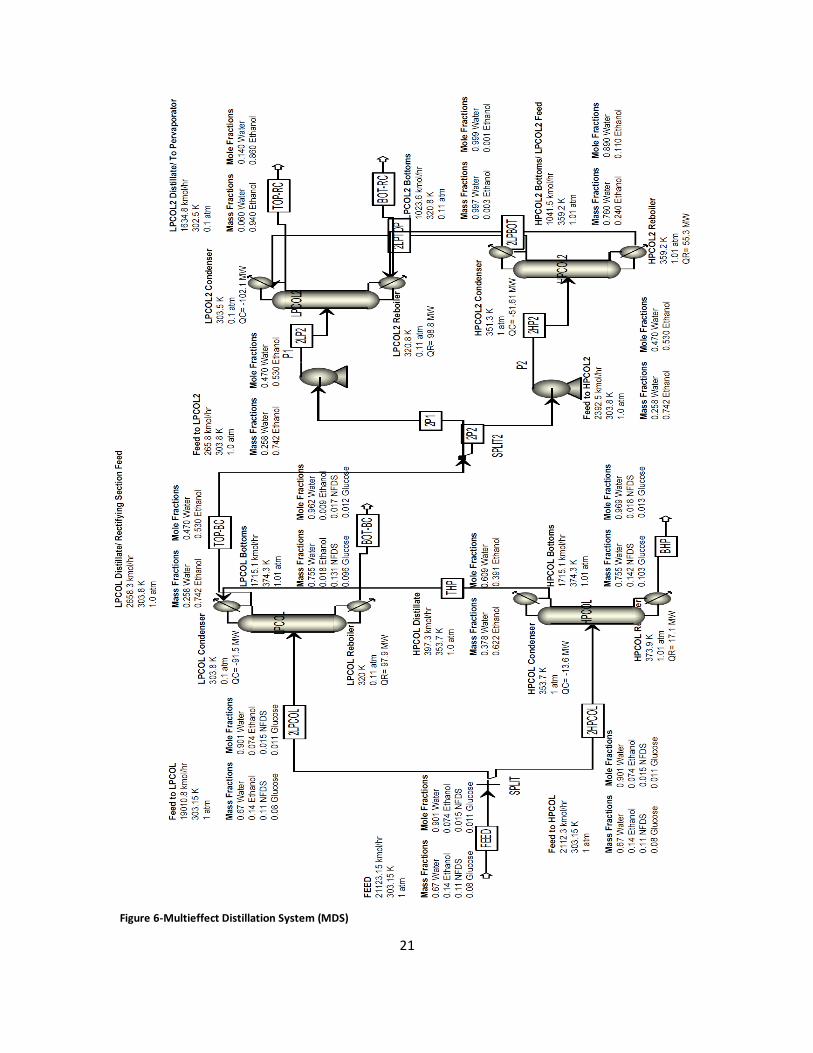
simulate and optimize each set of columns separately. Figure 6 shows a detailed schematic for
the entire system.
6.1.1 Beer Section
For the beer section, we have 6 manipulated variables for each column (mass distillate to
feed ratio, molar reflux ratio, number of feed stages, feed stage, pressure, and the split fraction).
We vary these manipulated variables to achieve the highest mass recovery at 99.9%. We
investigate many different combinations of manipulated variables and the effect of the operating
pressures and reflux ratio on the reboiler duty of beer column. For the purpose of heat
integration, we operate the columns at different pressures.
We set the high-pressure (HP) column to atmospheric pressure, and vary the pressure of the
low-pressure (LP) column for the optimum balance among the pressure, mass purity, and
reboiler duty. Since there is a cost to inducing a vacuum, we investigate the effect of operating
pressure on the condenser and reboiler duties for the columns. We choose the combination that
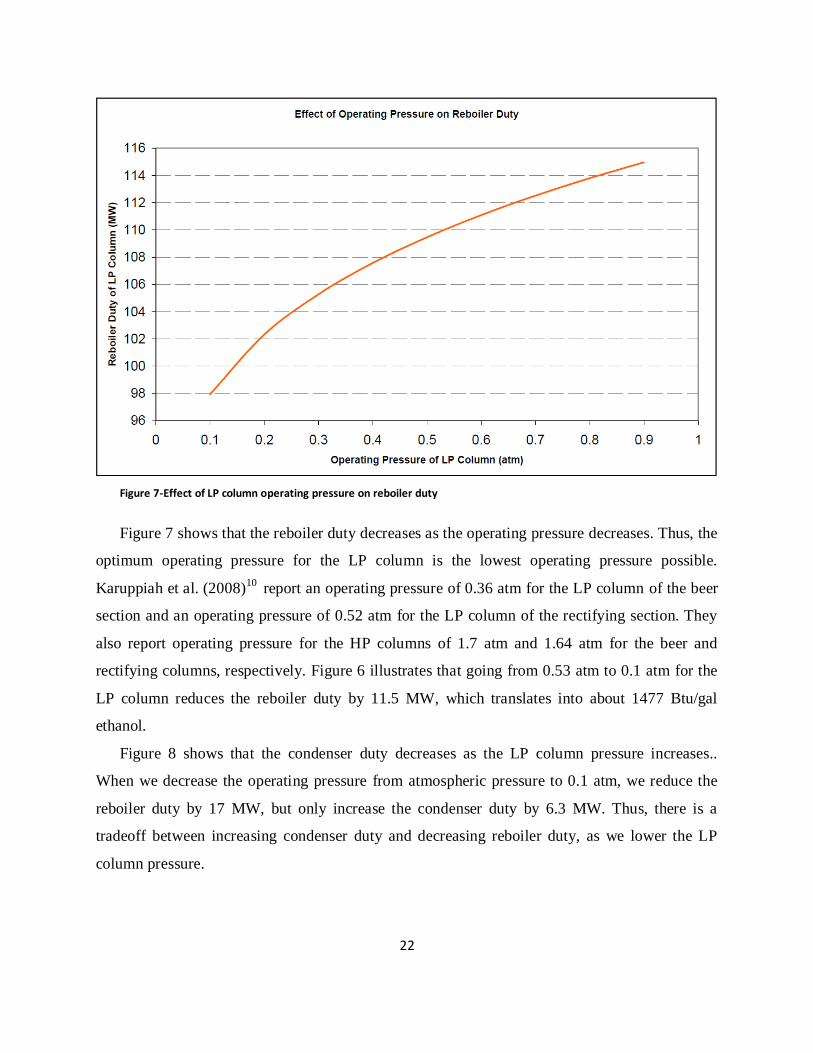
gives the maximum reduction of the reboiler duty after heat integration. Figure 7 shows the
relationship between the reboiler duty and the operating pressure of the LP column at the
maximum attained purity (94 mass% ethanol).
21
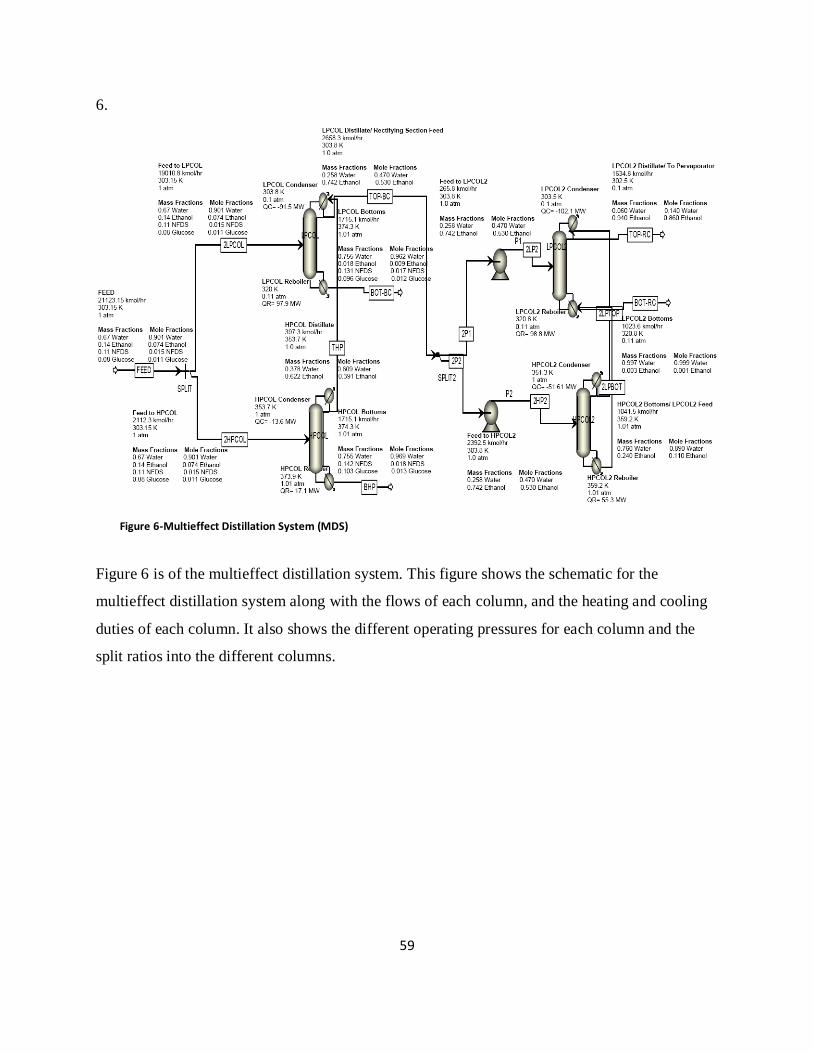
Figure 6-Multieffect Distillation System (MDS)
22
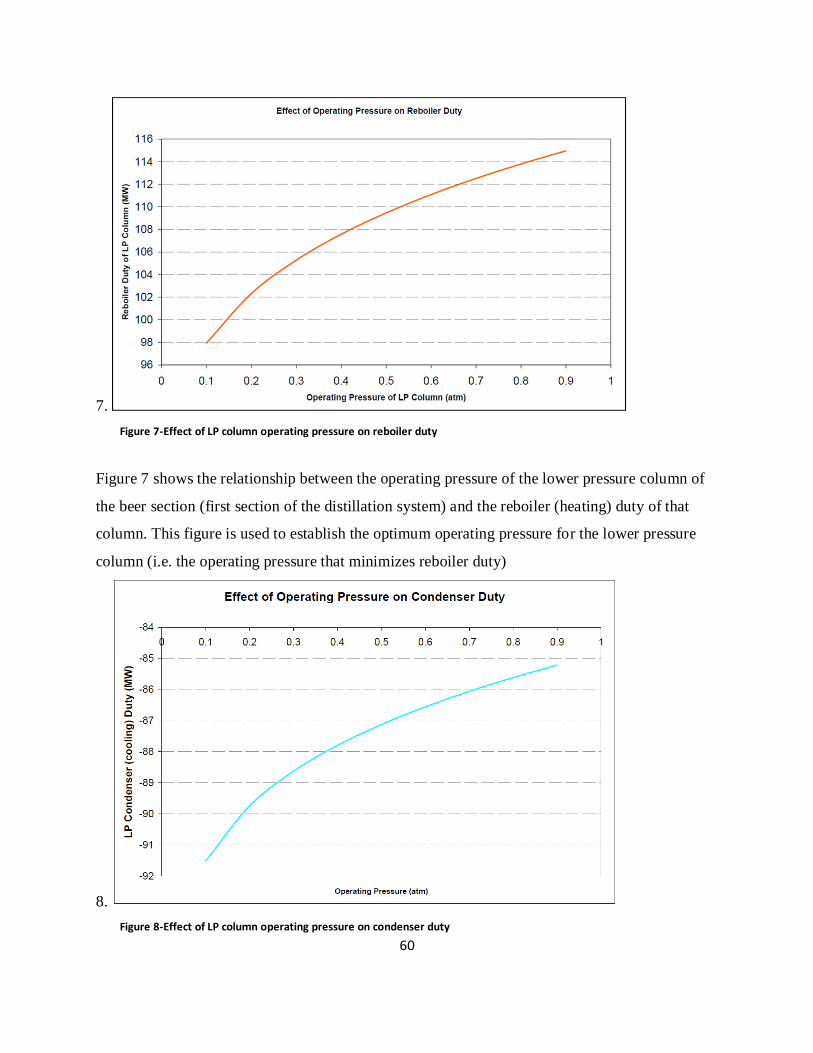
Figure 7-Effect of LP column operating pressure on reboiler duty
Figure 7 shows that the reboiler duty decreases as the operating pressure decreases. Thus, the
optimum operating pressure for the LP column is the lowest operating pressure possible.
Karuppiah et al. (2008)10
report an operating pressure of 0.36 atm for the LP column of the beer
section and an operating pressure of 0.52 atm for the LP column of the rectifying section. They
also report operating pressure for the HP columns of 1.7 atm and 1.64 atm for the beer and
rectifying columns, respectively. Figure 6 illustrates that going from 0.53 atm to 0.1 atm for the
LP column reduces the reboiler duty by 11.5 MW, which translates into about 1477 Btu/gal
ethanol.
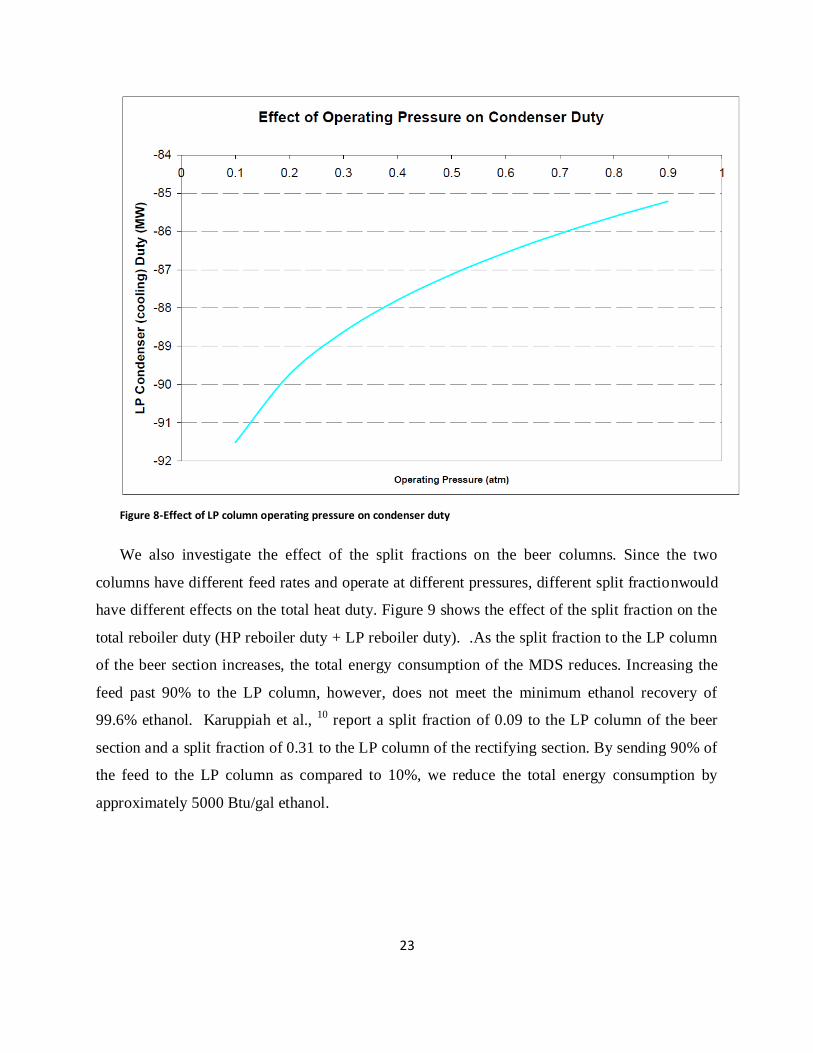
Figure 8 shows that the condenser duty decreases as the LP column pressure increases..
When we decrease the operating pressure from atmospheric pressure to 0.1 atm, we reduce the
reboiler duty by 17 MW, but only increase the condenser duty by 6.3 MW. Thus, there is a
tradeoff between increasing condenser duty and decreasing reboiler duty, as we lower the LP
column pressure.
23
Figure 8-Effect of LP column operating pressure on condenser duty
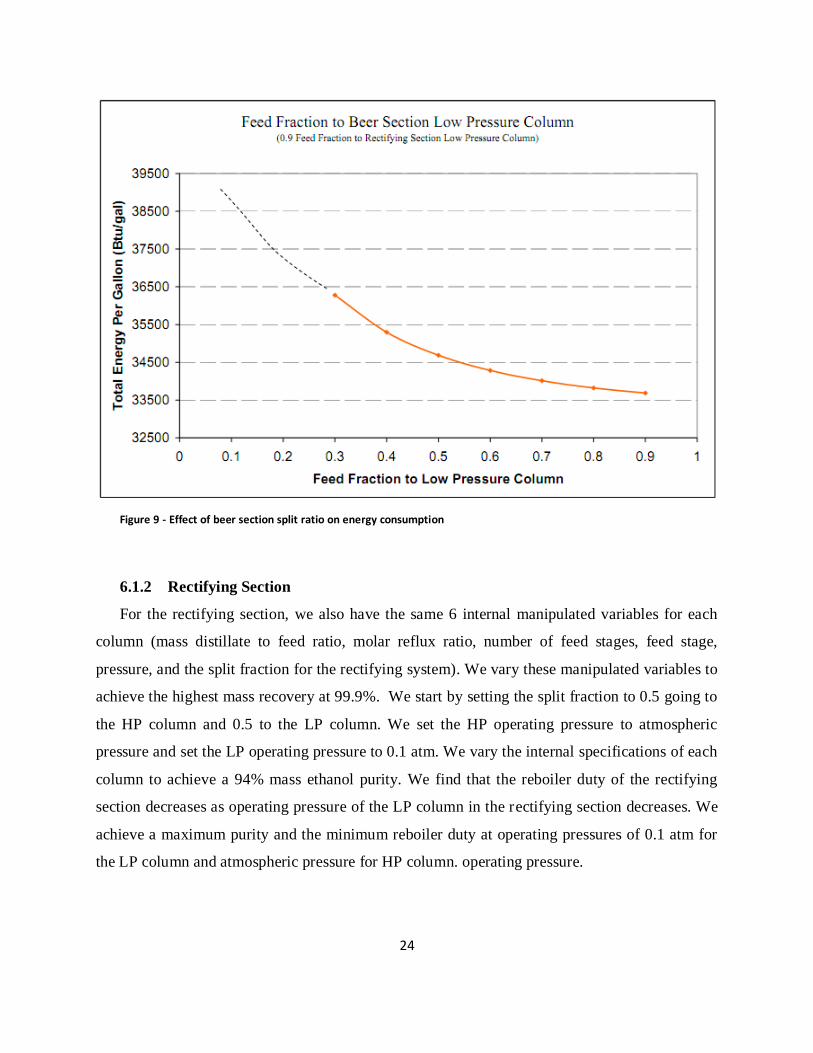
We also investigate the effect of the split fractions on the beer columns. Since the two
columns have different feed rates and operate at different pressures, different split fractionwould
have different effects on the total heat duty. Figure 9 shows the effect of the split fraction on the
total reboiler duty (HP reboiler duty + LP reboiler duty). .As the split fraction to the LP column
of the beer section increases, the total energy consumption of the MDS reduces. Increasing the
feed past 90% to the LP column, however, does not meet the minimum ethanol recovery of
99.6% ethanol. Karuppiah et al., 10
report a split fraction of 0.09 to the LP column of the beer
section and a split fraction of 0.31 to the LP column of the rectifying section. By sending 90% of
the feed to the LP column as compared to 10%, we reduce the total energy consumption by
approximately 5000 Btu/gal ethanol.
24
Figure 9 - Effect of beer section split ratio on energy consumption
6.1.2 Rectifying Section
For the rectifying section, we also have the same 6 internal manipulated variables for each
column (mass distillate to feed ratio, molar reflux ratio, number of feed stages, feed stage,
pressure, and the split fraction for the rectifying system). We vary these manipulated variables to
achieve the highest mass recovery at 99.9%. We start by setting the split fraction to 0.5 going to
the HP column and 0.5 to the LP column. We set the HP operating pressure to atmospheric
pressure and set the LP operating pressure to 0.1 atm. We vary the internal specifications of each
column to achieve a 94% mass ethanol purity. We find that the reboiler duty of the rectifying
section decreases as operating pressure of the LP column in the rectifying section decreases. We
achieve a maximum purity and the minimum reboiler duty at operating pressures of 0.1 atm for
the LP column and atmospheric pressure for HP column. operating pressure.
25
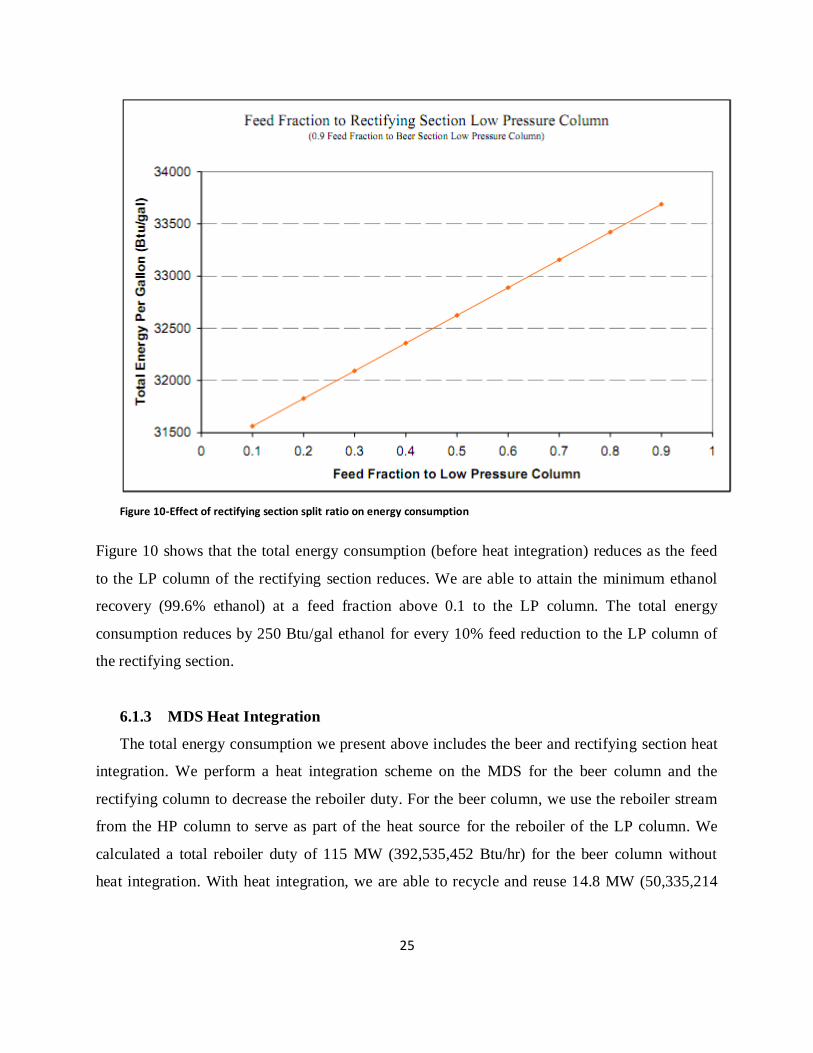
Figure 10-Effect of rectifying section split ratio on energy consumption
Figure 10 shows that the total energy consumption (before heat integration) reduces as the feed
to the LP column of the rectifying section reduces. We are able to attain the minimum ethanol
recovery (99.6% ethanol) at a feed fraction above 0.1 to the LP column. The total energy
consumption reduces by 250 Btu/gal ethanol for every 10% feed reduction to the LP column of
the rectifying section.
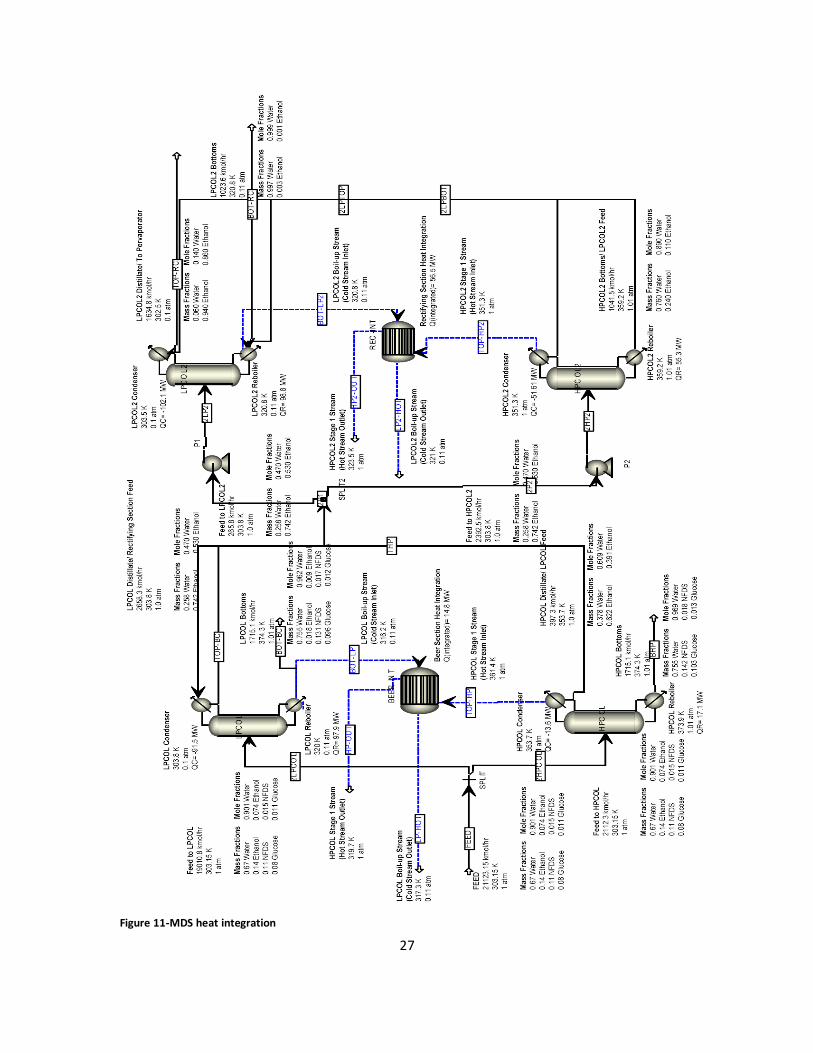
6.1.3 MDS Heat Integration
The total energy consumption we present above includes the beer and rectifying section heat
integration. We perform a heat integration scheme on the MDS for the beer column and the
rectifying column to decrease the reboiler duty. For the beer column, we use the reboiler stream
from the HP column to serve as part of the heat source for the reboiler of the LP column. We
calculated a total reboiler duty of 115 MW (392,535,452 Btu/hr) for the beer column without
heat integration. With heat integration, we are able to recycle and reuse 14.8 MW (50,335,214
26
Btu/hr) of the heat, which is 12.8 % of the reboiler duty of the beer section. This reduction
translates to a total energy usage reduction of 2112 Btu/gal ethanol.
We also perform heat integration for the rectifying section. Like the beer section, we use the
HP column reboiler stream as a heat source for the LP column reboiler. With heat integration, we
reduce the total heat duty of the beer section from 154 MW (525,893,545 Btu/hr) to 98 MW
(333,192,157 Btu/hr), which represents a 36.7% reduction or 8085 Btu/gal ethanol. Overall, heat
integration reduces the total heat duty of the MDS by 40.3%, or 10197 Btu/gal ethanol. Figure 11
shows the heat integration schemes, with dashed lines representing the hot and cold stream for
integration.
27
Figure 11-MDS heat integration
28
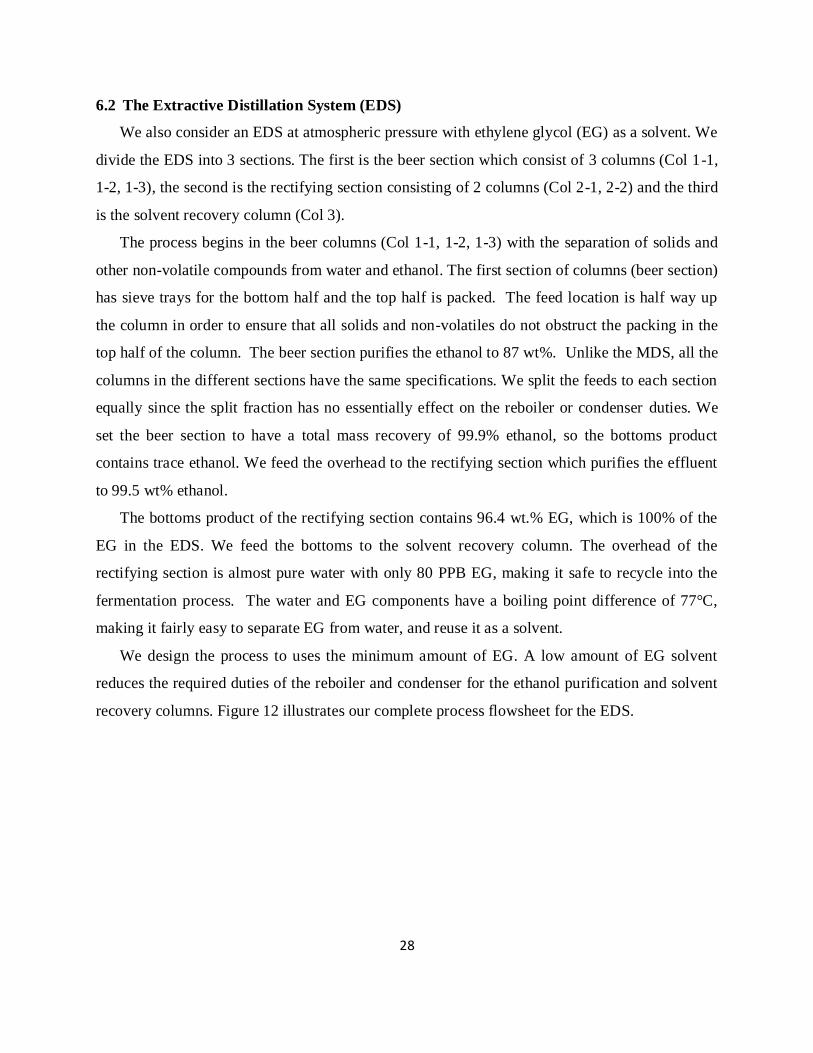
6.2 The Extractive Distillation System (EDS)
We also consider an EDS at atmospheric pressure with ethylene glycol (EG) as a solvent. We
divide the EDS into 3 sections. The first is the beer section which consist of 3 columns (Col 1-1,
1-2, 1-3), the second is the rectifying section consisting of 2 columns (Col 2-1, 2-2) and the third
is the solvent recovery column (Col 3).
The process begins in the beer columns (Col 1-1, 1-2, 1-3) with the separation of solids and
other non-volatile compounds from water and ethanol. The first section of columns (beer section)
has sieve trays for the bottom half and the top half is packed. The feed location is half way up
the column in order to ensure that all solids and non-volatiles do not obstruct the packing in the
top half of the column. The beer section purifies the ethanol to 87 wt%. Unlike the MDS, all the
columns in the different sections have the same specifications. We split the feeds to each section
equally since the split fraction has no essentially effect on the reboiler or condenser duties. We
set the beer section to have a total mass recovery of 99.9% ethanol, so the bottoms product
contains trace ethanol. We feed the overhead to the rectifying section which purifies the effluent
to 99.5 wt% ethanol.
The bottoms product of the rectifying section contains 96.4 wt.% EG, which is 100% of the
EG in the EDS. We feed the bottoms to the solvent recovery column. The overhead of the
rectifying section is almost pure water with only 80 PPB EG, making it safe to recycle into the
fermentation process. The water and EG components have a boiling point difference of 77°C,
making it fairly easy to separate EG from water, and reuse it as a solvent.
We design the process to uses the minimum amount of EG. A low amount of EG solvent
reduces the required duties of the reboiler and condenser for the ethanol purification and solvent
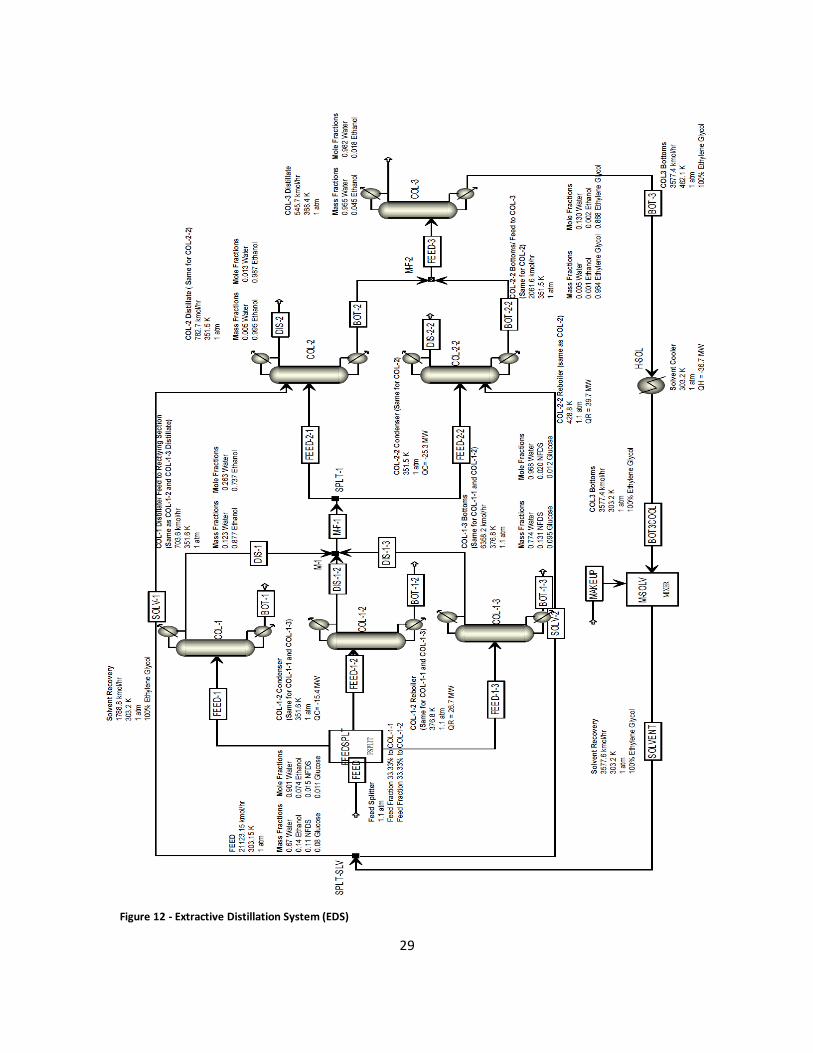
recovery columns. Figure 12 illustrates our complete process flowsheet for the EDS.
29
Figure 12 - Extractive Distillation System (EDS)
30
6.3 The Post-distillation Section
We use the same post-distillation section for both design alternatives. We model a
centrifuge using a stream splitter, and follow the specifications from the DOA model. A design
specification modifies the split fractions in the centrifuge block, and the resulting thin-stillage
stream contains 53% moisture. Another split block, with a split fraction of 0.268, recycles thin
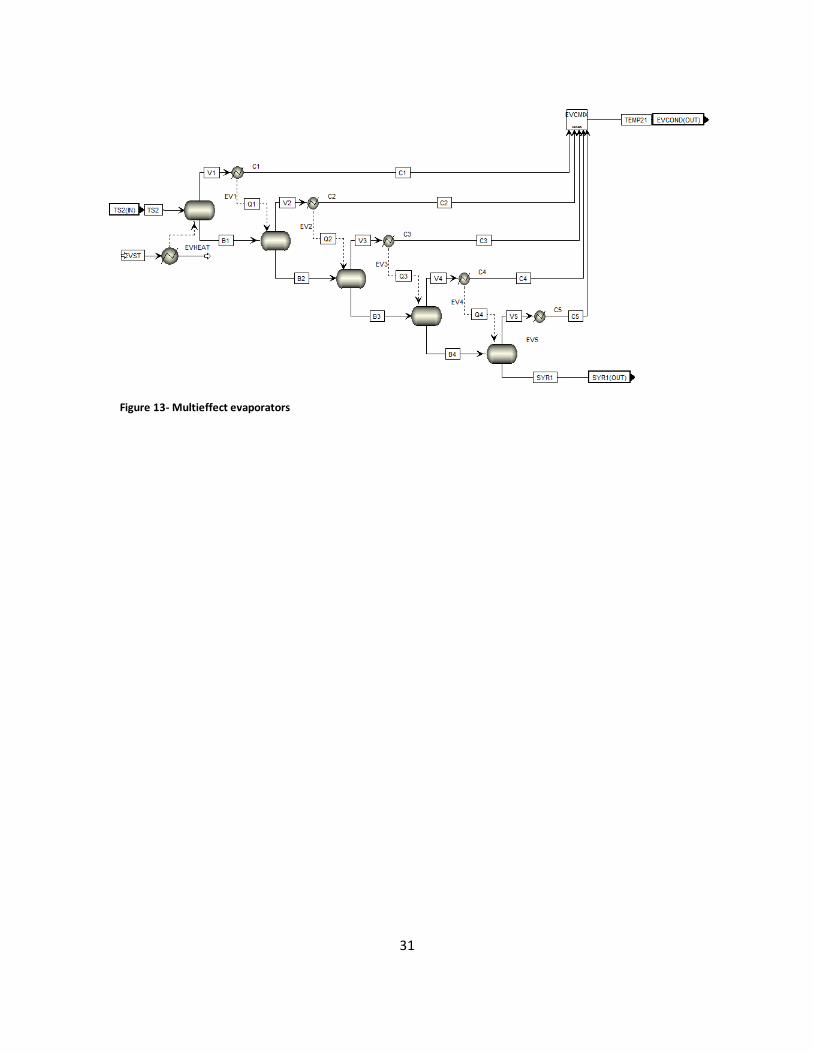
stillage back to the liquefaction stage. The multieffect evaporator is nested within a hierarchy
block (Figure 13). It consists of 5 effects, each 5 degrees Celsius lower than the previous effect.
A steam heater provides the heat for the first effect. The vapor product passes through a
condenser, which also acts as a pressure manipulator to prevent a temperature crossover, and the
resulting heat duty dictates the duty of the next effect. This simulates the vapor product from one
effect condensing as it heats the second effect, and so on.
A design specification varies the flow rate of the steam feed to the first effect, ensuring that
the final condensate consists of 45% moisture. The condensate streams represent recycle streams,
and provide water for the next fermentation. The syrup stream feeds into an atmospheric flash
drum, which is the model for the dryer. A design specification varies the dryer heat-duty until the
DDGS contains 7.2% moisture. In the case of the MDS system, the top product enters a
pervaporator, which we model using a standard separation block, and the resulting product
stream is pure ethanol. Since the water leaving the pervaporator is a vapor, we condense it before
recycle.
31
Figure 13- Multieffect evaporators
32
7. Comparing Design Alternatives
7.1 Comparing Heat Duties
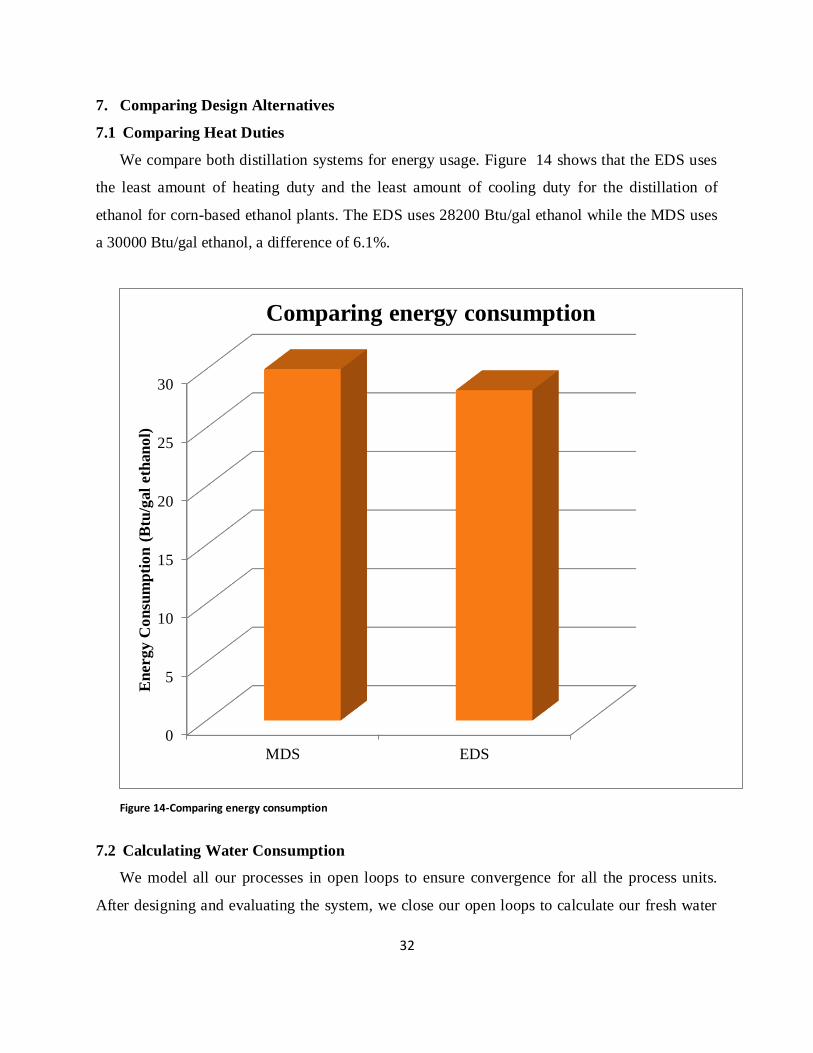
We compare both distillation systems for energy usage. Figure 14 shows that the EDS uses
the least amount of heating duty and the least amount of cooling duty for the distillation of
ethanol for corn-based ethanol plants. The EDS uses 28200 Btu/gal ethanol while the MDS uses
a 30000 Btu/gal ethanol, a difference of 6.1%.
Figure 14-Comparing energy consumption
7.2 Calculating Water Consumption
We model all our processes in open loops to ensure convergence for all the process units.
After designing and evaluating the system, we close our open loops to calculate our fresh water
0
5
10
15
20
25
30
MDS EDS
En
erg
y C
on
sum
pti
on
(B
tu/g
al
eth
an
ol)
Comparing energy consumption
33
consumption and energy consumption. We assume minimal losses due to boiler leaks, and
determine the fraction of steam lost due to leaks to be 1/99.
To calculate the fresh makeup water needed for the whole system, we calculate water lost by
drift, evaporation loss, and blow-down. To do this, we assume 6 cycles of concentration30
. We
define the cycles of concentration (COC) as the ratio of the concentration of dissolved salts in the
blow-down to the concentration of dissolved salts in the makeup water24
which we show in
Equation (8):
(Mann and Liu, 1999)
24 (8)
The evaporation loss in the cooling tower is the amount of cooling water lost due to
evaporation. Water lost by drift is the water carried off by wind from evaporation or splashes.
Drift loss depends on wind speed and it usually varies between 0.1 and 0.2 percent of the water
supplied to the tower. Although there are many new technologies that can reduce drift loss to
about 0.1 percent of water supplied to the tower, in calculations we use 0.2 percent. The blow-
down (boiler and cooling tower) is the water which contains dissolved solids that must be
removed from the cooling tower and/or the boiler, in order to avoid contaminant buildup in the
cooling tower and/or boiler water 25
. For industrial practice, depending on the cycles of
concentration, there is a maximum allowable amount of total dissolved solids (TDS). Blow-down
helps keep the TDS at a minimum. Removing blow-down and adding fresh makeup water slows
down mineral scale building, giving the cooling tower or boiler a longer life-time26
.
We use Equations (9) to (12) to determine the evaporation and wind drift from the cooling
tower, and the blow-down rate from the cooling tower and the boiler.
27
(9)
27 (10)
(11)
34
(12)
Since the required makeup should be at least equal to the sum of the water lost (evaporation
loss, drift loss and blow down) we use Equation (13) to calculate the minimum required makeup
water;
(13)
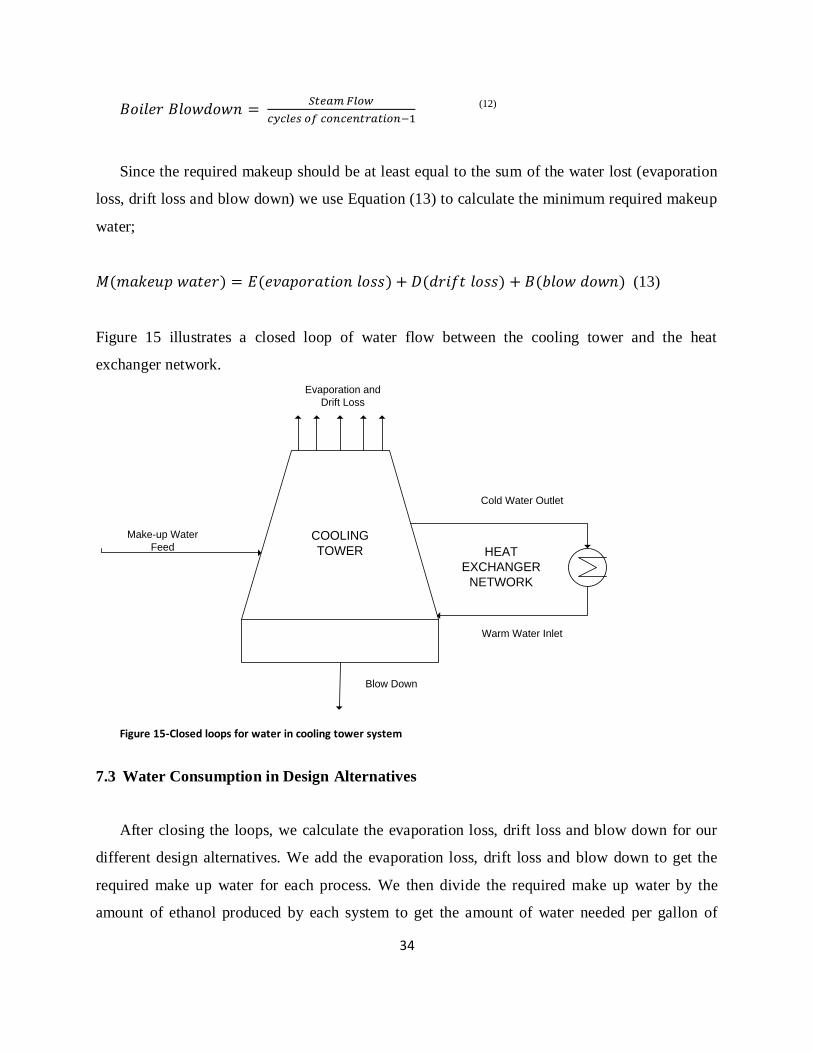
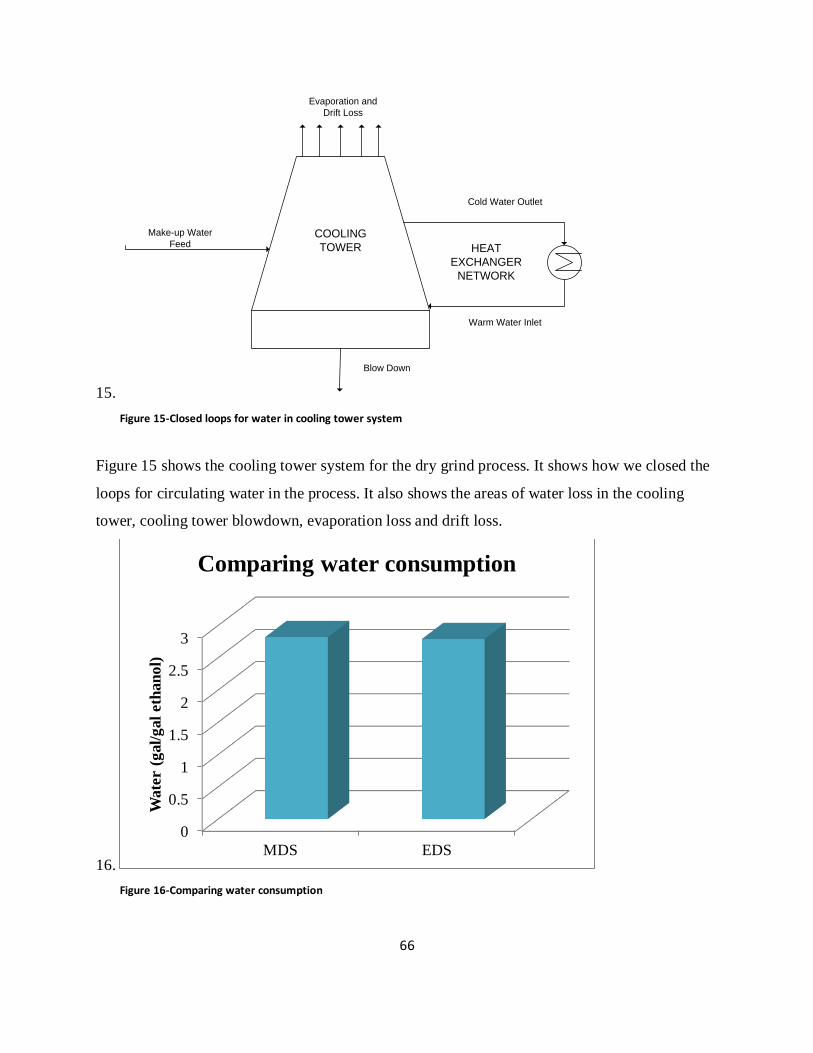
Figure 15 illustrates a closed loop of water flow between the cooling tower and the heat
exchanger network.
COOLING
TOWER HEAT
EXCHANGER
NETWORK
Make-up Water
Feed
Blow Down
Evaporation and
Drift Loss
Cold Water Outlet
Warm Water Inlet
Figure 15-Closed loops for water in cooling tower system
7.3 Water Consumption in Design Alternatives
After closing the loops, we calculate the evaporation loss, drift loss and blow down for our
different design alternatives. We add the evaporation loss, drift loss and blow down to get the
required make up water for each process. We then divide the required make up water by the
amount of ethanol produced by each system to get the amount of water needed per gallon of
35
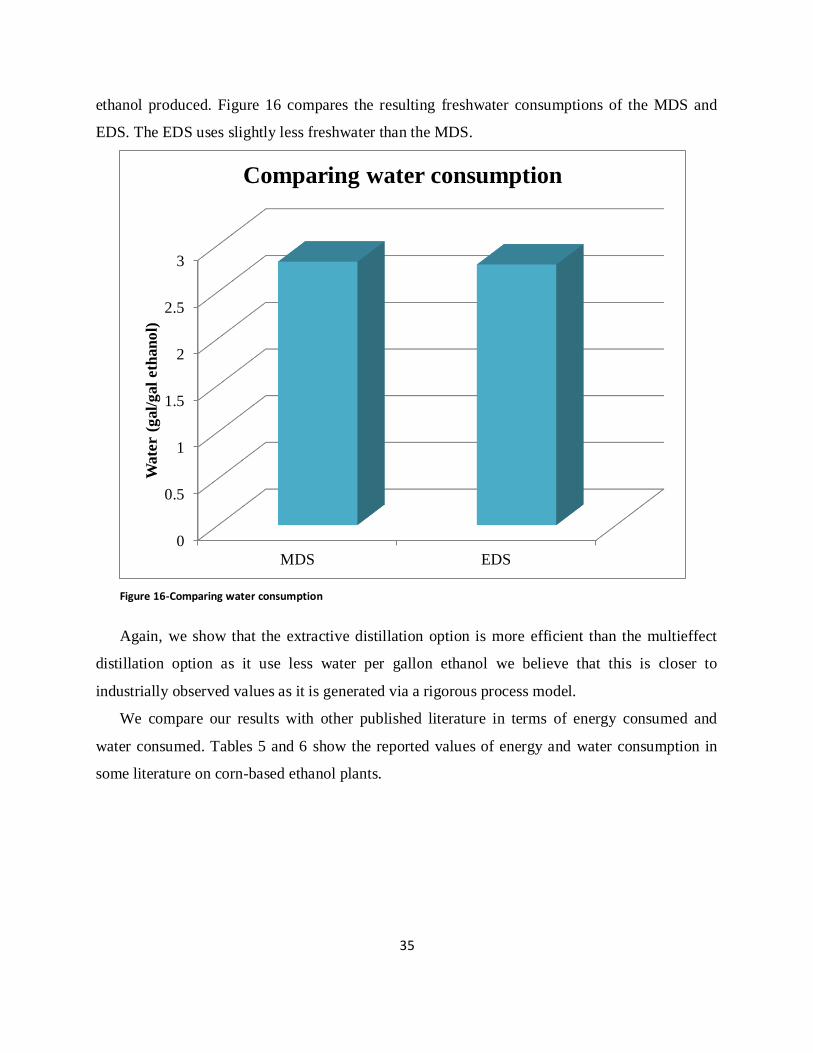
ethanol produced. Figure 16 compares the resulting freshwater consumptions of the MDS and
EDS. The EDS uses slightly less freshwater than the MDS.
Figure 16-Comparing water consumption
Again, we show that the extractive distillation option is more efficient than the multieffect
distillation option as it use less water per gallon ethanol we believe that this is closer to
industrially observed values as it is generated via a rigorous process model.
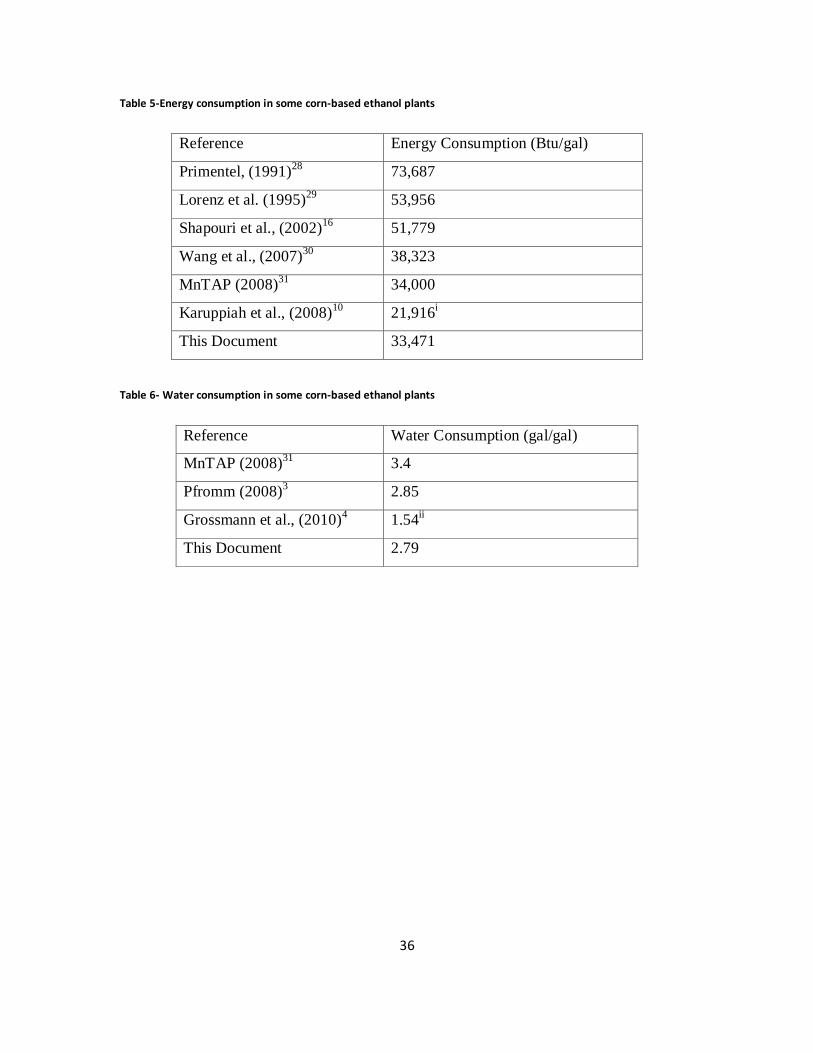
We compare our results with other published literature in terms of energy consumed and
water consumed. Tables 5 and 6 show the reported values of energy and water consumption in
some literature on corn-based ethanol plants.
0
0.5
1
1.5
2
2.5
3
MDS EDS
Wate
r (g
al/
gal
eth
an
ol)
Comparing water consumption
36
Table 5-Energy consumption in some corn-based ethanol plants
Reference Energy Consumption (Btu/gal)
Primentel, (1991)28
73,687
Lorenz et al. (1995)29
53,956
Shapouri et al., (2002)16
51,779
Wang et al., (2007)30
38,323
MnTAP (2008)31
34,000
Karuppiah et al., (2008)10
21,916i
This Document 33,471
Table 6- Water consumption in some corn-based ethanol plants
Reference Water Consumption (gal/gal)
MnTAP (2008)31
3.4
Pfromm (2008)3
2.85
Grossmann et al., (2010)4 1.54
ii
This Document 2.79
37
8. Reuse of Treated Wastewater
We also perform a study on the possibility of treating the wastewater and using it as part of
the utility makeup water. Improved technologies in wastewater treatment make it possible to
treat most of the wastewater and reuse it. In our process, the main sources of recycle water are
process wash water, boiler blowdown and cooling tower blowdown. We cannot recycle
evaporation loss and drift loss water since we have no way of trapping them. Reusing the treated
wastewater from these ethanol plants will further reduce the overall water consumption in the
plant. In the typical dry grind corn-to-ethanol process cooling tower makeup accounts for 68% of
the total makeup water and boiler blowdown accounts for 32% of the total makeup water1, thus
reusing the treated wastewater from the cooling tower and boiler blowdown will tremendously
reduce the freshwater consumption.
A study by the Metropolitan Council Environmental Services (MCES) shows that it is
possible for ethanol plants to reuse treated wastewater from a municipal wastewater treatment
plant (MWWTP)31
. The discharge from the MWWTP is good enough to use as non-contact
cooling water in ethanol plants. A recently built power plant in Mankato, Minnesota, takes
advantage of treated wastewater. It uses the effluent from the MWWTP for cooling, thereby
requiring no additional water for cooling purposes31
.
In industry, the main concerns when treating cooling tower blowdown for reuse in ethanol
plants are pathogens, organics, ammonia, chlorides, calcium, magnesium, heavy metals and total
dissolved solids (TDS)32
. Since the cooling water for the cooling tower is non-contact cooling
water, the requirements are different from contact water. Using mild treatment of wastewater
plant effluent allows for the reuse of the treated wastewater as the cooling tower makeup water
and further deep treatment for boiler makeup water. The wastewater stream from ethanol plants
is usually high in organic content and nutrients. A wastewater treatment plant in Decatur, Illinois
(ADM Decatur) proposed a solution for treating such effluent streams. They use a membrane
filtration system from GE Water and Process Technologies to treat these effluents. The
membrane acts as a physical barrier to suspended solids and colloidal material. Their treatment
of the wastewater results in high quality treated water which they use as cooling tower makeup
water33
.
38
Another example of industrial wastewater reuse in ethanol plants is a company (White
Energy) in Russell, Kansas. White Energy has an ethanol plant that produces about 40 million
gallons of ethanol a year since 2001. With the help of a team from GE Water and Process
Technologies, White Energy created an integrated water reuse and chemical treatment strategy
that recovers wastewater from the ethanol production process and recycles the treated discharge
as makeup water for the plant’s cooling towers. Their system of water reuse reduces the plant’s
annual water consumption by about 43 million gallons34
.
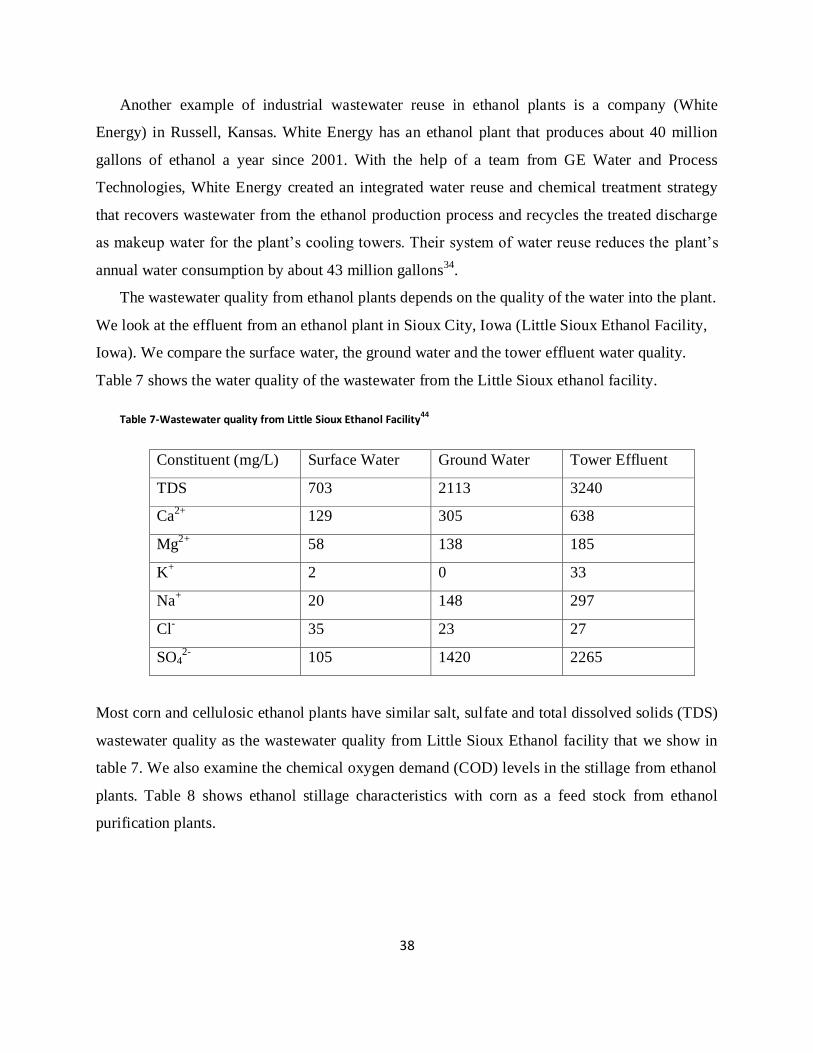
The wastewater quality from ethanol plants depends on the quality of the water into the plant.
We look at the effluent from an ethanol plant in Sioux City, Iowa (Little Sioux Ethanol Facility,
Iowa). We compare the surface water, the ground water and the tower effluent water quality.
Table 7 shows the water quality of the wastewater from the Little Sioux ethanol facility.
Table 7-Wastewater quality from Little Sioux Ethanol Facility44
Constituent (mg/L) Surface Water Ground Water Tower Effluent
TDS 703 2113 3240
Ca2+
129 305 638
Mg2+
58 138 185
K+
2 0 33
Na+
20 148 297
Cl-
35 23 27
SO42-
105 1420 2265
Most corn and cellulosic ethanol plants have similar salt, sulfate and total dissolved solids (TDS)
wastewater quality as the wastewater quality from Little Sioux Ethanol facility that we show in
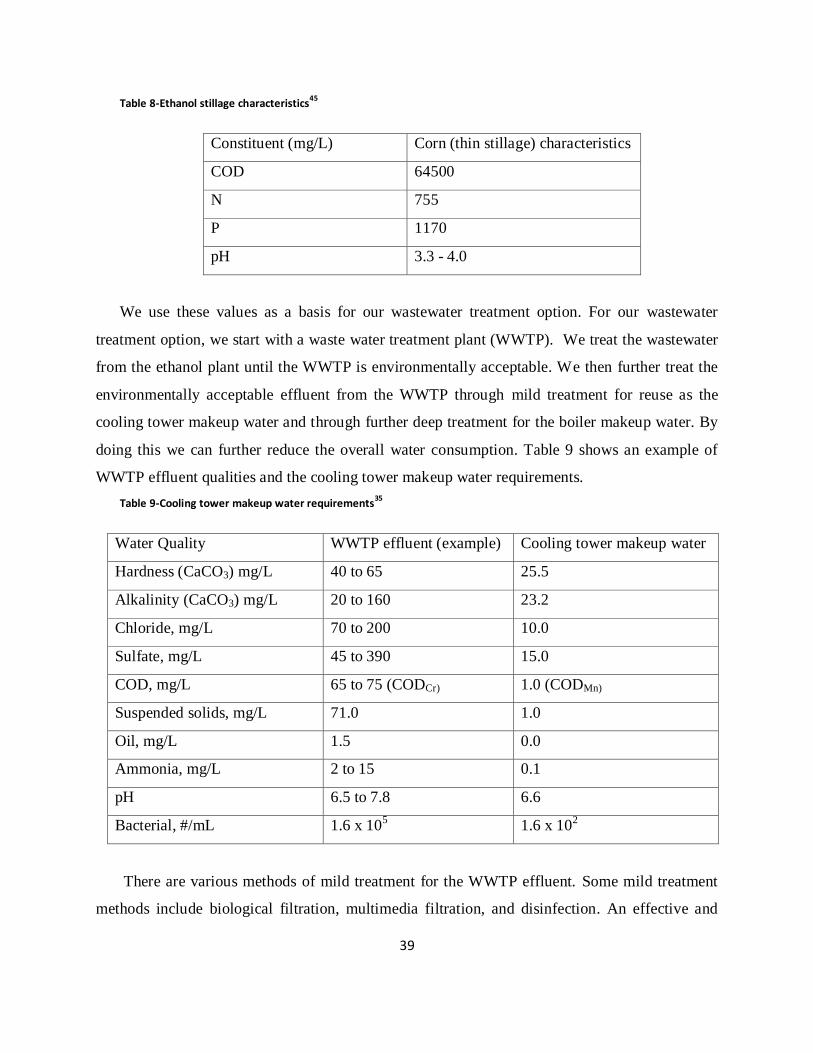
table 7. We also examine the chemical oxygen demand (COD) levels in the stillage from ethanol
plants. Table 8 shows ethanol stillage characteristics with corn as a feed stock from ethanol
purification plants.
39
Table 8-Ethanol stillage characteristics45
Constituent (mg/L) Corn (thin stillage) characteristics
COD 64500
N 755
P 1170
pH 3.3 - 4.0
We use these values as a basis for our wastewater treatment option. For our wastewater
treatment option, we start with a waste water treatment plant (WWTP). We treat the wastewater
from the ethanol plant until the WWTP is environmentally acceptable. We then further treat the
environmentally acceptable effluent from the WWTP through mild treatment for reuse as the
cooling tower makeup water and through further deep treatment for the boiler makeup water. By
doing this we can further reduce the overall water consumption. Table 9 shows an example of
WWTP effluent qualities and the cooling tower makeup water requirements.
Table 9-Cooling tower makeup water requirements35
Water Quality WWTP effluent (example) Cooling tower makeup water
Hardness (CaCO3) mg/L 40 to 65 25.5
Alkalinity (CaCO3) mg/L 20 to 160 23.2
Chloride, mg/L 70 to 200 10.0
Sulfate, mg/L 45 to 390 15.0
COD, mg/L 65 to 75 (CODCr) 1.0 (CODMn)
Suspended solids, mg/L 71.0 1.0
Oil, mg/L 1.5 0.0
Ammonia, mg/L 2 to 15 0.1
pH 6.5 to 7.8 6.6
Bacterial, #/mL 1.6 x 10⁵
1.6 x 10²
There are various methods of mild treatment for the WWTP effluent. Some mild treatment
methods include biological filtration, multimedia filtration, and disinfection. An effective and
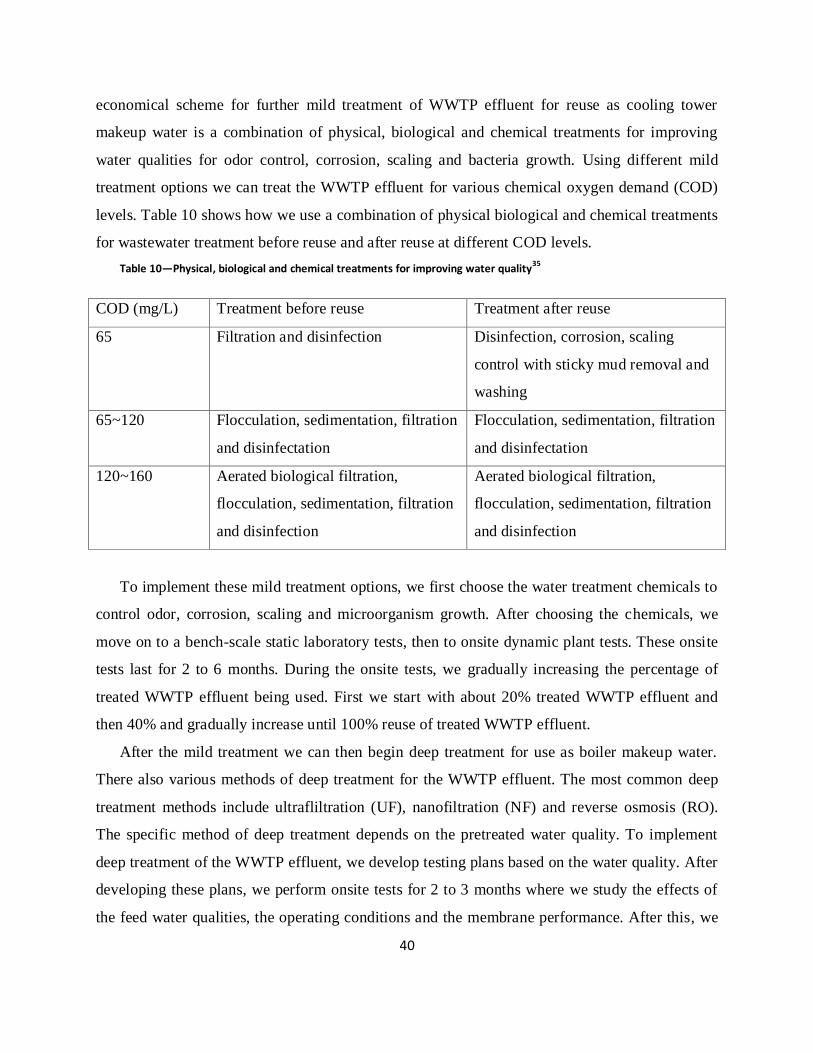
40
economical scheme for further mild treatment of WWTP effluent for reuse as cooling tower
makeup water is a combination of physical, biological and chemical treatments for improving
water qualities for odor control, corrosion, scaling and bacteria growth. Using different mild
treatment options we can treat the WWTP effluent for various chemical oxygen demand (COD)
levels. Table 10 shows how we use a combination of physical biological and chemical treatments
for wastewater treatment before reuse and after reuse at different COD levels.
Table 10—Physical, biological and chemical treatments for improving water quality35
COD (mg/L) Treatment before reuse Treatment after reuse
65 Filtration and disinfection Disinfection, corrosion, scaling
control with sticky mud removal and
washing
65~120 Flocculation, sedimentation, filtration
and disinfectation
Flocculation, sedimentation, filtration
and disinfectation
120~160 Aerated biological filtration,
flocculation, sedimentation, filtration
and disinfection
Aerated biological filtration,
flocculation, sedimentation, filtration
and disinfection
To implement these mild treatment options, we first choose the water treatment chemicals to
control odor, corrosion, scaling and microorganism growth. After choosing the chemicals, we
move on to a bench-scale static laboratory tests, then to onsite dynamic plant tests. These onsite
tests last for 2 to 6 months. During the onsite tests, we gradually increasing the percentage of
treated WWTP effluent being used. First we start with about 20% treated WWTP effluent and
then 40% and gradually increase until 100% reuse of treated WWTP effluent.
After the mild treatment we can then begin deep treatment for use as boiler makeup water.
There also various methods of deep treatment for the WWTP effluent. The most common deep
treatment methods include ultrafliltration (UF), nanofiltration (NF) and reverse osmosis (RO).
The specific method of deep treatment depends on the pretreated water quality. To implement
deep treatment of the WWTP effluent, we develop testing plans based on the water quality. After
developing these plans, we perform onsite tests for 2 to 3 months where we study the effects of
the feed water qualities, the operating conditions and the membrane performance. After this, we
41
optimize the operating conditions, the RO and UF process designs, and finally the engineering
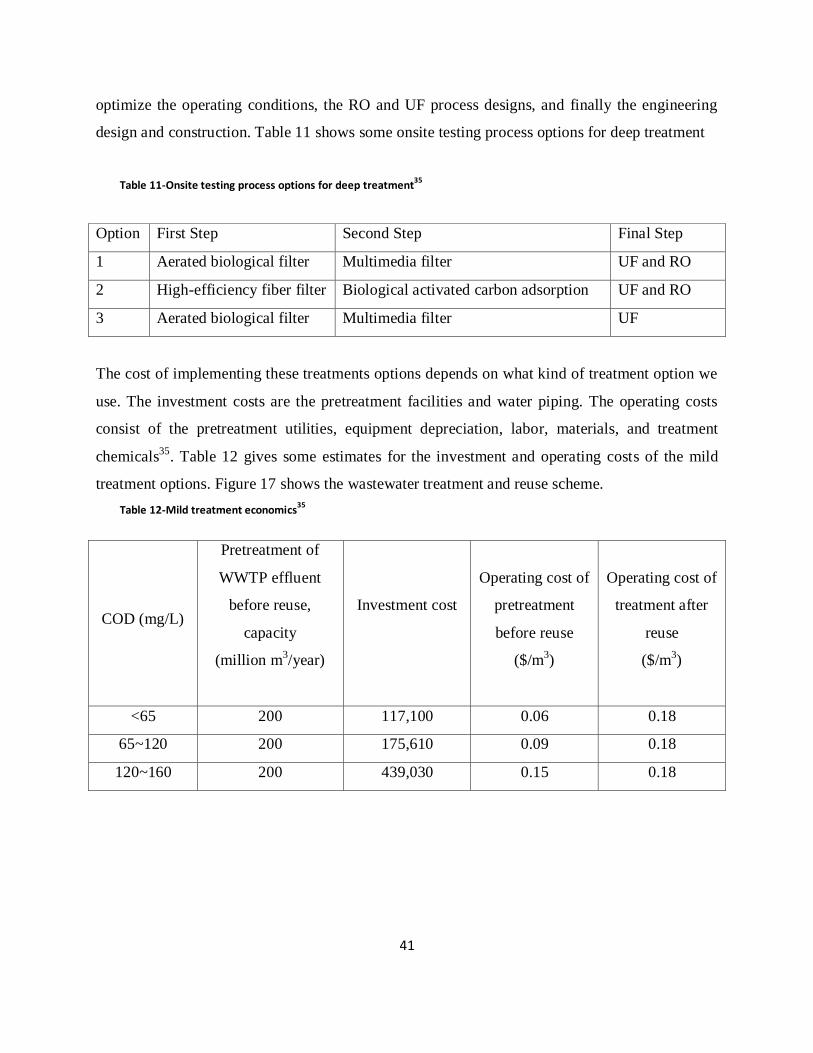
design and construction. Table 11 shows some onsite testing process options for deep treatment
Table 11-Onsite testing process options for deep treatment35
Option First Step Second Step Final Step
1 Aerated biological filter Multimedia filter UF and RO
2 High-efficiency fiber filter Biological activated carbon adsorption UF and RO
3 Aerated biological filter Multimedia filter UF
The cost of implementing these treatments options depends on what kind of treatment option we
use. The investment costs are the pretreatment facilities and water piping. The operating costs
consist of the pretreatment utilities, equipment depreciation, labor, materials, and treatment
chemicals35
. Table 12 gives some estimates for the investment and operating costs of the mild
treatment options. Figure 17 shows the wastewater treatment and reuse scheme.
Table 12-Mild treatment economics35
COD (mg/L)
Pretreatment of
WWTP effluent
before reuse,
capacity
(million m3/year)
Investment cost
Operating cost of
pretreatment
before reuse
($/m3)
Operating cost of
treatment after
reuse
($/m3)
<65 200 117,100 0.06 0.18
65~120 200 175,610 0.09 0.18
120~160 200 439,030 0.15 0.18
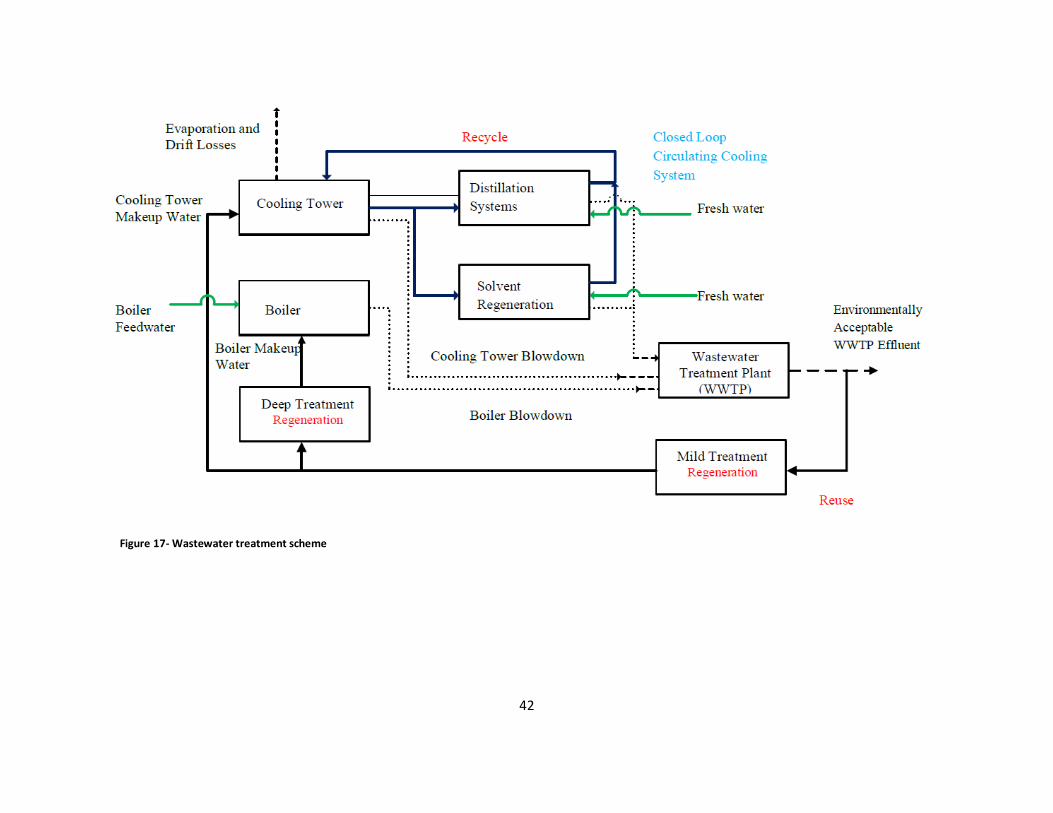
42
Figure 17- Wastewater treatment scheme
43
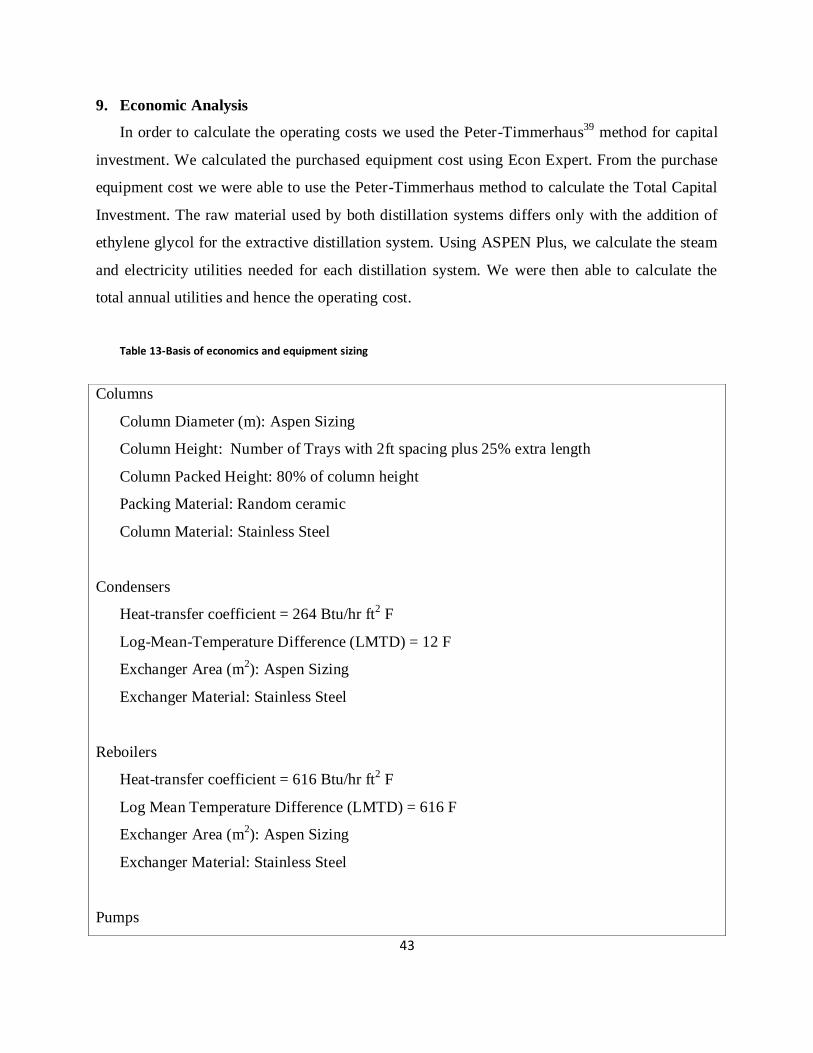
9. Economic Analysis
In order to calculate the operating costs we used the Peter-Timmerhaus39
method for capital
investment. We calculated the purchased equipment cost using Econ Expert. From the purchase
equipment cost we were able to use the Peter-Timmerhaus method to calculate the Total Capital
Investment. The raw material used by both distillation systems differs only with the addition of
ethylene glycol for the extractive distillation system. Using ASPEN Plus, we calculate the steam
and electricity utilities needed for each distillation system. We were then able to calculate the
total annual utilities and hence the operating cost.
Table 13-Basis of economics and equipment sizing
Columns
Column Diameter (m): Aspen Sizing
Column Height: Number of Trays with 2ft spacing plus 25% extra length
Column Packed Height: 80% of column height
Packing Material: Random ceramic
Column Material: Stainless Steel
Condensers
Heat-transfer coefficient = 264 Btu/hr ft2 F
Log-Mean-Temperature Difference (LMTD) = 12 F
Exchanger Area (m2): Aspen Sizing
Exchanger Material: Stainless Steel
Reboilers
Heat-transfer coefficient = 616 Btu/hr ft2 F
Log Mean Temperature Difference (LMTD) = 616 F
Exchanger Area (m2): Aspen Sizing
Exchanger Material: Stainless Steel
Pumps
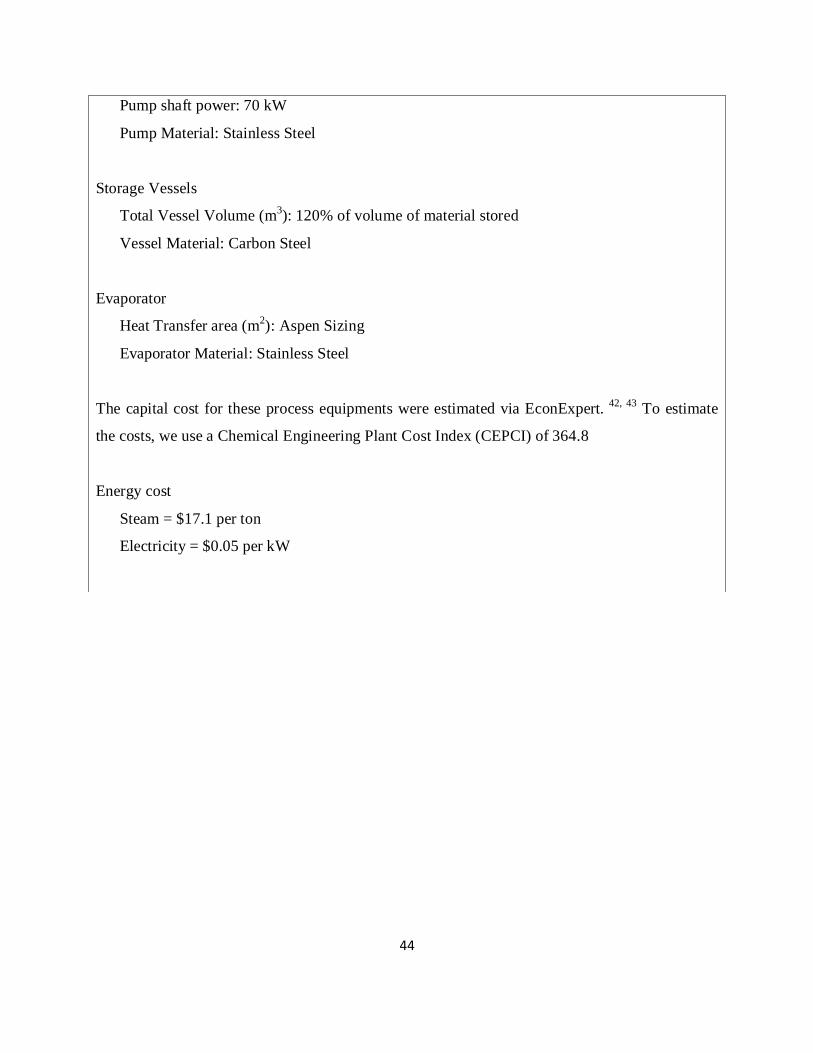
44
Pump shaft power: 70 kW
Pump Material: Stainless Steel
Storage Vessels
Total Vessel Volume (m3): 120% of volume of material stored
Vessel Material: Carbon Steel
Evaporator
Heat Transfer area (m2): Aspen Sizing
Evaporator Material: Stainless Steel
The capital cost for these process equipments were estimated via EconExpert. 42, 43
To estimate
the costs, we use a Chemical Engineering Plant Cost Index (CEPCI) of 364.8
Energy cost
Steam = $17.1 per ton
Electricity = $0.05 per kW
45
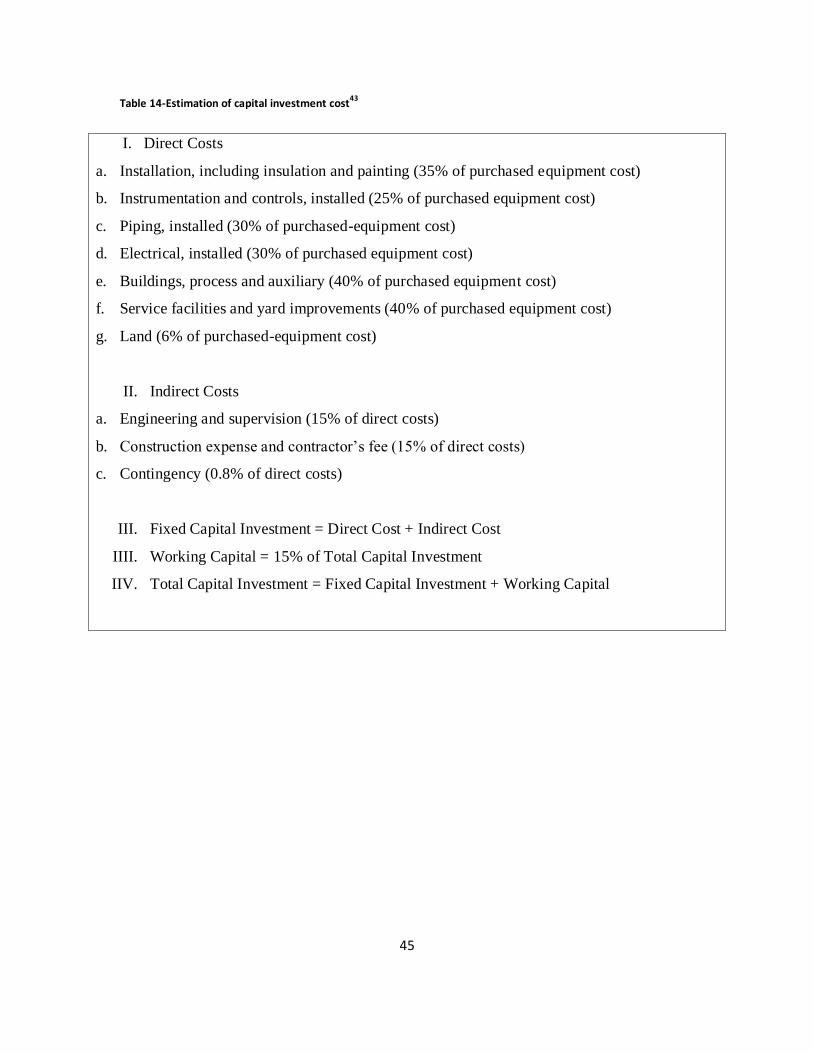
Table 14-Estimation of capital investment cost43
I. Direct Costs
a. Installation, including insulation and painting (35% of purchased equipment cost)
b. Instrumentation and controls, installed (25% of purchased equipment cost)
c. Piping, installed (30% of purchased-equipment cost)
d. Electrical, installed (30% of purchased equipment cost)
e. Buildings, process and auxiliary (40% of purchased equipment cost)
f. Service facilities and yard improvements (40% of purchased equipment cost)
g. Land (6% of purchased-equipment cost)
II. Indirect Costs
a. Engineering and supervision (15% of direct costs)
b. Construction expense and contractor’s fee (15% of direct costs)
c. Contingency (0.8% of direct costs)
III. Fixed Capital Investment = Direct Cost + Indirect Cost
IIII. Working Capital = 15% of Total Capital Investment
IIV. Total Capital Investment = Fixed Capital Investment + Working Capital
46
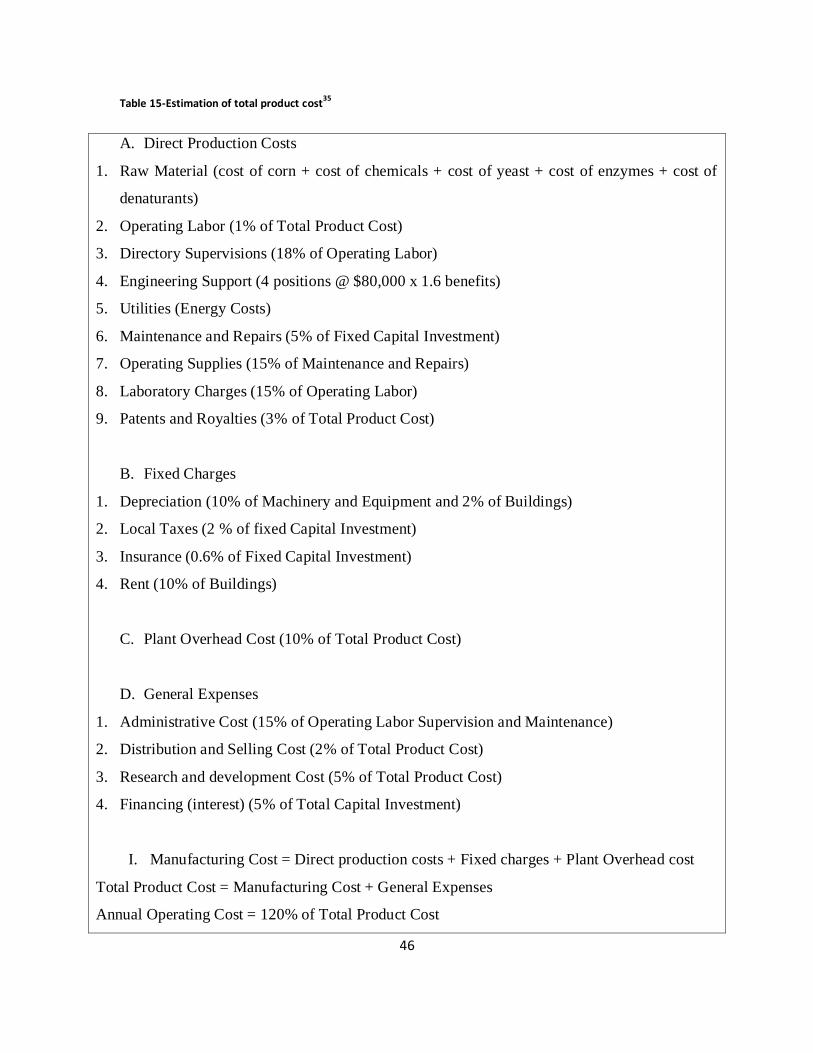
Table 15-Estimation of total product cost35
A. Direct Production Costs
1. Raw Material (cost of corn + cost of chemicals + cost of yeast + cost of enzymes + cost of
denaturants)
2. Operating Labor (1% of Total Product Cost)
3. Directory Supervisions (18% of Operating Labor)
4. Engineering Support (4 positions @ $80,000 x 1.6 benefits)
5. Utilities (Energy Costs)
6. Maintenance and Repairs (5% of Fixed Capital Investment)
7. Operating Supplies (15% of Maintenance and Repairs)
8. Laboratory Charges (15% of Operating Labor)
9. Patents and Royalties (3% of Total Product Cost)
B. Fixed Charges
1. Depreciation (10% of Machinery and Equipment and 2% of Buildings)
2. Local Taxes (2 % of fixed Capital Investment)
3. Insurance (0.6% of Fixed Capital Investment)
4. Rent (10% of Buildings)
C. Plant Overhead Cost (10% of Total Product Cost)
D. General Expenses
1. Administrative Cost (15% of Operating Labor Supervision and Maintenance)
2. Distribution and Selling Cost (2% of Total Product Cost)
3. Research and development Cost (5% of Total Product Cost)
4. Financing (interest) (5% of Total Capital Investment)
I. Manufacturing Cost = Direct production costs + Fixed charges + Plant Overhead cost
Total Product Cost = Manufacturing Cost + General Expenses
Annual Operating Cost = 120% of Total Product Cost
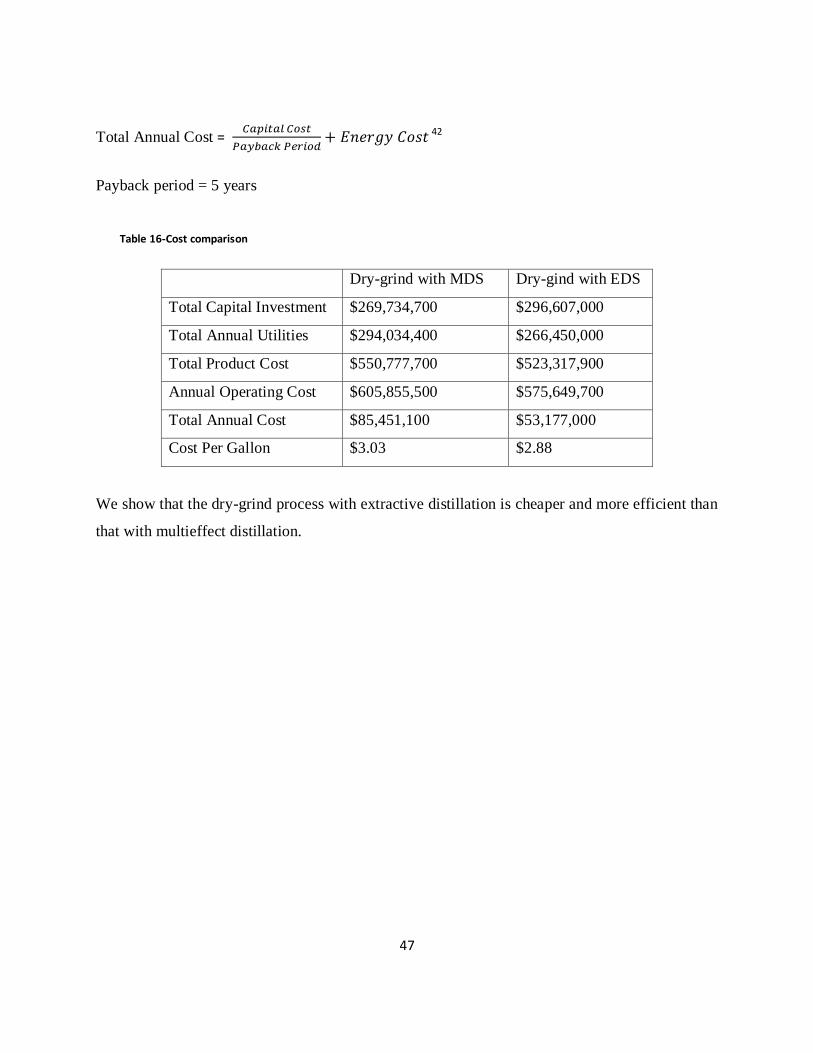
47
Total Annual Cost =
42
Payback period = 5 years
Table 16-Cost comparison
Dry-grind with MDS Dry-gind with EDS
Total Capital Investment $269,734,700 $296,607,000
Total Annual Utilities $294,034,400 $266,450,000
Total Product Cost $550,777,700 $523,317,900
Annual Operating Cost $605,855,500 $575,649,700
Total Annual Cost $85,451,100 $53,177,000
Cost Per Gallon $3.03 $2.88
We show that the dry-grind process with extractive distillation is cheaper and more efficient than
that with multieffect distillation.
48
10. Conclusions
Biofuel production is a viable and potentially promising source of alternative energy. Since
the Biofuel production and recovery process is a water intensive process, as biofuel production
and recovery plants become more popular exploited, industrial water consumption would also
increase. Water and energy are extensively used in industry. This work presents a detailed
comparison of two identical dry-grind process with different distillations systems; extractive and
multieffect distillation. The key highlights of this report are;
A brief summary of existing literature on ethanol production and purification via
biomass.
A brief summary of reported values of energy and water consumption in ethanol
production and purification.
An overall description of the dry-grind process.
A detailed design and comparison of short cut design and rigorous simulation.
A rigorous design (using ASPEN Plus) of identical dry-grind process with different
distillation options.
A description of both ASPEN Plus distillation designs.
A detailed and fair comparison between multieffect distillation and extractive distillation
for ethanol purification in terms of energy consumption, water consumption, cost and
overall efficiency.
A description of the heat integration method used in multieffect distillation.
A description of industrial wastewater treatment options applicable to corn-based ethanol
plants.
49
References
1) Aden, A.; Water Usage for Current and Future Ethanol Production. National Renewable
Energy Laboratory, Sept.-Oct. 2007.
2) Renewable Fuels Association, 2007. Available from: <http://www.ethanolrfa.org>.
3) Pfromm, P.H. The Minimum Water Consumption of Ethanol Production via Biomass
Fermentation. The Open Chemical Engineering Journal 2008, 5, 1-2.
4) Grossmann, I. E.; Mariano, M. Energy and Water Optimization in Biofuel Plants.
Chinese Journal of Chemical Engineering 2010, 18 (6), 14-22.
5) Butzen, S.; Haefele, D. Dry-grind Ethanol Production from Corn. Crop Insights. 2008, 18
(11), 1-4.
6) Wooley, R. J.; Putsche, V. Development of an ASPEN PLUS Physical Property Database
for Biofuels Components. Golden, Colorado: NREL, 1996, PDF.
7) Fenske, M. R. Fractionation of Straight-run Pennsylvania Gasoline. Ind. Eng. Chem. Res.
1932, 24, 482.
8) Underwood, A. J.V. Fractional Distillation of Multicomponent Mixtures- Calculation of
Minimum Reflux Ratio. J. Inst. Pet. 1946, 32, 614-626.
9) Gilliland, E. R. Multicomponent Rectification. Ind. Eng. Chem. Res. 1940, 32, 1220.
10) Karuppiah, R.; Peschel, A.; Mariano, M.; Martinson, W.; Zullo, L.; Grossmann, I.E.
Energy Optimization for the Design of Corn-based Ethanol Plants. AIChE Journal. 2008,
54 (6), 1499-1525.
50
11) Renon H.; Prausnitz J. M. Local Compositions in Thermodynamic Excess Functions for
Liquid Mixtures. AIChE Journal. 1968, 14, 135–144.
12) Yaws, C.L. Chemical Properties Handbook. McGraw-Hill. 1999.
13) Xiangjuan, Q.; Lingdong, S. Study of New High Efficiency Energy-Conservation
Multieffects Bio-Ethanol Distillation Technology. Advance Materials Research. 2011,
627 (32), 236-238.
14) Piccolo, C.; Bezzo, F. Ethanol from lignocellulosic biomass: A comparison between
conversion technologies. Computer-aided chemical engineering. 2007, 24, 1277–1282.
15) Kwiatkowski, J.; McAloon, A.; Taylor, F.; Johnston, D. Modeling the Process and Costs
of Fuel Ethanol Production by the Corn Dry-grind Process. Industrial Crops and
Products. 2006, 23 (3), 288-296.
16) Shapouri, H.; Duffield, J. A.; Wang, M.; The energy balance of corn ethanol: An update.
USDA, Office of Energy Policy and New Uses, Agricultural Economics. 2002, 813, 20.
17) Feitosa De Figueiredo, M.; Guedes, B.P.; Monteiro De Araujo, J.M.; Vasconcelos, L.G.;
Brito, R.P. Optimal Design of Extractive Distillation Columns-A Systematic Procedure
Using a Process Simulator. Chemical Engineering Research and Design. 2011, 89.3, 341-
346.
18) Ravagnani, M.A.S.S.; Reis, M.H.M.; Maciel Filho, R.; Wolf-Maciel, M.R. Anhydrous
Ethanol Production by Extractive Distillation: A Solvent Case Study. Process Safety and
Environmental Protection. 2010, 88, 67-73.
51
19) Hoch, P.M.; Espinosa, J. Conceptual Design and Simulation Tools Applied to the
Evolutionary Optimization of a Bioethanol Purification Plant. . Ind. Eng. Chem. Res.
2008, 47 (19), 7381-7389.
20) Emhamed, A. M.; Czuczai, B.; Rev, E.; Lelkes, Z. Analysis of extractive distillation with
mathematical programming. Ind. Eng. Chem. Res. 2008, 47, 9983–9995.
21) Ligero, E.; Ravagnani, T. Dehydration of Ethanol with Salt Extractive Distillation: A
Comparative Analysis between Processes with Salt Recovery. Chemical Engineering and
Processing. 2003, 42 (7), 543-552.
22) Pinto, R.T.P.; Wolf-Maciel, M.R.; Lintomen, L.; Saline Extractive Distillation Process
for Ethanol Purification. Computers & Chemical Engineering. 2000, 24 (2-7), 1689-
1694.
23) Fu Ming, L.; Pahl, R.H. Solvent Screening Study and Conceptual Extractive Distillation
Process to Produce Anhydrous Ethanol from Fermentation Broth. Industrial &
Engineering Chemistry Process Design and Development. 1985, 24 (1), 168-172.
24) Mann, James G., and Y. A. Liu. Industrial Water Reuse and Wastewater Minimization.
McGraw-Hill, 1999.
25) Alliance for Water Efficiency.
<http://www.allianceforwaterefficiency.org/cooling_tower_intro.aspx>.
26) Drinking Water Contaminants. EPA Office of Water Home | Water | US EPA; available at
http://water.epa.gov/drink/contaminants/index.cfm#listmcl (accessed 24 August 2011)
27) Green, D.W.; Perry, R. H. Perry's Chemical Engineers' Handbook. 2008, 8th
edition, 12-
20.
52
28) Pimentel, D. Ethanol fuels: Energy security, economics, and the environment. J. Agric.
Environ. Ethics. 1991, 4, 1–13.
29) Lorenz, D.; Morris, D. How Much Energy Does it Take to Make a Gallon of Ethanol?
Revised and Updated. Institute for Local Self-Reliance. 1995, PDF.
30) Wang, M.; Wu, M.; Huo, H. Life-Cycle Energy and Greenhouse Gas Emission Impacts
of Different Corn Ethanol Plant Types. Environ. Res. Lett. 2007, 2, 1-13.
31) Minnesota Technical Assistance Program, MTAP, Ethanol Benchmarking and best
practices. The production process and potential for improvement available at,
www.mntap.umn.edu/MnTAP%20Ethanol%20Report.pdf (accessed 24 August 2011).
32) Manning, D. Minnesota Ethanol Facilities and Wastewater Reuse. Metropolitan Council
Environmental Services. 2006
33) ADM Decatur. Case Study: Tertiary Treatment of Grain Possessing Wastewater for
Reuse. GE Water and Process Technologies. PDF
34) GE. Water Reuse Helps White Energy Save over $200,000 per Year. GE Water and
Process Technologies. 2006. PDF
35) Liu, Y.A. How to Develop and Implement Substantial Water Savings in Global Top 10
Chemical Companies. Second Gregory D. Botsaris lecture, Department of Chemical and
Biological Engineering,Tufts University, Medford, Massachusetts, October (2008);
Keynote Opening Address, Annual Meeting, Chemical Industry and Engineering Society
of China, Zhengzhou, Henan, October 22 (2011).
53
36) United States, Environmental Protection Agency, May 1998, EPA 833-F-98-002, Office
of Water (4204), available at; http://www.epa.gov/npdespub/pubs/bastre.pdf. (accessed
September 1 2011)
37) Hultz, B.; Krichten, R.; DiFranco, P.; Greenwood, E.; Harrison, G. Technologies for
Industrial Water Reuse. GE Water and Process Technologies. PPT.
38) CDM. Treating Brackish Water In Sandoval County. CDM. 2010. Available at
http://westcas.com/PDF/Winter_2010_presentations/Treating_brackish_water_Sandoval_
County_Fowlie.pdf. (accessed August 2011)
39) Peters, M. S.; Timmerhaus, K. D.; West, R. E. Plant Design and Economics for
Chemical Engineers. McGraw-Hill, New York. 2003, 5th
edition.
40) Palligarnai, V.T; Gael D. Ulrich, G.D. EconExpert. Chemical Engineering Process
Design. http://www.ulrichvasudesign.com/econ.html. (accessed Aug 2011)
41) Palligarnai, V.T.; Ulrich, G.D. Chemical Engineering Process Design and Economics: A
Practical Guide. Process Pub. 2004.
42) Diemer, R.B.; Luyben, W.L. Design and Control of a Methyl Acetate Process Using
Carbonylation of Dimethyl Ether. Ind. Eng. Chem. Res. 2010, 12224-12241.
43) Renon, H.; Prausnitz, J. M. Local Compositions in Thermodynamic Excess Functions for
Liquid Mixtures. AIChE J. 1968, 14(1), 135–144.
44) Parkin, G.; Weyer, P.; Just. C.L. Riding the Bioeconomy Wave: Smooth Sailing or
Rough Water for the Environment and Public Health? Proceedings of the 2007 lowa
Water Conference—Water and Bioenergy, March 6, 2007, lowa State Center, Ames,
lowa. Available online at http://www.aep.iastate.edu/water/2007/parkin.html

54
45) Wilkie, A.C.; Riedesel, K.J.; Owens, J.M. Stillage Characterization and Anaerobic
Treatment of Ethanol Stillage from Conventional and Cellulosic Feedstocks. Biomass
and Bioenergy. 2000, 19, 63-102.
46) Aspen Plus. Aspen Plus Bioethanol from Corn Stover Model. Aspen Technology, July
2008. PDF
55
Appendix A: Annotated list of figures
1.
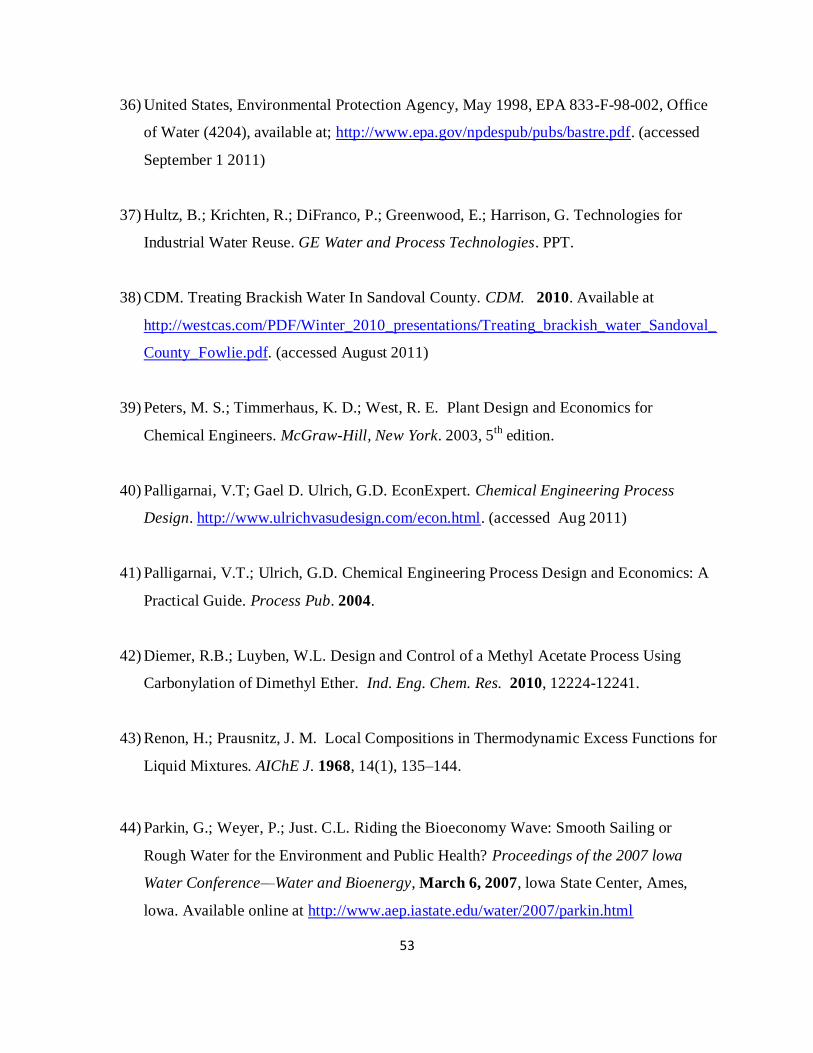
Figure 1-Pre-distillation section-
Figure 1 illustrates the predistillation section of the dry grind process. It illustrates how the corn
feed to the dry grind process goes through grain storage to a hammer mill for mashing, then to
slurry tanks with the addition of enzymes and to jet cooker, liquefaction vessels and finally
saccharification and fermentation and vessels in preparation for distillation.
2.
Figure 2-Extension of water-ethanol azeotrope at 0.1 atmospheres
56
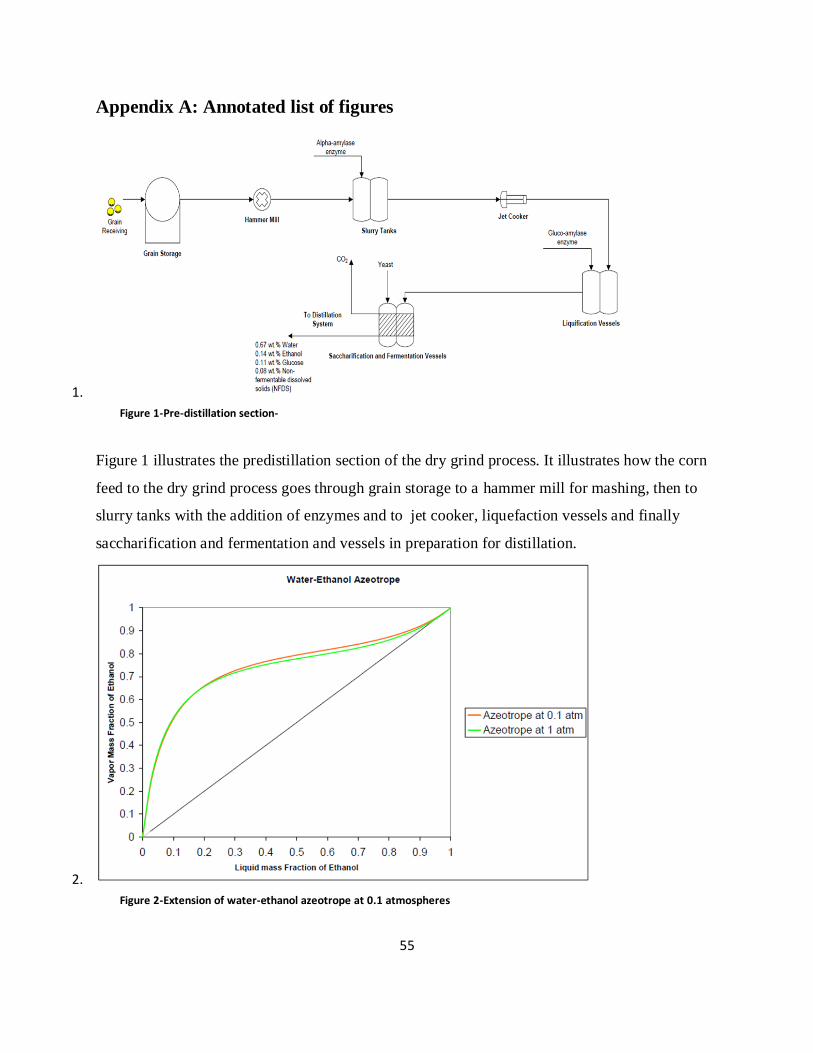
Figure 2 shows the azeotrope that occurs between the mixture of water and ethanol at
atmospheric pressure and at 0.1 atmoshperes.
3.
Figure 3-Results from shortcut design by DSTWU model in Aspen Plus
Figure 3 shows a conventional distillation system for the distillation of corn to ethanol. The
figure shows the shortcut calculations (non-rigorous stage by stage mass and energy calculations)
of the energy consumption of the distillation system performed using equations and Aspen Plus
software.
57
4.
Figure 4-Results of rigorous simulation using RADFRAC model from Aspen Plus
Figure 4 shows a conventional distillation system for the distillation of corn to ethanol. The
figure shows the values from the rigorous (stage by stage mass and energy balance calculations)
of the energy calculations using Aspen Plus modeling software.
58
5.
Figure 5-Schematic of DOA Model
Figure 5 is derived from Aspen Plus. (Aspen Plus. Aspen Plus Bioethanol from Corn Stover
Model. Aspen Technology, July 2008. PDF) It shows the entire dry grind process modeled using
Aspen Plus.
59
6.
Figure 6-Multieffect Distillation System (MDS)
Figure 6 is of the multieffect distillation system. This figure shows the schematic for the
multieffect distillation system along with the flows of each column, and the heating and cooling
duties of each column. It also shows the different operating pressures for each column and the
split ratios into the different columns.
60
7.
Figure 7-Effect of LP column operating pressure on reboiler duty
Figure 7 shows the relationship between the operating pressure of the lower pressure column of
the beer section (first section of the distillation system) and the reboiler (heating) duty of that
column. This figure is used to establish the optimum operating pressure for the lower pressure
column (i.e. the operating pressure that minimizes reboiler duty)
8.
Figure 8-Effect of LP column operating pressure on condenser duty
61
Figure 8 shows the relationship between the operating pressure of the lower pressure column of
the beer section of the distillation system and the condenser (cooling) duty of the column. We
use this figure to find the operating pressure that minimizes condenser duty.
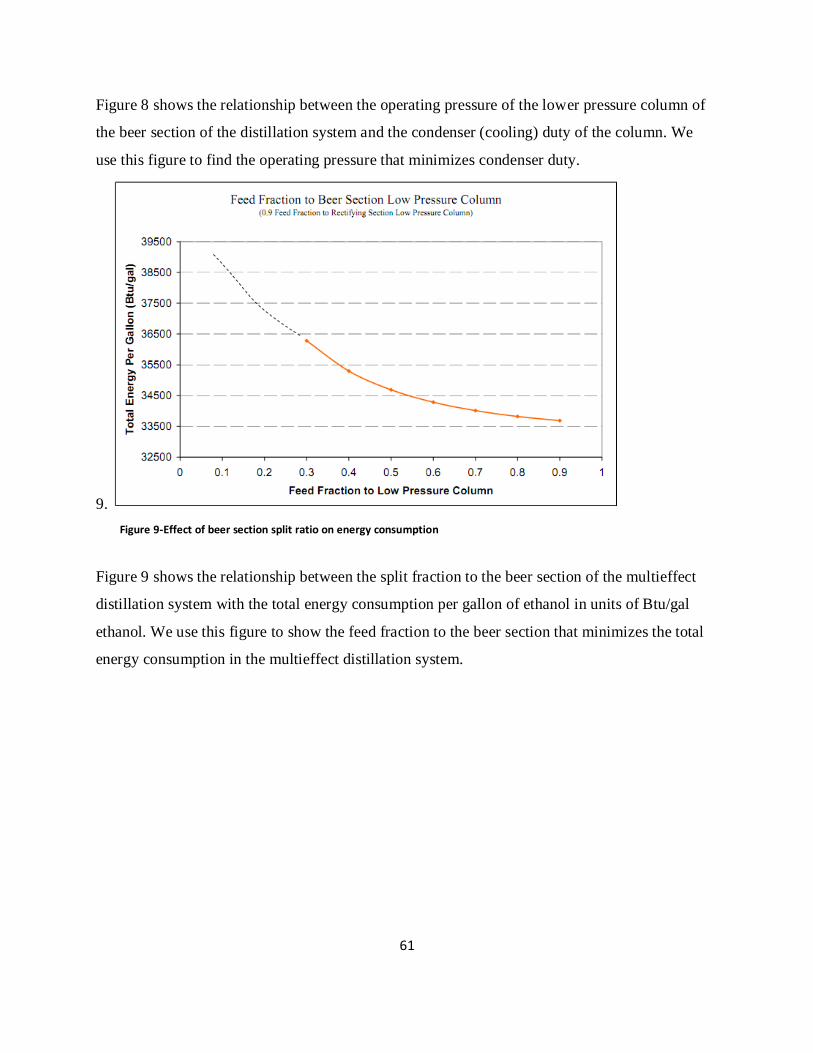
9.
Figure 9-Effect of beer section split ratio on energy consumption
Figure 9 shows the relationship between the split fraction to the beer section of the multieffect
distillation system with the total energy consumption per gallon of ethanol in units of Btu/gal
ethanol. We use this figure to show the feed fraction to the beer section that minimizes the total
energy consumption in the multieffect distillation system.
62
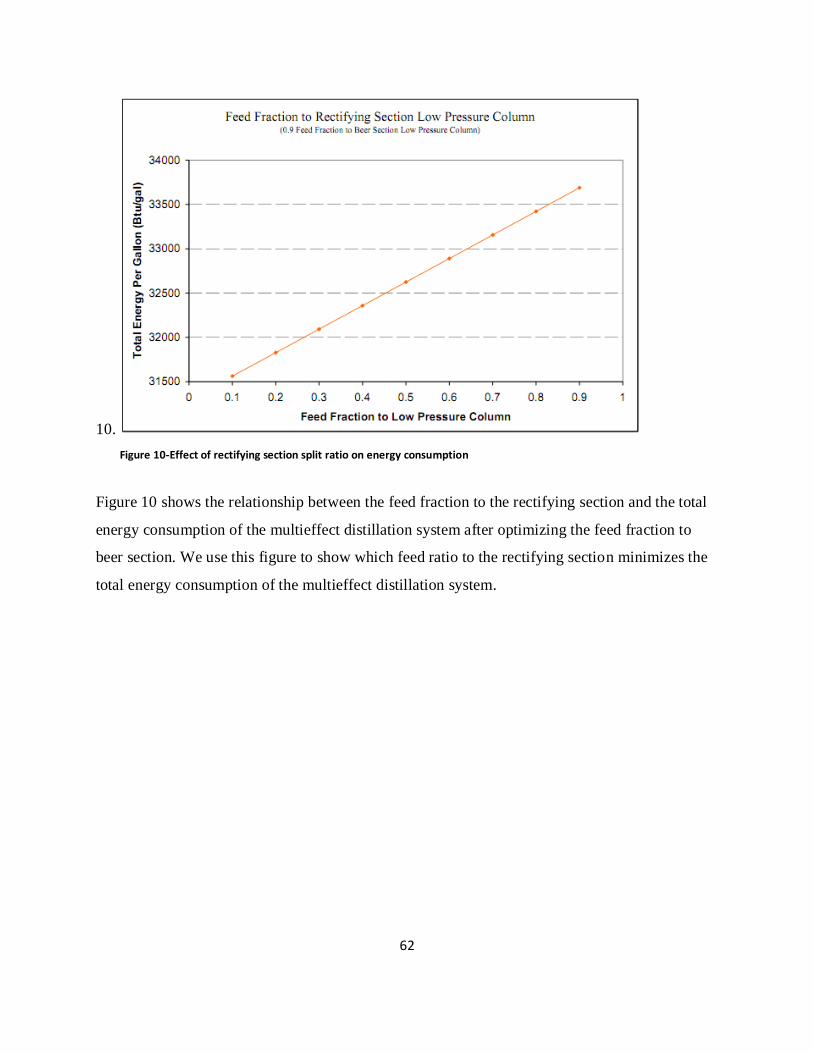
10.
Figure 10-Effect of rectifying section split ratio on energy consumption
Figure 10 shows the relationship between the feed fraction to the rectifying section and the total
energy consumption of the multieffect distillation system after optimizing the feed fraction to
beer section. We use this figure to show which feed ratio to the rectifying section minimizes the
total energy consumption of the multieffect distillation system.
63
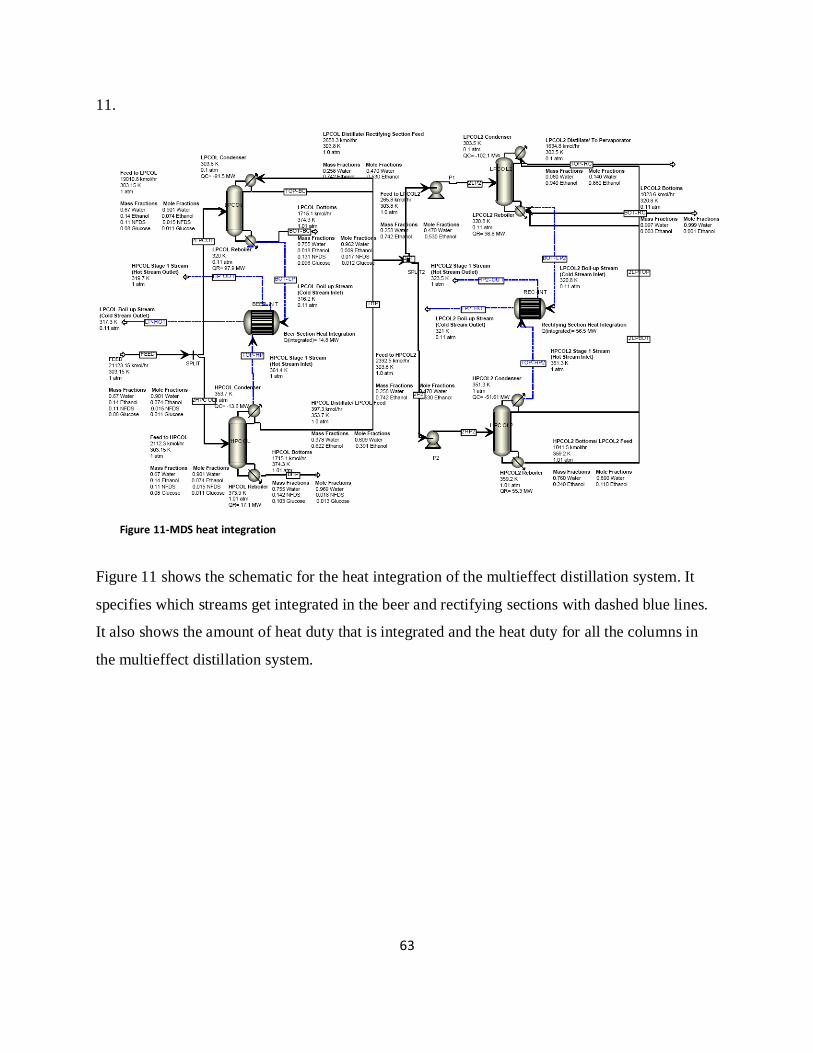
11.
Figure 11-MDS heat integration
Figure 11 shows the schematic for the heat integration of the multieffect distillation system. It
specifies which streams get integrated in the beer and rectifying sections with dashed blue lines.
It also shows the amount of heat duty that is integrated and the heat duty for all the columns in
the multieffect distillation system.
64
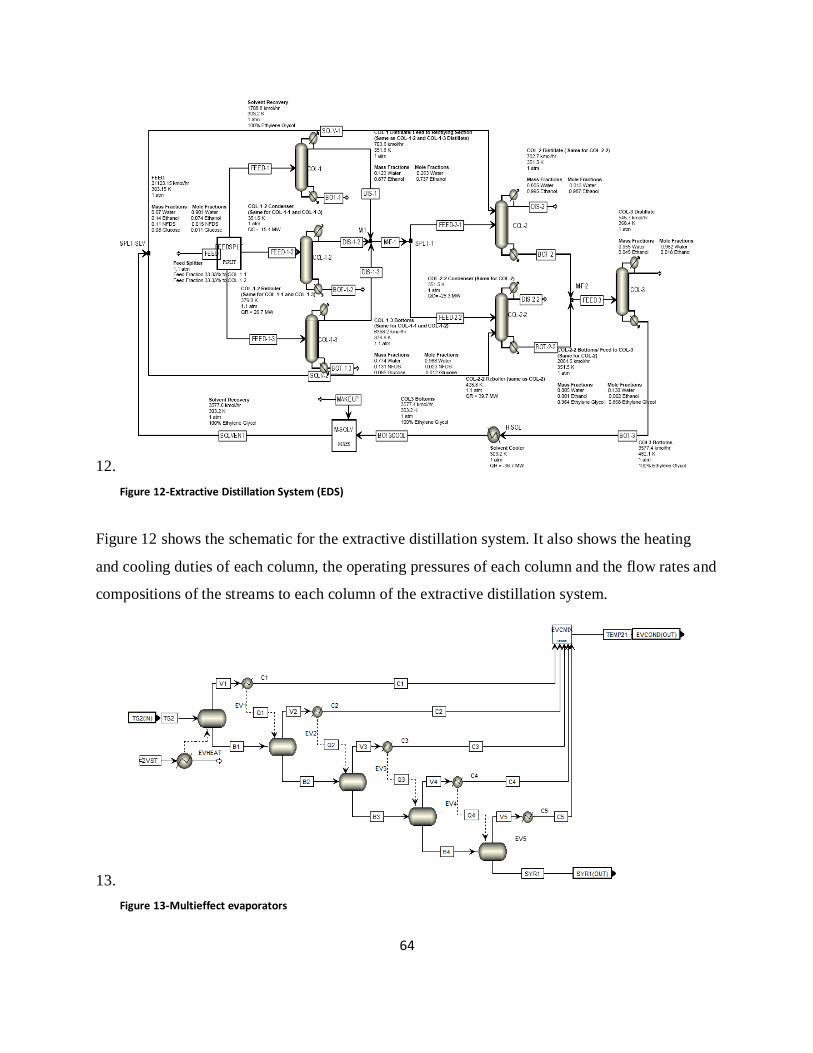
12.
Figure 12-Extractive Distillation System (EDS)
Figure 12 shows the schematic for the extractive distillation system. It also shows the heating
and cooling duties of each column, the operating pressures of each column and the flow rates and
compositions of the streams to each column of the extractive distillation system.
13.
Figure 13-Multieffect evaporators
65
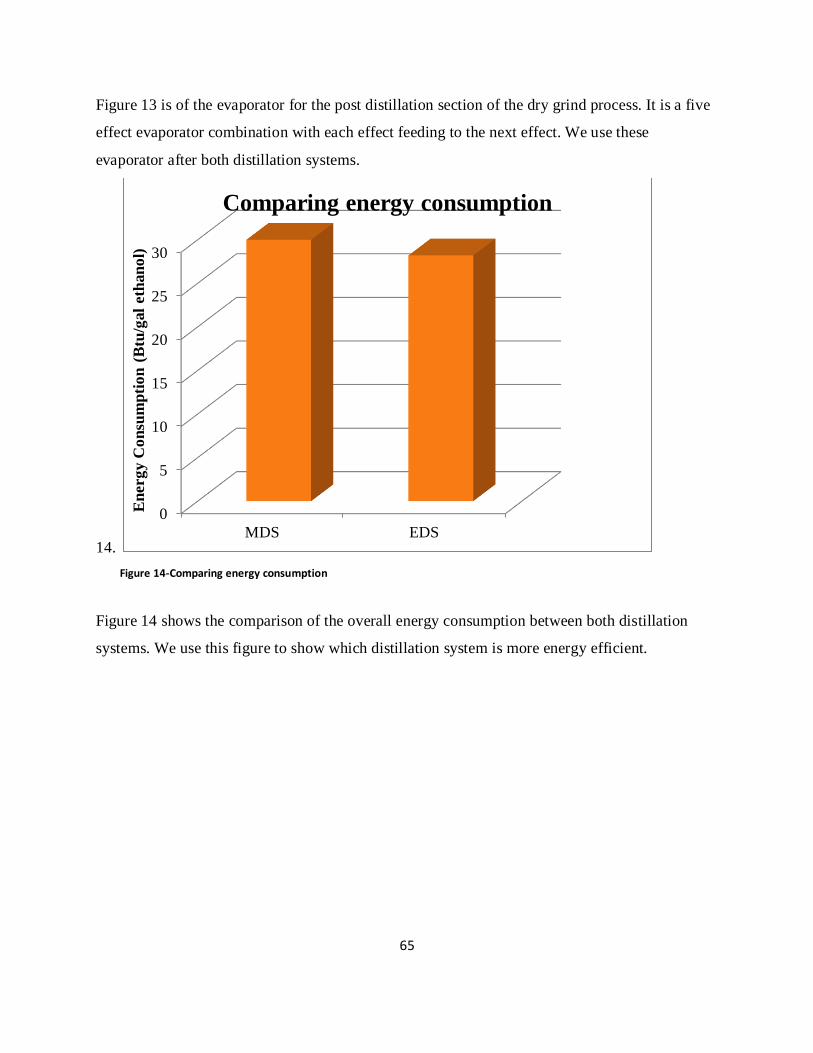
Figure 13 is of the evaporator for the post distillation section of the dry grind process. It is a five
effect evaporator combination with each effect feeding to the next effect. We use these
evaporator after both distillation systems.
14.
Figure 14-Comparing energy consumption
Figure 14 shows the comparison of the overall energy consumption between both distillation
systems. We use this figure to show which distillation system is more energy efficient.
0
5
10
15
20
25
30
MDS EDS
En
erg
y C
on
sum
pti
on
(B
tu/g
al
eth
an
ol)
Comparing energy consumption
66
15.
COOLING
TOWER HEAT
EXCHANGER
NETWORK
Make-up Water
Feed
Blow Down
Evaporation and
Drift Loss
Cold Water Outlet
Warm Water Inlet
Figure 15-Closed loops for water in cooling tower system
Figure 15 shows the cooling tower system for the dry grind process. It shows how we closed the
loops for circulating water in the process. It also shows the areas of water loss in the cooling
tower, cooling tower blowdown, evaporation loss and drift loss.
16.
Figure 16-Comparing water consumption
0
0.5
1
1.5
2
2.5
3
MDS EDS
Wate
r (g
al/
gal
eth
an
ol)
Comparing water consumption
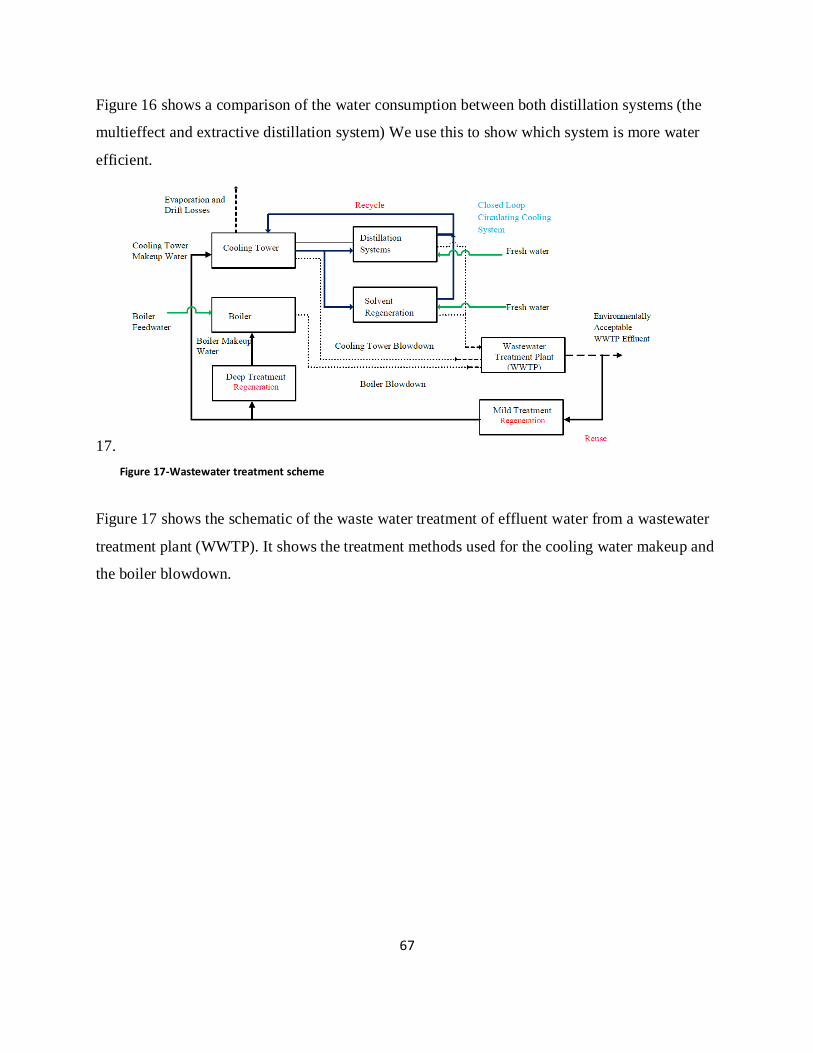
67
Figure 16 shows a comparison of the water consumption between both distillation systems (the
multieffect and extractive distillation system) We use this to show which system is more water
efficient.
17.
Figure 17-Wastewater treatment scheme
Figure 17 shows the schematic of the waste water treatment of effluent water from a wastewater
treatment plant (WWTP). It shows the treatment methods used for the cooling water makeup and
the boiler blowdown.
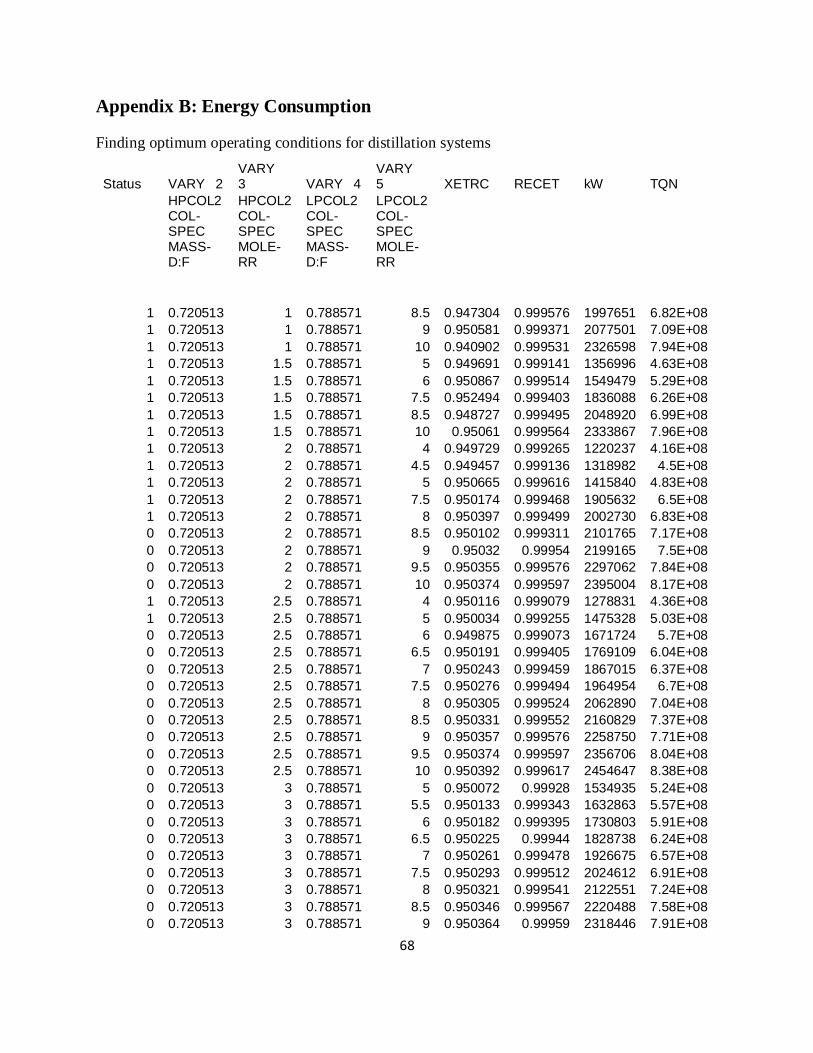
68
Appendix B: Energy Consumption
Finding optimum operating conditions for distillation systems
Status VARY 2 VARY 3 VARY 4
VARY 5 XETRC RECET kW TQN
HPCOL2 HPCOL2 LPCOL2 LPCOL2
COL-SPEC
COL-SPEC
COL-SPEC
COL-SPEC
MASS-D:F
MOLE-RR
MASS-D:F
MOLE-RR
1 0.720513 1 0.788571 8.5 0.947304 0.999576 1997651 6.82E+08
1 0.720513 1 0.788571 9 0.950581 0.999371 2077501 7.09E+08
1 0.720513 1 0.788571 10 0.940902 0.999531 2326598 7.94E+08
1 0.720513 1.5 0.788571 5 0.949691 0.999141 1356996 4.63E+08
1 0.720513 1.5 0.788571 6 0.950867 0.999514 1549479 5.29E+08
1 0.720513 1.5 0.788571 7.5 0.952494 0.999403 1836088 6.26E+08
1 0.720513 1.5 0.788571 8.5 0.948727 0.999495 2048920 6.99E+08
1 0.720513 1.5 0.788571 10 0.95061 0.999564 2333867 7.96E+08
1 0.720513 2 0.788571 4 0.949729 0.999265 1220237 4.16E+08
1 0.720513 2 0.788571 4.5 0.949457 0.999136 1318982 4.5E+08
1 0.720513 2 0.788571 5 0.950665 0.999616 1415840 4.83E+08
1 0.720513 2 0.788571 7.5 0.950174 0.999468 1905632 6.5E+08
1 0.720513 2 0.788571 8 0.950397 0.999499 2002730 6.83E+08
0 0.720513 2 0.788571 8.5 0.950102 0.999311 2101765 7.17E+08
0 0.720513 2 0.788571 9 0.95032 0.99954 2199165 7.5E+08
0 0.720513 2 0.788571 9.5 0.950355 0.999576 2297062 7.84E+08
0 0.720513 2 0.788571 10 0.950374 0.999597 2395004 8.17E+08
1 0.720513 2.5 0.788571 4 0.950116 0.999079 1278831 4.36E+08
1 0.720513 2.5 0.788571 5 0.950034 0.999255 1475328 5.03E+08
0 0.720513 2.5 0.788571 6 0.949875 0.999073 1671724 5.7E+08
0 0.720513 2.5 0.788571 6.5 0.950191 0.999405 1769109 6.04E+08
0 0.720513 2.5 0.788571 7 0.950243 0.999459 1867015 6.37E+08
0 0.720513 2.5 0.788571 7.5 0.950276 0.999494 1964954 6.7E+08
0 0.720513 2.5 0.788571 8 0.950305 0.999524 2062890 7.04E+08
0 0.720513 2.5 0.788571 8.5 0.950331 0.999552 2160829 7.37E+08
0 0.720513 2.5 0.788571 9 0.950357 0.999576 2258750 7.71E+08
0 0.720513 2.5 0.788571 9.5 0.950374 0.999597 2356706 8.04E+08
0 0.720513 2.5 0.788571 10 0.950392 0.999617 2454647 8.38E+08
0 0.720513 3 0.788571 5 0.950072 0.99928 1534935 5.24E+08
0 0.720513 3 0.788571 5.5 0.950133 0.999343 1632863 5.57E+08
0 0.720513 3 0.788571 6 0.950182 0.999395 1730803 5.91E+08
0 0.720513 3 0.788571 6.5 0.950225 0.99944 1828738 6.24E+08
0 0.720513 3 0.788571 7 0.950261 0.999478 1926675 6.57E+08
0 0.720513 3 0.788571 7.5 0.950293 0.999512 2024612 6.91E+08
0 0.720513 3 0.788571 8 0.950321 0.999541 2122551 7.24E+08
0 0.720513 3 0.788571 8.5 0.950346 0.999567 2220488 7.58E+08
0 0.720513 3 0.788571 9 0.950364 0.99959 2318446 7.91E+08
69
0 0.720513 3 0.788571 9.5 0.950388 0.999611 2416365 8.24E+08
0 0.720513 3 0.788571 10 0.950406 0.99963 2514299 8.58E+08
0 0.720513 3.5 0.788571 3.5 0.949828 0.999024 1300832 4.44E+08
0 0.720513 3.5 0.788571 4 0.949936 0.999137 1398761 4.77E+08
0 0.720513 3.5 0.788571 4.5 0.950022 0.999227 1496692 5.11E+08
0 0.720513 3.5 0.788571 5 0.950091 0.9993 1594627 5.44E+08
0 0.720513 3.5 0.788571 5.5 0.95015 0.99936 1692557 5.78E+08
0 0.720513 3.5 0.788571 6 0.950197 0.999411 1790498 6.11E+08
0 0.720513 3.5 0.788571 6.5 0.950238 0.999454 1888435 6.44E+08
0 0.720513 3.5 0.788571 7 0.950274 0.999492 1986371 6.78E+08
0 0.720513 3.5 0.788571 7.5 0.950305 0.999524 2084308 7.11E+08
0 0.720513 3.5 0.788571 8 0.950332 0.999553 2182246 7.45E+08
0 0.720513 3.5 0.788571 8.5 0.950356 0.999578 2280185 7.78E+08
0 0.720513 3.5 0.788571 9 0.950376 0.999601 2378134 8.11E+08
0 0.720513 3.5 0.788571 9.5 0.950397 0.999621 2476061 8.45E+08
0 0.720513 3.5 0.788571 10 0.950414 0.99964 2574004 8.78E+08
0 0.720513 4 0.788571 3.5 0.949847 0.999043 1360547 4.64E+08
0 0.720513 4 0.788571 4 0.949953 0.999154 1458478 4.98E+08
0 0.720513 4 0.788571 4.5 0.950038 0.999242 1556406 5.31E+08
0 0.720513 4 0.788571 5 0.9501 0.999314 1654357 5.64E+08
0 0.720513 4 0.788571 5.5 0.950159 0.999373 1752284 5.98E+08
0 0.720513 4 0.788571 6 0.950211 0.999423 1850205 6.31E+08
0 0.720513 4 0.788571 6.5 0.950249 0.999465 1948149 6.65E+08
0 0.720513 4 0.788571 7 0.950284 0.999502 2046087 6.98E+08
0 0.720513 4 0.788571 7.5 0.950314 0.999534 2144025 7.32E+08
0 0.720513 4 0.788571 8 0.950341 0.999562 2241962 7.65E+08
0 0.720513 4 0.788571 8.5 0.950365 0.999587 2339896 7.98E+08
0 0.720513 4 0.788571 9 0.950386 0.999609 2437838 8.32E+08
0 0.720513 4 0.788571 9.5 0.950401 0.999629 2535794 8.65E+08
0 0.720513 4 0.788571 10 0.950421 0.999647 2633720 8.99E+08
0 0.720513 4.5 0.788571 3.5 0.949861 0.999058 1420238 4.85E+08
0 0.720513 4.5 0.788571 4 0.949966 0.999168 1518165 5.18E+08
0 0.720513 4.5 0.788571 4.5 0.950048 0.999254 1616095 5.51E+08
0 0.720513 4.5 0.788571 5 0.950115 0.999324 1714029 5.85E+08
0 0.720513 4.5 0.788571 5.5 0.95017 0.999383 1811963 6.18E+08
0 0.720513 4.5 0.788571 6 0.950215 0.999432 1909904 6.52E+08
0 0.720513 4.5 0.788571 6.5 0.950257 0.999473 2007833 6.85E+08
0 0.720513 4.5 0.788571 7 0.95029 0.999509 2105775 7.19E+08
0 0.720513 4.5 0.788571 7.5 0.950321 0.999541 2203710 7.52E+08
0 0.720513 4.5 0.788571 8 0.950346 0.999568 2301652 7.85E+08
0 0.720513 4.5 0.788571 8.5 0.95037 0.999593 2399587 8.19E+08
0 0.720513 4.5 0.788571 9 0.950391 0.999615 2497527 8.52E+08
0 0.720513 4.5 0.788571 9.5 0.950406 0.999634 2595485 8.86E+08
0 0.720513 4.5 0.788571 10 0.950426 0.999652 2693408 9.19E+08
0 0.720513 5 0.788571 3.5 0.949872 0.999069 1480098 5.05E+08
0 0.720513 5 0.788571 4 0.949975 0.999177 1578030 5.38E+08
0 0.720513 5 0.788571 4.5 0.950056 0.999263 1675963 5.72E+08
0 0.720513 5 0.788571 5 0.950122 0.999332 1773898 6.05E+08
0 0.720513 5 0.788571 5.5 0.950177 0.99939 1871833 6.39E+08
70
0 0.720513 5 0.788571 6 0.950224 0.999438 1969765 6.72E+08
0 0.720513 5 0.788571 6.5 0.950262 0.999479 2067705 7.06E+08
0 0.720513 5 0.788571 7 0.950296 0.999515 2165642 7.39E+08
0 0.720513 5 0.788571 7.5 0.950327 0.999546 2263575 7.72E+08
0 0.720513 5 0.788571 8 0.950352 0.999573 2361517 8.06E+08
0 0.720513 5 0.788571 8.5 0.950373 0.999598 2459463 8.39E+08
0 0.720513 5 0.788571 9 0.950394 0.999619 2557403 8.73E+08
0 0.720513 5 0.788571 9.5 0.950416 0.999639 2655322 9.06E+08
0 0.720513 5 0.788571 10 0.950439 0.999656 2753227 9.39E+08
0 0.720513 5.5 0.788571 3.5 0.949882 0.999079 1539774 5.25E+08
0 0.720513 5.5 0.788571 4 0.949984 0.999186 1637703 5.59E+08
0 0.720513 5.5 0.788571 4.5 0.950064 0.999271 1735637 5.92E+08
0 0.720513 5.5 0.788571 5 0.950129 0.999339 1833572 6.26E+08
0 0.720513 5.5 0.788571 5.5 0.950183 0.999396 1931508 6.59E+08
0 0.720513 5.5 0.788571 6 0.950228 0.999444 2029443 6.92E+08
0 0.720513 5.5 0.788571 6.5 0.950268 0.999485 2127378 7.26E+08
0 0.720513 5.5 0.788571 7 0.950301 0.99952 2225319 7.59E+08
0 0.720513 5.5 0.788571 7.5 0.95033 0.999551 2323254 7.93E+08
0 0.720513 5.5 0.788571 8 0.950356 0.999578 2421192 8.26E+08
0 0.720513 5.5 0.788571 8.5 0.950379 0.999602 2519128 8.6E+08
0 0.720513 5.5 0.788571 9 0.950399 0.999623 2617072 8.93E+08
0 0.720513 5.5 0.788571 9.5 0.950417 0.999642 2715009 9.26E+08
0 0.720513 5.5 0.788571 10 0.950434 0.99966 2812945 9.6E+08
0 0.720513 6 0.788571 3.5 0.949888 0.999086 1599620 5.46E+08
0 0.720513 6 0.788571 4 0.949989 0.999192 1697552 5.79E+08
0 0.720513 6 0.788571 4.5 0.950069 0.999276 1795484 6.13E+08
0 0.720513 6 0.788571 5 0.950134 0.999344 1893418 6.46E+08
0 0.720513 6 0.788571 5.5 0.950185 0.999401 1991360 6.79E+08
0 0.720513 6 0.788571 6 0.950233 0.999448 2089289 7.13E+08
0 0.720513 6 0.788571 6.5 0.95027 0.999489 2187231 7.46E+08
0 0.720513 6 0.788571 7 0.950304 0.999524 2285165 7.8E+08
0 0.720513 6 0.788571 7.5 0.950333 0.999554 2383104 8.13E+08
0 0.720513 6 0.788571 8 0.950359 0.999581 2481041 8.47E+08
0 0.720513 6 0.788571 8.5 0.950381 0.999605 2578980 8.8E+08
0 0.720513 6 0.788571 9 0.950399 0.999626 2676931 9.13E+08
0 0.720513 6 0.788571 9.5 0.95042 0.999645 2774855 9.47E+08
0 0.720513 6 0.788571 10 0.950432 0.999662 2872820 9.8E+08
0 0.720513 6.5 0.788571 3.5 0.949894 0.999093 1659505 5.66E+08
0 0.720513 6.5 0.788571 4 0.949995 0.999198 1757434 6E+08
0 0.720513 6.5 0.788571 4.5 0.950074 0.999281 1855369 6.33E+08
0 0.720513 6.5 0.788571 5 0.950138 0.999349 1953304 6.66E+08
0 0.720513 6.5 0.788571 5.5 0.950191 0.999405 2051239 7E+08
0 0.720513 6.5 0.788571 6 0.950237 0.999452 2149173 7.33E+08
0 0.720513 6.5 0.788571 6.5 0.950274 0.999492 2247115 7.67E+08
0 0.720513 6.5 0.788571 7 0.950309 0.999527 2345044 8E+08
0 0.720513 6.5 0.788571 7.5 0.950337 0.999557 2442985 8.34E+08
0 0.720513 6.5 0.788571 8 0.950362 0.999584 2540922 8.67E+08
0 0.720513 6.5 0.788571 8.5 0.950384 0.999607 2638863 9E+08
0 0.720513 6.5 0.788571 9 0.950405 0.999628 2736801 9.34E+08
71
0 0.720513 6.5 0.788571 9.5 0.950422 0.999647 2834744 9.67E+08
0 0.720513 6.5 0.788571 10 0.950438 0.999664 2932682 1E+09
0 0.720513 7 0.788571 3.5 0.9499 0.999098 1719328 5.87E+08
0 0.720513 7 0.788571 4 0.949999 0.999202 1817260 6.2E+08
0 0.720513 7 0.788571 4.5 0.950078 0.999285 1915193 6.53E+08
0 0.720513 7 0.788571 5 0.950142 0.999352 2013125 6.87E+08
0 0.720513 7 0.788571 5.5 0.950194 0.999408 2111064 7.2E+08
0 0.720513 7 0.788571 6 0.950239 0.999455 2209001 7.54E+08
0 0.720513 7 0.788571 6.5 0.950277 0.999495 2306937 7.87E+08
0 0.720513 7 0.788571 7 0.950309 0.999529 2404877 8.21E+08
0 0.720513 7 0.788571 7.5 0.950338 0.99956 2502814 8.54E+08
0 0.720513 7 0.788571 8 0.950363 0.999586 2600753 8.87E+08
0 0.720513 7 0.788571 8.5 0.950387 0.99961 2698687 9.21E+08
0 0.720513 7 0.788571 9 0.950406 0.99963 2796628 9.54E+08
0 0.720513 7 0.788571 9.5 0.950424 0.999649 2894564 9.88E+08
0 0.720513 7 0.788571 10 0.950438 0.999666 2992515 1.02E+09
0 0.720513 7.5 0.788571 3.5 0.949901 0.999102 1779182 6.07E+08
0 0.720513 7.5 0.788571 4 0.950002 0.999206 1877108 6.4E+08
0 0.720513 7.5 0.788571 4.5 0.950081 0.999289 1975041 6.74E+08
0 0.720513 7.5 0.788571 5 0.950145 0.999356 2072975 7.07E+08
0 0.720513 7.5 0.788571 5.5 0.950197 0.999411 2170912 7.41E+08
0 0.720513 7.5 0.788571 6 0.950242 0.999458 2268846 7.74E+08
0 0.720513 7.5 0.788571 6.5 0.950279 0.999497 2366785 8.08E+08
0 0.720513 7.5 0.788571 7 0.95031 0.999532 2464731 8.41E+08
0 0.720513 7.5 0.788571 7.5 0.950341 0.999562 2562660 8.74E+08
0 0.720513 7.5 0.788571 8 0.950365 0.999588 2660598 9.08E+08
0 0.720513 7.5 0.788571 8.5 0.950388 0.999611 2758539 9.41E+08
0 0.720513 7.5 0.788571 9 0.950408 0.999632 2856475 9.75E+08
0 0.720513 7.5 0.788571 9.5 0.950425 0.999651 2954418 1.01E+09
0 0.720513 7.5 0.788571 10 0.950444 0.999668 3052339 1.04E+09
0 0.720513 8 0.788571 3.5 0.949909 0.999106 1839055 6.28E+08
0 0.720513 8 0.788571 4 0.950005 0.99921 1936991 6.61E+08
0 0.720513 8 0.788571 4.5 0.950083 0.999292 2034926 6.94E+08
0 0.720513 8 0.788571 5 0.950146 0.999358 2132861 7.28E+08
0 0.720513 8 0.788571 5.5 0.9502 0.999413 2230793 7.61E+08
0 0.720513 8 0.788571 6 0.950244 0.99946 2328731 7.95E+08
0 0.720513 8 0.788571 6.5 0.950278 0.999499 2426681 8.28E+08
0 0.720513 8 0.788571 7 0.950312 0.999534 2524611 8.61E+08
0 0.720513 8 0.788571 7.5 0.950342 0.999564 2622544 8.95E+08
0 0.720513 8 0.788571 8 0.950367 0.99959 2720481 9.28E+08
0 0.720513 8 0.788571 8.5 0.950389 0.999613 2818423 9.62E+08
0 0.720513 8 0.788571 9 0.950409 0.999634 2916358 9.95E+08
0 0.720513 8 0.788571 9.5 0.950427 0.999652 3014297 1.03E+09
0 0.720513 8 0.788571 10 0.950443 0.999669 3112238 1.06E+09
0 0.720513 8.5 0.788571 3.5 0.94991 0.999109 1898948 6.48E+08
0 0.720513 8.5 0.788571 4 0.950009 0.999212 1996878 6.81E+08
0 0.720513 8.5 0.788571 4.5 0.950083 0.999294 2094819 7.15E+08
0 0.720513 8.5 0.788571 5 0.950149 0.999361 2192748 7.48E+08
0 0.720513 8.5 0.788571 5.5 0.950201 0.999416 2290684 7.82E+08
72
0 0.720513 8.5 0.788571 6 0.950244 0.999462 2388623 8.15E+08
0 0.720513 8.5 0.788571 6.5 0.950283 0.999501 2486555 8.48E+08
0 0.720513 8.5 0.788571 7 0.950315 0.999535 2584495 8.82E+08
0 0.720513 8.5 0.788571 7.5 0.950339 0.999565 2682451 9.15E+08
0 0.720513 8.5 0.788571 8 0.950368 0.999591 2780373 9.49E+08
0 0.720513 8.5 0.788571 8.5 0.950391 0.999614 2878305 9.82E+08
0 0.720513 8.5 0.788571 9 0.950406 0.999635 2976268 1.02E+09
0 0.720513 8.5 0.788571 9.5 0.950428 0.999654 3074188 1.05E+09
0 0.720513 8.5 0.788571 10 0.950445 0.99967 3172122 1.08E+09
0 0.720513 9 0.788571 3.5 0.949913 0.999112 1958858 6.68E+08
0 0.720513 9 0.788571 4 0.950011 0.999215 2056789 7.02E+08
0 0.720513 9 0.788571 4.5 0.950088 0.999296 2154723 7.35E+08
0 0.720513 9 0.788571 5 0.950145 0.999363 2252674 7.69E+08
0 0.720513 9 0.788571 5.5 0.950211 0.999417 2350569 8.02E+08
0 0.720513 9 0.788571 6 0.950245 0.999463 2448537 8.35E+08
0 0.720513 9 0.788571 6.5 0.950284 0.999503 2546468 8.69E+08
0 0.720513 9 0.788571 7 0.950316 0.999537 2644408 9.02E+08
0 0.720513 9 0.788571 7.5 0.950347 0.999566 2742333 9.36E+08
0 0.720513 9 0.788571 8 0.950372 0.999592 2840272 9.69E+08
0 0.720513 9 0.788571 8.5 0.950393 0.999616 2938213 1E+09
0 0.720513 9 0.788571 9 0.950411 0.999636 3036160 1.04E+09
0 0.720513 9 0.788571 9.5 0.950426 0.999655 3134116 1.07E+09
0 0.720513 9 0.788571 10 0.950445 0.999671 3232037 1.1E+09
0 0.720513 9.5 0.788571 3.5 0.949915 0.999115 2018764 6.89E+08
0 0.720513 9.5 0.788571 4 0.950012 0.999217 2116697 7.22E+08
0 0.720513 9.5 0.788571 4.5 0.950092 0.999298 2214622 7.56E+08
0 0.720513 9.5 0.788571 5 0.950153 0.999364 2312561 7.89E+08
0 0.720513 9.5 0.788571 5.5 0.950206 0.999419 2410497 8.22E+08
0 0.720513 9.5 0.788571 6 0.95025 0.999465 2508431 8.56E+08
0 0.720513 9.5 0.788571 6.5 0.950286 0.999504 2606372 8.89E+08
0 0.720513 9.5 0.788571 7 0.950318 0.999538 2704309 9.23E+08
0 0.720513 9.5 0.788571 7.5 0.950346 0.999568 2802248 9.56E+08
0 0.720513 9.5 0.788571 8 0.950372 0.999594 2900182 9.9E+08
0 0.720513 9.5 0.788571 8.5 0.950391 0.999617 2998134 1.02E+09
0 0.720513 9.5 0.788571 9 0.950412 0.999637 3096067 1.06E+09
0 0.720513 9.5 0.788571 9.5 0.950428 0.999656 3194013 1.09E+09
0 0.720513 9.5 0.788571 10 0.950446 0.999672 3291939 1.12E+09
0 0.720513 10 0.788571 3.5 0.949918 0.999117 2078706 7.09E+08
0 0.720513 10 0.788571 4 0.950013 0.999219 2176643 7.43E+08
0 0.720513 10 0.788571 4.5 0.950092 0.9993 2274573 7.76E+08
0 0.720513 10 0.788571 5 0.950155 0.999366 2372505 8.1E+08
0 0.720513 10 0.788571 5.5 0.950206 0.99942 2470444 8.43E+08
0 0.720513 10 0.788571 6 0.950248 0.999466 2568385 8.76E+08
0 0.720513 10 0.788571 6.5 0.950287 0.999505 2666318 9.1E+08
0 0.720513 10 0.788571 7 0.950322 0.999539 2764244 9.43E+08
0 0.720513 10 0.788571 7.5 0.950344 0.999569 2862204 9.77E+08
0 0.720513 10 0.788571 8 0.950372 0.999595 2960131 1.01E+09
0 0.720513 10 0.788571 8.5 0.950394 0.999618 3058067 1.04E+09
0 0.720513 10 0.788571 9 0.950413 0.999638 3156009 1.08E+09
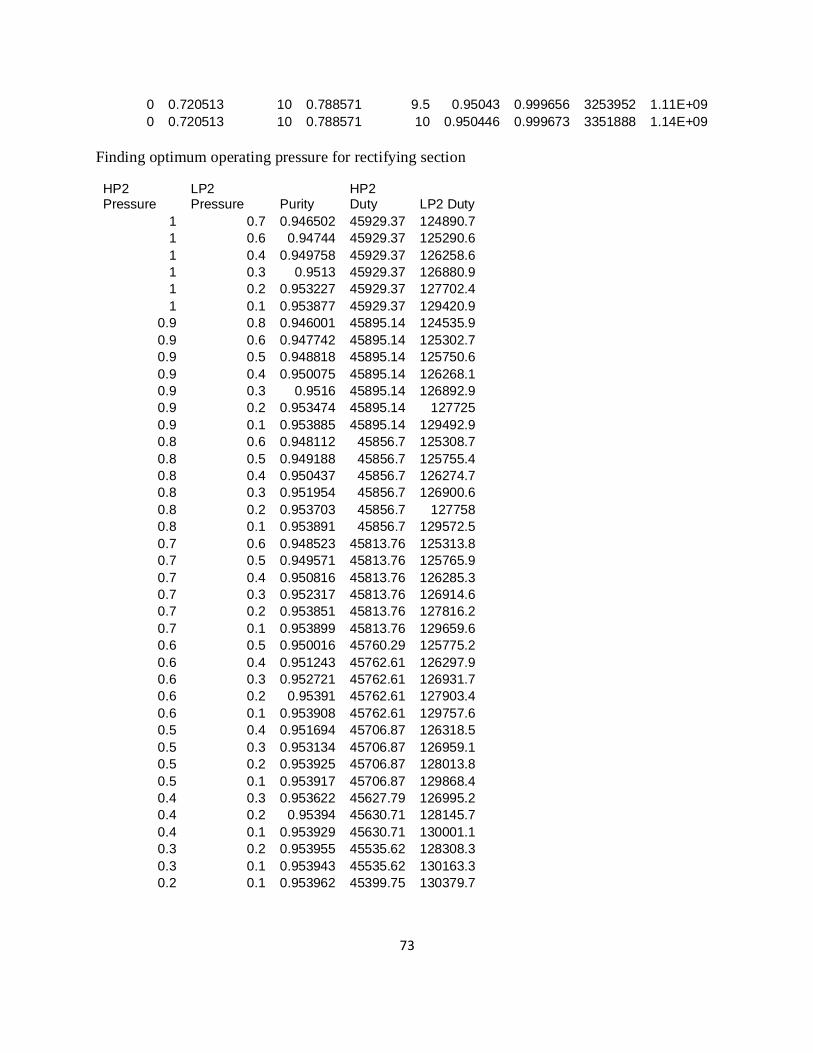
73
0 0.720513 10 0.788571 9.5 0.95043 0.999656 3253952 1.11E+09
0 0.720513 10 0.788571 10 0.950446 0.999673 3351888 1.14E+09
Finding optimum operating pressure for rectifying section HP2 Pressure
LP2 Pressure Purity
HP2 Duty LP2 Duty
1 0.7 0.946502 45929.37 124890.7
1 0.6 0.94744 45929.37 125290.6
1 0.4 0.949758 45929.37 126258.6
1 0.3 0.9513 45929.37 126880.9
1 0.2 0.953227 45929.37 127702.4
1 0.1 0.953877 45929.37 129420.9
0.9 0.8 0.946001 45895.14 124535.9
0.9 0.6 0.947742 45895.14 125302.7
0.9 0.5 0.948818 45895.14 125750.6
0.9 0.4 0.950075 45895.14 126268.1
0.9 0.3 0.9516 45895.14 126892.9
0.9 0.2 0.953474 45895.14 127725
0.9 0.1 0.953885 45895.14 129492.9
0.8 0.6 0.948112 45856.7 125308.7
0.8 0.5 0.949188 45856.7 125755.4
0.8 0.4 0.950437 45856.7 126274.7
0.8 0.3 0.951954 45856.7 126900.6
0.8 0.2 0.953703 45856.7 127758
0.8 0.1 0.953891 45856.7 129572.5
0.7 0.6 0.948523 45813.76 125313.8
0.7 0.5 0.949571 45813.76 125765.9
0.7 0.4 0.950816 45813.76 126285.3
0.7 0.3 0.952317 45813.76 126914.6
0.7 0.2 0.953851 45813.76 127816.2
0.7 0.1 0.953899 45813.76 129659.6
0.6 0.5 0.950016 45760.29 125775.2
0.6 0.4 0.951243 45762.61 126297.9
0.6 0.3 0.952721 45762.61 126931.7
0.6 0.2 0.95391 45762.61 127903.4
0.6 0.1 0.953908 45762.61 129757.6
0.5 0.4 0.951694 45706.87 126318.5
0.5 0.3 0.953134 45706.87 126959.1
0.5 0.2 0.953925 45706.87 128013.8
0.5 0.1 0.953917 45706.87 129868.4
0.4 0.3 0.953622 45627.79 126995.2
0.4 0.2 0.95394 45630.71 128145.7
0.4 0.1 0.953929 45630.71 130001.1
0.3 0.2 0.953955 45535.62 128308.3
0.3 0.1 0.953943 45535.62 130163.3
0.2 0.1 0.953962 45399.75 130379.7
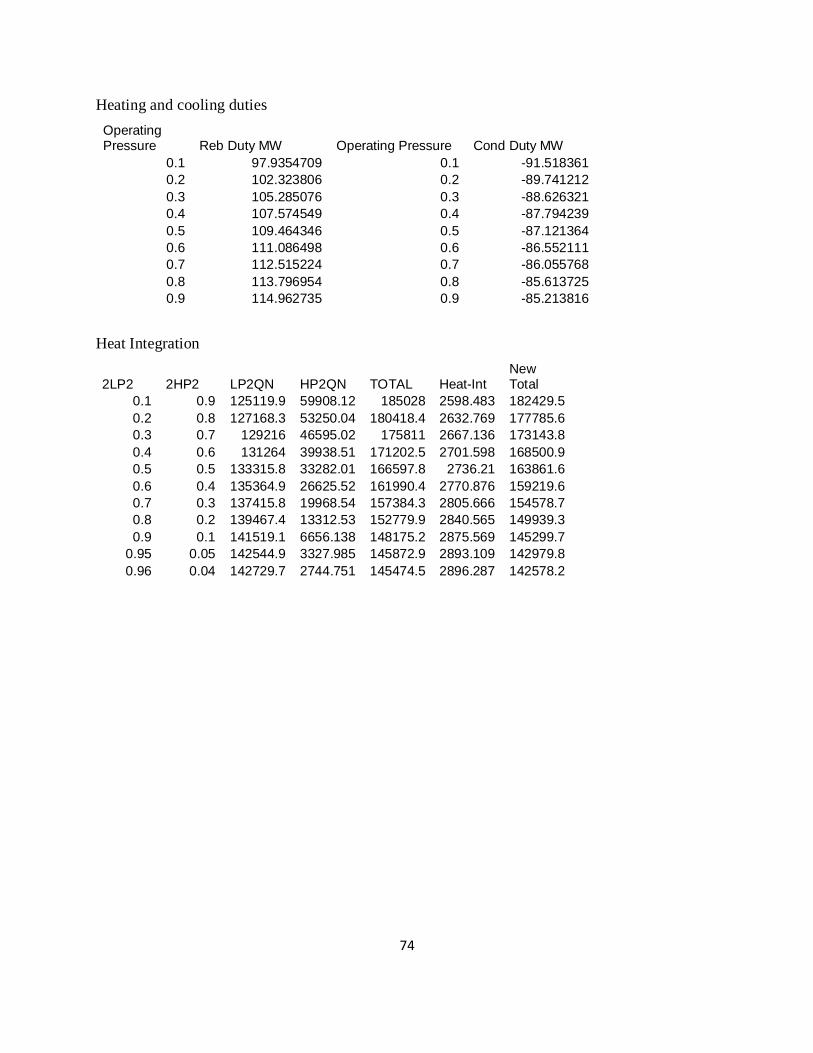
74
Heating and cooling duties
Operating Pressure Reb Duty MW Operating Pressure Cond Duty MW
0.1 97.9354709 0.1 -91.518361
0.2 102.323806 0.2 -89.741212
0.3 105.285076 0.3 -88.626321
0.4 107.574549 0.4 -87.794239
0.5 109.464346 0.5 -87.121364
0.6 111.086498 0.6 -86.552111
0.7 112.515224 0.7 -86.055768
0.8 113.796954 0.8 -85.613725
0.9 114.962735 0.9 -85.213816
Heat Integration
2LP2 2HP2 LP2QN HP2QN TOTAL Heat-Int New Total
0.1 0.9 125119.9 59908.12 185028 2598.483 182429.5
0.2 0.8 127168.3 53250.04 180418.4 2632.769 177785.6
0.3 0.7 129216 46595.02 175811 2667.136 173143.8
0.4 0.6 131264 39938.51 171202.5 2701.598 168500.9
0.5 0.5 133315.8 33282.01 166597.8 2736.21 163861.6
0.6 0.4 135364.9 26625.52 161990.4 2770.876 159219.6
0.7 0.3 137415.8 19968.54 157384.3 2805.666 154578.7
0.8 0.2 139467.4 13312.53 152779.9 2840.565 149939.3
0.9 0.1 141519.1 6656.138 148175.2 2875.569 145299.7
0.95 0.05 142544.9 3327.985 145872.9 2893.109 142979.8
0.96 0.04 142729.7 2744.751 145474.5 2896.287 142578.2
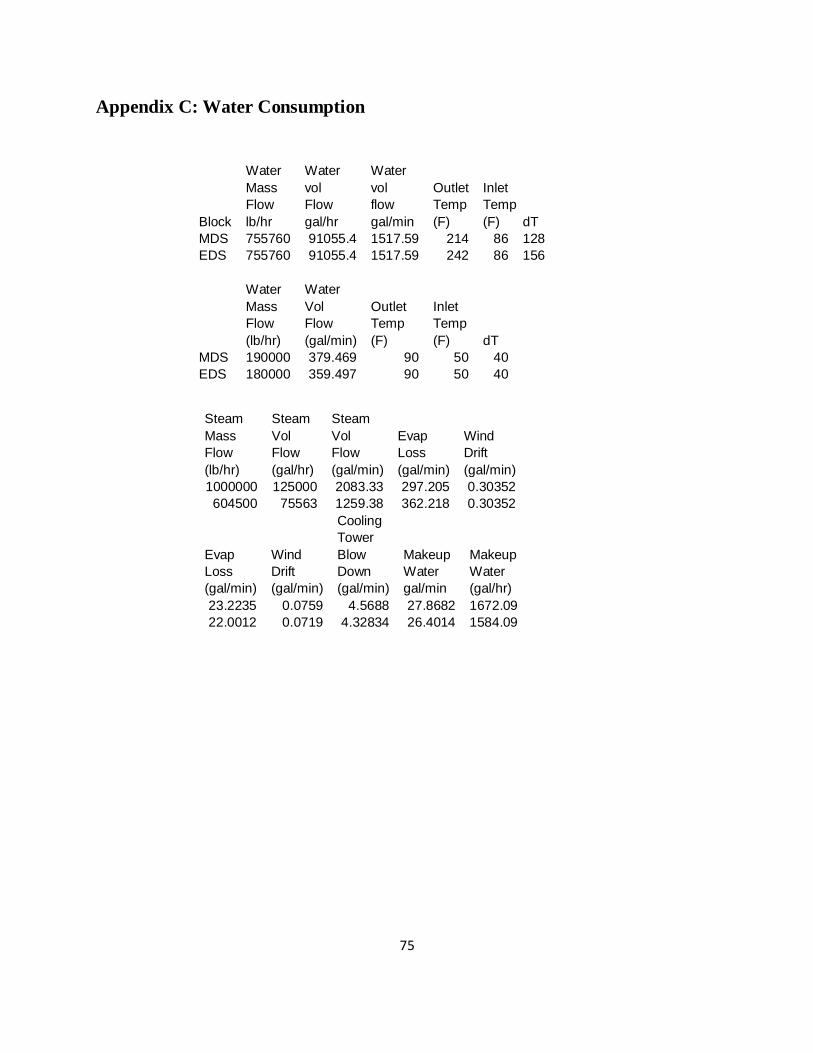
75
Appendix C: Water Consumption
Water Water Water
Mass vol vol Outlet Inlet
Flow Flow flow Temp Temp
Block lb/hr gal/hr gal/min (F) (F) dT
MDS 755760 91055.4 1517.59 214 86 128
EDS 755760 91055.4 1517.59 242 86 156
Water Water
Mass Vol Outlet Inlet
Flow Flow Temp Temp
(lb/hr) (gal/min) (F) (F) dT
MDS 190000 379.469 90 50 40
EDS 180000 359.497 90 50 40
Steam Steam Steam Mass Vol Vol Evap Wind
Flow Flow Flow Loss Drift
(lb/hr) (gal/hr) (gal/min) (gal/min) (gal/min)
1000000 125000 2083.33 297.205 0.30352
604500 75563 1259.38 362.218 0.30352
Cooling
Tower
Evap Wind Blow Makeup Makeup
Loss Drift Down Water Water
(gal/min) (gal/min) (gal/min) gal/min (gal/hr)
23.2235 0.0759 4.5688 27.8682 1672.09
22.0012 0.0719 4.32834 26.4014 1584.09
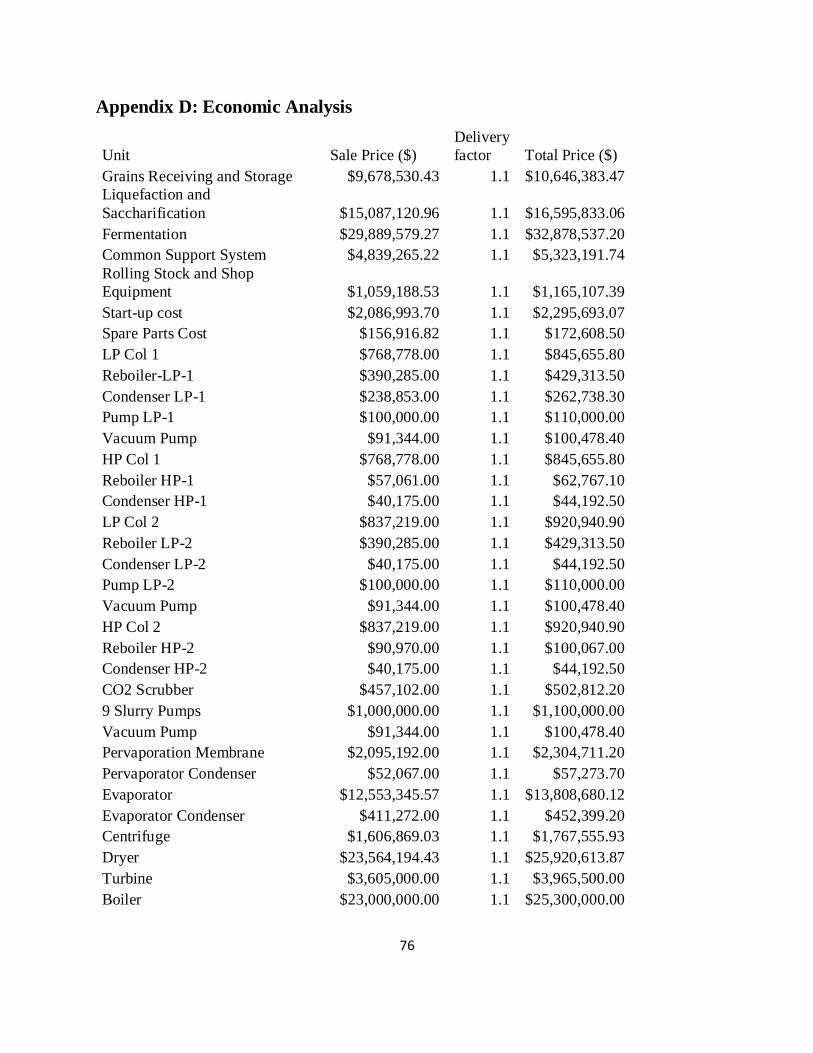
76
Appendix D: Economic Analysis
Unit Sale Price ($)
Delivery
factor Total Price ($)
Grains Receiving and Storage $9,678,530.43 1.1 $10,646,383.47
Liquefaction and
Saccharification $15,087,120.96 1.1 $16,595,833.06
Fermentation $29,889,579.27 1.1 $32,878,537.20
Common Support System $4,839,265.22 1.1 $5,323,191.74
Rolling Stock and Shop
Equipment $1,059,188.53 1.1 $1,165,107.39
Start-up cost $2,086,993.70 1.1 $2,295,693.07
Spare Parts Cost $156,916.82 1.1 $172,608.50
LP Col 1 $768,778.00 1.1 $845,655.80
Reboiler-LP-1 $390,285.00 1.1 $429,313.50
Condenser LP-1 $238,853.00 1.1 $262,738.30
Pump LP-1 $100,000.00 1.1 $110,000.00
Vacuum Pump $91,344.00 1.1 $100,478.40
HP Col 1 $768,778.00 1.1 $845,655.80
Reboiler HP-1 $57,061.00 1.1 $62,767.10
Condenser HP-1 $40,175.00 1.1 $44,192.50
LP Col 2 $837,219.00 1.1 $920,940.90
Reboiler LP-2 $390,285.00 1.1 $429,313.50
Condenser LP-2 $40,175.00 1.1 $44,192.50
Pump LP-2 $100,000.00 1.1 $110,000.00
Vacuum Pump $91,344.00 1.1 $100,478.40
HP Col 2 $837,219.00 1.1 $920,940.90
Reboiler HP-2 $90,970.00 1.1 $100,067.00
Condenser HP-2 $40,175.00 1.1 $44,192.50
CO2 Scrubber $457,102.00 1.1 $502,812.20
9 Slurry Pumps $1,000,000.00 1.1 $1,100,000.00
Vacuum Pump $91,344.00 1.1 $100,478.40
Pervaporation Membrane $2,095,192.00 1.1 $2,304,711.20
Pervaporator Condenser $52,067.00 1.1 $57,273.70
Evaporator $12,553,345.57 1.1 $13,808,680.12
Evaporator Condenser $411,272.00 1.1 $452,399.20
Centrifuge $1,606,869.03 1.1 $1,767,555.93
Dryer $23,564,194.43 1.1 $25,920,613.87
Turbine $3,605,000.00 1.1 $3,965,500.00
Boiler $23,000,000.00 1.1 $25,300,000.00
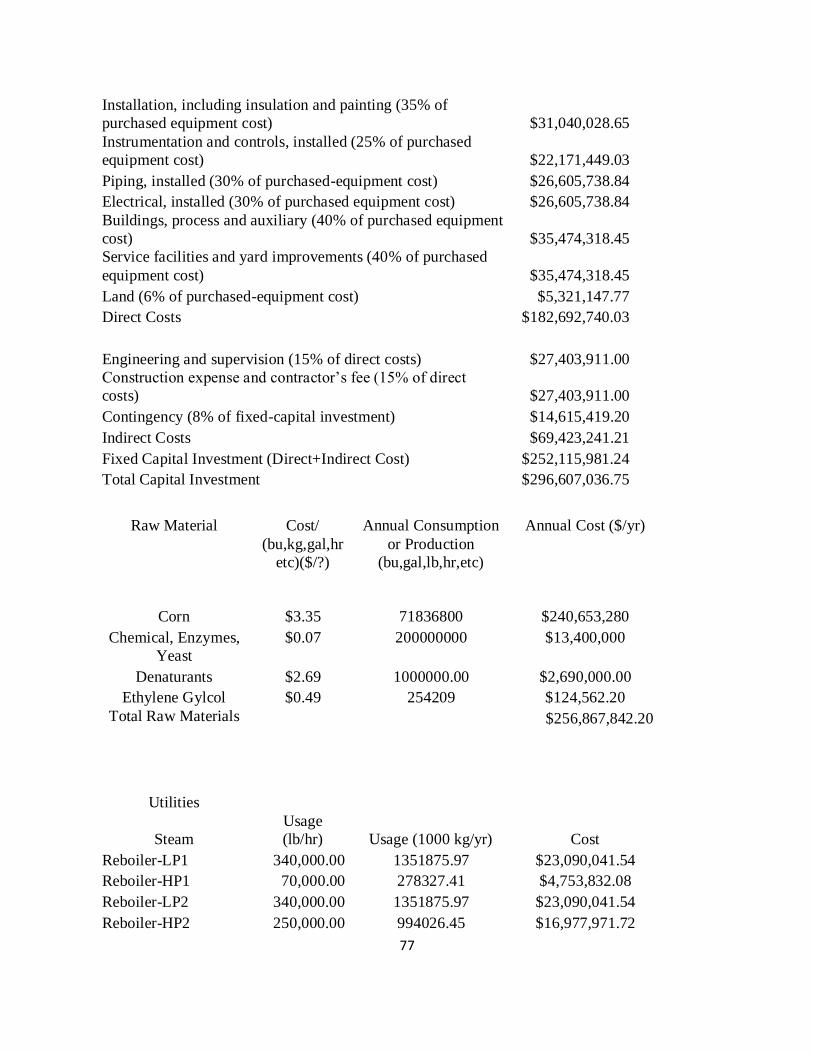
77
Installation, including insulation and painting (35% of
purchased equipment cost) $31,040,028.65
Instrumentation and controls, installed (25% of purchased
equipment cost) $22,171,449.03
Piping, installed (30% of purchased-equipment cost)
$26,605,738.84
Electrical, installed (30% of purchased equipment cost)
$26,605,738.84
Buildings, process and auxiliary (40% of purchased equipment
cost) $35,474,318.45
Service facilities and yard improvements (40% of purchased
equipment cost) $35,474,318.45
Land (6% of purchased-equipment cost)
$5,321,147.77
Direct Costs
$182,692,740.03
Engineering and supervision (15% of direct costs)
$27,403,911.00
Construction expense and contractor’s fee (15% of direct
costs) $27,403,911.00
Contingency (8% of fixed-capital investment)
$14,615,419.20
Indirect Costs
$69,423,241.21
Fixed Capital Investment (Direct+Indirect Cost)
$252,115,981.24
Total Capital Investment
$296,607,036.75
Raw Material Cost/
(bu,kg,gal,hr
etc)($/?)
Annual Consumption
or Production
(bu,gal,lb,hr,etc)
Annual Cost ($/yr)
Corn $3.35 71836800 $240,653,280
Chemical, Enzymes,
Yeast
$0.07 200000000 $13,400,000
Denaturants $2.69 1000000.00 $2,690,000.00
Ethylene Gylcol $0.49 254209 $124,562.20
Total Raw Materials
$256,867,842.20
Utilities
Steam
Usage
(lb/hr) Usage (1000 kg/yr) Cost
Reboiler-LP1 340,000.00 1351875.97 $23,090,041.54
Reboiler-HP1 70,000.00 278327.41 $4,753,832.08
Reboiler-LP2 340,000.00 1351875.97 $23,090,041.54
Reboiler-HP2 250,000.00 994026.45 $16,977,971.72
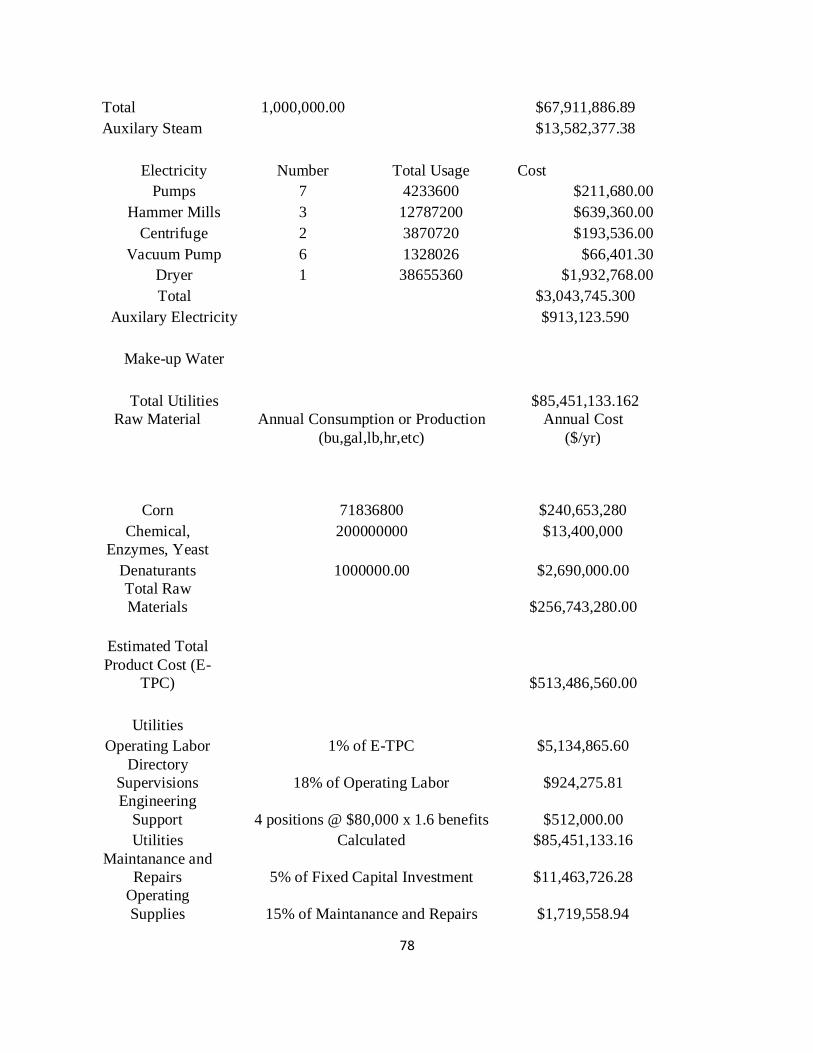
78
Total 1,000,000.00
$67,911,886.89
Auxilary Steam
$13,582,377.38
Electricity Number Total Usage Cost
Pumps 7 4233600 $211,680.00
Hammer Mills 3 12787200 $639,360.00
Centrifuge 2 3870720 $193,536.00
Vacuum Pump 6 1328026 $66,401.30
Dryer 1 38655360 $1,932,768.00
Total
$3,043,745.300
Auxilary Electricity
$913,123.590
Make-up Water
Total Utilities
$85,451,133.162
Raw Material Annual Consumption or Production
(bu,gal,lb,hr,etc)
Annual Cost
($/yr)
Corn 71836800 $240,653,280
Chemical,
Enzymes, Yeast
200000000 $13,400,000
Denaturants 1000000.00 $2,690,000.00
Total Raw
Materials
$256,743,280.00
Estimated Total
Product Cost (E-
TPC)
$513,486,560.00
Utilities
Operating Labor 1% of E-TPC $5,134,865.60
Directory
Supervisions 18% of Operating Labor $924,275.81
Engineering
Support 4 positions @ $80,000 x 1.6 benefits $512,000.00
Utilities Calculated $85,451,133.16
Maintanance and
Repairs 5% of Fixed Capital Investment $11,463,726.28
Operating
Supplies 15% of Maintanance and Repairs $1,719,558.94
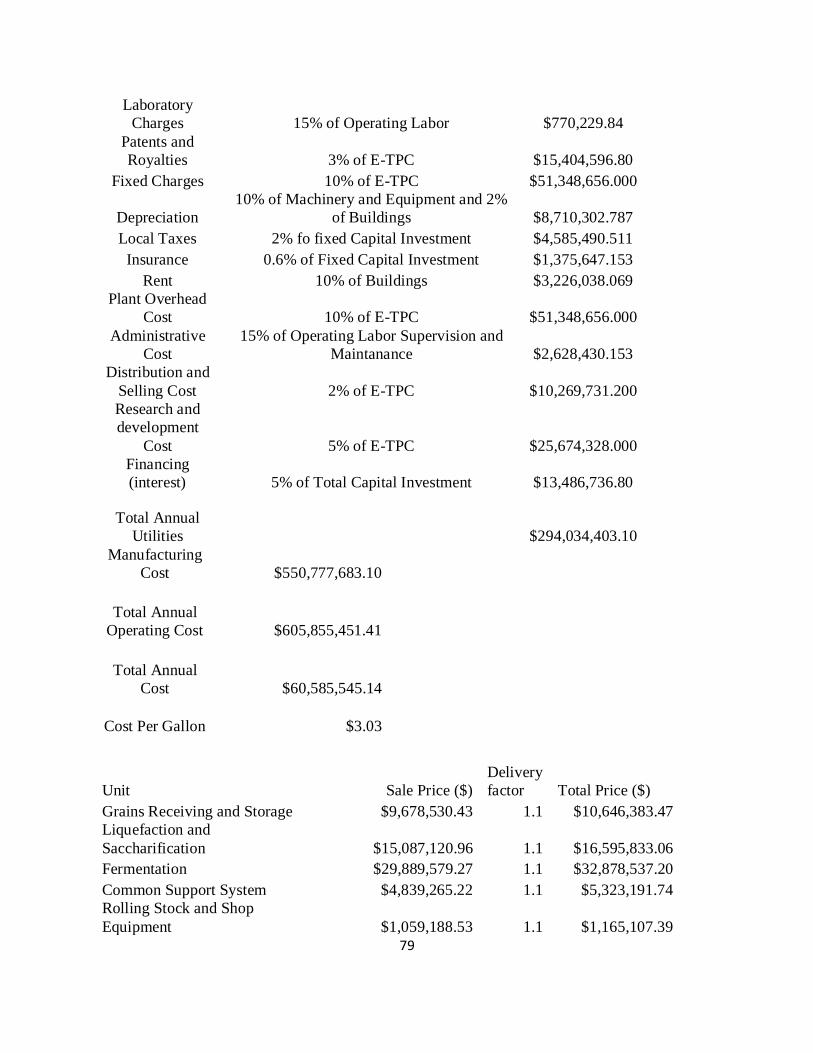
79
Laboratory
Charges 15% of Operating Labor $770,229.84
Patents and
Royalties 3% of E-TPC $15,404,596.80
Fixed Charges 10% of E-TPC $51,348,656.000
Depreciation
10% of Machinery and Equipment and 2%
of Buildings $8,710,302.787
Local Taxes 2% fo fixed Capital Investment $4,585,490.511
Insurance 0.6% of Fixed Capital Investment $1,375,647.153
Rent 10% of Buildings $3,226,038.069
Plant Overhead
Cost 10% of E-TPC $51,348,656.000
Administrative
Cost
15% of Operating Labor Supervision and
Maintanance $2,628,430.153
Distribution and
Selling Cost 2% of E-TPC $10,269,731.200
Research and
development
Cost 5% of E-TPC $25,674,328.000
Financing
(interest) 5% of Total Capital Investment $13,486,736.80
Total Annual
Utilities
$294,034,403.10
Manufacturing
Cost $550,777,683.10
Total Annual
Operating Cost $605,855,451.41
Total Annual
Cost $60,585,545.14
Cost Per Gallon $3.03
Unit Sale Price ($)
Delivery
factor Total Price ($)
Grains Receiving and Storage $9,678,530.43 1.1 $10,646,383.47
Liquefaction and
Saccharification $15,087,120.96 1.1 $16,595,833.06
Fermentation $29,889,579.27 1.1 $32,878,537.20
Common Support System $4,839,265.22 1.1 $5,323,191.74
Rolling Stock and Shop
Equipment $1,059,188.53 1.1 $1,165,107.39
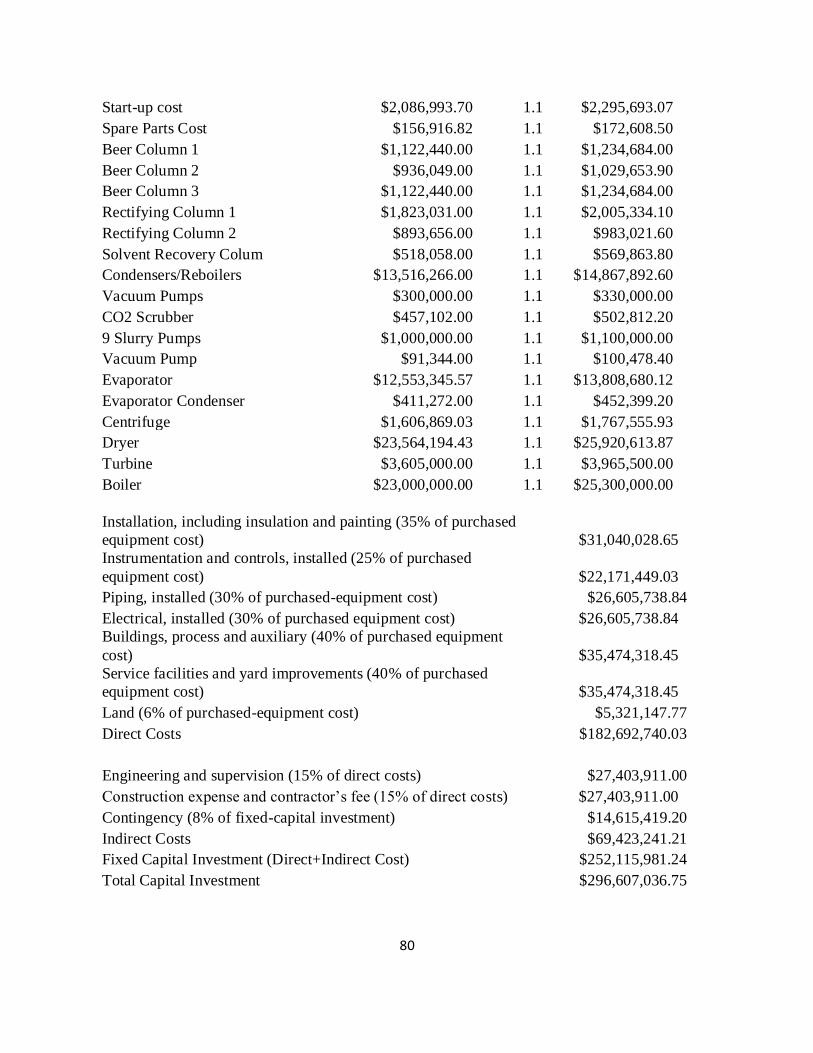
80
Start-up cost $2,086,993.70 1.1 $2,295,693.07
Spare Parts Cost $156,916.82 1.1 $172,608.50
Beer Column 1 $1,122,440.00 1.1 $1,234,684.00
Beer Column 2 $936,049.00 1.1 $1,029,653.90
Beer Column 3 $1,122,440.00 1.1 $1,234,684.00
Rectifying Column 1 $1,823,031.00 1.1 $2,005,334.10
Rectifying Column 2 $893,656.00 1.1 $983,021.60
Solvent Recovery Colum $518,058.00 1.1 $569,863.80
Condensers/Reboilers $13,516,266.00 1.1 $14,867,892.60
Vacuum Pumps $300,000.00 1.1 $330,000.00
CO2 Scrubber $457,102.00 1.1 $502,812.20
9 Slurry Pumps $1,000,000.00 1.1 $1,100,000.00
Vacuum Pump $91,344.00 1.1 $100,478.40
Evaporator $12,553,345.57 1.1 $13,808,680.12
Evaporator Condenser $411,272.00 1.1 $452,399.20
Centrifuge $1,606,869.03 1.1 $1,767,555.93
Dryer $23,564,194.43 1.1 $25,920,613.87
Turbine $3,605,000.00 1.1 $3,965,500.00
Boiler $23,000,000.00 1.1 $25,300,000.00
Installation, including insulation and painting (35% of purchased
equipment cost) $31,040,028.65
Instrumentation and controls, installed (25% of purchased
equipment cost) $22,171,449.03
Piping, installed (30% of purchased-equipment cost)
$26,605,738.84
Electrical, installed (30% of purchased equipment cost) $26,605,738.84
Buildings, process and auxiliary (40% of purchased equipment
cost) $35,474,318.45
Service facilities and yard improvements (40% of purchased
equipment cost) $35,474,318.45
Land (6% of purchased-equipment cost)
$5,321,147.77
Direct Costs
$182,692,740.03
Engineering and supervision (15% of direct costs)
$27,403,911.00
Construction expense and contractor’s fee (15% of direct costs) $27,403,911.00
Contingency (8% of fixed-capital investment)
$14,615,419.20
Indirect Costs
$69,423,241.21
Fixed Capital Investment (Direct+Indirect Cost)
$252,115,981.24
Total Capital Investment
$296,607,036.75
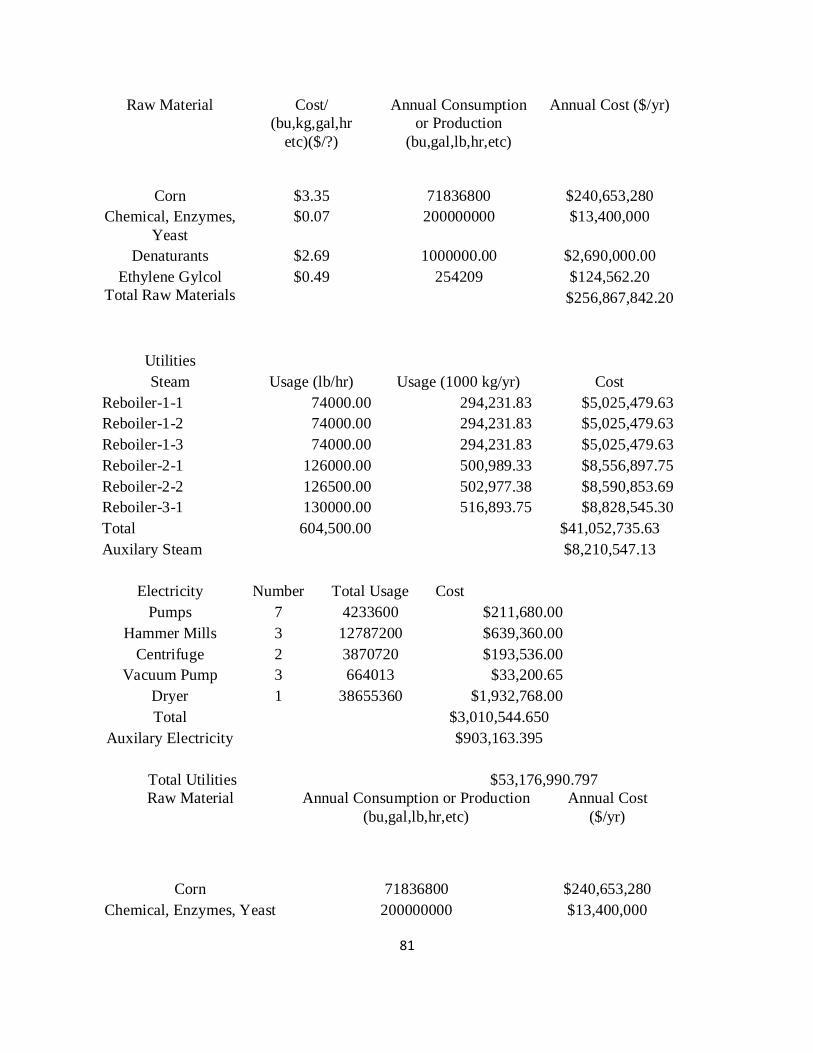
81
Raw Material Cost/
(bu,kg,gal,hr
etc)($/?)
Annual Consumption
or Production
(bu,gal,lb,hr,etc)
Annual Cost ($/yr)
Corn $3.35 71836800 $240,653,280
Chemical, Enzymes,
Yeast
$0.07 200000000 $13,400,000
Denaturants $2.69 1000000.00 $2,690,000.00
Ethylene Gylcol $0.49 254209 $124,562.20
Total Raw Materials
$256,867,842.20
Utilities
Steam Usage (lb/hr) Usage (1000 kg/yr) Cost
Reboiler-1-1 74000.00 294,231.83 $5,025,479.63
Reboiler-1-2 74000.00 294,231.83 $5,025,479.63
Reboiler-1-3 74000.00 294,231.83 $5,025,479.63
Reboiler-2-1 126000.00 500,989.33 $8,556,897.75
Reboiler-2-2 126500.00 502,977.38 $8,590,853.69
Reboiler-3-1 130000.00 516,893.75 $8,828,545.30
Total 604,500.00
$41,052,735.63
Auxilary Steam
$8,210,547.13
Electricity Number Total Usage Cost
Pumps 7 4233600 $211,680.00
Hammer Mills 3 12787200 $639,360.00
Centrifuge 2 3870720 $193,536.00
Vacuum Pump 3 664013 $33,200.65
Dryer 1 38655360 $1,932,768.00
Total
$3,010,544.650
Auxilary Electricity
$903,163.395
Total Utilities
$53,176,990.797
Raw Material Annual Consumption or Production
(bu,gal,lb,hr,etc)
Annual Cost
($/yr)
Corn 71836800 $240,653,280
Chemical, Enzymes, Yeast 200000000 $13,400,000
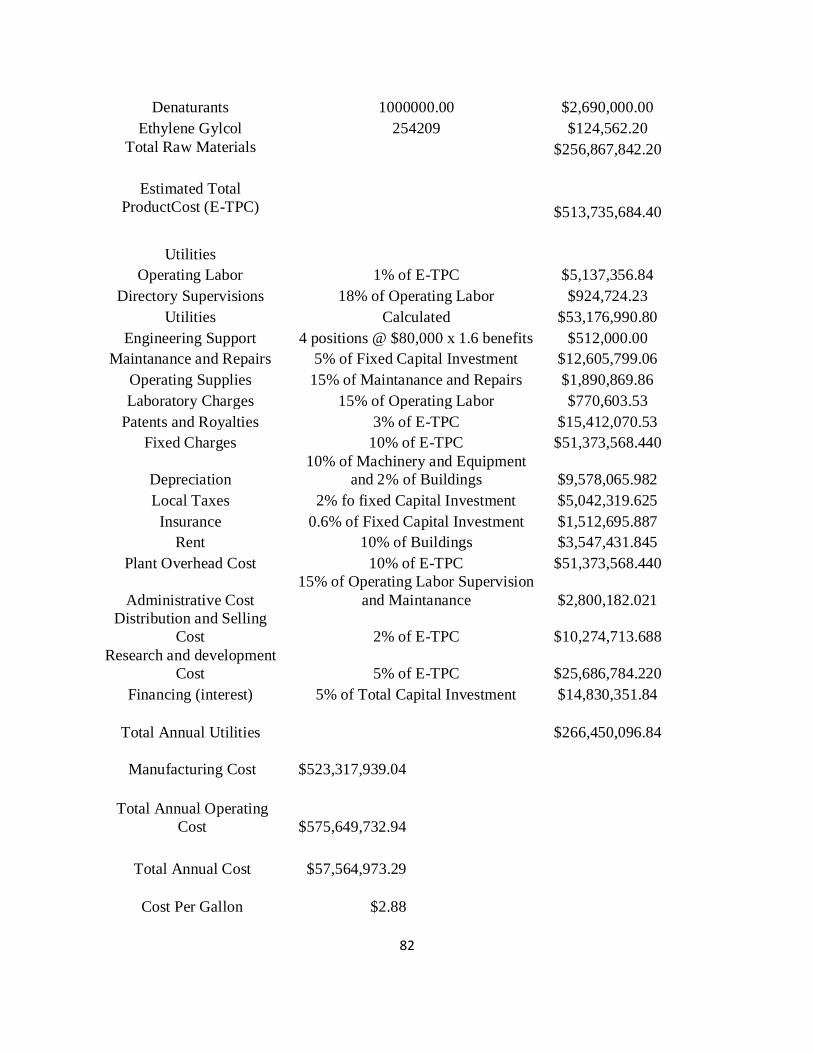
82
Denaturants 1000000.00 $2,690,000.00
Ethylene Gylcol 254209 $124,562.20
Total Raw Materials
$256,867,842.20
Estimated Total
ProductCost (E-TPC)
$513,735,684.40
Utilities
Operating Labor 1% of E-TPC $5,137,356.84
Directory Supervisions 18% of Operating Labor $924,724.23
Utilities Calculated $53,176,990.80
Engineering Support 4 positions @ $80,000 x 1.6 benefits $512,000.00
Maintanance and Repairs 5% of Fixed Capital Investment $12,605,799.06
Operating Supplies 15% of Maintanance and Repairs $1,890,869.86
Laboratory Charges 15% of Operating Labor $770,603.53
Patents and Royalties 3% of E-TPC $15,412,070.53
Fixed Charges 10% of E-TPC $51,373,568.440
Depreciation
10% of Machinery and Equipment
and 2% of Buildings $9,578,065.982
Local Taxes 2% fo fixed Capital Investment $5,042,319.625
Insurance 0.6% of Fixed Capital Investment $1,512,695.887
Rent 10% of Buildings $3,547,431.845
Plant Overhead Cost 10% of E-TPC $51,373,568.440
Administrative Cost
15% of Operating Labor Supervision
and Maintanance $2,800,182.021
Distribution and Selling
Cost 2% of E-TPC $10,274,713.688
Research and development
Cost 5% of E-TPC $25,686,784.220
Financing (interest) 5% of Total Capital Investment $14,830,351.84
Total Annual Utilities
$266,450,096.84
Manufacturing Cost $523,317,939.04
Total Annual Operating
Cost $575,649,732.94
Total Annual Cost $57,564,973.29
Cost Per Gallon $2.88

83
i Refer to Section 5.3 ii Refer to Section 5.3