Embed Size (px)
Citation preview
HAL Id: hal-01340000https://hal.archives-ouvertes.fr/hal-01340000
Submitted on 12 Jul 2016
HAL is a multi-disciplinary open accessarchive for the deposit and dissemination of sci-entific research documents, whether they are pub-lished or not. The documents may come fromteaching and research institutions in France orabroad, or from public or private research centers.
L’archive ouverte pluridisciplinaire HAL, estdestinée au dépôt et à la diffusion de documentsscientifiques de niveau recherche, publiés ou non,émanant des établissements d’enseignement et derecherche français ou étrangers, des laboratoirespublics ou privés.
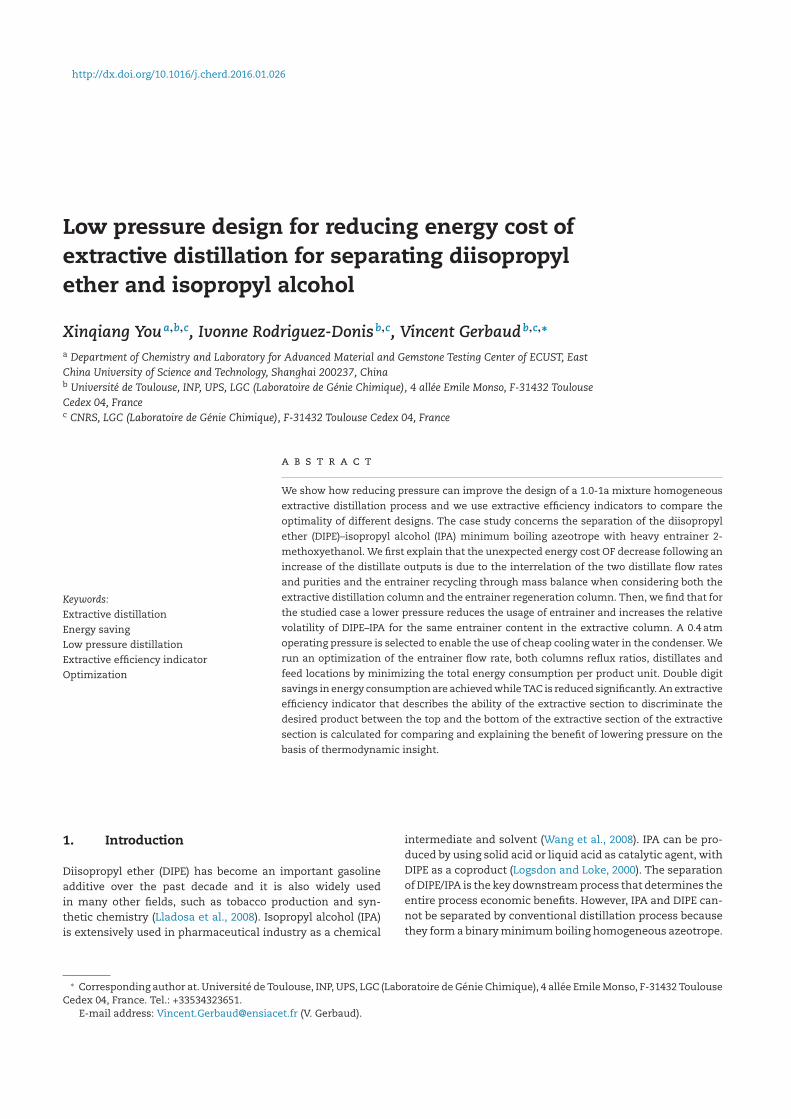
Low pressure design for reducing energy cost ofextractive distillation for separating Diisopropyl ether
and Isopropyl alcoholXinqiang You, Ivonne Rodriguez-Donis, Vincent Gerbaud
To cite this version:Xinqiang You, Ivonne Rodriguez-Donis, Vincent Gerbaud. Low pressure design for reducing energycost of extractive distillation for separating Diisopropyl ether and Isopropyl alcohol. Chemical En-gineering Research and Design, Elsevier, 2016, 109, pp.540-552. �10.1016/j.cherd.2016.01.026�. �hal-01340000�

Open Archive TOULOUSE Archive Ouverte (OATAO) OATAO is an open access repository that collects the work of Toulouse researchers and makes it freely available over the web where possible.
This is an author-deposited version published in : http://oatao.univ-toulouse.fr/ Eprints ID : 15864
To link to this article : DOI : 10.1016/j.cherd.2016.01.026URL : http://dx.doi.org/10.1016/j.cherd.2016.01.026
To cite this version : You, Xinqiang and Rodriguez-Donis, Ivonne and Gerbaud, Vincent Low pressure design for reducing energy cost of extractive distillation for separating Diisopropyl ether and Isopropyl alcohol. (2016) Chemical Engineering Research and Design, vol. 109. pp. 540-552. ISSN 0263-8762
Any correspondence concerning this service should be sent to the repository
administrator: [email protected]
Low pressure design for reducing energy cost of
extractive distillation for separating diisopropyl
ether and isopropyl alcohol
Xinqiang Youa,b,c, Ivonne RodriguezDonisb,c, Vincent Gerbaudb,c,∗
a Department of Chemistry and Laboratory for Advanced Material and Gemstone Testing Center of ECUST, East
China University of Science and Technology, Shanghai 200237, Chinab Université de Toulouse, INP, UPS, LGC (Laboratoire de Génie Chimique), 4 allée Emile Monso, F31432 Toulouse
Cedex 04, Francec CNRS, LGC (Laboratoire de Génie Chimique), F31432 Toulouse Cedex 04, France
Keywords:
Extractive distillation
Energy saving
Low pressure distillation
Extractive efficiency indicator
Optimization
a b s t r a c t
We show how reducing pressure can improve the design of a 1.01a mixture homogeneous
extractive distillation process and we use extractive efficiency indicators to compare the
optimality of different designs. The case study concerns the separation of the diisopropyl
ether (DIPE)–isopropyl alcohol (IPA) minimum boiling azeotrope with heavy entrainer 2
methoxyethanol. We first explain that the unexpected energy cost OF decrease following an
increase of the distillate outputs is due to the interrelation of the two distillate flow rates
and purities and the entrainer recycling through mass balance when considering both the
extractive distillation column and the entrainer regeneration column. Then, we find that for
the studied case a lower pressure reduces the usage of entrainer and increases the relative
volatility of DIPE–IPA for the same entrainer content in the extractive column. A 0.4 atm
operating pressure is selected to enable the use of cheap cooling water in the condenser. We
run an optimization of the entrainer flow rate, both columns reflux ratios, distillates and
feed locations by minimizing the total energy consumption per product unit. Double digit
savings in energy consumption are achieved while TAC is reduced significantly. An extractive
efficiency indicator that describes the ability of the extractive section to discriminate the
desired product between the top and the bottom of the extractive section of the extractive
section is calculated for comparing and explaining the benefit of lowering pressure on the
basis of thermodynamic insight.
1. Introduction
Diisopropyl ether (DIPE) has become an important gasoline
additive over the past decade and it is also widely used
in many other fields, such as tobacco production and syn
thetic chemistry (Lladosa et al., 2008). Isopropyl alcohol (IPA)
is extensively used in pharmaceutical industry as a chemical
∗ Corresponding author at. Université de Toulouse, INP, UPS, LGC (Laboratoire de Génie Chimique), 4 allée Emile Monso, F31432 ToulouseCedex 04, France. Tel.: +33534323651.
Email address: [email protected] (V. Gerbaud).
intermediate and solvent (Wang et al., 2008). IPA can be pro
duced by using solid acid or liquid acid as catalytic agent, with
DIPE as a coproduct (Logsdon and Loke, 2000). The separation
of DIPE/IPA is the key downstream process that determines the
entire process economic benefits. However, IPA and DIPE can
not be separated by conventional distillation process because
they form a binary minimum boiling homogeneous azeotrope.
http://dx.doi.org/10.1016/j.cherd.2016.01.026
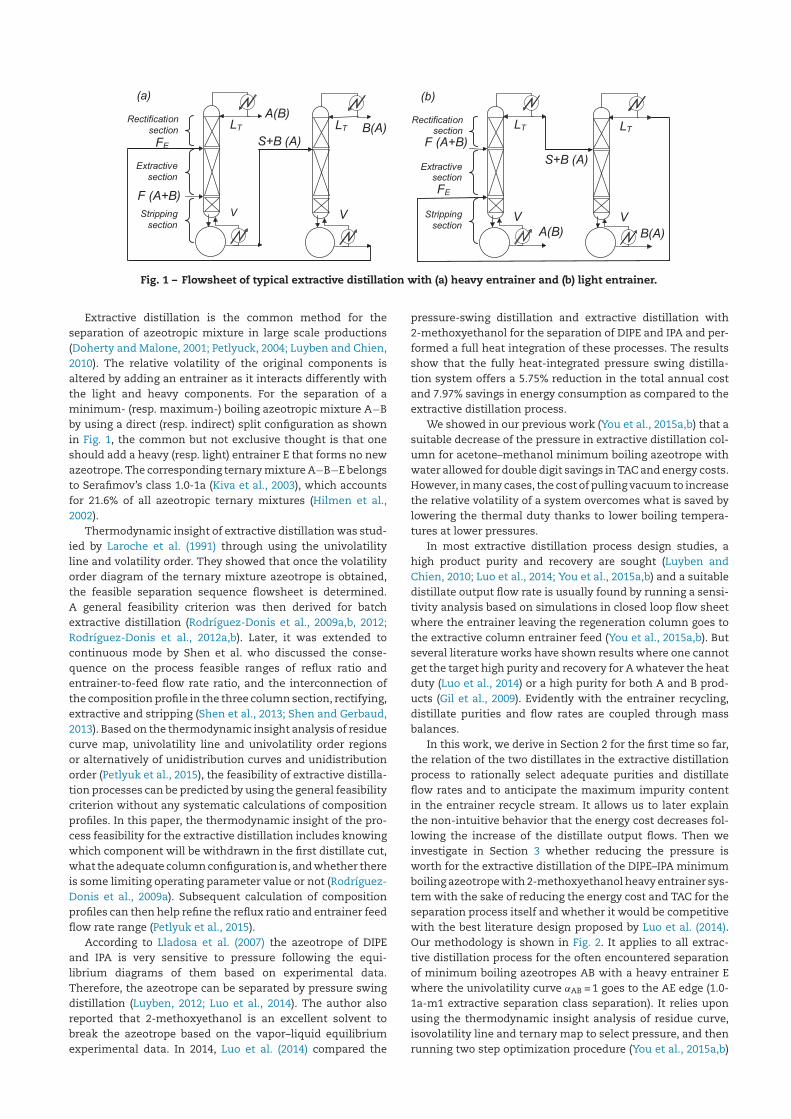
(a)
FE
F (A+B)
A(B)
Extractive
section
Rectification
section
Stripping
section
V
LT
S+B (A)B(A)
V
LT
(b)
FE
F (A+B)
A(B)
Extractivesection
Rectificationsection
Stripping
sectionV
LT
S+B (A)
B(A)
V
LT
Fig. 1 – Flowsheet of typical extractive distillation with (a) heavy entrainer and (b) light entrainer.
Extractive distillation is the common method for the
separation of azeotropic mixture in large scale productions
(Doherty and Malone, 2001; Petlyuck, 2004; Luyben and Chien,
2010). The relative volatility of the original components is
altered by adding an entrainer as it interacts differently with
the light and heavy components. For the separation of a
minimum (resp. maximum) boiling azeotropic mixture A−B
by using a direct (resp. indirect) split configuration as shown
in Fig. 1, the common but not exclusive thought is that one
should add a heavy (resp. light) entrainer E that forms no new
azeotrope. The corresponding ternary mixture A−B−E belongs
to Serafimov’s class 1.01a (Kiva et al., 2003), which accounts
for 21.6% of all azeotropic ternary mixtures (Hilmen et al.,
2002).
Thermodynamic insight of extractive distillation was stud
ied by Laroche et al. (1991) through using the univolatility
line and volatility order. They showed that once the volatility
order diagram of the ternary mixture azeotrope is obtained,
the feasible separation sequence flowsheet is determined.
A general feasibility criterion was then derived for batch
extractive distillation (RodríguezDonis et al., 2009a,b, 2012;
RodríguezDonis et al., 2012a,b). Later, it was extended to
continuous mode by Shen et al. who discussed the conse
quence on the process feasible ranges of reflux ratio and
entrainertofeed flow rate ratio, and the interconnection of
the composition profile in the three column section, rectifying,
extractive and stripping (Shen et al., 2013; Shen and Gerbaud,
2013). Based on the thermodynamic insight analysis of residue
curve map, univolatility line and univolatility order regions
or alternatively of unidistribution curves and unidistribution
order (Petlyuk et al., 2015), the feasibility of extractive distilla
tion processes can be predicted by using the general feasibility
criterion without any systematic calculations of composition
profiles. In this paper, the thermodynamic insight of the pro
cess feasibility for the extractive distillation includes knowing
which component will be withdrawn in the first distillate cut,
what the adequate column configuration is, and whether there
is some limiting operating parameter value or not (Rodríguez
Donis et al., 2009a). Subsequent calculation of composition
profiles can then help refine the reflux ratio and entrainer feed
flow rate range (Petlyuk et al., 2015).
According to Lladosa et al. (2007) the azeotrope of DIPE
and IPA is very sensitive to pressure following the equi
librium diagrams of them based on experimental data.
Therefore, the azeotrope can be separated by pressure swing
distillation (Luyben, 2012; Luo et al., 2014). The author also
reported that 2methoxyethanol is an excellent solvent to
break the azeotrope based on the vapor–liquid equilibrium
experimental data. In 2014, Luo et al. (2014) compared the
pressureswing distillation and extractive distillation with
2methoxyethanol for the separation of DIPE and IPA and per
formed a full heat integration of these processes. The results
show that the fully heatintegrated pressure swing distilla
tion system offers a 5.75% reduction in the total annual cost
and 7.97% savings in energy consumption as compared to the
extractive distillation process.
We showed in our previous work (You et al., 2015a,b) that a
suitable decrease of the pressure in extractive distillation col
umn for acetone–methanol minimum boiling azeotrope with
water allowed for double digit savings in TAC and energy costs.
However, in many cases, the cost of pulling vacuum to increase
the relative volatility of a system overcomes what is saved by
lowering the thermal duty thanks to lower boiling tempera
tures at lower pressures.
In most extractive distillation process design studies, a
high product purity and recovery are sought (Luyben and
Chien, 2010; Luo et al., 2014; You et al., 2015a,b) and a suitable
distillate output flow rate is usually found by running a sensi
tivity analysis based on simulations in closed loop flow sheet
where the entrainer leaving the regeneration column goes to
the extractive column entrainer feed (You et al., 2015a,b). But
several literature works have shown results where one cannot
get the target high purity and recovery for A whatever the heat
duty (Luo et al., 2014) or a high purity for both A and B prod
ucts (Gil et al., 2009). Evidently with the entrainer recycling,
distillate purities and flow rates are coupled through mass
balances.
In this work, we derive in Section 2 for the first time so far,
the relation of the two distillates in the extractive distillation
process to rationally select adequate purities and distillate
flow rates and to anticipate the maximum impurity content
in the entrainer recycle stream. It allows us to later explain
the nonintuitive behavior that the energy cost decreases fol
lowing the increase of the distillate output flows. Then we
investigate in Section 3 whether reducing the pressure is
worth for the extractive distillation of the DIPE–IPA minimum
boiling azeotrope with 2methoxyethanol heavy entrainer sys
tem with the sake of reducing the energy cost and TAC for the
separation process itself and whether it would be competitive
with the best literature design proposed by Luo et al. (2014).
Our methodology is shown in Fig. 2. It applies to all extrac
tive distillation process for the often encountered separation
of minimum boiling azeotropes AB with a heavy entrainer E
where the univolatility curve ˛AB = 1 goes to the AE edge (1.0
1am1 extractive separation class separation). It relies upon
using the thermodynamic insight analysis of residue curve,
isovolatility line and ternary map to select pressure, and then
running two step optimization procedure (You et al., 2015a,b)
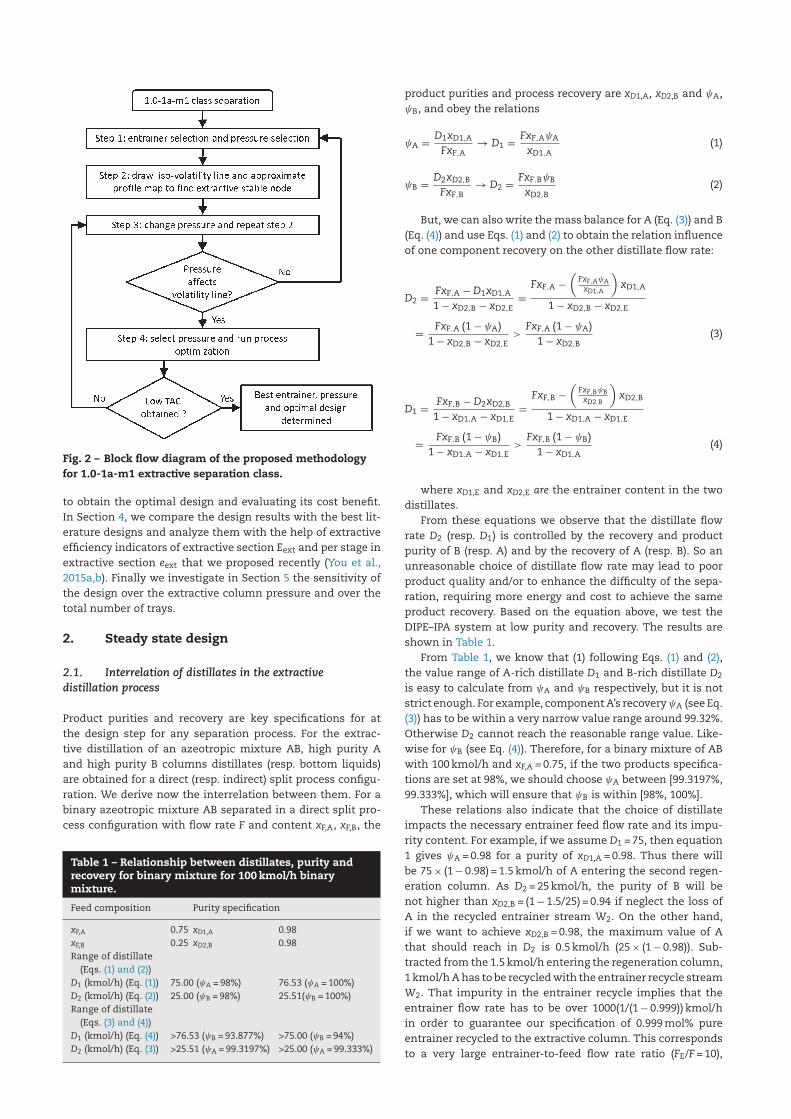
Fig. 2 – Block flow diagram of the proposed methodology
for 1.01am1 extractive separation class.
to obtain the optimal design and evaluating its cost benefit.
In Section 4, we compare the design results with the best lit
erature designs and analyze them with the help of extractive
efficiency indicators of extractive section Eext and per stage in
extractive section eext that we proposed recently (You et al.,
2015a,b). Finally we investigate in Section 5 the sensitivity of
the design over the extractive column pressure and over the
total number of trays.
2. Steady state design
2.1. Interrelation of distillates in the extractive
distillation process
Product purities and recovery are key specifications for at
the design step for any separation process. For the extrac
tive distillation of an azeotropic mixture AB, high purity A
and high purity B columns distillates (resp. bottom liquids)
are obtained for a direct (resp. indirect) split process configu
ration. We derive now the interrelation between them. For a
binary azeotropic mixture AB separated in a direct split pro
cess configuration with flow rate F and content xF,A, xF,B, the
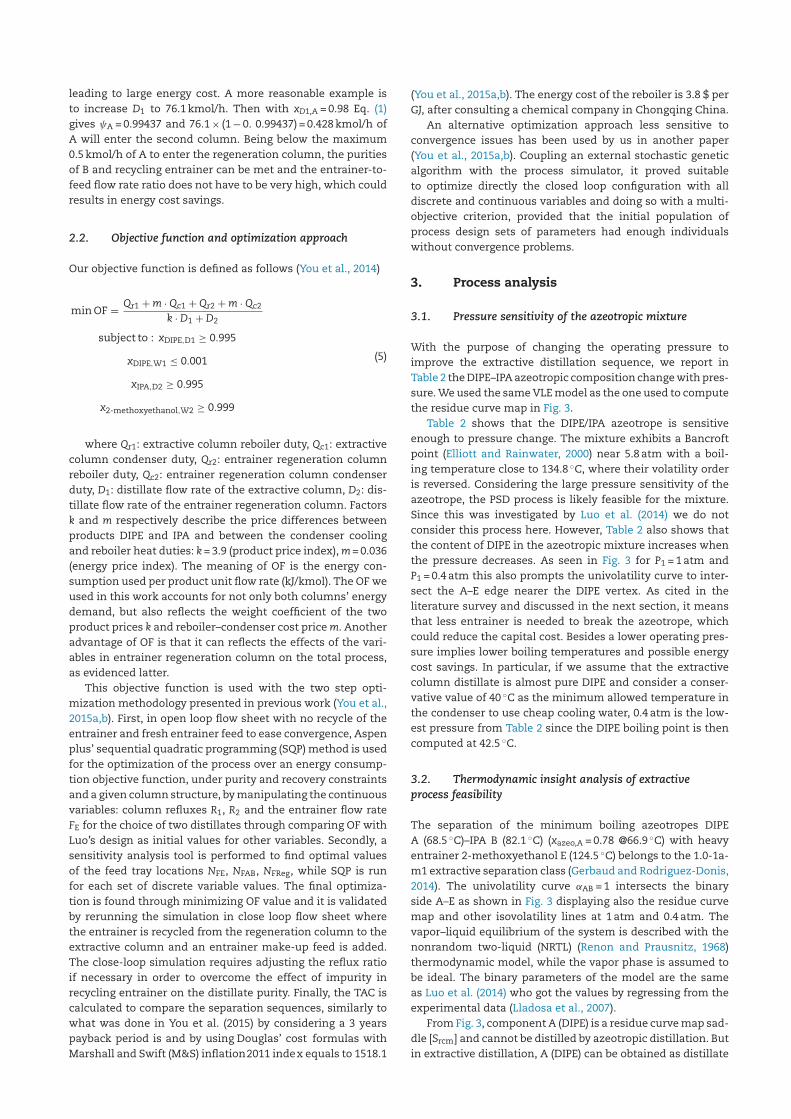
Table 1 – Relationship between distillates, purity andrecovery for binary mixture for 100 kmol/h binarymixture.
Feed composition Purity specification
xF,A 0.75 xD1,A 0.98
xF,B 0.25 xD2,B 0.98
Range of distillate
(Eqs. (1) and (2))
D1 (kmol/h) (Eq. (1)) 75.00 ( A = 98%) 76.53 ( A = 100%)
D2 (kmol/h) (Eq. (2)) 25.00 ( B = 98%) 25.51( B = 100%)
Range of distillate
(Eqs. (3) and (4))
D1 (kmol/h) (Eq. (4)) >76.53 ( B = 93.877%) >75.00 ( B = 94%)
D2 (kmol/h) (Eq. (3)) >25.51 ( A = 99.3197%) >25.00 ( A = 99.333%)
product purities and process recovery are xD1,A, xD2,B and A,
B, and obey the relations
A =D1xD1,A
FxF,A→ D1 =
FxF,A A
xD1,A(1)
B =D2xD2,B
FxF,B→ D2 =
FxF,B B
xD2,B(2)
But, we can also write the mass balance for A (Eq. (3)) and B
(Eq. (4)) and use Eqs. (1) and (2) to obtain the relation influence
of one component recovery on the other distillate flow rate:
D2 =FxF,A − D1xD1,A
1 − xD2,B − xD2,E=
FxF,A −
(
FxF,A AxD1,A
)
xD1,A
1 − xD2,B − xD2,E
=FxF,A (1 − A)
1 − xD2,B − xD2,E>FxF,A (1 − A)
1 − xD2,B(3)
D1 =FxF,B − D2xD2,B
1 − xD1,A − xD1,E=
FxF,B −
(
FxF,B BxD2,B
)
xD2,B
1 − xD1,A − xD1,E
=FxF,B (1 − B)
1 − xD1,A − xD1,E>FxF,B (1 − B)
1 − xD1,A(4)
where xD1,E and xD2,E are the entrainer content in the two
distillates.
From these equations we observe that the distillate flow
rate D2 (resp. D1) is controlled by the recovery and product
purity of B (resp. A) and by the recovery of A (resp. B). So an
unreasonable choice of distillate flow rate may lead to poor
product quality and/or to enhance the difficulty of the sepa
ration, requiring more energy and cost to achieve the same
product recovery. Based on the equation above, we test the
DIPE–IPA system at low purity and recovery. The results are
shown in Table 1.
From Table 1, we know that (1) following Eqs. (1) and (2),
the value range of Arich distillate D1 and Brich distillate D2
is easy to calculate from A and B respectively, but it is not
strict enough. For example, component A’s recovery A (see Eq.
(3)) has to be within a very narrow value range around 99.32%.
Otherwise D2 cannot reach the reasonable range value. Like
wise for B (see Eq. (4)). Therefore, for a binary mixture of AB
with 100 kmol/h and xF,A = 0.75, if the two products specifica
tions are set at 98%, we should choose A between [99.3197%,
99.333%], which will ensure that B is within [98%, 100%].
These relations also indicate that the choice of distillate
impacts the necessary entrainer feed flow rate and its impu
rity content. For example, if we assume D1 = 75, then equation
1 gives A = 0.98 for a purity of xD1,A = 0.98. Thus there will
be 75 × (1 − 0.98) = 1.5 kmol/h of A entering the second regen
eration column. As D2 = 25 kmol/h, the purity of B will be
not higher than xD2,B = (1 − 1.5/25) = 0.94 if neglect the loss of
A in the recycled entrainer stream W2. On the other hand,
if we want to achieve xD2,B = 0.98, the maximum value of A
that should reach in D2 is 0.5 kmol/h (25 × (1 − 0.98)). Sub
tracted from the 1.5 kmol/h entering the regeneration column,
1 kmol/h A has to be recycled with the entrainer recycle stream
W2. That impurity in the entrainer recycle implies that the
entrainer flow rate has to be over 1000(1/(1 − 0.999)) kmol/h
in order to guarantee our specification of 0.999 mol% pure
entrainer recycled to the extractive column. This corresponds
to a very large entrainertofeed flow rate ratio (FE/F = 10),
leading to large energy cost. A more reasonable example is
to increase D1 to 76.1 kmol/h. Then with xD1,A = 0.98 Eq. (1)
gives A = 0.99437 and 76.1 × (1 − 0. 0.99437) = 0.428 kmol/h of
A will enter the second column. Being below the maximum
0.5 kmol/h of A to enter the regeneration column, the purities
of B and recycling entrainer can be met and the entrainerto
feed flow rate ratio does not have to be very high, which could
results in energy cost savings.
2.2. Objective function and optimization approach
Our objective function is defined as follows (You et al., 2014)
min OF =Qr1 + m · Qc1 + Qr2 + m · Qc2
k · D1 + D2
subject to : xDIPE,D1 ≥ 0.995
xDIPE,W1 ≤ 0.001
xIPA,D2 ≥ 0.995
x2methoxyethanol,W2 ≥ 0.999
(5)
where Qr1: extractive column reboiler duty, Qc1: extractive
column condenser duty, Qr2: entrainer regeneration column
reboiler duty, Qc2: entrainer regeneration column condenser
duty, D1: distillate flow rate of the extractive column, D2: dis
tillate flow rate of the entrainer regeneration column. Factors
k and m respectively describe the price differences between
products DIPE and IPA and between the condenser cooling
and reboiler heat duties: k = 3.9 (product price index), m = 0.036
(energy price index). The meaning of OF is the energy con
sumption used per product unit flow rate (kJ/kmol). The OF we
used in this work accounts for not only both columns’ energy
demand, but also reflects the weight coefficient of the two
product prices k and reboiler–condenser cost price m. Another
advantage of OF is that it can reflects the effects of the vari
ables in entrainer regeneration column on the total process,
as evidenced latter.
This objective function is used with the two step opti
mization methodology presented in previous work (You et al.,
2015a,b). First, in open loop flow sheet with no recycle of the
entrainer and fresh entrainer feed to ease convergence, Aspen
plus’ sequential quadratic programming (SQP) method is used
for the optimization of the process over an energy consump
tion objective function, under purity and recovery constraints
and a given column structure, by manipulating the continuous
variables: column refluxes R1, R2 and the entrainer flow rate
FE for the choice of two distillates through comparing OF with
Luo’s design as initial values for other variables. Secondly, a
sensitivity analysis tool is performed to find optimal values
of the feed tray locations NFE, NFAB, NFReg, while SQP is run
for each set of discrete variable values. The final optimiza
tion is found through minimizing OF value and it is validated
by rerunning the simulation in close loop flow sheet where
the entrainer is recycled from the regeneration column to the
extractive column and an entrainer makeup feed is added.
The closeloop simulation requires adjusting the reflux ratio
if necessary in order to overcome the effect of impurity in
recycling entrainer on the distillate purity. Finally, the TAC is
calculated to compare the separation sequences, similarly to
what was done in You et al. (2015) by considering a 3 years
payback period is and by using Douglas’ cost formulas with
Marshall and Swift (M&S) inflation 2011 index equals to 1518.1
(You et al., 2015a,b). The energy cost of the reboiler is 3.8 $ per
GJ, after consulting a chemical company in Chongqing China.
An alternative optimization approach less sensitive to
convergence issues has been used by us in another paper
(You et al., 2015a,b). Coupling an external stochastic genetic
algorithm with the process simulator, it proved suitable
to optimize directly the closed loop configuration with all
discrete and continuous variables and doing so with a multi
objective criterion, provided that the initial population of
process design sets of parameters had enough individuals
without convergence problems.
3. Process analysis
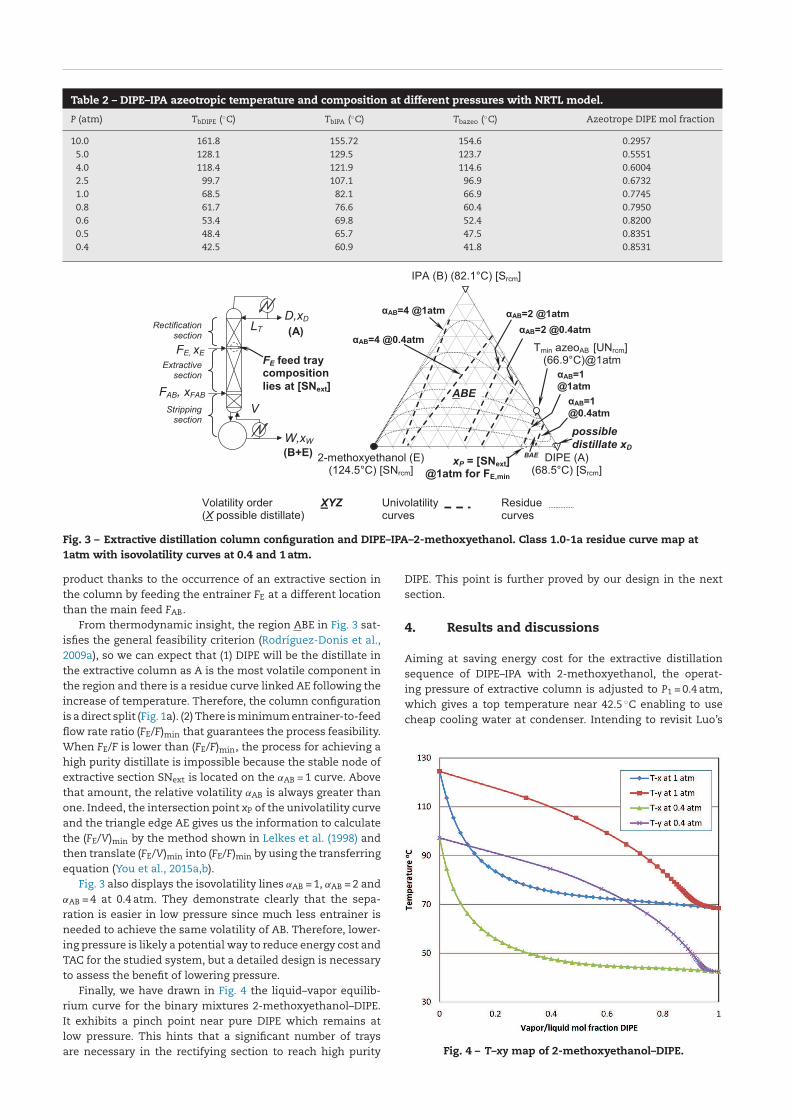
3.1. Pressure sensitivity of the azeotropic mixture
With the purpose of changing the operating pressure to
improve the extractive distillation sequence, we report in
Table 2 the DIPE–IPA azeotropic composition change with pres
sure. We used the same VLE model as the one used to compute
the residue curve map in Fig. 3.
Table 2 shows that the DIPE/IPA azeotrope is sensitive
enough to pressure change. The mixture exhibits a Bancroft
point (Elliott and Rainwater, 2000) near 5.8 atm with a boil
ing temperature close to 134.8 ◦C, where their volatility order
is reversed. Considering the large pressure sensitivity of the
azeotrope, the PSD process is likely feasible for the mixture.
Since this was investigated by Luo et al. (2014) we do not
consider this process here. However, Table 2 also shows that
the content of DIPE in the azeotropic mixture increases when
the pressure decreases. As seen in Fig. 3 for P1 = 1 atm and
P1 = 0.4 atm this also prompts the univolatility curve to inter
sect the A–E edge nearer the DIPE vertex. As cited in the
literature survey and discussed in the next section, it means
that less entrainer is needed to break the azeotrope, which
could reduce the capital cost. Besides a lower operating pres
sure implies lower boiling temperatures and possible energy
cost savings. In particular, if we assume that the extractive
column distillate is almost pure DIPE and consider a conser
vative value of 40 ◦C as the minimum allowed temperature in
the condenser to use cheap cooling water, 0.4 atm is the low
est pressure from Table 2 since the DIPE boiling point is then
computed at 42.5 ◦C.
3.2. Thermodynamic insight analysis of extractive
process feasibility
The separation of the minimum boiling azeotropes DIPE
A (68.5 ◦C)–IPA B (82.1 ◦C) (xazeo,A = 0.78 @66.9 ◦C) with heavy
entrainer 2methoxyethanol E (124.5 ◦C) belongs to the 1.01a
m1 extractive separation class (Gerbaud and RodriguezDonis,
2014). The univolatility curve ˛AB = 1 intersects the binary
side A–E as shown in Fig. 3 displaying also the residue curve
map and other isovolatility lines at 1 atm and 0.4 atm. The
vapor–liquid equilibrium of the system is described with the
nonrandom twoliquid (NRTL) (Renon and Prausnitz, 1968)
thermodynamic model, while the vapor phase is assumed to
be ideal. The binary parameters of the model are the same
as Luo et al. (2014) who got the values by regressing from the
experimental data (Lladosa et al., 2007).
From Fig. 3, component A (DIPE) is a residue curve map sad
dle [Srcm] and cannot be distilled by azeotropic distillation. But
in extractive distillation, A (DIPE) can be obtained as distillate
544 chemical engineering research and design 1 0 9 ( 2 0 1 6 ) 540–552
Table 2 – DIPE–IPA azeotropic temperature and composition at different pressures with NRTL model.
P (atm) TbDIPE (◦C) TbIPA (◦C) Tbazeo (◦C) Azeotrope DIPE mol fraction
10.0 161.8 155.72 154.6 0.2957
5.0 128.1 129.5 123.7 0.5551
4.0 118.4 121.9 114.6 0.6004
2.5 99.7 107.1 96.9 0.6732
1.0 68.5 82.1 66.9 0.7745
0.8 61.7 76.6 60.4 0.7950
0.6 53.4 69.8 52.4 0.8200
0.5 48.4 65.7 47.5 0.8351
0.4 42.5 60.9 41.8 0.8531
Fig. 3 – Extractive distillation column configuration and DIPE–IPA–2methoxyethanol. Class 1.01a residue curve map at
1atm with isovolatility curves at 0.4 and 1 atm.
product thanks to the occurrence of an extractive section in
the column by feeding the entrainer FE at a different location
than the main feed FAB.
From thermodynamic insight, the region ABE in Fig. 3 sat
isfies the general feasibility criterion (RodríguezDonis et al.,
2009a), so we can expect that (1) DIPE will be the distillate in
the extractive column as A is the most volatile component in
the region and there is a residue curve linked AE following the
increase of temperature. Therefore, the column configuration
is a direct split (Fig. 1a). (2) There is minimum entrainertofeed
flow rate ratio (FE/F)min that guarantees the process feasibility.
When FE/F is lower than (FE/F)min, the process for achieving a
high purity distillate is impossible because the stable node of
extractive section SNext is located on the ˛AB = 1 curve. Above
that amount, the relative volatility ˛AB is always greater than
one. Indeed, the intersection point xP of the univolatility curve
and the triangle edge AE gives us the information to calculate
the (FE/V)min by the method shown in Lelkes et al. (1998) and
then translate (FE/V)min into (FE/F)min by using the transferring
equation (You et al., 2015a,b).
Fig. 3 also displays the isovolatility lines ˛AB = 1, ˛AB = 2 and
˛AB = 4 at 0.4 atm. They demonstrate clearly that the sepa
ration is easier in low pressure since much less entrainer is
needed to achieve the same volatility of AB. Therefore, lower
ing pressure is likely a potential way to reduce energy cost and
TAC for the studied system, but a detailed design is necessary
to assess the benefit of lowering pressure.
Finally, we have drawn in Fig. 4 the liquid–vapor equilib
rium curve for the binary mixtures 2methoxyethanol–DIPE.
It exhibits a pinch point near pure DIPE which remains at
low pressure. This hints that a significant number of trays
are necessary in the rectifying section to reach high purity
DIPE. This point is further proved by our design in the next
section.
4. Results and discussions
Aiming at saving energy cost for the extractive distillation
sequence of DIPE–IPA with 2methoxyethanol, the operat
ing pressure of extractive column is adjusted to P1 = 0.4 atm,
which gives a top temperature near 42.5 ◦C enabling to use
cheap cooling water at condenser. Intending to revisit Luo’s
Fig. 4 – T–xy map of 2methoxyethanol–DIPE.
chemical engineering research and design 1 0 9 ( 2 0 1 6 ) 540–552 545
Table 3 – Relationship between distillates, purity and recovery for DIPE–IPA.
Feed composition Purity specification
x1 0.75 xD1,A 0.995
x2 0.25 xD2,B 0.995
Range of distillate (Eqs. (1) and (2))
D1 (kmol/h) (Eq. (1)) 75.00 ( A = 99.5%) 75.37 ( A = 100%)
D2 (kmol/h) (Eq. (2)) 25.00 ( B = 99.5%) 25.12 ( B = 100%)
Range of distillate (Eqs. (3) and (4))
D1 (kmol/h) (Eq. (4)) >75.37 ( B = 98.493%) >75.00 ( B = 98.50%)
D2 (kmol/h) (Eq. (3)) >25.12 ( A = 99.8325%) >25.00 ( A = 99.833%)
design, we keep his proposed total number of trays in the
extractive column (Next = 66) and in the entrainer regenera
tion column (NReg = 40). We also use the same feed as Luo
et al. (FAB = 100 kmol/h, 0.75(DIPE):0.25(IPA)) and preheat the
entrainer to 328.15 K as they did. But we select higher product
purity specifications equal to 0.995 molar fractions for both
DIPE and IPA whereas they obtained 0.993 for DIPE and 0.996
for IPA. Other design parameters are found by using two steps
optimization procedure. Luo’s design at 1 atm is used as the
initial point of the optimization that we run at 0.4 atm.
In the calculation of TAC, the heat exchanger annual cost
for cooling recycling entrainer is taken into account in order to
emphasize the effect of the recycling entrainer flow rate on the
process. The pressure drop of per tray is assumed 0.0068 atm,
the same as Luo et al. (2014) and the tray efficiency is 85%
(Figueiredo et al., 2015) for calculating capital cost of the col
umn.
It should be noticed that a vacuum pump is needed to pro
duce low pressure in extractive column while the process is
started, after that the operating pressure of the column is con
trolled by the condenser heat duty. The electricity cost and
capital cost of the vacuum pump is much lower than that of
the normal liquidconveying pump because it only works a
little time during each startup and its vaporconveying flow
(the volume of the extractive column) is much smaller than
that of the normal liquidconveying pump (total liquid flow of
recycling entrainer, feed and product for one year). Since the
cost of liquidconveying pump could be neglected in the con
ceptual design stage, the cost of vacuum pump should not be
taken into account. The other costs such as pipes and valves
are also neglected.
4.1. Choice of distillate flow rate
Having set new product purity specifications at 0.995, we use
Eqs. (1)–(4) to select suitable distillate flow rate, as shown in
Table 3.
Through the use of Eqs. (3) and (2), Table 3 shows that the
recovery of A (DIPE) should be at least greater than 99.83%
and that the recovery of B (IPA) should be above 99.5%. Our
final design results shown later overcome these values. This
table also explain why Luo’ design that fixed D1 = 75.44 kmol/h
prevented him to reach a purity of 0.9950 for DIPE since it is
above the 75.37 kmol/h limit value for that purity. He obtained
0.9930 which corresponds to a A = 99.88% from Eq. (1).
A side effect of the strongly nonlinear dependency of D1
and D2 on the product purity is that the simulation cannot
be converged steadily when we directly treat the distillates
as an optimized variable in the SQP method. So D1 is varied
with a discrete step of 0.05 kmol/h from 75 kmol/h ( A = 99.5%)
to 75.35 kmol/h ( A = 99.96%) and D2 is varied with a discrete
step of 0.03 kmol/h from 25 kmol/h ( B = 99.5%) to 25.12 kmol/h
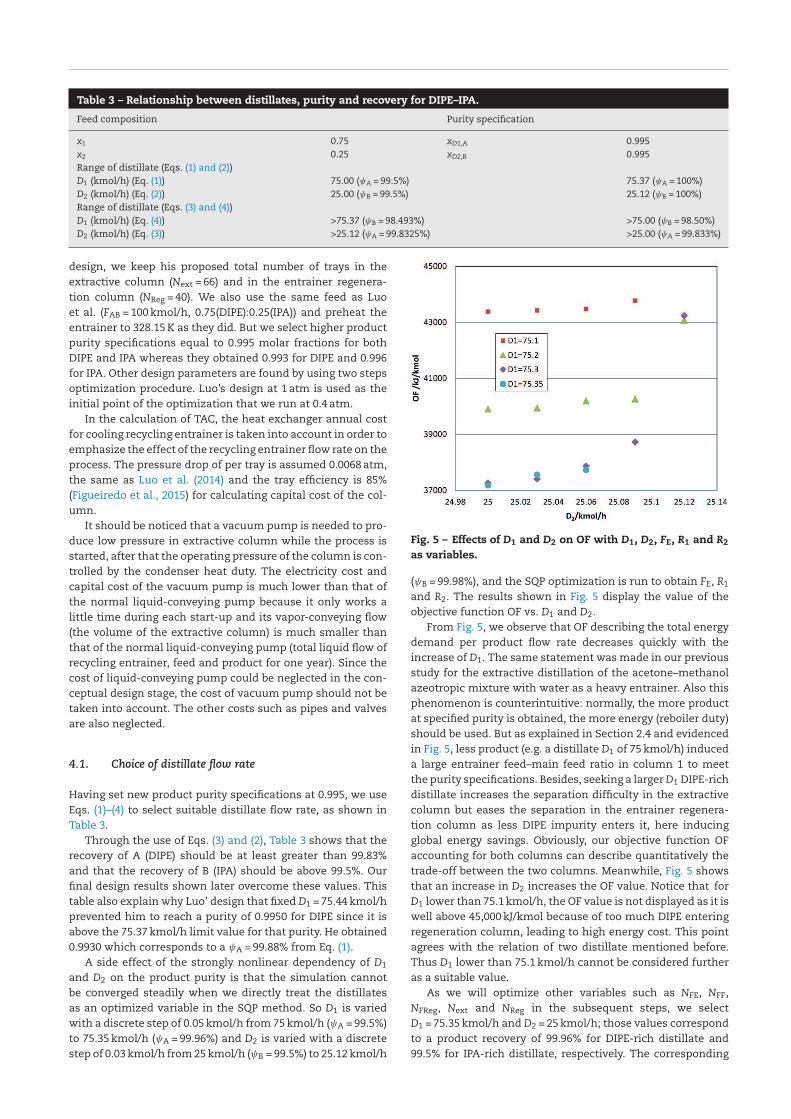
Fig. 5 – Effects of D1 and D2 on OF with D1, D2, FE, R1 and R2
as variables.
( B = 99.98%), and the SQP optimization is run to obtain FE, R1
and R2. The results shown in Fig. 5 display the value of the
objective function OF vs. D1 and D2.
From Fig. 5, we observe that OF describing the total energy
demand per product flow rate decreases quickly with the
increase of D1. The same statement was made in our previous
study for the extractive distillation of the acetone–methanol
azeotropic mixture with water as a heavy entrainer. Also this
phenomenon is counterintuitive: normally, the more product
at specified purity is obtained, the more energy (reboiler duty)
should be used. But as explained in Section 2.4 and evidenced
in Fig. 5, less product (e.g. a distillate D1 of 75 kmol/h) induced
a large entrainer feed–main feed ratio in column 1 to meet
the purity specifications. Besides, seeking a larger D1 DIPErich
distillate increases the separation difficulty in the extractive
column but eases the separation in the entrainer regenera
tion column as less DIPE impurity enters it, here inducing
global energy savings. Obviously, our objective function OF
accounting for both columns can describe quantitatively the
tradeoff between the two columns. Meanwhile, Fig. 5 shows
that an increase in D2 increases the OF value. Notice that for
D1 lower than 75.1 kmol/h, the OF value is not displayed as it is
well above 45,000 kJ/kmol because of too much DIPE entering
regeneration column, leading to high energy cost. This point
agrees with the relation of two distillate mentioned before.
Thus D1 lower than 75.1 kmol/h cannot be considered further
as a suitable value.
As we will optimize other variables such as NFE, NFF,
NFReg, Next and NReg in the subsequent steps, we select
D1 = 75.35 kmol/h and D2 = 25 kmol/h; those values correspond
to a product recovery of 99.96% for DIPErich distillate and
99.5% for IPArich distillate, respectively. The corresponding
546 chemical engineering research and design 1 0 9 ( 2 0 1 6 ) 540–552
Table 4 – Optimized values of FE, R1, and R2 for theextractive distillation of DIPE–IPA with2methoxyethanol, case A at 1 atm and case B at 0.4 atm.
Case A Case B
P1 (atm) 1 0.4
P2 (atm) 1 1
N1 66 66
N2 40 40
D1 (kmol/h) 75.35 75.35
D2 (kmol/h) 25 25
NFE 30 30
NFAB 56 56
NFReg 10 10
FE (kmol/h) 96.9 84.6
R1 1.85 1.70
R2 1.80 1.33
OF (kJ/kmol) 37174.9 30639.9
OF value is 37174.9 kJ/kmol, with FE = 96.9 kmol/h, R1 = 1.85 and
R2 = 1.80 at P1 = 0.4 atm.
4.2. Continuous variables FE, R1 and R2
The optimized FE, R1, R2 values are shown in Table 4 while the
other variables are kept constant. Notice that the initial values
of the three feed locations in case A and case B are taken from
Luo’s design.
We observe (1) under lower pressure (case B), the values
of FE, R1, R2 in case B are lower and OF decreases by 17.6%. It
materializes the benefit of the pressure reduction that was
anticipated through the analysis of residue curve map and
univolatility line for a 1.01a class mixture. (2) The reduc
tion in R2 is more pronounced that in R1. If less entrainer is
fed to the extractive column, a greater R1 is needed to get
the same separation effect. Meanwhile the concentration of
entrainer fed to the regeneration column decreases due to
mass balance, and less energy (R2 decrease) is used to recy
cle the entrainer. Overall, these observations agree with the
study for the separation of acetonemethanolwater system
(You et al., 2015a,b). These results also show the benefit of
optimizing both columns together to improve further the OF.
4.3. Selecting suitable feed locations
The sensitivity analysis over the three feed positions with
ranges [20; 40] for NFE, [>NFE; 66] for NFAB, [5; 40] for NFReg
was made by using experimental planning procedure so as
to avoid local minimum. For each set of values, FE, R1, R2 are
optimized while D1 and D2 are fixed. Table 5 shows the results
considering now P1 = 0.4 atm and P2 = 1 atm as in case B above.
As a whole, the shifting of the three feed locations improves
further the OF value by 1.9% but also impacts the process effi
ciency that will be discussed in Section 4.5. A few statements
can be made from Table 5: (1) OF is moderately sensitive to
small changes of the three feed locations when FE, R1, and R2
are optimized. (2) In conventional distillation an increase of
the number of trays in the rectifying section allows to use a
lower reflux ratio R1, but here for an extractive column, the
opposite is found as feed location of entrainer moves up the
column from 30 to 28 for the lowest OF design. The reason was
stated in Lelkes et al. (1998): too much trays in the rectifying
section is not recommended in extractive distillation for the
1.01a class because the pure product DIPE is a saddle in the
RCM and lengthening the rectifying composition profile will
Table 5 – Open loop optimal results of FE, R1, R2, NFE,
NFAB, NFReg under fixed D1 and D2 for the extractivedistillation of DIPE–IPA with 2methoxyethanol,P1 = 0.4 atm and P2 = 1 atm.
NFE NFAB NFReg FE R1 R2 OF (kJ/kmol)
26 58 13 75.1 1.76 1.20 30292.8
27 59 14 75.0 1.75 1.17 30081.9
28 58 13 75.1 1.76 1.17 30144.8
28 59 15 74.1 1.77 1.16 30110.5
28 60 15 75.0 1.74 1.17 30042.9
28 60 16 74.0 1.77 1.16 30122.2
28 61 15 74.0 1.78 1.15 30213.2
29 55 9 80.0 1.73 1.37 30827.4
30 56 10 84.6 1.70 1.33 30639.9
30 57 11 84.4 1.66 1.34 30410.7
31 55 10 86.5 1.67 1.39 30740.8
31 56 11 86.6 1.65 1.38 30619.0
approach instead the unstable node that should lie near the
unwanted azeotrope. (3) The minimum value of OF is found
with six extra number of trays in the extractive section than
Luo’s design. As discussed earlier, a key factor to achieve the
extractive separation is to reach the extractive section stable
node SNext near the DIPE–2methoxyethanol edge. This can be
achieved by more trays in the extractive section. Another con
sequence is that the efficiency of the extractive section that
will be discussed in Section 4.5 is improved. (4) The lowest
energy cost for per unit product OF is 30042.9 kJ/kmol with
NFE = 28, NFAB = 60 and NFReg = 15. It represents a further 1.9%
reduction in energy cost compared the design with NFE = 30,
NFAB = 56 and NFReg = 10.
4.4. Closed loop design and optimal design parameters
The optimal design is resimulated in closed loop flowsheet
in order to make sure the product purity is achieved and that
the effect of impurity in recycling entrainer on the process is
accounted for. For more detailed information, see our earlier
study (You et al., 2015a,b). Case 2 under P1 = 0.4 atm corre
sponds to the open loop design of case B. It is compared to case
1 that corresponds to our best closed loop design under P1 = 1
atm. Indeed case A (P1 = 1 atm) in Table 4 that corresponded to
a design with Luo’s feed locations did not allowed under closed
loop simulation to reach the targeted purity for the distillates
and cannot be used for comparison.
The design and operating variables and the cost data are
shown in Table 6, referring to the flow sheet notations in
Fig. 3. Table 7 displays the product purity and recovery val
ues. Figs. 6 and 7 show the temperature and composition
profiles of the extractive and entrainer regeneration columns
for the best case, namely case 2, where ME notation holds for
2methoxyethanol.
Table 6 confirms that a process design operating at 1 atm
like case 1 can be improved further, while keeping the same
number of trays in the extractive and regeneration columns. In
summary, (1) the entrainer flow rate decreased drastically by
25% from 100 kmol/h in case 1 to 75 kmol/h in case 2, showing
that improvement was possible due principally to a combi
nation of a shift of feed locations and pressure reduction, as
deduced from the pressure dependency of the azeotrope com
position and isovolatility curves. (2) The energy consumption
underlying the OF value in case 2 is reduced by 11.2% and 13.4%
compared to case 1 and case Luo, respectively. It is mostly
attributed to a reduction in the entrainer flow rate allowed
chemical engineering research and design 1 0 9 ( 2 0 1 6 ) 540–552 547
Table 6 – Optimal design parameters and cost data from closed loop simulation for the extractive distillation of DIPE–IPAwith 2methoxyethanol.
Column Case Luoa Case 1 Case 2
C1 C2 C1 C2 C1 C2
Next 66 66 66
P1 (atm) 1 1 0.4
FAB (kmol/h) 100 100 100
FE (kmol/h) 100 100 75
D1 (kmol/h) 75.44 75.35 75.35
NFE 30 29 28
NFAB 56 59 60
R1 1.54 1.86 1.83
QC (MW) 1.553 1.746 1.838
QR (MW) 2.279 2.205 1.948
NRreg 40 40 40
P2 (atm) 1 1 1
D2 (kmol)/h 25.03 25 25
NFReg 10 12 15
R2 1.93 1.88 1.18
QC (MW) 0.823 0.811 0.614
QR (MW) 0.748 0.737 0.658
Column C1 C2 C1 C2 C1 C2
Diameter (m) 1.44 0.78 1.37 0.69 1.66 0.65
Height (m) 46.33 28.05 46.33 28.05 46.33 28.05
ICS (106$) 0.720 0.251 0.683 0.220 0.838 0.207
AC (m2) 66 23 74 22 164 18
AR (m2) 116 38 112 38 99 34
IHE (106$) 0.347 0.172 0.354 0.170 0.443 0.151
Costcap (106$) 1.184 0.449 1.145 0.412 1.426 0.378
Costope (106$) 0.938 0.313 0.911 0.308 0.809 0.274
CostCA (106$) 1.333 0.462 1.293 0.445 1.284 0.399
QHA (MW) 0.407 0.407 0.305
CostHA (106$) 0.016 0.016 0.013
TAC (106$) 1.810 1.754 1.696
OF (kJ/kmol) 35098.7 34245.2 30398.9
a Luo’s process distillate molar purity for DIPErich product is below our specifications.
Table 7 – Product purities and recoveries for case Luo, cases 1 and 2 designs.
Mole fraction D1 D2 W2 W1 Recovery
Case Luo @1 atm DIPE 0.99350 0.00202 4.67E−27 0.00041 99.93%
IPA 0.00044 0.99637 0.00028 0.20044 99.64%
ME 0.00606 0.00161 0.99972 0.79915
Case 1 @1 atm DIPE 0.99504 0.00096 5.67E−26 0.00019 99.97%
IPA 0.00076 0.99772 0.00034 0.20033 99.78%
ME 0.00420 0.00132 0.99966 0.79948
Case 2 @0.4 atm DIPE 0.99501 0.00105 1.39E−23 0.00026 99.96%
IPA 0.00090 0.99730 0.00042 0.25044 99.73%
ME 0.00409 0.00165 0.99958 0.74930
by the reduced pressure. (3) Meanwhile, TAC savings reach
3.4% mainly due to the decrease of the entrainer flow rate
and reflux ratio in the second regeneration column. (4) There
are also drawbacks of lowering pressure except the negligible
cost of the vacuum pump mentioned above. If we compare
the extractive column in case 1 and case 2, the decrease of
the pressure leads to a 21.2% increase of the column diame
ter, and a 2.2 times increase of the condenser heat exchanger
area due to the decrease of condenser temperature. However,
the decrease of the pressure results in the decrease of reboiler
duty by 11.6%. As a result, the benefit of decreasing pressure
overcomes the punishment because the annual cost of extrac
tive column is slightly reduced from 1.293 to 1.284 (106$ per
year).
Recall in Table 7, Luo’s design does not meet our molar
purity specification on the DIPE distillate. To meet that
specification, case 1 result shows that R1 must be increased
and the heat duty as well. Despite all this, Table 6 shows that
case 1 gives a 3.1% and 2.4% reduction in TAC and energy
cost OF over Luo’s design at the same pressure due to the
decrease of reboiler duty thanks to more suitable distillate
and feed locations. This proves the effectiveness of the two
step optimization procedure we used.
Table 6 also shows that shifting the feed tray locations and
running a new optimization improves the OF and thus reduces
the process energy consumption. This point is evidenced by
comparing the total reboiler heat duty of case 1 (2.942 MW) and
case 2 (2.606 MW): a 11.4% total heat duty is saved. Regarding
product purity and recovery, Table 7 shows that purity targets
are met and that recoveries are high and in agreement with the
relationship between the two distillate flow rates as discussed
in Section 2.1.
Fig. 6 – Temperature and composition profiles of case 2 extractive column for the extractive distillation of DIPE–IPA with
2methoxyethanol.
4.5. Analysis from extractive efficiency indicators and
ternary composition profile map
Shifting feed tray locations induces changes in the number
of trays in each section. We already discussed the impact
of the number of trays in the rectifying section. But for the
extractive distillation process, the general feasibility criteria
(RodríguezDonis et al., 2009a; You et al., 2015a,b) and the fea
sibility analysis we have conducted in Section 2.1 show that
the number of trays in the extractive section, Next, should be
high enough to allow the column composition at the entrainer
feed tray to lie close to the stable node of the extractive pro
file map. In our previous work on another 1.01a extractive
separation class mixture, we proposed extractive efficiency
indicators describing the ability of the extractive section to dis
criminate the desired product between the top and the bottom
of the extractive section.
Eext = xP,H − xP,L (6)
eext =Eext
Next(7)
where Eext: the total extractive efficiency indicator of
extractive section, xP,H: product mole fraction at one end of
extractive section, xP,L: product mole fraction at another end
of extractive section, eext: extractive efficiency indicator per
tray, Next: tray number of extractive section. Here, we use the
entrainer feed and the main feed trays locations as ends of the
extractive section.
The extractive efficiency indicators Eext and eext are shown
in Table 8 for the cases 1 and 2 and Luo’s design, along with the
DIPE composition at the feed trays. Fig. 8 displays the extrac
tive column composition profiles in a ternary map.
From Table 8 and Fig. 8, we remark that (1) Luo’s design
extractive efficiency indicators are negative, stating that the
extractive section is not able to improve the DIPE purity. (2) A
lower entrainer flow rate as in case 2 operating at low pres
sure allows the top end of the extractive section SNext to
lie closer to the product vertex. (3) The extractive efficiency
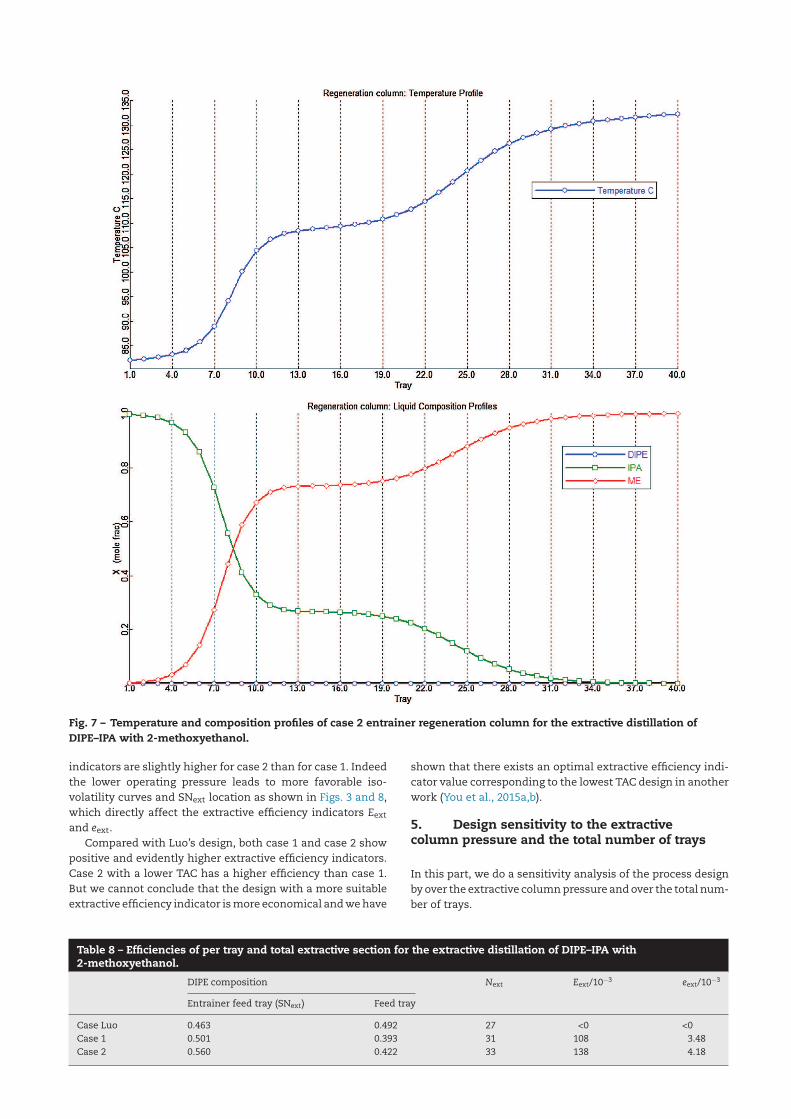
Fig. 7 – Temperature and composition profiles of case 2 entrainer regeneration column for the extractive distillation of
DIPE–IPA with 2methoxyethanol.
indicators are slightly higher for case 2 than for case 1. Indeed
the lower operating pressure leads to more favorable iso
volatility curves and SNext location as shown in Figs. 3 and 8,
which directly affect the extractive efficiency indicators Eext
and eext.
Compared with Luo’s design, both case 1 and case 2 show
positive and evidently higher extractive efficiency indicators.
Case 2 with a lower TAC has a higher efficiency than case 1.
But we cannot conclude that the design with a more suitable
extractive efficiency indicator is more economical and we have
shown that there exists an optimal extractive efficiency indi
cator value corresponding to the lowest TAC design in another
work (You et al., 2015a,b).
5. Design sensitivity to the extractivecolumn pressure and the total number of trays
In this part, we do a sensitivity analysis of the process design
by over the extractive column pressure and over the total num
ber of trays.
Table 8 – Efficiencies of per tray and total extractive section for the extractive distillation of DIPE–IPA with2methoxyethanol.
DIPE composition Next Eext/10−3 eext/10−3
Entrainer feed tray (SNext) Feed tray
Case Luo 0.463 0.492 27 <0 <0
Case 1 0.501 0.393 31 108 3.48
Case 2 0.560 0.422 33 138 4.18
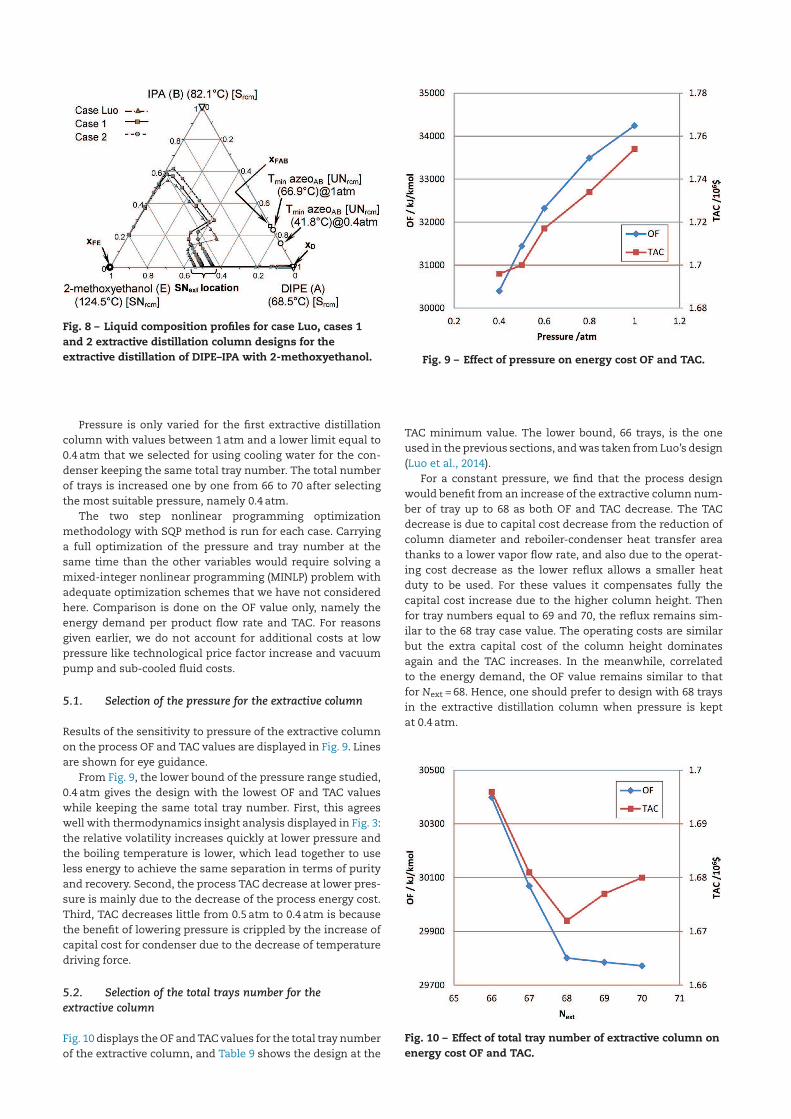
Fig. 8 – Liquid composition profiles for case Luo, cases 1
and 2 extractive distillation column designs for the
extractive distillation of DIPE–IPA with 2methoxyethanol.
Pressure is only varied for the first extractive distillation
column with values between 1 atm and a lower limit equal to
0.4 atm that we selected for using cooling water for the con
denser keeping the same total tray number. The total number
of trays is increased one by one from 66 to 70 after selecting
the most suitable pressure, namely 0.4 atm.
The two step nonlinear programming optimization
methodology with SQP method is run for each case. Carrying
a full optimization of the pressure and tray number at the
same time than the other variables would require solving a
mixedinteger nonlinear programming (MINLP) problem with
adequate optimization schemes that we have not considered
here. Comparison is done on the OF value only, namely the
energy demand per product flow rate and TAC. For reasons
given earlier, we do not account for additional costs at low
pressure like technological price factor increase and vacuum
pump and subcooled fluid costs.
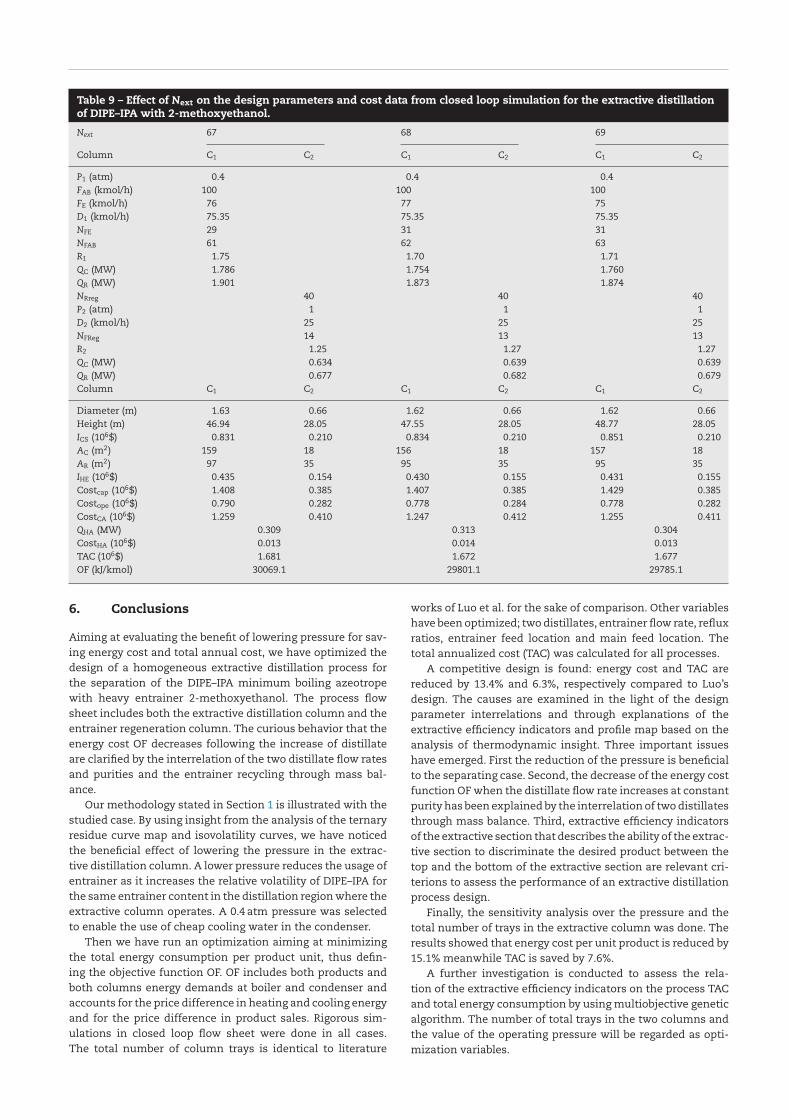
5.1. Selection of the pressure for the extractive column
Results of the sensitivity to pressure of the extractive column
on the process OF and TAC values are displayed in Fig. 9. Lines
are shown for eye guidance.
From Fig. 9, the lower bound of the pressure range studied,
0.4 atm gives the design with the lowest OF and TAC values
while keeping the same total tray number. First, this agrees
well with thermodynamics insight analysis displayed in Fig. 3:
the relative volatility increases quickly at lower pressure and
the boiling temperature is lower, which lead together to use
less energy to achieve the same separation in terms of purity
and recovery. Second, the process TAC decrease at lower pres
sure is mainly due to the decrease of the process energy cost.
Third, TAC decreases little from 0.5 atm to 0.4 atm is because
the benefit of lowering pressure is crippled by the increase of
capital cost for condenser due to the decrease of temperature
driving force.
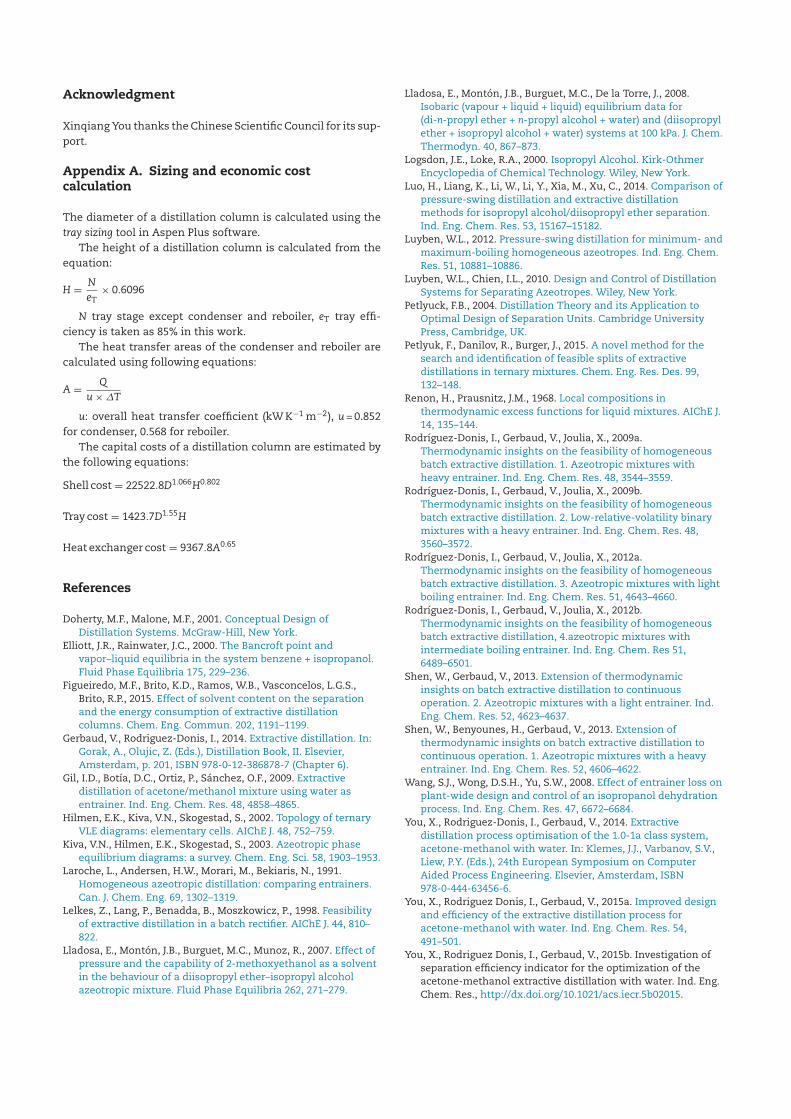
5.2. Selection of the total trays number for the
extractive column
Fig. 10 displays the OF and TAC values for the total tray number
of the extractive column, and Table 9 shows the design at the
Fig. 9 – Effect of pressure on energy cost OF and TAC.
TAC minimum value. The lower bound, 66 trays, is the one
used in the previous sections, and was taken from Luo’s design
(Luo et al., 2014).
For a constant pressure, we find that the process design
would benefit from an increase of the extractive column num
ber of tray up to 68 as both OF and TAC decrease. The TAC
decrease is due to capital cost decrease from the reduction of
column diameter and reboilercondenser heat transfer area
thanks to a lower vapor flow rate, and also due to the operat
ing cost decrease as the lower reflux allows a smaller heat
duty to be used. For these values it compensates fully the
capital cost increase due to the higher column height. Then
for tray numbers equal to 69 and 70, the reflux remains sim
ilar to the 68 tray case value. The operating costs are similar
but the extra capital cost of the column height dominates
again and the TAC increases. In the meanwhile, correlated
to the energy demand, the OF value remains similar to that
for Next = 68. Hence, one should prefer to design with 68 trays
in the extractive distillation column when pressure is kept
at 0.4 atm.
Fig. 10 – Effect of total tray number of extractive column on
energy cost OF and TAC.
chemical engineering research and design 1 0 9 ( 2 0 1 6 ) 540–552 551
Table 9 – Effect of Next on the design parameters and cost data from closed loop simulation for the extractive distillationof DIPE–IPA with 2methoxyethanol.
Next 67 68 69
Column C1 C2 C1 C2 C1 C2
P1 (atm) 0.4 0.4 0.4
FAB (kmol/h) 100 100 100
FE (kmol/h) 76 77 75
D1 (kmol/h) 75.35 75.35 75.35
NFE 29 31 31
NFAB 61 62 63
R1 1.75 1.70 1.71
QC (MW) 1.786 1.754 1.760
QR (MW) 1.901 1.873 1.874
NRreg 40 40 40
P2 (atm) 1 1 1
D2 (kmol/h) 25 25 25
NFReg 14 13 13
R2 1.25 1.27 1.27
QC (MW) 0.634 0.639 0.639
QR (MW) 0.677 0.682 0.679
Column C1 C2 C1 C2 C1 C2
Diameter (m) 1.63 0.66 1.62 0.66 1.62 0.66
Height (m) 46.94 28.05 47.55 28.05 48.77 28.05
ICS (106$) 0.831 0.210 0.834 0.210 0.851 0.210
AC (m2) 159 18 156 18 157 18
AR (m2) 97 35 95 35 95 35
IHE (106$) 0.435 0.154 0.430 0.155 0.431 0.155
Costcap (106$) 1.408 0.385 1.407 0.385 1.429 0.385
Costope (106$) 0.790 0.282 0.778 0.284 0.778 0.282
CostCA (106$) 1.259 0.410 1.247 0.412 1.255 0.411
QHA (MW) 0.309 0.313 0.304
CostHA (106$) 0.013 0.014 0.013
TAC (106$) 1.681 1.672 1.677
OF (kJ/kmol) 30069.1 29801.1 29785.1
6. Conclusions
Aiming at evaluating the benefit of lowering pressure for sav
ing energy cost and total annual cost, we have optimized the
design of a homogeneous extractive distillation process for
the separation of the DIPE–IPA minimum boiling azeotrope
with heavy entrainer 2methoxyethanol. The process flow
sheet includes both the extractive distillation column and the
entrainer regeneration column. The curious behavior that the
energy cost OF decreases following the increase of distillate
are clarified by the interrelation of the two distillate flow rates
and purities and the entrainer recycling through mass bal
ance.
Our methodology stated in Section 1 is illustrated with the
studied case. By using insight from the analysis of the ternary
residue curve map and isovolatility curves, we have noticed
the beneficial effect of lowering the pressure in the extrac
tive distillation column. A lower pressure reduces the usage of
entrainer as it increases the relative volatility of DIPE–IPA for
the same entrainer content in the distillation region where the
extractive column operates. A 0.4 atm pressure was selected
to enable the use of cheap cooling water in the condenser.
Then we have run an optimization aiming at minimizing
the total energy consumption per product unit, thus defin
ing the objective function OF. OF includes both products and
both columns energy demands at boiler and condenser and
accounts for the price difference in heating and cooling energy
and for the price difference in product sales. Rigorous sim
ulations in closed loop flow sheet were done in all cases.
The total number of column trays is identical to literature
works of Luo et al. for the sake of comparison. Other variables
have been optimized; two distillates, entrainer flow rate, reflux
ratios, entrainer feed location and main feed location. The
total annualized cost (TAC) was calculated for all processes.
A competitive design is found: energy cost and TAC are
reduced by 13.4% and 6.3%, respectively compared to Luo’s
design. The causes are examined in the light of the design
parameter interrelations and through explanations of the
extractive efficiency indicators and profile map based on the
analysis of thermodynamic insight. Three important issues
have emerged. First the reduction of the pressure is beneficial
to the separating case. Second, the decrease of the energy cost
function OF when the distillate flow rate increases at constant
purity has been explained by the interrelation of two distillates
through mass balance. Third, extractive efficiency indicators
of the extractive section that describes the ability of the extrac
tive section to discriminate the desired product between the
top and the bottom of the extractive section are relevant cri
terions to assess the performance of an extractive distillation
process design.
Finally, the sensitivity analysis over the pressure and the
total number of trays in the extractive column was done. The
results showed that energy cost per unit product is reduced by
15.1% meanwhile TAC is saved by 7.6%.
A further investigation is conducted to assess the rela
tion of the extractive efficiency indicators on the process TAC
and total energy consumption by using multiobjective genetic
algorithm. The number of total trays in the two columns and
the value of the operating pressure will be regarded as opti
mization variables.
Acknowledgment
Xinqiang You thanks the Chinese Scientific Council for its sup
port.
Appendix A. Sizing and economic costcalculation
The diameter of a distillation column is calculated using the
tray sizing tool in Aspen Plus software.
The height of a distillation column is calculated from the
equation:
H =N
eT× 0.6096
N tray stage except condenser and reboiler, eT tray effi
ciency is taken as 85% in this work.
The heat transfer areas of the condenser and reboiler are
calculated using following equations:
A =Q
u × �T
u: overall heat transfer coefficient (kW K−1 m−2), u = 0.852
for condenser, 0.568 for reboiler.
The capital costs of a distillation column are estimated by
the following equations:
Shell cost = 22522.8D1.066H0.802
Tray cost = 1423.7D1.55H
Heat exchanger cost = 9367.8A0.65
References
Doherty, M.F., Malone, M.F., 2001. Conceptual Design ofDistillation Systems. McGrawHill, New York.
Elliott, J.R., Rainwater, J.C., 2000. The Bancroft point andvapor–liquid equilibria in the system benzene + isopropanol.Fluid Phase Equilibria 175, 229–236.
Figueiredo, M.F., Brito, K.D., Ramos, W.B., Vasconcelos, L.G.S.,Brito, R.P., 2015. Effect of solvent content on the separationand the energy consumption of extractive distillationcolumns. Chem. Eng. Commun. 202, 1191–1199.
Gerbaud, V., RodriguezDonis, I., 2014. Extractive distillation. In:Gorak, A., Olujic, Z. (Eds.), Distillation Book, II. Elsevier,Amsterdam, p. 201, ISBN 9780123868787 (Chapter 6).
Gil, I.D., Botía, D.C., Ortiz, P., Sánchez, O.F., 2009. Extractivedistillation of acetone/methanol mixture using water asentrainer. Ind. Eng. Chem. Res. 48, 4858–4865.
Hilmen, E.K., Kiva, V.N., Skogestad, S., 2002. Topology of ternaryVLE diagrams: elementary cells. AIChE J. 48, 752–759.
Kiva, V.N., Hilmen, E.K., Skogestad, S., 2003. Azeotropic phaseequilibrium diagrams: a survey. Chem. Eng. Sci. 58, 1903–1953.
Laroche, L., Andersen, H.W., Morari, M., Bekiaris, N., 1991.Homogeneous azeotropic distillation: comparing entrainers.Can. J. Chem. Eng. 69, 1302–1319.
Lelkes, Z., Lang, P., Benadda, B., Moszkowicz, P., 1998. Feasibilityof extractive distillation in a batch rectifier. AIChE J. 44, 810–822.
Lladosa, E., Montón, J.B., Burguet, M.C., Munoz, R., 2007. Effect ofpressure and the capability of 2methoxyethanol as a solventin the behaviour of a diisopropyl ether–isopropyl alcoholazeotropic mixture. Fluid Phase Equilibria 262, 271–279.
Lladosa, E., Montón, J.B., Burguet, M.C., De la Torre, J., 2008.Isobaric (vapour + liquid + liquid) equilibrium data for(dinpropyl ether + npropyl alcohol + water) and (diisopropylether + isopropyl alcohol + water) systems at 100 kPa. J. Chem.Thermodyn. 40, 867–873.
Logsdon, J.E., Loke, R.A., 2000. Isopropyl Alcohol. KirkOthmerEncyclopedia of Chemical Technology. Wiley, New York.
Luo, H., Liang, K., Li, W., Li, Y., Xia, M., Xu, C., 2014. Comparison ofpressureswing distillation and extractive distillationmethods for isopropyl alcohol/diisopropyl ether separation.Ind. Eng. Chem. Res. 53, 15167–15182.
Luyben, W.L., 2012. Pressureswing distillation for minimum andmaximumboiling homogeneous azeotropes. Ind. Eng. Chem.Res. 51, 10881–10886.
Luyben, W.L., Chien, I.L., 2010. Design and Control of DistillationSystems for Separating Azeotropes. Wiley, New York.
Petlyuck, F.B., 2004. Distillation Theory and its Application toOptimal Design of Separation Units. Cambridge UniversityPress, Cambridge, UK.
Petlyuk, F., Danilov, R., Burger, J., 2015. A novel method for thesearch and identification of feasible splits of extractivedistillations in ternary mixtures. Chem. Eng. Res. Des. 99,132–148.
Renon, H., Prausnitz, J.M., 1968. Local compositions inthermodynamic excess functions for liquid mixtures. AIChE J.14, 135–144.
RodríguezDonis, I., Gerbaud, V., Joulia, X., 2009a.Thermodynamic insights on the feasibility of homogeneousbatch extractive distillation. 1. Azeotropic mixtures withheavy entrainer. Ind. Eng. Chem. Res. 48, 3544–3559.
RodríguezDonis, I., Gerbaud, V., Joulia, X., 2009b.Thermodynamic insights on the feasibility of homogeneousbatch extractive distillation. 2. Lowrelativevolatility binarymixtures with a heavy entrainer. Ind. Eng. Chem. Res. 48,3560–3572.
RodríguezDonis, I., Gerbaud, V., Joulia, X., 2012a.Thermodynamic insights on the feasibility of homogeneousbatch extractive distillation. 3. Azeotropic mixtures with lightboiling entrainer. Ind. Eng. Chem. Res. 51, 4643–4660.
RodríguezDonis, I., Gerbaud, V., Joulia, X., 2012b.Thermodynamic insights on the feasibility of homogeneousbatch extractive distillation, 4.azeotropic mixtures withintermediate boiling entrainer. Ind. Eng. Chem. Res 51,6489–6501.
Shen, W., Gerbaud, V., 2013. Extension of thermodynamicinsights on batch extractive distillation to continuousoperation. 2. Azeotropic mixtures with a light entrainer. Ind.Eng. Chem. Res. 52, 4623–4637.
Shen, W., Benyounes, H., Gerbaud, V., 2013. Extension ofthermodynamic insights on batch extractive distillation tocontinuous operation. 1. Azeotropic mixtures with a heavyentrainer. Ind. Eng. Chem. Res. 52, 4606–4622.
Wang, S.J., Wong, D.S.H., Yu, S.W., 2008. Effect of entrainer loss onplantwide design and control of an isopropanol dehydrationprocess. Ind. Eng. Chem. Res. 47, 6672–6684.
You, X., RodriguezDonis, I., Gerbaud, V., 2014. Extractivedistillation process optimisation of the 1.01a class system,acetonemethanol with water. In: Klemes, J.J., Varbanov, S.V.,Liew, P.Y. (Eds.), 24th European Symposium on ComputerAided Process Engineering. Elsevier, Amsterdam, ISBN9780444634566.
You, X., Rodriguez Donis, I., Gerbaud, V., 2015a. Improved designand efficiency of the extractive distillation process foracetonemethanol with water. Ind. Eng. Chem. Res. 54,491–501.
You, X., Rodriguez Donis, I., Gerbaud, V., 2015b. Investigation ofseparation efficiency indicator for the optimization of theacetonemethanol extractive distillation with water. Ind. Eng.Chem. Res., http://dx.doi.org/10.1021/acs.iecr.5b02015.