Embed Size (px)
Citation preview
Proprietary property of c. myers corporation | Phoenix, Arizona | 800.238.7475 | www.cmyers.com | April 2015
Page 1 of 23
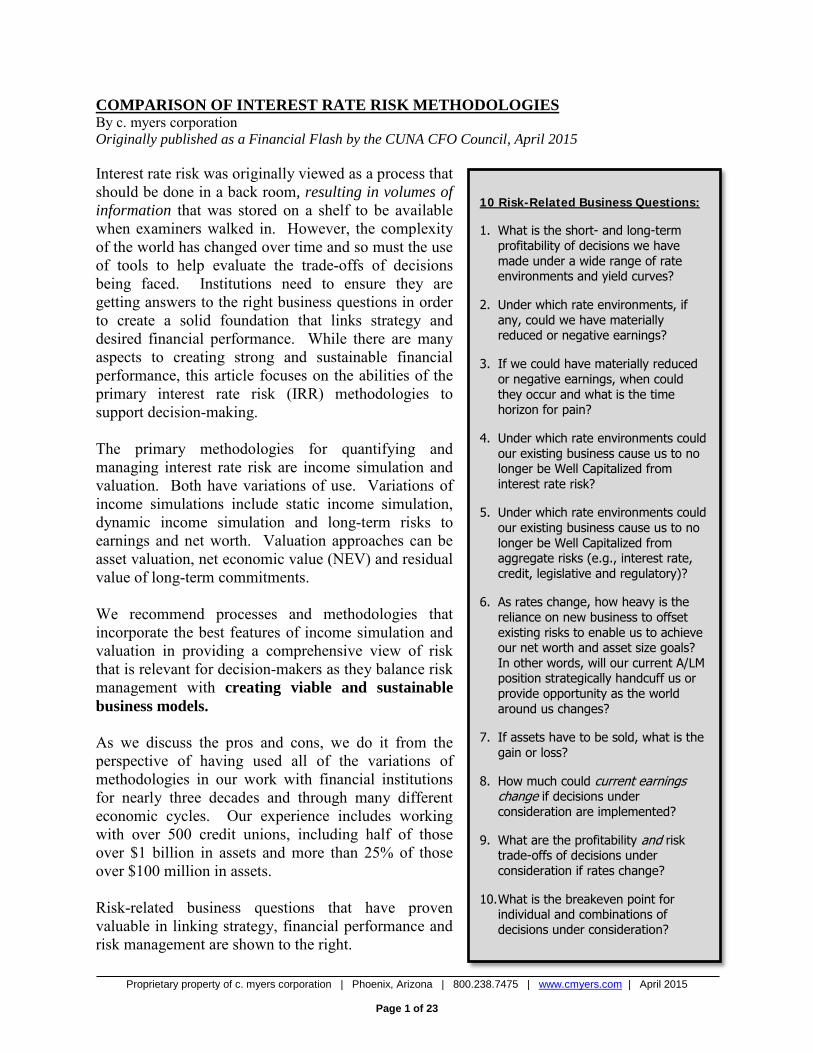
10 Risk-Related Business Questions:
1. What is the short- and long-term profitability of decisions we have made under a wide range of rate environments and yield curves?
2. Under which rate environments, if any, could we have materially reduced or negative earnings?
3. If we could have materially reduced or negative earnings, when could they occur and what is the time horizon for pain?
4. Under which rate environments could our existing business cause us to no longer be Well Capitalized from interest rate risk?
5. Under which rate environments could our existing business cause us to no longer be Well Capitalized from aggregate risks (e.g., interest rate, credit, legislative and regulatory)?
6. As rates change, how heavy is the reliance on new business to offset existing risks to enable us to achieve our net worth and asset size goals? In other words, will our current A/LM position strategically handcuff us or provide opportunity as the world around us changes?
7. If assets have to be sold, what is the gain or loss?
8. How much could current earnings change if decisions under consideration are implemented?
9. What are the profitability and risk trade-offs of decisions under consideration if rates change?
10.What is the breakeven point for individual and combinations of decisions under consideration?
COMPARISON OF INTEREST RATE RISK METHODOLOGIES By c. myers corporation Originally published as a Financial Flash by the CUNA CFO Council, April 2015 Interest rate risk was originally viewed as a process that should be done in a back room, resulting in volumes of information that was stored on a shelf to be available when examiners walked in. However, the complexity of the world has changed over time and so must the use of tools to help evaluate the trade-offs of decisions being faced. Institutions need to ensure they are getting answers to the right business questions in order to create a solid foundation that links strategy and desired financial performance. While there are many aspects to creating strong and sustainable financial performance, this article focuses on the abilities of the primary interest rate risk (IRR) methodologies to support decision-making. The primary methodologies for quantifying and managing interest rate risk are income simulation and valuation. Both have variations of use. Variations of income simulations include static income simulation, dynamic income simulation and long-term risks to earnings and net worth. Valuation approaches can be asset valuation, net economic value (NEV) and residual value of long-term commitments. We recommend processes and methodologies that incorporate the best features of income simulation and valuation in providing a comprehensive view of risk that is relevant for decision-makers as they balance risk management with creating viable and sustainable business models. As we discuss the pros and cons, we do it from the perspective of having used all of the variations of methodologies in our work with financial institutions for nearly three decades and through many different economic cycles. Our experience includes working with over 500 credit unions, including half of those over $1 billion in assets and more than 25% of those over $100 million in assets. Risk-related business questions that have proven valuable in linking strategy, financial performance and risk management are shown to the right.
Proprietary property of c. myers corporation | Phoenix, Arizona | 800.238.7475 | www.cmyers.com | April 2015
Page 2 of 23
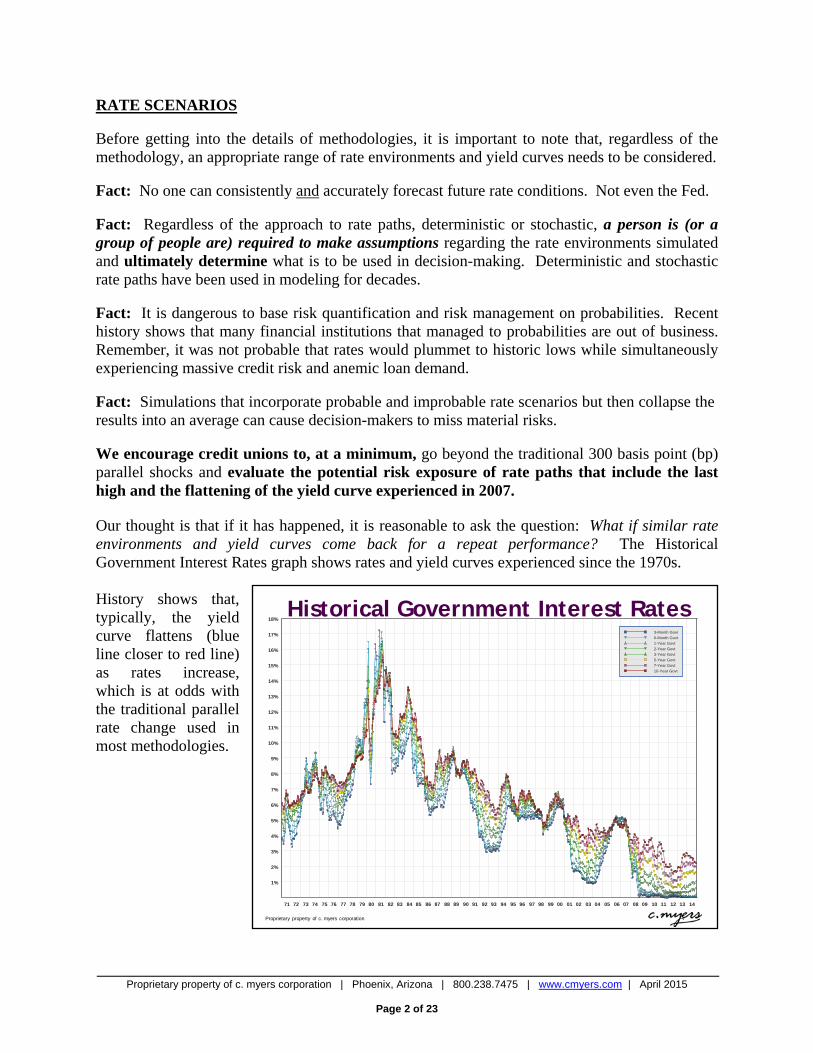
RATE SCENARIOS Before getting into the details of methodologies, it is important to note that, regardless of the methodology, an appropriate range of rate environments and yield curves needs to be considered. Fact: No one can consistently and accurately forecast future rate conditions. Not even the Fed. Fact: Regardless of the approach to rate paths, deterministic or stochastic, a person is (or a group of people are) required to make assumptions regarding the rate environments simulated and ultimately determine what is to be used in decision-making. Deterministic and stochastic rate paths have been used in modeling for decades. Fact: It is dangerous to base risk quantification and risk management on probabilities. Recent history shows that many financial institutions that managed to probabilities are out of business. Remember, it was not probable that rates would plummet to historic lows while simultaneously experiencing massive credit risk and anemic loan demand. Fact: Simulations that incorporate probable and improbable rate scenarios but then collapse the results into an average can cause decision-makers to miss material risks. We encourage credit unions to, at a minimum, go beyond the traditional 300 basis point (bp) parallel shocks and evaluate the potential risk exposure of rate paths that include the last high and the flattening of the yield curve experienced in 2007. Our thought is that if it has happened, it is reasonable to ask the question: What if similar rate environments and yield curves come back for a repeat performance? The Historical Government Interest Rates graph shows rates and yield curves experienced since the 1970s. History shows that, typically, the yield curve flattens (blue line closer to red line) as rates increase, which is at odds with the traditional parallel rate change used in most methodologies.
Proprietary property of c. myers corporation
18%
17%
16%
15%
14%
13%
12%
11%
10%
9%
8%
7%
6%
5%
4%
3%
2%
1%
71 72 73 74 75 76 77 78 79 80 81 82 83 84 85 86 87 88 89 90 91 92 93 94 95 96 97 98 99 00 01 02 03 04 05 06 07 08 09 10 11 12 13 14
3-Month Govt6-Month Govt1-Year Govt2-Year Govt3-Year Govt5-Year Govt7-Year Govt10-Year Govt
Historical Government Interest Rates
Proprietary property of c. myers corporation | Phoenix, Arizona | 800.238.7475 | www.cmyers.com | April 2015
Page 3 of 23
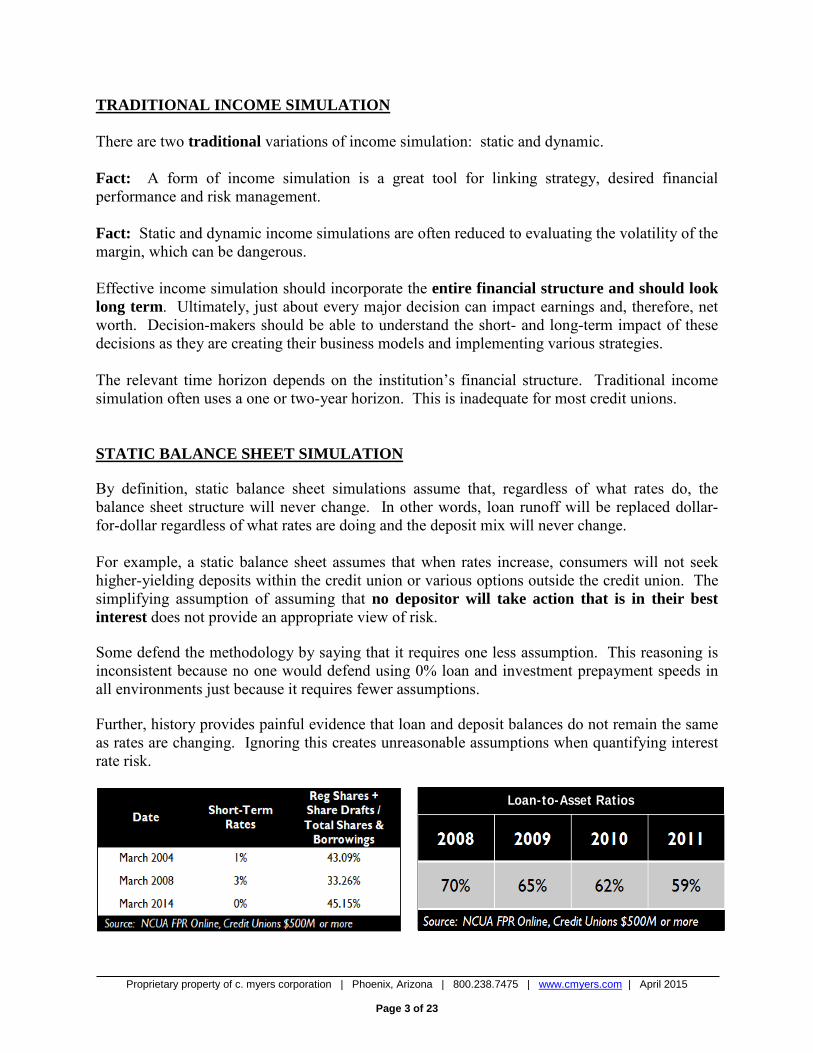
TRADITIONAL INCOME SIMULATION There are two traditional variations of income simulation: static and dynamic. Fact: A form of income simulation is a great tool for linking strategy, desired financial performance and risk management. Fact: Static and dynamic income simulations are often reduced to evaluating the volatility of the margin, which can be dangerous. Effective income simulation should incorporate the entire financial structure and should look long term. Ultimately, just about every major decision can impact earnings and, therefore, net worth. Decision-makers should be able to understand the short- and long-term impact of these decisions as they are creating their business models and implementing various strategies. The relevant time horizon depends on the institution’s financial structure. Traditional income simulation often uses a one or two-year horizon. This is inadequate for most credit unions. STATIC BALANCE SHEET SIMULATION By definition, static balance sheet simulations assume that, regardless of what rates do, the balance sheet structure will never change. In other words, loan runoff will be replaced dollar-for-dollar regardless of what rates are doing and the deposit mix will never change. For example, a static balance sheet assumes that when rates increase, consumers will not seek higher-yielding deposits within the credit union or various options outside the credit union. The simplifying assumption of assuming that no depositor will take action that is in their best interest does not provide an appropriate view of risk. Some defend the methodology by saying that it requires one less assumption. This reasoning is inconsistent because no one would defend using 0% loan and investment prepayment speeds in all environments just because it requires fewer assumptions. Further, history provides painful evidence that loan and deposit balances do not remain the same as rates are changing. Ignoring this creates unreasonable assumptions when quantifying interest rate risk.
Loan-to-Asset Ratios
Proprietary property of c. myers corporation | Phoenix, Arizona | 800.238.7475 | www.cmyers.com | April 2015
Page 4 of 23
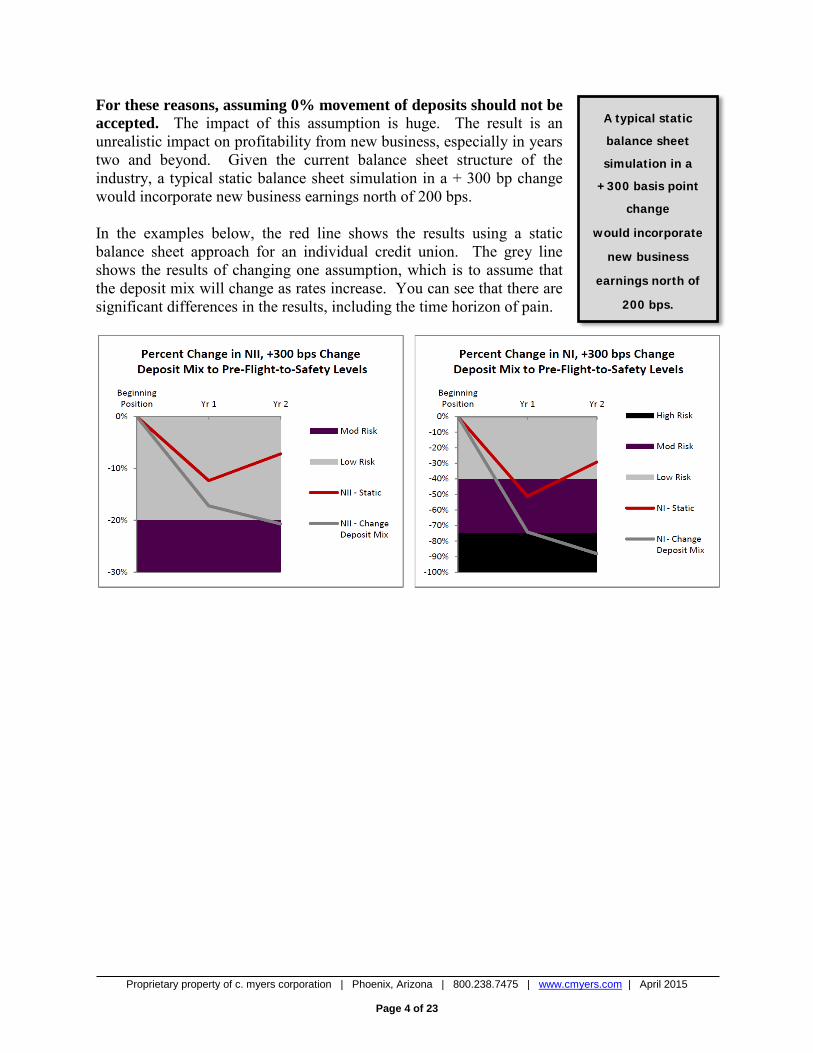
A typical static
balance sheet
simulation in a
+300 basis point
change
would incorporate
new business
earnings north of
200 bps.
For these reasons, assuming 0% movement of deposits should not be accepted. The impact of this assumption is huge. The result is an unrealistic impact on profitability from new business, especially in years two and beyond. Given the current balance sheet structure of the industry, a typical static balance sheet simulation in a + 300 bp change would incorporate new business earnings north of 200 bps. In the examples below, the red line shows the results using a static balance sheet approach for an individual credit union. The grey line shows the results of changing one assumption, which is to assume that the deposit mix will change as rates increase. You can see that there are significant differences in the results, including the time horizon of pain.
Proprietary property of c. myers corporation | Phoenix, Arizona | 800.238.7475 | www.cmyers.com | April 2015
Page 5 of 23
The following highlights some pros and cons of static balance sheet methodology. They are not listed in order of priority. Pros: The new business assumptions are easy to understand
It is easy to simulate
Because it is familiar, many find it easy to compare results across institutions
It’s been around for a long time
It deals in terms and concepts that most understand, such as dollars of net interest income and net income
Cons: It does not disclose real risk for individual institutions. For example, it assumes:
o Deposits never leave and that the mix never changes. These simplifying assumptions hide a major source of interest rate risk. Back testing this assumption to history shows a huge flaw
o All loans will always be replaced, including discontinued product offerings. History demonstrates that loans-to-assets fluctuate
It assumes irrationally high profitability on new business in a rising rate environment. Therefore, total simulated profitability is unreasonable for assessing risks. This can create a false sense of security for decision-makers
The traditional one to two-year time horizon does not adequately disclose risk. Extending a static balance sheet simulation will exacerbate the weaknesses. The unrealistic assumption on new business profitability becomes a larger component of the simulation which further masks existing risks
The following table summarizes how often the 10 risk-related business questions are addressed by static balance sheet simulations.
Risk-Related Business Questions Addressed
Methodology Typically Seldom No Net Income (NI): Static 8 2,3,9,10 1,4,5,6,7
NOTE: The 10 risk-related business questions can be found on page 1.
DYNAMIC BALANCE SHEET SIMULATION The most common use of dynamic balance sheet simulations is to create budgets. Budgets are based on expectations of what decision-makers think may happen. Budgeting is a key tool for managing a business and should not be confused with quantifying interest rate risk.
Proprietary property of c. myers corporation | Phoenix, Arizona | 800.238.7475 | www.cmyers.com | April 2015
Page 6 of 23
Unfortunately, most institutions that perform dynamic balance sheet simulations for risk quantification simply take their budget (plan), change the rate environment and assume that planned growth will always come true, regardless of what rates do. The problem is that this process takes the concerns about the static methodology and magnifies the issues. In reality, what an institution expects will happen (budget) is often opposite of what could occur if the environment changes materially (risk). Dynamic simulations that start by answering the question, what can go wrong if rates change materially?, are better positioned for analyzing interest rate risk. As a result, the assumptions about what could happen to loan accounts, deposit accounts and even investments would be quite different than a budget. The following highlights some pros and cons of dynamic balance sheet methodology. They are not listed in order of priority. Pros: Loan and deposit mix and balances can change as rates are changing. If this is done with
the emphasis being on risk, not budget, then simulations can be used to understand risks to earnings and net worth
It’s been around for a long time
It can capture risk of an individual institution better than static if used appropriately Cons: It is heavily dependent on new business assumptions
To get a realistic depiction of risks to earnings and net worth, new business assumptions for asset and deposit mix and rates would need to be considered for each rate scenario simulated. This can require a material investment of time for decision-makers; therefore, it is rarely done
The objectives are often confused with budgeting and forecasting
For ease of use, many take their budgets and, when applying rate shocks, assume the budget will come true regardless of the rate environment
The following table summarizes how often the 10 risk-related business questions are addressed by dynamic balance sheet simulations.
Risk-Related Business Questions Addressed Methodology Typically Seldom No Net Income (NI): Dynamic 8 1,2,3,4,5,6,9,10 7
NOTE: The 10 risk-related business questions can be found on page 1.
Proprietary property of c. myers corporation | Phoenix, Arizona | 800.238.7475 | www.cmyers.com | April 2015
Page 7 of 23
NET ECONOMIC VALUE Fact: Understanding potential changes in values of readily saleable assets plays an important role in the risk management process. It is particularly important to understand potential market value losses should a credit union need to sell assets to support liquidity needs, whether liquidity is needed to support loan demand or unexpected outflows of deposits. Fact: Understanding changes in value is not the same as NEV. Fact: The NEV ratio is not synonymous with the net worth ratio. Fact: NEV is not an indication of future earnings capacity. C. myers conducts NEV analyses for hundreds of credit unions. We have found that it can be valuable to discuss and clarify the objectives for NEV simulations. Is the objective liquidation or a going concern? As we write this paper, the definition of NEV is coming into question. Traditionally, NCUA has defined NEV as the fair value of assets minus the fair value of liabilities. Fair value has been defined as:
“Fair value means the amount at which an instrument could be exchanged in a current, arms-length transaction between willing parties, as opposed to a forced or liquidation sale.”
One reason the definition is coming into question is that many uses of core deposit studies are showing tremendous economic benefit. When these economic benefits are used in NEV simulations, the results often show the credit union has fairly low or no risk as rates rise, even if the credit union has relatively long assets. This assumption, with essentially a few keystrokes, can actually change the direction of the results. Further, favorable deposit values can result in a high beginning NEV. This can skew both NEV volatility and the NEV ratio for shocked environments. As a matter of fact, in 90% of the model validations we do, we observe that the current NEV ratio is higher than the current net worth ratio with an average premium of 23%. This is an unreasonable starting point. The wild card of how to value non-maturity deposits is creating serious angst with examiners and practitioners. For this reason, some examiners are now requesting that credit unions establish risk limits, and therefore make business decisions, assuming shares at par. Making business decisions based either on NEV shares at par or NEV results showing unreasonably high deposit values can mislead decision-makers.
Proprietary property of c. myers corporation | Phoenix, Arizona | 800.238.7475 | www.cmyers.com | April 2015
Page 8 of 23
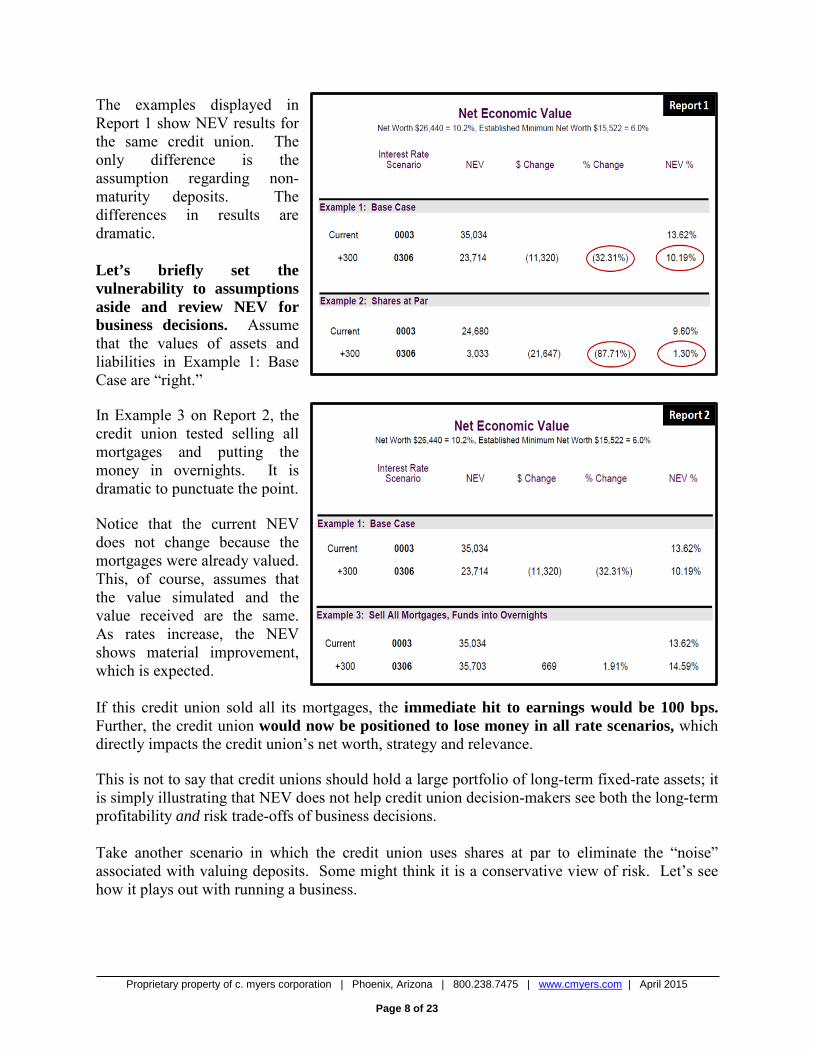
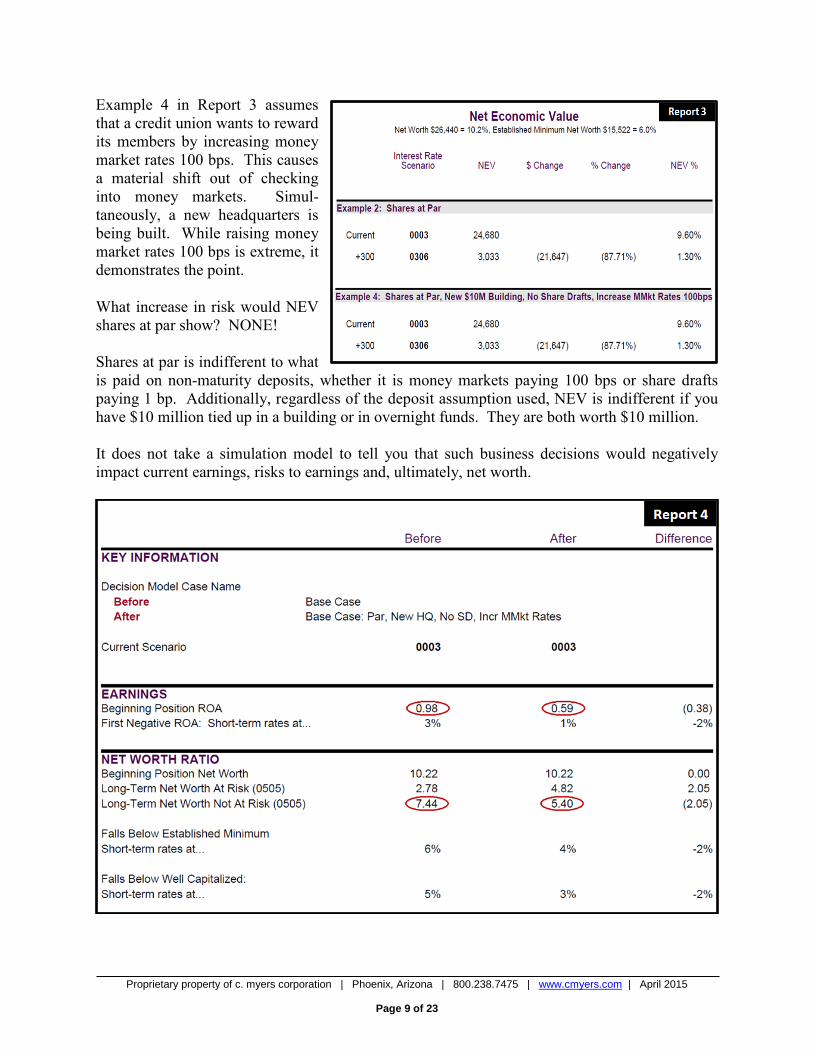
The examples displayed in Report 1 show NEV results for the same credit union. The only difference is the assumption regarding non-maturity deposits. The differences in results are dramatic. Let’s briefly set the vulnerability to assumptions aside and review NEV for business decisions. Assume that the values of assets and liabilities in Example 1: Base Case are “right.” In Example 3 on Report 2, the credit union tested selling all mortgages and putting the money in overnights. It is dramatic to punctuate the point. Notice that the current NEV does not change because the mortgages were already valued. This, of course, assumes that the value simulated and the value received are the same. As rates increase, the NEV shows material improvement, which is expected. If this credit union sold all its mortgages, the immediate hit to earnings would be 100 bps. Further, the credit union would now be positioned to lose money in all rate scenarios, which directly impacts the credit union’s net worth, strategy and relevance. This is not to say that credit unions should hold a large portfolio of long-term fixed-rate assets; it is simply illustrating that NEV does not help credit union decision-makers see both the long-term profitability and risk trade-offs of business decisions. Take another scenario in which the credit union uses shares at par to eliminate the “noise” associated with valuing deposits. Some might think it is a conservative view of risk. Let’s see how it plays out with running a business.
Proprietary property of c. myers corporation | Phoenix, Arizona | 800.238.7475 | www.cmyers.com | April 2015
Page 9 of 23
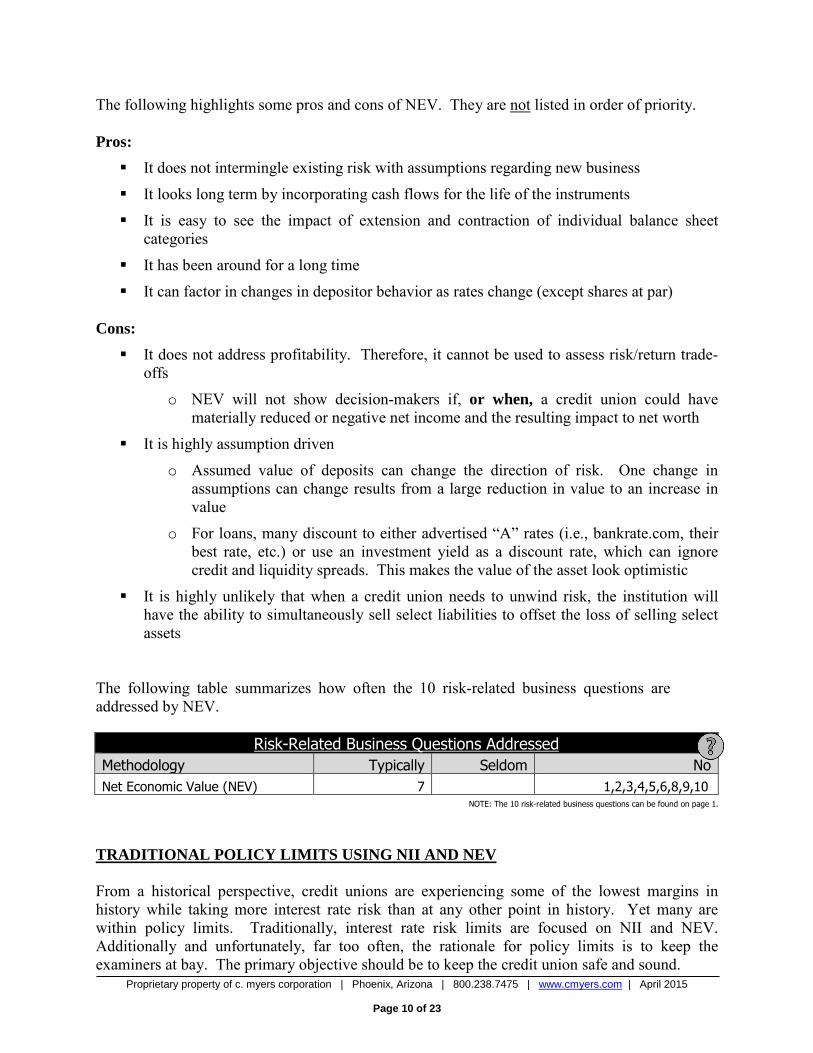
Example 4 in Report 3 assumes that a credit union wants to reward its members by increasing money market rates 100 bps. This causes a material shift out of checking into money markets. Simul-taneously, a new headquarters is being built. While raising money market rates 100 bps is extreme, it demonstrates the point. What increase in risk would NEV shares at par show? NONE! Shares at par is indifferent to what is paid on non-maturity deposits, whether it is money markets paying 100 bps or share drafts paying 1 bp. Additionally, regardless of the deposit assumption used, NEV is indifferent if you have $10 million tied up in a building or in overnight funds. They are both worth $10 million. It does not take a simulation model to tell you that such business decisions would negatively impact current earnings, risks to earnings and, ultimately, net worth.
Proprietary property of c. myers corporation | Phoenix, Arizona | 800.238.7475 | www.cmyers.com | April 2015
Page 10 of 23
The following highlights some pros and cons of NEV. They are not listed in order of priority. Pros: It does not intermingle existing risk with assumptions regarding new business
It looks long term by incorporating cash flows for the life of the instruments
It is easy to see the impact of extension and contraction of individual balance sheet categories
It has been around for a long time
It can factor in changes in depositor behavior as rates change (except shares at par) Cons: It does not address profitability. Therefore, it cannot be used to assess risk/return trade-
offs
o NEV will not show decision-makers if, or when, a credit union could have materially reduced or negative net income and the resulting impact to net worth
It is highly assumption driven
o Assumed value of deposits can change the direction of risk. One change in assumptions can change results from a large reduction in value to an increase in value
o For loans, many discount to either advertised “A” rates (i.e., bankrate.com, their best rate, etc.) or use an investment yield as a discount rate, which can ignore credit and liquidity spreads. This makes the value of the asset look optimistic
It is highly unlikely that when a credit union needs to unwind risk, the institution will have the ability to simultaneously sell select liabilities to offset the loss of selling select assets
The following table summarizes how often the 10 risk-related business questions are addressed by NEV.
Risk-Related Business Questions Addressed Methodology Typically Seldom No Net Economic Value (NEV) 7 1,2,3,4,5,6,8,9,10
NOTE: The 10 risk-related business questions can be found on page 1.
TRADITIONAL POLICY LIMITS USING NII AND NEV From a historical perspective, credit unions are experiencing some of the lowest margins in history while taking more interest rate risk than at any other point in history. Yet many are within policy limits. Traditionally, interest rate risk limits are focused on NII and NEV. Additionally and unfortunately, far too often, the rationale for policy limits is to keep the examiners at bay. The primary objective should be to keep the credit union safe and sound.
Proprietary property of c. myers corporation | Phoenix, Arizona | 800.238.7475 | www.cmyers.com | April 2015
Page 11 of 23
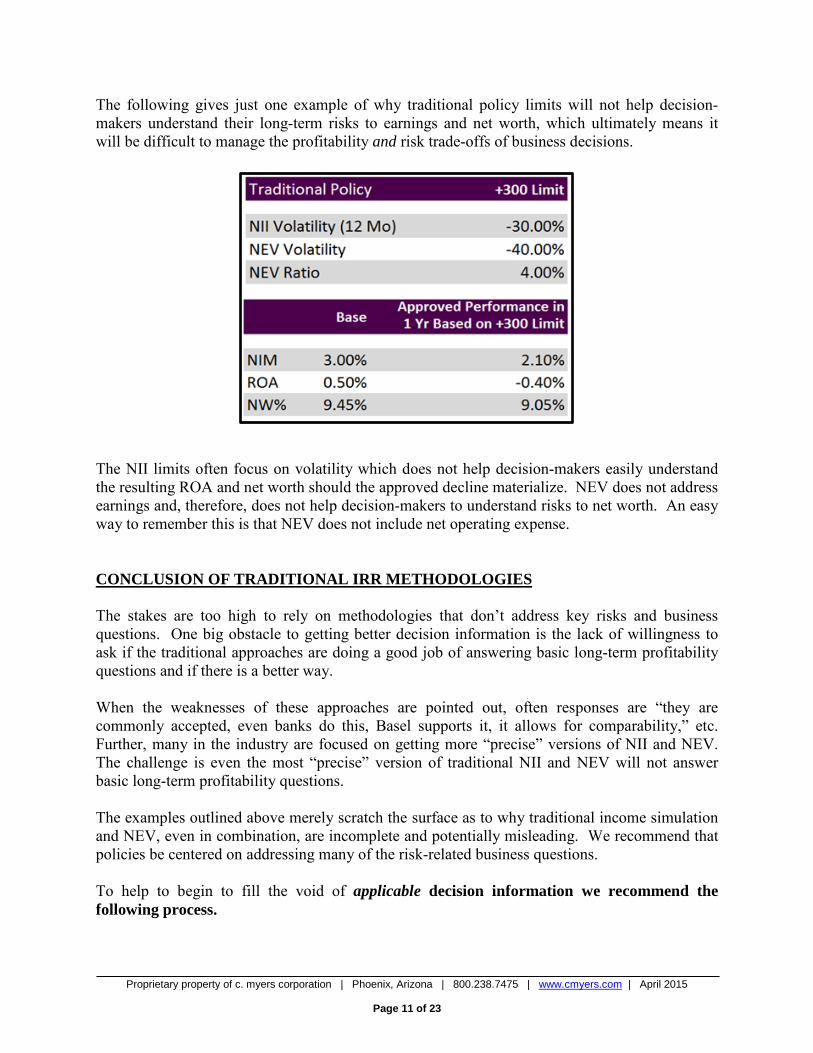
The following gives just one example of why traditional policy limits will not help decision-makers understand their long-term risks to earnings and net worth, which ultimately means it will be difficult to manage the profitability and risk trade-offs of business decisions.
The NII limits often focus on volatility which does not help decision-makers easily understand the resulting ROA and net worth should the approved decline materialize. NEV does not address earnings and, therefore, does not help decision-makers to understand risks to net worth. An easy way to remember this is that NEV does not include net operating expense. CONCLUSION OF TRADITIONAL IRR METHODOLOGIES The stakes are too high to rely on methodologies that don’t address key risks and business questions. One big obstacle to getting better decision information is the lack of willingness to ask if the traditional approaches are doing a good job of answering basic long-term profitability questions and if there is a better way. When the weaknesses of these approaches are pointed out, often responses are “they are commonly accepted, even banks do this, Basel supports it, it allows for comparability,” etc. Further, many in the industry are focused on getting more “precise” versions of NII and NEV. The challenge is even the most “precise” version of traditional NII and NEV will not answer basic long-term profitability questions. The examples outlined above merely scratch the surface as to why traditional income simulation and NEV, even in combination, are incomplete and potentially misleading. We recommend that policies be centered on addressing many of the risk-related business questions. To help to begin to fill the void of applicable decision information we recommend the following process.
Proprietary property of c. myers corporation | Phoenix, Arizona | 800.238.7475 | www.cmyers.com | April 2015
Page 12 of 23
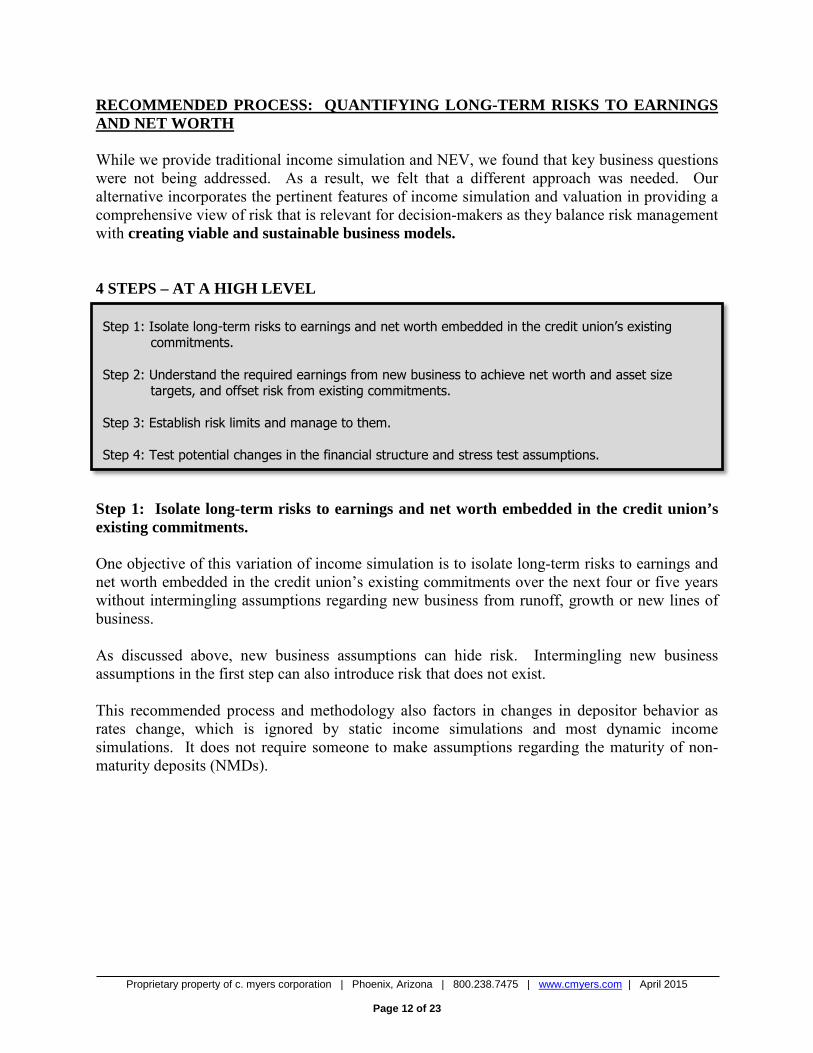
Step 1: Isolate long-term risks to earnings and net worth embedded in the credit union’s existing commitments.
Step 2: Understand the required earnings from new business to achieve net worth and asset size
targets, and offset risk from existing commitments. Step 3: Establish risk limits and manage to them. Step 4: Test potential changes in the financial structure and stress test assumptions.
RECOMMENDED PROCESS: QUANTIFYING LONG-TERM RISKS TO EARNINGS AND NET WORTH While we provide traditional income simulation and NEV, we found that key business questions were not being addressed. As a result, we felt that a different approach was needed. Our alternative incorporates the pertinent features of income simulation and valuation in providing a comprehensive view of risk that is relevant for decision-makers as they balance risk management with creating viable and sustainable business models. 4 STEPS – AT A HIGH LEVEL
Step 1: Isolate long-term risks to earnings and net worth embedded in the credit union’s existing commitments. One objective of this variation of income simulation is to isolate long-term risks to earnings and net worth embedded in the credit union’s existing commitments over the next four or five years without intermingling assumptions regarding new business from runoff, growth or new lines of business. As discussed above, new business assumptions can hide risk. Intermingling new business assumptions in the first step can also introduce risk that does not exist. This recommended process and methodology also factors in changes in depositor behavior as rates change, which is ignored by static income simulations and most dynamic income simulations. It does not require someone to make assumptions regarding the maturity of non-maturity deposits (NMDs).
Proprietary property of c. myers corporation | Phoenix, Arizona | 800.238.7475 | www.cmyers.com | April 2015
Page 13 of 23
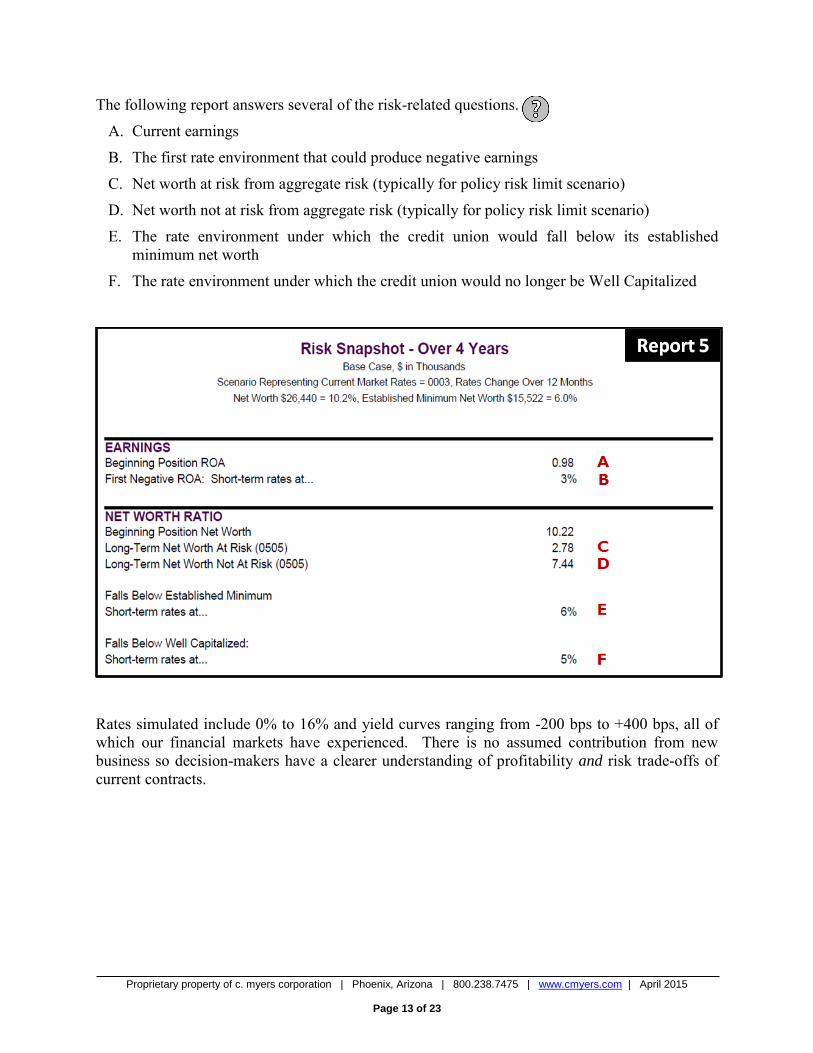
The following report answers several of the risk-related questions.
A. Current earnings
B. The first rate environment that could produce negative earnings
C. Net worth at risk from aggregate risk (typically for policy risk limit scenario)
D. Net worth not at risk from aggregate risk (typically for policy risk limit scenario)
E. The rate environment under which the credit union would fall below its established minimum net worth
F. The rate environment under which the credit union would no longer be Well Capitalized
Rates simulated include 0% to 16% and yield curves ranging from -200 bps to +400 bps, all of which our financial markets have experienced. There is no assumed contribution from new business so decision-makers have a clearer understanding of profitability and risk trade-offs of current contracts.
Proprietary property of c. myers corporation | Phoenix, Arizona | 800.238.7475 | www.cmyers.com | April 2015
Page 14 of 23
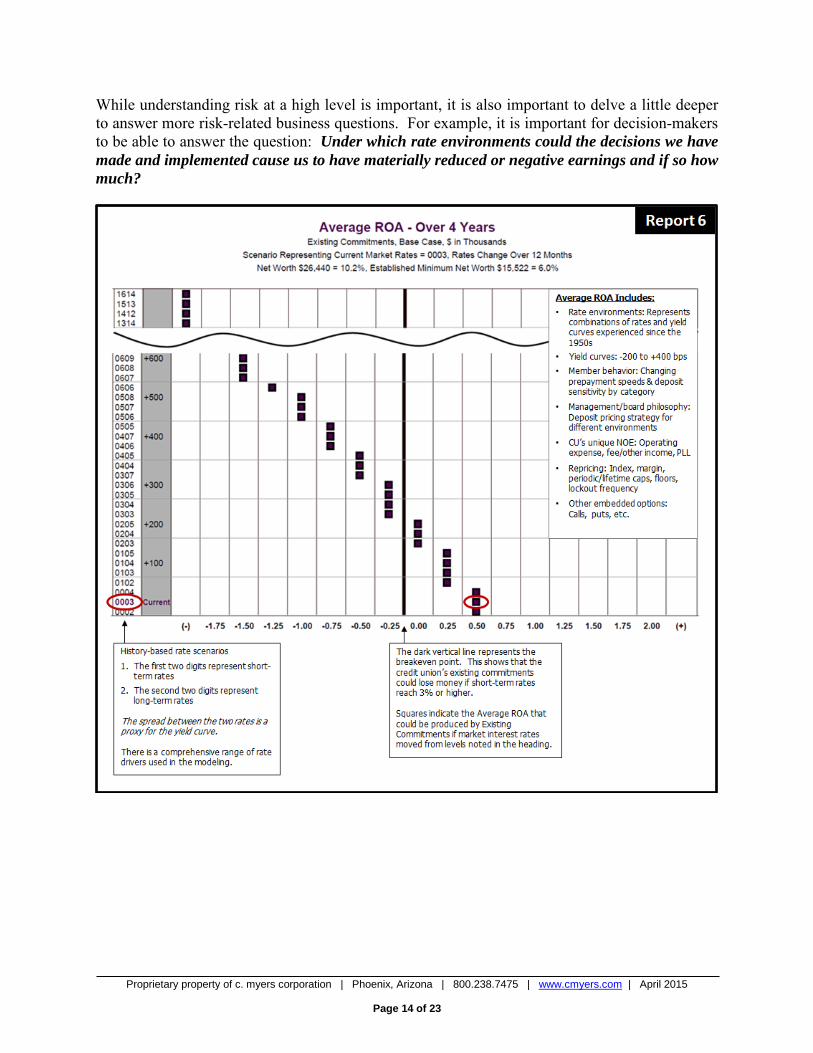
While understanding risk at a high level is important, it is also important to delve a little deeper to answer more risk-related business questions. For example, it is important for decision-makers to be able to answer the question: Under which rate environments could the decisions we have made and implemented cause us to have materially reduced or negative earnings and if so how much?
Proprietary property of c. myers corporation | Phoenix, Arizona | 800.238.7475 | www.cmyers.com | April 2015
Page 15 of 23
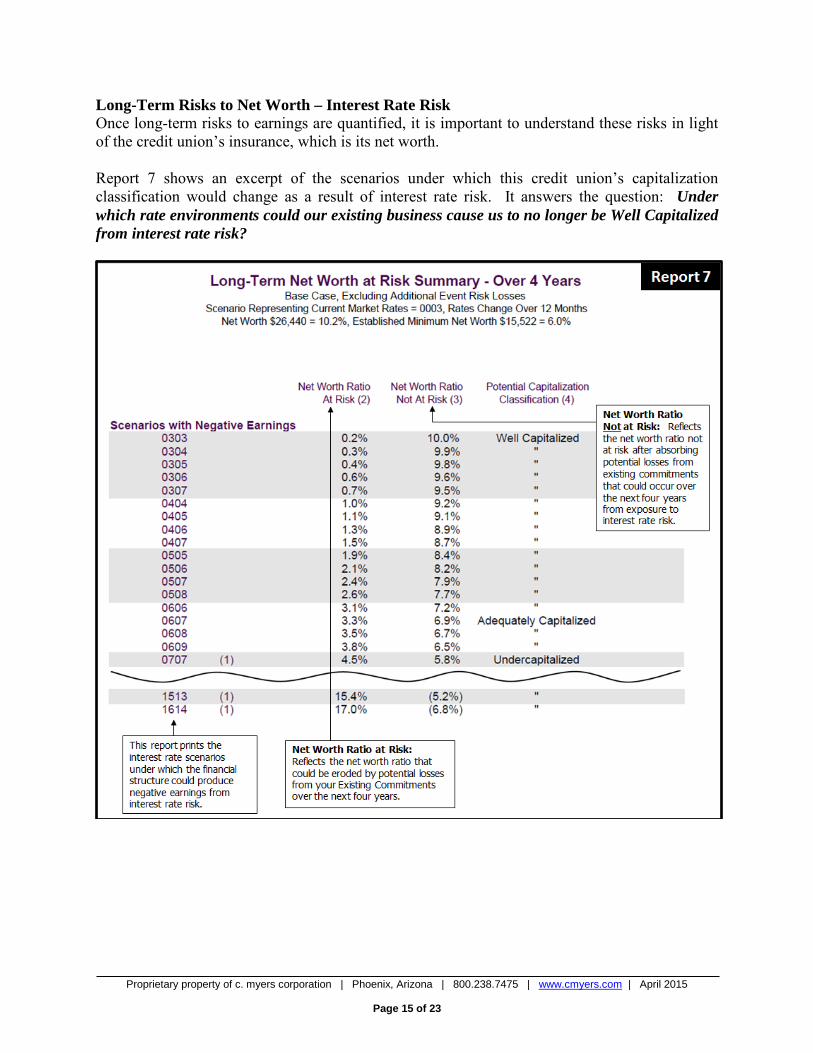
Long-Term Risks to Net Worth – Interest Rate Risk Once long-term risks to earnings are quantified, it is important to understand these risks in light of the credit union’s insurance, which is its net worth. Report 7 shows an excerpt of the scenarios under which this credit union’s capitalization classification would change as a result of interest rate risk. It answers the question: Under which rate environments could our existing business cause us to no longer be Well Capitalized from interest rate risk?
Proprietary property of c. myers corporation | Phoenix, Arizona | 800.238.7475 | www.cmyers.com | April 2015
Page 16 of 23
Long-Term Risks to Net Worth with Residual Value (A combination of income simulation and valuation.) For those credit unions with material amounts of existing commitments remaining beyond the four or five-year horizon, we recommend that decision-makers understand the residual risk. The residual value methodology is designed to answer the question: How does our net worth hold up, if after four (or five) years, we decide to “close out” our risk? This approach begins with the potential earnings or losses from the existing commitments. It then closes out the remaining risk by valuing relevant portions of the remaining existing commitments at the end of the income simulation period and incorporates the valuation fluctuations into the assessment of net worth at risk. The objective for most credit unions is to stay in business rather than to sell all assets and liabilities. Therefore, the foundation of their assessment of risk should be based on the long-term profitability of their business model. There are several advantages to such an approach. The wild card of deposit valuations, essential to NEV simulations, is removed. The earnings simulation over four or five years incorporates the benefit of NMDs along with the timing of the benefit. At the end of the period, the material remaining risk is closed out. The residual value approach also allows decision-makers to understand their risk using the entire financial structure. This is key because a credit union’s ability to withstand residual risk is influenced by its bottom-line income and the impact it has on net worth. Long-Term Risks to Net Worth – Aggregate Risks The type and magnitude of risks faced by credit unions vary, as strategy and business models are unique. Other key risks often considered beyond interest rate risk include credit, cyber-security, fraud, liquidity, strategic threats with respect to payments and other sources of non-interest income, to name a few. We agree with the following quote from NCUA’s Supervisory Letter on Concentration Risk:
“One of the common flaws in managing risks within a credit union is to tie each risk independently to net worth, without monitoring the aggregate exposure of different risks to net worth. The result may be excessive reliance on the level of net worth to manage each individual risk.”
Fact: History shows that rarely do bad things happen in silos. The silo approach to risk management can cause a false sense of security resulting in decision-makers being blindsided. A credit union can be within individually established interest rate risk, credit risk, liquidity risk and concentration risk limits and still have a material level of risk beyond what its net worth can withstand.
Proprietary property of c. myers corporation | Phoenix, Arizona | 800.238.7475 | www.cmyers.com | April 2015
Page 17 of 23
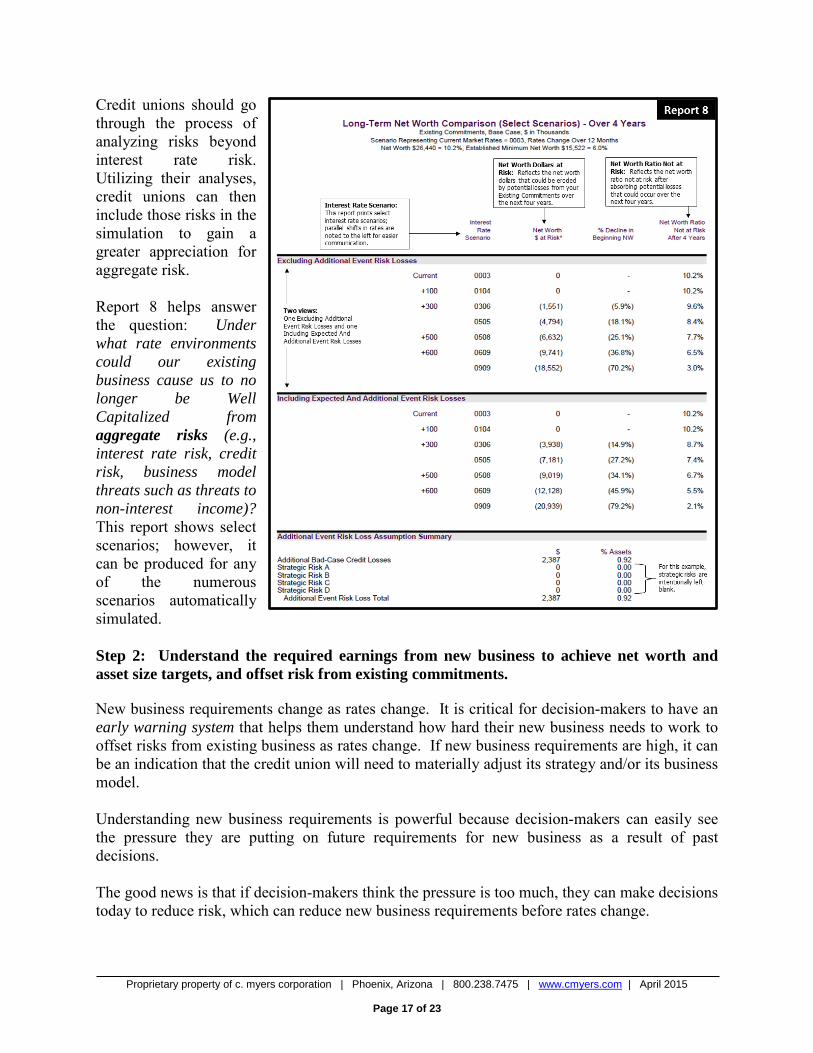
Credit unions should go through the process of analyzing risks beyond interest rate risk. Utilizing their analyses, credit unions can then include those risks in the simulation to gain a greater appreciation for aggregate risk. Report 8 helps answer the question: Under what rate environments could our existing business cause us to no longer be Well Capitalized from aggregate risks (e.g., interest rate risk, credit risk, business model threats such as threats to non-interest income)? This report shows select scenarios; however, it can be produced for any of the numerous scenarios automatically simulated. Step 2: Understand the required earnings from new business to achieve net worth and asset size targets, and offset risk from existing commitments. New business requirements change as rates change. It is critical for decision-makers to have an early warning system that helps them understand how hard their new business needs to work to offset risks from existing business as rates change. If new business requirements are high, it can be an indication that the credit union will need to materially adjust its strategy and/or its business model. Understanding new business requirements is powerful because decision-makers can easily see the pressure they are putting on future requirements for new business as a result of past decisions. The good news is that if decision-makers think the pressure is too much, they can make decisions today to reduce risk, which can reduce new business requirements before rates change.
Proprietary property of c. myers corporation | Phoenix, Arizona | 800.238.7475 | www.cmyers.com | April 2015
Page 18 of 23
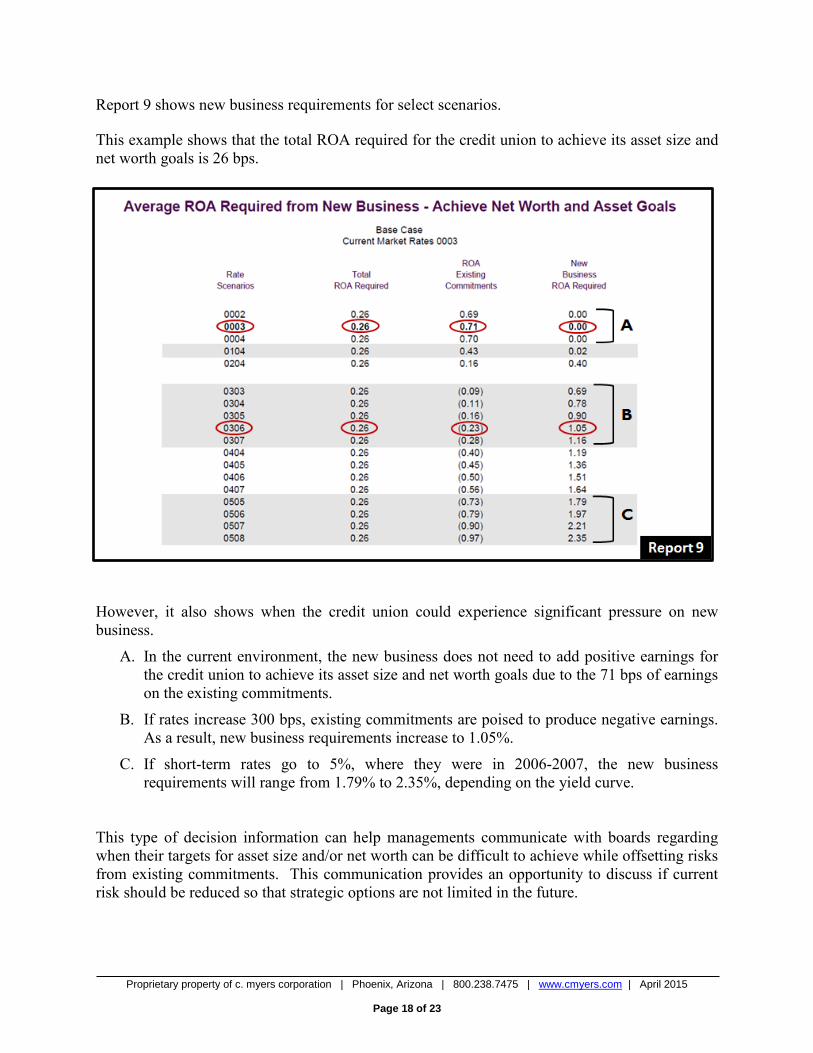
Report 9 shows new business requirements for select scenarios. This example shows that the total ROA required for the credit union to achieve its asset size and net worth goals is 26 bps.
However, it also shows when the credit union could experience significant pressure on new business.
A. In the current environment, the new business does not need to add positive earnings for the credit union to achieve its asset size and net worth goals due to the 71 bps of earnings on the existing commitments.
B. If rates increase 300 bps, existing commitments are poised to produce negative earnings. As a result, new business requirements increase to 1.05%.
C. If short-term rates go to 5%, where they were in 2006-2007, the new business requirements will range from 1.79% to 2.35%, depending on the yield curve.
This type of decision information can help managements communicate with boards regarding when their targets for asset size and/or net worth can be difficult to achieve while offsetting risks from existing commitments. This communication provides an opportunity to discuss if current risk should be reduced so that strategic options are not limited in the future.
Proprietary property of c. myers corporation | Phoenix, Arizona | 800.238.7475 | www.cmyers.com | April 2015
Page 19 of 23
Step 3: Establish risk limits and manage to them. Board and management agree on how much risk is acceptable and manage within their appetite for risk. This only works if decision-makers take appropriate actions, timely, to manage within their appetite for risk. This often requires tough decisions. Managing to risk limits can result in lost opportunities for net income in the current rate and economic environments to protect against the uncertainty of future rate and economic environments. Step 4: Test potential changes in the financial structure and stress test assumptions. Stress testing key assumptions such as prepayments and deposit withdrawals is a necessary component to the risk management process. “What-ifing” assumptions regarding new business and new lines of business, in advance of implementing decisions, is also a critical component of the risk management process. Stress test key assumptions to answer:
What if our assumptions are wrong? Does the direction of risk change? Does the magnitude of risk change materially such that we should do something different
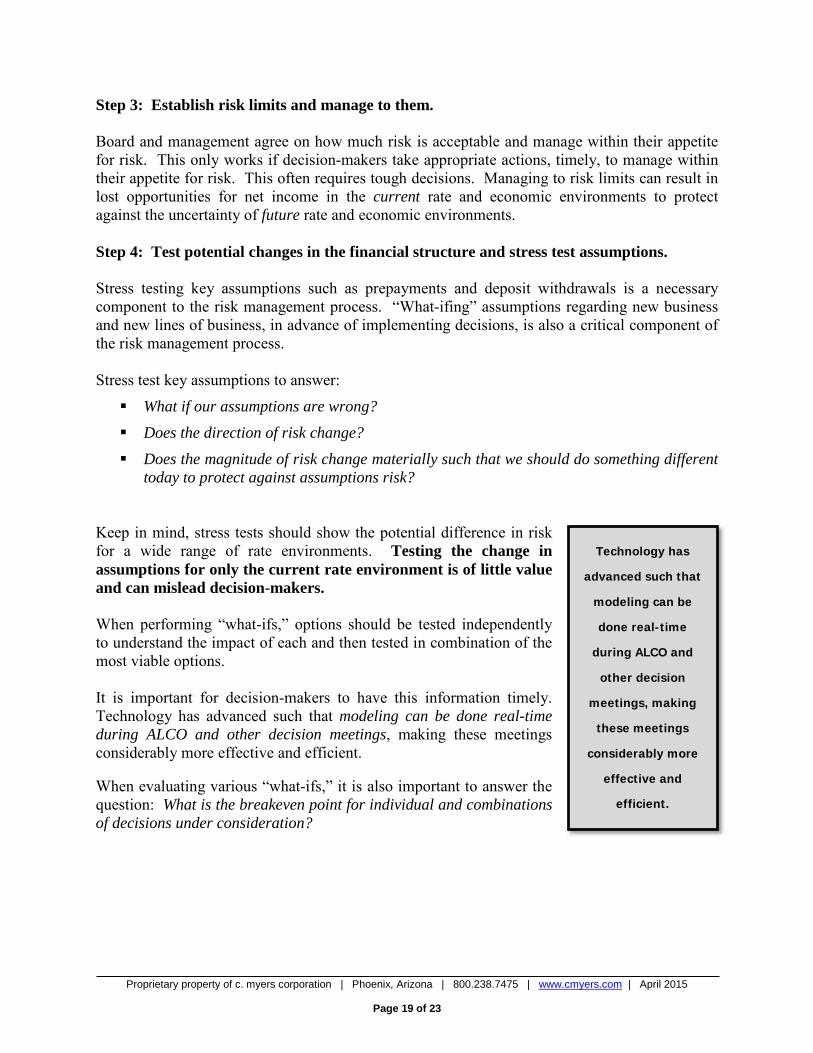
today to protect against assumptions risk? Keep in mind, stress tests should show the potential difference in risk for a wide range of rate environments. Testing the change in assumptions for only the current rate environment is of little value and can mislead decision-makers. When performing “what-ifs,” options should be tested independently to understand the impact of each and then tested in combination of the most viable options. It is important for decision-makers to have this information timely. Technology has advanced such that modeling can be done real-time during ALCO and other decision meetings, making these meetings considerably more effective and efficient. When evaluating various “what-ifs,” it is also important to answer the question: What is the breakeven point for individual and combinations of decisions under consideration?
Technology has
advanced such that
modeling can be
done real-time
during ALCO and
other decision
meetings, making
these meetings
considerably more
effective and
efficient.
Proprietary property of c. myers corporation | Phoenix, Arizona | 800.238.7475 | www.cmyers.com | April 2015
Page 20 of 23
The following highlights some pros and cons of Long-Term Risks to Earnings and Net Worth methodology. They are not listed in order of priority. Pros: It quantifies short- and long-term profitability and risks from existing commitments
It does not intermingle existing risk with assumptions regarding new business
It shows decision-makers what new business profitability needs to be in order to offset existing risks
It automatically factors in changes in depositor behavior as rates change
o The approach is designed so that it is very difficult to hide risk. There are built-in checks and balances. For example, if deposit pricing assumptions are low in a rising rate environment, the advantage for the consumer to move their funds will increase, resulting in more withdrawals, which would increase the cost of funds
It can capture interest rate risk and aggregate risk of an individual institution
It automatically simulates risks to profitability and net worth against a back drop of history-based rate environments and yield curves, well beyond standard rate shocks
Cons: It is not as familiar as traditional methodologies
Decision-makers cannot see profitability in year six and beyond
Because income simulation and valuation can be combined, it can be more difficult to understand
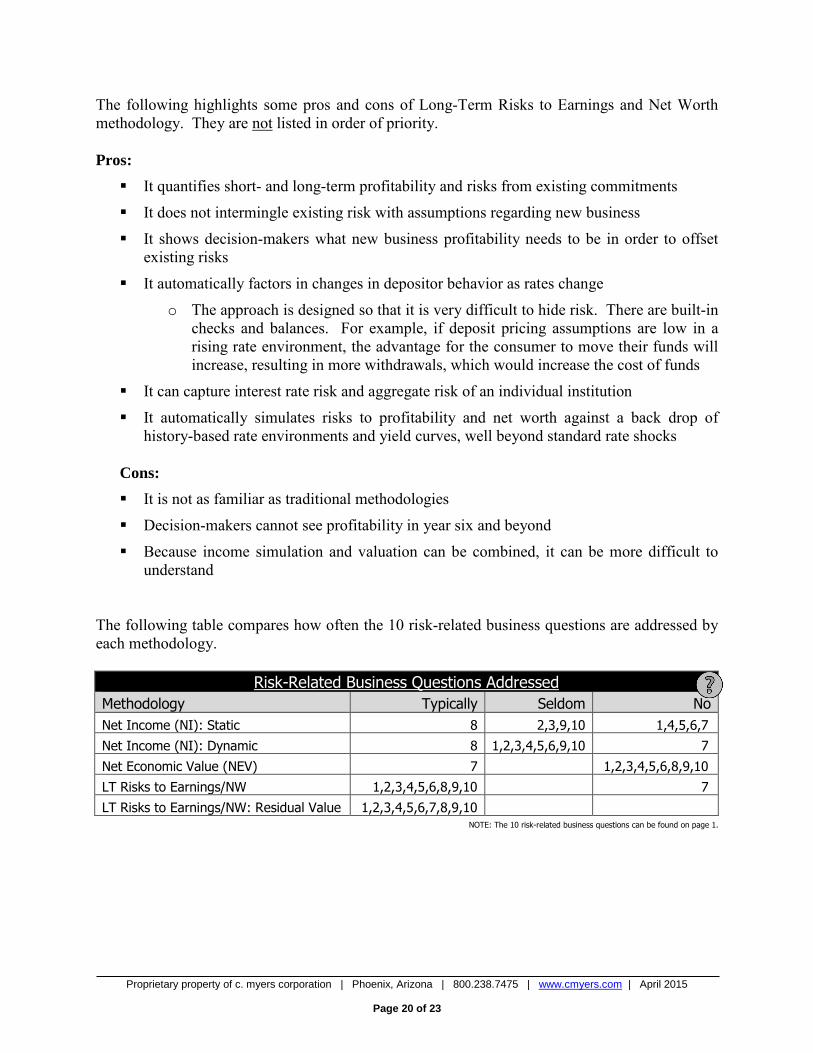
The following table compares how often the 10 risk-related business questions are addressed by each methodology.
Risk-Related Business Questions Addressed Methodology Typically Seldom No Net Income (NI): Static 8 2,3,9,10 1,4,5,6,7
Net Income (NI): Dynamic 8 1,2,3,4,5,6,9,10 7
Net Economic Value (NEV) 7 1,2,3,4,5,6,8,9,10
LT Risks to Earnings/NW 1,2,3,4,5,6,8,9,10 7
LT Risks to Earnings/NW: Residual Value 1,2,3,4,5,6,7,8,9,10 NOTE: The 10 risk-related business questions can be found on page 1.
Proprietary property of c. myers corporation | Phoenix, Arizona | 800.238.7475 | www.cmyers.com | April 2015
Page 21 of 23
ASSUMPTIONS It is important that members of the management team have a working understanding of key assumptions used in modeling. The board should have a high-level understanding of the assumptions, as well as an understanding of assumptions that can influence, versus drive, the results. The expectation when testing assumptions is that they should change the degree of risk, not the direction of risk. If the assumption tested changes the direction of risk, then that assumption drives the results and it should be thoroughly understood by board and management. Fact: Regardless of methodology used, assumptions regarding human behavior will need to be made in the risk quantification process. Fact: Many factors outside of the credit union’s control will play a role in consumers’ responses. Such factors include changes in traditional and non-traditional competition, regulation, economic environment, the world economy and technological advances. Fact: Because no one can accurately forecast human behavior, the notion of any simulation being precisely accurate is absolutely incorrect regardless of the methodology. Therefore, testing ranges of assumptions is necessary in the risk management process. Fact: Standardizing assumptions will not reduce assumptions risk. It may help if the objective is comparing across many institutions but that should not be confused with appropriate quantification of risk for individual institutions. Fact: Assumptions regarding non-maturity deposits are some of the most important assumptions when simulating interest rate risk. It is interesting to note that, if a credit union uses static balance sheet simulations and NEV shares at par to quantify and manage interest rate risk, the assumptions regarding NMDs are in direct conflict.
Static assumes that the NMD balances will never drop and will always be around to help
NEV shares at par assumes balances will mature immediately and will not be around to help
Proprietary property of c. myers corporation | Phoenix, Arizona | 800.238.7475 | www.cmyers.com | April 2015
Page 22 of 23
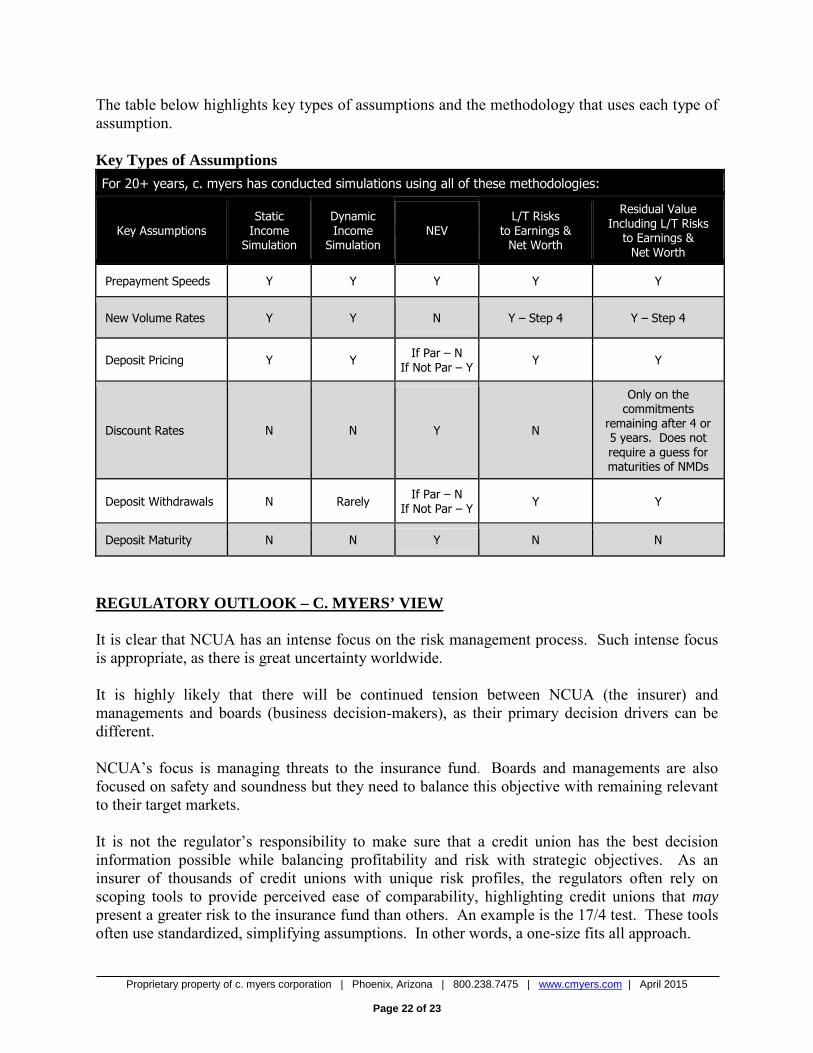
The table below highlights key types of assumptions and the methodology that uses each type of assumption. Key Types of Assumptions For 20+ years, c. myers has conducted simulations using all of these methodologies:
Key Assumptions Static
Income Simulation
Dynamic Income
Simulation NEV
L/T Risks to Earnings &
Net Worth
Residual Value Including L/T Risks
to Earnings & Net Worth
Prepayment Speeds Y Y Y Y Y
New Volume Rates Y Y N Y – Step 4 Y – Step 4
Deposit Pricing Y Y If Par – N If Not Par – Y Y Y
Discount Rates N N Y N
Only on the commitments
remaining after 4 or 5 years. Does not require a guess for maturities of NMDs
Deposit Withdrawals N Rarely If Par – N If Not Par – Y Y Y
Deposit Maturity N N Y N N
REGULATORY OUTLOOK – C. MYERS’ VIEW It is clear that NCUA has an intense focus on the risk management process. Such intense focus is appropriate, as there is great uncertainty worldwide. It is highly likely that there will be continued tension between NCUA (the insurer) and managements and boards (business decision-makers), as their primary decision drivers can be different. NCUA’s focus is managing threats to the insurance fund. Boards and managements are also focused on safety and soundness but they need to balance this objective with remaining relevant to their target markets. It is not the regulator’s responsibility to make sure that a credit union has the best decision information possible while balancing profitability and risk with strategic objectives. As an insurer of thousands of credit unions with unique risk profiles, the regulators often rely on scoping tools to provide perceived ease of comparability, highlighting credit unions that may present a greater risk to the insurance fund than others. An example is the 17/4 test. These tools often use standardized, simplifying assumptions. In other words, a one-size fits all approach.
Proprietary property of c. myers corporation | Phoenix, Arizona | 800.238.7475 | www.cmyers.com | April 2015
Page 23 of 23
Other such scoping tools will likely be introduced as the concern for interest rate risk is elevated. These types of tools should not be mistaken for sound decision-making tools. It is important that decision-makers and regulators do not confuse the use of these scoping tools with linking effective risk management with strategy. While NCUA may continue to use standardized scoping tools, and possibly create new ones, we are happy to see that NCUA is also raising awareness of business risks and linking their impact on income statements and balance sheets. This connects with the recommended approach of having a comprehensive view of risks to earnings and net worth. Excerpt from October 2014 NCUA Economic Update:
“If the increase in short rates is larger than the increase in loan rates, that is if the yield curve becomes flatter, credit unions could likely see a narrowing of net interest margins. We’ve already noted that non-interest income has moved lower recently. If that trend continues while net interest margins are also shrinking, many credit unions will face declining net income or even losses. Here at NCUA, our chief concern is that credit unions are aware and prepared for this possibility. Credit unions should have a firm idea of how their income statements and balance sheets are affected by a rapid rise in short-term rates, and they should have a plan for dealing with the potential consequences.”
ABOUT C. MYERS Our philosophy is based on helping our clients ask the right, and often tough, questions in order to create a solid foundation that links strategy, risk management and desired financial performance. We have the experience of working with over 500 credit unions including 50% of those over $1 billion in assets and more than 25% of those over $100 million providing services such as A/LM, NEV, Liquidity Analysis, Model Validations, Budgeting, Strategic Planning, Process Improvement and Project Management. cm
Standardizing
assumptions
guarantees that the
unique risk of an
individual credit
union will not be
appropriately
captured.