Embed Size (px)
Citation preview

Comparison of Blood and Brain Mercury Levels inInfant Monkeys Exposed to Methylmercury or
Vaccines Containing ThimerosalThomas M. Burbacher, Danny D. Shen, Noelle Liberato,
Kimberly S. Grant, Elsa Cernichiari, and Thomas Clarkson
doi:10.1289/ehp.7712 (available at http://dx.doi.org/)
The National Institute of Environmental Health SciencesNational Institutes of Health
U.S. Department of Health and Human Services
ehponline.org
Online 21 April 2005

Comparison of Blood and Brain Mercury Levels in Infant Monkeys Exposed to
Methylmercury or Vaccines Containing Thimerosal
Thomas M. Burbacher, Ph.D.a,c,d*, Danny D. Shen, Ph.D.b, Noelle Liberato, B.S. a,c,d,
Kimberly S. Grant, Ph.D.a,c,d, Elsa Cernichiari, M.S. e, and Thomas Clarkson, Ph.D. e
Departments of Environmental and Occupational Health Sciences,a
School of Public Health and Community Medicine,
Departments of Pharmacy and Pharmaceutics b, School of Pharmacy,
Washington National Primate Research Center,c and
Center on Human Development and Disability,d
University of Washington, Seattle, Washington 98195 USA
Department of Environmental Medicinee , University of Rochester School of Medicine,
Rochester, New York 14642 USA
Tables: 4
Figures: 7
*To whom all correspondence should be addressed:
Department of Environmental and Occupational Health Sciences
1705 NE Pacific Street
Health Sciences Building (F555)
School of Public Health and Community Medicine
University of Washington
Seattle, Washington 98195
Phone: (206) 685-1862
FAX: (206) 685-4696
e-mail address: [email protected]

2
Running Title: Thimerosal and blood and brain mercury
Key words: thimerosal, methylmercury, ethylmercury, brain and blood distribution,
elimination half-life, infant nonhuman primates
Acknowledgments
The authors wish to thank the staff of the Infant Primate Research Laboratory for their
cooperation during this study and Dr. David Blough for his assistance with statistical
analyses. The authors would also like to thank Dr. John Treanor from the University of
Rochester for supplying the vaccines used in the study. This project was supported by
funds from the National Institutes of Health, Grants RO1ES03745, P51HD02274,
P51RR00166, P30ES07033 and NO1-A1-25460. The authors declare they have no
competing financial interests.

3
Abstract
Introduction
Methods
Subjects
Mercury Dosing Schedule
Blood Draw Schedule
Sacrifice Schedule
Blood and Brain Hg Measurement
Kinetic Analysis
Results
Infant Growth and Health Status
Oral Methylmercury Kinetics
Intramuscular Thimerosal Kinetics
Discussion

4
Abstract
Thimerosal is a preservative that has been used in manufacturing vaccines since the
1930s. Reports have indicated that infants can receive ethylmercury (in the form of
thimerosal) at or above the Environmental Protection Agency (EPA) guidelines for
methylmercury (MeHg) exposure, depending on the exact vaccinations, schedule, and
size of the infant. This study compared the systemic disposition and brain distribution of
total and inorganic mercury in infant monkeys following thimerosal exposure with
infants exposed to MeHg. Monkeys were exposed to MeHg (via oral gavage) or vaccines
containing thimerosal (via i.m. injection) at birth and 1, 2, and 3 weeks of age. Total
blood mercury (Hg) levels were determined 2, 4 and 7 days after each exposure. Total
and inorganic brain Hg levels were assessed 2, 4, 7 or 28 days after the last exposure.
The initial and terminal half-life of Hg in blood following thimerosal exposure was 2.1
and 8.6 days, which are significantly shorter than the elimination half-life of Hg
following MeHg exposure at 21.5 days. Brain concentrations of total Hg were
significantly lower by ~3-fold for the thimerosal-exposed infants when compared to the
MeHg infants, while the average brain-to-blood concentration ratio was slightly higher
for the thimerosal-exposed infants (3.5±1.0 vs. 2.5±0.6). A higher percentage of the total
Hg in the brain was in the form of inorganic mercury for the thimerosal-exposed infants
(34% vs 7%). The current study indicates that MeHg is not a suitable reference for risk
assessment from exposure to thimerosal derived Hg. Knowledge of the toxicokinetics
and developmental toxicity of thimerosal is needed to afford a meaningful assessment of
the developmental effects of thimerosal-containing vaccines.

5
Introduction
Public perception of the safety and efficacy of childhood vaccines has a direct impact on
immunization rates (Biroscak et al. 2003, Thomas et al. 2004). The current debate
linking the use of thimerosal in vaccines to autism and other developmental disorders
(IOM 2001, 2004) has led many families to question whether the potential risks
associated with early childhood immunizations may outweigh the benefits (Blaxill et al.
2004; http://www.SafeMinds.org). Thimerosal is an effective preservative that has been
used in the manufacturing of vaccines since the 1930s. Thimerosal is comprised of 49.6
% mercury by weight and breaks down in the body to ethylmercury and thiosalicylate
(Tab and Parkin 2000). Recent reports have indicated that some infants can receive
ethylmercury (in the form of thimerosal) at or above the Environmental Protection
Agency (EPA) guidelines for methylmercury (MeHg) exposure, depending on the exact
vaccinations, schedule, and size of the infant (Ball et al. 2001). Clements et al. (2000)
calculated that children receive 187.5 micrograms of ethylmercury from thimerosal
containing vaccines given over the first 14 weeks of life. According to the authors, this
amount approaches or, in some cases, exceeds the EPA guidelines for MeHg exposure
during pregnancy (0.1 µg/kg/day). Other estimates (Halsey 1999) have indicated that the
schedule could provide repeated doses of ethylmercury from approximately 5 to 20 µg/kg
over the first 6 months of life. Studies in preterm infants indicate that blood levels of
mercury following just one vaccination (hepatitis B) increase by over 10-fold to levels
above the EPA guidelines (Stajich et al. 2000).
EPA guidelines for MeHg are based on several decades of studies of humans and
animal models of developmental toxicity (Burbacher et al. 1990; National Research
Council 2000). Since little data exist for ethylmercury, the use of the MeHg guidelines
would seem appropriate if the two compounds have similar toxicokinetic profiles and
neurodevelopmental effects. The results from the few studies that have provided a direct
comparison of these two compounds have been summarized recently in a review article
by Magos (2003), who concluded that:
• Mercury clears from the body faster after the administration of
ethylmercury than after the administration of MeHg
• The brain-to-blood mercury concentration ratio established for MeHg will

6
overestimate mercury in the brain after exposure to ethylmercury
• Because ethylmercury is decomposed faster than MeHg, the risk of brain
damage is less for ethylmercury than for MeHg.
These conclusions are based on only a few studies, none of which included measurements
of both blood and brain mercury levels in infant subjects.
The current study was initiated to provide a direct comparison of the blood and
brain levels of mercury in infant nonhuman primates exposed orally to MeHg or via i.m.
injections of vaccines containing thimerosal. Nonhuman primates have been used
extensively in previous studies of MeHg toxicokinetics and developmental neurotoxicity
(Stinson et al. 1989; Vahter et al. 1994, 1995; Burbacher et al. 1986, 1990; Gunderson et
al. 1986, 1988; Rice and Gilbert 1982, 1990, 1995). The routes of administration (oral
for MeHg and i.m. injection for thimerosal-containing vaccines) were chosen to mimic
the two routes of mercury exposure for humans. The dosages and schedule of
administration of mercury were chosen to be comparable to the current immunization
schedule for human newborns, taking into consideration the faster growth (approximately
4 to 1) of the macaque infant (Gunderson and Sackett 1984). The results of this study
provide important new information regarding the comparative toxicokinetics of these two
compounds in newborns and infants.
Methods
Subjects: Forty-one infant Macaca fascicularis born at the Washington National Primate
Research Center’s Infant Primate Research Laboratory were used in the study. The birth
weights of the infants were within the normal range for this species; the average birth
weight was 341 grams (range 255 to 420 grams). Infants were weighed daily throughout
the study and any clinical problems were recorded.
Mercury Dosing Schedule: The mercury-dosing schedule is shown in Table 1.
Infants were assigned to 1 of 3 exposure groups at birth. Seventeen infants assigned to
the thimerosal group were given the typical schedule of vaccines for human infants (see
Table 1). Thimerosal (Omicron Quimica S.A.), dissolved in saline, was mixed with
thimerosal-free vaccines to yield a final concentration of 4, 8, or 20 µg/ml mercury,
depending on the vaccine and the age of the infant. The total dose of mercury
7
administered via the vaccines was 20 µg/kg on day 0 and at 7, 14, and 21 days of age. A
dose of 20 µg/kg was chosen based on the range of estimated doses received by human
infants receiving vaccines during the first 6 months of life.
Seventeen infants assigned to the MeHg group were given MeHg hydroxide
(MeHgOH, 97% pure, Alfa Aesar, Johnson Matthey Co., Ward Hill, Massachusetts
USA) dissolved in water to a concentration of 20 µg Hg/ml. MeHg was administered to
infants via oral gavage at a dose of 20 µg/kg on their day of birth (day 0) and at 7, 14,
and 21 days of age.
Seven infants were assigned to a control group. These infants did not receive
any gavages or i.m. injections. Infants were assigned to the three groups on a semi-
random basis, in order to balance gender ratios and average birth weights across groups.
Blood Draw Schedule: Blood was drawn from the saphenous vein of all infants
at birth (prior to any Hg exposure). Blood was also drawn 2, 4, and 7 days after the
initial Hg exposure (day 0) and after subsequent exposures on days 7 and 14. Depending
on the sacrifice group (see below) blood was drawn up to 28 days after the final
exposure on day 21 to further characterize the washout kinetics of Hg (see Table 1).
Sacrifice Schedule: Infants were sacrificed 2, 4, 7 or 28 days after their last Hg
exposure on day 21 (see Table 1). Infants were sedated with an i.m. injection of
ketamine (10mg/kg) and atropine (0.4 mg/kg) and then given an intravenous overdose of
Nembutal (20 mg/kg). Autopsy personnel from the Primate Center drew blood and
removed the brain and other organs for analysis. The autopsy typically lasted
approximately 1 hour.
The number of infants at each sacrifice day for both the MeHg and thimerosal
groups was Day 2=4, Day 4=4, Day 7=5, and Day 28=4. The 7 control infants were
assigned sacrifice days as follows Day 2=3, Day 4=1, Day 7=2, and Day 28=1 (see
Table 1). Infants were assigned to sacrifice groups at birth on a semi-random basis that
balanced gender ratios and average birth weights across groups.
Blood and Brain Hg Measurement: Blood samples were prepared for Hg
analysis by diluting them with an equal volume of 1 % w/v NaCl solution. Aliquots were
removed for mercury determination without digestion. One drop of antifoam reagent was
added to the aliquot at the time of the analysis.

8
Half brain samples were fixed in formaldehyde prior to analysis. Samples of the
fixative were analyzed to check for mercury content. The tissue was removed from the
jar and blotted dry. A homogenate of the brain in 1% NaCl was prepared using a
Polytron homogenyzer PT 10-35 ( Brinkmann Instruments, Westbury, NY) while keeping
the sample in an ice slurry. An aliquot of the homogenate was digested with 1 ml of 1%
w/v cysteine and 2 ml of 45 % NaOH by heating at 950C for 10 to 15 minutes. Digest
was allowed to cool and then diluted to volume by addition of 7 ml of 1% w/v NaCl. The
digests were kept in an ice slurry until analysis. Aliquots were removed for mercury
determination. One drop of antifoam was added to the aliquot at the time of the analysis.
Total Hg concentrations in blood and total and inorganic Hg concentrations in
brain were measured using a procedure adapted from Greenwood et al. (1977). The
method determines total mercury and its inorganic fraction (Magos and Clarkson 1972).
Cadmium chloride in the presence of stannous chloride at high pH breaks the mercury-
carbon bond with the subsequent reduction of Hg2+ to Hg0, the latter is then measured by
cold vapor atomic absorption at 254 nm with a Model #1235 mercury monitor from
Laboratory Data Control (Thermo Separation Products). Inorganic mercury is
determined by the addition of stannous chloride in the absence of cadmium chloride.
Concentration of organic Hg was calculated from the difference between the measured
total and inorganic Hg concentrations. The original concentration of SnCl2 used for the
Magos method (1972) was modified to prevent the decomposition of the ethylmercury
during assay (Magos et al. 1985). To measure mercury in aqueous solution of thimerosal
the amount of SnCl2 was reduced from 100 µg to 50 µg per aliquot analyzed. For tissue
homogenate samples, 500 µg of SnCl2 was added to each aliquot. All reagents used for
preparation and analysis of the samples were of analytical grade.
Quality control was assured by analysis of reference samples prior to each assay
run. Fisher Mercury Reference Solutions (SM114-100, certified 1000 ppm + 1%) was
used as a stock solution. Working standards of 30 and 10 ng Hg/ml were made daily from
appropriate dilutions of the stock solution. In addition, the following certified reference
materials were analyzed daily prior to analysis of the samples: Trace Elements in Whole
Blood (Seronorm Trace Elements, Accurate Chemical & Scientific Corporation, Certified
Reference Material #201605, 6.8-8.5 µg/L), and Trace Elements in Human Hair

9
(Commission of the European Communities, Certified Reference Material #397: 12 µg/g
+/- 0.5). The detection limit of the instrument was estimated to be 0.75 ng Hg per aliquot
used for analysis.
Data Analysis: The mean total blood Hg concentration data from both the oral
MeHg and i.m. thimerosal groups (N=17 in each) were subject to analysis using the
compartmental module of the pharmacokinetic modeling software SAAM II (SAAM
Institute, Seattle, WA).
The accumulation and washout of total blood Hg concentration-time data from the
MeHg infants were well described by a one-compartment model featuring a first-order
absorption process. Regression fit of the data to the model yielded estimates of the
absorption rate constant (ka), elimination rate constant (K), and an apparent volume of
distribution (V/F, F is the implicit bioavailability term). Half- lives (T1/2) corresponding
to each of the rate constants were calculated by dividing ln 2 by the rate constant
estimate. Blood clearance (Cl/F) was derived from the product of K and V/F.
A one-compartment model failed to provide a satisfactory fit of the mean total
blood Hg concentration-time data from the thimerosal infants. The model over-predicted
the blood concentration during accumulation; at the same time, it under-predicted the
blood concentration during washout rate (i.e., over-predicted washout rate). Further
examination of a scatter-plot of the individual monkey data suggested a biphasic pattern
in the washout of Hg from the blood following the last dose. Accordingly, a regression
fit of the mean total blood Hg concentration data with a two-compartment model was
attempted. This yielded a much better visual fit of the data, with minimal change in the
objective function and Akaike Information Criterion (AIC). The two-compartment
parameter estimates from the regression analysis included the absorption rate constant
(ka), rate constants for Hg transfer from the central to the peripheral compartment (k12)
and the return from the peripheral to the central compartment (k21), the elimination rate
constant from the central compartment (k10), and the apparent volume of the central
compartment (Vc/F). From these primary parameters, we further estimated the apparent
distribution volume at steady-state (Vss/F), and the peripheral volume referenced to
blood concentration (i.e., Vp=Vss – Vc). The initial and terminal rate constants and half-
lives (T1/2,α and T1/2,β) for the biexponential decline of total blood Hg concentration were
10
estimated by standard formulae (Gibaldi and Perrier 1982). Blood clearance was
computed by the product of Vc and k10. For both the MeHg and thimerosal model fits, a
fractional standard deviation of 0.1 was used as the weighting scheme.
The washout half-life of total and organic Hg in the brain of both the oral MeHg
and i.m. thimerosal groups were estimated by regression fit to a monoexponential model
using the WinNonlin software (Pharsight Corp., Mountain View, CA). One of the Day
28 brain samples from the MeHg exposure group had a spuriously high total Hg
concentration; i.e., a concentration of 151 ng/g, which is more than 50% higher than the
other samples obtained on Day 28 (71-90 ng/ml) and higher than those observed at the
earliest sacrifice time at Day 2 (75 to 129 ng/g). The unreasonably high concentration is
most likely due to contamination of the sample. Therefore, data from this brain and its
corresponding blood were excluded from the regression analysis. The average brain-to-
blood concentration ratio was also calculated using data from the earliest sacrifice
duration (2 days). Because of different washout half-lives in blood and the brain, brain-
to-blood concentration ratio is expected to vary with the duration of washout. Samples at
Day 2 offered the best measure of the extent of uptake of Hg species into the brain that
are least confounded by differences in their clearance rate.
Between-group statistical comparisons of the rate of washout of total Hg in blood,
as well as total and organic concentrations in the brain, were accomplished through
multiple regression analysis as implemented in the PROC GLM subroutine in SAS
(version 9.1, SAS Institute, Gary NC). PROC GLM performs multiple regression within
the framework of General Linear Models, and can accommodate missing data or sparse
sampling and confounding from correlations between repeated measures. Hence, it is
able to provide tests of hypotheses for the effects of time and group using blood and brain
data obtained from sacrifice of individual animals at varying times during washout. Log
transformed blood or brain Hg concentrations in animals from both the MeHg and
thimerosal groups were entered as the dependent variable. The independent variables
consisted of sampling time, group (MeHg=0, thimerosal=1), and a time-by-group
interaction. Once the overall significance of the regression model was verified, the
significant sources of variation (i.e., time, group and time-by-group) were identified. A
difference in the rate of washout of Hg in blood or brain between groups was indicated by
11
a significant regression coefficient for time-by-group interaction. If there was no
evidence for interaction, a significant decline in blood or brain Hg concentration over
time for each group was assessed by the t-statistic associated with the estimated
regression coefficient for time.
The following statistical comparisons of the washout rate of Hg were also
undertaken: total Hg in blood versus total Hg in brain, total Hg in blood versus organic
Hg in the brain, and total Hg versus organic Hg concentration in the brain. The
difference between the pair of log transformed Hg concentrations for each animal
sacrificed at the various times was calculated. Individual difference values in both
groups were then entered as the dependent variable in the regression model. The
independent variables were time, group and time-by-group interaction. A significant
regression coefficient for the time variable indicates that the paired-log concentration
difference (or the concentration ratio) varied with time; i.e., the two concentration
measures (e.g. blood and brain) declined in parallel with time.
Results
Infant Growth and Health Status: The weights of infants during the study are
shown in Figure 1. There were no significant differences in the weight gain across the 3
groups (p>0.10, all comparisons). The average weight gain during the first 23 days of
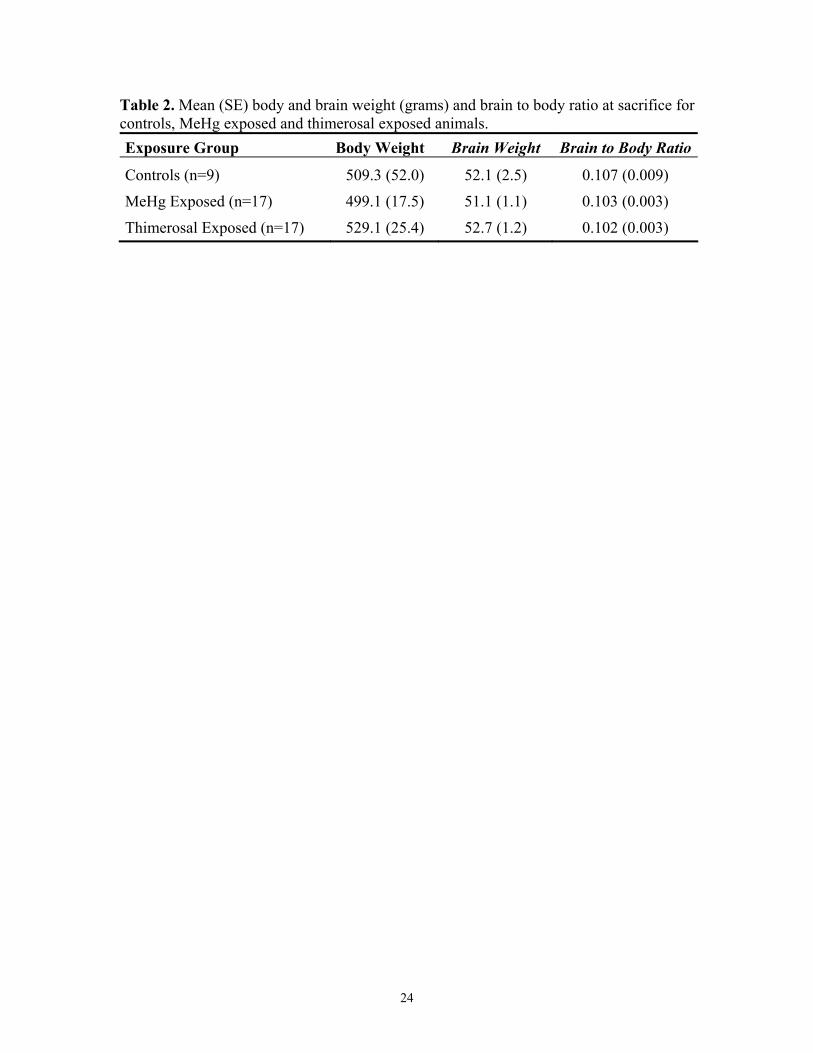
life was 135 grams. The brain weights at sacrifice and brain-to-body weight ratios are
shown in Table 2. There were no significant differences in the brain weights or brain-to-
body weight ratios across the 3 groups (p>0.10, all comparisons). There were no serious
medical complications for any of the infants.
Oral MeHg Kinetics: The total blood Hg concentrations at 2 days (observed
peak) following the first dose ranged from 8 to 18 ng/ml across the infants, i.e., a 2-fold
variation. Progressive accumulation of total blood Hg was observed over the three
subsequent doses of MeHg, such that the peak total blood Hg concentrations after the
fourth dose were about 3-fold higher (30-46 ng/ml). The inter-animal variation in blood
Hg concentrations remained at about 2-fold during accumulation. Blood Hg persisted
through the entire period of washout, and was readily measurable in all 4 infants in the 28
day sacrifice group (16-21 ng/ml). This is consistent with previous reports of a greater

12
than 20 day elimination T1/2 of methymercury in adult M. fascicularis (Stinson et al.
1989; Vahter et al. 1994, 1995) and explains the minimal decline (<20%) in blood
mercury concentrations during the weekly intervals between MeHg doses.
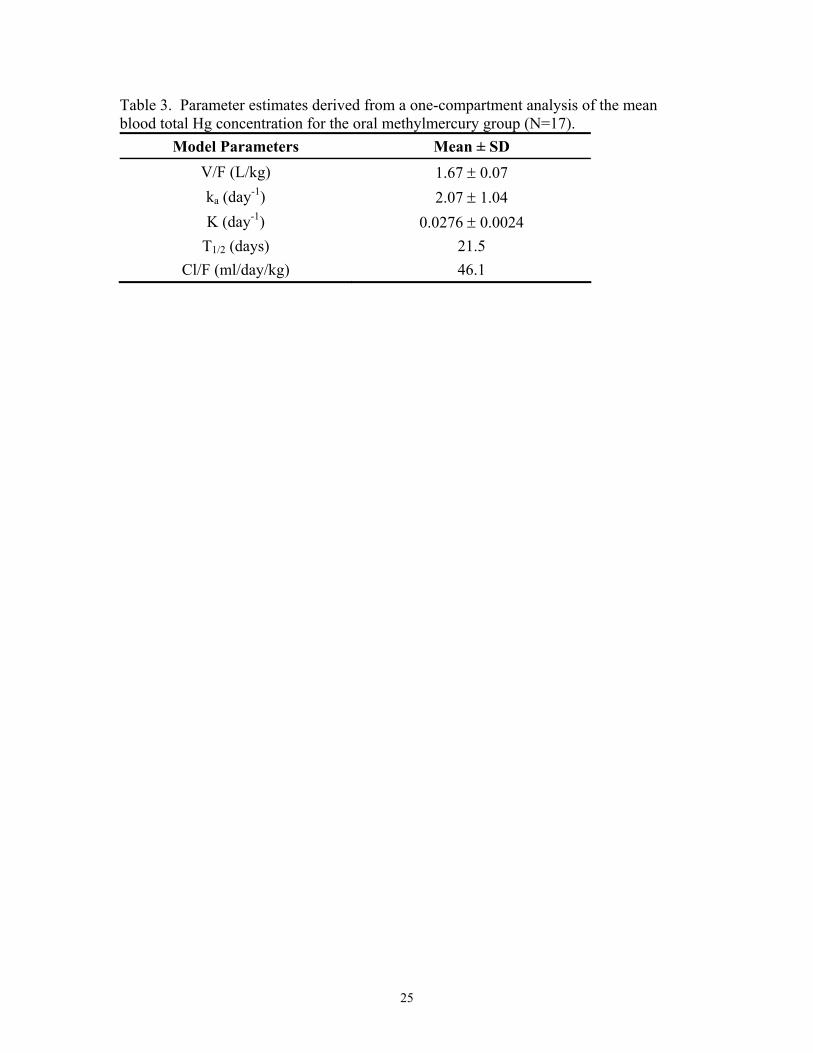
The time course of total blood Hg was fitted to a one-compartment model. Figure
2 shows the excellent regression fit of the mean blood concentration-time data. Table 3
presents parameter estimates from the one-compartment model fit of the mean blood Hg
concentration-time data. The distribution volume of total mercury following MeHg
administration is estimated to be 1.7 L/kg, or about 20 times the blood volume (~8%).
This means that only 1/20th of the body burden of mercury is confined to the vascular
space. This is consistent with the known extensive extravascular distribution of Hg
following methymercury exposure in primates and agrees with previous estimates of Hg
distribution volume in adult M. fascicularis (Stinson et al. 1989). The elimination T1/2 of
total blood Hg is 21.5 days, which agrees with reported estimates in adult M. fascicularis
(Stinson et al. 1989; Vahter et al. 1994, 1995). The blood clearance is estimated at 46.1
ml/day/kg, well within the range of clearance values observed earlier in adult M.
fascicularis (Stinson et al. 1989). It appears that the systemic disposition kinetics of
MeHg are the same between infant and adult M. fascicularis, i.e., no change during
development.
A plot of the blood and brain total Hg concentration data from the infants
sacrificed at various times during the washout period is shown in Figure 3. There was a
significant decrease in total Hg from the blood during the washout period (p< 0.01). The
apparent T1/2 for total Hg in blood is 19.1±5.1 days (±standard error of regression
estimate). The decrease in total Hg in the brain over time was marginally significant (p<
0.07), with an apparent T1/2 of 59.5±24.1 days. The T1/2 for total Hg in brain was
significantly longer than the T1/2 for total Hg in blood (p= 0.05) for the MeHg-exposed
infants. The T1/2 for total Hg in brain (59.5±24.1 days) is also longer than the previously
reported washout T1/2 from the brain for adult M. fascicularis (37 days, Vahter et al.
1994, 1995). It should be noted that the relatively high standard error of the half-life
estimates for the brain reflects the large inter-animal variation in Hg concentrations at
each sampling time, limited number of data points, and the short duration of sacrifice
relative to the washout half-life. The concentration of total Hg in the brain is 1.7 to 3-
13
fold higher than in the blood (mean±SE = 2.5±0.3) 2 days after the last MeHg dose. This
brain-to-blood concentration ratio increased as the duration between the last dose and the
sacrifice lengthened. The ratio ranged from 3.9 to 7.4 at 28 days after the last exposure.
The time-dependence for the brain-to-blood ratio is primarily due to the difference in the
washout T1/2 between total Hg in the blood and brain (p=0.06). The average brain-to-
blood ratio for these infants at Day 2 after the last MeHg dose (2.5±0.3) is slightly lower
than previously reported values (3 to 5) for adult macaque and squirrel monkeys over
various durations of washout (Stinson et al. 1989; Vahter et al. 1994; Berlin et al. 1975).
Although the cited differences in brain uptake and clearance of MeHg between adult and
infant monkeys may be attributed to the effects of postnatal brain growth and
development, it may also be related to variation in exposure regimen between studies.
A plot of the organic and inorganic Hg concentrations in the brain of MeHg-
exposed infants sacrificed at various times during the washout period is shown in Figure
4. The decrease in organic Hg in the brain over time was not statistically significant (p=
0.17). The apparent T1/2 for the washout of organic Hg from the brain was 58.4±25.0
days, close to the T1/2 for total Hg. The concentration of inorganic Hg in the brain
samples was below the quantifiable limit of the assay (7 ng/ml) in 8 of 17 MeHg-exposed
infants. The average concentration of inorganic Hg for those infants with values above
the detection limit (N=10) did not change significantly over 28 days of washout and was
approximately 7 to 8 ng/ml (see Figure 5). Inorganic Hg represented only 6% to 10% of
total Hg in the brain. These values are consistent with previously reported data in adult
M. fascicularis (Vahter et al. 1994, 1995).
Intramuscular Thimerosal Kinetics: The initial total Hg concentrations in the
day 2 blood samples, which ranged from 6 to 14 ng/ml, are comparable to the
concentrations observed in the oral MeHg group. These blood levels are also similar to
those reported in preterm infants receiving 12.5 µg of mercury from a hepatitis b vaccine
(Stajich et al. 2000). Blood Hg concentrations declined relatively rapidly (by >50%) in
between doses. As a result, there was minimal accumulation in blood Hg concentrations
during weekly dosing. Also, blood Hg concentrations dropped below the detection limit
of the assay in some animals by day 10 after the last vaccine injection.
The time course of total blood Hg concentrations was best described by a two-

14
compartment model; i.e., the disposition kinetics is biphasic, with a rapid initial phase
followed by a slower terminal phase of clearance. Table 4 presents the parameter
estimates derived from the two-compartment model analysis. A comparison of the model
prediction and the observed blood concentration data are shown in Figure 5. The model
predicted some accumulation in peak blood Hg concentrations, and minimal
accumulation in trough concentrations. Since blood concentration data were not
available before day 2, the predicted peak concentrations are extrapolations and should be
viewed with caution. The initial volume of distribution in the central compartment was
1.7 L/kg, which is comparable to the overall distribution volume for oral MeHg. The
initial and terminal blood half-life was 2.1 and 8.6 days, respectively. Mercury derived
from thimerosal is eliminated much more rapidly than MeHg. The steady-state volume
of distribution (i.e., Vss or the fully equilibrated volume) was estimated to be 2.5 L/kg,
which is 50% larger than the initial distribution volume (i.e., Vc). Hence, the effective
peripheral compartment volume at steady state is about 0.8 L/kg. Alternately, this means
that, at steady state, partitioning of the body burden of Hg between the tissue regions
associated with the central and peripheral compartments is about 2:1. The blood
clearance of total Hg was estimated to be 248 ml/day/kg, which is 5.4-fold higher than
the estimate for oral MeHg.
Figure 6 presents a scatter-plot of the blood and brain total Hg concentration data
for infants sacrificed at various times during the washout. There was a significant
decrease in total Hg concentration in the blood during the washout period (p< 0.01). The
apparent T1/2 for total Hg in blood is 6.9±1.7 days. There was also a significant decrease
in total Hg concentration in the brain over time (p< 0.01), with an apparent T1/2 of
24.2±7.4 days. The T1/2 for total Hg in brain was significantly longer than the T1/2 for
total Hg in blood (p< 0.01) for the thimerosal-exposed infants. In addition, the T1/2 for
total Hg in blood and brain for these infants (6.9±1.7 days and 24.2±7.4 days) are
significantly shorter (p< 0.01) than the T1/2 for total Hg in blood and brain for the MeHg
infants (19.1±5.1 days and 59.5±24.1 days). The concentration of total Hg in the brain of
the thimerosal-exposed infants is 2.6 to 4.6-fold higher than in the blood (mean±SE =
3.5±0.5) 2 days after the last injection. Again, this ratio increased as the sacrifice was
performed at longer durations from the last dose, primarily due to the difference in the

15
half-lives of total Hg in the blood and brain.
A plot of the organic and inorganic Hg concentrations in the brain of thimerosal-
exposed infants sacrificed at various times during the washout period is shown in Figure
7. There was a significant decrease in organic Hg in the brain over the washout period
(p< 0.01). The apparent T1/2 for the washout of organic Hg from the brain was 14.2±5.2
days, which is significantly shorter than the T1/2 for total Hg in brain (p< 0.01). The
inorganic form of Hg was readily measurable in the brain of the thimerosal-exposed
infants. The average concentration of inorganic Hg did not change across the 28 days of
washout and was approximately 16 ng/ml (see figure 9). This level of inorganic Hg
represented 21 % to 86% of the total Hg in the brain (mean±SE = 70±4%), depending on
the sacrifice time. These values are considerably higher than the inorganic fraction
observed in the brain of MeHg infants (6% to10%).
Discussion
There are notable similarities and differences in the kinetics of Hg following oral
administration of MeHg and i.m. injection of thimerosal in vaccines. The absorption rate
and initial distribution volume of total Hg appear to be similar between i.m. thimerosal
and oral MeHg. This means approximately equal peak total blood Hg levels following a
single exposure to either MeHg or thimersoal or following episodic exposures that are
apart by longer than four elimination half-life (i.e., >80 days for MeHg or >28 days for
thimerosal). Studies in preterm and term human infants have reported similar results
(Stajich et al. 2000). Infants receiving 12.5 ug of mercury from a single hepatitis b
vaccine had blood mercury levels at 48 to 72 hours consistent with what would be
anticipated after an equal dose of MeHg.
While the initial distribution volume of total Hg is similar for the 2 groups, a
biphasic exponential decline in total blood Hg is observed only following i.m. injections
of thimerosal. This suggests continual distribution into and localization in tissue sites
over time. It is relevant to note that the kidney-to-blood concentration gradient of total
Hg is much higher in the thimerosal infants than in the MeHg infants (mean±SE 95.1±10
vs 5.8±0.6). The second slower phase of washout could also represent the gradual
biotransformation of ethylmercury (the presumed principal organic form of Hg after
thimerosal administration) to Hg-containing metabolites that have a different tissue
16
distribution or are more slowly eliminated. Further investigations of the disposition fate
of thimerosal-derived mercury should address these issues.
Total Hg derived from i.m. thimerosal is cleared from the infant M. fascicularis
much more quickly than MeHg. The washout T1/2 of total blood Hg following i.m.
injections of thimerosal in vaccines is much shorter than the T1/2 of MeHg (6.9 vs. 19.1
days). These results support the earlier conclusion of Magos (2003) that mercury is
cleared from the body faster after the administration of ethylmercury than after the
administration of MeHg. More interestingly, the washout blood Hg T1/2 in the
thimerosal-exposed infant macaques is remarkably similar to the blood mercury T1/2 of
approximately 7 days in human infants injected with thimerosal-containing vaccines
reported by Pichichero et al. (2002).
An important consequence of the difference in blood half-lives is the remarkable
accumulation of blood Hg during repeated exposure to MeHg. While the initial blood Hg
concentration (at 2 days after the first dose) did not differ between the MeHg and
thimerosal groups, the peak blood Hg concentration in the MeHg-exposed infants rose to
a level nearly 3 times higher than in the thimerosal infants after the 4th dose.
Furthermore, the blood clearance of total Hg is 5.4-fold higher after i.m. thimerosal than
after oral MeHg exposure. This means that for an equivalent level of chronic exposure,
the area under the curve (AUC) of total blood mercury concentrations in infants receiving
repeated i.m. injections of thimerosal-containing vaccines will be significantly lower than
infants exposed chronically to MeHg via the oral route.
A much lower brain concentration of total Hg was observed in the thimerosal
infants compared to the MeHg infants, i.e., a 3- to 4-fold difference for an equivalent
exposure of Hg. Moreover, total Hg is cleared much more rapidly from the brain after
thimerosal than after methymercury exposure (24 vs 60 days). It appears that the
difference in brain Hg exposure between thimerosal and MeHg is largely driven by their
differences in systemic disposition kinetics (i.e., the blood level). The average brain-to-
blood partitioning ratio of total Hg in the thimerosal group was slightly higher than that
in the MeHg group (3.5±0.5 vs 2.5±0.6, t-test, p=0.11). Thus, the brain-to-blood mercury
concentration ratio established for MeHg will underestimate the amount of mercury in the
brain after exposure to thimerosal.
17
The large difference in the blood Hg half-life compared to the brain half-life for
the thimerosal-exposed infants (6.9 days vs 24 days) indicates that blood Hg may not be a
good indicator of risk of adverse effects on the brain, particularly under conditions of
rapidly changing blood levels such as those observed following vaccinations. The blood
concentrations of the thimerosal-exposed infants in the current study are within the range
of those reported for human infants following vaccination (Stajich et al 2000). Data from
the current study predicts that while little accumulation of Hg in the blood occurs over
time with repeated vaccinations, accumulation of Hg in the brain of infants will occur.
Thus, conclusion regarding the safety of thimerosl drawn from blood Hg clearance data
in human infants receiving vaccines may not be valid, given the significantly slower half-
life of Hg in the brain as observed in the infant macaques.
There was a much higher proportion of inorganic Hg in the brain of thimerosal
infants than MeHg infants (up to 71% vs. 10%). Absolute inorganic Hg concentrations in
the brains of the thimerosal-exposed infants were approximately twice that of the MeHg
infants. Interestingly, the inorganic fraction in the kidneys of the same cohort of infants
was also significantly higher following i.m. thimerosal than oral MeHg exposure
(0.71±0.04 vs. 0.40±0.03). This suggest that the dealkylation of ethylmercury is much
more extensive than that of MeHg.
Previous reports have indicated that the dealkylation of mercury is a
detoxification process that helps to protect the CNS (Magos et al. 1985; Magos 2003).
These reports are largely based on histology and histochemistry studies of adult rodents
exposed to mercury for a short period of time. The results of these studies indicated that
damage to the cerebellum was only observed in MeHg treated animals who had much
lower levels of inorganic mercury in the brain than animals comparably treated with
ethylmercury. Moreover, the results did not indicate the presence of inorganic mercury
deposits in the area where the cerebellar damage was localized (granular layer).
In contrast, previous studies of adult M. fascicularis monkeys exposed chronically to
MeHg have indicated that demethylation of mercury occurs in the brain over a long
period of time following MeHg exposure and that this is not a detoxification process
(Vahter et al. 1994, 1995; Charleston et al. 1994, 1995, 1996). Results from these studies
indicated higher inorganic Hg concentrations in the brain 6 months after MeHg exposure

18
had ended while organic Hg had cleared from the brain. The estimated half-life of
organic Hg in the brain of these adult monkeys was consistent across various brain
regions at approximately 37days (similar to the brain half-life in the present infant
monkeys). The estimated half-life of inorganic Hg in the brain in the same adult cohort
varied greatly across some regions of the brain, from 227 days to 540 days. In other
regions, the concentrations of inorganic Hg remained the same (thalamus) or doubled
(pituitary) 6 months after exposure to MeHg had ended (Vahter et al. 1994, 1995).
Stereologic and autometallographic studies on the brains of these adult monkeys
indicated that the persistence of inorganic Hg in the brain was associated with a
significant increase in the number of microglia in the brain, while the number of
astrocytes declined. Notably, these effects were observed 6 months after exposure to
methymercury ended, when inorganic Hg concentrations were at their highest levels, or
in animals solely exposed to inorganic Hg (Charleston et al. 1994, 1995, 1996). The
effects in the adult macaques were associated with brain inorganic Hg levels
approximately 5 times higher than those observed in the present group of infant
macaques. The longer-term effects (greater than 6 months) of inorganic Hg in the brain
have not been examined. In addition, whether similar effects are observed at lower levels
in the developing brain is not known. It is important to note that a recent publication has
demonstrated “an active neuroinflammatory process” in brains of autistic patients,
including a marked activation of microglia (Vargas et al. 2005).
In 1999, the American Academy of Pediatrics and the Public Health Service
published a joint statement that urged “all government agencies to work rapidly toward
reducing children’s exposure to mercury from all sources.” The statement recommended
that thimerosal be removed from vaccines as soon as possible as part of this overall
process (American Academy of Pediatrics 1999). Between 1999 and 2001, vaccines
currently recommended for children 6 years of age and under were made available in
thimerosal-free formulations in the United States (CDC 2001). Exposures to thimerosal
through pediatric vaccines, however, still occur in other countries where multiple-dose
vials are used to maintain childhood immunization programs and the control of
preventable disease (Knezdvic et al. 2004).
Recent publications have proposed a direct link between the use of thimerosal

19
containing vaccines and the significant rise in the number of children being diagnosed
with autism, a serious and prevalent developmental disorder (for review, see IOM 2001).
Results from an initial Institute of Medicine (IOM) review of the safety of vaccines found
that there was not sufficient evidence to render an opinion on the relationship between
ethylmercury exposure and developmental disorders in children (IOM 2001). The IOM
review did, however, note the possibility of such a relationship and recommended further
studies be conducted. A recently published second IOM review (IOM 2004) appears to
have abandoned the earlier recommendation as well as back away from the American
Academy of Pediatrics goal. This approach is difficult to understand, given our current
limited knowledge of the toxicokinetics and developmental neurotoxicity of thimerosal, a
compound that has been (and will continue to be) injected in millions of newborns and
infants.
The key findings of the current study are the differences in the disposition kinetics
and demethylation rates of thimerosal and MeHg. Consequently, MeHg is not a suitable
reference for risk assessment from exposure to thimerosal derived Hg. Knowledge of the
biotransformation of thimerosal, the chemical identity of the Hg-containing species in the
blood and brain, and the neurotoxic potential of intact thimerosal and its various
biotransformation products, including ethylmercury are urgently needed to afford a
meaningful interpretation of the potential developmental effects of immunization with
thimerosal-containing vaccines in newborns and infants. This information is critical if
we are to respond to public concerns regarding the safety of childhood immunizations.
20
References American Academy of Pediatrics and Public Health service. 1999. Thimerosal in vaccines: a joint statement. Morb Mortal Week Rep 48:563-565. Ball LK, Ball R, Pratt RD. 2001. An assessment of thimerosal use in childhood vaccines. Pediatrics 107:1147-1154. Berlin M, Crawford A, Grant DVM. Hellberg J, Hellstrom J, Schultz A. 1975. Neurotoxicity of methylmercury in squirrel monkeys. Arch Environ Health 30:340-348. Biroscak BJ, Fiore AE, Fasano N, Fineis P, Collins MP, Stoltman G. 2003. Impact of the thimerosal controversy on Hepatitis B vaccine coverage of infants born to women of unknown Hepatitis B surface antigen status in Michigan. Pediatrics 111:645-649. Blaxill M, Redwood L, Bernard S. 2004. Thimerosal and autism? A plausible hypothesis that should not be dismissed. Medical Hypoth 62:788-794. Burbacher T, Grant K, Mottet NK. 1986. Retarded object permanence development in methylmercury exposed Macaca fascicularis infants. Developmental Psychology 22:771-776. Burbacher T, Rodier PM, Weiss B. 1990a. Methylmercury developmental neurotoxicity: A comparison of effects in humans and animals. Neurotoxicology and Teratology 12:191-202. Burbacher T, Sackett GP, Mottet NK. 1990b. Methylmercury effects on the social behavior of Macaca fascicularis infants. Neurotoxicology and Teratology 12:65-71. CDC 2001. Notice to readers: Update on the supply of Tetanus and Diphtheria Toxoids and of Diptheria and Tetanus Toxoids and Acellular Pertussis Vaccine. MMWR Morb Mortal Wkly Rep 50:189-190. Charleston J, Bolender R, Mottet NK, Body R, Vahter M, Burbacher T. 1994. Increases in the Number of Reactive Glia in the Visual Cortex of Macaca fascicularis Following Subclinical Long-Term Methylmercury Exposure. Tox. Appl. Pharmacol. 129:196-206. Charleston J, Body R, Mottet NK, Vahter M, Burbacher T. 1995. Autometallographic determination of inorganic mercury distribution in the cortex of Macaca fascicularis following long-term subclinical exposure to methylmercury and mercuric chloride. Tox. Appl. Pharmacol. 132:325-333. Charleston J, Body R, Bolender R, Mottet NK, Vahter M, Burbacher T. 1996. Changes in the number of astrocytes and microglia in the thalamus of the monkey Macaca fascicularis following long-term subclinical methylmercury exposure. Neurotoxicology 17:127-138.
21
Clements CJ, Ball LK, Ball R, Pratt RD. 2000. Thiomersal in vaccines. Lancet 355:1279-1280. Gibaldi M, Perrier D. Pharmacokinetics, Marcel Dekker, New York, 1982. Greenwood MR, Dahir P, Clarkson TW, Farant JP, Chartrand A, Khayat A. 1977. Epidemiological experience with the Magos’ reagents in the determination of different forms of mercury in biological samples by flameless atomic absorption. J Anal Toxicol 1:265-269. Gunderson V, Grant K, Burbacher T, Fagan J, Mottet NK. 1986. The effect of low level prenatal methylmercury exposure on visual recognition memory in infant macaques. Child Development 57:1076-1083. Gunderson V, Grant-Webster K, Burbacher T, Mottet NK. 1988. Visual recognition memory deficits in methylmercury exposed Macaca fascicularis infants. Neurotoxicology and Teratology 10:373-379. Gunderson V, Sackett GP. 1984. Development of pattern recognition in infant pigtailed macaques (Macaca nemestrina). Developmental Psychology 20:418-426. Halsey NS. 1999. Perspective on the use of thimerosal-containing vaccines. NVAC Workshop on Thimerosal and Vaccines: Bethesda, Maryland. Institute of Medicine. Stratton K, Gable A, McCormick M, editors. 2001. Immunization safety review: Thimerosal containing vaccines and neurodevelopmental disorders. Washington, DC: National Academy Press. Institute of Medicine. Vaccines and Autism. 2004. Immunization safety review committee. Washington, DC: National Academy Press. Knezevic I, Griffiths E, Reigel F, Dobbelaer R. 2004. Thiomersal in vaccines: a regulatory perspective WHO Consultation, Geneva, 15-16 April 2002. Vaccine 22:1836-1841. Magos L, Clarkson TW. 1972. Atomic Absorption of total, organic and inorganic mercury in blood. J Assoc Official Anal Chemists 55:966-971. Magos L, Brown AW, Sparrow S, Bailey E, Snowden RT, Skipp WR. 1985. The comparative toxicology of ethyl- and methylmercury. Arch Toxicol. 57: 260-267. Magos L. 2003. Neurotoxic character of thimerosal and the allometric extrapolation of adult clearance half-time to infants. J Appl Toxicol. 23:263-269. National Research Council. 2000. Toxicological effects of methylmercury. National Academy Press, Washington 1-344.
22
Pichichero ME, Cernichiari E, Lopreiato J, Treanor J. 2002. Mercury concentrations and metabolism in infants receiving vaccines containing thiomersal: a descriptive study. Lancet 360:1737-1741. Rice DC, Gilbert SG. 1982. Early chronic low-level methylmercury poisoning in monkeys impairs spatial vision. Science 216:759-761. Rice DC, Gilbert SG. 1990. Effects of developmental exposure to methylmercury on spatial and temporal visual function in monkeys. Toxicol Appl Pharmacol 102:151-163. Rice DC, Gilbert SG. 1995. Effects of developmental methylmercury exposure or lifetime lead exposure on vibration sensitivity function in monkeys. Toxicol Appl Pharmacol 134:161-169. Safe Minds, Sensible Action for Ending Mercury-Induced Neurological Disorders http://www.SafeMinds.org Stajich GV, Lopez GP, Harry SW, Sexson WR. 2000. Iatrogenic exposure to mercury after hepatitis B vaccination in preterm infants. J Pediatr 136:679-681. Stinson CH, Shen DM, Burbacher TM, Mohamed MK, Mottet NK. 1989. Kinetics of methylmercury in blood and brain during chronic exposure in the monkey Macaca fascicularis. Pharmacol Toxicol. 65:223-230. Tap M, Parkin JE. 2000. Route of decomposition of thiomersal (thimerosal). Inter J Pharm 208: 23-34. Thomas AR, Fiore AE, Corwith HL, Cieslak PR, Margolis HS. 2004. Hepatitis B vaccine coverage among infants born to women without prenatal screening for hepatitis B virus infection: Effects of the joint statement on thimerosal in vaccines. Pediatr Infect Dis J 23:313-318. Vahter M, Mottet NK, Friberg L, Lind B, Shen D, Burbacher T. 1994. Speciation of Mercury in the Primate Blood and Brian Following Long-Term Exposure to Methylmercury. Tox. Appl. Pharmacol. 124: 221-229. Vahter M, Mottet NK, Friberg L, Lind B, Charleston J, Shen D, Burbacher T. 1995. Demethylation of methylmercury in different brain sites of Macaca fascicularis monkeys during long-term subclinical methylmercury exposure. Tox. Appl. Pharmacol. 134:273-284. Vargus DL, Nascimbene C, Krishnan C, Zimmerman AW, Pardo CA. 2005. Neuroglial activation and neuroinflammation in the brain of patients with Autism. Annals of Neurology 57: 67-81.

23
Table 1. Study Design and Schedule
Age (Days) Birth
Age (0) 2 4 7 9 11 14 16 18 21 23 25 28 31 35 38 42 45 49 Mercury Dose1 (Oral MeHg) 20 20 20 20
Mercury Dose2 (I.M. Thimerosal in Vaccine)
OPV-0 HB-20
OPV-0 HB-4 DTP-8 Hib-8
OPV-0 DTP-10 Hib-10
OPV-0 HB-4 DTP-8 Hib-8
Blood Draws3 0 2 4 7 2 4 7 2 4 7 2 4 7 10 14 17 21 24 28 Sacrifice Day4 2 4 7 28 1Dose of MeHg in µg/kg 2Dose of ethylmercury in µg/kg 3Days after most recent dose 4Days after last (4th) dose
24
Table 2. Mean (SE) body and brain weight (grams) and brain to body ratio at sacrifice for controls, MeHg exposed and thimerosal exposed animals. Exposure Group Body Weight Brain Weight Brain to Body Ratio
Controls (n=9) 509.3 (52.0) 52.1 (2.5) 0.107 (0.009)
MeHg Exposed (n=17) 499.1 (17.5) 51.1 (1.1) 0.103 (0.003)
Thimerosal Exposed (n=17) 529.1 (25.4) 52.7 (1.2) 0.102 (0.003)
25
Table 3. Parameter estimates derived from a one-compartment analysis of the mean blood total Hg concentration for the oral methylmercury group (N=17).
Model Parameters Mean ± SD V/F (L/kg) 1.67 ± 0.07 ka (day-1) 2.07 ± 1.04 K (day-1) 0.0276 ± 0.0024
T1/2 (days) 21.5 Cl/F (ml/day/kg) 46.1

26
Table 4. Parameter estimates derived from a two-compartment analysis of the mean blood total Hg concentration for the i.m. thimerosal group (N=17).
Model Parameters Mean ± SD ka (day-1) 3.24 ± 3.00 k12 (day-1) 0.081 ± 0.076 k21 (day-1) 0.177 ± 0.138 k10 (day-1) 0.148 ± 0.024 T1/2, α (day) 2.13 T1/2, β (day) 8.62 Vc/F (L/kg) 1.68 ± 0.30 Vss/F (L/kg) 2.45
Vp (L/kg) 0.77 Cl/F (ml/day/kg) 248

27
Figure 1. Weight gain of infants during study

28
Figure 2. Comparison of model predicted and observed mean blood total Hg concentration during and after four weekly oral doses (20 µg/kg) of methylmercury.

29
Figure 3. A semi-logarithmic plot of washout of total Hg in blood ( ) and the brain ( ) after 4 weekly oral doses (20 µg/kg) of methylmercury. The data were collected from groups of infants sacrificed at 2, 4, 7 and 28 days following the last dose. The lines represent nonlinear regression fit of the data to a monoexpoential model. The regression estimate (± standard error) of T1/2 is shown along with the correlation coefficient (r).

30
Figure 4. A semi-logarithmic plot of the washout of organic (♦) and inorganic (◊) Hg in the brain after 4 weekly oral doses (20 µg/kg) of methylmercury. The data were collected from groups of infants sacrificed at 2, 4, 7 and 28 days following the last dose. The lines represent nonlinear regression fit of the data to a monoexpoential model. The regression estimate (± standard error) of T1/2 for organic Hg is shown along with the correlation coefficient (r). The half-life of inorganic Hg is too long (>120 days) to be accurately estimated from the present data (i.e., r is not significantly different from 0).

31
Figure 5. Comparison of model predicted and observed mean blood total Hg concentration during and after four weekly i.m. injection of vaccine containing thimerosal at 20 µg/kg of Hg.

32
Figure 6. A semi-logarithmic plot of washout of total Hg in blood ( ) and the brain ( ) after four weekly i.m. injections of vaccine thimerosal at 20 µg/kg of Hg. The data were collected from groups of infants sacrificed at 2, 4, 7, 10, 17 and 21 days following the last dose. The lines represent nonlinear regression fit of the data to a monoexpoential model. The regression estimate (± standard error) of T1/2 is shown along with the correlation coefficient (r).

33
Figure 7. A semi-logarithmic plot of washout of organic (♦) and inorganic (◊) Hg in the brain after 4 weekly i.m.injection of vaccines containing thiomerosal at 20 µg/kg of Hg. The data were collected from groups of infants sacrificed at 2, 4, 7 and 28 days following the last dose. The lines represent nonlinear regression fit of the data to a monoexpoential model. The regression estimate (± standard error) of T1/2 for organic Hg is shown along with the correlation coefficient (r). The half-life of inorganic Hg is too long (>120 days) to be accurately estimated from the present data (i.e., r is not significantly different from 0).

34
List of abbreviations
MeHg- methylmercury
EPA- Environmental Protection Agency
Hg- mercury
Hg2+- mercuric mercury
Hg0- elemental mercury
i.m.- intramuscular
µg/kg/day- micrograms per kilogram per day
µg/ml- micrograms per milliliter
µg/L- micrograms per liter
L/kg- liters per kilogram
ml/day/kg- milliliters per day per kilogram
mg/kg- micrograms per kilogram
NaCl- sodium chloride
NaOH- sodium hydroxide
SnCl2-stannous chloride
ng Hg/ml- nanograms mercury per milliliter
ng/ml- nanograms per milliliter
ng/g- nanograms per gram
ppm- parts per million
K- elimination rate constant
V/F-volume of distribution (F is the implicit bioavailability term)
ka- absorption rate constant
T1/2- half-lives
Cl/F- blood clearance
AIC- Akaike Information Criterion
k12- rate constants for Hg transfer from the central to the peripheral compartment
k21- return from the peripheral to the central compartment
k10- elimination rate constant from the central compartment
Vc- initial distribution volume
Vc/F- apparent volume of the central compartment

35
Vss- fully equilibrated volume
Vss/F- apparent distribution volume at steady-state
Vp=Vss – Vc- peripheral volume referenced to blood concentration
SE- standard error
AUC- area under the curve
CNS- central nervous system
IOM- Institute of Medicine


![Pfizer/BioNTech COVID-19 mRNA vaccine...- 10 µg, 20 µg, 30 µg, 100 µg - Immunized on Day 1 and a boost dose on Day 21 [No boost for 100µg cohort] Germany Phase 1/2 Study** (BNT162-01](https://img.pdfslide.us/doc/110x75/60a064ae2ff07627e1303b25/pfizerbiontech-covid-19-mrna-vaccine-10-g-20-g-30-g-100-g-immunized.jpg)


![[Product Monograph Template - Standard] - Novartis...Page 1 of 60 PRODUCT MONOGRAPH PrSANDOSTATIN® (Octreotide acetate Injection) 50 µg/ mL, 100 µg/ mL, 200 µg/ mL, 500 µg/ mL](https://img.pdfslide.us/doc/110x75/5ea993fd17e967737b0c06c0/product-monograph-template-standard-novartis-page-1-of-60-product-monograph.jpg)