Embed Size (px)
Citation preview
Comparing HIV and AIDS
Prevalence within Countries
Comparing HIV and AIDS
Prevalence within Countries
By: Dan Evans
Ida NordestgaardLacey McLean
By: Dan Evans
Ida NordestgaardLacey McLean
30 April 2009Economic Statistics 120
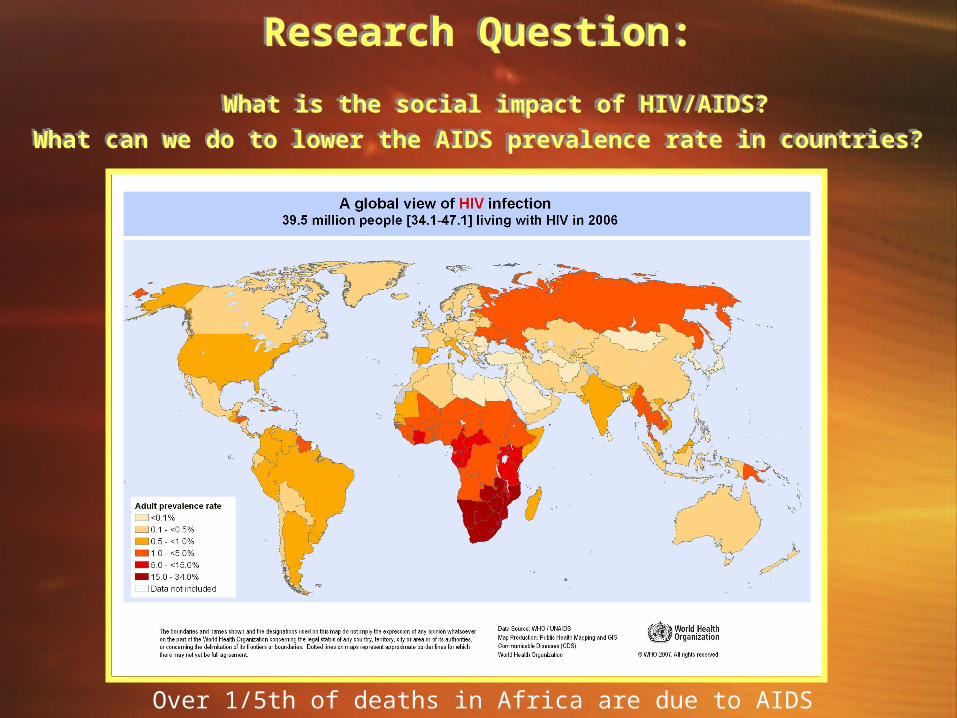
Research Question:
What is the social impact of HIV/AIDS?
What can we do to lower the AIDS prevalence rate in countries?
Research Question:
What is the social impact of HIV/AIDS?
What can we do to lower the AIDS prevalence rate in countries?
Over 1/5th of deaths in Africa are due to AIDS

Estimated number of people living with HIV, by region(1990-2006)
Estimated number of people living with HIV, by region(1990-2006)
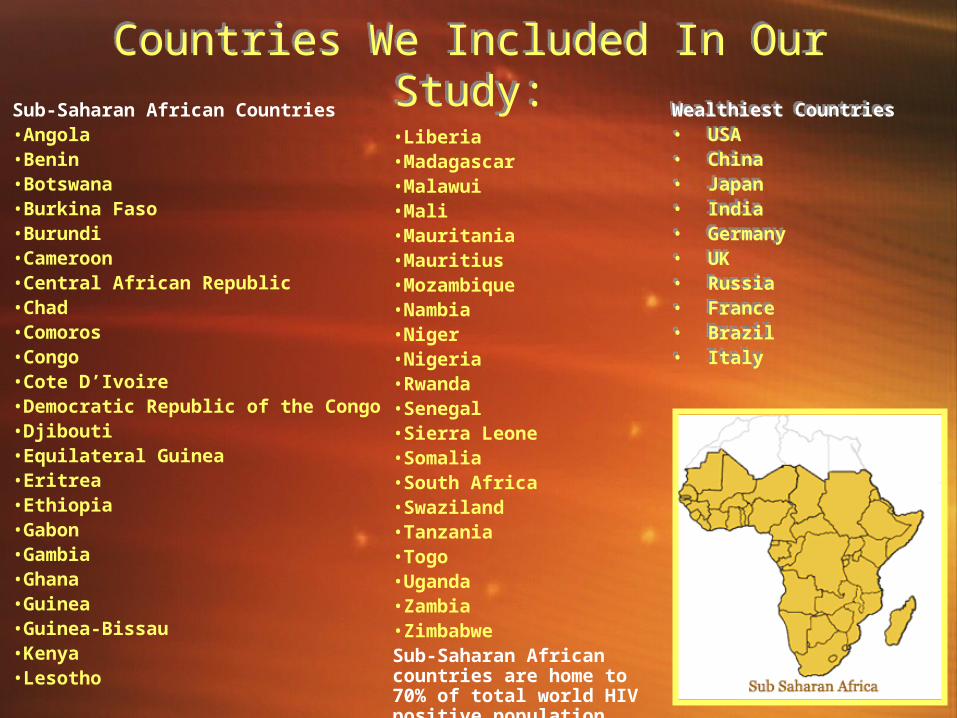
Countries We Included In Our Study:Countries We Included In Our Study:Wealthiest Countries • USA• China• Japan• India• Germany• UK• Russia• France• Brazil• Italy
Wealthiest Countries • USA• China• Japan• India• Germany• UK• Russia• France• Brazil• Italy
•Liberia•Madagascar•Malawui•Mali•Mauritania•Mauritius•Mozambique•Nambia•Niger•Nigeria•Rwanda•Senegal•Sierra Leone•Somalia•South Africa•Swaziland•Tanzania•Togo•Uganda•Zambia•ZimbabweSub-Saharan African countries are home to 70% of total world HIV positive population
Sub-Saharan African Countries •Angola•Benin•Botswana•Burkina Faso•Burundi•Cameroon•Central African Republic•Chad•Comoros•Congo•Cote D’Ivoire•Democratic Republic of the Congo•Djibouti•Equilateral Guinea•Eritrea•Ethiopia•Gabon•Gambia•Ghana•Guinea•Guinea-Bissau•Kenya•Lesotho
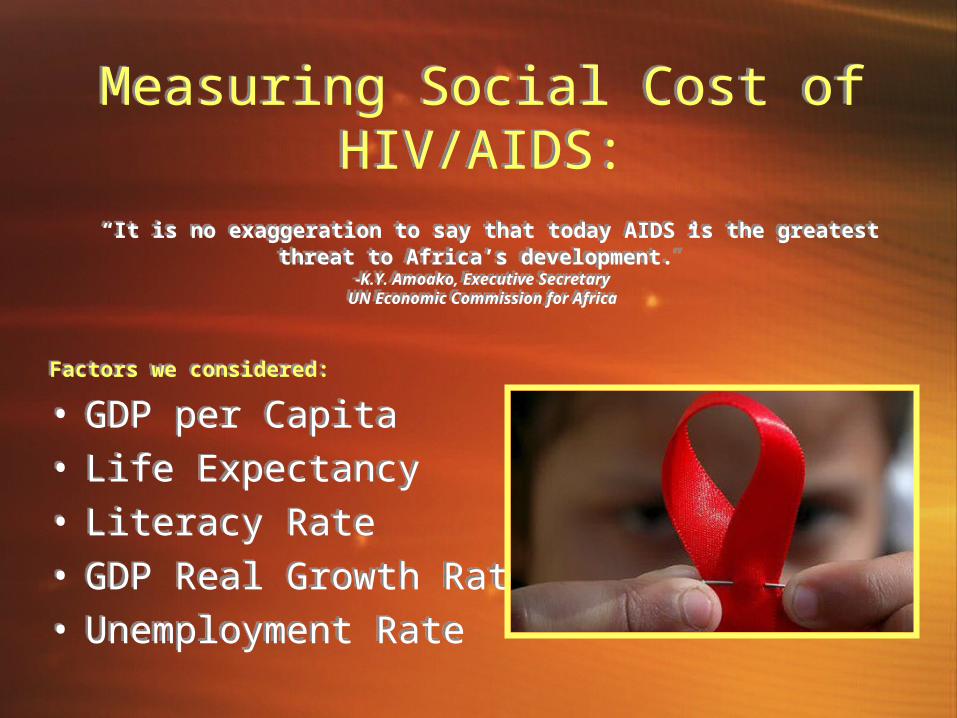
Measuring Social Cost of HIV/AIDS:
“It is no exaggeration to say that today AIDS is the greatest threat to Africa’s development.”
-K.Y. Amoako, Executive SecretaryUN Economic Commission for Africa
Measuring Social Cost of HIV/AIDS:
“It is no exaggeration to say that today AIDS is the greatest threat to Africa’s development.”
-K.Y. Amoako, Executive SecretaryUN Economic Commission for Africa
Factors we considered:
• GDP per Capita• Life Expectancy• Literacy Rate• GDP Real Growth Rate• Unemployment Rate
Factors we considered:
• GDP per Capita• Life Expectancy• Literacy Rate• GDP Real Growth Rate• Unemployment Rate
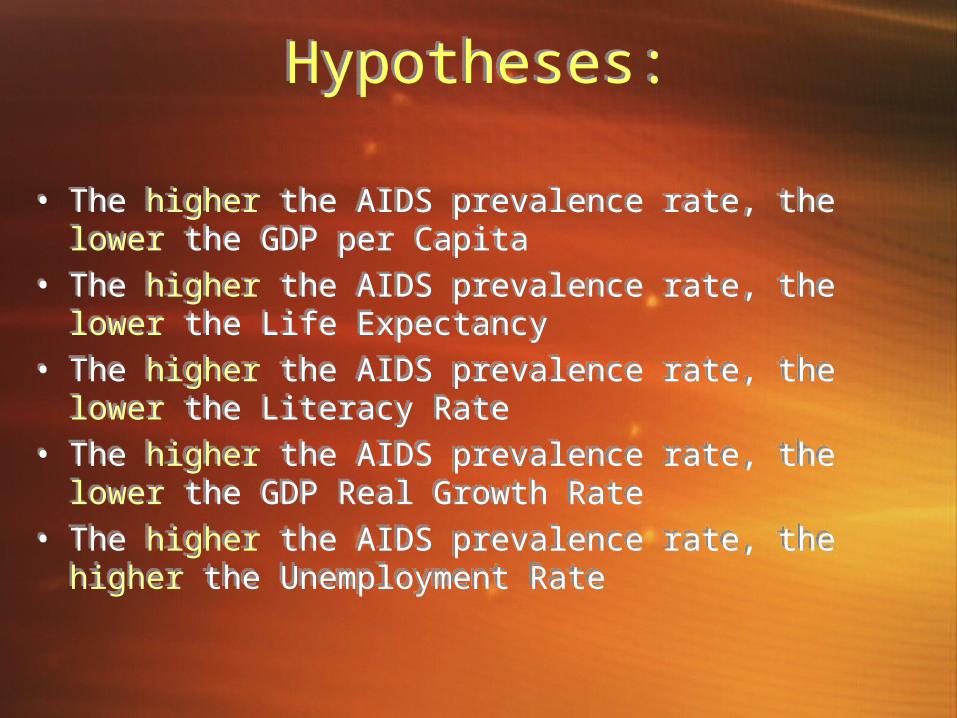
Hypotheses:Hypotheses:
• The higher the AIDS prevalence rate, the lower the GDP per Capita
• The higher the AIDS prevalence rate, the lower the Life Expectancy
• The higher the AIDS prevalence rate, the lower the Literacy Rate
• The higher the AIDS prevalence rate, the lower the GDP Real Growth Rate
• The higher the AIDS prevalence rate, the higher the Unemployment Rate
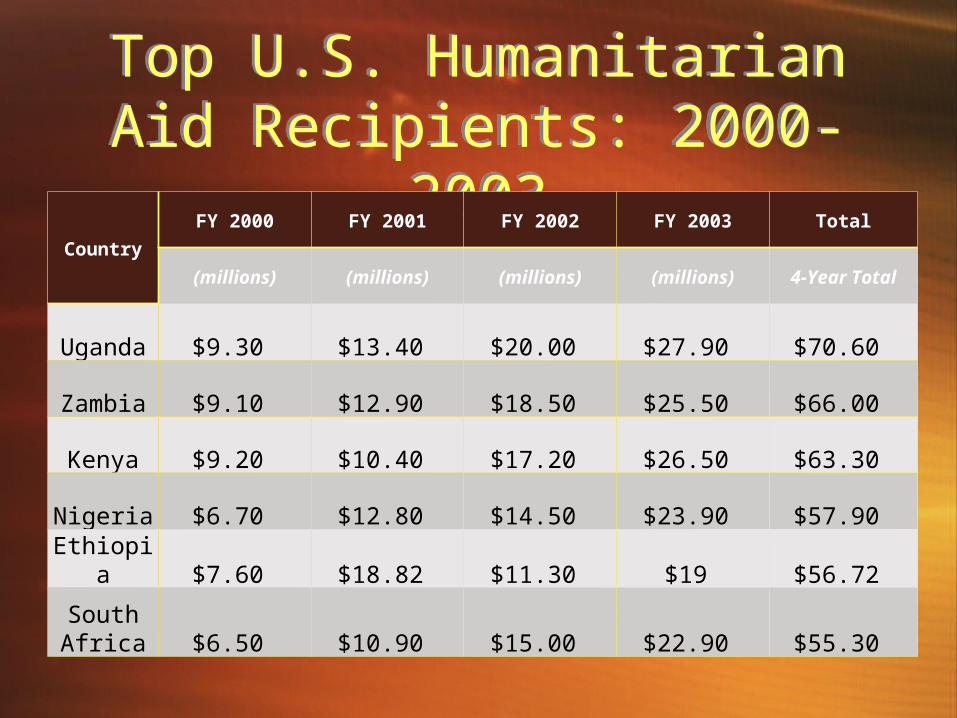
Top U.S. Humanitarian Aid Recipients: 2000-2003
Top U.S. Humanitarian Aid Recipients: 2000-2003
Country
FY 2000 FY 2001 FY 2002 FY 2003 Total
(millions) (millions) (millions) (millions) 4-Year Total
Uganda $9.30 $13.40 $20.00 $27.90 $70.60
Zambia $9.10 $12.90 $18.50 $25.50 $66.00
Kenya $9.20 $10.40 $17.20 $26.50 $63.30
Nigeria $6.70 $12.80 $14.50 $23.90 $57.90
Ethiopia $7.60 $18.82 $11.30 $19 $56.72
South Africa $6.50 $10.90 $15.00 $22.90 $55.30
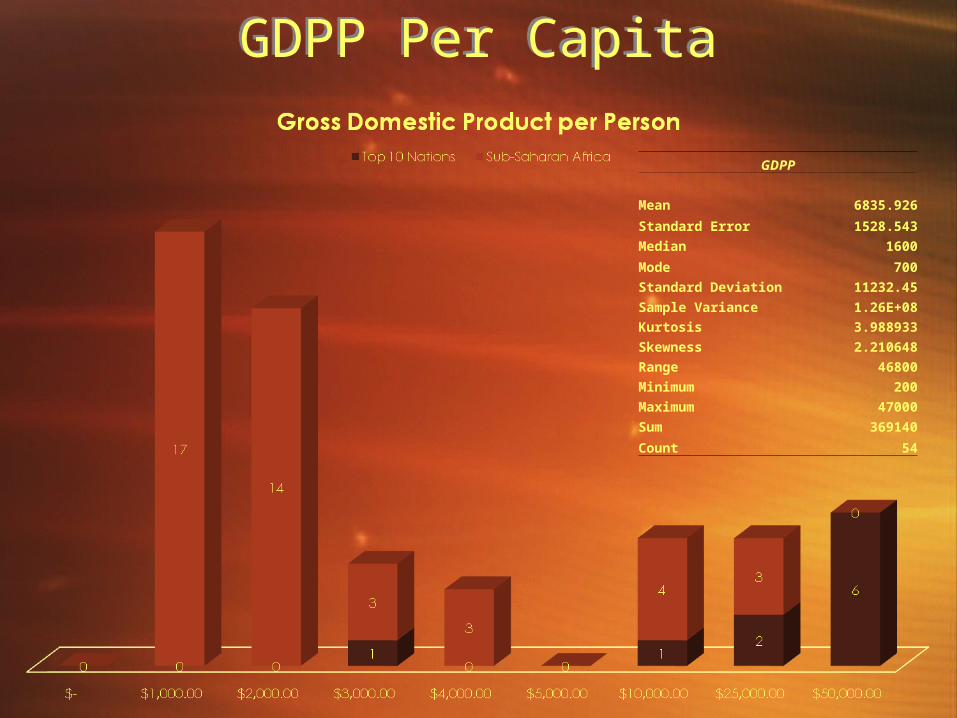
GDPP Per CapitaGDPP Per Capita
GDPP
Mean 6835.926
Standard Error 1528.543
Median 1600
Mode 700
Standard Deviation 11232.45
Sample Variance 1.26E+08
Kurtosis 3.988933
Skewness 2.210648
Range 46800
Minimum 200
Maximum 47000
Sum 369140
Count 54
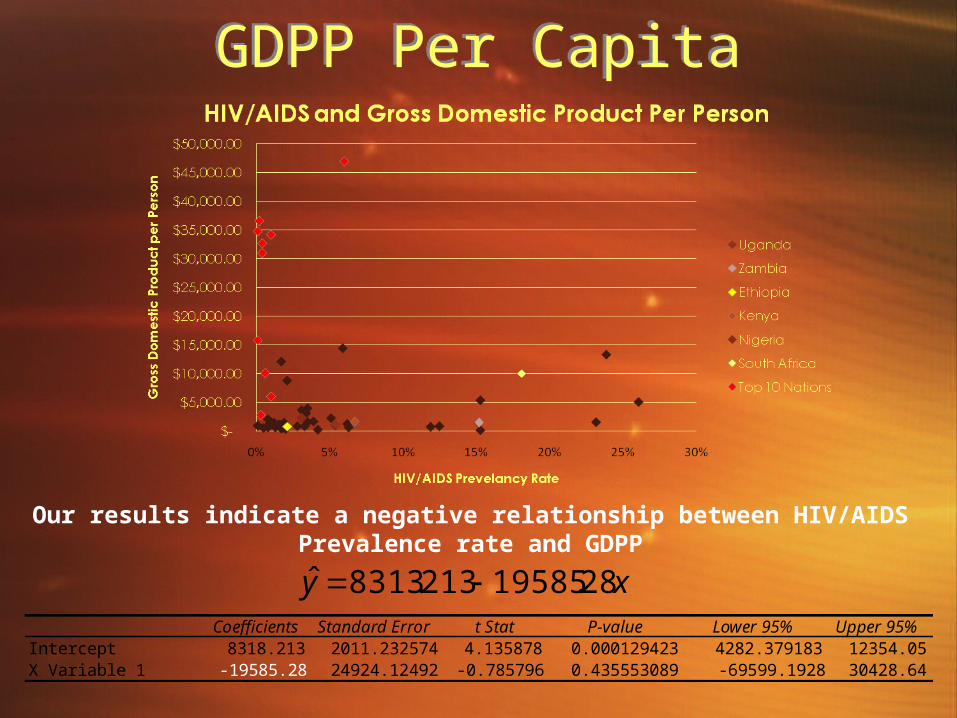
GDPP Per CapitaGDPP Per Capita
Coefficients Standard Error t Stat P-value Lower 95% Upper 95%Intercept 8318.213 2011.232574 4.135878 0.000129423 4282.379183 12354.05X Variable 1 -19585.28 24924.12492 -0.785796 0.435553089 -69599.1928 30428.64
ˆ y 8313.213 19585.28x
Our results indicate a negative relationship between HIV/AIDSPrevalence rate and GDPP
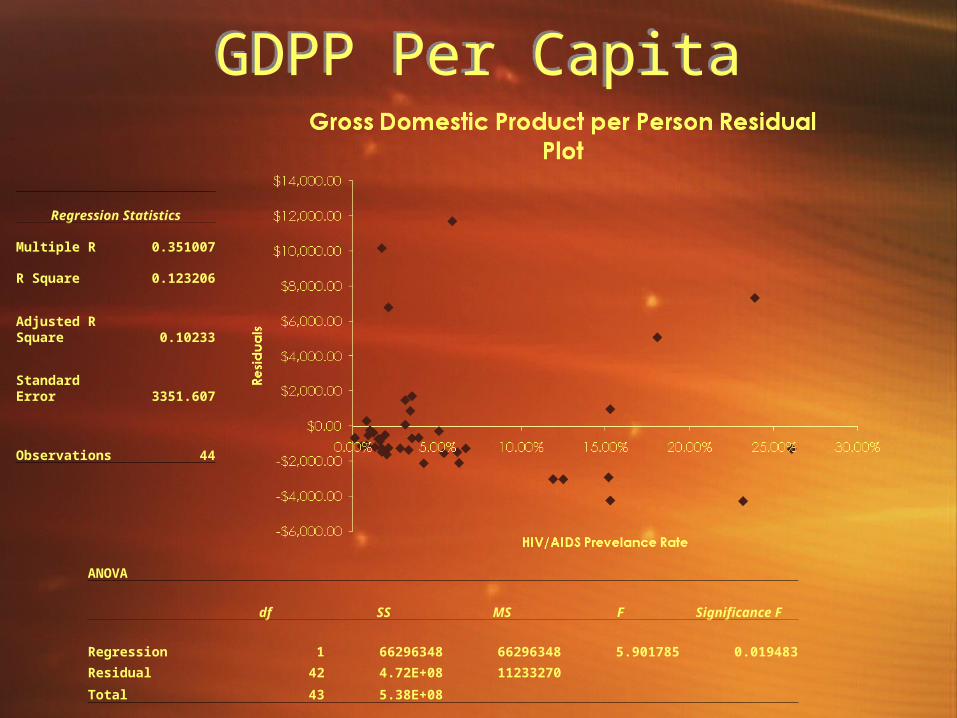
GDPP Per CapitaGDPP Per Capita
Regression Statistics
Multiple R 0.351007
R Square 0.123206
Adjusted R Square 0.10233
Standard Error 3351.607
Observations 44
ANOVA
df SS MS F Significance F
Regression 1 66296348 66296348 5.901785 0.019483
Residual 42 4.72E+08 11233270
Total 43 5.38E+08
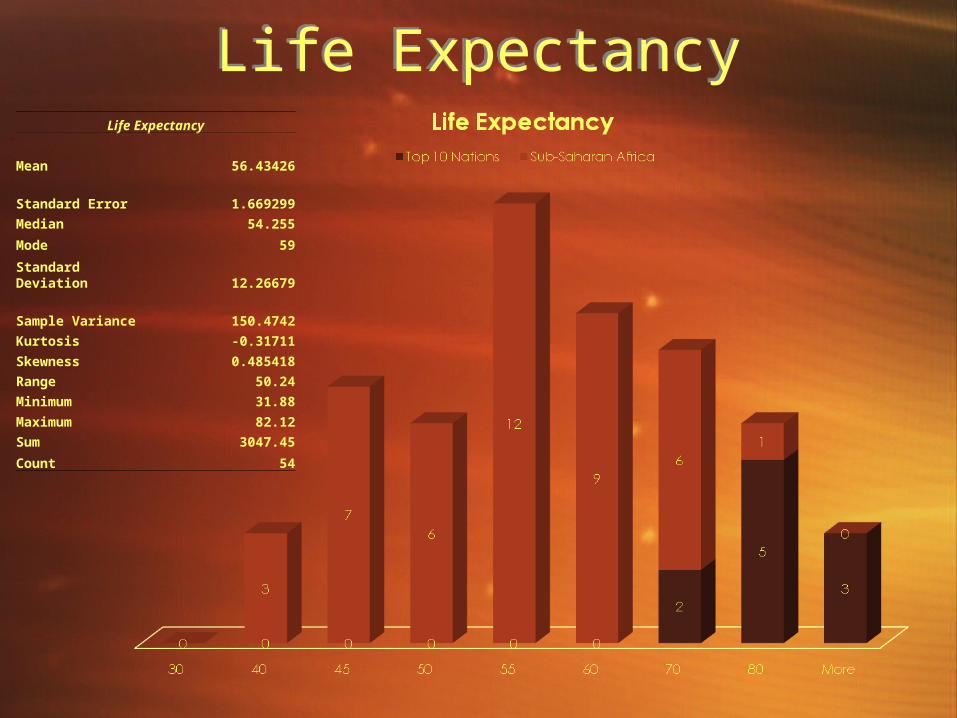
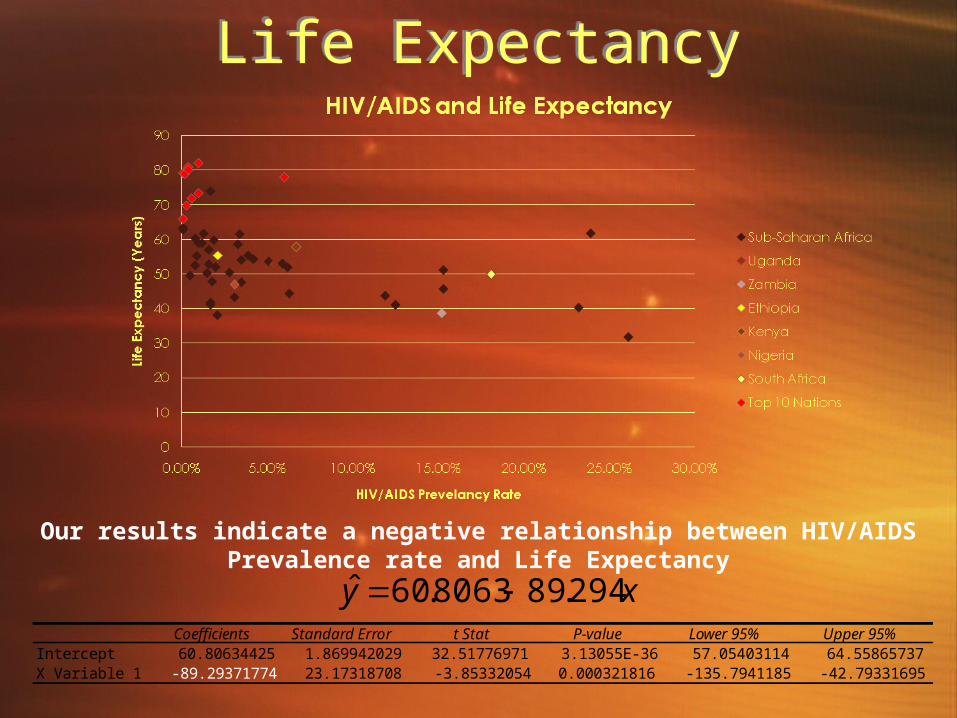
Life ExpectancyLife ExpectancyLife Expectancy
Mean 56.43426
Standard Error 1.669299
Median 54.255
Mode 59
Standard Deviation 12.26679
Sample Variance 150.4742
Kurtosis -0.31711
Skewness 0.485418
Range 50.24
Minimum 31.88
Maximum 82.12
Sum 3047.45
Count 54
Life ExpectancyLife Expectancy
Coefficients Standard Error t Stat P-value Lower 95% Upper 95%Intercept 60.80634425 1.869942029 32.51776971 3.13055E-36 57.05403114 64.55865737X Variable 1 -89.29371774 23.17318708 -3.85332054 0.000321816 -135.7941185 -42.79331695
ˆ y 60.8063 89.294x
Our results indicate a negative relationship between HIV/AIDSPrevalence rate and Life Expectancy
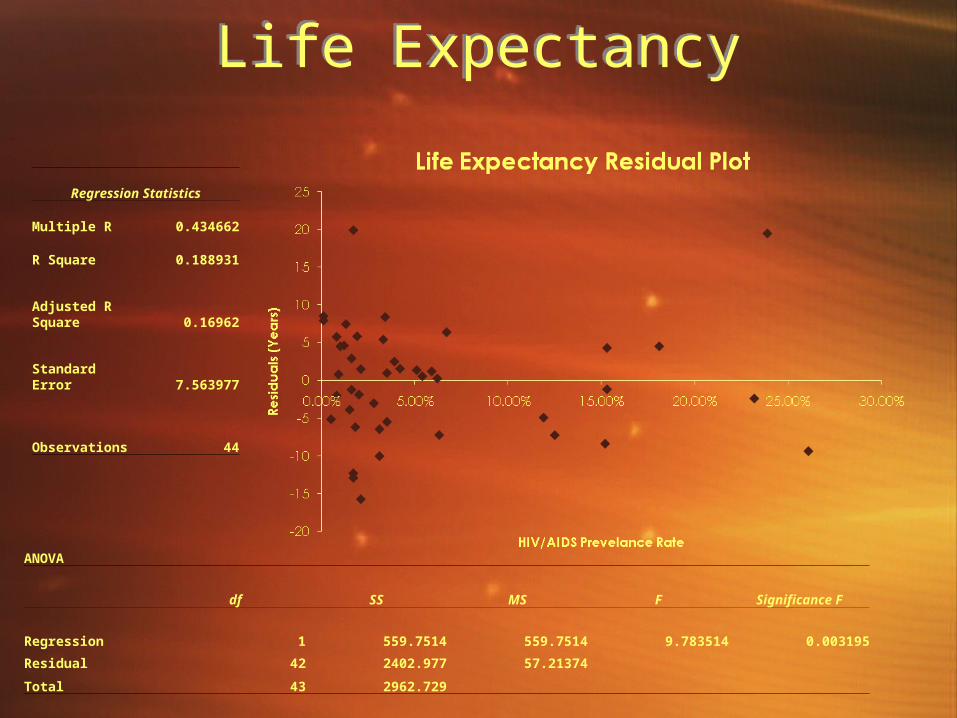
Life ExpectancyLife Expectancy
Regression Statistics
Multiple R 0.434662
R Square 0.188931
Adjusted R Square 0.16962
Standard Error 7.563977
Observations 44
ANOVA
df SS MS F Significance F
Regression 1 559.7514 559.7514 9.783514 0.003195
Residual 42 2402.977 57.21374
Total 43 2962.729
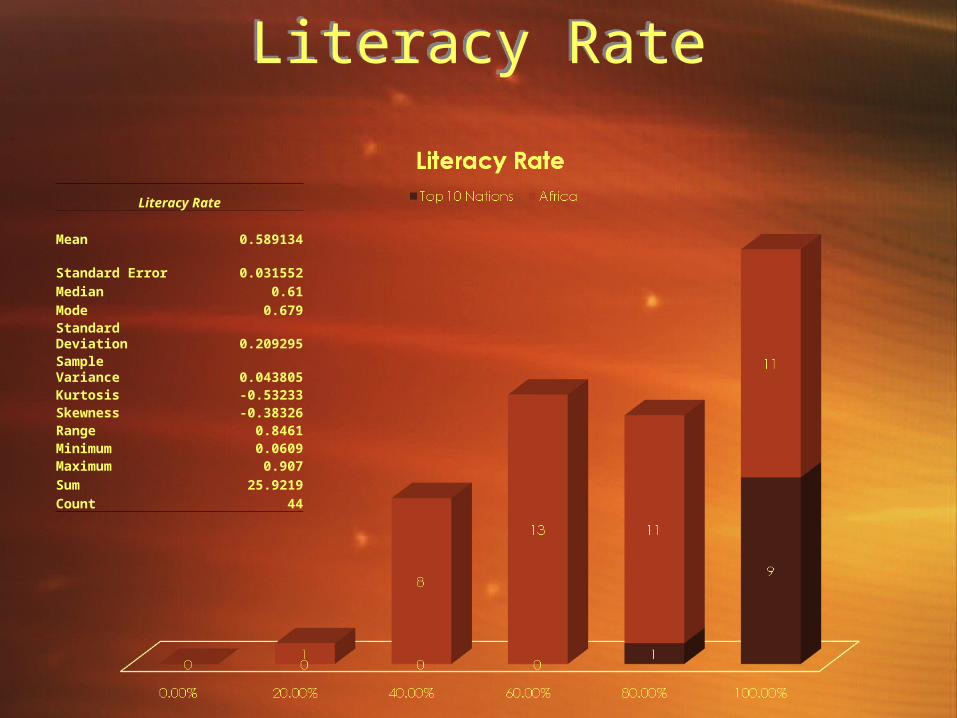
Literacy RateLiteracy Rate
Literacy Rate
Mean 0.589134
Standard Error 0.031552Median 0.61Mode 0.679Standard Deviation 0.209295Sample Variance 0.043805Kurtosis -0.53233Skewness -0.38326Range 0.8461Minimum 0.0609Maximum 0.907Sum 25.9219Count 44

Literacy RateLiteracy Rate
Coefficients Standard Error t Stat P-value Lower 95% Upper 95%Intercept 0.6056498 0.039526061 15.322798 6.35E-21 0.526335 0.6849647X Variable 1 0.9643753 0.489825237 1.9688151 0.054315 -0.0185309 1.9472815
ˆ y .6056 .9644x
Our results indicate a positive relationship between HIV/AIDSprevalence rate and literacy rate
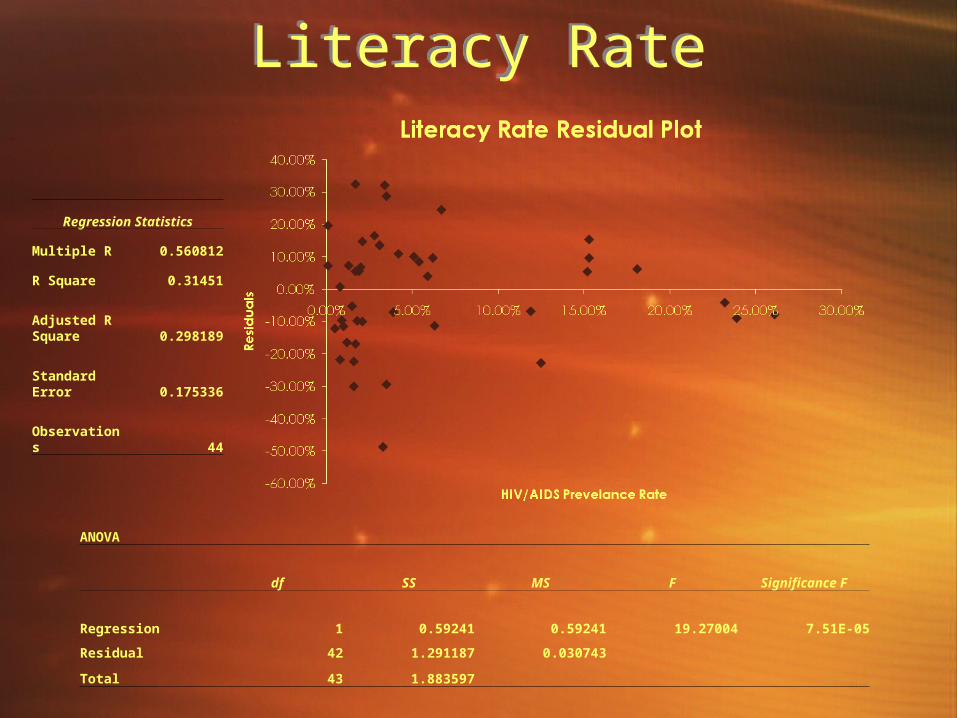
Literacy RateLiteracy Rate
Regression Statistics
Multiple R 0.560812
R Square 0.31451
Adjusted R Square 0.298189
Standard Error 0.175336
Observations 44
ANOVA
df SS MS F Significance F
Regression 1 0.59241 0.59241 19.27004 7.51E-05
Residual 42 1.291187 0.030743
Total 43 1.883597
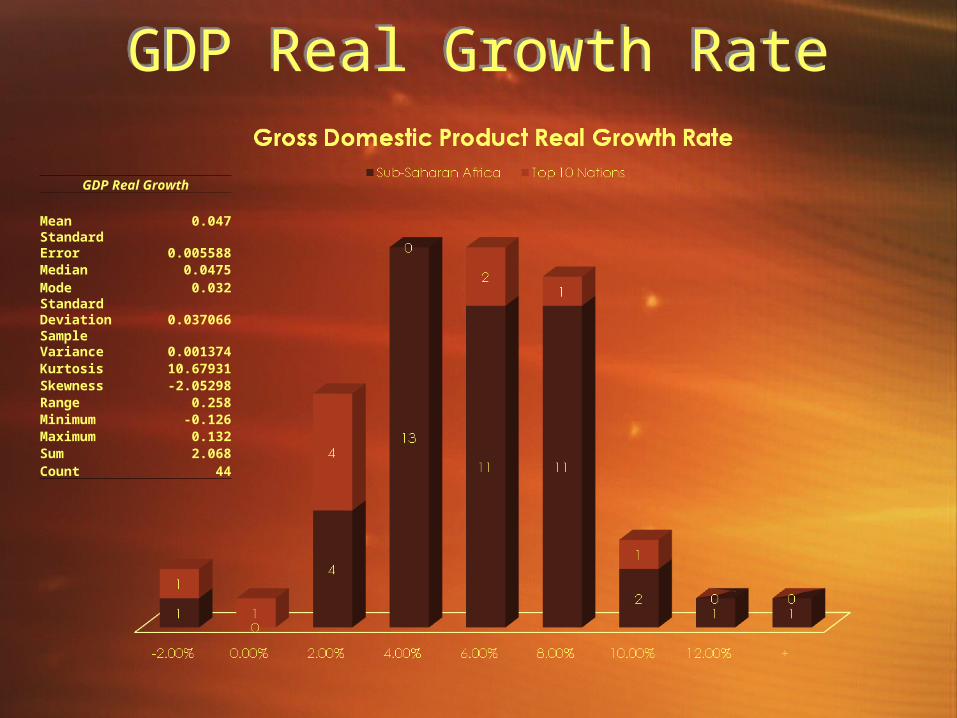
GDP Real Growth RateGDP Real Growth Rate
GDP Real Growth
Mean 0.047Standard Error 0.005588Median 0.0475Mode 0.032Standard Deviation 0.037066Sample Variance 0.001374Kurtosis 10.67931Skewness -2.05298Range 0.258Minimum -0.126Maximum 0.132Sum 2.068Count 44
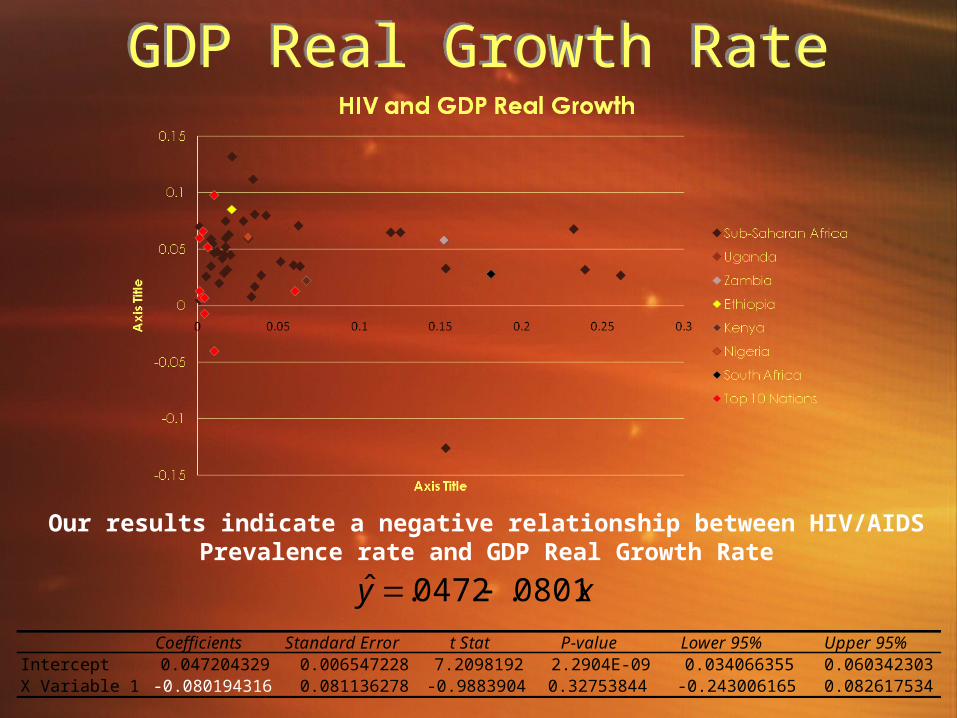
GDP Real Growth RateGDP Real Growth Rate
Coefficients Standard Error t Stat P-value Lower 95% Upper 95%Intercept 0.047204329 0.006547228 7.2098192 2.2904E-09 0.034066355 0.060342303X Variable 1 -0.080194316 0.081136278 -0.9883904 0.32753844 -0.243006165 0.082617534
ˆ y .0472 .0801x
Our results indicate a negative relationship between HIV/AIDSPrevalence rate and GDP Real Growth Rate
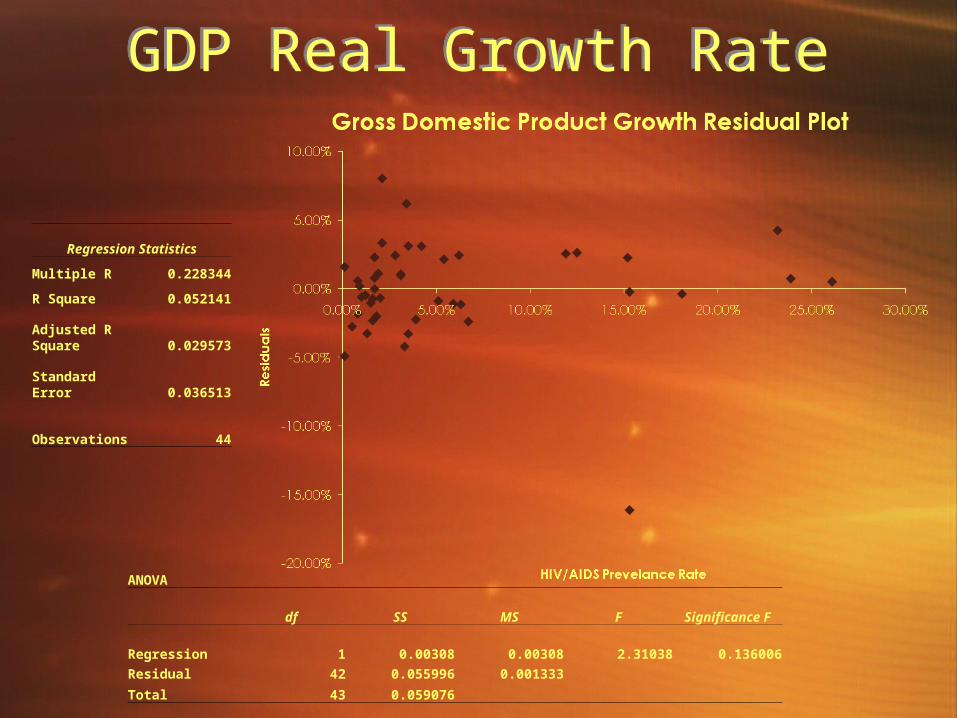
GDP Real Growth RateGDP Real Growth Rate
Regression Statistics
Multiple R 0.228344
R Square 0.052141
Adjusted R Square 0.029573
Standard Error 0.036513
Observations 44
ANOVA
df SS MS F Significance F
Regression 1 0.00308 0.00308 2.31038 0.136006
Residual 42 0.055996 0.001333
Total 43 0.059076
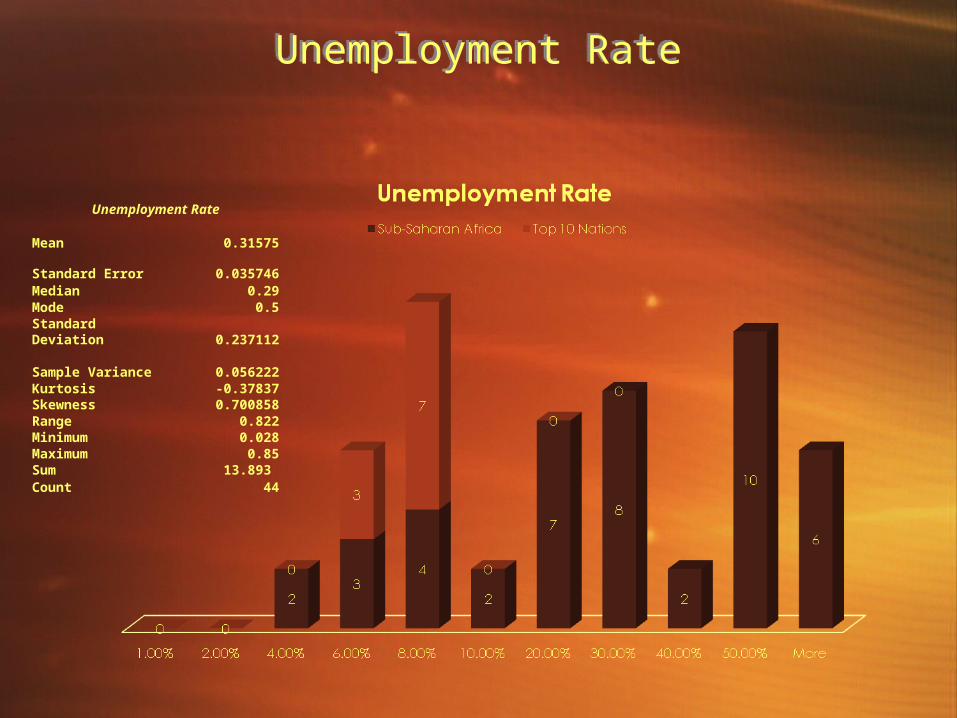
Unemployment RateUnemployment Rate
Unemployment Rate
Mean 0.31575
Standard Error 0.035746Median 0.29Mode 0.5Standard Deviation 0.237112Sample Variance 0.056222Kurtosis -0.37837Skewness 0.700858Range 0.822Minimum 0.028Maximum 0.85Sum 13.893 Count 44
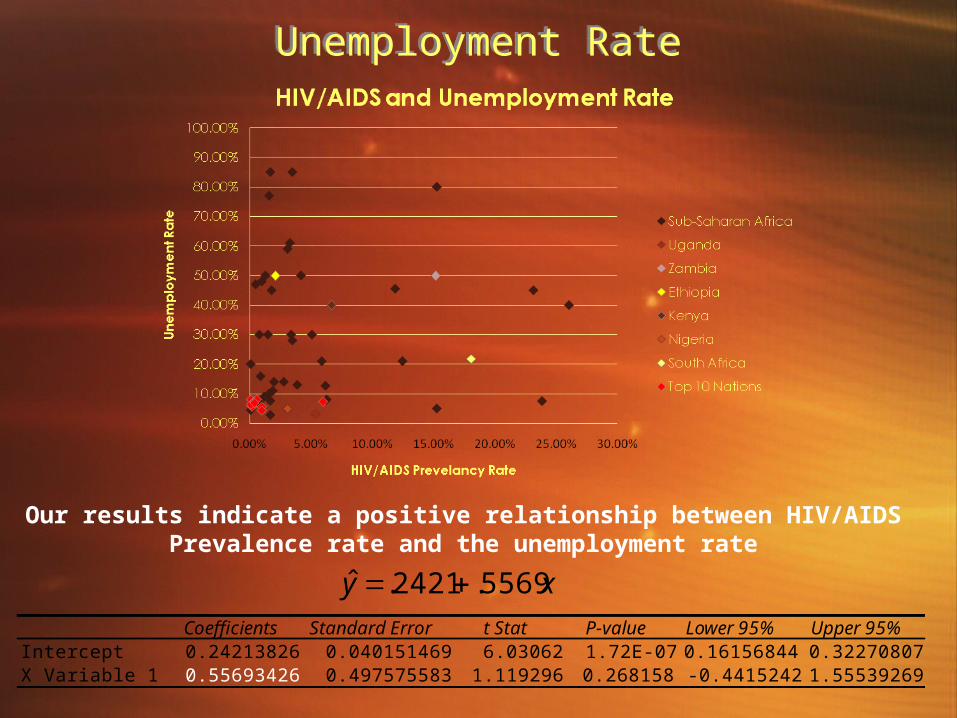
Unemployment RateUnemployment Rate
Coefficients Standard Error t Stat P-value Lower 95% Upper 95%Intercept 0.24213826 0.040151469 6.03062 1.72E-07 0.16156844 0.32270807X Variable 1 0.55693426 0.497575583 1.119296 0.268158 -0.4415242 1.55539269
Our results indicate a positive relationship between HIV/AIDSPrevalence rate and the unemployment rate
xy 5569.2421.ˆ
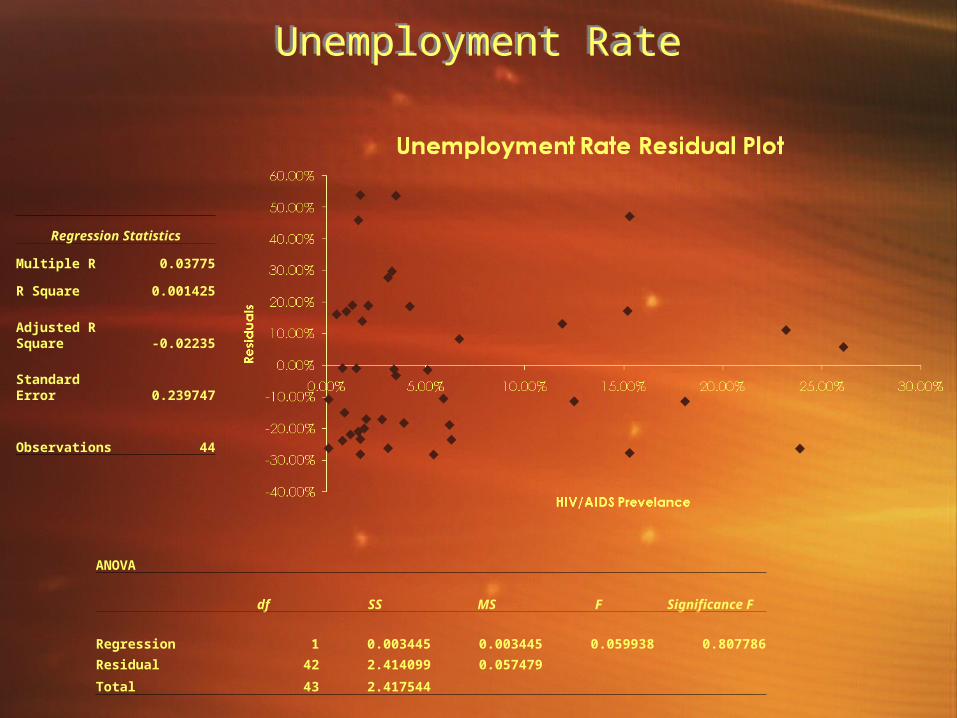
Unemployment RateUnemployment Rate
Regression Statistics
Multiple R 0.03775
R Square 0.001425
Adjusted R Square -0.02235
Standard Error 0.239747
Observations 44
ANOVA
df SS MS F Significance F
Regression 1 0.003445 0.003445 0.059938 0.807786
Residual 42 2.414099 0.057479
Total 43 2.417544
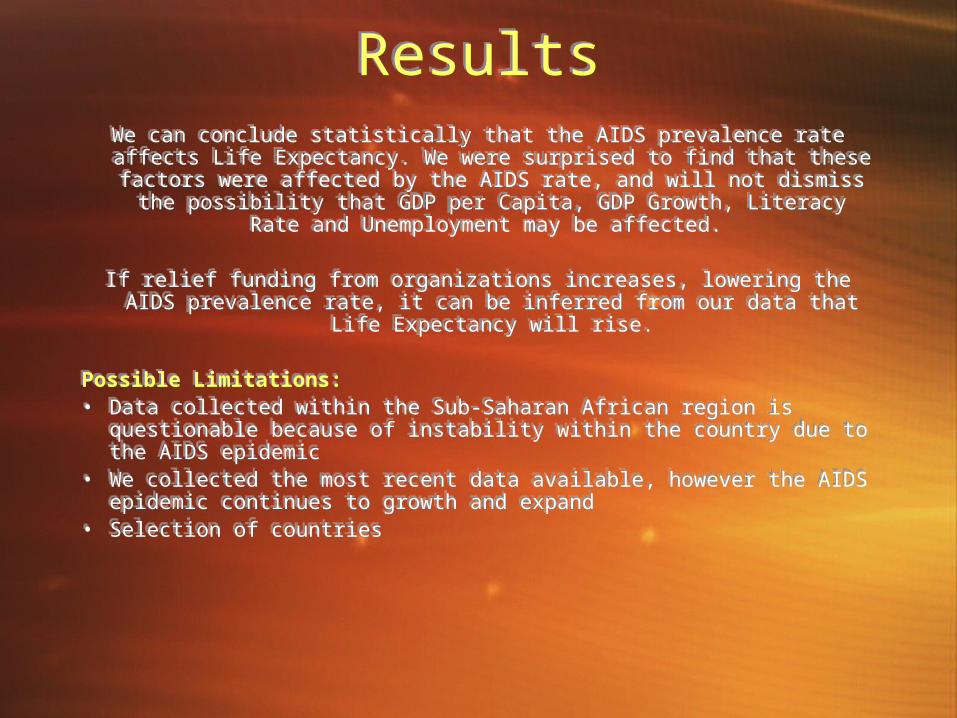
ResultsResultsWe can conclude statistically that the AIDS prevalence rate affects Life
Expectancy. We were surprised to find that these factors were affected by the AIDS rate, and will not dismiss the possibility that
GDP per Capita, GDP Growth, Literacy Rate and Unemployment may be affected.
If relief funding from organizations increases, lowering the AIDS prevalence rate, it can be inferred from our data that Life
Expectancy will rise.
Possible Limitations:• Data collected within the Sub-Saharan African region is questionable
because of instability within the country due to the AIDS epidemic• We collected the most recent data available, however the AIDS
epidemic continues to growth and expand• Selection of countries
We can conclude statistically that the AIDS prevalence rate affects Life Expectancy. We were surprised to find that these factors were
affected by the AIDS rate, and will not dismiss the possibility that GDP per Capita, GDP Growth, Literacy Rate and Unemployment may
be affected.
If relief funding from organizations increases, lowering the AIDS prevalence rate, it can be inferred from our data that Life
Expectancy will rise.
Possible Limitations:• Data collected within the Sub-Saharan African region is questionable
because of instability within the country due to the AIDS epidemic• We collected the most recent data available, however the AIDS
epidemic continues to growth and expand• Selection of countries

Funding Toward AIDSFunding Toward AIDS• Global Spending on AIDS has increased from $3 million in
1996 to $6.1 in 2004. • It was projected in 2008 the world would need to spend $22
billion to effectively respond to the epidemic.• Sources of funding include:
– National Governments– Multilateral Funding Organizations– Private Sector Funding– Domestic Resources
• Projected distribution of resources:– 38% HIV care and treatment– 35% for prevention– 22% for orphan support– 5% for policy, advocacy and administration costs
• Global Spending on AIDS has increased from $3 million in 1996 to $6.1 in 2004.
• It was projected in 2008 the world would need to spend $22 billion to effectively respond to the epidemic.
• Sources of funding include:– National Governments– Multilateral Funding Organizations– Private Sector Funding– Domestic Resources
• Projected distribution of resources:– 38% HIV care and treatment– 35% for prevention– 22% for orphan support– 5% for policy, advocacy and administration costs

Nation ProfilesNation Profiles
HIV/AIDS pervalance
Rate GDP Per Capita Literacy
RateUnemploymen
t RateGDP Real
Growth RateLife
Expectancy
Uganda 5.40% $
1,100.00 66.80% 3.20% 6.90% 52.72
Zambia 15.20% $
1,500.00 80.60% 50.00% 5.80% 38.63
Ethiopia 2.10% $
800.00 42.70% 50.00% 8.50% 55.41
Kenya 6.70% $
1,600.00 85.10% 40.00% 2.20% 57.86
Nigeria 3.10% $
2,300.00 68.00% 4.90% 6.10% 46.94
South Africa 18.10%
$ 10,000.00 86.40% 21.70% 2.80% 49.98
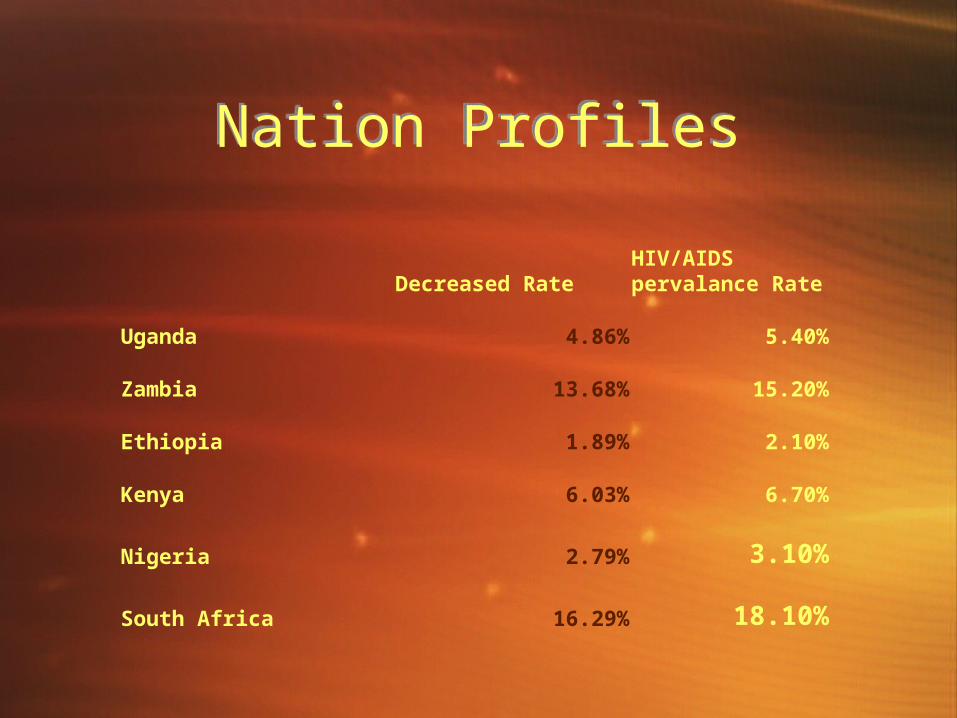
Nation ProfilesNation Profiles
Decreased RateHIV/AIDS pervalance Rate
Uganda 4.86% 5.40%
Zambia 13.68% 15.20%
Ethiopia 1.89% 2.10%
Kenya 6.03% 6.70%
Nigeria 2.79% 3.10%
South Africa 16.29% 18.10%
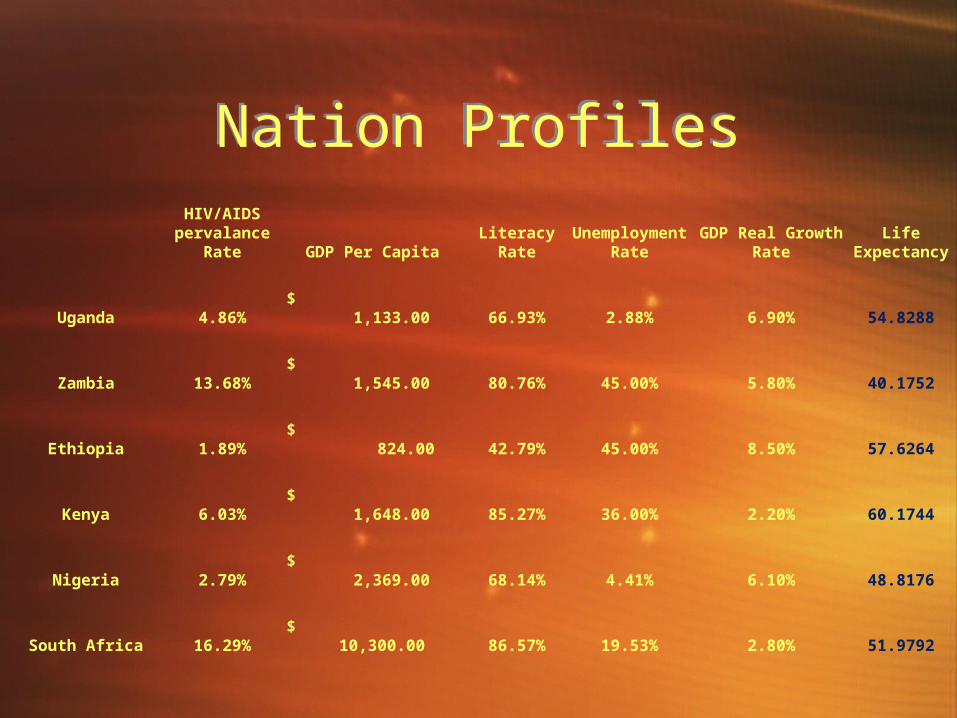
Nation ProfilesNation ProfilesHIV/AIDS
pervalance Rate GDP Per Capita
Literacy Rate
Unemployment Rate
GDP Real Growth Rate
Life Expectancy
Uganda 4.86% $
1,133.00 66.93% 2.88% 6.90% 54.8288
Zambia 13.68% $
1,545.00 80.76% 45.00% 5.80% 40.1752
Ethiopia 1.89% $
824.00 42.79% 45.00% 8.50% 57.6264
Kenya 6.03% $
1,648.00 85.27% 36.00% 2.20% 60.1744
Nigeria 2.79% $
2,369.00 68.14% 4.41% 6.10% 48.8176
South Africa 16.29% $
10,300.00 86.57% 19.53% 2.80% 51.9792
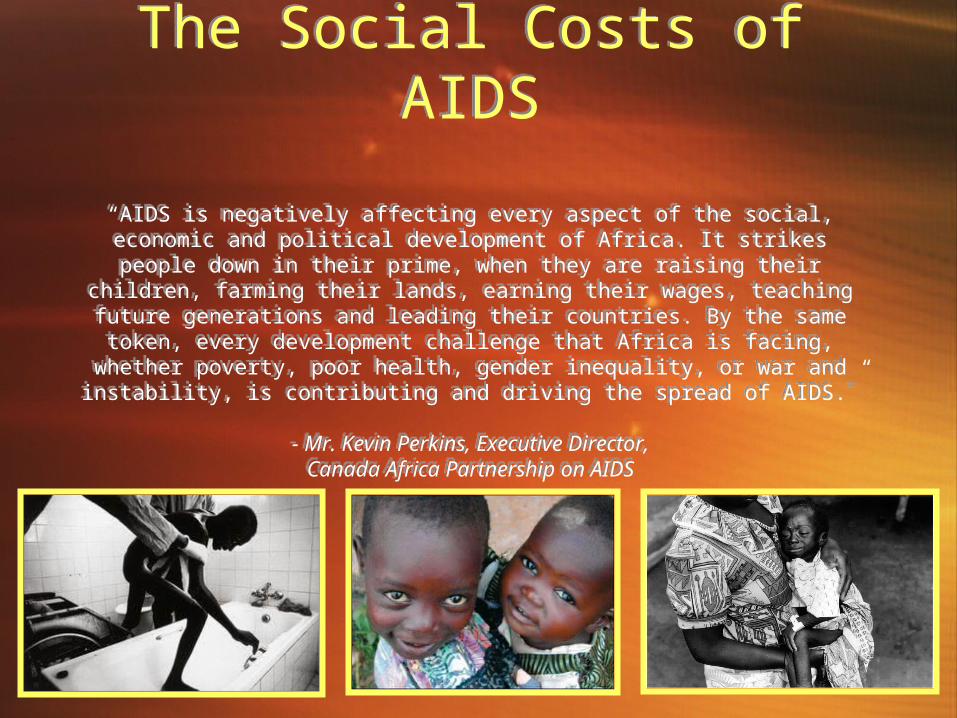
The Social Costs of AIDS
“AIDS is negatively affecting every aspect of the social, economic and political development of Africa. It strikes people down in their prime, when they are raising their children, farming their lands, earning their wages, teaching future generations and leading their countries. By the same token, every development challenge that
Africa is facing, whether poverty, poor health, gender inequality, or war and instability, is contributing and driving the spread of AIDS.”
- Mr. Kevin Perkins, Executive Director,Canada Africa Partnership on AIDS
For Additional Information:For Additional Information:
• CIA World Fact Book• AIDS.ORG• UNICEF.ORG• JournAIDS.ORG• World Health Organization
• CIA World Fact Book• AIDS.ORG• UNICEF.ORG• JournAIDS.ORG• World Health Organization