Embed Size (px)
Citation preview
The Quantity and theQuality of Party SystemsParty System Polarization,Its Measurement, and Its ConsequencesRussell J. DaltonUniversity of California, Irvine
Previous research claims that the number of parties affects the representationof social cleavages in voting behavior, election turnout, patterns of politicalconflict, and other party system effects. This article argues that researchtypically counts the quantity of parties and that often the more importantproperty is the quality of party competition—the polarization of politicalparties within a party system. The author first discusses why polarization isimportant to study. Second, the author provides a new measurement of partysystem polarization based on voter perceptions of party positions in theComparative Study of Electoral Systems, which includes more than 50separate elections from established and developing democracies. Third, theauthor compares party polarization and party fractionalization as influenceson cleavage-based and ideological voting and as predictors of turnout levels.The finding is that party polarization is empirically more important inexplaining these outcomes.
Keywords: party polarization; party fractionalization; turnout; voting
One of the most widely examined properties of party systems is thecounting of the number of parties. A large body of research examines
the merits of a two-party system versus a multiparty system (or a range ofparties) and links the number of parties to the representation of social cleav-ages in voting behavior, turnout in elections, representation, and levels ofpolitical conflict (e.g., Blais & Dobrzynska, 1998; Kim, Powell, & Fording,2006; Norris, 2004; Powell, 1982). Douglas Rae (1971) and others haveexamined how the number of parties influences strategic voting and otheraspects of electoral behavior. At a systemic level, Lijphart (1999) includesthe number of parties as a prime indicator for the development of consoci-ational democracy and links a range of effects to the consociational model.
Comparative Political StudiesVolume 41 Number 7
July 2008 899-920© 2008 Sage Publications
10.1177/0010414008315860http://cps.sagepub.com
hosted athttp://online.sagepub.com
899
at CALIFORNIA DIGITAL LIBRARY on October 15, 2008 http://cps.sagepub.comDownloaded from

The list of studies comparing the correlates of the number of parties isextensive, touching many aspects of party and electoral behavior (Lijphart& Grofman, 1991; Norris, 2004; Taagepera & Shugart, 1989).
The simple premise of this article—but one often overlooked—is thatinstead of counting the quantity of parties, a more important property ofparty systems is often the quality of party competition. Many of the conse-quences attributed to the number of parties are actually linked to the degreeof polarization in a party system. Party system polarization reflects thedegree of ideological differentiation among political parties in a system.Giovanni Sartori (1976) focused attention on this concept when he com-pared the consequences of centripetal and centrifugal party systems. In theformer, parties converge on the center to compete for the median voter; inthe latter, parties are more widely dispersed along the political continuum.In other words, counting the number of parties was less important thanknowing how they were distributed ideologically. Similarly, many ofAnthony Downs’s (1957) theoretical arguments on the consequences ofparty system competition were based on presumptions of how parties weredistributed along an ideological continuum.
In historical terms, analysts claim that one of the factors contributing tothe collapse of democracy in the Weimar Republic was its heavily fraction-alized party system. Similar claims are made about the breakdown ofAustrian democracy in the 1930s, the French Fourth Republic in the 1950s,Chilean democracy in the 1970s, and the fragility of democracy in othernations with a large and diverse party system (Powell, 1982; Sartori, 1976).However, the problem facing Weimar, the French Fourth Republic, andthese other examples was not primarily the number of parties but the vastideological differences that separated parties and made governing problem-atic. The polarization of a party system is a property that can be indepen-dent of the number of parties, and I suspect that many of the effectsattributed to the fractionalization of party system are better understood as aconsequence of party system polarization.
This article focuses on the meaning, measurement, and consequences ofpolarization in contemporary democratic party systems. I begin by dis-cussing the concept of party system polarization in the research literatureand why polarization is important to study. Second, I provide a new mea-surement of party system polarization based on public perceptions of par-ties from the Comparative Study of Electoral Systems (CSES). The CSEShas now conducted surveys in two waves and has polled citizens in morethan 50 elections. Most important, I examine two potential implications ofparty system polarization and demonstrate how polarization has stronger
900 Comparative Political Studies
at CALIFORNIA DIGITAL LIBRARY on October 15, 2008 http://cps.sagepub.comDownloaded from
effects than party fractionalization. Finally, I discuss the implications ofthese findings for contemporary party systems.
The Literature on Party Polarization
The concept of polarization has developed from two distinct approaches.First, Anthony Downs (1957) introduced the concept of the spatial model-ing of party systems, in which political parties (and voters) are alignedalong a Left and Right continuum. This provides a framework for partycompetition. For instance, voters will typically select the party most proxi-mate to their own position on this continuum. Thus, the relative movementof voters and parties along this dimension alters outcomes from election toelection. Similarly, if the nearest party is far from the voter, he or she mightdecide to abstain from voting. Or if two or more parties are equidistant, thisproduces indifference that may also increases the likelihood of nonvotingand makes voting predictions less certain.
This spatial model is a powerful theoretical tool in studying electionsand voter behavior, party competition, and coalition formation (e.g.,Adams, Merrill, & Grofman, 2005; Laver & Hunt, 1992; Laver &Schofield, 1990). Moreover, embedded in Downs’s (1957) analyses was aconcern for the degree of polarization in a party system, although it wasoften expressed in terms of the number of parties. For instance, Downsassumed that two-party systems would converge to the center, whereasmultiparty systems would be spread along the Left and Right dimension.Downs believed that the diversity of parties would also affect the correlatesof voting choice:
Voters in multiparty systems, however, are given a wide range of ideologicalchoice, with parties emphasizing rather than soft-pedaling their doctrinaldifferences. Hence regarding ideologies as a decisive factor in one’s votingdecision is usually more rational in a multiparty system than in a two-partysystem. (p. 127)
The ideological spread of parties also should affect the voters’ proximity toa preferred party and thus the likelihood of turning out to vote.
A second approach is reflected in Giovanni Sartori’s (1976) influentialstudy of political parties (also see Evans, 2002). Sartori began with theDownsian concept of an ideological space structuring party competition.He specifically focused on the degree of polarization within a party system
Dalton / Party System Polarization 901
at CALIFORNIA DIGITAL LIBRARY on October 15, 2008 http://cps.sagepub.comDownloaded from
and argued that there were both centripetal and centrifugal forces that influ-enced parties’ locations along the Left and Right scale. In some systems—most often multiparty systems—these centrifugal forces produced a fleeingfrom the center and a pattern of polarized pluralism (Sartori, 1976, pp. 131-145). High levels of party system polarization can intensify ideologicaldebates, weaken the legitimacy of the regime, and destabilize the politicalsystem. Sartori illustrated his theory with descriptive accounts of highlypolarized systems, such as the German Weimar system and the postwarFrench and Italian systems. He contrasted polarized pluralism with the pat-terns of moderate pluralism or two-party systems, where centripetal forcesproduced a different electoral dynamic and its consequences (Sartori, 1976,pp. 173-192). Subsequent studies have adopted this framework to examinehow the number of parties—if not system polarization—influences the natureof electoral choice, party coalitions, democratic representation, and politicalstability (e.g., Kim et al., 2006; Lijphart, 1999; Norris, 2004; Powell, 1982).
These spatial models thus converge on a common framework for study-ing party systems. Parties can be conceptualized as aligned along a singlepolicy or ideological continuum. Even if this is an oversimplification ofpolitical reality, it provides a good first approximation of the nature of partycompetition (Cox, 1990; Knutsen, 1998). In addition, the distribution ofparties along this continuum is an important characteristic of party systems.Often, researchers have resorted to the shorthand of counting the number ofparties, because it was assumed that the number of parties reflected thedegree of polarization. However, the underlying theoretical logic impliesthat the distribution of parties along the continuum is of equal or of greaterimportance than the simple number of parties. The quantity of parties isthus used as a surrogate for the distribution of parties. However, the degreeof party system polarization should more directly influence both the pat-terns of voter behavior as well as the broad characteristics of the politicalsystem. I examine this framework in this research.
Measuring Party System Characteristics
Scholars have long emphasized the number of parties as an importantcharacteristic of party system. Empirical researchers have adopted two dif-ferent methods to count the number of parties to give weight to the relativesize of parties and not just their absolute numbers. Party fractionalization(the Herfindahl index) is calculated from statistics on the relative size ofparties:
902 Comparative Political Studies
at CALIFORNIA DIGITAL LIBRARY on October 15, 2008 http://cps.sagepub.comDownloaded from
Herfindahl = ∑(party seat share in legislaturei)2,
where i represents individual parties. The Herfindahl index can be inter-preted as the probability that two deputies picked at random from amongthe legislative parties will be of different parties, with higher values indicat-ing a less fractionalized party system. This measure or its variants havebeen widely used in empirical research on party systems (e.g., Klingemann,2005; Rae, 1971; Sigelman & Yough, 1978; Taylor & Herman, 1971).An alternative statistic is the Laakso and Taagepera (1979) measure of theeffective number of parties (also Taagepera & Shugart, 1989). TheLaasko–Taagepera index is simply the inverse of the Herfindahl index,which counts the number of parties weighted by size to discount therelevance of small parties.1 In other words, different studies comparingthe number of parties in a party system use either of these two indices,but these two measures are essentially interchangeable. For instance, inthe elections included in the CSES database, the Herfindahl andLaasko–Taagepera scores are correlated at r = .92 (N = 62). Furthermore,these statistics on the number of parties are readily calculated for eachelection and each legislature from publicly reported data.
Party system polarization is a more difficult concept to measure. Thelogic of party system polarization implies that it should reflect the distri-bution of parties along an ideological dimension. Following the lead ofDowns (1957), I conceptualize parties as aligned along a single ideolog-ical dimension. A few large parties near the center of the continuumwould reflect a centrist party system in which centripetal forces encour-age parties to move toward the center. Conversely, a system with anumber of large parties at the political extremes is a highly polarizedsystem in which centrifugal forces are pressuring parties to move to theextremes.
Until recently, however, it was difficult to compare party systems ontheir degree of polarization, because this required measuring the ideologi-cal position of parties as well as their vote shares. Typically, researchersestimated polarization from indirect indicators, such as the number of par-ties in an electoral system, the size of extremist parties, or the vote sharefor governing parties (Pennings, 1998; Powell, 1982). Sartori (1976)attempted to estimate polarization by categorizing parties as Left, Right,or Center; Sigelman and Yough (1978) used a 4-category grouping of partyfamilies available from a U.S. State Department report; Gross andSigelman (1984) used 10-party family categories (e.g., communist, social-ist, centrist, fascist) coded by the Britannica Yearbook and assigned theminterval values. These methods provide broad approximations of the actual
Dalton / Party System Polarization 903
at CALIFORNIA DIGITAL LIBRARY on October 15, 2008 http://cps.sagepub.comDownloaded from
ideological position of parties but treat all parties of a family as identicaland differences between families as equal interval differences. Anotheroption is the use of party manifestos to estimate parties’ Left and Right posi-tions (Budge, Robertson, & Hearl, 1987; Caul & Gray, 2000; Klingemann,2005). However, the comparative manifesto project focused on the salienceof issues rather than party positions, and thus there is debate about thevalidity of this methodology (Gabel & Huber, 2000; Harmel, Tan, &Janda, 1995; Laver & Garry, 2000).
I therefore turn to another source to directly measure the distribution ofparties: the perceptions of the electorate in the nation. The CSES is a coop-erative international project that asks a common questionnaire in thenational election studies of many contemporary democracies.2 The firstmodule of the CSES included 36 nations, and the current release of the sec-ond module includes 29 nations. Thus, the CSES offers an unparalleledresource to compare partisan images across nations and to track changes inperceptions across two waves of surveys.
Following Downs (1957) and previous researchers, I begin by assumingthat party politics is structured along a Left and Right dimension. The use ofa Left and Right scale does not imply that citizens possess a sophisticatedconceptual framework or theoretical understanding of liberal–conservativephilosophy. I simply expect that positions on this scale summarize theissues and cleavages that structure political competition in a nation. RonaldInglehart (1990), for instance, found that citizens in most nations can locatethemselves on the Left–Right scale and described the scale as representing“whatever major conflicts are present in the political system” (p. 273; alsosee Dalton, 2006; Huber & Inglehart, 1995; Knutsen, 1999). The meaningof this dimension can, and indeed likely does, vary across nations. In keep-ing with Downs’s logic, these labels provide reference points that help cit-izens interpret and evaluate political parties and other political actors andpolicies. Thus, the Left–Right dimension provides a metric for the cross-national comparisons.
The CSES asks respondents to position themselves along a Left–Rightscale using the following question:3
In politics people sometimes talk of Left and Right. Where would you placeyourself on a scale from 0 to 10, where 0 means the Left and 10 means the Right?
After placing themselves on the Left–Right scale, the survey asked respon-dents to position the parties in their nation; up to six parties were included.These citizen placements of the parties provide the basis for measuringpolarization for the party system as a whole.
904 Comparative Political Studies
at CALIFORNIA DIGITAL LIBRARY on October 15, 2008 http://cps.sagepub.comDownloaded from
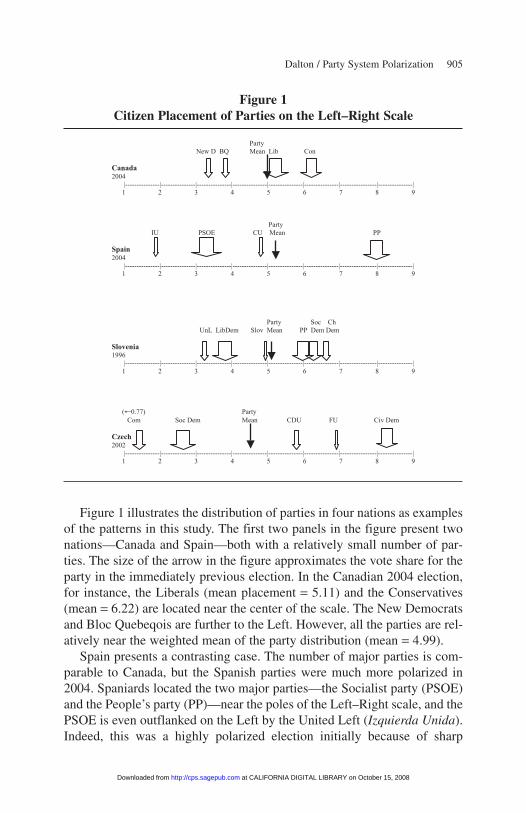
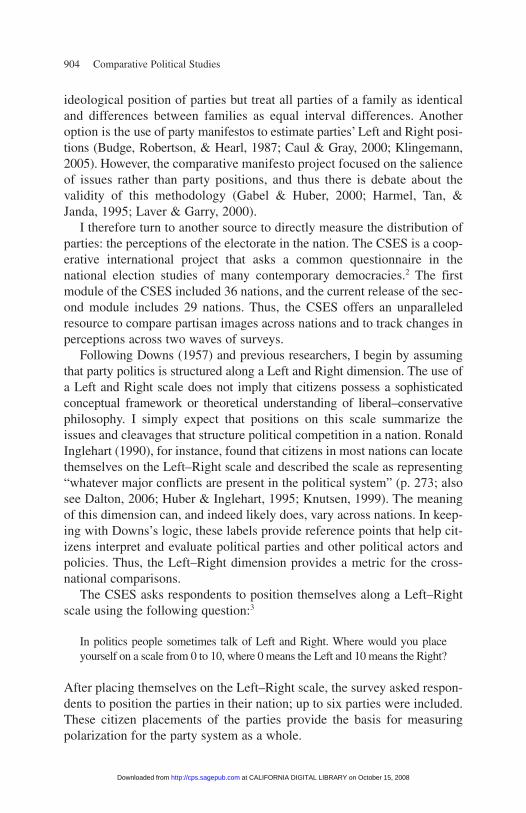
Figure 1 illustrates the distribution of parties in four nations as examplesof the patterns in this study. The first two panels in the figure present twonations—Canada and Spain—both with a relatively small number of par-ties. The size of the arrow in the figure approximates the vote share for theparty in the immediately previous election. In the Canadian 2004 election,for instance, the Liberals (mean placement = 5.11) and the Conservatives(mean = 6.22) are located near the center of the scale. The New Democratsand Bloc Quebeqois are further to the Left. However, all the parties are rel-atively near the weighted mean of the party distribution (mean = 4.99).
Spain presents a contrasting case. The number of major parties is com-parable to Canada, but the Spanish parties were much more polarized in2004. Spaniards located the two major parties—the Socialist party (PSOE)and the People’s party (PP)—near the poles of the Left–Right scale, and thePSOE is even outflanked on the Left by the United Left (Izquierda Unida).Indeed, this was a highly polarized election initially because of sharp
Dalton / Party System Polarization 905
Figure 1Citizen Placement of Parties on the Left–Right Scale
Party New D BQ Mean Lib Con
Canada2004 |---------------|---------------|---------------|---------------|---------------|---------------|----------------|---------------| 1 2 3 4 5 6 7 8 9
Party IU PSOE CU Mean PP
Spain2004 |---------------|---------------|---------------|---------------|---------------|---------------|----------------|---------------| 1 2 3 4 5 6 7 8 9
Party Soc Ch UnL LibDem Slov Mean PP Dem Dem
Slovenia1996 |---------------|---------------|---------------|---------------|---------------|---------------|----------------|---------------| 1 2 3 4 5 6 7 8 9
( 0.77) Party Com Soc Dem Mean CDU FU Civ Dem
Czech2002 |---------------|---------------|---------------|---------------|---------------|---------------|----------------|---------------| 1 2 3 4 5 6 7 8 9
at CALIFORNIA DIGITAL LIBRARY on October 15, 2008 http://cps.sagepub.comDownloaded from
disagreements between the PSOE and PP over economic policy and the warin Iraq, then punctuated by the Madrid terrorist bombing on the eve of theelection. In short, even though the numbers of parties is roughly equivalentin these two party systems, polarization varies substantially.
The last two nations in Figure 1 show a similar pattern for two newdemocracies in Eastern Europe, both with a larger number of political par-ties. In the Slovenian election of 1996, the public positioned all the majorparties within a modest range along the Left–Right scale. In contrast, theCzech party system in 2002 had approximately the same effective numberof parties, but the parties were much more widely dispersed along theLeft–Right scale. The Communists were positioned at 0.77, and the CivicDemocrats at 8.24. These parties represent more than 40% of the electorate,yet they are positioned near the ideological extremes. The other Czech par-ties are also widely dispersed between these two poles.
Figure 1 illustrates two points. First, the measurement of polarizationcan be relatively independent of the number of parties because even partysystems with relatively similar numbers of parties vary widely in theLeft–Right distribution of these parties. Second, my conceptual measure ofparty polarization should include two elements: (a) the relatively positionof each party along the Left–Right scale and (b) the party’s positionweighted by party size (because a large party at the extreme would signifygreater polarization than a splinter party in the same position).
I developed an index to measure the distribution of parties along theLeft–Right scale.4 The Polarization index is measured as the following:
PI = SQRT{∑(party vote sharei)*([party L/R scorei – party systemaverage L/R score]/5)2},
where i represents individual parties. This index is comparable to a mea-sure of the standard deviation of a distribution and is similar to the statis-tics used by other scholars.5 It has a value of 0 when all parties occupy thesame position on the Left–Right scale and 10 when all the parties are splitbetween the two extremes of the scale. This statistic calculates what isapparent from the party locations in Figure 1. For instance, the Canadianparty system in 2004 has a Polarization index of 2.06, whereas the Spanishsystem has an index of 4.33. Similarly, the Slovenia party system has anindex of 2.15, whereas the Czech polarization score is more than twice aslarge at 5.43.
Table 1 presents the Polarization index for all the democracies in the twomodules of the CSES. There is considerable variability in the polarization
906 Comparative Political Studies
at CALIFORNIA DIGITAL LIBRARY on October 15, 2008 http://cps.sagepub.comDownloaded from

of contemporary party systems. In a few instances, polarization dropsbelow 1.0. For instance, in the 2000 South Korean election, the democraticreformer Kim Dae Jung switched parties to run with the conservativeMillennium Democratic Party to win the election; this dramatically reduced
Dalton / Party System Polarization 907
Table 1Party Polarization Index by Nation
Nation Time 1 Time 2 Change
Australia 2.04 1.96 –.08Belgium 2.46 —Brazil — 2.00Bulgaria — 4.37Canada 1.83 2.06 .23Czech Republic 5.44 5.43 –.01Denmark 3.84 3.57 .27Finland — 2.85France — 3.29Germany 2.51 2.70 .29Hungary 3.40 5.85 2.45Iceland 4.49 4.08 –.41Ireland — 2.20Israel 3.99 3.87 –.12Japan 3.30 3.30 .00Korea (S.) 0.70 3.55 2.85Lithuania 3.41 —Mexico 1.29 2.10 .81Netherlands 2.89 3.64 .75New Zealand 3.81 3.35 –.46Norway 3.42 3.75 .27Peru 0.84 —Philippines 1.33 0.46 –.87Poland 5.18 4.92 –.26Portugal 3.62 3.44 –.12Romania 2.13 —Russia 4.01 —Slovenia 2.15 —Spain 4.02 4.33 .29Sweden 5.19 4.07 –1.08Switzerland 3.19 4.01 .82Taiwan 1.18 1.14 –.04United Kingdom 2.82 2.37 –.45United States — 2.43Total N 29 28
Source: Comparative Study of Electoral Systems; available from www.cses.org.
at CALIFORNIA DIGITAL LIBRARY on October 15, 2008 http://cps.sagepub.comDownloaded from
party polarization in this election (which rebounded in the 2004 election).In the case of the Philippines and Peru, the low Polarization index impliesthat these party systems are not offering significantly different choices interms of the public’s perceptions. At the other extreme, polarization is sub-stantially higher in a range of other party systems (e.g., Sweden and Icelandamong established democracies and Poland and the Czech Republic amongnew democracies). These are nations where the public sees party choicesthat nearly span the entire Left–Right continuum. In addition, althoughthere is variability over time, most party systems have fairly stable levels ofparty polarization, with most ranging within +/–.25 between the two mod-ules of the CSES.
In broad terms, it seems logical to assume that party systems with alarge number of parties also tend to be more polarized. However, corre-lating polarization with the Herfindahl index of party fractionalizationshows that these two party systems characteristics are unrelated (r =.067, N = 33).6 The examples of Figure 1 are thus typical in showing howpolarization can vary nearly independent of the number of parties.Reaffirming this pattern, Gross and Sigelman (1984) similarly found thatparty system fractionalization and polarization were essentially orthogo-nal characteristics of the 46 party systems they compared in the late1970s.
The structure of the electoral system, measured by the district magnitude,has a stronger relationship with polarization (r = .338).7 However, it is alsoapparent from Table 1 that party system polarization can vary considerablybetween the two CSES modules even when the electoral system is constant.We also might assume that fractionalization is greater in new party systemswhere party alignments are still forming and parties are less institutionalized.In fact, polarization is slightly greater in an established party system (r = .087), although this is also an insignificant correlation.
In addition, Downs’s analyses presume that the polarization of a partysystem reflects the dispersion of citizens along the ideological dimension:In systems with voters compacted together, the parties will converge towardthe median, whereas in systems with voters dispersed along the continuum,the parties will spread out to reflect this distribution. In fact, this is notempirically correct. The dispersion of citizens along the Left–Right scale(measured by the standard deviation of Left–Right self-placement) isalmost unrelated to the party system Polarization index (r = .144, N = 28;CSES Module I). This is partially because most publics follow a single-peaked distribution with only modest differences in their standard deviationand because party polarization seems to vary independently of these patterns.8
908 Comparative Political Studies
at CALIFORNIA DIGITAL LIBRARY on October 15, 2008 http://cps.sagepub.comDownloaded from

Rather than such institutional structures or societal characteristics, partypolarization often reflects the internal dynamics of electoral competition ina nation. Parties and their leaders make strategic or ideological choiceswhen they begin a campaign, and other parties respond to these choices. Ifone thinks of the ebbs and flows of party positions across campaigns in anation (e.g., the Nixon–McGovern campaign of 1972 versus Bush–Clintonin 1992), this illustrates how parties’ campaign choices vary the level ofpolarization. The polarization statistic is capturing this process and displayingthe nature of party competition in each system, which is also my objective.
Certainly there are limitations to these measures of polarization, as thereare to measures from other data sources. I am assuming that voters canmeaningfully place political parties along a Left–Right continuum. Somemight question whether a single dimension is sufficient; but this oftenyields a good approximation of the basic cleavages in a society (e.g.,Inglehart, 1990; Knutsen, 1999). In addition, research often questions thesophistication of mass publics. However, cumulating estimates over all vot-ers should generate a reliable measure of party positions. Moreover, even ifone argues that the placement of a party is incorrect, this is still the place-ment that the public perceives and this is what should influence their behav-ior. To the electorate, their perceptions are reality. Thus, there is a stronginternal logic to using citizen estimates of party positions to predict citizenpolitical behavior.
The Correlates of Polarization
A considerable body of research maintains that the degree of polariza-tion in a party system—often measured by fractionalization—has importantconsequences. A highly polarized system presumably produces clearerparty choices, stimulates participation, affects representation, and has moreintense partisan competition. Thus, the ideological gap between winnersand losers is greater and the policy implications of government control aremore substantial. Conversely, a centrist party system should reflect greaterconsensus within the electoral process—at least in Left–Right terms—andless interparty conflict and less political responsiveness.
To illustrate the value of measuring party system polarization, I examinetwo areas of party system differences that are widely discussed in the liter-ature. First, I analyze how polarization and fractionalization might berelated to the strength of voter–party relationships. Second, I examine howthese two party system characteristics affect turnout in elections.
Dalton / Party System Polarization 909
at CALIFORNIA DIGITAL LIBRARY on October 15, 2008 http://cps.sagepub.comDownloaded from

The Polarization of Voter Preferences
One hypothesized effect of party polarization is on the correlates of partypreferences. If parties offer limited choices to voters, then it is not likely thatthe voter blocs will differ sharply across parties. Downs expressed this ideain terms of the number of parties, although his logic is clearly based on partypolarization: “Voters in multiparty systems are more likely to be swayed bydoctrinal considerations—matters of ideology and policy—than are votersin two party systems” (1957). Bing Powell (1982) discussed this hypothesisin terms of class voting. He maintained that when parties offer distinct ide-ological choices, then it is more likely that social class groups could identifyand support a party that was more representative of their positions. Whentweedledum is running against tweedledee, then there is little to choosebetween them. Pippa Norris (2004) similarly found that the overall level ofsocial cleavage voting was higher in proportional representation systemsthan in majoritarian systems with fewer parties.
However, the focus on class voting is merely a shorthand for a broaderhypothesis: Diverse party choice should generally strengthen the polariza-tion of voters. If parties are distinctive in their issue positions, then issuescan have greater weight, all else being equal (such as when the issues areof equal relevance across nations). I might debate the causal direction ofthis relationship, but the present analyses simply focus on the strength ofthis relationship.
I can test this hypothesis in two ways with the CSES surveys. First, I cal-culated the relationship between social class and party support acrossnations. I expect that class issues are generally relevant in contemporaryelectoral systems and that the level of class voting will be stronger in morepolarized systems. However, I also know that the institutional history of aparty system and the nature of class–interest group alignments affect thelevel of class voting (Lipset & Rokkan, 1967). Therefore, as a second step,I generalize this test to examine variations in the correlation of Left–Rightself-placement with party choice. Most voters in most party systems canlocate themselves along the Left–Right scale. As noted earlier, I do not pre-sume that they have a deep understanding of the Left–Right scale in liberaland conservative ideological terms. Rather, Left–Right positions summa-rize positions on the political issues of relevance in a nation (Fuchs &Klingemann, 1989; Inglehart, 1990; Knutsen, 1999). In some nations, thismay tap class conflicts; in other nations, cultural or social issues are moreimportant. Thus, Left–Right position acts a summary of the issues most rel-evant to the respective public in each nation.
910 Comparative Political Studies
at CALIFORNIA DIGITAL LIBRARY on October 15, 2008 http://cps.sagepub.comDownloaded from
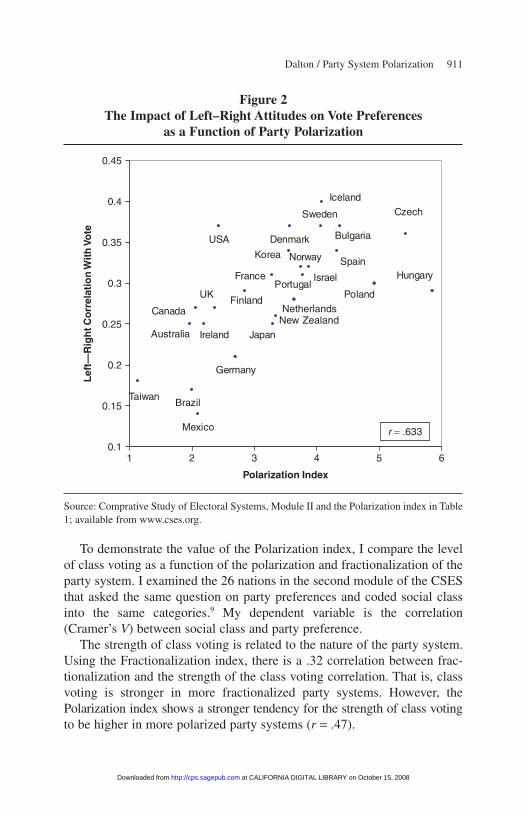
To demonstrate the value of the Polarization index, I compare the levelof class voting as a function of the polarization and fractionalization of theparty system. I examined the 26 nations in the second module of the CSESthat asked the same question on party preferences and coded social classinto the same categories.9 My dependent variable is the correlation(Cramer’s V) between social class and party preference.
The strength of class voting is related to the nature of the party system.Using the Fractionalization index, there is a .32 correlation between frac-tionalization and the strength of the class voting correlation. That is, classvoting is stronger in more fractionalized party systems. However, thePolarization index shows a stronger tendency for the strength of class votingto be higher in more polarized party systems (r = .47).
Dalton / Party System Polarization 911
Figure 2The Impact of Left–Right Attitudes on Vote Preferences
as a Function of Party Polarization
USA
UK
Taiwan
Sweden
Spain
Portugal Poland
Norway
New ZealandNetherlands
Mexico
Korea
Japan
Israel
Ireland
Iceland
Hungary
Germany
France
Finland
Denmark
Czech
Canada
Bulgaria
Brazil
Australia
0.1
0.15
0.2
0.25
0.3
0.35
0.4
0.45
1 4
Polarization Index
r = .633
Lef
t—R
igh
t Co
rrel
atio
n W
ith
Vo
te
32 65
Source: Comprative Study of Electoral Systems, Module II and the Polarization index in Table1; available from www.cses.org.
at CALIFORNIA DIGITAL LIBRARY on October 15, 2008 http://cps.sagepub.comDownloaded from

An even more robust test is the correlation of Left–Right self-placementwith party preference, because this is a more encompassing measure thanthe single cleavage of class voting. I believe the Left–Right position is morecomparable across nations in examining party system effects because classvoting may reflect the structure of interest groups or the composition of thelabor force. Figure 2 presents the relationship between Left–Right attitudesand party preferences as a function of party system polarization. There is animpressively strong (r = .63) relationship between the party polarizationand the correlation between Left–Right attitudes and party choice. Forinstance, returning to the examples from Figure 1, Canada in 2004 has alow level of party polarization on the x-axis (2.06) and the correlationbetween Left–Right attitudes and vote is only .27 on the y-axis; polarizationis higher is Spain and the correlation is stronger (r = .34); and even higherpolarization in the Czech Republic yields an even stronger correlation (r = .36).
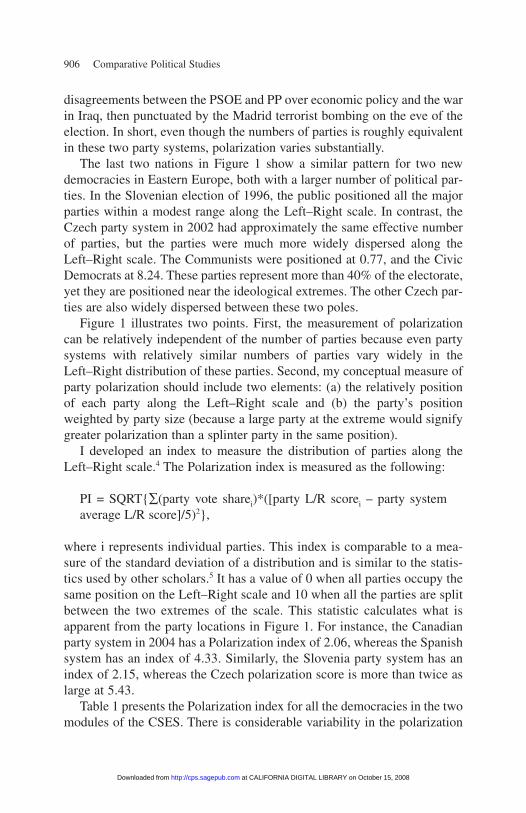
The results of Figure 2 may seem unsurprising and inevitable: Withmore electoral choice, voters can more clearly translate their Left–Rightorientations into a party preference. Indeed, this is the theoretical logic I amtesting. But the important factor is not the number of party choices, whichis what previous research has primarily tested, but the ideological diversityof choice as measured by the Polarization index. I can demonstrate thispoint by repeating the analysis using the Fractionalization index instead ofpolarization. Figure 3 shows that party system fractionalization is unrelatedto the strength of the Left–Right relationship (r = –.020).10 As I demonstratedabove, party systems can vary in the number of parties almost indepen-dently of the polarization among the parties. Thus, the correlation betweenLeft–Right attitudes and party preferences can be stronger in a system withfewer parties but more polarization (e.g., Spain, r = .34) than in a systemwith many parties but less polarization (e.g., Finland, r = .29)
A unique aspect of the CSES study is that I can replicate these analyseswith the nations from the Module I data set. I again find that the impact ofLeft–Right attitudes on party preferences is strongly conditioned by thelevel of polarization in the party system (r = .69, N = 27).11 At the sametime, party system fractionalization has little relationship to the strength ofthe Left–Right relationship with party preference (r = .16).
The Party System and Voting Turnout
Another commonly cited consequence of the fractionalization and polar-ization of party systems is turnout in elections. The logic is quite clear. Withfew choices, voters have limited opportunities to find a party that represents
912 Comparative Political Studies
at CALIFORNIA DIGITAL LIBRARY on October 15, 2008 http://cps.sagepub.comDownloaded from

their views and thus may choose to abstain from voting. However, as thenumber of choices increases, voters should more easily find a party theyagree with, which justifies the effort to cast a ballot. Thus, a host of cross-national empirical studies have demonstrated that party system fractional-ization, along with other institutional characteristics, is related to aggregatelevels of election turnout (Blais & Dobrzynska, 1998; Jackman & Miller,1995; Norris, 2004; Powell, 1982).
This pattern reflects Downs’s (1957) logic that abstention increaseswhen the distance between a voter and the nearest party on the politicalcontinuum also increases. However, if the underlying process is based onideological distances, then the number of parties may be a poor measure of
Dalton / Party System Polarization 913
Figure 3The Impact of Left–Right Attitudes on Vote Preferences
as a Function of Party Fractionalization
USA
UK
Taiwan
Sweden
Spain Portugal
Poland
Norway
New ZealandNetherlands
Mexico
Korea
Japan
Israel
Ireland
Iceland
Hungary
Germany
France
Finland
Denmark
Czech
Canada
Bulgaria
Brazil
Australia
0.1
0.15
0.2
0.25
0.3
0.35
0.4
0.45
0.5 0.6 0.7 0.8 0.9 1
Fragmentation Index
Lef
t—R
igh
t C
orr
elat
ion
Wit
h V
ote
r = −.020
Source: Comparative Study of Electoral Systems, Module II and Fragmentation index;available from www.cses.org.
at CALIFORNIA DIGITAL LIBRARY on October 15, 2008 http://cps.sagepub.comDownloaded from
proximity. As seen above, there are multiparty systems with parties com-pacted together and thus offering limited choices, whereas systems withfewer parties have these parties dispersed along the Left–Right scale. Inother words, even when studies examine the number of parties, the disper-sion of parties along the Left–Right scale should be a more accurate mea-sure of the hypothesized causal process.
Although the logic of party system polarization effects seems straight-forward, the estimation of effects is complicated by the other institutionaland contextual factors that influence aggregate turnout levels. For instance,Pippa Norris’s (2004) recent analysis of aggregate turnout used seven dif-ferent institutional variables. In addition, prior research identifies other pre-dictors that one might include in a comprehensive model (e.g., registrationrequirements or when elections are held).
It is not possible with the small number of nations in the CSES to havesuch an extensive model, and so I focus on a subset of key predictors. First,to have a comparable measure of turnout, I measure turnout percentages as afunction of the total voting age public that partially adjusts for the differencesin voter registration requirements across nations.12 Then I entered several pre-dictors into three regression models. I started with the two measures of partysystem characteristics: polarization in Model I, fractionalization in Model II,and then both characteristics in Model III. The models also include two otherinstitutional factors: the existence of compulsory voting requirements andwhether the turnout was for a sole parliamentary election or for an executiveor executive–parliamentary election. These two variables were among thestrongest institutional predictors in Norris’s (2004) models.13
Table 2 presents these three regression models. In the first model, thepolarization of a party system has a distinct positive impact on turnout (β =.289). These effects are comparable to those of a compulsory voting sys-tem, which has a slightly stronger effect (β = .384). By comparison, the sec-ond model exchanges party system fractionalization for polarization. Usingthe standardized coefficients as a guide, fractionalization has approxi-mately half the impact of the polarization variable. A third model includesboth party system measures. Again, party polarization emerges as substan-tially stronger than party fractionalization; the results are largely the sameas Model I, and the explained variance is quite similar. Only the coefficientsfor compulsory voter in Models I and III are statistically significant at the.05 level for a one-tailed test, largely because of the small number ofnations I am analyzing. However, party system polarization approaches sig-nificance even with this small N, and the Fractionalization index is far from
914 Comparative Political Studies
at CALIFORNIA DIGITAL LIBRARY on October 15, 2008 http://cps.sagepub.comDownloaded from

being significant. These results reinforce the point that polarization is thekey variable, not the quantity of parties.
In summary, the nature of the choices available to voters is stronglyrelated to the level of turnout in elections. However, the number of parties,although easily measured, is less important than the diversity of choicesthat the parties offer.
Polarization and Democratic Politics
The point of this article was not to criticize the concept of party systemfractionalization. Counting the number of parties has proven to be one ofthe more powerful theoretical and empirical concepts in explaining impor-tant aspects of party competition and even the workings of the democraticprocess (e.g., Klingemann, 2005; Lijphart, 1999; Powell, 1982, 2000;Taagepera & Shugart, 1989).
However, I maintain that counting the number of parties is often a sur-rogate for a richer characteristic of a party system that is more difficult tomeasure—party system polarization. Polarization measures how parties aredispersed along an ideological continuum, indicating the range of ideolog-ical choices that parties represent and not just the discrete number of par-ties. Embedded in formal theories and empirical analyses of party system is
Dalton / Party System Polarization 915
Table 2The Predictors of Voting Turnout (N == 29)
Model I Model II Model III
Predictors b SE β b SE β b SE β
Polarization 2.89 2.09 .289 — — — 2.61 2.31 .264Fractionalization — — — 16.76 22.14 .149 6.38 23.86 .057Compulsory voting 15.85 8.12 .384 10.82 7.97 .262 15.06 8.77 .365Simultaneous 3.20 5.45 .118 1.12 5.25 .041 3.26 5.56 .120
executive electionConstant 59.96 7.79 — 56.98 15.92 — 55.27 15.91 —R2 .385 .325 .389
Note: Table entries for each model are unstandardized coefficients and standardized coefficientsfrom ordinary least squares regression analyses.Source: Comparative Study of Electoral Systems, Module I; available from www.cses.org.
at CALIFORNIA DIGITAL LIBRARY on October 15, 2008 http://cps.sagepub.comDownloaded from
the belief that this ideological dispersion does matter, and this researchfocused on testing this belief.
An initial finding is that these two party system characteristics—polarization and fractionalization—can vary almost independently of oneanother (also see Gross & Sigelman, 1984). I used public perceptions of partypositions to measure party system polarization and then to demonstrate itsindependence from fractionalization. Thus, this research shows that simplycounting the number of parties may be easier and readily available for mostparty systems, but in many cases it will miss the property of party systemsthat is of prime interest.
Second, I found clear empirical differences in the correlates of polariza-tion and fractionalization. The polarization of a party system is related tostronger correlations between class and the Left–Right relationship withparty preferences. To the extent that political parties are supposed to be chan-nels of expression that allow citizens to vote their preferences (Sartori, 1976),then party system polarization substantially strengthens this process—butparty fractionalization has little impact on these relationships. Similarly,voting turnout appears more strongly related to party system polarizationthan fractionalization. Moreover, because of the expansion in the number ofdemocracies, these effects appear for a broader range of democracies thanhas typically been found in earlier studies on party systems. In addition, thetwo modules of the CSES have already provided replications of several ofmy findings.
This does not mean that counting the number of parties is irrelevant. Insome cases, the number of parties may be of prime interest, such as theincrease in coalition negotiation costs as the number of parties increases. Inother instances, the number of parties may be the only surrogate for party-system diversity. However, when party system effects are contingent onprocesses linked to the ideological distance between voters and parties,such as the two examples presented here, then we should strive to addpolarization measures to the analyses of party and political behavior.
Indeed, the evidence of polarization effects described here suggests thatfurther attention to past studies of party system fractionalization is war-ranted. Arend Lijphart (1999), for example, emphasized the number of par-ties as an element of consociational democracy, largely derived from hisinitial research on the Netherlands. However, the relationship between par-ties may be more important than the number of parties; thus, polarization inthe Dutch 1998 election with many parties was barely higher than theBritish 1997 election with its two-and-a-half party system. Similarly, thestability of political systems should be more a function of the polarization
916 Comparative Political Studies
at CALIFORNIA DIGITAL LIBRARY on October 15, 2008 http://cps.sagepub.comDownloaded from

of parties than the fractionalization of the party system (Powell, 1982). Inthe end, quality should count more than quantity.
Notes
1. The effective number of parties is calculated as follows:
1Effective Number of Parties = ________________________________ .
∑(party seat share in legislaturei)2
This means that the relationship between the Herfindahl and Laasko–Taapera measures isformally nonlinear, but in practice, a linear correlation shows a very strong relationship.
2. The data used in this study were downloaded from the Comparative Study of ElectoralSystems (CSES) Web site (www.cses.org). The Web site also includes documentation on thesurvey. I did not use the Belarus or Hong Kong surveys because these are not based on demo-cratic elections, and a few nations did not include the Left–Right battery. I added the 1998Philippines CSES survey that was provided by the Social Weather Station. All the analyses andinterpretations of these data are my own.
3. The Japanese survey used a Progressive–Conservatives scale as an equivalent toLeft–Right. The Left–Right question is widely used in electoral research in other democraticparty systems (Dalton, 2006; Fuchs & Klingemann, 1989; Inglehart, 1990; Inglehart &Klingemann, 1976).
4. I thank Rein Taagepera and Aiji Tanaka for their advice in developing this index. In somenations, the survey did not ask for the position of some significant parties and therefore they werenot included in the calculation of polarization. I had less than 80% of the election vote share inBrazil, Israel, Lithuania, and Peru, so these nations might be interpreted with caution.
5. Caul and Gray (2000), Pennings (1998), and Sigelman and Yough (1978) use a formulafor the variance of the distribution, without taking the square root of differences to moderatethe impact of extreme scores that are squared in the numerator. To avoid the exaggeration ofsquared differences in another way, Gross and Sigelman (1984) calculate the absolute valueof the difference, and Klingemann (2005) calculates the absolute differences between pairs ofparties in his set.
6. To be consistent with other analyses of party fractionalization, I create a fractionalizationmeasure that is 1 – Herfindahl index. This simply transposes the Herfindahl index so that highervalues equal greater fractionalization. The Herfindahl index of legislative fractionalization isfrom the World Bank Political Institutions database, Database of Political Institutions 2004(http://econ.worldbank.org). The Herfindahl index is available by year from the World Bankdatabase for every nation so that I can easily match results to the CSES surveys.
7. District magnitude is drawn from the World Bank Political Institutions database; seeNote 6.
8. For instance, using the examples of Figure 1, the standard deviations for the public inCanada (1.90 in 2004) and Spain (2.10 in 2004) are quite similar, but the party Polarizationindex values are much more distinct. Similarly, the standard deviations for Slovenia (2.14 in1996) and the Czech Republic (2.54 in 2002) are more similar than the Polarization indexscores for these two nations.
9. I used the question on which party best represents the respondent’s opinions as thedependent variable (B3024), because this included the largest number of respondents in most
Dalton / Party System Polarization 917
at CALIFORNIA DIGITAL LIBRARY on October 15, 2008 http://cps.sagepub.comDownloaded from
nations and was most comparable across different elections for presidents or the lower orupper house of Parliament. The class variable is B2012 in the CSES dataset (April 2006release). I excluded the Philippines from these analyses because only a very small proportionof the respondents were willing to express their partisanship on any question.
10. To illustrate how fractionalization and effective number of parties yield equivalentresults because of their high intercorrelation, I related both to the level of class voting andLeft–Right voting using the CSES Module II. Fractionalization has a .32 and –.02 correlationwith both variables as described in the text. The effective number of parties yields .25 and .00correlations for these same two relationships.
11. Module I does not have the same question on the preferred party. Therefore, I use partychoice in the legislative election or the presidential election if there was not a legislative elec-tion (A2029, A2030).
12. Similar to Norris (2004), I measure turnout based on the voting age population anddraw these data from the International Institute for Democracy and Electoral Assistance(http://www.idea.int/vt/survey/index.cfm). However, the voting age population statistics arenot available for the most recent elections, so I limited the analyses to the Module I nationswhere the data are available.
13. The other aggregate predictors were human development, district size, the frequencyof national elections, and three measures of party system fractionalization (electoral system,party competition, and effective number of parliamentary parties). See Norris (2004, pp. 158-159). I would like to include additional variables, but the results of Table 2 suggest that thereare relatively few cases for the number of predictors.
References
Adams, J., Merrill, S., & Grofman, B. (2005). A unified theory of party competition: A cross-national analysis integrating spatial and behavioral. New York: Cambridge University Press.
Blais, A., & Dobrzynska, A. (1998). Turnout in electoral democracies. European Journal ofPolitical Research, 33, 239-261.
Budge, I., Robertson, D., & Hearl, D. (Eds.). (1987). Ideology, strategy and party change: Spatialanalysis of postwar election programmes in 19 democracies. Cambridge, UK: CambridgeUniversity Press.
Caul, M., & Gray, M. (2000). From platform declarations to policy outcomes. In R. Dalton &M. Wattenberg (Eds.), Parties without partisans (pp. 208-237). Oxford, UK: OxfordUniversity Press.
Cox, G. (1990). Centripetal and centrifugal incentives in electoral systems. American Journalof Political Science, 34, 903-935.
Dalton, R. J. (2006). Social modernization and the end of ideology debate: Patterns of ideo-logical polarization. Japanese Journal of Political Science, 7, 1-22.
Downs, A. (1957). An economic theory of democracy. New York: Harper.Evans, J. (2002). In defence of Sartori: Party system change, voter preference distributions and
other competitive incentives. Party Politics, 8, 155-174.Fuchs, D., & Klingemann, H. (1989). The Left–Right schema. In M. K. Jennings & J. van Deth
(Eds.), Continuities in political action (pp. 203-234). Berlin, Germany: de Gruyter.Gabel, M., & Huber, J. (2000). Putting parties in their place: Inferring party Left–Right
ideological positions from party manifestos data. American Journal of Political Science,44, 94-103.
918 Comparative Political Studies
at CALIFORNIA DIGITAL LIBRARY on October 15, 2008 http://cps.sagepub.comDownloaded from
Gross, D. A., & Sigelman, L. (1984). Comparing party systems: A multidimensional approach.Comparative Politics, 16(4), 463-479.
Harmel, R., Tan, A., & Janda, K. (1995, September). Substance vs. packaging: An empiricalanalysis of parties’ issue identity. Paper presented at the annual meeting of the AmericanPolitical Science Association, Chicago.
Huber, J., & Inglehart, R. (1995). Expert interpretations of party space and party locations in42 societies. Party Politics, 1, 73-111.
Inglehart, R. (1990). Culture shift in advanced industrial society. Princeton, NJ: PrincetonUniversity Press.
Inglehart, R., & Klingemann, H. (1976). Party identification, ideological preference and theLeft-Right dimension among Western mass publics. In I. Budge, D. Crewe, & J. Farlie(Eds.), Party identification and beyond (pp. 243-273). London: Wiley.
Jackman, R., & Miller, R. (1995). Voter turnout in industrial democracies during the 1980s.Comparative Political Studies, 27, 467-492.
Kim, H., Powell, G. B., & Fording, R. (2006, April). Party systems and substantive represen-tation: Static and dynamic performance. Paper presented at the annual meetings of theMidwest Political Science Association Meeting, Chicago.
Klingemann, H. (2005). Political parties and party systems. In J. Thomassen (Ed.), TheEuropean voter: A comparative study of modern democracies (pp. 22-63). Oxford, UK:Oxford University Press.
Knutsen, O. (1998). Expert judgments of the Left–Right location of political parties: A com-parative longitudinal study. West European Politics, 21(2), 63-94.
Knutsen, O. (1999). Left–Right party polarization among the mass publics. In H. Narud &T. Aalberg (Eds.), Challenges to representative democracy (pp. 229-277). Bergen,Sweden: Fagbokforlaget.
Laakso, M., & Taagepera, R. (1979). Effective number of parties: A measure with applicationto West Europe. Comparative Political Studies, 12, 3-27.
Laver, M., & Garry, J. (2000). Estimating policy positions from political texts. AmericanJournal of Political Science, 44(3), 619-634.
Laver, M., & Hunt, W. B. (1992). Policy and party competition. New York: Routledge.Laver, M., & Schofield, N. (1990). Multiparty government: The politics of coalition in Europe.
Oxford, UK: Oxford University Press.Lijphart, A. (1999). Democracies. New Haven, CT: Yale University Press.Lijphart, A., & Grofman, B. (Eds.). (1991). Electoral laws and their political consequences.
New York: Agathon.Lipset, S. M., & Rokkan, S. (Eds.). (1967). Party systems and voter alignments. New York:
Free Press.Norris, P. (2004). Electoral engineering: Voting rules and political behavior. New York:
Cambridge University Press.Pennings, Paul. (1998). The triad of party system change: Votes, office and policy. In P. Pennings
& J. Lane (Eds.), Comparing party system change (pp. 79-100). London: Routledge.Powell, G. B. (1982). Contemporary democracies: Participation, stability and violence.
Cambridge, MA: Harvard University Press.Powell, G. B. (2000). Elections as instruments of democracy: Majoritarian and proportional
visions. New Haven, CT: Yale University Press.Rae, D. (1971). The political consequences of electoral laws (2nd ed.). New Haven, CT: Yale
University Press.
Dalton / Party System Polarization 919
at CALIFORNIA DIGITAL LIBRARY on October 15, 2008 http://cps.sagepub.comDownloaded from
Sartori, G. (1976). Parties and party systems. New York: Cambridge University Press.Sigelman, L., & Yough, S. N. (1978) Left–Right polarization in national party systems:
A cross-national analysis. Comparative Political Studies, 11(3), 355-379.Taagepera, R., & Shugart, M. (1989). Seats and votes. New Haven, CT: Yale University Press.Taylor, M., & Herman, V. M. (1971). Party systems and government stability. American
Political Science Review, 65, 28-37.
Russell J. Dalton is a professor of political science at the University of California, Irvine, andwas the founding director of the Center for the Study of Democracy. He has been a FulbrightResearch fellow at the University of Mannheim, a German Marshall Research fellow, and aPOSCO fellow at the East/West Center. His scholarly interests include comparative politicalbehavior, political parties, social movements, and democratic development.
920 Comparative Political Studies
at CALIFORNIA DIGITAL LIBRARY on October 15, 2008 http://cps.sagepub.comDownloaded from