Embed Size (px)
Citation preview

Comparative Mapping of Growth Habit, Plant Height, and Flowering QTLs in TwoInterspecific Families of Leymus
Steven R. Larson,* Xiaolei Wu, Thomas A. Jones, Kevin B. Jensen, N. Jerry Chatterton, Blair L. Waldron,Joseph G. Robins, B. Shaun Bushman, and Antonio J. Palazzo
ABSTRACTLeymus cinereus (Scribn. & Merr.) A. Love and L. triticoides
(Buckley) Pilg. are tall caespitose and short rhizomatous perennialTriticeae grasses, respectively. Circumference of rhizome spreading,proportion of bolting culms, anthesis date, and plant height were eval-uated in two mapping families derived from two interspecific hybrids ofL. cinereus Acc:636 and L. triticoides Acc:641 accessions, backcrossedto one L. triticoides tester. Two circumference, two bolting, and twoheight QTLs were homologous between families. Two circumference,seven bolting, all five anthesis date, and five height QTLs were familyspecific. Thus, substantial QTL variation was apparent within and be-tween natural source populations of these species. Two of the fourcircumference QTLs were detected in homoeologous regions of linkagegroups 3a and 3b in both families, indicating that one gene may controlmuch of the dramatic difference in growth habit between these species.A major height QTL detected in both families may correspond withdwarfing mutations on barley 2H and wheat 2A. The L. cinereus parentcontributed negative alleles for all four circumference QTLs, five ofnine bolting QTLs, two of five anthesis date QTLs, and one of sevenheight QTLs. Coupling of synergistic QTL allele effects within parentalspecies was consistent with the divergent growth habit and plant heightof L. cinereus and L. triticoides. Conversely, antagonistic QTL allelesevidently caused transgressive segregation in reproductive bolting andflowering time.
LEYMUS wildryes are long-lived Triticeae grasses,closely related to wheat (Triticum spp.) and barley
(Hordeum vulgare L.). The genus Leymus includesabout 30 species distributed throughout temperate re-gions of Europe, Asia, and the Americas (Dewey, 1984).More than half of all Leymus species are allotetraploids(2n 5 4x 5 28), but octoploid (2n 5 8x 5 56) and do-decaploid (2n5 12x5 84) variants may arise from inter-specific hybrids (Anamthawat-Jonsson and Bodvarsdottir,2001) or autoduplication within species. These cool-season grasses display remarkable variation in growthhabit and stature with unusual adaptation to harshpolar, desert, saline, and erosion-prone environments.Leymus triticoides (creeping or beardless wildrye) andL. cinereus (basin wildrye) are closely related but mor-phologically divergent North American range grasses.
Aggressive rhizomes and adaptation to poorly drainedalkaline sites, primarily within the western USA, charac-terize sod-forming L. triticoides (0.3–0.7 m). Conversely,L. cinereus is a tall (up to 2 m) conspicuous bunchgrassadapted to deep well-drained soils from Saskatchewan toBritish Columbia, south to California, northern Arizona,and New Mexico, and east to South Dakota and Minne-sota. Most populations ofL. cinereus andL. triticoides areallotetraploids; however, octoploid forms of L. cinereusare typical in the Pacific Northwest. Basin wildrye, andoctoploid giant wildrye [L. condensatus (J. Presl) A.Love], are the largest cool-season bunch grasses native towestern North America. Artificial hybrids of L. cinereus,L. triticoides, and otherNorthAmericanLeymuswildryesdisplay regular meiosis and stainable pollen (Stebbinsand Walters, 1949; Dewey, 1972; Hole et al., 1999). BothL. cinereus andL. triticoides are highly self-sterile (Jensenet al., 1990) and hybridize with each other in nature.These species are naturally important forage and haygrasses in the Great Basin and other regions of westernNorth America.
Growth habit is a highly variable and ecologicallyimportant trait in perennial grasses. Aggressive rhi-zomes characterize quackgrass [Elymus repens (L.) Desv.ex Nevski] and johnsongrass [Sorghum bicolor (L.)Moench], which rank among the world’s worst perennialgrass weeds (Holm et al., 1977). In general, caespitose(i.e., growing in bunches or tufts) and rhizomatous grassesdominate semiarid and mesic grasslands, respectively(Sims et al., 1978). Nutrient islands beneath caespitosegrasses may also contribute to clone fitness in this growthform in both mesic and semiarid communities, whereasthe distribution of rhizomatous grasses may be restrictedto microsites characterized by higher soil organic carbonand nitrogen concentrations (Derner and Briske, 2001).We have observedL. cinereus andL. triticoides growing inclose proximity in mixed stands, at several disturbed sites,with no apparent difference in microhabitat. Conversely,we have observed L. triticoides in riparian or wet zonesandL. cinereus inhabiting dry adjacent uplands, restrictedto seemingly different natural microhabitats. In any case,L. cinereus and L. triticoides display profound differencesin growth habit. Lateral branches of L. cinereus growstrictly upward, often within the lower leaf sheaths astillers, whereas the lateral branches of L. triticoides fre-quently grow horizontally or downward under the soilsurface as rhizomes. In addition to obvious morphological
S.R. Larson, T.A. Jones, K.B. Jensen, N.J. Chatterton, B.L. Waldron,J.G. Robins, and B.S. Bushman, USDA-ARS, Forage and RangeResearch Lab., Utah State Univ., Logan, UT 84322-6300; X. Wu,Univ. of Missouri-Columbia, Columbia, MO 65211; A.J. Palazzo, U.S.Army Corps of Engineers, Engineering Research and DevelopmentCenter-Cold Regions Research and Engineering Lab., Hanover, NH03755-1290. Received 13 Dec. 2005. *Corresponding author ([email protected]).
Published in Crop Sci. 46:2526–2539 (2006).Genomics, Molecular Genetics & Biotechnologydoi:10.2135/cropsci2005.12.0472ª Crop Science Society of America677 S. Segoe Rd., Madison, WI 53711 USA
Abbreviations: AFLP, amplified fragment length polymorphism;ANTH, anthesis date; BOLT, reproductive bolting; CIRC, plant circum-ference; HGHT, plant height; IM, interval mapping; MQM, multiple-QTLmodel;QTL, quantitative trail locus (i); RFLP, restriction fragmentlength polymorphism; rMQM, restrictedMQMmapping; STS, sequence-tagged site; SSR, simple-sequence repeat.
Reproducedfrom
CropScience.PublishedbyCropScienceSociety
ofAmerica.Allcopyrights
reserved.
2526
Published online November 21, 2006

differences in growth habit and stature,L. cinereus andL.triticoides display differences in salt tolerance, seed dor-mancy, seed color, seed shattering, mineral content, til-lering, texture, and other characteristics.
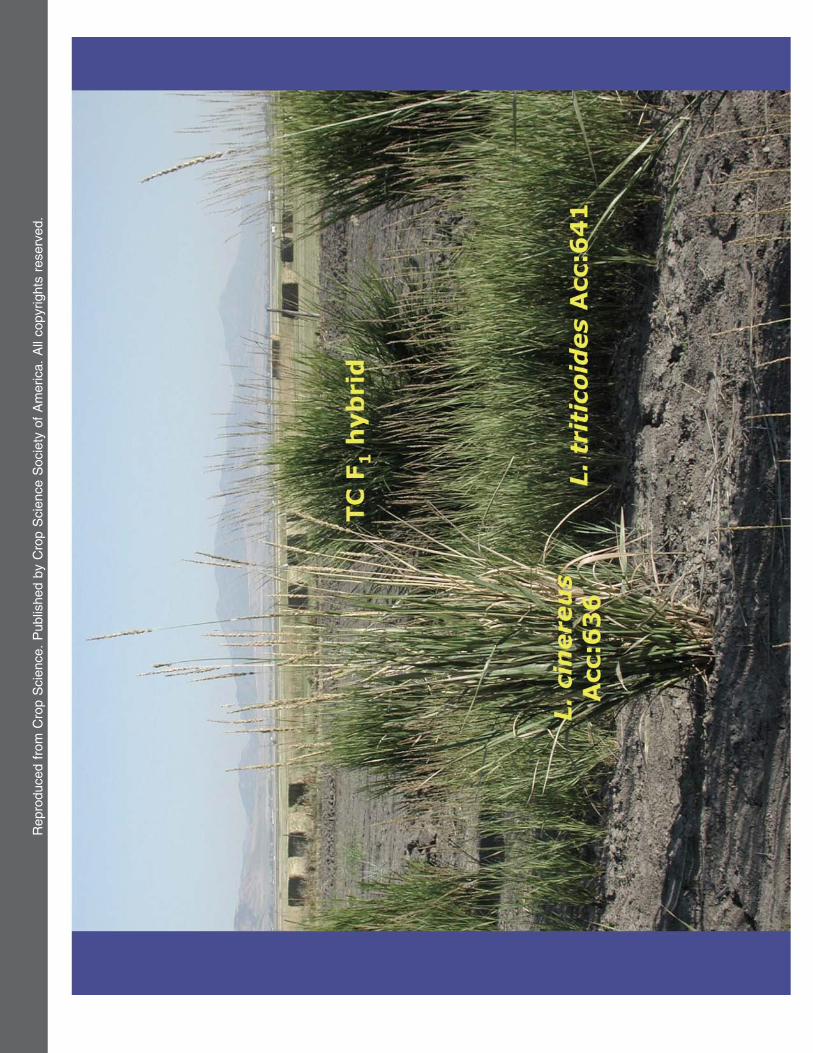
The F1 hybrids of L. cinereus and L. triticoides arerobust and vigorous plants with relatively large biomasspotential compared to other range grasses of westernNorth America. Wu et al. (2003) recently constructedhigh-density molecular genetic linkage maps for twofull-sib families, TTC1 and TTC2. The 164-sib TTC1 and170-sib TTC2 families were derived from two differentL. triticoides 3 L. cinereus F1 hybrids, TC1 and TC2,crossed to different clones of the same L. triticoidestester genotype (T–tester). The TC1 and TC2 F1 hybridswere derived from naturally heterogeneousL. triticoidesand L. cinereus seed accessions from Oregon and Al-berta, respectively. Together, the TTC1 and TTC2 fam-ilies capture a snippet of the divergence among andheterogeneity within the L. triticoides and L. cinereussource populations. These two experimental populationsprovide unique system for gene discovery research anddevelopment of breeding markers in perennial grasses.A close relative of quackgrass, Leymus also provides auseful system to study weedy traits such as rhizomes.Our primary objective here was to identify, character-ize, and compare QTLs controlling growth habit, plantheight, and flowering traits. Another major objectivewas to compare the location of these LeymusQTLs withgenomic regions controlling related traits in other cerealand grass species.
MATERIALS AND METHODS
Plant Materials and Genetic Maps
The full-sib TTC1 and TTC2 molecular genetic maps andpedigrees were described by Wu et al. (2003). The 164-sibTTC1 map included 1069 AFLP markers and 38 anchor loci in14 linkage groups spanning 2001 cM. The 170-sib TTC2 mapcontained 1002 AFLPmarkers and 36 anchor loci in 14 linkagegroups spanning 2066 cM. Some 488 homologous AFLP lociand 24 anchor markers, detected in both families, showed sim-ilar map order among 14 homologous linkage groups of theTTC1 and TTC2 families (Fig. 1). The 14 homologous linkagegroups of the allotetraploid TTC1 and TTC2 families weretentatively numbered according to the seven homoeolgousgroups of the Triticeae grasses on the basis of synteny of twoor more anchor markers from each of the seven homoeologousgroups of wheat and barley. Moreover, genome-specific STSmarkers were used to distinguish the Ns and Xm marker se-quences for homoeologous groups four and five on the basis ofsimilarity to Psathyrostachys juncea (Fisch.) Nevski (genomedesignation Ns), which is one of the diploid ancestors of al-lotetraploid Leymus (Wu et al., 2003). Otherwise, homoeo-logous chromosomes of allotetraploid Leymus were arbitrarilydistinguished by the letters “a” or “b.” For example, LG3a isallegedly homoeologous with LG3b (Fig. 1), an assertion sup-ported by synteny among 10 of the 11 anchor markers mappedto these linkage groups (Wu et al., 2003). Additional SSR andSTS anchor markers described in the results below wereanalyzed by methods described by Wu et al. (2003). Detailedgenetic maps containing all 1583 AFLP markers mapped inthe TTC1 and/or TTC2 families are shown in SupplementaryData files online. For essential comparisons of homology
between the Leymus TTC1 and TTC2 families and compari-sons of homoeology with other species, we showed all anchormakers but only those AFLP markers that were detected (ho-mologous) in both TTC1 and TTC2 families (Fig. 1).
Field Evaluations
Ramets from each of the two mapping families (TTC1 andTTC2) were space planted in a randomized complete block(RCB) design with two replicates (blocks) per family at theUtah Agriculture Experiment Station Richmond Farm (CacheCo., UT). Each block contained one entry of each of the 164TTC1 siblings or one clone from each of the 170 TTC2 siblingsplus the parental clones (i.e., TC1, TC2 and T) and single-plantrepresentatives of the heterogeneous L. cinereus Acc:636 andL. triticoides Acc:641 accessions. Individual ramets weretransplanted from soil containers (4-cm diameter) in thespring of 2001 to field plots with 2-meter row spacing and 2-meter spacing within rows (2-m centers). Plants were alignedamong rows such that each plant had four equidistant (2 m)neighboring plants. Each row contained 34 centers (one plantper center), thus blocks were restricted to six or seven rows.The TTC1 rep1, TTC2 rep1, TTC1 rep2, and TTC2 rep2blocks were arranged lengthwise, respectively, along the 66-mrows to form one continuous array comprised of 24 3 34centers (463 66 m). Quantitative traits, described below, weremeasured in 2002, 2003, and 2004.
Rhizome proliferation was measured as plant circumference(CIRC) in late spring or early summer. For caespitose plants,this could be simply measured by stretching a tape ruleraround the tussock at the soil surface. The circumference ofirregular sods, characteristic of the more rhizomatous plants,was approximated as the perimeter of a polygon where thecorners represent the outermost rhizome branches (i.e., theshortest distance around the outermost rhizomes) at the soilsurface. Anthesis date (ANTH) was measured as the numberof days from 1 January until the first day of anther extrusion,which is most apparent on warm dry mornings, beginning mid-June. In practice, the first day of anther extrusion was in-terpolated between two or three observations per week. Apriori, one unexpected phenomenon in the TTC1 and TTC2families was variation in reproductive bolting (BOLT), wheresome genotypes flowered and some did not, first observed in2002. Individual clones were retrospectively rated as 0 (notflowered) or one (flowered), after seed harvest and mowing,based on ANTH notes take in 2002. We subsequently ratedindividual plants for the proportion of bolting culms from 0 (nospikes produced) to 1 (virtually all major culms bolting), be-fore seed harvests and mowing, in 2003 and 2004. Plant height(HGHT)as measured after anthesis using a 2-m ruler. Plantheight (i.e., actual culm length from soil surface to the spiketerminal) was not measured on plants that did not flower.
Data Analysis
QTL analyses were based on trait means from tworeplicants for each of the 164 TTC1 and 170 TTC2 segregatesin 2002, 2003, and 2004. QTL analyses were also performed onaverages over all 3 yr, using output from the LSMEANS pro-cedure of SAS (Statistical Analysis Systems Institute Inc.,Cary, NC). Coefficients of skewness and kurtosis, g1, and g2were calculated as described by Snedecor and Cochran (1980).Departures from normality were deemed significant if theyexceeded two standard errors of skewness (SES) and kurto-sis (SEK) estimated by (6/N)22 and (24/N)22, respectively (Ta-bachnick and Fidell, 1996). Histograms of phenotypic values
Reproducedfrom
CropScience.PublishedbyCropScienceSociety
ofAmerica.Allcopyrights
reserved.
2527LARSON ET AL.: LEYMUS WILDRYES

(clonal averages) from 2002, 2003, and 2004 were also preparedfor CIRC, BOLT, ANTH, and HGHT (Supplementary Data).
Broad-sense heritabilities within years were obtained us-ing a SAS program for estimating heritability from linesevaluated in an RCB design in a single environment (Hollandet al., 2003). Likewise, heritabilities among years were ob-tained using another SAS program for estimating heritabilityfrom lines evaluated in RCB designs in multiple environments(Holland et al., 2003), modified to account for repeated mea-surements on perennial plants. All class variables (i.e., rep,clone, year) were treated as random effects. Genotypic andphenotypic correlations between traits evaluated using a SASprogram for estimating correlations from RCB designs inmultiple environments (Holland et al., 2003), also modified toaccount for repeated measurements. The original SASprograms for estimating heritabilities, genotypic correlations,and phenotypic correlations (Holland et al., 2003) areavailable at http://www4.ncsu.edu/|jholland/homepage_files/Page571.htm (verified 24 July 2006).
A sequential and reiterative procedure of QTL detectionwas performed using the MAPQTL five package (Van Ooijen,2004). Genome-wide interval mapping (IM) (Lander andBotstein, 1989; Van Ooijen, 1992) was performed in 1-cM in-crements to identify putative QTLs and possible cofactors
used in a multiple-QTL model (MQM) (Jansen, 1993; Jansen,1994; Jansen and Stam, 1994). Markers with the highest log-likelihood ratios (i.e., LOD test statistics) for each QTL (nomore than one per chromosome) were selected as the initialset of possible MQM cofactors. A backward elimination pro-cedure was applied to this initial set of cofactors using aconservative significance level of 0.001 to ensure the indepen-dence of each cofactor. A reiterative process of restrictedMQM (rMQM) mapping, which excludes any syntenous co-factors (i.e., cofactors located on the same linkage group thatis being scanned), was used to refine the location of rMQMcofactors (QTLs) and identify new rMQM cofactors (QTLs).Moreover conventional MQMmapping was used to detect (orexclude) syntenous QTLs, where that possibility was apparent.Finally, all putative QTLs were also evaluated using the non-parametric Kruskal–Wallis rank sum test, equivalent to thetwo-sided Wilcoxon rank sum test for two genotype classes(this study), which means that no assumptions are being madefor the probability distributions of the quantitative traits(Lehmann, 1975).
A threshold of 3.3 LOD was used throughout these QTL,MQM, and rMQM detection procedures as a close approxi-mation for a genome-wide 5% significance level as determinedfrom simulation tables based on genome size and family type
Fig. 1. Continued on next page.
Reproducedfrom
CropScience.PublishedbyCropScienceSociety
ofAmerica.Allcopyrights
reserved.
2528 CROP SCIENCE, VOL. 46, NOVEMBER–DECEMBER 2006

Fig. 1. Continued on next page.
Reproducedfrom
CropScience.PublishedbyCropScienceSociety
ofAmerica.Allcopyrights
reserved.
2529LARSON ET AL.: LEYMUS WILDRYES

Fig. 1. Continued on next page.
Reproducedfrom
CropScience.PublishedbyCropScienceSociety
ofAmerica.Allcopyrights
reserved.
2530 CROP SCIENCE, VOL. 46, NOVEMBER–DECEMBER 2006

Fig. 1. Summary and comparison of plant height, growth habit, and flowering QTLs detected in the full-sib Leymus triticoides3 (L. triticoides3 L.cinereus) TTC1 and TTC2 families based on 2002, 2003, 2004, and average measurements. The approximate location of QTLeffects (LOD 3.3),corresponding to a genome-wide P # 0.05 signficance level, detected using a restricted multiple QTL model (rMQM) are indicated by black orwhite bars for each trait 3 year. The updated molecular genetic linkage maps include 488 homologous AFLP markers and mapped in bothTTC1 and TTC2 families (Wu et al., 2003), 50 anchor markers (larger bold marker text) mapped in TTC1 and/or TTC2 families (Wu et al., 2003),and 17 additional anchor markers (larger bold italic marker text) mapped in the TTC1 and/or TTC2 families. Annotation next to each anchormarker indicate homoeologous groups of barley (H), wheat (ABD), cereal rye (R), and in parentheses oat chromosome designations.
Reproducedfrom
CropScience.PublishedbyCropScienceSociety
ofAmerica.Allcopyrights
reserved.
2531LARSON ET AL.: LEYMUS WILDRYES

(Van Ooijen, 1999) and empirical thresholds based on permu-tation analyses with 1000 replications (Churchill and Doerge,1994) specific to each trait. Both methods (Van Ooijen, 1999;Churchill and Doerge, 1994) produced remarkably similar re-sults for all four traits evaluated in this study.
Genome-wide IM and rMQM LOD scans based on 2002,2003, 2004, and average phenotypic values were performed forCIRC, BOLT, ANTH, and HGHTusing MapChart version 2.1(Voorrips, 2002) and the updated Leymus TTC1 and TTC2genetic maps as described in the results section below. Detailedgraphs of each genome-wide LOD scan using the completehigh-density linkage maps are provided in the SupplementaryData Online.
RESULTSMolecular Map Update
A subset of 48 CSU or KSU wheat SSR primer pairsdescribed by Yu et al. (2004), the HVCABG SSRprimers described by Becker and Heun (1995), and theHVM068 SSR primers described by Liu et al. (1996)were tested for amplification and polymorphism amongthe parental genotypes. Seven of these SSR primer pairs(CNL45, KSU154, CNL39, HVCABG, HVN068,KSU149, and KSU171) detected 11 loci in the LeymusTTC1 and/or TTC2 families (Fig. 1). Likewise, anothersubset of 48 published STS primer pair sequences (Manoet al., 1999; Taylor et al., 2001; Lem and Lallemand,2003), three sets of STS primers designed from the wheatVRN2 (Yan et al., 2004), and one set of STS primersdesigned from the BCD1117 barley cDNA clone (Heunet al., 1991) were also tested for amplification and poly-morphism among the parental genotypes. Seven of theseSTS primer pairs (TRX1, TRX2, BCD1117, MWG2230,VRN2, MWG2264, and ADP) detected 13 loci in theLeymus TTC1 and/or TTC2 families (Fig. 1).The thioredoxin h RFLPmarker,Xbm2, maps near the
self-incompatibility gene locus, S, on homeologous group1R of Secale (Korzun et al., 2001), and thioredoxin h STSmarkers have been utilized in perennial ryegrass (Tayloret al., 2001) and Kentucky bluegrass (Patterson et al.,2005). The thioredoxin h STS primers used by Pattersonet al. (2005) amplified two distinct sets of sequences,designated TRX1 (AY943821 and AY943822 from L. ci-nereus Acc:636; AY943823 and AY943824 from L. triti-coides Acc:641) and TRX2 (AY943825-AY943827 fromL. cinereus Acc:636; AY943828-AY943830 from L. triti-coides Acc:641). We designed TRX1 and TRX2 primersthat would amplify corresponding sequences from L. cine-reusbut notL. triticoides—thusproviding informative poly-morphisms for mapping in the TTC1 and TTC2 backcrossfamilies. The TRX2 amplicons mapped to homologous po-sitions of the LG6b linkage group, evident by the colin-iearity with homologous TTC1 and TTC2 AFLP markers(Fig. 1). The TRX1 primers amplified 289 bp sequencesthat mapped to LG1a in TTC1 and LG2b in TTC2 (Fig. 1).The TRX1 locus on LG1a is presumably homeologous tothe Xbm2 locus on Secale 1R. The role of thioredoxinh genes in seed germination, self-incompatibility, grainquality, and characteristics has been evaluated in cereals,grasses, and other plants (Juttner et al., 2000; Langridgeet al., 1999; Li et al., 1994, 1997; Sahrawy et al., 1996).
Of special interest with regard to flowering traits, theVRN1 and VRN2 genes are the two most potent genescontrolling differences in vernalization requirement be-tween winter annual and spring annual barley, wheat,and rye (Dubcovsky et al., 1998), and both of these geneshave been cloned (Yan et al., 2003, 2004). The VRN2gene is present on homoeologous regions of 4H in winterbarleys (evidently absent in most spring barleys) and a4A/5A translocation region of Triticum monococcum 5A(Dubcovsky et al., 1998; Yan et al., 2004). Primersdesigned from the wheat VRN2 gene amplified mixedsequences from Leymus that were very similar in size(supplemental data) and sequence (DQ486013) to thewheat VRN2 gene. These putative Leymus VRN2 se-quences map to a locus on the distal long arm of Leymus5Ns (Fig. 1), which evidently corresponds to the VRN2locus on Triticum monococcum 5A. Although we havenot yet mapped the Leymus VRN1 sequences, this geneis closely associated with the CDO504 marker in otherTriticeae species and also maps to Leymus LG5Ns andLG5Xm (Fig. 1) (Wu et al., 2003).
In summary, seven SSR primer pairs and seven STSprimer pairs (supplemental data) detected 15 additionalanchor loci in the TTC1 family and nine additionalanchor loci in the TTC2 family, not previously describedby Wu et al. (2003). The updated TTC1 map includes1069 AFLP markers and 53 anchor loci in 14 linkagegroups spanning 2001 cM. The updated TTC2 map con-tained 1002 AFLP markers and 45 anchor loci in 14linkage groups spanning 2066 cM. Some 488 homolo-gous AFLP loci and 31 anchor markers have beenmapped in both families, showing similar map order.Thus, 1583 AFLP markers and 67 different anchor locihave been mapped into 14 linkage groups, which evi-dently correspond to the 14 chromosome pairs of allo-tetraploid Leymus (2n 5 4x 5 28). The map locationsof the 17 new anchor loci (24 total including sevenhomologous pairs) (Fig. 1) were largely consistent withthe other anchor loci previously mapped in Leymus (Wuet al., 2003).
Growth HabitThe L. cinereus Acc:636 and L. triticoides Acc:641
progenitor accessions displayed very different levelsof rhizomatous spreading, which became more pro-nounced each year (Table 1). Although CIRC measure-ments of the TC1 and TC2 F1 hybrids were significantlygreater thanL. cinereusAcc:636, these means were well-below the midparent, TTC1, and TTC2 averages es-pecially in 2004 (Table 1).
Circumference of plant (rhizome) spreading showedrelatively strong broad-sense heritabilities in the TTC1family and moderate heritabilities in the more rhizoma-tous TTC2 family (Table 2). The CIRC trait also showedespecially strong heritabilities over years, in both TTC1and TTC2 families; however, this is expected becauseplant spreading is a cumulative trait. Not surprisingly,the ratio of genotype3 year to phenotypic variance wasnegligible (0.02) for the CIRC trait. The CIRC trait wasweakly correlated with the BOLTand ANTH flowering
Reproducedfrom
CropScience.PublishedbyCropScienceSociety
ofAmerica.Allcopyrights
reserved.
2532 CROP SCIENCE, VOL. 46, NOVEMBER–DECEMBER 2006

traits, in the TTC1 and/or TTC2 families, but virtuallyindependent from plant height in both TTC1 and TTC2families (Table 3).At least three significant CIRC QTLs were detected
in each family; however, not more than two QTLs weresignificant in any one year and population (Table 4,Fig. 1). The strongest, most consistent CIRC QTLs inboth TTC1 and TTC2 families were located in homolo-gous regions of LG3a (Table 4, Fig. 1). Likewise, homolo-gous CIRC QTLs were also detected on LG3b in bothTTC1 and TTC2 families (Fig. 1). The LG3a and LG3bCIRC QTLs, detected in both TTC1 and TTC2 families,are all located near homoeologous copies of VP1 genemarkers (Fig. 1). The transcription factor Viviparous-1(encoded by the Vp1 gene) induces and maintains seeddormancy (McCarty et al., 1991) and has been mappedto orthologous loci in wheat, maize, and rice (Bailey et al.,1999).Inadditiontothehomologousandpossiblyhomoeo-logous QTLs detected on LG3a and LG3b, in both TTC1and TTC2 families, a TTC1-specific CIRC QTL was de-tected on LG6a and a TTC2-specific CIRC QTL was de-tected on LG5Xm (Fig. 1). Thus, two CIRC QTLs werecommon to both TTC1 and TTC2 families and two wereunique toonlyone family.TheL. cinereusalleles hadnega-tive effects at all four (LG3a, LG3b, LG5Xm, and LG6a)CIRC QTLs (Table 4, Fig. 1) consistent with divergentphenotypes of the parental species.Although significant skewness was detected in several
evaluations, all four CIRC QTLs (Table 4, Fig. 1) were
highly significant (P , 0.0001) on the basis of the non-parametric Kruskal–Wallis rank sum test.
Flowering TraitsThe BOLT and ANTH traits showed relatively strong
negative genotypic correlations in both TTC1 and TTC2families (Table 3), evidently controlled by several common(probably pleiotropic) QTLs (Fig. 1). Thus, data fromthese two traits are presented together in one section.
The L. cinereusAcc:636 and L. triticoidesAcc:641 pro-genitor accessions; F1 interspecific hybrids (TC1 andTC2); and TTC1 and TTC2 families displayed similarBOLT and ANTH phenotypic means (Table 1), exceptfor the fact that L. cinereus showed relatively weak bolt-ing in the first establishment year. Leymus cinereus has arelatively large stature, requiring several years to reachreproductive maturity. Yet, the TTC1 and TTC2 familiesdisplayed transgressive BOLT and ANTH segregationthat persisted through 2002, 2003, and 2004 (see traitdistributions in Supplemental Data). Unlike the F1 hy-brids or parental source populations, some transgressiveprogeny failed to flower in 2002, 2003, 2004, and 2005.
The BOLT and ANTH traits both showed relativelyweak plot-mean heritabilities over years (Table 2). Theratio of genotype 3 year interaction to phenotypic var-iance was substantially greater for ANTH (0.18) andBOLT (0.21) compared with CIRC (0.02) or HGHT(0.13), which explains the low plot-mean heritabilities
Table 1. Trait means6 SD for circumference of plant spreading (CIRC), proportion of bolting culms (BOLT), anthesis date (ANTH), andplantheight (HGHT) for Leymus cinereusAcc:636, L. triticoides Acc:641, L. triticoides T parental genotype, interspecific TC1 and TC2parental hybrids, and full-sib L. triticoides 3 (L. triticoides 3 L. cinereus) TTC1 and TTC2 mapping families.
Trait Year Acc:636 (n 5 18)† Acc:641 (n 5 15)† t tester (n 5 13)‡ TC1 (n 5 14)‡ TC2 (n 5 14)‡ TTC1 (n 5 164)§ TTC2 (n 5 168)§
CIRC 2002 23 6 10 354 6 186 487 6 61 96 6 35 125 6 37 180 6 91 299 6 1162003 51 6 26 594 6 326 853 6 120 200 6 32 231 6 38 288 6 122 449 6 1542004 76 6 21 816 6 416 1263 6 177 256 6 39 282 6 53 362 6 137 548 6 170Avg. 57 6 23 702 6 208 653 6 112 183 6 28 212 6 40 273 6 112 430 6 144
BOLT 2002 0.28 6 0.46 0.67 6 0.48 1.00 6 0.00 0.79 6 0.43 1.00 6 0.00 0.57 6 0.43 0.73 6 0.382003 0.63 6 0.43 0.56 6 0.32 0.98 6 0.06 0.88 6 0.19 0.77 6 0.21 0.33 6 0.24 0.36 6 0.252004 0.85 6 0.33 0.78 6 0.35 1.00 6 0.00 0.84 6 0.19 0.81 6 0.23 0.55 6 0.26 0.67 6 0.27Avg. 0.60 6 0.58 0.74 6 0.24 0.99 6 0.03 0.83 6 0.14 0.85 6 0.09 0.49 6 0.26 0.59 6 0.26
ANTH 2002 176.8 6 2.1 173.3 6 2.6 172.0 6 0.0 173.6 6 2.1 173.1 6 1.5 173.5 6 1.9 173.8 6 4.82003 171.1 6 5.1 169.3 6 1.4 169.0 6 0.0 169.0 6 0.0 169.0 6 0.0 172.1 6 5.7 171.3 6 4.92004 178.3 6 3.9 172.6 6 1.6 173.0 6 0.0 175.9 6 4.0 175.9 6 4.0 175.7 6 4.6 174.1 6 3.7Avg. 175.9 6 2.4 172.2 6 1.1 171.3 6 0.0 172.8 6 1.3 172.6 6 1.5 174.5 6 3.5 173.4 6 4.0
HGHT 2002 99.0 6 39.8 94.5 6 12.6 100.8 6 5.7 145.8 6 15.9 141.8 6 10.6 103.9 6 13.8 109.7 6 13.02003 135.6 6 23.0 98.5 6 8.5 100.9 6 5.9 155.1 6 12.6 138.4 6 13.3 108.3 6 12.9 106.1 6 12.42004 182.9 6 18.5 123.3 6 12.7 125.7 6 3.4 184.7 6 12.3 164.6 6 8.7 134.8 6 13.8 137.8 6 11.8Avg. 142.2 6 26.0 107.3 6 8.7 109.2 6 2.4 161.8 6 11.2 148.3 6 8.3 116.1 6 12.5 117.9 6 10.7
Measurements expressed in cm (CIRC and HGHT), proportion (BOLT), and days from January one (ANTH).† Sample size based on individual plants.‡ Sample size based on individual clones of each parental genotype.§ Sample size based on means of two clones for each genotype (n).
Table 2. Estimates of broad-sense heritability (H 2)6 SE based on a plot basis and, in parentheses, genotypic mean basis for circumferenceof plant spreading (CIRC), proportion of bolting culms (BOLT), anthesis date (ANTH), and plant height (HGHT) in the full-sib Leymustriticoides 3 (L. triticoides 3 L. cinereus) TTC1 and TTC2 mapping families.
Trait Family 2002 2003 2004 Over years
CIRC TTC1 0.72 6 0.04 (0.84 6 0.03) 0.77 6 0.03 (0.87 6 0.02) 0.73 6 0.04 (0.85 6 0.02) 0.64 6 0.04 (0.91 6 0.01)TTC2 0.54 6 0.06 (0.70 6 0.05) 0.55 6 0.06 (0.71 6 0.05) 0.57 6 0.05 (0.73 6 0.04) 0.50 6 0.05 (0.86 6 0.03)
BOLT TTC1 0.44 6 0.06 (0.61 6 0.06) 0.63 6 0.05 (0.77 6 0.04) 0.64 6 0.05 (0.77 6 0.04) 0.38 6 0.04 (0.76 6 0.04)TTC2 0.43 6 0.06 (0.61 6 0.06) 0.64 6 0.05 (0.78 6 0.04) 0.69 6 0.04 (0.81 6 0.03) 0.41 6 0.04 (0.78 6 0.03)
ANTH TTC1 0.50 6 0.07 (0.67 6 0.07) 0.42 6 0.08 (0.59 6 0.08) 0.51 6 0.06 (0.67 6 0.06) 0.31 6 0.05 (0.71 6 0.05)TTC2 0.73 6 0.04 (0.84 6 0.03) 0.43 6 0.08 (0.60 6 0.07) 0.46 6 0.07 (0.63 6 0.06) 0.41 6 0.04 (0.78 6 0.03)
HGHT TTC1 0.69 6 0.05 (0.81 6 0.03) 0.51 6 0.07 (0.68 6 0.06) 0.73 6 0.04 (0.84 6 0.03) 0.54 6 0.04 (0.86 6 0.02)TTC2 0.66 6 0.05 (0.79 6 0.03) 0.53 6 0.06 (0.69 6 0.06) 0.59 6 0.05 (0.75 6 0.04) 0.48 6 0.04 (0.82 6 0.03)
Reproducedfrom
CropScience.PublishedbyCropScienceSociety
ofAmerica.Allcopyrights
reserved.
2533LARSON ET AL.: LEYMUS WILDRYES

over years for the ANTH and BOLT flowering traits.Although, BOLT and ANTH traits show significant ge-notype 3 year interaction and the significance of QTLsvary by year (Tables 4), several QTLs were detectableover years (Fig. 1). One notable exception was a highlysignificant TTC2 ANTH QTL on LG6a in 2002, whichwas virtually nonexistent in subsequent years. Boltingdeficiencies were strongly correlated with late floweringand weakly correlated with short caespitose character-istics (Table 3).A total of nine BOLT QTLs were detected in the
TTC1 and/or TTC2 families (Table 4, Fig. 1). The TTC1and TTC2 BOLT QTL peaks on the upper portion ofLG4Xm overlap well enough (Fig. 1) that we countedthese as one homologous QTL. Likewise, we believe that
there is insufficient separation of the TTC1 and TTC2BOLTQTLs on LG6a to declare these as different (Fig. 1).Thus, L. cinereus contributed five negative TTC1 and/orTTC2 BOLTQTL alleles and four positive TTC1 and/orTTC2 BOLT QTL alleles (Table 4, Fig. 1). Two of thesenine BOLT QTLs were significant in both TTC1 andTTC2 families (i.e., homologous), whereas seven QTLswere unique to TTC1 or TTC2. Four QTLs explained upto 43.9% of the BOLT variation in the 2003 TTC2 dataset, which was the most explanatory QTL model in thisstudy (Table 4).
A total of five significant ANTH QTLs were detectedin the TTC1 or TTC2 families (Table 4, Fig. 1). All fivesignificant ANTH QTLs were unique to TTC1 or TTC2(Table 4 and Fig. 1). However, the TTC1 family displayed
Table 3. Genotypic and in parentheses phenotypic trait correlations 6 SE for circumference of plant spreading (CIRC), proportion ofbolting culms (BOLT), anthesis date (ANTH), and plant height (HGHT) in the full-sib Leymus triticoides (L. triticoides 3 L. cinereus)TTC1 (below diagonal) and TTC2 (above diagonal) families.
CIRC BOLT ANTH HGHT
CIRC — 0.24 6 0.09 (0.13 6 0.05) 20.22 6 0.09 (20.10 6 0.05) 0.12 6 0.09 (0.02 6 0.05)BOLT 0.22 6 0.08 (0.15 6 0.05) — 20.83 6 0.04 (20.56 6 0.03) 0.32 6 0.09 (0.36 6 0.04)ANTH 20.33 6 0.09 (20.22 6 0.05) 20.81 6 0.06 (20.48 6 0.03) — 20.26 6 0.09 (20.32 6 0.04)HGHT 0.01 6 0.09 (0.04 6 0.06) 0.32 6 0.09 (0.40 6 0.04) 0.07 6 0.11 (20.19 6 0.05) —
Table 4. Summary of QTL effects detected using multiple QTL model (MQM) scans of circumference of plant spreading (CIRC),proportion of bolting culms (BOLT), anthesis date (ANTH), and plant height (HGHT) in the full-sib Leymus triticoides3 (L. cinereus3L. triticoides) TTC1 and TTC2 backcross mapping families.
Trait Family Position (interval†) 2002 LOD (R2, effect‡) 2003 LOD (R2, effect‡) 2004 LOD (R2, effect‡) Average LOD (R2, effect‡)
CIRC TTC1 3a (125–137) NS 3.88 (10.7%, 279)§ 3.16 (9.3%, 283)§ 3.41 (10.0%, 269)¶3b (111–112) NS 3.47 (8.5%, 273)¶ NS NS6a (107–144) NS NS 4.08 (9.9%, 287)§ 3.33 (8.2%, 64.4)§Overall R2 NS 16.9% 18.4% 16.4%
TTC2 3a (111–161) 4.36 (10.2%, 275)§ 5.15 (12.0%, 2107)§ 3.9 (9.0%, 2102)§ 5.44 (12.8%, 2104)§3b (111–144) 3.56 (8.4%, 268)§ NS NS NS5Xm (25–66) NS 3.84 (8.7%, 294)§ 4.76 (12.1%, 2121)§ 4.49 (10.4%, 296)§Overall R2 19.7% 21.0% 20.3% 20.4%
BOLT TTC1 3a (27–80) NS NS 6.12 (13.3%, 10.19)§ 4.00 (7.6%, 10.14)¶4Xm (11–42) 3.17 (7.4%, 20.24)§ 4.12 (10.9%, 20.16)§ 5.12 (11.4%, 20.18)§ 6.33 (13.6%, 20.19)§6a (61–88) 3.57 (8.4%, 10.25)§ NS NS 4.01 (8.1%, 10.15)§6b (95–117) NS NS 3.47 (9.3%, 20.16)¶ 4.11 (10.0%, 20.16)§7b (11–15) 3.20 (7.0%, 10.24)§ NS NS NSOverall R2 25.7% 10.9% 28.9% 35.9%
TTC2 1b (47–85) NS 5.38 (8.9%, 20.15)§ NS NS4Ns (0–24) 3.78 (8.7%, 20.25)§ NS NS NS4Ns (95–142) 4.36 (10.8%, 10.26)§ 4.53 (9.0%, 10.16)§ 5.65 (15.3%, 10.21)§ 5.64 (11.3%, 10.18)§4Xm (23–41) NS 4.05 (7.2%, 20.13)§ NS 4.37 (9.2%, 20.16)§4Xm (68–109) NS 4.61 (8.1%, 20.14)¶ NS NS6a (80–125) NS 7.33 (15.4%, 10.20)§ NS 4.89 (12.4%, 10.18)§Overall R2 19.9% 43.9% 15.3% 32.6%
ANTH TTC1 2a (121–139) NS NS NS 4.59 (11.4%, 12.5)§6b (108–127) NS NS NS 4.00 (9.9%, 12.2)¶Overall R2 NS NS NS 19.2%
TTC2 4Ns (87–124) 3.54 (7.6%, 22.7)§ 5.21 (15.9%, 24.5)§ NS 5.42 (14.7%, 23.12)§4Xm (32–34) 3.70 (7.5%, 12.7)§ NS NS NS6a (108–127) 5.85 (15.6%, 23.9)§ NS NS NSOverall R2 30.9% 13.7% NS 14.7%
HGHT TTC1 2a (30–105) 7.66 (23.5%, 113.3)§ 6.74 (15.2%, 110.1)§ 10.8 (24.5%, 113.6)§ 10.36 (21.2%, 111.6)§2b (130–164) NS NS 5.16 (10.7%, 19.0)§ 5.07 (9.6%, 17.8)§5Ns (42–44) NS 3.44 (7.4%, 17.0)¶ NS NS5Xm (0–11) NS NS NS 3.77 (7.0%, 26.8)e
6b (0–24) NS 3.86 (11.7% 19.1)§ NS NSOverall R2 20.6% 31.4% 33.8% 38.8%
TTC2 2a (37–103) 8.56 (17.5%, 111.1)§ 4.20 (9.3%, 17.6)§ 3.50 (8.8%, 17.0)§ 6.40 (14.2%, 18.1)§3a (20–34) 4.10 (8.7%, 17.74)¶ 4.15 (9.2%, 17.5)¶ NS 3.98 (7.9%, 16.0)§3a (77–89) NS 3.42 (7.2%, 16.7)§ 4.96 (13.2%, 18.6)§ NS5Xm (6–82) 5.64 (11.1%, 28.8)§ NS NS 4.65 (9.1%, 26.9)§Overall R2 34.1% 28.8% 20.3% 34.5%
†Approximate positions (cM) where LOD scan exceeded 3.3 threshold as shown in Fig. 1.‡Mean of heterozygous genotype (L. cinereus and L. triticoides alleles)– mean of homozygous genotypes (two L. triticoides alleles) expressed in centimeters(CIRC and HGHT), proportions (BOLT), or days (ANTH).
§Cofactors selected by interval mapping (LOD . 3.3) and backward elimination (significant at the 0.001 level).¶Additional cofactors identified by restricted multiple QTL model mapping (LOD . 3.3) and backward elimination.
Reproducedfrom
CropScience.PublishedbyCropScienceSociety
ofAmerica.Allcopyrights
reserved.
2534 CROP SCIENCE, VOL. 46, NOVEMBER–DECEMBER 2006

ANTH LOD values that were nearly significant on achromosome region homologous to the TTC2 ANTHQTL on LG4Xm (see ANTH LOD scan in Supple-mental Data). Similarly, both TTC1 and TTC2 displayednearly significant ANTH LOD values on homologousregions of LG3b. In any case, L. cinereus contributedthree positive and two negative ANTH QTL alleles atthe five significant QTLs (Table 4, Fig. 1).The genome-wide LOD scans were similar but not
identical for the BOLTand ANTH flowering traits (Fig. 1and Supplemental Data). The TTC1 BOLT QTL onLG3a had no apparent effects on ANTH. The TTC2BOLT QTLs on LG4Ns were associated with significantor nearly significant ANTH QTLs. Likewise, the BOLTQTLs on LG4Xm were associated with significant ornearly significant ANTH QTLs in the TTC1 and TTC2families. The TTC1 ANTH QTL on LG 5Ns was as-sociated with elevated BOLT LOD, albeit less than the3.3 LOD threshold (Supplemental Data). Interestingly,the TTC1 and TTC2 BOLT QTLs on LG6a were as-sociated with significant ANTH QTLs only in the TTC2family. The TTC1 BOLT QTL on LG6a was not as-sociated with elevated ANTH LOD values. The latterobservation raises some doubt about the putative ho-mology of the TTC1 and TTC2 BOLT QTLs on LG6a(Fig. 1). Finally the TTC1 BOLT QTLs on LG6b andLG7b were closely associated with a significant or nearlysignificant ANTH QTLs, respectively.Significant skewness and kurtosis was detected for
BOLT and ANTH; however, all QTLs (Table 4, Fig. 1)were highly significant (P , 0.0001) on the basis of thenonparametric Kruskal–Wallis rank sum test.
Plant HeightThe L. cinereus Acc:636 plants were substantially
taller than the L. triticoides Acc:641 plants in 2003 and2004 (Table 1). However, the L. cinereus plants requireseveral years to reach full-size; thus, interspecific dif-ferences in plant height were not apparent in 2002.Interestingly, the TC1 and TC2 F1 hybrid genotypesdisplayed greater plant height than the L. cinereus Acc:636 or L. triticoides Acc:641 reference individuals, espe-cially in 2002 and 2003 (Table 1). The 2004 HGHTmeanswere substantially greater in 2004, which may be attrib-utable to better rainfall (i.e., 2002 and 2003 were severedrought years) and/or longer plant establishment.Heritabilities over years (Table 2) for HGHT were
intermediate between CIRC and the two flowering traits(ANTH and BOLT). Likewise, the ratio of genotype 3year interaction to phenotypic variance for HGHT (0.13)was intermediate between CIRC (0.02) and the flow-ering traits, ANTH (0.18) and BOLT (0.21). Weak posi-tive genotypic correlations between HGHT and BOLTwere detected in TTC1 and TTC2 families, but noother trait correlations with HGHT were detected inboth families.We detected a total of seven HGHT QTLs in the
TTC1 and/or TTC2 families (Table 4, Fig. 1). The TTC2HGHT QTL on LG3a was split into two QTLs using acombination of rMQM and unrestricted MQMmapping
(Table 4, Fig. 1). The single largest HGHT QTL waslocated in homologous regions of LG2a in both TTC1and TTC2 families. Likewise, overlapping TTC1 andTTC2 HGHT QTLs on LG5Xm were too close to sepa-rate (Fig. 1), which we count as one homologous QTL.Moreover, LG5Xm was the only chromosome that con-tributed negative HGHT QTL alleles from the taller L.cinereus species, which also seems to support our inter-pretation that these are homologous QTLs in the TTC1and TTC2 families. Thus, L. cinereus contributed sixpositive and one negative HGHT QTL alleles in theTTC1 and/or TTC2 families, which is consistent with di-vergent phenotypes of the parental species.
DISCUSSIONLeymus Molecular Genetic Maps
Seventeen additional anchor markers described in thisstudy support previous linkage group identifications, ten-tatively numbered according to the seven homoeologousgroups of the wheat, barley, and rye Triticeae cereals(Wu et al., 2003). Among the well-characterized Triticeaegenomes, researchers have detected one rearrangementin Aegilops longissima Schweinf. & Muschl. (SI ge-nome), 11 in Ae. umbellulata Zhuk. (U genome), 0 inAe. speltoides Tausch (S genome), seven in Secale cerealeL. cultivated ryes (R genome), and two paracentricinversions in H. vulgare cultivated barleys (H genome)relative to Ae. tauschii Coss., the donor of the hexaploidwheat D genome (Devos and Gale, 2000). The A, B, andD genomes of allohexaploid wheat are evidently colinearexcept for several large reciprocal translocations involv-ing chromosome arms 2BS and 6BS and chromosomes4A, 5A, and 7B (Devos and Gale, 2000). One of theserearrangements involves a reciprocal translocation be-tween 4AL and 5AL, which includes the VRN2 gene inT. monococcum L. (Dubcovsky et al., 1998; Yan et al.,2004). Interestingly, the location of the VRN2 gene onLeymus LG5Ns evidently corresponds with the locationof VRN2 in T. monococcum (Devos et al., 1995; Dub-covsky et al., 1996). Thus, the Leymus Ns and T. mono-coccum genomes evidently share the same 4AL/5ALtranslocation arrangement. Although we detected seveninstances of marker synteny in Leymus that were notsyntenous in other Triticeae species, we have no firmevidence of rearrangements other than the putative 4Ns/5Ns translocation that has already been documented inwheat. Incongruent RFLP marker locations can oftenbe attributed to paralogous duplications or, in the caseof PCR, priming annealing at nonhomologous loci. Al-though there is substantial evidence of colinearity betweenthe LeymusNs, LeymusXm, wheat A, wheat B, wheat D,andbarleyHgenomes,we cannot exclude the possibility ofa few yet undetected rearrangements in Leymus.
These are the first QTL analyses conducted using thehigh-density linkage maps published byWu et al. (2003).Throughout much of the linkage map, relatively smallirregularities in the LOD scans (Supplemental Data) re-sulted from imperfect genotyping, missing data, and am-biguous marker orders. Nevertheless, these QTL maps
Reproducedfrom
CropScience.PublishedbyCropScienceSociety
ofAmerica.Allcopyrights
reserved.
2535LARSON ET AL.: LEYMUS WILDRYES

provide a useful starting point for high-resolution QTLmapping experiments using six advanced backcrosspopulations that are currently being genotyped and evalu-ated in clonally replicated field trials.
Comparison of TTC1 and TTC2 QTLsTwo circumference, two bolting, and two height QTLs
were evidently homologous in both TTC1 and TTC2families. Conversely, two circumference, seven bolting,all five anthesis date, and five height QTLs were uniqueto TTC1 or TTC2 families. Differences between theTTC1 and TTC2 families can be attributed to differencesbetween the TC1 and TC2 hybrids, which in turn can onlybe attributed to genetic variation within the L. cinereusAcc:636 and L. triticoides Acc:641 natural germplasmsources. Thus, functionally important QTL variation wasapparent within and between natural source populationsof these experimental families and species.
Growth HabitThe coincidence of QTL effects near the VP1 loci on
LG3a and LG3b, in both TTC1 and TTC2, suggest thatthese QTLs may be controlled by homoeologous copiesof the one gene. If so, this gene evidently controls muchof the dramatic difference in growth habit between L.cinereus, L. triticoides, and perhaps other grasses. Theonly other CIRC QTLs, on LG5Xm and LG6a, wereunique to the TTC1 and TTC2 families, respectively. Apreponderance of mapped barley mutations (four of sixloci) that affect vegetative axillary development havebeen localized to chromosome 3HL (minus arm), in-cluding absent lower laterals (als), low number of tillers1(int1), and semi brachytic (usu), which produce fewertillers, in addition to granum-a (gra-a), which producessignificantly more tillers (Babb and Muehlbauer, 2003;Franckowiak, 1996). A recessive gravitropic lazy dwarfgene (lzd) was also mapped to the short arm of barleychromosome 3 (Franckowiak, 1996; Takahashi et al.,1975), but this mutation seems to bemore proximal to thecentromere than the Leymus LG3a and LG3b growthhabit QTLs. Chromosome 3 is highly conserved withinthe Triticeae (Devos and Gale, 2000). Colinear from endto end with rice chromosome 1, Triticeae group three isalso the most conserved of all chromosome groups whencompared with rice (La Rota and Sorrells, 2004). Ricechromosome 1 contains putative transmembrane auxinefflux carrier and DNAJ-like genes (International RiceGenome Sequencing Project, 2005), near the Vp1 locus,originally identified in Arabidopsis pin-forming (Galwei-ler et al., 1998) and arg1 (altered response to gravity)(Sedbrook et al., 1999) mutants, respectively. However,pin1- and arg1-like sequences are also present in otherregions the rice genome. Rhizome (Hu et al., 2003) andtiller angle (Li et al., 1999) QTLs also map to rice chro-mosome 1, but these rice loci were not located near therice Vp1 gene.The TTC2 CIRC rMQM QTL on LG5Xm mapped
near the TCP-like sequence (TCP2) amplified from L.triticoides rhizome cDNA using primers designed fromthe teosinte branched one gene (Doebley et al., 1997),
BCD1130, BCD1707, and PSR128 loci. The PSR128marker also maps in the centromere region of maizechromosome 4 near the recessive lazy1 (la1) gene (Law-rence et al., 2004). Lazy maize mutants, allelic to la1,actively grow downward (prostrate) under light (Firnet al., 2000). We found BCD1707 and BCD1130 se-quences on rice chromosome 11, using a TBLASTXsearch (Ware et al., 2002) of the rice genome (Interna-tional Rice Genome Project, 2005), near another lazy (la)gene (Miura et al., 2003). The centromere and short armregions of Triticeae group 5 are homoeologous to ricechromosomes 9 and 12, respectively (Van Deynze et al.,1995; La Rota and Sorrells 2004). Rice chromosome 9contains a majorQTL (Ta) for tiller angle (Li et al., 1999).
The TTC1 CIRC QTL peak on LG6a is located ap-proximately (minus) 40 cM from the MWG2264 locus.Interestingly, the uniculm (cul2) mutation andMWG2264loci are both located (minus) 8.8 and 3 cM relative to thecMWG679 locus on barley 6H (Babb and Muehlbauer,2003; Graner et al., 1991; Graner, 2004). Compared withother barley mutants, uniculm2 (cul2) is unique in that itinhibits formation of axillary meristems and does notproduce tillers (Babb and Muehlbauer, 2003).
We were not able to identify rhizome QTLs in Ley-mus that were homeologous to rhizome QTLs of Sor-ghum and Oryza. Paterson et al. (1995) detected about12 rhizome QTLs including a conspicuous cluster ofQTLs affecting rhizome number, rhizome distance, andseedling tillers on Sorghum linkage group C, whichcorresponds to wheat group 4 (Draye et al., 2001). Thelatter Sorghum QTL also corresponds with sucker andstalk number QTL in Saccharum (Jordan et al., 2004), inaddition to the Rhz2 gene and 11 other QTLs con-trolling rhizome proliferation differences between O.sativa L. and O. longistaminata A. Chev. & Roehr. (Huet al., 2003). We did not detect any plant circumferenceQTLs on Leymus LG 4Ns or LG4Xm, which include thePRC140 rhizome QTL marker (Draye et al., 2001)derived from a Sorghum LG C and sequences ortholo-gous to the maize teosinte branched one gene (Doebleyet al., 1997). The Rhz3 gene and rhizome QTL onOryzachromosome 4 correspond to rhizome QTLs on Sor-ghum LG D (Hu et al., 2003) and Saccharum (Jordanet al., 2004). This region of Oryza chromosome 4 andSorghum LG D evidently corresponds to Triticeae group2 (Paterson et al., 1995; Van Deynze et al., 1995). We didnot detect any significant rhizome QTL effects on Triti-ceae group 2.
Bolting and Anthesis DateThe genetic control of flowering time is complex,
involving three major groups of genes on all sevenTriticeae chromosome groups (Snape et al., 2001). Twoof these groups interact with the environment, namelythose controlling vernalization (Vrn) and photoperiod(Ppd). The third set of genes controls developmental rateindependent of vernalization and photoperiod, so-called“earliness per se” (Eps) genes. A relatively large numberofEps genes have beenmapped to all seven homoeologousgroups of wheat and/or barley (Laurie et al., 1995; Snape
Reproducedfrom
CropScience.PublishedbyCropScienceSociety
ofAmerica.Allcopyrights
reserved.
2536 CROP SCIENCE, VOL. 46, NOVEMBER–DECEMBER 2006

et al., 2001), several of which may correspond to BOLTand/or ANTH QTLs detected in Leymus.The Vrn genes map to Triticeae groups 1, 4, 5, and 7
(Dubcovsky et al., 1998; Snape et al., 2001). Moreover,the two most potent genes, on groups 4 and 5, have beencloned and characterized (Yan et al., 2003; Yan et al.,2004). Surprisingly, no significant bolting or anthesisdate QTLs were associated with the Leymus CDO504markers on LG5Ns and LG5Xm, which are presumablyclosely linked with genes that are orthologous to VRN1.We have amplified VRN1 sequences from Leymus buthave not yet found polymorphisms needed for mapping.Likewise, no significant bolting or anthesis date QTLswere associated with the VRN2 gene on LG5Ns. A sec-ond yet undetected VRN2 gene may or may not be pres-ent on the Xm genome. The most conspicuous wheat andbarley Ppd genes are located on homoeologous regionsof the 2A, 2B, 2D, and 2H short (plus) chromosome arms.Other Ppd genes have also been reported on barley 1H(Laurie et al., 1995) and 6H (Strake and Borner, 1998).We did not detect ANTH or BOLT QTLs on short (mi-nus) arm of Leymus group two chromosomes.The TTC1 and TTC2 families displayed substantial
genetic variation for anthesis date and bolting, includinggenotypes that have not flowered in the field, which wasnot apparent among the parental species accessions.This transgressive segregation can be explained by amixture of antagonistic (i.e., positive and negative) QTLalleles from each parental species. Leymus cinereus con-tributed five positive and four negative BOLT QTLsand three positive and two negative ANTHQTLs. Thus,correspondence of bolting and anthesis date QTLs (andrelatively strong negative genotypic correlations) sug-gest that outbreeding depression (i.e., transgressive ge-notypes that to flower) was associated with flowering(i.e., lateness) genes under balancing selection. Althoughpopulation means and standard deviations may notdemonstrate significant bolting depression, the fact thata substantial number of progeny failed to flower yearafter year indicates that some outbreeding depressionis occurring. We have not observed this phenomenonwithin the L. cinereus Acc:636 or L. triticoides Acc:641natural source populations.
Plant HeightThe HGHT QTLs on LG2a displayed remarkably
strong effects and similar map locations in both TTC1and TTC2 families, suggesting that these QTLs are ho-mologous. The LG2a HGHT QTL was the only majorpositive HGHT effect associated with chromatin of themuch taller L. cinereus species and detected in bothTTC1 and TTC2 families. We interpret these results tomean that this is one of the key QTLs controlling rela-tively large differences in plant height between L.cinereus and L. triticoides. Borner et al. (1999) mappedgibberellin-sensitive gal (GA-less) and gibberellin-insensitive gai (GA-ins) mutations about 55 cM aparton barley 2H. The Leymus LG2a HGHT QTL spans a40 cM interval from the XANTHA locus down belowthe CNL045 locus (Fig. 1). The XANTHA–CNL045
LG2b interval also includes the cWMG763 locus (Fig. 1),which was mapped to the short (plus) arm of barley 2Habout 36 cm distal from the MWG2287 marker in thebarley IGRI 3 FRANKA population (Graner et al.,1991; Graner, 2004). The MWG2287 locus is closelylinked to the barley gai mutation in the centromeric re-gion of barley chromosome 2H (Borner et al., 1999). Wespeculate that the gai (sdw3) locus, described by Borneret al. (1999) and Gottwald et al. (2004), may correspondwith a major plant height QTL associated with the clus-ter of DNA markers near the CNL045 locus of LG2a.The CNL045 loci are associated with high-density clus-ters of markers on Leymus LG2a and LG2b linkagegroups, probably caused by reduced recombination nearthe centromere. Yang et al. (1995) also described a par-tially dominant GA-ins dwarfing gene on the short armof chromosome 2A of wheat (Rht21), which could behomeologous to the gai mutation mapped by Borneret al. (1999). In any case, the barley, wheat, and Leymusplant height genes on homeologous group two are evi-dently different from the so-called “green revolution”GA-ins dwarfing genes of wheat, barley, and rice encodegibberellin response modulators that map to Triticeaegroup four (Peng et al., 1999).
ACKNOWLEDGMENTS
This work was supported by joint contributions of the USDAAgriculture Research Service, Utah Agriculture ExperimentStation, Department of Defense Strategic EnvironmentalResearch and Development Program CS1103 project, and USArmy BT25-EC-B09 project (Genetic Characterization ofNative Plants in Cold Regions). Trade names are included forthe benefit of the reader, and imply no endorsement or pref-erential treatment of the products listed by the USDA. The au-thors gratefully acknowledge the technical assistance of MauroCardona, Linnea Johnson, Neil Rasmussen, and Ron Reed.
REFERENCESAnamthawat-Jonsson, K., and S. Bodvarsdottir. 2001. Genomic and
genetic relationships among species of Leymus (Poaceae: Triticeae)inferred from 18S–26S ribosomal genes. Am. J. Bot. 88:553–559.
Babb, S., and G.J. Muehlbauer. 2003. Genetic and morphologicalcharacterization of the barley uniculm2 (cul2) mutant. Theor. Appl.Genet. 106:846–857.
Bailey, P.C., R.S. McKibbin, J.R. Lenton, M.J. Holdsworth, J.E. Flint-ham, and M.D. Gale. 1999. Genetic map locations for orthologousVp1 genes in wheat and rice. Theor. Appl. Genet. 98:281–284.
Becker, J., and M. Heun. 1995. Barley microsatellites: Allele variationand mapping. Plant Mol. Biol. 27:835–845.
Borner, A., V. Korzun, S. Malyshev, V. Ivandic, and A. Graner. 1999.Molecular mapping of two dwarfing genes differing in their GAresponse on chromosome 2H of barley. Theor. Appl. Genet. 99:670–675.
Churchill, G.A., and R.W. Doerge. 1994. Empirical threshold valuesfor quantitative trait mapping. Genetics 138:963–971.
Devos, K.M., J. Dubcovsky, J. Dvorak, C.N. Chinoy, and M.D. Gale.1995. Structural evolution of wheat chromosome 4A, 5A, and 7Band its impact on recombination. Theor. Appl. Genet. 91:282–288.
Devos, K.M., and M.D. Gale. 2000. Genome relationships: The grassmodel in current research. Plant Cell 12:637–646.
Dubcovsky, J., D. Lijavetzky, L. Appendina, and G. Tranquilli. 1998.Comparative RFLP mapping of Triticum monococcum genes con-trolling vernalization requirement. Theor. Appl. Genet. 97:968–975.
Dubcovsky, J., M.C. Luo, G.Y. Zhong, R. Bransteitter, A. Desai, A.Kilian, A. Kleinhofs, and J. Dvorak. 1996. Genetic map of diploid
Reproducedfrom
CropScience.PublishedbyCropScienceSociety
ofAmerica.Allcopyrights
reserved.
2537LARSON ET AL.: LEYMUS WILDRYES

wheat, Triticum monococcum L., and its comparison with maps ofHordeum vulgare L. Genetics 143:983–999.
Derner, J.D., and D.D. Briske. 2001. Below-ground carbon and nitro-gen accumulation in perennial grasses: A comparison of caespi-tose and rhizomatous growth forms. Plant Soil 237:117–127.
Dewey, D.R. 1972. Cytogenetics of tetraploid Elymus cinereus, E.triticoides, E. multicaulis, E. karatviensis, and their F1 hybrids. Bot.Gaz. 133:51–57.
Dewey, D.R. 1984. The genomic system of classification as a guide tointergeneric hybridization with the perennial Triticeae. p. 209–279.In J.P. Gustafson (ed.) Proc. of the 16th Stadler Genetics Sym-posium. Plenum, New York.
Draye, X., Y.R. Lin, X.Y. Qian, J.E. Bowers, G.B. Burrow, P.L.Morrell, D.G. Peterson, G.G. Presting, S.X. Ren, R.W. Wing, andA.H. Paterson. 2001. Toward integration of comparative genetic,physical, diversity, and cytomolecular maps for grasses and grains,using the sorghum genome as a foundation. Plant Physiol. 125:1325–1341.
Doebley, J., A. Stec, and L. Hubbard. 1997. The evolution of apicaldominance in maize. Nature 386:485–488.
Firn, R.D., C.Wagstaff, and J. Digby. 2000. The use of mutants to probemodels of gravitropism. J. Exp. Bot. 51:1323–1340.
Franckowiak, J.D. 1996. Revised linkage maps for morphologicalmarkers in barley,Hordeum vulgare. Barley Genet. Newsl. 26:9–22.
Galweiler, L., C. Guan, A. Muller, E. Wisman, K. Mendgen, A. Ye-phremov, and K. Palme. 1998. Regulation of polar auxin transportby AtPIN1 in Arabidopsis vascular tissue. Science 282:2226–2230.
Graner, A. 2004. GrainGenes map data report: Barley, I3F. In Grain-genes: A database for Triticeae and Avena. http://wheat.pw.usda.gov/cgi-bin/graingenes/report.cgi?class=mapdata&name=Barley%2C%20IxF (verified 24 July 2006).
Graner, A., A. Jahoor, J. Schondelmaier, H. Siedler, K. Pillen, G.Fischbeck, G. Wenzel, and R.G. Herrmann. 1991. Construction ofan RFLP map of barley. Theor. Appl. Genet. 83:250–256.
Gottwald, S., N. Stein, A. Borner, T. Sasaki, and A. Graner. 2004. Thegibberellic-acid insensitive dwarfing gene sdw3 of barley is locatedon chromosome 2HS in a region that show high colinearity with ricechromosome 7L. Mol. Gen. Genom. 271:426–436.
Heun, M., A.E. Kennedy, J.A. Anderson, N.L.V. Lapitan, M.E. Sor-rells, and S.D. Tanksley. 1991. Construction of a restriction frag-ment length polymorphism map for barley (Hordeum vulgare).Genome 34:437–447.
Hole, D.J., K.B. Jensen, R.R.C. Wang, and S.M. Clawson. 1999. Mo-lecular marker analysis of Leymus flavescens and chromosomepairing in Leymus flavescens hybrids (Poaceae: Triticeae). Int. J.Plant Sci. 160:371–376.
Holland, J.B., W.E. Nyquist, and C.T. Cervantes-Marinez. 2003. Es-timating and interpreting heritability for plant breeding: An update.Plant Breed. Rev. 22:9–111.
Holm, L.G., D.L. Plucknett, J.V. Pancho, and J.P. Herberger. 1977. Theworld’s worst weeds: distribution and biology. Univ. Press of Ha-waii, Honolulu.
Hu, F.Y., D.Y. Tao, E. Sacks, B.Y. Fu, P. Xu, J. Li, Y. Yang, K. McNally,G.S. Khush, A.H. Paterson, and Z.K. Li. 2003. Convergent evo-lution of perenniality in rice and sorghum. Proc. Natl. Acad. Sci.USA 100:4050–4054.
International Rice Genome Sequencing Project. 2005. The map-basedsequence of the rice genome. Nature 436:793–800.
Jansen, R.C. 1993. Interval mapping of multiple quantitative trait loci.Genetics 135:205–211.
Jansen, R.C. 1994. Controlling the type I and type II errors in mappingquantitative trait loci. Genetics 138:871–881.
Jansen, R.C., and P. Stam. 1994. High resolution of quantitative traitsinto multiple loci via interval mapping. Genetics 136:1447–1455.
Jensen, K.B., Y.F. Zhang, and D.R. Dewey. 1990. Mode of pollinationof perennial species of the Triticeae in relation to genomicallydefined genera. Can. J. Plant Sci. 70:215–225.
Jordan, D.R., R.E. Casu, P. Besse, B.C. Carroll, N. Berding, and C.L.McIntyre. 2004. Markers associated with stalk number and suck-ering in sugarcane colocate with tillering and rhizomatousnessQTLs in sorghum. Genome 47:988–993.
Juttner, J., D. Olde, P. Langridge, and U. Baumann. 2000. Cloning andexpression of a distinct subclass of plant thioredoxins. Eur. J. Bio-chem. 267:7109–7117.
Korzun, V., S. Malyshev, A.V. Voylokov, andA. Borner. 2001. A geneticmap of rye (Secale cereale L.) combining RFLP, isozyme, protein,microsatellite and gene loci. Theor. Appl. Genet. 102:709–717.
Lander, E.S., and D. Botstein. 1989. Mapping Mendelian factors un-derlying quantitative traits using RFLP linkage maps. Genetics 121:185–199.
Langridge, P., U. Baumann, and J. Juttner. 1999. Revisiting and re-vising the self-incompatibility genetics of Phalaris coerulescens.Plant Cell 10:1826–1827.
La Rota, M., and M.E. Sorrells. 2004. Comparative DNA sequenceanalysis of mapped wheat ESTs reveals the complexity of ge-nome relationships between rice and wheat. Funct. Integr. Genom.4:34–46.
Laurie, D.A., N. Pratchett, J.H. Bezant, and J.W. Snape. 1995. RFLPmapping of five major genes and eight quantitative trait loci con-trolling flowering time in a winter 3 spring barley (Hordeum vul-gare) cross. Genome 38:575–585.
Lawrence, C.J., Q. Dong, M.L. Polacco, T.E. Seigfried, and V. Brendel.2004. MaizeGDB, the community database for maize genetics andgenomics. Nucleic Acids Res. 32:D393–D397.
Lehmann, E.L. 1975 Nonparamentrics. McGraw-Hill, New York.Lem, P., and J. Lallemand. 2003. Grass consensus STS markers: An
efficient approach for detecting polymorphism in Lolium. Theor.Appl. Genet. 107:1113–1122.
Li, X., N. Paech, J. Nield, D. Haman, and P. Langridge. 1997. Self-incompatibility in the grasses: Evolutionary relationships of the Sgene from Phalaris coerulescens to homologous sequences in othergrasses. Plant Mol. Biol. 34:223–232.
Li, X., J. Nield, D. Hayman, and P. Langridge. 1994. Cloning a putativeself-incompatibility gene from the pollen of the grass Phalariscoerulescens. Plant Cell 6:1923–1932.
Li, Z., A.H. Paterson, S.R.M. Pinson, and J.W. Stansel. 1999. RFLPfacilitated analysis of tiller and leaf angles in rice (Oryza sativa L.).Euphytica 109:79–84.
Liu, Z.W., R.M. Biyashev, and M.A. Saghai Maroof. 1996. Develop-ment of simple sequence repeat DNAmarkers and their integrationinto a barley linkage map. Theor. Appl. Genet. 93:869–876.
McCarty, D.R., T. Hattori, C.B. Carson, V. Vasil, M. Lazar, and I.K.Vasil. 1991. The Viviparous–1 developmental gene of maize en-codes a novel transcriptional activator. Cell 66:895–905.
Mano, Y., B.E. Sayed-Tabatabaei, A. Graner, T. Blake, F. Takaiwa, S.Oka, and T. Kobatsuda. 1999. Map construction of sequence-taggedsites (STSs) in barley (Hordeum vulgare L.). Theor. Appl. Genet.98:937–946.
Miura, K., M. Ashikari, M. Matsuoka, and Y.I.C. Hsing. 2003. Map-ping of the lazy gene, la. Rice Genet. Newsl. 20:29–30.
Paterson, A.H., K.F. Schertz, Y.R. Lin, S.C. Liu, and Y.L. Chang. 1995.The weediness of wild plants: Molecular analysis of genes in-fluencing dispersal and persistence of johnsongrass, Sorghum hale-pense (L.). Pers. Proc. Natl. Acad. Sci. USA 92:6127–6131.
Patterson, J.T., S.R. Larson, and P.G. Johnson. 2005. Genome rela-tionships in polyploid Poa pratensis and other Poa species inferredfrom phylogentic analysis of nuclear and chloroplast DNA se-quences. Genome 48:76–87.
Peng, J., D.E. Richards, N.M. Hartley, G.P. Murphy, K.M. Devos, J.E.Flintham, J. Beales, L.J. Fish, A.J. Worland, F. Pelica, D. Sudhakar,P. Christou, J.W. Snape, M.D. Gale, and N.P. Harberd. 1999. ‘Greenrevolution’ genes encode mutant gibberellin response modulators.Nature 400:256–261.
Sahrawy, M., V. Hecht, J. Lopez-Jarmillo, A. Chueca, Y. Chartier, andY. Meyer. 1996. Intron position as an evolutionary marker of thio-redoxins and thioredoxin domains. J. Mol. Evol. 42:422–431.
Sedbrook, J.C., R. Chen, and P.H. Masson. 1999. ARG1 (Altered Re-sponse to Gravity) encodes a DNAJ-like protein that potentiallyinteracts with the cytoskeleton. Proc. Natl. Acad. Sci. USA 96:1140–1145.
Sims, P.L., J.S. Singh, and W.K. Lauenroth. 1978. The structure andfunction of ten western North American grasslands. I. Abiotic andvegetation characteristics. J. Ecol. 66:251–281.
Snape, J.W., K. Butterworth, E. Whitechuch, and A.J. Worland. 2001.Waiting for fine times: Genetics of flowering time in wheat.Euphytica 119:185–190.
Snedecor, G.W., and W.G. Cochran. 1980. Statistical methods, Seventhed. Iowa State Univ. Press, Ames, IA.
Reproducedfrom
CropScience.PublishedbyCropScienceSociety
ofAmerica.Allcopyrights
reserved.
2538 CROP SCIENCE, VOL. 46, NOVEMBER–DECEMBER 2006

Stebbins, G.L., and M.S. Walters. 1949. Artificial and natural hybridsin the Gramineae, tribe Hordeae. III. Hybrids involving Elymuscondensatus and E. triticoides. Am. J. Bot. 36:291–301.
Strake, S., and A. Borner. 1998. Molecular mapping of the photope-riod response gene ea7 in barley. Theor. Appl. Genet. 97:797–800.
Tabachnick, B.G., and L.S. Fidell. 1996. Using multivariate statistics(3rd ed.). New York: Harper Collins.
Takahashi, R., J. Hayashi, T. Konishi, and I. Moriya. 1975. Linkageanalysis of barley mutants. Barley Genet. Newsl. 5:56–60.
Taylor, C., K. Madsen, S. Borg, M.G. Møller, B. Boelt, and P.B. Holm.2001. The development of sequence-tagged sites (STSs) in Loliumperenne L.: The application of primer sets derived from othergenera. Theor. Appl. Genet. 103:648–658.
Van Deynze, A.E., J.C. Nelson, E.S. Yglesias, S.E. Harrington, D.P.Braga, S.R. McCouch, and M.E. Sorrells. 1995. Comparative map-ping in grasses. Wheat relationships. Mol. Gen. Genet. 248:744–754.
Van Ooijen, J.W. 1992. Accuracy of mapping quantitative trait loci inautogamous species. Theor. Appl. Genet. 84:803–811.
VanOoijen, J.W. 1999. LOD significance thresholds forQTLanalysis inexperimental populations of diploid species. Heredity 83:613–624.
Van Ooijen, J.W. 2004. MapQTL W 5, Software for the mapping ofquantitative trait loci in experimental populations. Kyazma B.V.,Wageningen, the Netherlands.
Voorrips, R.E. 2002. MapChart: Software for the graphical presenta-tion of linkage maps and QTLs. Heredity 93:77–78.
Ware, D., P. Jaiswal, J. Ni, X. Pan, K. Chang, K. Clark, L. Teytelman, S.Schmidt, W. Zhao, S. Cartinhour, S. McCouch, and L. Stein. 2002.Gramene: A resource for comparative grass genomics. NucleicAcids. Res. 30:103–105.
Wu, X.L., S.R. Larson, Z.M. Hu, A.J. Palazzo, T.A. Jones, R.R.C.Wang,K.B. Jensen, and N.J. Chatterton. 2003. Molecular genetic linkagemaps for allotetraploid Leymus (Triticeae). Genome 46:627–646.
Yan, L.L., A. Loukoianov, A. Blechl, G. Tranquilli, W. Ramakrishna, P.SanMiguel, J.L. Bennetzen, V. Echenique, and J. Dubcovsky. 2004.The wheat VRN2 gene is a flowering repressor down-regulated byvernalization. Science 303:1640–1644.
Yan, L., A. Loukoianov, G. Tranquilli, M. Helguera, T. Fahima, and J.Dubcovsky. 2003. Positional cloning of the wheat vernalizationgene VRN1. Proc. Natl. Acad. Sci. USA 100:6263–6268.
Yang, T.Z., X.K. Zhang, H.W. Liu, and Z.H. Wang. 1995. Chromosomalarm location of a dominant dwarfing gene Rht21 in XN0004 of com-mon wheat. p. 839–842. In Z.S. Li and Z.Y. Xin (ed.) Proc. 8th Int.Wheat Genet. Symp. China Agricultural Scientech Press, Beijing.
Yu, J.K., T.M. Dake, S. Singh, D. Benscher, W. Li, B. Gill, and M.E.Sorrells. 2004. Development and mapping of EST-derived simplesequence repeat markers for hexaploid wheat. Genome 47:805–818.
Reproducedfrom
CropScience.PublishedbyCropScienceSociety
ofAmerica.Allcopyrights
reserved.
2539LARSON ET AL.: LEYMUS WILDRYES
Reproducedfrom
CropScience.PublishedbyCropScienceSociety
ofAmerica.Allcopyrights
reserved.

E36M61.254E38M49.066E41M59.098E36M59.167E36M59.062E38M60.202P33M47.258P33M60.360P33M47.161P42M62.187P42M61.166P42M62.181E38M60.182E37M61.306E41M49.052E36M61.292
E41M48.162bP44M62.137P33M62.346E36M50.222E41M47.300E38M47.253
TRX11RE38M49.319E41M48.110E36M48.061
P35M60.248aP44M62.266P35M62.353P33M50.305E41M60.094E37M61.167E38M49.396E38M47.293
P44M62.331bE36M49.321E36M48.271E37M62.278E41M48.389E36M62.240P44M62.293
E41M60.123aE41M49.217E41M61.321
E37M49.321
E41M49.220E41M49.072
P35M50.213a
E38M49.140
E36M50.254
P33M50.281P33M59.158
E41M47.148E38M60.107a
P44M49.388E38M59.101E38M49.146E41M59.163E38M60.159P42M61.114E37M61.344
HVA.0941HE41M61.122E37M47.196P42M61.218P33M62.354E41M61.398P35M59.188P35M62.180E41M59.310
P33M61.137E38M60.108P35M61.177E38M49.399P33M61.233P33M47.234P44M62.119P44M62.368E37M47.327E41M49.134P35M61.174E38M60.311E38M60.294P33M47.273
0 1 2 3 4
LG1a--TTC1
P33M47.258
E37M61.306
E36M61.377
E38M49.066E36M50.397E36M61.291P33M60.147E41M59.335E41M61.367P33M60.360P35M61.361P33M47.161E38M60.181E36M59.167E36M61.231E41M61.271P42M62.293bP33M61.331E41M48.388E38M49.396E37M61.173E36M49.287E38M47.293E37M49.146E41M59.124E38M59.215P33M62.346E36M61.286E41M59.193E36M48.163E41M47.113E41M60.123aE41M49.217E38M49.266E37M49.361E37M49.321E37M60.153E38M60.074E38M59.330E41M59.082E41M49.072E37M60.146
P42M62.153
E37M61.182
E41M60.361
E36M59.217
E41M47.148
E38M60.162
BCD1150 1B(A)
E38M60.107aE36M59.239P35M59.211E41M59.163P44M62.164bHVA.094 1HE38M59.101BCD1562 1BD(A)E41M47.110P33M62.354P42M61.218E37M47.196E38M60.291E41M61.398E36M59.296E41M60.195P35M61.177GDM126.146 1DE38M60.108E41M47.163P44M62.368P33M47.234P44M62.124P33M62.138E41M49.134E37M47.327E38M60.294E38M60.311E41M62.184P35M50.127
0 1 2 3 4
LG1a--TTC2
E36M61.336
P33M47.280bP33M50.162P35M59.213E38M47.185
P42M61.072
P33M60.290
E36M49.306E36M59.250E38M60.177E36M48.225E36M48.069E41M49.278E41M59.271
E38M47.222aE41M48.322
P44M62.164aE37M47.270
E36M62.363
E41M47.129
E41M59.197
E36M61.191E38M49.283bWMC336.3881ADP35M62.350E41M61.265E37M47.126E36M62.140E37M60.103P44M62.378P35M61.394P44M49.200P33M61.367P35M49.334P35M49.311P33M61.198P33M47.328P35M49.139P42M61.117E36M61.323E41M48.245E38M60.213E36M62.346E41M62.189E41M61.385E37M49.051E37M47.319E37M47.320E41M47.355E41M60.360E37M49.079E37M61.073E36M59.317E41M61.141E38M49.269E37M60.097E37M61.095E38M59.204
E41M60.336aE41M47.237E37M49.092E36M61.267P44M62.209
P33M50.246bE38M49.214P33M62.271
P44M62.351
E38M49.241E38M59.153E38M49.386E36M62.057E41M48.147P44M49.133P35M61.141E36M62.192E41M47.078
E38M49.256
P35M60.119
0 1 2 3 4
LG1b--TTC1
P33M47.280b
P33M50.162P33M62.220
E36M61.336
E36M48.168
E41M49.278E37M62.244
P33M60.290
E36M48.257bE37M62.270
E41M47.119
E38M47.222a
P35M50.142E41M47.130P44M49.228aE41M59.090
P33M59.251
E36M61.191
E38M47.394E41M61.226P42M62.062E38M49.283bP35M62.350E37M60.097E36M61.240E36M62.140E37M60.103E37M47.319E37M62.388bP35M61.396E41M62.173E38M60.213E36M62.346E36M61.323E41M61.385E41M48.245P33M61.198E37M62.232E41M48.131P35M59.154P44M62.105P33M61.367P42M61.117P33M62.319E38M47.229E41M47.355P33M50.154E38M59.317E37M61.095P33M47.255E37M62.201bE37M61.290E37M47.151E37M47.150E41M61.252E37M49.092E36M61.192E41M49.171E36M61.267
E41M48.053E37M60.284
P33M59.118a
P33M50.246b
E36M62.150
P33M50.180b
P44M49.250E37M60.259E38M49.241
P44M49.133P42M62.312P42M61.157E36M62.192E41M47.078E41M62.337
E38M49.063a
0 1 2 3 4
LG1b--TTC2
0
5
10
15
20
25
30
35
40
45
50
55
60
65
70
75
80
85
90
95
100
105
110
115
120
125
130
135
Genome-wide QTL interval mapping (IM) and restricted multiple QTL model(rMQM) mapping in the full-sib Leymus TTC1 and TTC2 families based on log of the odds (LOD) for circumference of plant spreading (CIRC), proportion of bolting culms (BOLT), anthesis date (ANTH), and plant height (HGHT) based averages over 2002, 2003, and 2004. A threshold value of 3.3 LOD is shown for reference.
CIRC_IM
CIRC_rMQM
BOLT_IM
BOLT_rMQM
ANTH_IM
ANTH_rMQM
HGHT_IM
HGHT_rMQM
Reproducedfrom
CropScience.PublishedbyCropScienceSociety
ofAmerica.Allcopyrights
reserved.

P33M62.285E41M48.255P33M48.139P33M61.175P33M61.312P33M47.078P35M62.187P35M49.202P33M61.213P35M61.225E36M48.172E38M60.263E37M61.155E41M59.077E38M47.364E36M61.138E41M59.345P44M62.223E36M61.175P44M49.246P33M59.256E36M50.247
E38M60.056
P35M62.365
E36M59.221
E38M59.282
P44M62.228
E41M61.352
XANTHA.2702H
E36M50.224E38M47.180P33M48.212P33M50.249E37M60.192E41M47.249E36M59.234E36M61.361P42M61.367E36M49.271E37M60.342E41M62.194E37M47.145E41M61.188E37M62.228E36M61.297E41M49.092E36M61.253P33M61.216CNL045.1542AE37M62.182E36M48.098P35M50.385P33M48.215
P33M61.203E41M62.152E41M50.202
E37M61.232E37M62.252
E36M48.248
P33M48.224
E41M60.123b
P35M50.279E37M49.102
P33M50.180cE36M48.202
E36M59.222
E41M61.099E41M47.139
E36M48.356
P33M59.242
E41M59.318P33M59.318
E38M49.074
P33M62.231
E38M47.076a
E41M59.154
E41M47.356P42M61.185E36M49.339P42M61.122P42M61.196P33M48.126P35M50.307
GWM382.0952ABDP33M62.291E38M49.152P35M62.111P35M49.140
P44M62.088aE36M49.348E36M48.075E36M49.366E38M49.067E41M48.112E36M59.182E41M47.285E38M59.074
0 1 2 3 4 5 6 7 8 9 10
LG2a--TTC1P33M61.175E38M47.364E36M48.172E37M61.246E41M48.255E38M60.263E37M61.155P33M61.312P42M61.145P33M48.139P35M49.202P33M61.212P33M59.256E38M59.217P44M62.223P35M62.178P44M49.246E41M59.184E36M61.221E38M60.056P33M62.364P35M49.297P35M62.365E36M48.305
P44M62.228
E37M62.072P42M62.303P42M62.298
E36M50.224
E36M61.152a
P33M48.212E37M60.192E41M60.139
E41M48.070E36M61.361E36M61.297E41M61.188E41M61.254E41M62.194E41M48.085aE37M60.342E37M62.228E38M60.087E38M60.069E41M49.092P42M61.367E41M62.319P33M61.216P33M60.143
E41M48.062a
P33M48.154
E38M59.329
E37M62.252
E41M60.238
P35M50.279
E37M49.102
E36M49.130
E36M59.222
E41M61.099
E36M48.356
P33M50.246a
P35M62.377E38M47.076aP33M62.231E41M60.088E36M62.339E41M47.357P33M47.243P44M49.149P33M62.296E41M48.060P33M62.333P33M48.126P35M49.242E37M49.160GWM382.095 2ABDP35M62.399P35M60.144P33M62.291E36M49.366E41M47.132E41M48.112E41M47.131P44M49.369P42M62.146E41M47.214P44M49.323P33M48.397
P35M50.258E41M48.188
0 1 2 3 4 5 6
LG2a--TTC2
E36M61.248
E38M60.153
E41M48.241a
E36M59.293E41M49.131E36M49.311E36M59.392E38M47.072P35M62.194P33M60.125P33M50.152P33M48.328P35M50.208P33M48.394P44M62.299
P44M62.176
P33M62.117
E41M61.111a
XANTHA.3952H
P33M47.345P35M60.227
P42M61.142
MWG763.2772H
E37M60.188P35M62.320E37M61.110P33M60.130E37M62.131E37M60.297E41M50.159E37M62.272E37M60.257E38M60.280E41M60.172E41M49.215E37M49.304P35M59.253P33M48.079P33M60.249P35M61.364P33M61.285E37M62.183E36M59.171E41M48.226E38M60.234E37M62.261E38M60.130E37M62.136E38M47.105E36M49.313P33M59.241P42M62.115E37M61.141P44M49.223E36M61.157E37M49.147CNL045.1722AP33M60.180
E41M60.293aE37M47.370E37M60.294P33M59.278
E41M61.119P33M59.172
E41M61.359
P33M50.180aE36M49.266
E41M47.359
E36M61.091P35M60.272
E37M49.165
E37M62.269P35M59.372P33M60.268
P33M48.350E37M60.186
P33M61.071b
E41M61.156
P42M61.081E38M59.220E36M49.092P35M61.243P33M60.217P35M49.090
GWM382.1262ABDP33M62.394E41M47.155E38M59.095E41M60.144E37M47.356E38M59.179P42M61.140
E41M59.126aE38M47.278
P33M48.067
0 1 2 3 4 5
LG2b--TTC1E41M49.131E36M61.248
E36M59.293E41M47.204E36M50.311P44M49.095bP33M50.227P33M50.152P35M62.194P35M62.163E41M62.160E37M49.270P44M49.258E37M61.102
P35M50.208P33M48.392
E38M60.153
E41M59.094
E37M60.172b
P35M60.227E37M60.257
E36M61.157E37M62.272P33M59.241E37M60.188P35M60.248bE41M59.257P33M61.285P33M60.130E41M48.251TRX1 1RE37M62.183P35M61.364P33M48.079P35M59.253P33M60.250E37M62.260E36M59.171E37M62.212E36M62.145E41M49.247E41M61.350E37M61.281E37M61.141E37M49.147E36M62.097P33M60.180E37M47.143bE36M49.179P33M59.278
P35M60.280
E41M61.119
P33M59.172
E37M62.269
P33M50.180a
P42M62.067
P35M60.272
E41M59.323
E37M49.165
P33M48.348
E37M47.198
P42M61.081
E38M59.220E36M49.109E37M47.056P35M61.243P44M49.286P33M60.217E41M47.155E38M59.095E41M60.144E37M47.356E38M59.179P33M50.245E41M59.126aGWM382.126 2ABDP33M48.067E38M47.278
P42M61.140
0 1 2 3 4
LG2b--TTC2
0
5
10
15
20
25
30
35
40
45
50
55
60
65
70
75
80
85
90
95
100
105
110
115
120
125
130
135
140
145
150
155
160
165
HGHT_IM
HGHT_rMQM
CIRC_IM
CIRC_rMQM
BOLT_IM
BOLT_rMQM
ANTH_IM
ANTH_rMQM
Reproducedfrom
CropScience.PublishedbyCropScienceSociety
ofAmerica.Allcopyrights
reserved.

P33M50.250
E38M49.363E38M47.228P33M47.131P33M48.194P35M59.195P33M60.104P42M61.294P42M62.178
E38M59.298aP35M61.158
P35M62.385P44M62.197aP35M61.082E36M62.130P44M49.253E37M62.257E38M49.084E37M47.128E41M59.268E37M47.305P33M62.144E37M62.096P33M60.308
E38M47.214E36M48.164P42M61.232P35M50.314P35M62.225
SIP1.3243H
GWM005.0803A
E41M49.122b
E41M62.223
E38M60.359
E41M47.071E41M49.090E36M61.330
E38M47.076bE41M47.225
E41M48.133P33M50.328
P33M61.149aE41M61.290E37M49.132
P35M59.284
P42M61.316E37M61.350
E37M60.356a
E41M48.102P33M47.097
P33M60.192
E41M61.220P44M62.204
VP1i5.4063ABDE37M60.083P35M60.135
P44M62.360
E37M47.225
E36M59.219E41M59.365E41M60.296P33M48.378P33M50.149P33M48.119P33M50.285P44M49.324P44M49.197
P35M49.270P33M47.111P35M61.089P35M62.147E38M47.359E37M61.191E36M50.170E36M48.308P44M62.093P33M61.129
E37M47.224
E41M62.069
P44M49.139
E37M60.302
P33M59.118b
0 1 2 3 4
LG3a--TTC1
E41M48.390
E38M47.228E41M59.148
P42M62.177
P44M49.331
P35M62.385E41M61.234aE41M61.235P33M60.305
E41M62.350
E38M49.084BCD1532 3AB(C)
E41M60.111P33M62.144
SIP1.291 3H
E41M62.223E36M48.164P42M61.232E36M61.311GWM005.080 3AP35M62.225E36M62.302P35M50.154E41M49.122bE36M48.101E37M47.226E38M60.359E41M47.071E36M59.287E36M61.330
E41M47.225
E38M47.076bP35M62.199E37M47.302P33M50.328P33M61.149aE41M61.290E36M61.303E41M61.127E41M48.133
P35M59.284
E38M47.165
E37M61.349
E36M61.243
E37M49.349
P33M47.097
E36M62.203
E41M48.102P33M60.192
E38M60.278P44M49.324VP1i5.406 3ABDE41M61.220E37M60.083P44M62.204
E36M49.248
P44M62.360
E37M47.225E36M59.219P33M50.146E36M62.090E38M47.185E37M49.141E36M48.167
P33M61.174E41M48.248E37M49.118P35M49.224E41M62.341E37M49.201E41M61.063P35M61.089P35M62.147E37M60.303E41M49.232
P33M61.129P44M62.093
P44M49.139
E37M47.224
E37M49.355E41M62.069
P35M59.174
P35M60.074a
P33M59.118bE41M61.107
0 1 2 3 4 5
LG3a--TTC2
P35M49.082
P33M47.228
E36M61.339a
E41M61.394P33M62.393P33M47.179P33M47.279P44M62.334
E37M62.274
E41M60.080b
P35M50.120
E41M49.135E41M47.167
P42M61.197
SIP1.4133H
E41M60.343
E38M49.057
P33M47.072
E36M62.338E41M60.166
P33M47.073
E37M47.386P44M49.110
P35M60.074bE38M47.374E37M49.329P33M47.167P33M62.190E36M62.173E37M61.199E37M60.339E36M61.263P33M61.153E36M59.253P44M49.329E36M61.097E37M62.082E37M60.203E36M61.141E37M49.303E41M61.131E36M49.351E36M50.351E38M60.242E41M59.113P35M49.242E36M61.234E38M60.316E37M47.124E38M47.140E41M49.163E38M60.305E38M47.192
P35M50.264
E37M60.082
P33M60.207E41M49.302
E41M47.134P35M62.242E36M62.227E41M61.077P33M50.345E37M62.162
P33M47.099VP1i2.3943ABD
E37M47.326E38M59.249E36M48.204E37M47.263E41M59.206E41M62.204P42M62.249P33M48.155E36M59.262E41M47.173
E41M59.325bE37M49.358
CDO14014B(F)E41M49.285E41M59.210
P33M60.393
0 1 2 3 4
LG3b--TTC1E36M59.261P33M62.343P33M47.310P33M47.179P33M47.280aE41M60.156P33M62.393CDO460 3ABR(C)E36M49.206E36M61.092E41M48.085bE41M61.313aP35M49.082
E41M61.095
E41M62.354
E41M49.135E41M47.167P42M61.197
P35M50.120
SIP1.413 3HE41M62.154
E38M49.057
E41M60.166
E36M62.338
P33M47.072P33M47.073P33M47.167E37M47.386P44M49.110E38M47.374E37M61.199E37M60.339P33M62.190E37M49.329P33M61.153E36M62.173P33M50.116E36M49.351E36M59.253E36M61.097E36M61.141E37M60.203P44M49.329E37M60.200bE37M62.082E36M61.263E41M61.131E37M49.303E36M61.234E38M47.140E38M60.242E37M47.242E36M48.066E36M61.206E38M60.316
E38M49.064
E38M47.172
E41M60.286
P33M60.207
E41M49.304P33M60.227
E36M62.227
E37M62.162
E37M47.326E36M48.284
E41M62.204
E41M62.260
P42M62.249
P33M59.245E37M49.179
E41M59.222
E36M50.237a
E37M49.358E38M59.065
E37M62.235P33M62.090E37M62.075
0 1 2 3 4
LG3b--TTC2
0
5
10
15
20
25
30
35
40
45
50
55
60
65
70
75
80
85
90
95
100
105
110
115
120
125
130
135
140
145
150
155
160
165
170
CIRC_IM
CIRC_rMQM
BOLT_IM
BOLT_rMQM
ANTH_IM
ANTH_rMQM
HGHT_IM
HGHT_rMQM
Reproducedfrom
CropScience.PublishedbyCropScienceSociety
ofAmerica.Allcopyrights
reserved.

E38M59.239
P33M59.260P35M62.140E41M61.172E41M49.283E41M49.223E36M62.349P42M61.073
P44M49.095aE41M49.277
E37M47.143a
E38M60.090
P44M62.317P44M62.331aE38M60.091
MipsA.2844HKSU154.1374BE41M62.396KSU154.1374BE36M62.210
P42M62.164E38M59.346P35M61.277E41M60.069P35M59.112
GWM165.2024ABD
E41M62.393
E38M47.063
E41M60.132aE36M61.342E41M49.143E41M49.142E41M50.282E36M49.353E38M47.103E36M61.287
E41M61.084bE41M60.196E41M60.243E38M60.259E41M59.342E41M62.335E36M62.319CNL039.2293AE36M50.376E41M61.109P42M61.317E36M62.249E36M59.374
E41M48.185a
P33M59.302
P33M62.070
P33M47.126
E36M49.279
E36M62.211
TCP1Ns.4304HE37M60.375
P35M62.127
E41M48.195
E38M49.390E36M59.247
E41M61.212
0 1 2 3 4
LG4Ns--TTC1
E41M47.169
P33M59.260
E38M59.239
P33M61.316
E36M61.368
E38M47.398E41M49.223E41M49.283E41M61.172P35M62.140P42M61.073E41M49.277E36M59.152P42M62.263E41M62.219b
P44M62.317
E38M60.090
E36M61.289b
E41M61.373E41M60.069P33M59.133E38M59.346P35M61.277E41M47.205bE41M60.233P35M61.370GWM165.202 4ABDE38M59.387
E41M62.393E36M49.187E37M49.316P33M59.091E37M49.313E41M59.152P33M47.094E41M49.143E37M61.186E41M61.109E41M48.067E38M60.259E37M60.262E36M61.287E38M47.103E36M62.319E41M62.336E36M49.376P33M50.264E41M61.084bE36M50.376E41M60.247E38M60.122E37M49.174E36M50.353E41M60.196E37M60.325E36M49.353P35M62.370P33M62.070E36M62.249E41M59.342E37M60.183E37M61.332E37M62.286
P33M47.125
E36M62.211
E41M60.301
P35M62.127
TCP1Ns.430 4H
E38M49.390E38M60.223E37M60.252E41M61.380E41M47.384E36M59.247
E41M61.272
0 1 2 3 4 5 6
LG4Ns--TTC2P33M62.351E36M50.064E37M49.207E37M49.206P33M59.134
GWM006.1704BHP33M48.399E41M49.194E36M48.109E37M62.129E37M62.128P35M61.153
MLOH1A.3524HP35M59.230
P35M60.392P35M50.371P35M50.372P42M61.285E37M62.368E41M62.082E41M62.233P44M49.141P33M48.359E41M62.200P42M62.362E37M49.360
E41M61.381E36M62.087E41M47.150
GWM165.1724ABDE41M47.301E41M62.091E41M49.343E41M62.246E36M48.272
BCD250(F)E36M61.332P33M47.142PRC140.4094HP42M61.182P33M60.110E38M60.146E41M50.330E36M61.306E38M47.284E38M47.363E41M61.317E41M59.230E36M59.113E36M49.238E37M60.135E38M47.068E37M49.273KSU149.2404DE38M49.170E38M49.291E37M47.108E36M50.171E36M62.341E36M48.118E36M61.099E41M62.369
E38M60.396
TCP1Xm.4594H
KNOX.2394H
E38M59.100aE41M47.060P33M62.206E41M61.269E36M49.076E37M60.190E37M60.090P44M49.326P35M49.205P35M60.313P35M62.276P35M62.274
P33M61.096
0 1 2 3 4 5 6
LG4Xm--TTC1
E36M50.064
P33M62.351P33M59.134E41M61.186E41M49.198bP33M48.399E41M60.326
P35M50.371P35M50.372P35M60.392E37M47.304E38M60.325E41M62.235E41M62.082P35M49.187E41M62.239P33M48.359
E36M61.378E41M61.381
E41M47.150E41M47.301
E36M62.087
P35M50.262
E41M62.246E36M61.332
E41M61.317P35M62.123P33M60.110E38M60.146E36M61.306E38M47.284E41M59.230E36M59.113E36M49.238E41M61.340PRC140.409 4HKSU149.243 4DE37M47.108E38M49.291E36M48.118
E36M48.277E41M47.171P33M61.340
E41M47.172
E38M60.201KNOX.239 4H
E38M59.100aE41M47.060
TCP1Xm.459 4H
E38M60.196
E41M61.269E36M49.076
E38M47.198
E41M48.093P35M49.201
P33M61.273
P35M62.276
P35M62.274
0 1 2 3 4
LG4Xm--TTC2
0
5
10
15
20
25
30
35
40
45
50
55
60
65
70
75
80
85
90
95
100
105
110
115
120
125
130
135
140
145
CIRC_IM
CIRC_rMQM
BOLT_IM
BOLT_rMQM
ANTH_IM
ANTH_rMQM
HGHT_IM
HGHT_rMQM
Reproducedfrom
CropScience.PublishedbyCropScienceSociety
ofAmerica.Allcopyrights
reserved.

P33M62.133
P33M60.202P42M62.081P35M62.389TCP2Ns.1175HP33M62.093P33M62.097E36M59.169E37M62.172
E38M60.094
E37M61.149E41M60.357
E37M47.133E38M60.327
E41M61.091bE36M61.339bE36M48.180E36M59.225P33M60.366E37M60.287E36M61.383E36M62.311E38M59.268E37M61.204E37M60.398KSU171.2795BP33M50.158E41M48.280E37M47.378
E38M60.107bE41M47.281
E36M62.340
P33M62.259
E36M59.111
E36M48.254
P33M50.232
E36M62.189
E41M62.107E37M60.105E41M61.201E41M61.256E36M61.139E37M47.322
E36M62.180
P33M59.264P42M62.191E38M49.230E41M47.149P33M47.211E38M47.338E36M59.291P33M59.104E37M62.120
MWG2230.2855HP35M59.376P33M48.340
P35M61.295P33M62.323E41M61.194E38M47.084E41M60.244
E38M59.248
E41M50.064
P33M62.172P35M60.115P33M62.178E41M60.140E41M59.311E41M59.312E36M59.140E41M60.099
E36M59.265E37M47.153
E41M48.056bE37M47.244P42M62.112E37M60.235P33M60.077P42M61.143P33M48.283P33M48.258P35M49.344
VRN2.1994H-5AP33M50.292E36M49.319E36M50.319E36M48.207E41M61.279
P33M62.208
0 1 2 3 4
LG5Ns--TTC1P33M62.175E41M48.077E37M62.172
TCP2Ns.117 5H
P35M50.281P33M62.133P35M62.390E36M48.290
P42M62.381
P33M50.274E38M60.248E37M60.228E37M62.163
E38M60.094
E37M61.149
E41M60.285
E41M61.136a
E37M47.133E41M60.293bE36M61.383E41M61.091bE36M48.180E38M49.222E37M62.136E38M49.369E37M47.378P33M60.366KSU171.279 5BP33M50.340P33M50.158E38M59.268E41M49.140E37M62.273E36M62.311E38M60.107bE41M47.281E36M48.296E38M60.169P33M50.233E36M48.308E36M62.189E36M48.254E41M62.107E41M59.267E41M61.201E41M61.256
E37M47.136E37M47.324
E37M60.105
E41M59.199
E36M62.180P33M59.264
E36M59.312
E36M48.200
P35M49.251
E41M60.147
P33M48.361
E36M61.125
E41M60.058
CDO504Ns.086 5ABDHR
E38M47.084
E37M60.200aE36M49.138
E41M60.244E41M60.079
E38M59.248P33M62.172E36M59.265P35M60.115E37M49.352E41M48.056aE38M59.149E41M48.056bP42M62.112
E37M47.244
P33M60.077
P42M61.139E37M60.235P35M49.344P33M50.292VRN2.193 4H-5AP44M49.296
0 1 2 3 4
LG5Ns--TTC2
GDM101.1965BE38M59.137E41M59.333
E41M48.244aE36M59.308P42M61.162P33M61.123P33M59.169E41M49.094E37M60.156E41M61.224E37M49.251E41M49.120
E41M59.114aE38M49.136E36M50.284E41M48.336E41M47.258E38M47.147P35M50.363E36M49.284E38M60.204E38M47.313E41M60.205E36M61.082
E37M60.172aE38M49.245E41M60.164
GDM068.1145ABDP33M61.250E37M61.291E38M49.191P44M49.085P33M50.244E37M47.341E41M60.276E38M59.139E41M49.191E38M60.178P42M61.100P33M48.298E36M61.352
E41M48.062bP35M49.199P33M50.197
PSR128.4125ABDHRP35M62.264
E36M61.173E41M48.173E41M48.103E36M48.088
E41M59.130
E38M59.199
E41M48.119a
E37M60.092
CDO504Xm.1675ABDHR
E37M47.096
E37M49.183
E36M50.333
E37M61.190
P35M59.137
P44M62.088bE41M49.213P44M62.089P35M60.240E37M61.215E41M62.122P33M59.262P35M62.167P35M60.100P33M47.216E36M62.252
E37M49.100E37M47.063E37M49.063
E36M62.334a
P33M48.153
0 1 2 3 4
LG5Xm--TTC1E41M59.333E36M49.272E41M48.244aE36M59.308P33M61.089E37M61.269E36M61.218E37M49.073E41M47.364E37M60.156E41M49.094P35M61.131E41M59.260E41M49.120P33M59.200GWM205.142 5ADE37M49.250P33M59.169GDM101.197 5BP33M59.170P35M61.102TCP2Xm.252 5HE41M49.333E38M60.204E38M47.124E38M47.147E38M49.245E38M47.313E41M60.205E37M60.172aE36M59.133BCD1130 5ABD(F)BCD1707 (F)E36M50.284KSU220.308 7BE36M62.330E36M49.284E41M48.059P35M50.363E41M60.163P33M61.250E38M59.139P44M49.085P42M61.257E37M47.307E36M62.325P33M50.244E38M49.191E41M49.192GDM068.116 5ABDE41M60.267P33M48.298E38M49.207b
E37M60.307
E37M61.327
E41M48.103
E38M59.199
E36M49.188
CDO504Xm.167 5ABDHRE36M62.220
E41M60.229E37M49.077P35M59.102
E36M62.159
E36M50.333E36M49.333E37M61.190E41M59.303
P35M59.137
E41M49.213E41M62.122P44M62.088bP44M62.089
P35M60.240P35M60.239
P35M62.167
P44M62.296P35M60.100P33M47.216E41M48.075E37M62.155E37M49.100P35M49.065bP33M62.335
E36M48.158
0 1 2 3 4
LG5Xm--TTC2
0
5
10
15
20
25
30
35
40
45
50
55
60
65
70
75
80
85
90
95
100
105
110
115
120
125
130
135
140
145
150
155
160
165
CIRC_IM
CIRC_rMQM
BOLT_IM
BOLT_rMQM
ANTH_IM
ANTH_rMQM
HGHT_IM
HGHT_rMQM
Reproducedfrom
CropScience.PublishedbyCropScienceSociety
ofAmerica.Allcopyrights
reserved.
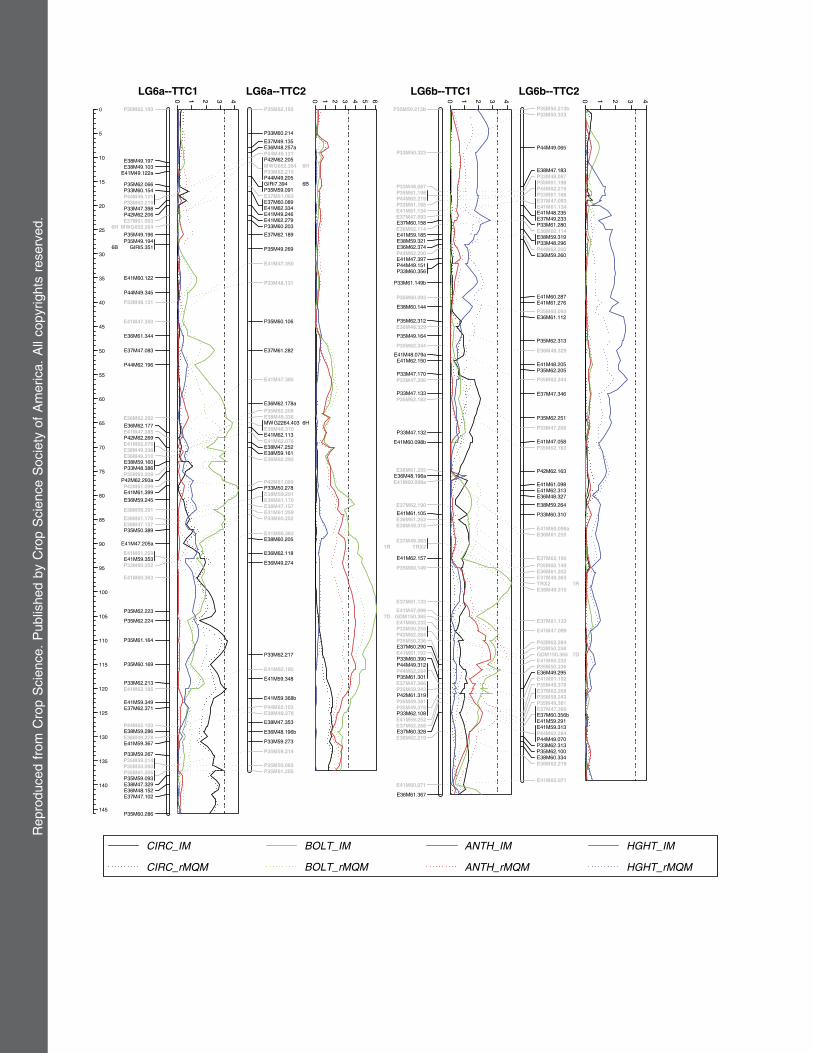
P35M62.193
E38M49.197E38M49.103
E41M49.122a
P35M62.066P33M60.154P44M49.121P33M62.219P33M47.398P42M62.206E37M61.063
MWG652.2646HP35M49.196P35M49.194
GIRi5.3516B
E41M60.122
P44M49.345
P33M48.131
E41M47.350
E36M61.344
E37M47.083
P44M62.196
E36M62.292E36M62.177E41M47.385P42M62.269E41M62.076E38M49.336E36M49.310E38M59.160P33M48.386P35M62.209
P42M62.293aP42M61.099E41M61.399
E36M59.245
E38M59.291
E36M61.170E38M47.157P35M50.389
E41M47.205a
E41M61.259E41M59.353P33M60.252
E41M60.363
P35M62.223
P35M62.224
P35M61.164
P35M60.169
P33M62.213E41M62.185
E41M59.349E37M62.371
P44M62.103E38M59.286E38M49.278E41M59.367
P33M59.267P35M59.214P35M50.093P35M61.205P35M59.093E38M47.329E36M48.152E37M47.102
P35M60.286
0 1 2 3 4
LG6a--TTC1
P35M62.193
P33M60.214
E37M49.135E36M48.257aP44M49.121P42M62.205MWG652.264 6HP33M62.219P44M49.205GIRi7.394 6BP35M59.091E37M61.063E37M60.089E41M62.334E41M49.246E41M62.279P33M60.203
E37M62.189
P35M49.269
E41M47.350
P33M48.131
P35M60.106
E37M61.282
E41M47.385
E36M62.178aP35M62.209E38M49.336MWG2264.403 6HE36M49.310E41M62.113E41M62.076E38M47.252E38M59.161E36M62.292
P42M61.099P33M50.278E38M59.291E36M61.170E38M47.157E41M61.259P33M60.252
E41M60.363E38M60.205
E36M62.118
E36M49.274
P33M62.217
E41M62.185
E41M59.348
E41M59.368b
P44M62.103E38M49.278
E38M47.353
E36M48.196b
P33M59.273
P35M59.214
P35M50.093P35M61.205
0 1 2 3 4 5 6
LG6a--TTC2
P35M50.213b
P33M50.323
P33M48.087P35M61.198P44M62.219P33M61.168E41M61.134E37M47.093E37M60.158E36M62.114E41M59.185E38M59.321E36M62.374P44M62.200E41M47.397P44M49.151P33M60.356
P33M61.149b
P35M60.093
E38M60.144
P35M62.312E36M48.329
P35M49.164
P35M62.344
E41M48.079aE41M62.150
P33M47.170P33M47.206
P33M47.133P35M62.183
P33M47.132
E41M60.098b
E36M61.255E36M48.196aE41M60.098a
E37M62.190
E41M61.105E36M61.252E38M49.315
E37M49.363TRX21R
E41M62.157
P35M60.149
E37M61.133
E41M47.099GDM150.3657DE41M60.232P33M50.258P42M62.284P35M50.236E37M60.290E41M61.192P33M60.390P44M49.312P44M62.284P35M61.301E37M47.366P35M59.243P42M61.319P35M49.381P35M49.378P33M62.108E41M59.252E37M62.268E37M60.328E36M62.219
E41M60.071
E36M61.367
0 1 2 3 4
LG6b--TTC1P35M50.213bP33M50.323
P44M49.065
E38M47.183P33M48.087P35M61.198P44M62.219P33M61.168E37M47.093E41M61.134E41M48.235E37M49.233P33M61.280E36M62.114E38M59.319P33M48.296P44M62.200E36M59.260
E41M60.287E41M61.276
P35M60.093E36M61.112
P35M62.313
E36M48.329
E41M48.205P35M62.205
P35M62.344
E37M47.346
P35M62.251
P33M47.206
E41M47.058P35M62.183
P42M62.163
E41M61.098E41M62.313E36M48.327
E38M59.264
P33M60.310
E41M60.098aE36M61.255
E37M62.190P35M60.149E36M61.252E37M49.363TRX2 1RE38M49.315
E37M61.133
E41M47.099
P42M62.284P33M50.258GDM150.365 7DE41M60.232P35M50.236E36M49.295E41M61.192P35M49.378E37M62.268P35M59.243P35M49.381E37M47.366E37M60.356bE41M59.291E41M59.313P44M62.284P44M49.070P33M62.313P35M62.100E38M60.334E36M62.219
E41M60.071
0 1 2 3 4
LG6b--TTC2
0
5
10
15
20
25
30
35
40
45
50
55
60
65
70
75
80
85
90
95
100
105
110
115
120
125
130
135
140
145
CIRC_IM
CIRC_rMQM
BOLT_IM
BOLT_rMQM
ANTH_IM
ANTH_rMQM
HGHT_IM
HGHT_rMQM
Reproducedfrom
CropScience.PublishedbyCropScienceSociety
ofAmerica.Allcopyrights
reserved.

E36M49.124P33M50.361
E38M49.207aE38M60.308P33M59.082P44M62.094
6-SFT.1017HP33M50.267E36M62.193E41M48.215E41M48.152
MWG703.1947HP35M49.204E41M49.204E36M61.095E36M49.061P33M61.386
E41M62.212P35M50.219
E38M60.148
E36M61.152bE37M49.198E41M49.193P33M61.326
E41M60.070
P44M62.197b
P42M62.326E38M60.140
E37M62.297
E41M49.357E41M49.170E41M47.162E36M62.306
MWG741.2877HE41M62.351
BCD4217H(D)E36M62.225E37M62.323
MWG669.4926ABDHRADP.3505A,5B,5D
P42M62.289ADP.1905A,5B,5D
E38M49.297E41M48.294E36M59.391E36M62.298E36M49.380E38M60.092E41M61.112E41M50.267P33M62.126P33M47.242E36M59.279E41M60.338E37M61.340
E41M62.342
E41M60.378
P44M49.129bE37M60.246
E36M49.258
E36M50.202
E41M62.362
P44M49.130
E36M62.325E36M59.237E37M60.107E41M47.310E36M61.142E37M61.374P33M48.294P33M50.156P33M50.142P35M62.166E37M47.169E36M49.270E38M47.230P33M48.174P35M62.280P33M60.318P33M48.178E41M47.257
E41M60.185
P33M61.074
0 1 2 3 4
LG7a--TTC1
P44M62.094
P33M47.119
6-SFT.101 7H
P33M50.143P33M48.159E41M48.215E37M49.340E41M48.153MWG703.194 7HE36M62.088E36M48.336P44M62.397E41M62.212E41M49.259E41M48.162a
P35M50.101
P44M62.197bE37M49.382E41M48.254
P33M48.240
E37M49.142E37M49.143E38M60.140
E41M59.278
E41M62.103E38M59.259
E41M47.066E41M61.313bE41M47.162E38M59.342E36M61.067E36M59.263E41M60.336bMWG741.287 7HE38M49.136E36M61.122AE36M62.225E37M62.323E41M61.111bE41M62.116P44M62.226E38M49.297E41M60.239E38M60.092E41M61.267E41M48.294E41M61.112E37M61.340E41M47.220E36M49.380E41M60.338E41M59.114bP44M62.288bMWG669.492 6ABDHRE37M47.259E41M60.378P44M62.063P44M49.129bE36M50.314E38M59.300P33M48.319bP42M61.322P44M49.130E36M50.202
E41M59.273
E37M60.106E37M60.092E38M59.327P35M50.209P35M62.166E37M61.374E36M62.300E41M62.287
E41M59.252E37M47.294P33M60.318P33M48.174E41M61.090aE36M49.269P35M62.280P33M48.178E41M47.257E41M49.313E41M60.185E41M47.313E38M47.261E41M49.065E37M62.230E36M50.212P33M47.108E41M61.262E41M61.240
E36M50.269
P33M61.074
P35M61.143
0 1 2 3 4
LG7a--TTC2E41M59.215E36M59.095E36M49.090
E41M61.084aE37M62.291E37M62.071P33M61.387
6-SFT.5797HE41M59.072P44M49.179P33M50.284P35M59.166P33M48.135P35M61.154E38M47.385P33M62.071E41M60.130P33M62.352
E38M47.222b
E37M61.193
E41M47.266
E38M49.375E41M61.090bE41M61.091a
P35M60.247E36M59.134E38M59.304E41M59.234P35M60.189P35M59.116E37M62.180E36M49.190E38M47.096P44M49.261
P35M62.109P33M62.325E41M47.170
P35M62.254P33M48.319aE36M61.093E38M59.082E41M48.321E41M48.111
E36M61.289aE36M49.327E38M60.165E38M47.171E37M60.144E37M47.082P33M61.368P33M62.327P44M62.290
E37M49.380E37M62.157
E41M59.203
P35M49.347
P35M61.311
E36M61.320
P35M61.382WMC488.1057A
E36M61.122
E41M48.240
E37M61.225E37M61.283E41M59.220P33M48.122P33M47.230E41M62.229P33M60.378P33M50.332P35M61.183E36M49.368E37M49.356E37M60.323E41M47.399E38M59.151E36M62.383E36M50.325E36M62.172P33M62.181E36M48.313P35M50.285P35M61.381E37M49.108P35M59.237P33M59.186E38M49.305
0 1 2 3 4
LG7b--TTC1E41M59.215E41M60.2356-SFT.579 7HE36M59.100E36M62.261E36M61.316E37M62.291E41M61.084aE38M59.323P44M49.228bP33M50.284E37M61.205E41M59.072P35M62.184P35M59.165P33M62.071E38M47.385E41M60.130P44M62.117E36M48.130E37M61.193E37M47.078E41M61.091aP35M60.246E36M59.371E38M59.304P35M60.247LIMDEX.227 7HP35M59.116P42M62.386P33M50.349E38M59.298b
P33M48.384E37M62.180
E41M60.190E38M47.096
P33M62.325
E37M47.222
E41M47.134
E37M60.148E38M59.082
E41M48.111
E41M59.095
E37M60.144E41M59.203E41M48.355E36M62.334bP44M62.290
P35M49.347
E38M47.384
E41M48.338
P33M62.122
WMC488.105 7A
P35M61.311
E36M62.172
P33M48.122
P44M62.156
E41M62.229
E41M48.377
E36M49.101E36M50.398E37M49.113
E41M47.255P33M60.378
E36M48.293E36M50.325
P35M62.095E41M48.384
E38M49.305E36M48.313
P35M61.381P33M60.225
0 1 2 3 4
LG7b--TTC2
0
5
10
15
20
25
30
35
40
45
50
55
60
65
70
75
80
85
90
95
100
105
110
115
120
125
130
135
140
145
150
155
CIRC_IM
CIRC_rMQM
BOLT_IM
BOLT_rMQM
ANTH_IM
ANTH_rMQM
HGHT_IM
HGHT_rMQM
Reproducedfrom
CropScience.PublishedbyCropScienceSociety
ofAmerica.Allcopyrights
reserved.

Histograms for circumference (cm) of plant spreading in the full-sib Leymus TTC1 (n=164) and TTC2 (n=170) mapping families, based on means of two clones, compared to the heterogeneous L. cinereus Acc:636 (Lc) and L. triticoides Acc:641 (Lt) progenitors, interspecific hybrid parents (TC1 and TC2), and recurrent parent (T).
0
5
10
15
20
25
30
35
40
45
50
55
60
70 140 210 280 350 420 490 560 630 700 770 840 910 980 1050 More
TTC1
TTC2
2002 ID AV (SD)Lc 23 (10)Lt 354 (186)T 487 (61)TC1 96 (35)TC2 125 (37)TTC1 180 (91)TTC2 299 (116)
Lc TC1 Lt T TC2 TTC1 TTC2
0
5
10
15
20
25
30
35
40
45
50
70 140 210 280 350 420 490 560 630 700 770 840 910 980 1050 More
TTC1
TTC2
2003 ID AV (SD)Lc 51 (26) Lt 594 (326)T 853 (120) TC1 200 (32) TC2 231 (38) TTC1 288 (122) TTC2 449 (154)
Lc TC1 Lt T TC2 TTC1 TTC2
0
5
10
15
20
25
30
35
40
70 140 210 280 350 420 490 560 630 700 770 840 910 980 1050 More
TTC1
TTC2
2004 ID AV (SD)Lc 76 (21) Lt 816 (416) T 1263 (177) TC1 256 (39) TC2 282 (53) TTC1 362 (137) TTC2 548 (170)
T Lc TC1 Lt TC2 TTC1 TTC2
Reproducedfrom
CropScience.PublishedbyCropScienceSociety
ofAmerica.Allcopyrights
reserved.

Histograms for proportion of bolting culms in the full-sib Leymus TTC1 (n=164) and TTC2 (n=170) mapping populations, based on means of two clones, compared to the heterogeneous L. cinereus Acc:636 (Lc) and L. triticoides Acc:641 (Lt) progenitors, interspecific hybrid parents (TC1 and TC2), and recurrent parent (T).
0
10
20
30
40
50
60
70
80
90
100
110
0.1 0.2 0.3 0.4 0.5 0.6 0.7 0.8 0.9 1
TTC1
TTC2
ID AV (SD)Lc 0.28 (0.46)Lt 0.67 (0.48)T 1.00 (0.00)TC1 0.79 (0.43) TC2 1.00 (0.00) TTC1 0.57 (0.43) TTC2 0.72 (0.39)
2002
Lc TC1 TTC2 TC2 TTC1 Lt T
0
5
10
15
20
25
30
35
40
0.1 0.2 0.3 0.4 0.5 0.6 0.7 0.8 0.9 1
TTC1
TTC2
ID AV (SD)Lc 0.63 (0.43)Lt 0.56 (0.32)T 0.98 (0.06)TC1 0.88 (0.19) TC2 0.77 (0.21) TTC1 0.33 (0.24) TTC2 0.55 (0.26)
2003
Lc Lt TC2 TC1 TTTC1 TTC2
0
5
10
15
20
25
30
35
40
0.1 0.2 0.3 0.4 0.5 0.6 0.7 0.8 0.9 1
TTC1
TTC2
ID AV (SD)Lc 0.85 (0.33)Lt 0.78 (0.35)T 1.00 (0.00)TC1 0.84 (0.19)TC2 0.81 (0.23)TTC1 0.55 (0.26)TTC2 0.67 (0.27)
2004
Lc T TC2 TTC1 TTC2 TC1 Lt
Reproducedfrom
CropScience.PublishedbyCropScienceSociety
ofAmerica.Allcopyrights
reserved.
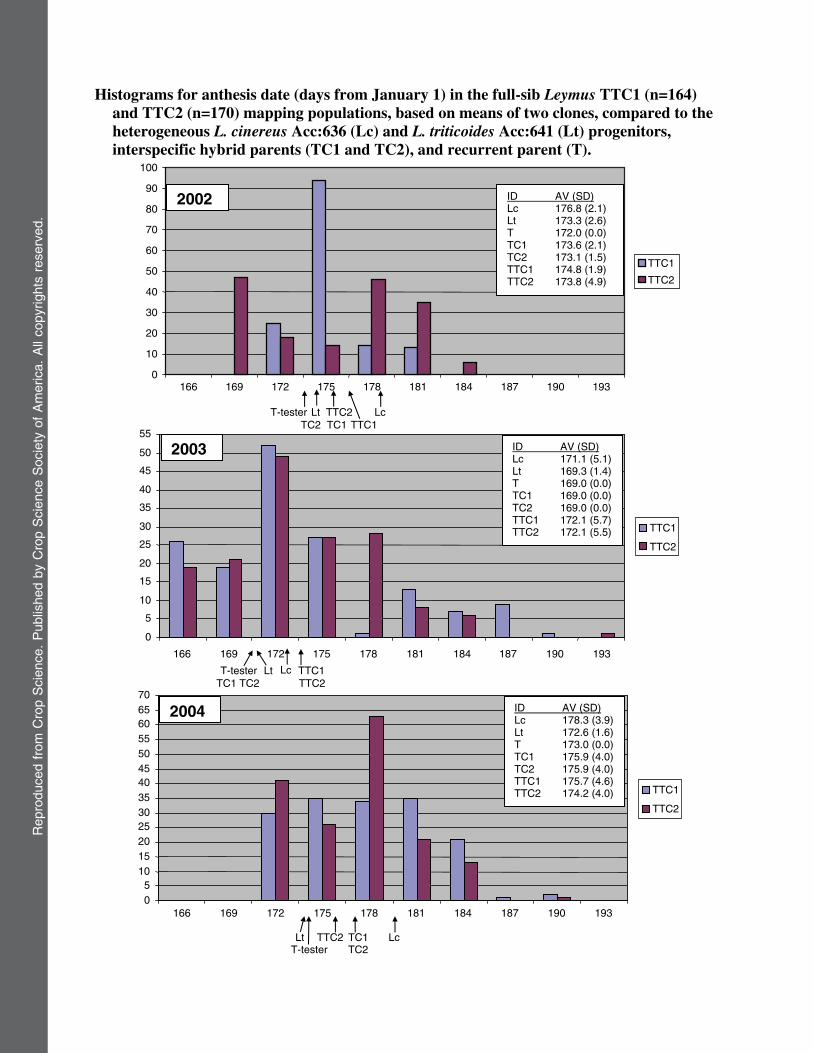
Histograms for anthesis date (days from January 1) in the full-sib Leymus TTC1 (n=164) and TTC2 (n=170) mapping populations, based on means of two clones, compared to the heterogeneous L. cinereus Acc:636 (Lc) and L. triticoides Acc:641 (Lt) progenitors, interspecific hybrid parents (TC1 and TC2), and recurrent parent (T).
166 169 172 175 178 181 184 187 190 193
0
5
10
15
20
25
30
35
40
45
50
55
TTC1
TTC2
ID AV (SD)Lc 171.1 (5.1) Lt 169.3 (1.4) T 169.0 (0.0) TC1 169.0 (0.0) TC2 169.0 (0.0) TTC1 172.1 (5.7) TTC2 172.1 (5.5)
2003
TTC2 Lc Lt T-tester
TC1 TC2 TTC1
05
10152025303540455055606570
166 169 172 175 178 181 184 187 190 193
TTC1
TTC2
ID AV (SD)Lc 178.3 (3.9) Lt 172.6 (1.6) T 173.0 (0.0) TC1 175.9 (4.0) TC2 175.9 (4.0) TTC1 175.7 (4.6) TTC2 174.2 (4.0)
2004
Lc TC1 Lt T-tester TC2
TTC2
0
10
20
30
40
50
60
70
80
90
100
166 169 172 175 178 181 184 187 190 193
TTC1
TTC2
ID AV (SD)Lc 176.8 (2.1) Lt 173.3 (2.6) T 172.0 (0.0) TC1 173.6 (2.1) TC2 173.1 (1.5) TTC1 174.8 (1.9) TTC2 173.8 (4.9)
2002
Lc TC1 TTC1
Lt T-tester TC2
TTC2
Reproducedfrom
CropScience.PublishedbyCropScienceSociety
ofAmerica.Allcopyrights
reserved.

Histograms for plant height (cm) in the full-sib Leymus TTC1 (n=164) and TTC2 (n=170) mapping populations, based on means of two clones, compared to the heterogeneous Leymus cinereus Acc:636 (Lc) and L. triticoides Acc:641 (Lt) progenitors, interspecific hybrid parents (TC1 and TC2), and recurrent parent (T).
0
10
20
30
40
50
60 70 80 90 100 110 120 130 140 150 160 170 180
TTC1
TTC2
ID AV (SD)Lc 99.0 (39.8)Lt 94.5 (12.6)T 100.8 (5.7) TC1 145.8 (15.9) TC2 141.8 (10.6) TTC1 103.9 (13.8) TTC2 109.7 (13.0)
2002
Lt Lc T TC2 TC1 TTC1 TTC2
0
10
20
30
40
50
60
70
60 70 80 90 100 110 120 130 140 150 160 170 180
TTC1
TTC2
ID AV (SD)Lc 135.6 (23.0) Lt 98.5 (8.5) T 100.9 (5.9) TC1 155.1 (12.6) TC2 138.4 (13.3) TTC1 108.3 (12.9) TTC2 109.7 (13.0)
2003
LcLt T TC2 TC1 TTC1 TTC2
0
10
20
30
40
50
60
60 70 80 90 100 110 120 130 140 150 160 170 180
TTC1
TTC2
ID AV (SD)Lc 182.9 (18.5) Lt 123.3 (12.7) T 125.7 (3.4) TC1 184.7 (12.3) TC2 164.6 (8.7) TTC1 134.8 (13.8) TTC2 137.8 (11.8)
2004
Lc TC1 Lt T TC2 TTC1 TTC2
Reproducedfrom
CropScience.PublishedbyCropScienceSociety
ofAmerica.Allcopyrights
reserved.

Description of additional SSR (CNL and KSU) and STS markers added to the Leymus TTC1 and TTC2 maps originally published by WUet al. (2003)
Loci(groups) Primers Gene or motif Anchor lociExpectedamplicon
Mappedamplicons§
TRX1 (LG1a, LG2b) GGATAACATGACCCTAAAAACT† AY204511 thioredoxin, Xbm2, 1R 287‡ Leymus 289GTTGTGCATCACAGGGTTATA
TRX2 (LG6B) GGATAACATGACCCTAAAAAG† AY204511 thioredoxin, Xbm2 1R 287‡ Leymus 288TTGTTCATCACAGGGTTATC
CNL45(LG2A, LG2B)
GAGAGAGCTTCGTCCCACTC (ga)9, putative RNA binding protein 2A 167‡ wheat 154, 161, 170, 172CACCACTCGTTTCTTTCACTTT
KSU154 (LG4Ns) GGAGACTCTGGTCATCTCGC (cac)7 4B 146‡ wheat 137ATACTGGAGTGAAGGCACGG
CNL39 (LG4Ns) TACCTGTGCGGCGATGAAT AF251264 (atgc)5 rubisco activase B 3A 220‡ wheat 229CAGGAGCAGGAGAACGTGAA
BCD1117(LG4Ns, LG4Xm)
TCAGTTCTCAATAGAAGTGCTGTG BCD117 barley cDNA clone 4HD 209 152, 211TCCTGAATAAGGTCTTCATACCAA
HVCABG (LG4Ns) ACACCTTCCCAGGACAATCC Rubisco (AT)29 4H 182 barley 152CAGAGCACCGAAAAAGTCTGTA
HVM068 (LG4Xm) AGGACCGGATGTTCATAACG (GA)22 4H 204 barley 199CAAATCTTCCAGCGAGGCT
KSU149 (LG4Xm) GAGCCACCAGAGCAGAAATC (acc)9 4D 228‡ wheat 240, 243CGAGCTCCCCTTCTTCTTCT
KSU171 (LG5Ns) TCTTGCTTGCATTGTAACCG (agt)7 5B 243‡ wheat 279TCATGTCTGGGAGCATGGTA
MWG2230 (LG5Ns) AATGATGTTGCTTTCCTGTTTGCTC MWG2230 barley genomic DNA 5H 320 barley 285ACAGATGATGATGGCGTGCAGCTTT
VRN2 (LG5Ns) AGTACCAGTTCTTCRCCCAAGG Wheat vrn2 (AY485644) 4H, 4A/5A 203 wheat 193,199CTGCASYAGGTGAGCCAT
MWG2264 (LG6a) AGGTAGAAGTCAAACTGTGTGGGAT MWG2264 barley genomic DNA 6H 400-450 403GTATTACTTTACGAGTTAGATGCTA
ADP (LG7a) CCTCCGTGAACAATTTCCTG M31616 ADP glucose phosphorylase 5ABD 1003‡ rice 350 TaqITCCAATACGAGCATTCTTGT 190 TaqI
†FAM 5’ labeled primer.‡Amplicon size based on sequence data.§Amplicon size based on comparisons with internal size standards in capillary electrophoresis.
Reproducedfrom
CropScience.PublishedbyCropScienceSociety
ofAmerica.Allcopyrights
reserved.


![CaseReport Habit Breaking Appliance for Multiple Corrections · Habit Breaking Appliance for Multiple Corrections ... removable habit breaking appliances [15, 16]. Hence, habit breaking](https://img.pdfslide.us/doc/110x75/5f15893424a8522d646af1b7/casereport-habit-breaking-appliance-for-multiple-corrections-habit-breaking-appliance.jpg)