Embed Size (px)
Citation preview

COMPARATIVE ENERGY AND GREENHOUSE GAS ANALYSES BETWEEN
SMALL- AND LARGE-SCALE SUGARCANE PRODUCTION IN MAURITIUS
James T. L. K. Y. Kong-Win Chang
Master of Science Thesis KTH School of Industrial Engineering and Management
Energy Technology EGI-2013-135MSC Division of Energy and Climate Studies
SE-100 44 Stockholm

Master of Science Thesis EGI-2013-135MSC
Comparative energy and greenhouse gas analyses between small- and large-scale
sugarcane production in Mauritius
James T. L. K. Y. Kong-Win Chang
Approved:
30.10.2013
Examiner:
Prof. Semida Silveira
Supervisors:
Francis X. Johnson Dilip Khatiwada
Commissioner:
Contact person:
James T. L. K. Y. Kong-Win Chang
ABSTRACT This study uses energy and greenhouse gas (GHG) balances to evaluate how the scale of
sugarcane cultivation affects the performance of a sugarcane bioenergy system generating
exportable electricity from bagasse. Small-, medium-, large- and miller-planter systems, with
cane field areas of less than 10 ha, 10 – 42 ha, 42 – 2000 ha, more than 2000 ha respectively,
were modelled. Each of them also has different combinations of manual and mechanical
agricultural operations, resulting in different cane yields.
Miller-planter system (fully mechanised) performs best with energy yield ratio of 10.99, GHG
emissions in bagasse electricity of 0.0633 kg CO2eq/kWh and avoided life cycle GHG emissions
of 82.07% when replacing electricity from coal, whereas small-planter system (fully manual) has
the worst performance with energy yield ratio of 6.82, GHG emissions in bagasse electricity of
0.0881 kg CO2eq/kWh and avoided life cycle GHG emissions of 75.03% when substituting
electricity from coal.
Sensitivity analyses show that relative performances of all sugarcane planter systems both in
terms of energy and GHG emissions are not significantly affected by variations in bagasse
allocation factor, in sugarcane yield and in fertiliser input (the most energy-intensive and GHG-
emitting component). Moreover, they confirm miller-planter system as the overall best
performer and indicate that increasing small-planters’ cane yield is the critical measure to
improve their energy analysis performance. In terms of the nature of agricultural operations,
mechanical operations do not necessarily require more input energy than their manual
counterparts, contrary to common belief. This is the case for fertilisation, irrigation and cane
loading. Fully mechanised sugarcane production at miller-planter scale is therefore strongly
encouraged.
-2-
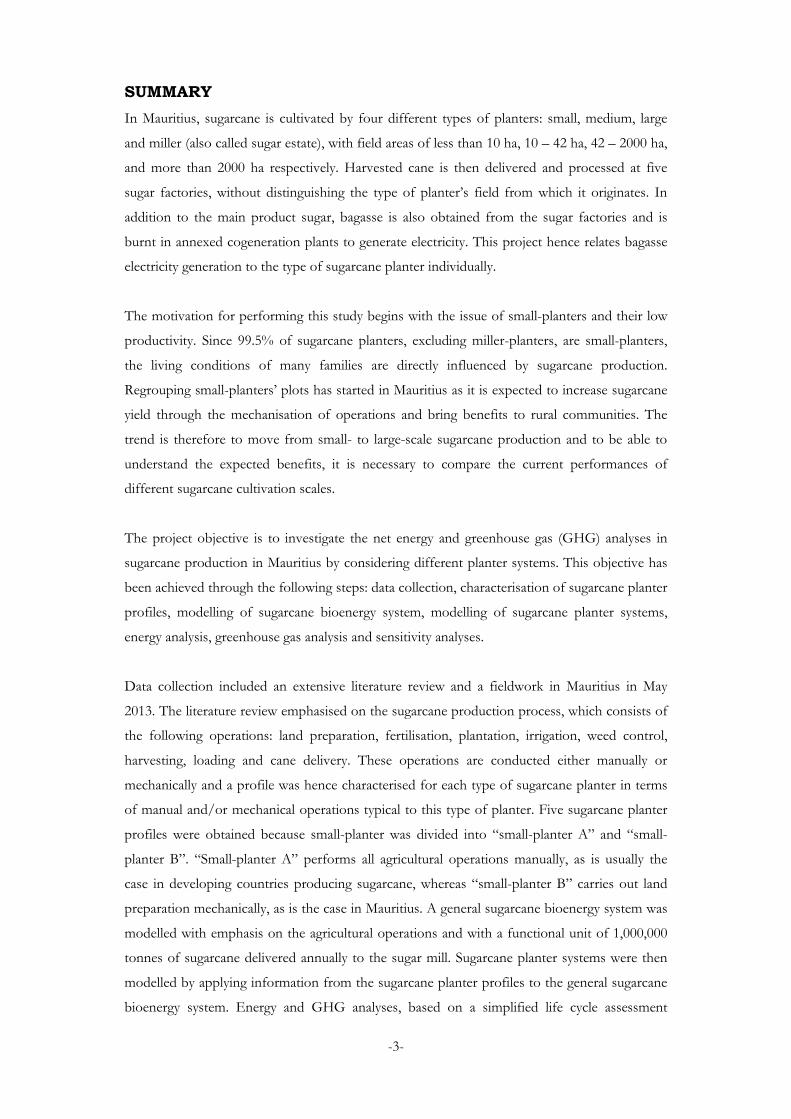
SUMMARY In Mauritius, sugarcane is cultivated by four different types of planters: small, medium, large
and miller (also called sugar estate), with field areas of less than 10 ha, 10 – 42 ha, 42 – 2000 ha,
and more than 2000 ha respectively. Harvested cane is then delivered and processed at five
sugar factories, without distinguishing the type of planter’s field from which it originates. In
addition to the main product sugar, bagasse is also obtained from the sugar factories and is
burnt in annexed cogeneration plants to generate electricity. This project hence relates bagasse
electricity generation to the type of sugarcane planter individually.
The motivation for performing this study begins with the issue of small-planters and their low
productivity. Since 99.5% of sugarcane planters, excluding miller-planters, are small-planters,
the living conditions of many families are directly influenced by sugarcane production.
Regrouping small-planters’ plots has started in Mauritius as it is expected to increase sugarcane
yield through the mechanisation of operations and bring benefits to rural communities. The
trend is therefore to move from small- to large-scale sugarcane production and to be able to
understand the expected benefits, it is necessary to compare the current performances of
different sugarcane cultivation scales.
The project objective is to investigate the net energy and greenhouse gas (GHG) analyses in
sugarcane production in Mauritius by considering different planter systems. This objective has
been achieved through the following steps: data collection, characterisation of sugarcane planter
profiles, modelling of sugarcane bioenergy system, modelling of sugarcane planter systems,
energy analysis, greenhouse gas analysis and sensitivity analyses.
Data collection included an extensive literature review and a fieldwork in Mauritius in May
2013. The literature review emphasised on the sugarcane production process, which consists of
the following operations: land preparation, fertilisation, plantation, irrigation, weed control,
harvesting, loading and cane delivery. These operations are conducted either manually or
mechanically and a profile was hence characterised for each type of sugarcane planter in terms
of manual and/or mechanical operations typical to this type of planter. Five sugarcane planter
profiles were obtained because small-planter was divided into “small-planter A” and “small-
planter B”. “Small-planter A” performs all agricultural operations manually, as is usually the
case in developing countries producing sugarcane, whereas “small-planter B” carries out land
preparation mechanically, as is the case in Mauritius. A general sugarcane bioenergy system was
modelled with emphasis on the agricultural operations and with a functional unit of 1,000,000
tonnes of sugarcane delivered annually to the sugar mill. Sugarcane planter systems were then
modelled by applying information from the sugarcane planter profiles to the general sugarcane
bioenergy system. Energy and GHG analyses, based on a simplified life cycle assessment
-3-
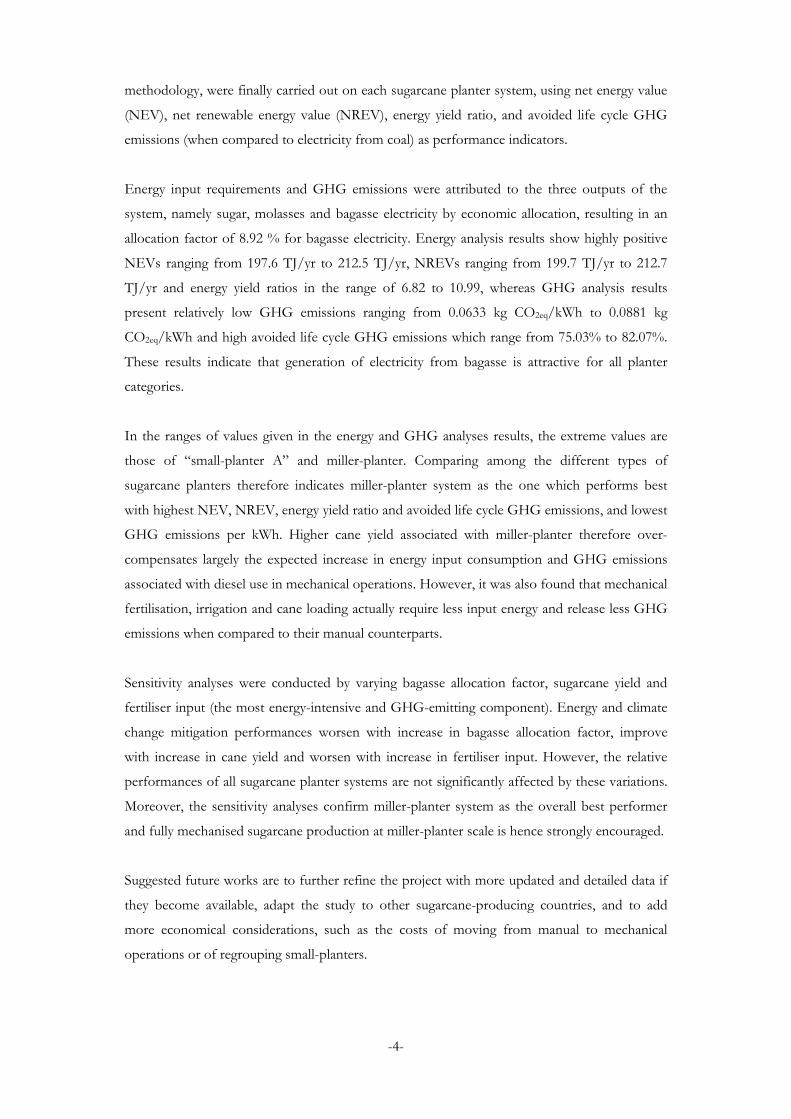
methodology, were finally carried out on each sugarcane planter system, using net energy value
(NEV), net renewable energy value (NREV), energy yield ratio, and avoided life cycle GHG
emissions (when compared to electricity from coal) as performance indicators.
Energy input requirements and GHG emissions were attributed to the three outputs of the
system, namely sugar, molasses and bagasse electricity by economic allocation, resulting in an
allocation factor of 8.92 % for bagasse electricity. Energy analysis results show highly positive
NEVs ranging from 197.6 TJ/yr to 212.5 TJ/yr, NREVs ranging from 199.7 TJ/yr to 212.7
TJ/yr and energy yield ratios in the range of 6.82 to 10.99, whereas GHG analysis results
present relatively low GHG emissions ranging from 0.0633 kg CO2eq/kWh to 0.0881 kg
CO2eq/kWh and high avoided life cycle GHG emissions which range from 75.03% to 82.07%.
These results indicate that generation of electricity from bagasse is attractive for all planter
categories.
In the ranges of values given in the energy and GHG analyses results, the extreme values are
those of “small-planter A” and miller-planter. Comparing among the different types of
sugarcane planters therefore indicates miller-planter system as the one which performs best
with highest NEV, NREV, energy yield ratio and avoided life cycle GHG emissions, and lowest
GHG emissions per kWh. Higher cane yield associated with miller-planter therefore over-
compensates largely the expected increase in energy input consumption and GHG emissions
associated with diesel use in mechanical operations. However, it was also found that mechanical
fertilisation, irrigation and cane loading actually require less input energy and release less GHG
emissions when compared to their manual counterparts.
Sensitivity analyses were conducted by varying bagasse allocation factor, sugarcane yield and
fertiliser input (the most energy-intensive and GHG-emitting component). Energy and climate
change mitigation performances worsen with increase in bagasse allocation factor, improve
with increase in cane yield and worsen with increase in fertiliser input. However, the relative
performances of all sugarcane planter systems are not significantly affected by these variations.
Moreover, the sensitivity analyses confirm miller-planter system as the overall best performer
and fully mechanised sugarcane production at miller-planter scale is hence strongly encouraged.
Suggested future works are to further refine the project with more updated and detailed data if
they become available, adapt the study to other sugarcane-producing countries, and to add
more economical considerations, such as the costs of moving from manual to mechanical
operations or of regrouping small-planters.
-4-

ACKNOWLEDGEMENTS I would like to thank my supervisor Francis X. Johnson for having proposed this challenging
research topic. The fact that there is very limited research on detailed agricultural practices of
different sugarcane planters in sub-Saharan Africa enabled me to deliver original results and to
learn considerably more than what I would have hoped for. My thanks also go to my co-
supervisor Dilip Khatiwada for his guidance, especially in the life cycle analysis part of this
project.
I am thankful to the Stockholm Environment Institute for having provided the funds for the
fieldwork that I carried out in Mauritius, without which this study would not have been
possible. During this fieldwork, I gained access to much data via the help of many people and I
would like to earnestly thank them:
• Mauritius Sugar Industry Research Institute staff: Stéphanie Adélaïde, Priscille Chong Shin Sen ,
Maryse Chung Tze Cheong, Ah Foon Lau Ah Wing, Tesha Mardamootoo, Ronald Ng
Cheong, Gopal Pillay, Vivian Rivière, and Jugdish Sonatun.
• University of Mauritius senior lecturers: Vikram Seebaluck and Dinesh Surroop
• Friends: Prakash Juddoo, Melany Poorun, and Melody Poorun
• Sunil Dooly
• Indoomatee Ramma
I would also like to sincerely thank my colleagues and friends Mercè Labordena and Soroor
Amindezfooli, as well as my parents in Mauritius, my twin brother in Singapore and my sister in
the United States, for their unfailing motivation despite the long distances.
Finally, I am most grateful to the European Institute of Innovation and Technology for
providing me with a scholarship to study the KIC InnoEnergy Master in Renewable Energy.
These two years were so enriching in all aspects and were definitely the best of my life so far.
-5-
TABLE OF CONTENTS
ABSTRACT ................................................................................................................................................ 2
SUMMARY ................................................................................................................................................ 3
ACKNOWLEDGEMENTS ................................................................................................................... 5
TABLE OF CONTENTS ....................................................................................................................... 6
LIST OF FIGURES ................................................................................................................................ 10
LIST OF TABLES .................................................................................................................................. 11
LIST OF ACRONYMS AND ABBREVIATIONS ......................................................................... 12
LIST OF UNITS AND SYMBOLS ..................................................................................................... 13
CHAPTER 1: INTRODUCTION ....................................................................................................... 14
1.1. BACKGROUND ........................................................................................................................ 14
1.2. BIOENERGY FROM SUGARCANE ................................................................................... 15
1.3. PROJECT RATIONALE .......................................................................................................... 17
1.4. OBJECTIVE OF PROJECT .................................................................................................... 18
1.5. STRUCTURE OF THE REPORT .......................................................................................... 18
CHAPTER 2: THE SUGARCANE INDUSTRY IN MAURITIUS ............................................ 19
2.1. SUGARCANE AGRICULTURE ............................................................................................ 19
2.1.1. Sugarcane sectors ...................................................................................................................... 19
2.1.2. Sugarcane planters .................................................................................................................... 20
2.2. SUGAR MANUFACTURE ...................................................................................................... 21
2.3. COGENERATION OF ELECTRICITY .............................................................................. 23
2.4. MARKETS ................................................................................................................................... 23
CHAPTER 3: SUGARCANE PRODUCTION IN MAURITIUS ............................................... 25
3.1. LAND PREPARATION ........................................................................................................... 25
3.2. FERTILISATION ...................................................................................................................... 26
3.3. PLANTATION ........................................................................................................................... 27
3.4. IRRIGATION ............................................................................................................................. 28
-6-

3.5. WEED CONTROL .................................................................................................................... 31
3.6. HARVESTING ........................................................................................................................... 31
3.6.1. Green and burnt harvesting .................................................................................................... 31
3.6.2. Manual and mechanical harvesting ........................................................................................ 32
3.7. LOADING ................................................................................................................................... 33
3.8. DELIVERY .................................................................................................................................. 34
CHAPTER 4: METHODOLOGY ...................................................................................................... 35
4.1. DATA COLLECTION .............................................................................................................. 35
4.2. CHARACTERISATION OF SUGARCANE PLANTER PROFILES ........................... 35
4.2.1. Small-planter .............................................................................................................................. 36
4.2.2. Medium-planter ......................................................................................................................... 36
4.2.3. Large-planter .............................................................................................................................. 37
4.2.4. Miller-planter ............................................................................................................................. 37
4.2.5. Sugarcane planter profiles ....................................................................................................... 37
4.3. MODELLING OF SYSTEM ................................................................................................... 39
4.4. ECONOMIC ALLOCATION ................................................................................................. 40
4.5. ENERGY ANALYSIS ............................................................................................................... 41
4.6. GREENHOUSE GAS ANALYSIS ........................................................................................ 41
CHAPTER 5: RESULTS & DISCUSSIONS ..................................................................................... 43
5.1. OVERVIEW ................................................................................................................................ 43
5.2. SUGARCANE PLANTER SYSTEMS ................................................................................... 43
5.2.1. “Small-planter A” ..................................................................................................................... 44
5.2.2. “Small-planter B” ...................................................................................................................... 45
5.2.3. Medium-planter ......................................................................................................................... 46
5.2.4. Large-planter/FORIP .............................................................................................................. 47
5.2.5. Miller-planter ............................................................................................................................. 48
5.3. ENERGY ANALYSIS RESULTS ........................................................................................... 49
5.3.1. “Small-planter A” ..................................................................................................................... 49
5.3.2. “Small-planter B” ...................................................................................................................... 52
5.3.3. Medium-planter ......................................................................................................................... 55
-7-
5.3.4. Large-planter/FORIP .............................................................................................................. 56
5.3.5. Miller-planter ............................................................................................................................. 59
5.4. ENERGY ANALYSIS DISCUSSIONS ................................................................................. 65
5.4.1. Sensitivity analysis ..................................................................................................................... 67
5.4.2. Comparison with other studies ............................................................................................... 73
5.5. GREENHOUSE GAS ANALYSIS RESULTS .................................................................... 74
5.5.1. “Small-planter A” ..................................................................................................................... 74
5.5.2. “Small-planter B” ...................................................................................................................... 76
5.5.3. Medium-planter ......................................................................................................................... 77
5.5.4. Large-planter/FORIP .............................................................................................................. 79
5.5.5. Miller-planter ............................................................................................................................. 81
5.6. GREENHOUSE GAS ANALYSIS DISCUSSIONS .......................................................... 86
5.6.1. Sensitivity analysis ..................................................................................................................... 87
5.6.2. Comparison with other studies ............................................................................................... 91
CHAPTER 6: CONCLUSIONS & RECOMMENDATIONS ...................................................... 93
6.1. CONCLUSIONS......................................................................................................................... 93
6.2. RECOMMENDATIONS.......................................................................................................... 93
6.3. FUTURE WORK ........................................................................................................................ 94
REFERENCES........................................................................................................................................ 96
APPENDIX A: SUGAR FACTORIES IN MAURITIUS ............................................................ 103
A.1. TERRA MILLING LTD. ....................................................................................................... 103
A.2. ALTEO LTD. ........................................................................................................................... 103
A.3. OMNICANE ............................................................................................................................ 103
A.4. MEDINE ................................................................................................................................... 103
APPENDIX B: INSTITUTIONS IN THE SUGARCANE INDUSTRY ............................... 105
APPENDIX C: SUGARCANE PLANTERS’ YIELDS ................................................................ 106
APPENDIX D: ECONOMIC ALLOCATION FACTORS ........................................................ 107
APPENDIX E: HUMAN LABOUR’S ENERGY INPUT .......................................................... 108
-8-

APPENDIX F: FERTILISER USE IN MAURITIUS ................................................................... 109
-9-

LIST OF FIGURES
Figure 1: Bagasse electricity supply in Mauritius ................................................................................. 16
Figure 2: Sugarcane fields and sugar factories in Mauritius .............................................................. 22
Figure 3: Nutrient requirements at different sugarcane growth stages ........................................... 26
Figure 4: Spacings in dual row planting ................................................................................................ 27
Figure 5: Hodge cane planter ................................................................................................................. 28
Figure 6: Overhead .................................................................................................................................. 29
Figure 7: Centre pivot ............................................................................................................................. 30
Figure 8: Dragline .................................................................................................................................... 30
Figure 9: Chopper harvester with tractor-drawn trailer ..................................................................... 33
Figure 10: Cane transfer to road truck ................................................................................................. 34
Figure 11: General modelled system ..................................................................................................... 39
Figure 12: “Small-planter A” system..................................................................................................... 44
Figure 13: "Small-planter B" system ..................................................................................................... 45
Figure 14: Medium-planter system ........................................................................................................ 46
Figure 15: Large-planter system/FORIP system ................................................................................ 47
Figure 16: Miller-planter system ............................................................................................................ 48
Figure 17: Overall energy analysis results ............................................................................................. 64
Figure 18: Variation of NEV and energy yield ratio with allocation factor 5% - 60% ................. 68
Figure 19: Variation of NEV and energy yield ratio with allocation factor 2% - 20% ................. 69
Figure 20: Variation of NEV and energy yield ratio with sugarcane yield ..................................... 71
Figure 21: Variation of NEV and energy yield ratio with N-fertiliser input .................................. 72
Figure 22: Overall GHG analysis results .............................................................................................. 85
Figure 23: Variation of GHG emissions and avoided life cycle GHG emissions with allocation
factor .......................................................................................................................................................... 89
Figure 24: Variation of GHG emissions and avoided life cycle GHG emissions with cane yield
..................................................................................................................................................................... 90
Figure 25: Variation of GHG emissions and avoided life cycle GHG emissions with N-fertiliser
input ........................................................................................................................................................... 91
-10-

LIST OF TABLES
Table 1: Sugarcane sectors in Mauritius ............................................................................................... 19
Table 2: Distribution of planters by size of sugarcane plantation in Mauritius ............................. 21
Table 3: Area harvested, yield, cane and sugar produced by sugar factory area in 2011 .............. 22
Table 4: Cogeneration plants in Mauritius ........................................................................................... 23
Table 5: Steps in land preparation ......................................................................................................... 25
Table 6: Irrigation systems use in 2010 ................................................................................................ 29
Table 7: Sugarcane irrigation guidelines in Mauritius ......................................................................... 30
Table 8: Sugarcane planter profiles ....................................................................................................... 38
Table 9: Average man-hours required per hectare for sugarcane production ................................ 49
Table 10: Energy input by "Small-planter A" operations .................................................................. 50
Table 11: Energy input due to fertilisers for "Small-planter A" ....................................................... 51
Table 12: Energy input due to mechanical land preparation ............................................................ 53
Table 13: Energy input by "Small-planter B" operations .................................................................. 53
Table 14: Energy input by medium-planter operations ..................................................................... 55
Table 15: Energy input by large-planter operations ........................................................................... 58
Table 16: Energy input by miller-planter operations ......................................................................... 60
Table 17: Summary of energy analysis results ..................................................................................... 62
Table 18: Comparison of energy inputs between manual and mechanical operations ................. 66
Table 19: GHG emission factors .......................................................................................................... 74
Table 20: GHG emissions due to "Small-planter A" operations ..................................................... 74
Table 21: GHG emissions related to fertilisers for “small-planter A” ............................................ 75
Table 22: GHG emissions due to "small-planter B" operations ...................................................... 76
Table 23: GHG emissions related to fertilisers and herbicides for "Small-planter B" ................. 77
Table 24: GHG emissions due to medium-planter operations ........................................................ 78
Table 25: GHG emissions related to fertilisers and herbicides for medium-planter .................... 78
Table 26: GHG emissions due to large-planter operations .............................................................. 79
Table 27: GHG emissions related to fertilisers and herbicides for large-planter .......................... 80
Table 28: GHG emissions due to miller-planter operations ............................................................. 81
Table 29: Summary of GHG analysis results ...................................................................................... 83
Table 30: Comparison of GHG emissions between manual and mechanical operations ............ 87
Table 31: Parastatal bodies of the MAIF connected to the sugar industry .................................. 105
Table 32: Sugarcane yields by planter categories in Mauritius ........................................................ 106
Table 33: Economic allocation ............................................................................................................ 107
Table 34: Effective area under crop cultivation in Mauritius ......................................................... 109
Table 35: Fertiliser use for cane cultivation in Mauritius ................................................................ 109
-11-

LIST OF ACRONYMS AND ABBREVIATIONS ACP African, Caribbean and Pacific
a.i. active ingredient
CEB Central Electricity Board
CTLs Cane tops and leaves
DRBC Deep River Beau Champ
EC European Commission
EU European Union
E10 Ethanol 10% (Mixture of 10% ethanol and 90% gasoline)
FORIP Field Operations Regrouping & Irrigation Project
FUEL Flacq United Estates Limited
GHG Greenhouse Gases
GNP Gross National Product
IPPs Independent Power Producers
LCA Life Cycle Assessment
MAAS Multi Annual Adaptation Strategy
MAIF Ministry of Agro-Industry & Fisheries (in 2006)/
Ministry of Agro-Industry Food Production and Security (in 2009)/
Ministry of Agro-Industry and Food Security (in 2010)
MBSTC Mauritius Bulk Sugar Terminal Corporation
MCA Mauritius Chamber of Agriculture
MCIA Mauritius Cane Industry Authority
MSS Mauritius Sugar Syndicate
MSIRI Mauritius Sugar Industry Research Institute
MSPA Mauritius Sugar Producers’ Association
NEV Net Energy Value
NREV Net Renewable Energy Value
SPMPC Sugar Planters Mechanical Pool Corporation
UNEP United Nations Environment Programme
UoM University of Mauritius
US United States
VRS Voluntary Retirement Scheme
-12-
LIST OF UNITS AND SYMBOLS cm centimetres
GJ gigajoules
GWh gigawatt-hours
h hours
ha hectare
K potassium
km kilometre
L litres
MJ megajoules
MUR Mauritian rupees
m metres
N nitrogen
P phosphorus
TJ terajoules
toe tonnes of oil equivalent
USD United States dollar
yr year
-13-

CHAPTER 1: INTRODUCTION 1.1. BACKGROUND Sugarcane was introduced in Mauritius by the Dutch, who were the first settlers, in the 1640s
(Beeharry, 1996) and has ever since been grown to produce sugar, thereby considerably
defining the island’s history and development for over three centuries. The sugar industry
quickly became the main pillar of the country’s economy due to favourable conditions. Indeed,
since 1975, Mauritius has benefited tremendously from the European Union (EU) sugar
regime, in which the sugar that was sold to the EU market had a guaranteed price almost thrice
as much as that on the world market (Sawkut, et al., 2009). Moreover, when compared to other
African, Carribean and Pacific (ACP) countries, the island had the biggest annual sugar quota of
507,000 tonnes under the ACP-EU Sugar Protocol (Sawkut, et al., 2009).
Still based on the EU sugar regime, the price of sugar on the EU market is to undergo gradual
reductions. With a total EU price decrease of 36% in 2009 (Sawkut, et al., 2009), the gross
domestic product contribution of the sugar sector has diminished and the long-term viability of
the sugar industry is at risk. In order to restructure and implement a more competitive sugar
sector, the Mauritian government, in consultation with stakeholders of the sugar industry,
defined the Multi Annual Adaptation Strategy (MAAS) Action Plan 2006-2015.
The main objective of the MAAS Action Plan is to convert the sugar industry into a sugarcane
cluster, meaning from an essentially raw sugar manufacturer to a producer of various types of
sugar, cogenerated electricity from bagasse, and ethanol from molasses. Sugarcane as feedstock
for a biorefinery producing proteins, pharmaceuticals, vaccines and polymers is also a
possibility if research advances to the commercial stage (MAIF, 2006). Moreover, the MAAS
aims for cost reductions by correctly sizing the labour force and by closing down seven of the
eleven sugar factories in operation as at 2006 (MAIF, 2006). Under these circumstances, many
workers’ employment contracts are terminated through the Voluntary Retirement Scheme
(VRS) which includes compensation by cash payment and land provision of about 300 m2
(Sawkut, et al., 2009). The employees also participate in an empowerment programme to help
them get new jobs or start their own businesses.
-14-

This gradual transition of the sugar industry to a sugarcane industry in Mauritius faces similar
challenges and aims for comparable beneficial targets as in other sub-Saharan African countries.
Sugarcane has indeed strongly been advocated as the most promising solution to address the
triple challenge of energy insecurity, climate change and rural poverty in sub-Saharan Africa
(Johnson & Batidzirai, 2012) since it has the highest bioconversion efficiency of capture of
sunlight among terrestrial plants (Deepchand, 2005) and grows optimally in the conditions of
high solar intensity prevailing in this region of the world. Moreover, these countries have a long
experience with sugarcane cultivation. Although this study was based on the Mauritian context,
the results and conclusions are general enough to be applicable to least-developed sugarcane
producing sub-Saharan African countries.
1.2. BIOENERGY FROM SUGARCANE In a sugar factory, raw sugar is extracted from sugarcane through a series of processes, which
also deliver bagasse and molasses as by-products. In order to discard bagasse and
simultaneously save external sources of energy for the manufacture of raw sugar, bagasse-fired
power plants were set up and annexed to sugar factories to produce process steam required in
raw sugar extraction (Baguant, 1984). In addition to steam, bagasse-fired power plants could
also generate electricity to satisfy the internal needs of both the sugar factory and the power
plant. Any excess electricity is then sold to the national grid and is referred to as exportable
electricity (Baguant, 1984). Since the power plant generates both heat, in the form of process
steam, and electricity from a single fuel, namely bagasse, it is commonly called a cogeneration
plant. On the other hand, molasses could be processed in a distillery to produce bioethanol
which is then used as transportation fuel. Thus, a sugarcane bioenergy system typically consists
of a sugar factory with a cogeneration plant and/or a distillery annexed to it.
Mauritius is considered to be a pioneer in cogeneration with electricity supply to the grid, using
bagasse as feedstock. It was in 1956 that the first sugar factory, namely St Antoine sugar
factory, generated exportable electricity (Beeharry, 1996). With technological improvement
throughout the years, the sugarcane industry has been delivering an increasing amount of
electricity to the grid and has become a reliable electricity supplier in the country. Since bagasse
is available only during the sugarcane harvest season, most cogeneration plants burn coal for
electricity production during the remaining time of the year (Deepchand, 2005).
Figure 1 shows the electricity generated from bagasse and delivered to the grid during the past
years. A significant increase in absolute bagasse electricity production was observed at the
beginning of this millennium, before fluctuating in the subsequent years. Another noticeable
increase was found in 2007 which is certainly justified by the implementation of the MAAS.
Although bagasse electricity has been contributing less than 20% of total electricity generated, it
has always been the most used form of renewable energy for power generation with a share -15-
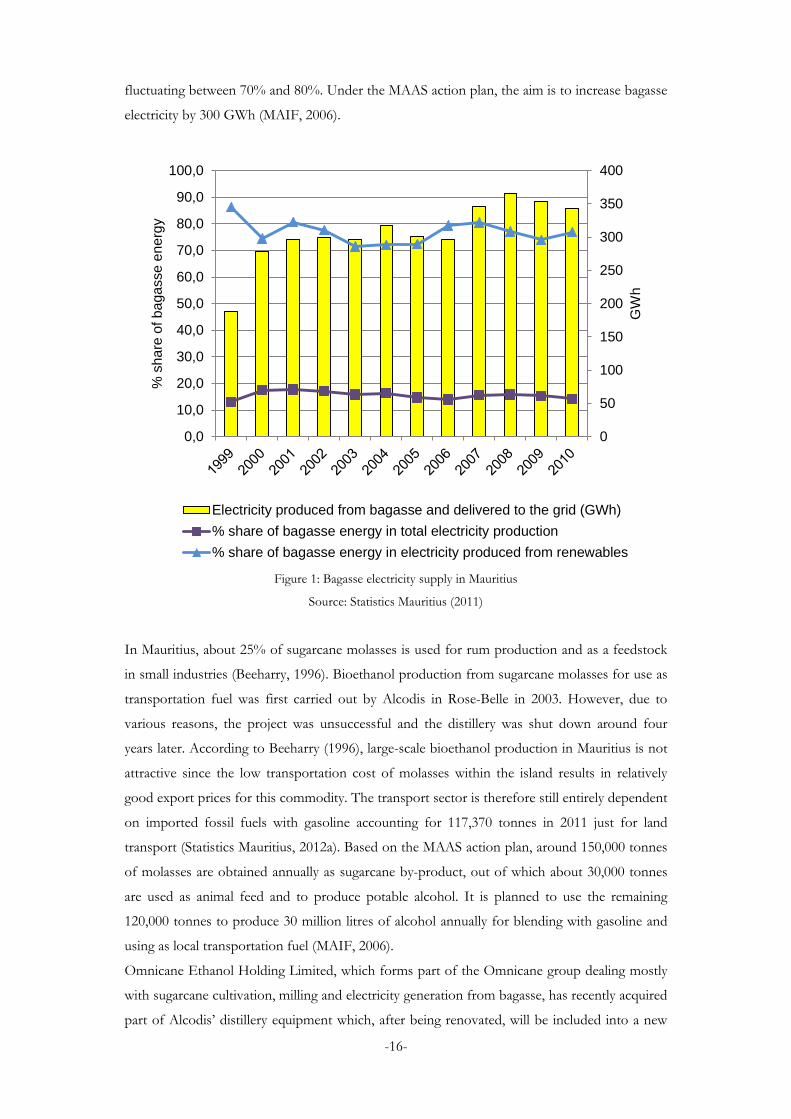
fluctuating between 70% and 80%. Under the MAAS action plan, the aim is to increase bagasse
electricity by 300 GWh (MAIF, 2006).
Figure 1: Bagasse electricity supply in Mauritius
Source: Statistics Mauritius (2011)
In Mauritius, about 25% of sugarcane molasses is used for rum production and as a feedstock
in small industries (Beeharry, 1996). Bioethanol production from sugarcane molasses for use as
transportation fuel was first carried out by Alcodis in Rose-Belle in 2003. However, due to
various reasons, the project was unsuccessful and the distillery was shut down around four
years later. According to Beeharry (1996), large-scale bioethanol production in Mauritius is not
attractive since the low transportation cost of molasses within the island results in relatively
good export prices for this commodity. The transport sector is therefore still entirely dependent
on imported fossil fuels with gasoline accounting for 117,370 tonnes in 2011 just for land
transport (Statistics Mauritius, 2012a). Based on the MAAS action plan, around 150,000 tonnes
of molasses are obtained annually as sugarcane by-product, out of which about 30,000 tonnes
are used as animal feed and to produce potable alcohol. It is planned to use the remaining
120,000 tonnes to produce 30 million litres of alcohol annually for blending with gasoline and
using as local transportation fuel (MAIF, 2006).
Omnicane Ethanol Holding Limited, which forms part of the Omnicane group dealing mostly
with sugarcane cultivation, milling and electricity generation from bagasse, has recently acquired
part of Alcodis’ distillery equipment which, after being renovated, will be included into a new
0
50
100
150
200
250
300
350
400
0,0
10,0
20,0
30,0
40,0
50,0
60,0
70,0
80,0
90,0
100,0
GW
h
% s
hare
of b
agas
se e
nerg
y
Electricity produced from bagasse and delivered to the grid (GWh)% share of bagasse energy in total electricity production% share of bagasse energy in electricity produced from renewables
-16-
distillery annexed to Omnicane’s sugar factory at La Baraque (Omnicane, 2012a). This distillery
will process molasses originating from all sugarcane planters in Mauritius to produce up to 22.5
million litres of ethanol annually (Omnicane, 2012a), which will then be blended with gasoline
and marketed locally as E10. In case more molasses becomes available, the additional ethanol
produced will be exported. However, the setting up and commissioning of the distillery has not
yet started since the company is still waiting for the Government’s authorisation. Bioethanol is
therefore not considered in this study.
1.3. PROJECT RATIONALE In the context of world trade liberalisation and reduced sugar price in the EU market, the issue
of low productivity on small-scale African farms, roughly defined by Wiggins (2009) as those
occupying an area of less than 2 ha, has become an increasingly important concern. For
example, in South Africa, around 50,000 of the 53,000 registered small-scale growers produce
only 10-15% of the country’s sugarcane (Watson, et al., 2008) and the differences in yield
between them and large-scale growers often reach 50% or more (Eweg, et al., 2009). By
improving the efficiency of operations and coordination among these growers, their cane
output and income could be increased.
In Mauritius, the Mauritius Cane Industry Authority (MCIA) Act 2011 specifically defined a
small planter as one who cultivates sugarcane over an area of less than 10 ha (Government of
Mauritius, 2011). At the time when the MAAS was being prepared, sugarcane was cultivated
over some 72,000 ha of land by around 28,000 planters with holdings varying from less than 0.1
ha to more than 4000 ha (MAIF, 2006) and the vast majority of these sugarcane growers were
smallholders. Under the MAAS action plan, incentives and help are to be provided to the small
planters to enable them to gather into larger units, via the Field Operations Regrouping and
Irrigation Project (FORIP), thereby increasing their cane yields and lowering their production
costs (MAIF, 2006). As small-scale sugarcane production has been associated with increased
social welfare stability and poverty alleviation in rural areas of sub-Saharan African countries,
increasing smallholders’ output is expected to result in significant beneficial effects. With the
current trend of shifting from small- to large-scale sugarcane cultivation, it is therefore
important to compare the actual performances of different scales of sugarcane bioenergy
systems.
The first comparison between different scales of sugarcane cultivation is on an energy basis,
since the relationship between energy input and energy output is of utmost importance when
considering bioenergy systems. Indeed, for a bioenergy system to be worth developing, its
production of secondary energy, such as electricity and bioethanol in the case of sugarcane,
should exhibit positive energy returns as a system, including energy used in the agricultural,
transportation and industrial production phases. Although sugarcane is generally known to have -17-

a very positive energy balance for both electricity and bioethanol production, based on
successful experiences from countries like Mauritius, India and Brazil, hardly any study has
compared the energy balance between small- and large-scale sugarcane cultivation.
The carbon-neutrality and climate change mitigation potential of bioenergy systems are also
subject to much controversy. Although bioethanol from sugarcane is constantly argued to be
one of the best commercially available biofuels with reductions in greenhouse gas (GHG)
emissions of 70% or more (EC, 2009; de Vries et al., 2010; cited in Johnson & Batidzirai, 2012),
hardly any detailed carbon balance on the exisiting combinations of different agricultural
practices for cultivating sugarcane has ever been done. The second comparison between
different scales of sugarcane production is therefore on the basis of GHG emissions and the
associated climate change mitigation potential. The need for such a study could not be any
timelier since the symbolic cap of 400 ppm of carbon dioxide concentration in the atmosphere
was reached and exceeded on 9 May 2013 (The Guardian, 2013).
1.4. OBJECTIVE OF PROJECT The general objective of this study is to investigate the net energy and GHG analyses in
sugarcane production in Mauritius by considering different planter systems.
This objective has been achieved in the following broad steps:
• Conducting a thorough literature search on the life cycle of sugarcane in Mauritius, with
emphasis on manual and mechanical operations.
• Characterising different sugarcane planter systems based on their scale of sugarcane
cultivation.
• Applying a simplified life cycle assessment (LCA) methodology to carry out energy and
GHG balances on these sugarcane planter systems and then comparing the results.
1.5. STRUCTURE OF THE REPORT
• Chapter 2 reviews the current sugarcane industry in Mauritius in terms of its constituent
entities and the interactions among them.
• Chapter 3 describes all the steps involved in producing and delivering sugarcane to the
factory for processing in Mauritius.
• Chapter 4 outlines the methods used and provides the preliminary information necessary
for performing the energy and GHG analyses.
• Chapter 5 delivers and discusses the results of the energy and GHG analyses, as well as
their corresponding sensitivity analyses.
• Chapter 6 presents the main conclusions and recommendations of the study, before
suggesting future works to take over from this project.
-18-

CHAPTER 2: THE SUGARCANE INDUSTRY IN MAURITIUS 2.1. SUGARCANE AGRICULTURE Sugarcane agriculture is the most important part of this study and is considered in detail in
Chapter 3. In addition to being highly site-specific, it is also where the highest potential for
optimisation resides (Johnson & Batidzirai, 2012) and where small- and large-scale production
differ in common practices since, in Mauritius, all harvested sugarcane is delivered to the 5
existing sugar factories for processing. Therefore, the industry side (milling and cogeneration) is
basically the same regardless of the source of sugarcane.
2.1.1. Sugarcane sectors Sugarcane is cultivated in different regions all over the island and these are referred to as
sugarcane sectors. Sugarcane sectors are characterised to indicate the different geographical and
climatic conditions to which sugarcane fields are subjected in Mauritius. A brief description of
each sugarcane sector is given in Table 1.
Table 1: Sugarcane sectors in Mauritius
Sector Land topography Climate Mean annual rainfall (mm)
Average temperatures (°C) January July
Northern Undulating lowland plain at less than 175 m altitude
Sub-humid to humid 1,400 26.5 20.5
Eastern Relatively flat from sea level to 350 m
Humid to super-humid 2,400 25.5 19.5
Southern Gradually rising from sea level to 350 m
Humid to super-humid 2,300 25.5 19.0
Western Gently rising from sea level to 275 m Sub-humid 1,125 25.5 19.0
Central Undulating plateau at 275 - 550 m altitude
Humid to super-humid 2,600 23.5 17.5
Source: Mauritius Sugar Industry Research Institute (MSIRI) (2011a)
Optimum growth of sugarcane requires a relative humidity of less than 70% during maturation
and harvesting stages (Schulze et al., 1997; cited in Watson, et al., 2008) as well as average annual
rainfall and temperature ranges of 1,200 mm – 1,500 mm and 26 – 34 °C respectively (Blume,
1985; cited in Watson, et al., 2008). Based on Table 1, it seems that sugarcane sectors in
Mauritius possess a relatively suitable humidity but experience higher rainfall and lower
temperatures than those required for optimum sugarcane cultivation. Nevertheless, rainfall and
temperatures are not uniform all year round and therefore, sugarcane generally grows well in
the country.
-19-

2.1.2. Sugarcane planters In the Mauritian sugar industry, there are three categories of growers: miller (or estate), metayer
(or tenant), and “owner” planter (Statistics Mauritius, 2012b). Millers are referred to as the
sugar industry’s corporate sector and possess sugar factories as well as very large sugarcane
fields around these factories; whereas metayers are employed by millers to grow sugarcane on
their lands. On the other hand, “owner” planters cultivate sugarcane on their own plots of land
and sell their harvested crops to millers.
MSIRI (2011a) categorises planters as miller, large (> 42 ha), medium (10 – 42 ha) and small (<
10 ha). This same classification was used in this research project, although small-scale was
redefined as being less or equal to 10 ha, as was commonly observed in literature. Moreover,
since the sugarcane field area cultivated by a miller-planter was not found in literature, it was
reasonably inferred to be more than 2,000 ha by estimating greatest possible field area for large-
planters (Statistics Mauritius, 2012b) and considering the miller-planter with the smallest
sugarcane cultivation area (Omnicane, 2012). It is also worth noting that in the case of a miller-
planter, only one person, namely the agronomist, is responsible for sugarcane cultivation on all
the fields belonging to this estate since virtually all of the operations are done mechanically.
Table 2 gives the number of sugarcane planters, excluding miller-planters, in Mauritius in 2011
and the corresponding size of their sugarcane plantations. With ‘small-scale’ defined as less or
equal to 10 ha, it is found that 18,650 out of a total of 18,749 planters are small-scale farmers,
which is equal to 99.5%. This, in addition to the fact that the number of tenant planters is
negligible as compared to that of owner planters, leads to the reasonable assumption that
information about owner planters in Mauritius refers to small-scale farmers. In this project, the
term ‘smallholders’ is used interchangeably with ‘small-scale farmers/planters’. Adding the total
area of 26,467 ha harvested by these planters to that of miller-planters, a final total area of
56,668 ha (Statistics Mauritius, 2012b) was harvested from the 59,724 ha of land under
sugarcane cultivation.
-20-

Table 2: Distribution of planters by size of sugarcane plantation in Mauritius
Size of plantation (ha)
Number of planters Area harvested (ha) Owner Tenant Total
Up to 0.250 4,800 29 4,829 779 0.251 - 0.500 4,824 52 4,876 1,854 0.501 - 1.000 4,758 126 4,884 3,601 1.001 - 2.000 2,423 128 2,551 3,684 2.001 - 5.000 1,209 86 1,295 3,777 5.001 - 10.000 205 10 215 1,469 10.001 - 25.000 61 3 64 948 25.001 - 50.000 9 - 9 319 50.001 - 100.000 8 - 8 591 100.001 - 200.000 7 - 7 893 200.001 and over 11 - 11 8,552
Total 18,315 434 18,749 26,467
Source: Statistics Mauritius (2012b)
In 2012, the area of sugarcane fields decreased to 58,000 ha, out of which only 54,139 ha were
harvested. The cane yield over the past years did not vary a lot and was an overall average of
72.9 tonnes/ha in 2012 (Statistics Mauritius, 2013). However, millers have always had the
highest yield among the three categories of growers while metayers’ yield has remained the
lowest. In 2011, they were 82.1 tonnes/ha and 44.6 tonnes/ha respectively, whereas
smallholders’ yield was 66.7 tonnes/ha (Statistics Mauritius, 2012b). These numbers indicate
that there exists a real potential for improving smallholders’ yield.
2.2. SUGAR MANUFACTURE
Conforming to the MAAS, the centralisation of sugarcane activities to only four sugar mills is
well under way, such that in 2011, there were only six sugar factories in operation. Table 3 gives
the area harvested, cane production, yield and sugar production associated with the sugar
factory areas of these six mills in 2011. A sugar factory area has the same name as the sugar mill
responsible for processing its cane. For example, all the different types of planters (small,
medium, large and miller) cultivating sugarcane on the sugar factory area of Belle Vue are
required to deliver their harvested cane to Belle Vue sugar mill only.
In 2012, Mon Loisir sugar mill closed down and the cane from this sugar factory area has since
been shared between Flacq United Estates Ltd (FUEL) and Belle Vue (which has been
renamed Terra Milling Ltd). In the east of the country, FUEL merged into Deep River Beau
Champ to form a new group called Alteo Ltd, although they are still two distinct sugar factories
(Alteo Ltd, 2012c). However, DRBC sugar mill is expected to close down before the end of
2015.
-21-

Table 3: Area harvested, yield, cane and sugar produced by sugar factory area in 2011
Sugar factory area Area
harvested (ha)
Sugarcane production
(tonnes)
Yield (tonnes/ha)
Sugar production
(tonnes) Belle Vue 8,508 687,039 80.8 72,339
Mon Loisir 4,451 312,523 70.2 30,245 FUEL 13,467 948,120 70.4 85,161 DRBC 8,049 558,653 69.4 69,533
Omnicane 17,634 1,339,320 76.0 136,925 Medine 4,560 384,518 84.3 41,107 Total 56,669 4,230,174 72.1 435,310
Source: Statistics Mauritius (2012b)
Figure 2 gives the position of sugarcane plantations in Mauritius in 2012. Fields held by millers
are differentiated from those held by other planters (including smallholders). The location of
the five sugar factories is also indicated. Clockwise from top, these sugar factories are
respectively Terra Milling Ltd, FUEL, DRBC, Omnicane and Medine; more detailed
information about them can be found in Appendix A.
Figure 2: Sugarcane fields and sugar factories in Mauritius
Source: Adelaide (2013)
-22-

2.3. COGENERATION OF ELECTRICITY Every sugar mill in Mauritius has a cogeneration plant annexed to it. The sugar mill provides
bagasse to the cogeneration plant for electricity production and receives its required electricity
and low-pressure steam from the latter. Most cogeneration plants, also referred to as
Independent Power Producers (IPPs) in Mauritius, are firm producers. This means that they
generate electricity all year round with bagasse during the cane harvest season and coal during
the intercrop season. However, Medine thermal power plant is the only continuous producer,
meaning that it generates electricity only by burning bagasse during the crop season (Statistics
Mauritius, 2011). Details about cogeneration plants in Mauritius are given in Table 4.
Table 4: Cogeneration plants in Mauritius
Cogeneration plant Previous name (if any)
Total installed capacity (MW)
Annexed sugar factory
Terragen Ltd. Compagnie Thermique de Belle-Vue 70.0a Terra Milling
Ltd. FUEL Steam and Power Co. Ltd. - 37.0b FUEL Consolidated Energy Ltd - 25.0c DRBC Omnicane Thermal Energy Operations (La Baraque) Ltd.
Compagnie Thermique de Savannah 89.0d Omnicane
Omnicane Thermal Energy Operations (Saint Aubin) Ltd.
Compagnie Thermique du Sud 34.5d -
Medine - 13.0e Medine
a Source: Terragen (2013) b Source: Alteo Ltd (2012c) c Source: Alteo Ltd (2012a) d Source: Omnicane (2012b) e Source: Statistics Mauritius (2011)
2.4. MARKETS The period from the cultivation of sugarcane to the marketing of sugar manufactured spans
over eighteen months. All locally produced sugar is marketed and exported only through the
Mauritius Sugar Syndicate (MSS), which is an organisation governed by a committee consisting
of 22 individuals working in the sugar industry, out of whom 14 represent the industry’s
corporate sector, 4 represent the large independent planters and 4 are representatives of
smallholders (MSS, 2013). Its main functions include:
• Guaranteeing that all products supplied to the market conform with Quality and Food
Safety norms set by the customers
• Regulating all shipments of sugar from Mauritius
• Selling sugar locally via a network of distributors and packers, and directly to industrial
users
• Paying sugar manufacturers, as well as providing sugarcane growers with financial advances
for their cultivating and harvesting operations
-23-

On the other hand, electricity produced from bagasse cogeneration plants is sold to the grid
after satisfying the internal power needs of both the cogeneration plant and sugar factory. The
Central Electricity Board (CEB) manages the grid and is therefore responsible for supplying
electricity to various customers. Additional institutions in the sugarcane industry in Mauritius
are given in Appendix B.
-24-
CHAPTER 3: SUGARCANE PRODUCTION IN MAURITIUS Sugarcane is reproduced through vegetative propagation using typically two-bud or three-bud
cuttings (Netafim, 2012). The first crop, called the “plant cane” crop, is harvested between 8 to
24 months after planting whereas the stubble or “ratoon” crop, which arises from the portion
of the “plant cane” stalk that remains underground, is usually cut after 12 months. The cycle
repeats itself and lasts between four and ten years (Fauconnier, 1993 cited in Ramdoyal, et al.,
2012) before the need for replanting occurs. Sucrose content and yield normally decrease with
successive ratoons since land preparation for ratoons is not as thorough as for plant canes
(Watson, et al., 2008).
3.1. LAND PREPARATION In Mauritius, sugarcane is normally cultivated with a plant cycle of seven years (MCA, 1997 in
Beeharry, 1998), meaning that land preparation is required only once every seven years.
Optimum soils for sugarcane plantation are well-aerated with loamy or clayey textures
(Netafim, 2012), deeper than 1 m (Schulze, 1997 cited in Watson, et al., 2008) but less 1.5 m
(Netafim, 2012) and with pH ranging from 5.5 to 7.5 (Blume, 1985 cited in Watson, et al., 2008).
The land preparation methods to be used depend on the terrain characteristics at the site.
Gentle slopes enable mechanising land preparation (as well as planting and harvesting) which
results in minimum input costs and maximum productivities when compared to other
topographies where hand-held or animal-driven ploughs are used to till the soil. Nevertheless,
the majority of land preparation for commercial sugarcane production is mechanised (Watson,
et al., 2008). Mechanised land preparation is typically done by agricultural tractor drawn
implements. The corresponding steps are given in detail in Table 5.
Table 5: Steps in land preparation
Step Alternative terms Function Pre-discing Pre-disc
harrowing To break soil lumps and cut weeds or crop remains
Ripping Subsoiling, chiseling
Done at a depth of 50 to 75 cm to break tough compact sub-pan soil layer
Ploughing - To mix residues from previous crops with organic manures
Post-discing Post-disc harrowing
Same function as pre-discing
Landlevelling Landshaping To give the necessary inclination for draining excess water Ridging Furrowing To create 25 cm-deep furrows in which cane setts are later
planted Source: Adapted from Netafim (2006a)
-25-

The process of loosening the surface soil layer is called tillage and it refers to pre-discing,
ripping, ploughing and post-discing altogether. Minimum tillage is recommended, especially in
the case of manual land preparation, to avoid the release of carbon captured in soil to the
atmosphere. In Mauritius, land preparation is reported by Baguant (1998 cited in Beeharry, 1998)
as consisting of ripping and furrowing. In addition to these, Chunen, et al. (1994) also
considered disc harrowing with different disc diameters, which refer to pre- and post-discing.
3.2. FERTILISATION Nitrogen, phosphorus and potassium are three essential nutrients that are needed in large
amounts for sugarcane to grow healthily. Only part of the necessary nitrogen is to be applied at
the planting phase (Netafim, 2006b) since the highest nitrogen requirement occurs when
sugarcane starts to tiller. Phosphorus is also needed to a greater extent during the formative
phase of sugarcane, which is hence the optimum application time for phosphorus, while
potassium is supplied simultaneously with nitrogen. The application times essentially depend on
when the consumption of these nutrients is highest, which is given in Figure 3.
Figure 3: Nutrient requirements at different sugarcane growth stages
Source: Bachchhav (2005) cited in Netafim (2006b)
For Mauritius, Netafim (2006b) recommends a 2-1-1 mixture of N, P and K, with 100 – 125 kg
N/ha. Beeharry (1998) reported fertiliser use in Mauritius as 144 kg N/ha using an average
from the years 1993, 1994 and 1995; Leung Pah Hang (2012) calculated it to be 109 kg N/ha
based on total fertiliser consumption in 2006; while Ramjeawon (2008) used average values of
138 kg N/ha, 50 kg P2O5/ha and 175 kg K2O/ha.
-26-

Regular recommendation sheets published by the MSIRI advise sugarcane planters on the
amount of fertilisers to be applied. For N, the quantity depends on the best possible sugarcane
yield averaged over a period of three years, in addition to the price of fertilisers and sugar
(MSIRI, 2010a), whereas free soil analyses performed by the MSIRI prior to planting determine
the recommendations for P and K (MSIRI, 2013; MSIRI, 2010a). Based on the last
recommendation sheet, it is advised to use 1.4 kg N for every tonne of cane expected. The
MSIRI also recommends applying urea-based fertilisers for plant canes and irrigated ratoon
crops, and nitrate-based fertilisers for non-irrigated ratoons (MSIRI, 2010a).
The values from Ramjeawon (2008) were preferred for this work as his published study
provides reliable average quantities for all three nutrient compounds whereas MSIRI’s method
relies on laboratory analyses to determine the amounts of P and K required, which is too site-
specific. Moreover, almost all published sources report fertiliser requirement in terms of kg/ha
rather than kg/tonne of cane.
3.3. PLANTATION Various kinds of planting materials can be used for vegetative propagation of sugarcane. These
include cane setts, settlings and bud chips (Netafim, 2006c). Three-bud cane setts are most
commonly used as planting material worldwide, since experiments have shown that germination
percentage is higher than in the case of setts with less and more than three buds (Verma 2004
cited in Netafim, 2006c). The recommended seeding rate is around 30,000 three-bud setts per
hectare and at a seeding depth of 10 cm (Netafim, 2012). Both Netafim (2012) and MSIRI
(2006) highly advise dual row planting for sugarcane, depicted in Figure 4. Compared to the
standard row spacing of 1.6 m used since 1999 in Mauritius, dual row planting generally needs
the same amount of planting material and fertilisers, facilitates weed control as the sugarcane
canopy seals 4 – 8 weeks earlier, increases efficiency of chopper-harvesters, and can potentially
improve cane yields (MSIRI, 2006).
Figure 4: Spacings in dual row planting
Source: MSIRI (2006)
-27-

As the planting process simply involves dropping sugarcane setts in the furrows together with
fertiliser and covering them with soil, it is mostly done manually (MSPA, 2008). However, the
use of mechanised plantation by specialised agricultural equipment is on the upward trend in
Mauritius (MSPA, 2008), whereby setts of 25 – 30 cm are appropriate for the mechanical
planter (MSIRI, 2011a). The Hodge cane planter, depicted in Figure 5, has the advantages of
planting an exact density of cane setts at an increased rate, regulating the planting depth, and
preserving soil moisture while not disturbing the soil during planting (MSPA, 2012a).
Figure 5: Hodge cane planter
Source: MSPA (2012a)
3.4. IRRIGATION Under rain-fed conditions, sugarcane grows optimally in locations receiving between 1,200 mm
and 1,500 mm of rainfall annually (Watson, et al., 2008). Based on Table 1, it seems that
irrigation of sugarcane fields is not necessary, except for the western part of Mauritius.
Nevertheless, it is routinely carried out.
In Mauritius, miller-planters use six irrigation systems: overhead (also called sprinkler or big
gun), centre pivot, lateral move (also called linear move), dragline, drip and surface (MSIRI,
2011a). Their use in different regions of the country in 2010 is given in Table 6.
-28-

Table 6: Irrigation systems use in 2010
Sugarcane area under irrigation (ha) Irrigation systems West North East South Centre Total Overhead – Intensive – Occasional
- -
35 1,325
385 1,421
605 135
35 71
1,060 2,952
Centre pivot 1,276 1,256 884 1,943 242 5,601 Lateral move 134 - - - - 134 Dragline 1,845 266 - 831 69 3,011 Drip 11 467 244 474 - 1,196 Surface 193 - - - - 193 Total 3,459 3,349 2,934 3,988 417 14,147 Source: MSIRI (2011a)
As can be observed, the west differentiates from the other regions in that it is the only one not
using overhead irrigation. Instead, it alone uses lateral move and surface irrigation systems.
When compared to previous years, the observed trends are that overhead irrigation systems are
increasingly being used occasionally rather than intensively, the use of surface irrigation keeps
decreasing, and centre pivot remains the most important irrigation system by accounting for
almost 40% of the total sugarcane irrigated area (MSIRI, 2011a).
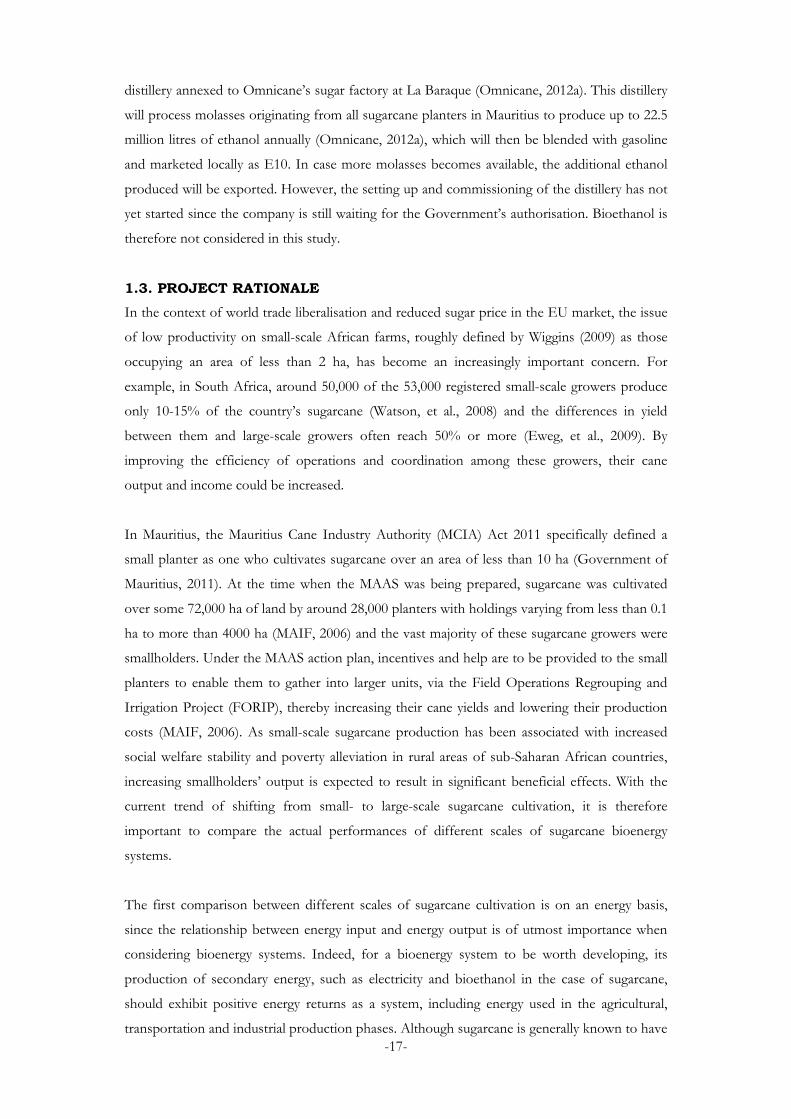
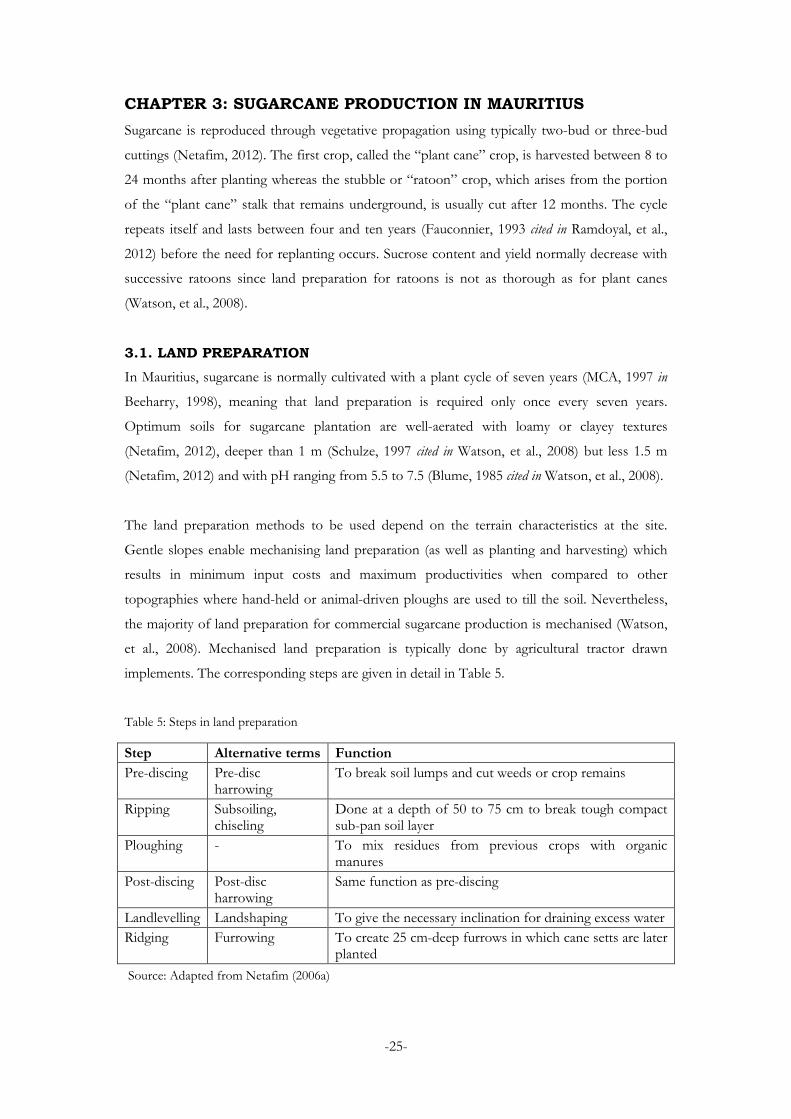
The overhead, centre pivot and dragline irrigation systems are depicted in Figure 6, Figure 7
and Figure 8 respectively. In the overhead irrigation system, water is supplied to the sprinkler at
high speed of 70 – 100 m3/h and high pressure of more than 7 bars (MSPA, 2012b). In the
centre pivot system, small sprinklers spray 1.5 m3/h of water at 3.5 bars, entirely covering the
circular field (MSPA, 2012b). Finally, the dragline consists of a pipe system with an average
pressure of 5 bars and a sprinkler delivering 2 m3/h of water at 3.5 bars. The dragline has a low
electricity consumption but it must be manually moved twice daily to another part of the field
(MSPA, 2012b).
Figure 6: Overhead
Source: MSPA (2012b)
-29-
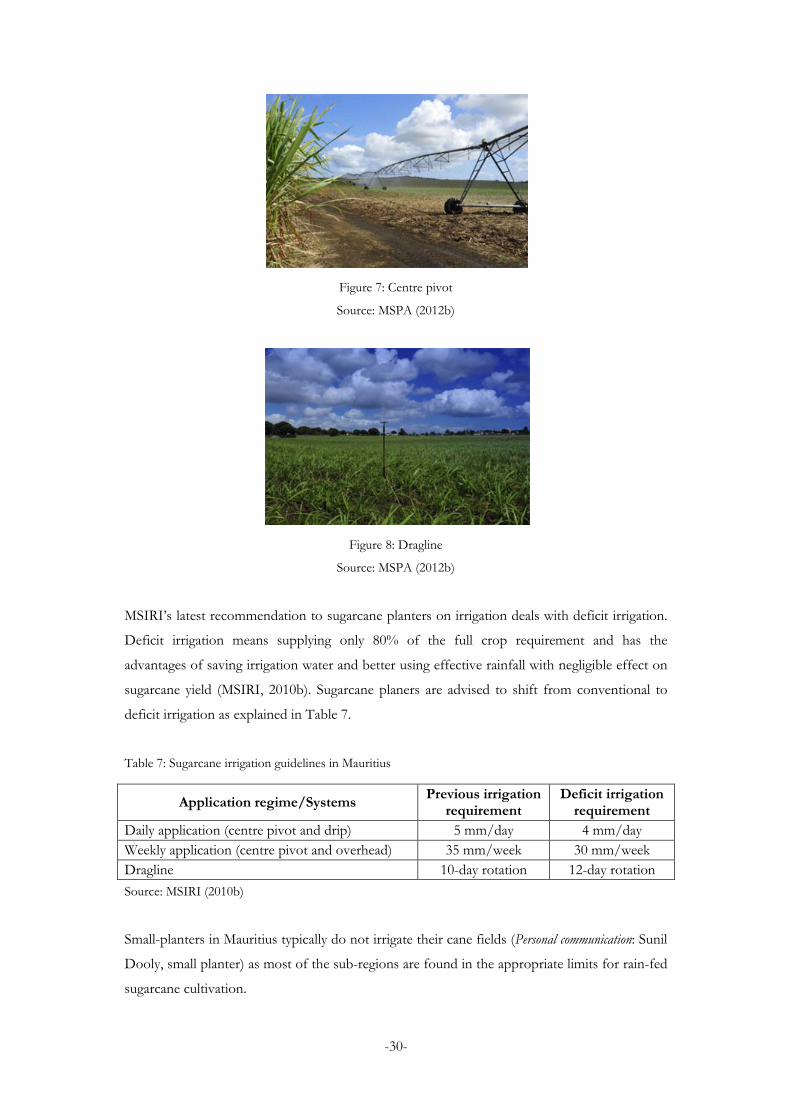
Figure 7: Centre pivot
Source: MSPA (2012b)
Figure 8: Dragline
Source: MSPA (2012b)
MSIRI’s latest recommendation to sugarcane planters on irrigation deals with deficit irrigation.
Deficit irrigation means supplying only 80% of the full crop requirement and has the
advantages of saving irrigation water and better using effective rainfall with negligible effect on
sugarcane yield (MSIRI, 2010b). Sugarcane planers are advised to shift from conventional to
deficit irrigation as explained in Table 7.
Table 7: Sugarcane irrigation guidelines in Mauritius
Application regime/Systems Previous irrigation requirement
Deficit irrigation requirement
Daily application (centre pivot and drip) 5 mm/day 4 mm/day Weekly application (centre pivot and overhead) 35 mm/week 30 mm/week Dragline 10-day rotation 12-day rotation Source: MSIRI (2010b)
Small-planters in Mauritius typically do not irrigate their cane fields (Personal communication: Sunil
Dooly, small planter) as most of the sub-regions are found in the appropriate limits for rain-fed
sugarcane cultivation.
-30-

3.5. WEED CONTROL The growth of sugarcane crops is usually affected by weeds, diseases, insects and fungi. In the
Mauritian sugarcane industry, the total volume of insecticides applied is negligible since
insecticide application is done only in February near the airport, to prevent invasion by insects
that could be brought by planes, and when there are serious army worm attacks in sugarcane
fields (AGRECO Consortium, 2007). Fungicides are used in a very limited amount of around
600 kg of a.i. annually whereas herbicides remain the most used biocide with an annual rate of
7.4 kg a.i./ha (AGRECO Consortium, 2007).
Weeds have to be destroyed by herbicides as they compete with sugarcane for resources and
may also host pests and diseases (Watson, et al., 2008). Herbicides are applied manually, aerially
or by tractors (Blume, 1985 cited in Watson, et al., 2008) and have increasingly been used in
Mauritius to compensate for the manual weeding carried out by off-season labour dismissed
through the VRS (AGRECO Consortium, 2007).
3.6. HARVESTING In Mauritius, “plant cane” and “ratoon” crops are typically harvested after 18 and 12 months
respectively (Beeharry, 1998). There are 27 commercial sugarcane varieties cultivated in
Mauritius and some of them have harvesting periods starting as early as in June whereas others
are harvested as late as in November (MSIRI, 2011b).
Best practices in sugarcane harvesting include (Netafim, 2012):
• Harvesting at peak maturity whereby sucrose content is highest
• Cutting the sugarcane crops to ground level so that the bottom sucrose-rich internodes
increase the biomass and sugar yields
• Detopping the canes at the appropriate height to remove the top immature internodes
• Cleaning the crops properly to remove extraneous matter such as leaves and trash
3.6.1. Green and burnt harvesting Sugarcane is harvested either green or burnt. Despite its adverse effects on the atmosphere,
burning cane before harvesting to eliminate extraneous matter is still a common worldwide
practice. This is because, in addition to considerably improving the efficiency of harvesting,
loading and transporting; burnt cane is crushed at a better rate and the extracted juice is of
higher purity than in the case of green cane. More than 80% and almost 100% of sugarcane is
burnt in South Africa and in other southern African countries respectively (Watson, et al.,
2008).
-31-

With increased environmental consciousness, sugarcane burning in Mauritius decreased to less
than 10% of the cultivated cane area in 2005 (AGRECO Consortium, 2007). Small planters do
not burn sugarcane in their fields as most of them have plots which are too small to be divided
for burning (AGRECO Consortium, 2007). On the other hand, miller-planters still burn
sugarcane prior to mechanical harvesting to take advantage of the better efficiency of
mechanical harvesters. Nevertheless, this practice decreased from 20 – 25 % (AGRECO
Consortium, 2007) to 11% (MSIRI, 2011a) of miller-planters’ mechanically harvested fields
from 2006 to 2010 respectively and was reported to be localised and with reduced air emissions
due to the use of “cool burning” (early in the morning from 4 to 6 a.m.). Indeed, “cool
burning” decreases the 200 – 500 kg/ha of particulate matter emitted on a dry basis by
conventional burning (from 4 to 6 p.m.) by 30 – 50 % (Cahoolessur, 2002).
3.6.2. Manual and mechanical harvesting Sugarcane harvesting is done either manually or mechanically and both techniques are
applicable to green and burnt canes. Manual harvesting is performed using various kinds of
hand knives or hand axes which typically have a heavier blade for easier and efficient cane
cutting (Netafim, 2006d). Mechanical harvesting is increasingly being used on large-scale
sugarcane cultivation due to shortage of harvesting labour. Depending on their size, mechanical
harvesters can cover 2.5 – 4 ha per day of 8 hours (Netafim, 2006d).
In Mauritius, mechanical harvesting is done by chopper harvesters and whole-stalk harvesters.
1,851,003 tonnes of sugarcane were harvested from 21,200 ha by 42 chopper harvesters and 1
whole-stalk harvester in 2010 (MSIRI, 2011a). The 5.1% increase in area under mechanical
harvesting as compared to 2009 confirmed the upward trend of mechanical harvesting.
However, mechanical harvesting can be done only in the sub-humid and humid regions, which
receive less than 2,500 mm of rainfall annually (Beeharry, 1998), because mechanical harvesters
have the tendency of picking up large quantities of soil in wet conditions (Stutterheim, 2006).
Although manual harvesting is being considerably reduced, it is still being practised in regions
unattainable by machines, such as steep slopes (Chand, 2010) and isolated small fields within
built-up regions. Other inconvenient places for mechanical harvesting are those having deep
drains in super humid regions or those with very rocky soils (MCA, 2009).
A chopper harvester operates by pushing the sugarcane stalks over and cutting or breaking
them at the base (Beeharry, 1998). The stalks are then drawn into the machine where they are
chopped into billets, before being raised onto a carrier, past one or two blower fans for removal
of extraneous matter. The so-formed billets are then dropped into a tractor-drawn trailer of
around 5 tonnes capacity in the case of in-field loading, where the topography or soil condition
-32-
does not allow the operation of larger units, as depicted in Figure 9 (Beeharry, 1998; Watson, et
al., 2008). The tractor-drawn trailer then transfers the cane to a road vehicle, typically a lorry of
20 – 25 tonnes capacity or a self-loader truck capable of transporting 35 tonnes (MSPA, 2012c).
If the field conditions allow, harvested cane can also be transferred directly from the chopper
harvester to the truck for road transport to the mill.
Figure 9: Chopper harvester with tractor-drawn trailer
Source: MSPA (2012d)
A whole-stalk harvester is equipped with gathering arms and chains which grip the cane. A base
cutter and a topper, which are both adjustable, then respectively severs the bottom of the stalk
and cuts off the cane tops. Finally, the whole-stalk harvester drops the cane to the ground,
assembling the cane stalks in piles (Beeharry, 1998).
3.7. LOADING Similarly to harvesting, cane loading is increasingly being carried out mechanically. Depending
on the harvesting method, there are two basic mechanical loading techniques. The first one
forms part of the chopper harvester operation, as described in Section 3.6, while the second
technique uses a grab loader which picks up whole cane stalks, harvested and gathered in piles,
and puts them into trucks (Beeharry, 1998). The grab loader can be a small grab which picks up
0.25 – 0.75 tonnes of cane stalks or a crane-grab handling cane loads weighing more than 3
tonnes (Beeharry, 1998).
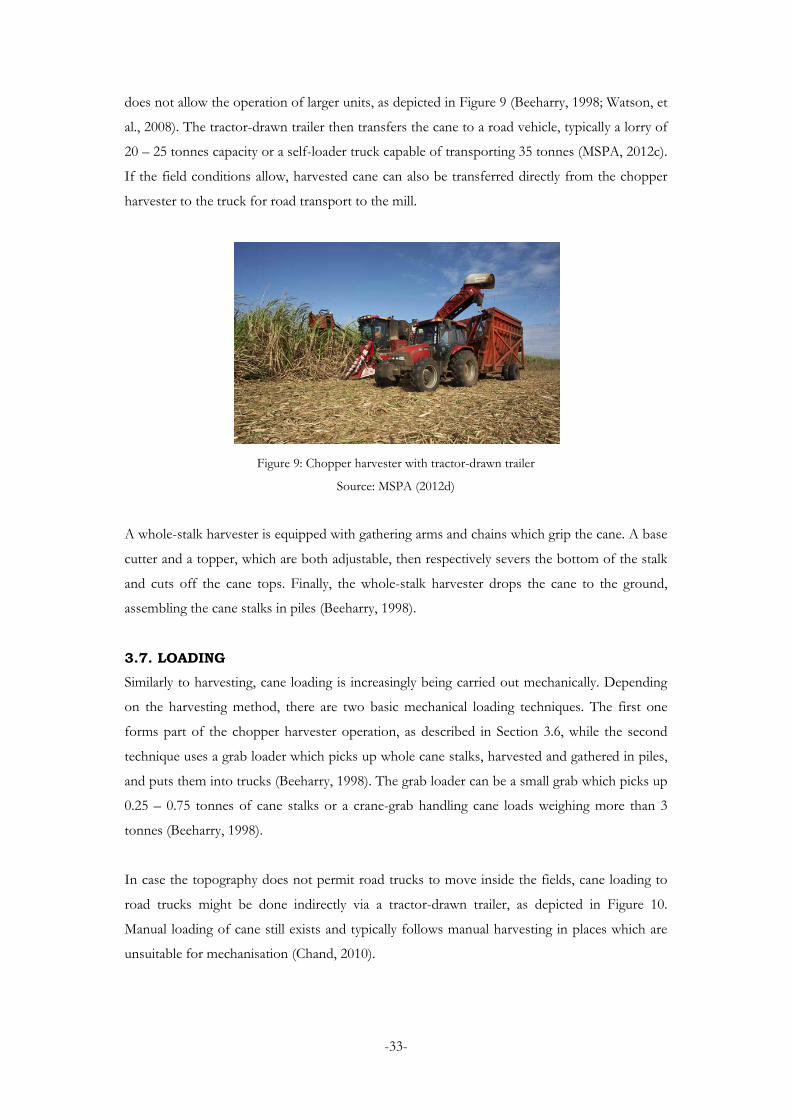
In case the topography does not permit road trucks to move inside the fields, cane loading to
road trucks might be done indirectly via a tractor-drawn trailer, as depicted in Figure 10.
Manual loading of cane still exists and typically follows manual harvesting in places which are
unsuitable for mechanisation (Chand, 2010).
-33-

Figure 10: Cane transfer to road truck
Source: MSPA (2012d)
3.8. DELIVERY The average distance between a sugar factory and its own field in Mauritius is 7 km (Leung Pah
Hang, 2012; Beeharry, 1998). However, with centralisation, many sugar factories have closed
down and been converted to loading sites; thereby considerably increasing the average distance
over which sugarcane is transported from field to factory. Leung Pah Hang (2012) estimated
this distance to be 21.26 km.
The greater distance over which cane has to be transported resulted in the use of lorries with
higher capacities. Millers carry cane from their own fields to their factories in lorries or self-
loader trucks of 20 – 25 tonnes and 35 tonnes capacity respectively (MSPA, 2012c), as
mentioned in Section 3.6. The average diesel consumption of such vehicles was found to be
0.0204 L/tonne-km (Leung Pah Hang, 2012).
“Owner” planters, being mainly smallholders, supply their cane to sugar mills via middlemen.
Middlemen typically use trucks of lower capacity (less than 20 tonnes) to transport sugarcane to
the mill located in the same sugar factory area where the cane has been harvested. These trucks
have an average diesel consumption of 0.075 L/tonne-km (Ramjeawon, 2008; Beeharry, 1998).
-34-
CHAPTER 4: METHODOLOGY
In this study, carrying out energy and GHG analyses forms the core of the methodology used.
The energy analysis is adapted from the life cycle methodology used by Khatiwada & Silveira
(2009) but only considers the energy inputs inventory of sugarcane agricultural operations (both
manual and mechanical) and delivery to sugar mills in detail. For the industrial side (sugar mill
and cogeneration plant), electricity generated from combusted bagasse is the only energy flow
taken into account. This simplified approach is considered sufficient to satisfy the objective of
comparing the different sugarcane planter systems since the industrial side is basically the same,
regardless of how the sugarcane is produced.
For the GHG analysis, a simplified LCA is used. The LCA technique enables evaluating the
total environmental performance of a product from cradle to grave (Khatiwada & Silveira,
2011) and many studies (Beeharry, 2001; Gil, et al., 2013; Macedo, et al., 2008; Mashoko, et al.,
2013; Ramjeawon, 2008) have used it on sugarcane bioenergy systems. However, for this study,
a detailed LCA is not carried out since only GHG emissions from the main sources are
considered.
Both energy and GHG analyses are performed using Microsoft Excel instead of dedicated LCA
softwares since Microsoft Excel is simpler and offers the flexibility needed for this project. The
methodology of this study therefore essentially consists of the necessary steps to conduct the
energy and GHG analyses, the actual analyses and the interpretation of the results.
4.1. DATA COLLECTION Both qualitative and quantitative data collection were required for performing the energy and
GHG analyses and these were realised by an extensive continuous literature review and a
fieldwork in Mauritius in May 2013. Literature review sources included journal articles, websites
and published reports whereas the fieldwork consisted of interactions with small-planters,
miller-planters, researchers at the MSIRI and the University of Mauritius (UoM), and review of
locally-published newspapers and documents available at the MSIRI and UoM libraries.
4.2. CHARACTERISATION OF SUGARCANE PLANTER PROFILES The data collection process revealed that sugarcane agricultural practices, particularly with
respect to the level of mechanisation, are very heterogeneous among the categories of
sugarcane planters in Mauritius as well as within each category. This observation makes any
comparative analysis very challenging. Nevertheless, in an attempt to analyse the main
differences, it was decided to develop all 4 categories of sugarcane planters in Mauritius, namely
small-planter, medium-planter, large-planter and miller-planter, and to attribute to each category
-35-

its most common features. This means that, for example, the medium-planter modelled in this
study possesses the characteristics found in the majority of medium-planters in Mauritius.
4.2.1. Small-planter For a more interesting analysis, the small-planter profile is divided into “small-planter A” and
“small-planter B”. “Small-planter A” is one who does all the operations without any
mechanisation and is also representative of small-scale sugarcane planters in least developed
countries whereas “small-planter B” is the typical one in Mauritius.
Based on a survey with 800 small-planters in Mauritius, Pillay et al. (2010) found that the
majority (91%) of them use conventional mechanical land preparation by contracting the
services of the Sugar Planters Mechanical Pool Corporation (SPMPC) while the rest performed
minimum tillage or manual land preparation. This observation is the main reason to divide
small-planters into two sub-categories and is also used to confidently assume that all the other
categories of planters with larger cultivation scales practise mechanical land preparation as well.
“Small-planter B” performs fertilisation, weed control, harvesting and loading manually (MAIF,
2009; Bhaugeerutty, 2010 and Pillay, et al., 2010).
Moreover, most small-planters in Mauritius plant sugarcane setts manually and do not irrigate
their fields (Personal communication: Sunil Dooly, small planter, 28 May 2013). As the planting
process is simple, it can be assumed beyond doubt that this operation is done manually for all
categories of planters except for miller-planters and no indication of the contrary was found in
literature. Concerning irrigation, its absence from small-planters’ fields was indeed one of the
key drivers for FORIP (Bhaugeerutty, 2010).
Cane delivery is done by middlemen’s trucks of capacity less than 20 tonnes for all categories of
planters, except for miller-planters where bigger lorries carrying more than 20 tonnes are
typically used. Moreover, “small-planter A” is assumed to manually bring water to their fields
for irrigation purposes and perform weed control by manually removing the weeds, without
applying any herbicides.
4.2.2. Medium-planter In a survey of 240 planters who were all cultivating on fields greater than 10 ha, Pillay et al.
(2001) found that all medium-planters fertilised their lands manually and used herbicides, as
well as manual weeding occasionally, to eliminate weeds. Moreover, most of them harvested
cane manually but loaded it mechanically. Based on 2 surveys (Jhoty, et al., 2001 and Pillay, et
-36-

al., 2001) surface irrigation, more specifically wild flooding, can be inferred as the most
common irrigation technique used by medium-planters.
4.2.3. Large-planter In addition to owner-planters with fields greater than 42 ha, this category also includes FORIPs
made up of regrouped small-planters’ plots. An example of a FORIP is that of Queen Victoria
1, established in 2006/2007, regrouping 27 small-planters and having a total area of 54 ha
(MAIF, 2009). A FORIP is treated like a large-planter’s field because it is managed by a single
entity and agricultural practices are applied uniformly across the FORIP. As more and more
FORIPs are being implemented, their cultivation techniques are increasingly redefining the
large-planter category.
On FORIPs, fertilisation, weed control (by spraying herbicides) and harvesting are all
mechanised and no cane burning is performed (MAIF, 2009). Mechanical harvesting is assumed
to be logically followed by mechanical loading. The centre pivot can confidently be stated as the
irrigation technique used on FORIPs because of its greater water application efficiency, fewer
labour requirement and easier operation (Monty, 2000 and Teeluck, 1998 cited in Jhoty, et al.,
2001) and of its upward trend in use (MSIRI, 2011a).
4.2.4. Miller-planter
Miller-planters are modelled as having fully mechanised operations, although manual
intervention still exists to a very small extent and occasionally. Mechanical planting is the main
difference between the miller-planter and the large-planter profile, given that this operation was
done over 488 ha with four billet planters at a miller-planter’s fields, namely Médine, as early as
in 2006 (MSIRI, 2007). With regards to the irrigation technique, the centre pivot is definitely
the most commonly used on miller-planter estates (MSIRI, 2011a).
4.2.5. Sugarcane planter profiles Based on the description of all categories of sugarcane planters in Mauritius, their profiles have
been summarised in Table 8. Their operations are essentially described as being conducted
either manually or mechanically, with manual operations typically having number of man-hours
as input energy and mechanical operations consuming diesel energy. A general shift from
manual to mechanical can be observed when moving from small- to miller-planter.
-37-

Table 8: Sugarcane planter profiles
“Small-planter A”
“Small-planter B”
Medium-planter
Large-planter
/FORIP
Miller-planter
Cane yielda (tonnes/ha)
46.68 66.47 72.58 81.15 81.15
Operation Land preparationb
Manual Mechanical Mechanical Mechanical Mechanical
Fertilisation Manual Manualc Manuald Mechanicale Mechanical Plantation Manual Manualf Manual Manual Mechanical Irrigation Manual Nonef Surface (wild
flooding)g Electric (Centre pivot)
Electric (Centre pivot)h
Weed control
Manual weeding
Manual weedingc /spraying of herbicides
Manual weedingd /spraying of herbicides
Mechanical spraying of herbicidese
Mechanical spraying of herbicides
Harvesting Manual Manualc Manuald Mechanicale Mechanical Loading Manual Manualc Mechanicald Mechanical Mechanical Delivery Trucks
(Capacity < 20 tonnes)i
Trucks (Capacity < 20 tonnes)i
Trucks (Capacity < 20 tonnes)i
Trucks (Capacity < 20 tonnes)i
Trucks (Capacity > 20 tonnes)j
a Calculation of the cane yield for each planter is explained in Appendix C. b Source: Pillay, et al. (2010) c Source: MAIF (2009); Bhaugeerutty (2010) and Pillay, et al. (2010) d Source: Pillay, et al. (2001) e Source: MAIF (2009) f Source: Personal communication: Sunil Dooly, small planter (28 May 2013) g Source: Jhoty, et al. (2001) and Pillay, et al. (2001) h Source: MSIRI (2011a) i Source: Ramjeawon (2008) and Beeharry (1998) j Source: MSPA (2012c) For each operation, the energy input is usually calculated in the same way with identical MJ/ha.
For example, mechanical land preparation in the case of “small-planter B”, medium-planter,
large-planter and miller-planter consumes the same amount of input energy in MJ/ha.
However, since their cane yields are different, the total field area required to produce a fixed
mass of sugarcane as output is also different, resulting in different total energy consumption for
land preparation.
It should be noted that since all planters in Mauritius use middlemen to deliver sugarcane from
their fields to the factories, the same type of trucks is used for all planters except miller-
planters.
-38-

4.3. MODELLING OF SYSTEM The general system was modelled as given in Figure 11, in which fertilisation refers to fertiliser
application through “Operation 2” and weed control corresponds to herbicide application
through “Operation 5”. Transport of herbicides is not considered as it is relatively negligible in
terms of energy consumption, when compared to fertiliser transport and cane delivery.
Land preparation
Fertilisation
Plantation
Irrigation
Weed control
Harvesting
Loading
Delivery
Sugar mill
Fertilisers
Fertiliser transport
Cogeneration plant
Bagasse
Sugar Electricity Molasses
Figure 11: General modelled system
Operation 1
Operation 2
Operation 3
Operation 4
Operation 5
Operation 6
Operation 7
Operation 8
Herbicides
-39-

The system is modelled based on a field where sugarcane had previously been cultivated,
meaning that initial energy-intensive de-rocking and other land preparation steps to make a plot
of land suitable for agriculture are not considered. The application of filter cake and/or scum is
not considered as it is produced and used within the system. Therefore, fertilisation refers to
application of inorganic (NPK) fertilisers only. Energy input associated with fertilisers refers to
energy required to produce them and is assumed to be fossil-based. Sugar directly produced
from the mill is raw, special or plantation white, but not refined sugar which would require a
refinery.
The functional unit defined for analysing the system is 1,000,000 tonnes of sugarcane delivered
annually to sugar mills because it is the average amount of sugarcane processed yearly by a
typical state-of-the-art sugar factory in Mauritius, as well as around the world (Leung Pah Hang,
2012). It is also the average operating rate of any of the four remaining sugar factories in
Mauritius once the centralisation process is completed in 2015.
4.4. ECONOMIC ALLOCATION Since there are 3 outputs from the system, namely sugar, electricity and molasses, energy input
and GHG emissions from the system need to be appropriately attributed among them by the
method of allocation. Shapouri et al. (1995) (cited in Beeharry, 1998) mentioned 4 bases on
which allocation can be done in LCA: market value, output weight, calorific value and
replacement value of co-product. Khatiwada & Silveira (2011) referred to these same bases but
regrouped output weight and calorific value under a single category. Therefore, according to
them, the 3 types of allocation methods in LCA are economic allocation, mass or energy
allocation, and system expansion (or substitution method).
ISO (2006) (cited in Khatiwada & Silveira, 2011) does not recommend using the system
expansion method. Moreover, mass or energy allocation is found to be unsuitable for this study
since the relationship of mass or energy content of sugar, molasses and electricity does not
match their market value. For instance, sugar (main product) has the biggest market value but a
low energy content relative to both molasses and electricity; whereas electricity has the biggest
energy content but has no mass associated to it. Since, market value of products is the most
important criteria for the profitability of any business, economic allocation method is selected
for this study and economic allocation factors are calculated in Appendix D. Economic
allocation was also selected by Ramjeawon (2008) and Khatiwada & Silveira (2011).
-40-

4.5. ENERGY ANALYSIS The energy analysis considers the energy input to the sugarcane planter system due to each
operation, fertiliser production (converted to energy contained in fertilisers), fertiliser transport
to the field, and herbicide production (converted to energy contained in herbicides). Three
energy performance indicators, namely the net energy value (NEV), the net renewable energy
value (NREV) and the energy yield ratio, are used to evaluate and compare the sugarcane
planter systems.
The NEV evaluates the overall energy gain or loss of a bioenergy system by subtracting energy
inputs associated with the production of a biofuel from the energy content of this biofuel,
which is bagasse electricity in this work, thereby demonstrating whether the system is attractive
from an energy point of view (Khatiwada & Silveira, 2009). The NREV is similar to the NEV,
except that only the fossil fuel energy input is deducted from the energy content of the bagasse
electricity since renewable energy does not deplete. Finally, the energy yield ratio is the ratio of
the energy content of the produced bagasse electricity and the total fossil fuel energy input
required to generate it. Both NREV and energy yield ratio give an indication of the
sustainability of the bioenergy system producing the biofuel (Khatiwada & Silveira, 2009). The
formulae for these energy performance indicators are given as follows:
NEV = Bagasse electricity output – Energy input for bagasse electricity generation
NREV = Bagasse electricity output – Fossil energy input for bagasse electricity generation
Energy yield ratio = Bagasse electricity output
Fossil energy input for bagasse electricity generation
4.6. GREENHOUSE GAS ANALYSIS
GHG analysis results of sugarcane bioenergy systems are influenced by spatial variations, such
as changes in material and energy inputs, and by temporal variations, like carbon stored in the
soil and in the roots and stubble after harvesting and GHG emissions due to decaying dead
plant tissues left in the field (Beeharry, 1998). With regards to the objective of this study, GHG
analysis is carried out by considering spatial variations only. Therefore, the main sources of
GHG emissions are human labour and diesel consumption in the case of manual and
mechanical operations respectively, fertiliser application and the diesel burned for its transport,
and herbicide application. Cane burning is also considered in the case of miller-planters. On the
industrial part, only the emissions due to bagasse combustion are considered. Since the
-41-

wastewater treatment plant is not in the developed system, its emissions are not taken into
account.
Like in the case of energy analysis, the environmental burdens of sugar, electricity and molasses
are allocated based on the market value of these three products. Emissions from returned
residues, namely filter cake and unburnt trash, are not considered as their emission factors are
around seventy-fold lower than those of diesel use and nitrogen fertiliser application
(Khatiwada & Silveira, 2011). Moreover, these residues are produced and consumed within the
system.
Khatiwada & Silveira (2011) used average emission factors from two internationally published
research studies, carried out in Brazil and Thailand respectively, for evaluating greenhouse gas
balance of molasses-based ethanol in Nepal. The unavailability of reliable data on emission
factors in Mauritius requires the use of average values. Although BioGrace (2013) provides
standard emission factors for harmonised calculations of biofuel greenhouse gas emissions in
Europe, the values adopted for this study are those of Khatiwada & Silveira (2011) as they are
believed to better represent the case of developing countries.
The GHG emission performance indicator used is the avoided life cycle GHG emissions,
calculated as follows:
Avoided life cycle GHG emissions (%)
= GHG emissions in coal electricity - GHG emissions in bagasse electricity
100%GHG emissions in coal electricity
×
Coal is the fossil fuel used for comparison purposes because firm cogeneration plants in
Mauritius are already burning coal during the off-crop season. The comparison is done purely
on an energy content basis, without considering the efficiencies of the bagasse or coal electricity
generating systems.
-42-

CHAPTER 5: RESULTS & DISCUSSIONS 5.1. OVERVIEW This chapter first presents the sugarcane planter systems developed by integrating each
sugarcane planter profile, namely “small-planter A”, “small-planter B”, medium-planter, large-
planter and miller-planter into the modelled general system. The detailed results of the energy
and GHG analyses performed over these planter systems are then reported in the second part
of this chapter, along with the discussions, sensitivity analyses and comparisons with other
studies.
5.2. SUGARCANE PLANTER SYSTEMS As the sugarcane planter systems are developed based on the general system, all the elements
are kept. However, those elements that are absent from a particular planter system are denoted
by a box with a dashed border line and with a dashed arrow.
In each case, the functional unit is the delivery of one million tonnes of sugarcane to the sugar
mill annually.
-43-

5.2.1. “Small-planter A” All agricultural operations for “Small-planter A” are manually conducted and the corresponding
system is given in Figure 12.
Land preparation
Fertilisation
Plantation
Irrigation
Weed control
Harvesting
Loading
Delivery
Sugar mill
Manual preparation
Manual application
Manual plantation
Manual irrigation
Manual weeding
Manual harvesting
Manual loading
Use of trucks (capacity < 20
tonnes)
Fertilisers
Fertiliser transport
Cogeneration plant
Bagasse
Sugar Electricity Molasses
Figure 12: “Small-planter A” system
No herbicides
-44-
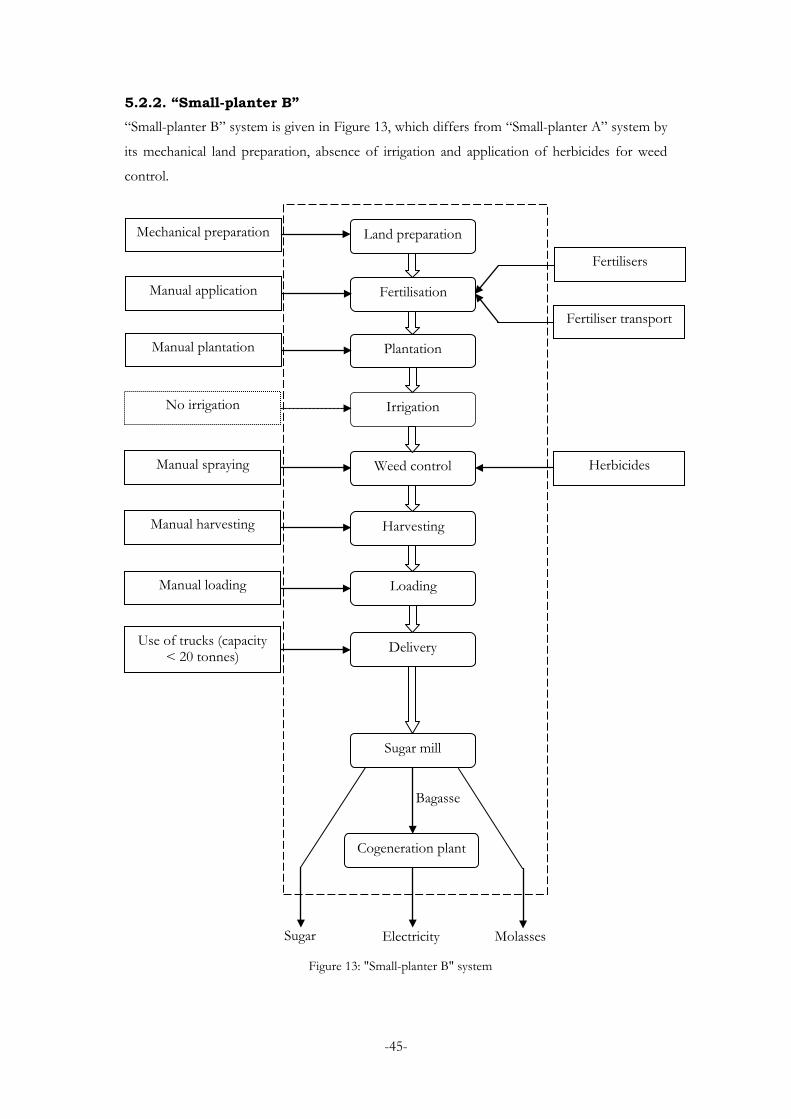
5.2.2. “Small-planter B” “Small-planter B” system is given in Figure 13, which differs from “Small-planter A” system by
its mechanical land preparation, absence of irrigation and application of herbicides for weed
control.
Land preparation
Fertilisation
Plantation
Irrigation
Weed control
Harvesting
Loading
Delivery
Sugar mill
Mechanical preparation
Manual application
Manual plantation
No irrigation
Manual spraying
Manual harvesting
Manual loading
Fertilisers
Fertiliser transport
Cogeneration plant
Bagasse
Sugar Electricity Molasses
Herbicides
Figure 13: "Small-planter B" system
Use of trucks (capacity < 20 tonnes)
-45-

5.2.3. Medium-planter Figure 14 gives the medium-planter system, which differs from “Small-planter B” system with
its surface irrigation and mechanical loading operations.
Land preparation
Fertilisation
Plantation
Irrigation
Weed control
Harvesting
Loading
Delivery
Sugar mill
Mechanical preparation
Manual application
Manual plantation
Surface irrigation
Manual spraying
Manual harvesting
Mechanical loading
Use of trucks (capacity < 20 tonnes)
Fertilisers
Fertiliser transport
Cogeneration plant
Bagasse
Sugar Electricity Molasses
Herbicides
Figure 14: Medium-planter system
-46-

5.2.4. Large-planter/FORIP The system for large-planter/FORIP is given in Figure 15. Moving from medium- to large-
planter corresponds to the greatest increase in mechanisation of operations as application of
fertilisers, irrigation, application of herbicides and harvesting are all mechanised in the case of
large-planter.
Land preparation
Fertilisation
Plantation
Irrigation
Weed control
Harvesting
Loading
Delivery
Sugar mill
Mechanical preparation
Mechanical application
Manual plantation
Centre pivot irrigation
Mechanical spraying
Mechanical harvesting
Mechanical loading
Use of trucks (capacity < 20 tonnes)
Fertilisers
Fertiliser transport
Cogeneration plant
Bagasse
Sugar Electricity Molasses
Herbicides
Figure 15: Large-planter system/FORIP system
-47-

5.2.5. Miller-planter The fully mechanised system for miller-planter is given in Figure 16, in which plantation is
carried out mechanically. In addition to this, miller-planter system also differs from large-
planter system with the use of self-loader trucks with capacity greater than 20 tonnes for
sugarcane delivery from the field to the mill.
Land preparation
Fertilisation
Plantation
Irrigation
Weed control
Harvesting
Loading
Delivery
Sugar mill
Mechanical preparation
Mechanical application
Mechanical plantation
Centre pivot irrigation
Mechanical spraying
Mechanical harvesting
Mechanical loading
Use of trucks (capacity > 20 tonnes)
Fertilisers
Fertiliser transport
Cogeneration plant
Bagasse
Sugar Electricity Molasses
Herbicides
Figure 16: Miller-planter system
-48-

5.3. ENERGY ANALYSIS RESULTS The detailed energy analysis for each planter system is given in the following sub-sections.
5.3.1. “Small-planter A” Sugarcane production = 1,000,000 tonnes/yr
Cane yield = 46.68 tonnes/ha
Field area required = 21,422 ha/yr
Energy input due to operations
For “small-planter A”, energy input for the manual operations is measured in terms of number
of man-hours required, as given in Table 9. Although these values correspond to sugarcane
production in India, it is reasonably assumed that they are the same for Mauritius due to the
unavailability of local data.
Table 9: Average man-hours required per hectare for sugarcane production
Operation Manual labour input (man-hours/ha) Land preparation 47.4a Fertilisation 238.0 Plantation 337.5 Irrigation 392.0 Weed control - Harvesting 920.0 Loading 497.7b Source: Adapted from Yadav (2001)
a Per year (cultivation season) since sugarcane is normally cultivated with a plant cycle of 7 years (MCA, 1997 in Beeharry, 1998; Ramjeawon, 2008) in Mauritius. b Five men are required to work 6 hours daily during 7 days for loading sugarcane from one arpent (Personal communication: Sunil Dooly, small planter, 28 May 2013). Manual labour input was thus calculated to be 497.7 man-hours/ha.
Weed control by manual weeding or manual spraying of herbicides is assumed to require
negligible number of man-hours as it is only lightly done after harvest (Personal communication:
Sunil Dooly, small planter, 28 May 2013). This assumption is further supported by the fact that
Yadav (2001) did not mention weed control when listing the operations involved in sugarcane
production and their respective manual labour input requirements.
Total manual labour input for “Small-planter A” is found to be 2,433 man-hours/ha, which is
significantly higher than 1,632 man-hours/ha in Nepal as reported by Khatiwada & Silveira
(2009). Possible reasons for this difference are that Khatiwada & Silveira (2009) do not include
cane loading as part of the sugarcane farming practices and actual manual labour input for
-49-
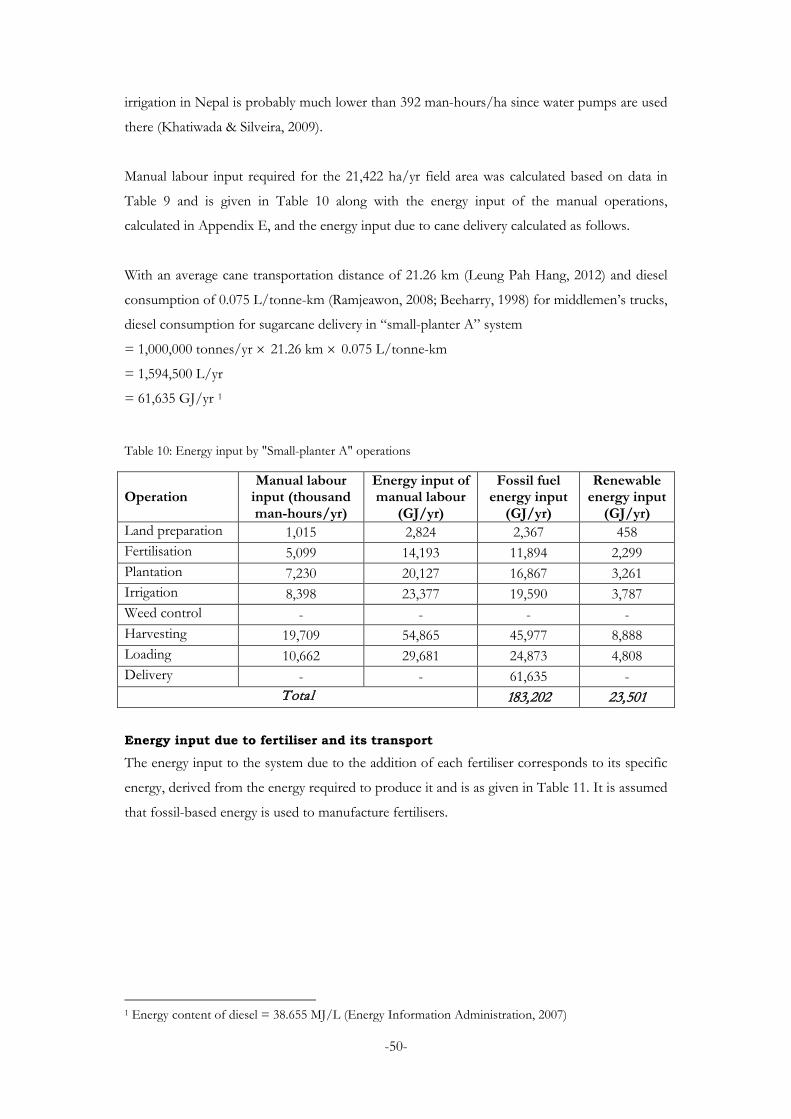
irrigation in Nepal is probably much lower than 392 man-hours/ha since water pumps are used
there (Khatiwada & Silveira, 2009).
Manual labour input required for the 21,422 ha/yr field area was calculated based on data in
Table 9 and is given in Table 10 along with the energy input of the manual operations,
calculated in Appendix E, and the energy input due to cane delivery calculated as follows.
With an average cane transportation distance of 21.26 km (Leung Pah Hang, 2012) and diesel
consumption of 0.075 L/tonne-km (Ramjeawon, 2008; Beeharry, 1998) for middlemen’s trucks,
diesel consumption for sugarcane delivery in “small-planter A” system
= 1,000,000 tonnes/yr × 21.26 km × 0.075 L/tonne-km
= 1,594,500 L/yr
= 61,635 GJ/yr 1
Table 10: Energy input by "Small-planter A" operations
Operation Manual labour
input (thousand man-hours/yr)
Energy input of manual labour
(GJ/yr)
Fossil fuel energy input
(GJ/yr)
Renewable energy input
(GJ/yr) Land preparation 1,015 2,824 2,367 458 Fertilisation 5,099 14,193 11,894 2,299 Plantation 7,230 20,127 16,867 3,261 Irrigation 8,398 23,377 19,590 3,787 Weed control - - - - Harvesting 19,709 54,865 45,977 8,888 Loading 10,662 29,681 24,873 4,808 Delivery - - 61,635 -
Total 183,202 23,501
Energy input due to fertiliser and its transport
The energy input to the system due to the addition of each fertiliser corresponds to its specific
energy, derived from the energy required to produce it and is as given in Table 11. It is assumed
that fossil-based energy is used to manufacture fertilisers.
1 Energy content of diesel = 38.655 MJ/L (Energy Information Administration, 2007)
-50-

Table 11: Energy input due to fertilisers for "Small-planter A"
Fertiliser Average amount used (kg/ha)a
Amount applied (tonnes/yr)
Specific energy (MJ/kg)b
Energy input (GJ/yr)
N 138 2,956 56.3 166,440 P2O5 50 1,071 7.5 8,033
K2O 175 3,749 7 26,243
Total 200,716
a Source: Ramjeawon (2008) b Source: Macedo, et al. (2008)
In Mauritius, fertilisers are transported over an average distance of 20 km from the harbour to
sugarcane fields (Ramjeawon, 2008). With an average of 0.539 tonne of fertiliser2
(undistinguished with regards to NPK content) used per hectare of sugarcane field and a diesel
consumption of 0.105 L/tonne-km (Beeharry, 1998) for transporting fertilisers, amount of
diesel required is 24,258 L/yr, corresponding to an energy input of 938 GJ/yr.
Energy output due to electricity
During harvest, cane tops, trash and leaves are left in the fields (Seebaluck & Seeruttun, 2009)
and therefore, sugarcane delivered to the mill consists essentially of cane stalks. From the
1,000,000 tonnes/yr of sugarcane crushed, 103,950 tonnes/yr of sugar and 30,790 tonnes/yr of
molasses are obtained and 65 GWh/yr of electricity are supplied to the grid (See Appendix D).
Energy performance indicators
Energy input for electricity generation is calculated from total energy input using the economic
allocation factor of 0.0892 (See Appendix D).
NEV
= Energy output due to electricity – Allocation factor of bagasse × (Fossil fuel energy input for
operations + Renewable energy input for operations + Energy input due to fertilisers + Energy
input due to fertiliser transport)
= 234,000 GJ/yr – 0.0892 (183,202 GJ/yr + 23,501 GJ/yr + 200,716 GJ/yr + 938 GJ/yr)
= 197,582 GJ/yr
NREV
= Energy output due to electricity – Fossil energy input for bagasse electricity generation
2 Detailed calculations are given in Appendix F
-51-
= Energy output due to electricity – Allocation factor of bagasse × (Fossil fuel energy input for
operations + Energy input due to fertilisers + Energy input due to fertiliser transport)
= 234,000 GJ/yr – 0.0892 (183,202 GJ/yr + 200,716 GJ/yr + 938 GJ/yr)
= 199,678 GJ/yr
Energy yield ratio
= Energy output due to electricity
Fossil energy input for bagasse electricity generation
=234,000 GJ/yr
0.0892 (183,202 GJ/yr + 200,716 GJ/yr + 938 GJ/yr)
= 6.8177
5.3.2. “Small-planter B” Annual sugarcane production = 1,000,000 tonnes/yr
Cane yield = 66.47 tonnes/ha
Field area required = 15,044 ha/yr
Energy input due to operations
Mechanical land preparation is the main difference between “small-planter B” and “small-
planter A” and, in Mauritius, it consists of the steps given in Table 12 with the respective
energy consumption/input to the system. Considering sugarcane’s plant cycle of seven years,
annual energy consumption for land preparation is also calculated.
-52-

Table 12: Energy input due to mechanical land preparation
Step Diesel
consumption rate (L/h)
Effective yield
(ha/h)
Diesel consumption
(L/ha)
Total diesel consumption
(L/yr)
Total energy consumption
(GJ/yr)a Pre-discingb at Ø610 mm
18.65 1.75 10.66 160,330 6,198
Rippingc 24.07 1.24 19.41 292,031 11,288
Ploughingd 18.52 0.73 25.37 381,674 14,754
Post-discinge at Ø810 mm
20.00 0.94 21.28 320,093 12,373
Ridgingf 15.00 1.00 15.00 225,666 8,723
Total 53,336
Total energy consumption per year (cultivation season) 7,619
a Based on energy content of diesel = 38.655 MJ/L (Energy Information Administration, 2007) b Source: Leung Pah Hang (2012) and Chunen, et al. (1994) c Source: Chunen, et al. (1994) d Source: Chunen, et al. (1994) e Source: Leung Pah Hang (2012) f Source: Leung Pah Hang (2012) and Chunen, et al. (1994)
Labour input, and its equivalent energy input, required for the manual operations on the 15,044
ha/yr field area is calculated based on data in Table 9 and is given in Table 13 along with the
energy input due to mechanical land preparation, calculated in Table 12, and due to cane
delivery, in an identical way as for “Small-planter A”.
Table 13: Energy input by "Small-planter B" operations
Operation
Manual labour input
(man-hours/ha)
Manual labour input
(thousand man-hours/yr)
Energy input of manual
labour (GJ/yr)
Fossil fuel energy input
(GJ/yr)
Renewable energy input
(GJ/yr) Land preparation - - - 7,619 -
Fertilisation 238 3,581 9,968 8,353 1,615 Plantation 338 5,077 14,135 11,845 2,290 Irrigation - - - - - Weed control - - - - -
Harvesting 920 13,841 38,530 32,288 6,242 Loading 498 7,488 20,844 17,467 3,377 Delivery - - - 61,635 -
Total 139,208 13,523
-53-

Energy input due to fertiliser and its transport
With identical average amounts in kg/ha of N, P2O5 and K2O as used for “small-planter A” but
with a field of 15,044 ha/yr, total energy inputs due to fertiliser use and its transport are
140,957 GJ/yr and 659 GJ/yr respectively.
Energy input due to herbicides
With an average herbicide application of 7.4 kg of active ingredient (a.i.) per hectare of
sugarcane field (AGRECO Consortium, 2007) and a specific energy of 265 MJ/kg a.i. of
herbicide (Helser, 2006 cited in Leung Pah Hang, 2012), total energy input due to herbicides for
the 15,044 ha/yr field is 29,502 GJ/yr. Like in the case of fertilisers, it is assumed that fossil-
based energy is used to manufacture herbicides.
Energy output due to electricity
Similar to “small-planter A”, energy output is due to electricity delivered to the grid, which is
equal to 65 GWh/yr for the one million tonnes/yr of sugarcane milled.
Energy performance indicators
NEV
= Energy output due to electricity – Allocation factor of bagasse × (Fossil fuel energy input for
operations + Renewable energy input for operations + Energy input due to fertilisers + Energy
input due to fertiliser transport)
= 234,000 GJ/yr – 0.0892 (139,208 GJ/yr + 13,523 GJ/yr + 140,957 GJ/yr + 659 GJ/yr +
29,502 GJ/yr)
= 205,118 GJ/yr
NREV
= Energy output due to electricity – Fossil energy input for bagasse electricity generation
= Energy output due to electricity – Allocation factor of bagasse × (Fossil fuel energy input for
operations + Energy input due to fertilisers + Energy input due to fertiliser transport)
= 234,000 GJ/yr – 0.0892 (139,208 GJ/yr + 140,957 GJ/yr + 659 GJ/yr + 29,502 GJ/yr)
= 206,324 GJ/yr
Energy yield ratio
= Energy output due to electricity
Fossil energy input for bagasse electricity generation
= 234,000 GJ/yr
0.0892 (139,208 GJ/yr + 140,957 GJ/yr + 659 GJ/yr + 29,502 GJ/yr)
= 8.4551
-54-
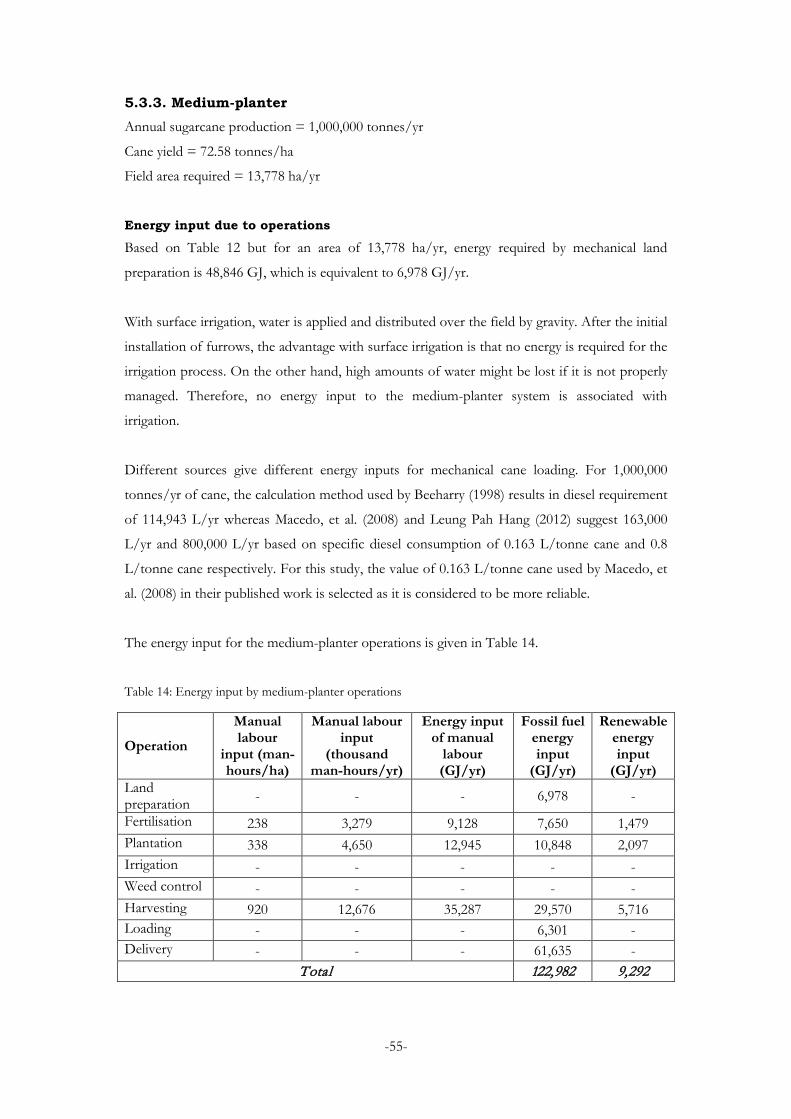
5.3.3. Medium-planter Annual sugarcane production = 1,000,000 tonnes/yr
Cane yield = 72.58 tonnes/ha
Field area required = 13,778 ha/yr
Energy input due to operations
Based on Table 12 but for an area of 13,778 ha/yr, energy required by mechanical land
preparation is 48,846 GJ, which is equivalent to 6,978 GJ/yr.
With surface irrigation, water is applied and distributed over the field by gravity. After the initial
installation of furrows, the advantage with surface irrigation is that no energy is required for the
irrigation process. On the other hand, high amounts of water might be lost if it is not properly
managed. Therefore, no energy input to the medium-planter system is associated with
irrigation.
Different sources give different energy inputs for mechanical cane loading. For 1,000,000
tonnes/yr of cane, the calculation method used by Beeharry (1998) results in diesel requirement
of 114,943 L/yr whereas Macedo, et al. (2008) and Leung Pah Hang (2012) suggest 163,000
L/yr and 800,000 L/yr based on specific diesel consumption of 0.163 L/tonne cane and 0.8
L/tonne cane respectively. For this study, the value of 0.163 L/tonne cane used by Macedo, et
al. (2008) in their published work is selected as it is considered to be more reliable.
The energy input for the medium-planter operations is given in Table 14.
Table 14: Energy input by medium-planter operations
Operation
Manual labour
input (man-hours/ha)
Manual labour input
(thousand man-hours/yr)
Energy input of manual
labour (GJ/yr)
Fossil fuel energy input
(GJ/yr)
Renewable energy input
(GJ/yr) Land preparation - - - 6,978 -
Fertilisation 238 3,279 9,128 7,650 1,479 Plantation 338 4,650 12,945 10,848 2,097 Irrigation - - - - - Weed control - - - - - Harvesting 920 12,676 35,287 29,570 5,716 Loading - - - 6,301 - Delivery - - - 61,635 -
Total 122,982 9,292
-55-

Energy input due to fertiliser and its transport
With identical average amounts in kg/ha of N, P2O5 and K2O as used for small-planters but
with a field of 13,778 ha/yr, total energy inputs due to fertiliser use and its transport are
129,090 GJ/yr and 603 GJ/yr respectively.
Energy input due to herbicides
Similar as in the case of “small-planter B” but for a field of 13,778 ha/yr, energy input due to
herbicides is 27,018 GJ/yr.
Energy output due to electricity
Similar to small-planters, energy output due to electricity exported to the grid is 65 GWh/yr for
the one million tonnes/yr of sugarcane milled.
Energy performance indicators
NEV
= Energy output due to electricity – Allocation factor of bagasse × (Fossil fuel energy input for
operations + Renewable energy input for operations + Energy input due to fertilisers + Energy
input due to fertiliser transport)
= 234,000 GJ/yr – 0.0892 (122,982 GJ/yr + 9,292 GJ/yr + 129,091 GJ/yr + 603 GJ/yr +
27,018 GJ/yr)
= 208,228 GJ/yr
NREV
= Energy output due to electricity – Fossil energy input for bagasse electricity generation
= Energy output due to electricity – Allocation factor of bagasse × (Fossil fuel energy input for
operations + Energy input due to fertilisers + Energy input due to fertiliser transport)
= 234,000 GJ/yr – 0.0892 (122,982 GJ/yr + 129,091 GJ/yr + 603 GJ/yr + 27,018 GJ/yr)
= 209,056 GJ/yr
Energy yield ratio
= Energy output due to electricity
Fossil energy input for bagasse electricity generation
= 234,000 GJ/yr
0.0892 (122,982 GJ/yr + 129,091 GJ/yr + 603 GJ/yr + 27,018 GJ/yr)
= 9.3811
5.3.4. Large-planter/FORIP Annual sugarcane production = 1,000,000 tonnes/yr
-56-
Cane yield = 81.15 tonnes/ha
Field area required = 12,323 ha/yr
Energy input due to operations
Based on Table 12, annual energy required by mechanical land preparation is 6,241 GJ/yr for
the field area of 12,323 ha/yr.
Fertiliser application is done mechanically with a spreader consuming on average 7 L of diesel
per hour and working with an effective yield of 1.5 ha/h and an efficiency of 70% (Personal
communication: Vivian Rivière, MSIRI, 31 May 2013). Using these values and the energy content
of diesel, total diesel energy consumption is calculated to be 3,176 GJ/yr.
Among the irrigation systems listed in Table 6, overhead, centre pivot, lateral move and
dragline involve mechanical movement, with or without the use of sprinklers, and are powered
by electricity-driven pumps (Beeharry, 1998). On the other hand, drip and surface irrigation use
gravity. In Mauritius, electricity-driven irrigation technologies consume an average of 216
kWh/ha (Ramjeawon, 2008; Beeharry, 1998). This value was assumed to be representative of
the centre pivot, which is the most popular system. Using values from 1999 to 2010 (Statistics
Mauritius, 2011), an average of 20.39% of electricity generated in Mauritius is from renewable
sources. Therefore, 44.04 kWh/ha required for irrigation is allocated as renewable whereas
171.96 kWh/ha is considered of fossil origin.
Mechanical spraying of herbicides for weed control is done using a sprayer consuming on
average 7 L of diesel per hour and working with an effective yield of 1.0 ha/h and an efficiency
of 70% (Personal communication: Vivian Rivière, MSIRI, 31 May 2013). Using these values and the
energy content of diesel, total diesel energy consumption is calculated to be 4,763 GJ/yr.
The increasing trend for mechanical harvesting by both large- and miller-planters in Mauritius is
green harvesting using chopper harvesters. Under this mode, 1.1 L of diesel is typically
consumed per tonne of cane harvested (Personal communication: Vivian Rivière, MSIRI, 31 May
2013; Macedo, et al., 2008) resulting in 42,521 GJ/yr of diesel energy consumption for the
1,000,000 tonnes/yr of sugarcane.
Energy inputs for plantation, loading and cane delivery are calculated in the same way as for
medium-planters and are given, along with those of the other operations in Table 15.
-57-
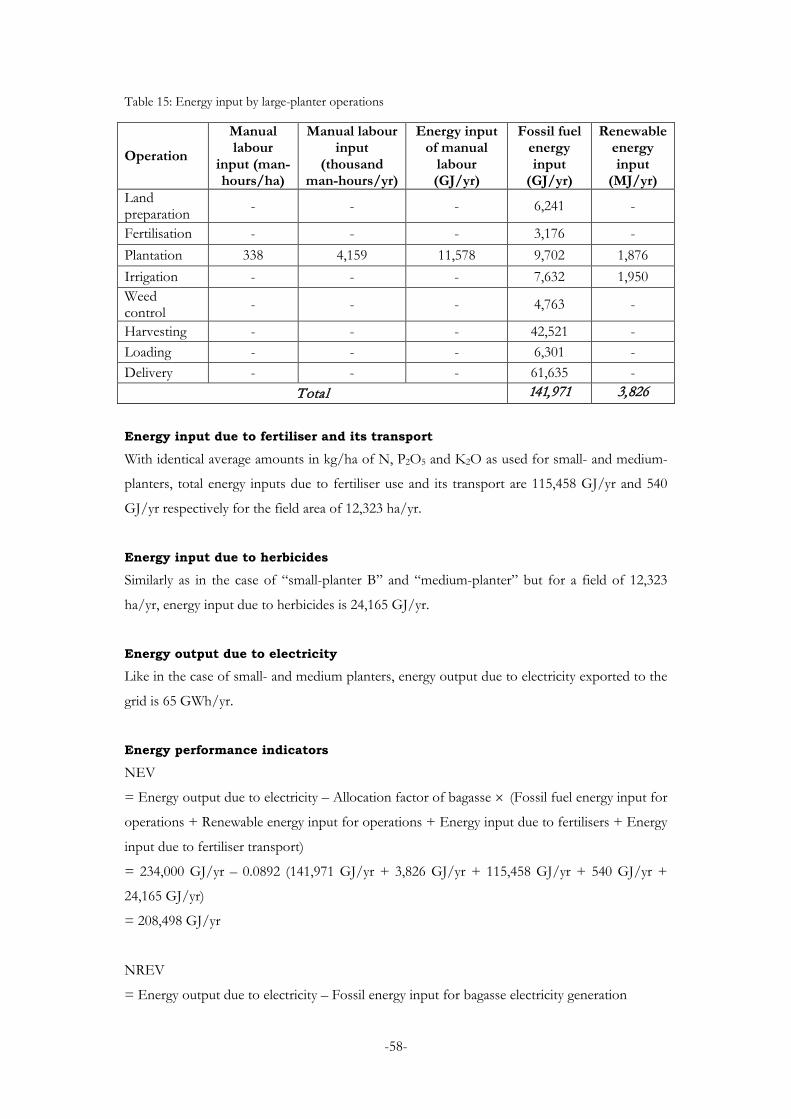
Table 15: Energy input by large-planter operations
Operation
Manual labour
input (man-hours/ha)
Manual labour input
(thousand man-hours/yr)
Energy input of manual
labour (GJ/yr)
Fossil fuel energy input
(GJ/yr)
Renewable energy input
(MJ/yr) Land preparation - - - 6,241 -
Fertilisation - - - 3,176 - Plantation 338 4,159 11,578 9,702 1,876 Irrigation - - - 7,632 1,950 Weed control - - - 4,763 -
Harvesting - - - 42,521 - Loading - - - 6,301 - Delivery - - - 61,635 -
Total 141,971 3,826
Energy input due to fertiliser and its transport
With identical average amounts in kg/ha of N, P2O5 and K2O as used for small- and medium-
planters, total energy inputs due to fertiliser use and its transport are 115,458 GJ/yr and 540
GJ/yr respectively for the field area of 12,323 ha/yr.
Energy input due to herbicides
Similarly as in the case of “small-planter B” and “medium-planter” but for a field of 12,323
ha/yr, energy input due to herbicides is 24,165 GJ/yr.
Energy output due to electricity
Like in the case of small- and medium planters, energy output due to electricity exported to the
grid is 65 GWh/yr.
Energy performance indicators
NEV
= Energy output due to electricity – Allocation factor of bagasse × (Fossil fuel energy input for
operations + Renewable energy input for operations + Energy input due to fertilisers + Energy
input due to fertiliser transport)
= 234,000 GJ/yr – 0.0892 (141,971 GJ/yr + 3,826 GJ/yr + 115,458 GJ/yr + 540 GJ/yr +
24,165 GJ/yr)
= 208,498 GJ/yr
NREV
= Energy output due to electricity – Fossil energy input for bagasse electricity generation
-58-
= Energy output due to electricity – Allocation factor of bagasse × (Fossil fuel energy input for
operations + Energy input due to fertilisers + Energy input due to fertiliser transport)
= 234,000 GJ/yr – 0.0892 (141,971 GJ/yr + 115,458 GJ/yr + 540 GJ/yr + 24,165 GJ/yr)
= 208,839 GJ/yr
Energy yield ratio
= Energy output due to electricity
Fossil energy input for bagasse electricity generation
= 234,000 GJ/yr
0.0892 (141,971 GJ/yr + 115,458 GJ/yr + 540 GJ/yr + 24,165 GJ/yr)
= 9.3000
5.3.5. Miller-planter As miller-planters have a cane yield identical to that of large-planters, the sugarcane field area
required is also 12,323 ha/yr.
Energy input due to operations
The energy inputs for most operations are the same as in the case of large-planters due to the
identical field area. The only differences are with plantation, which is mechanically done, and
cane delivery by using trucks of capacity greater than 20 tonnes.
For a mechanical planter undertaking the entire planting process, the typical diesel consumption
is 10 L/h (Personal communication: Vivian Rivière, MSIRI, 19 July 2013). For an effective yield of
0.4245 ha/h (Average value based on experiments carried out by Chunen, et al. (1994) for
optimal practice) and field area of 12,323 ha/yr, the amount of diesel input is 290,291 L/yr
which corresponds to an energy input of 11,221 GJ/yr.
Diesel consumption for sugarcane delivery
= 1,000,000 tonnes/yr × 21.26 km × 0.0204 L/tonne-km
= 433,704 L/yr
= 16,765 GJ/yr
Energy inputs, separated as fossil fuel energy and renewable energy, for miller-planters’
operations are given in Table 16.
-59-

Table 16: Energy input by miller-planter operations
Operation Fossil fuel energy input (GJ/yr) Renewable energy input (GJ/yr) Land preparation 6,241 -
Fertilisation 3,176 -
Plantation 11,221 -
Irrigation 7,628 1,954
Weed control 4,763 -
Harvesting 42,521 -
Loading 6,301 -
Delivery 16,765 -
Total 98,616 1,954
Energy input due to fertiliser and its transport
With identical fertiliser use and field area as large-planters, total energy inputs due to fertiliser
use and its transport are 115,458 GJ/yr and 540 GJ/yr.
Energy input due to herbicides
Similar to large-planters, energy input due to herbicides is 24,165 GJ/yr.
Energy output due to electricity
Based on a specific mass of 1,000,000 tonnes/yr of sugarcane crushed for all planters, electricity
supplied to the grid is 65 GWh/yr.
Energy performance indicators
NEV
= Energy output due to electricity – Allocation factor of bagasse × (Fossil fuel energy input for
operations + Renewable energy input for operations + Energy input due to fertilisers + Energy
input due to fertiliser transport)
= 234,000 GJ/yr – 0.0892 (98,616 GJ/yr + 1,954 GJ/yr + 115,458 GJ/yr + 540 GJ/yr +
24,165 GJ/yr)
= 212,531 GJ/yr
NREV
= Energy output due to electricity – Fossil energy input for bagasse electricity generation
= Energy output due to electricity – Allocation factor of bagasse × (Fossil fuel energy input for
operations + Energy input due to fertilisers + Energy input due to fertiliser transport)
= 234,000 GJ/yr – 0.0892 (98,616 GJ/yr + 115,458 GJ/yr + 540 GJ/yr + 24,165 GJ/yr)
= 212,705 GJ/yr
-60-

Energy yield ratio
= Energy output due to electricity
Fossil energy input for bagasse electricity generation
= 234,000 GJ/yr
0.0892 (98,616 GJ/yr + 115,458 GJ/yr + 540 GJ/yr + 24,165 GJ/yr)
= 10.9886
-61-

Table 17: Summary of energy analysis results
“Small-planter A” “Small-planter B” Medium-planter Large-planter/ FORIP Miller-planter
Cane yield (tonnes/ha) 46.68 66.47 72.58 81.15 81.15 Field area (ha/yr) 21,422 15,044 13,778 12,323 12,323 Energy input to operations (GJ/yr):
Land preparation Manual 2,367 + 458
Mechanical 7,619
Mechanical 6,978
Mechanical 6,241
Mechanical 6,241
Fertilisation Manual 11,894 + 2,299
Manual 8,353 + 1,615
Manual 7,650 + 1,479
Mechanical 3,176
Mechanical 3,176
Plantation Manual 16,867 + 3,261
Manual 11,845 + 2,290
Manual 10,848 + 2,097
Manual 9,702 + 1,876
Mechanical 11,221
Irrigation Manual 19,590 + 3,787
None 0
Surface irrigation (Wild flooding) 0
Electricity-driven (Centre pivot) 7,628 + 1,954
Electricity-driven (Centre pivot) 7,628 + 1,954
Weed control Manual weeding 0
Manual weeding Manual spraying of herbicides 0
Manual weeding Manual spraying of herbicides 0
Mechanical spraying of herbicides 4,763
Mechanical spraying of herbicides 4,763
Harvesting Manual 45,977 + 8,888
Manual 32,288 + 6,242
Manual 29,570 + 5,716
Mechanical 42,521
Mechanical 42,521
Loading Manual 24,873 + 4,808
Manual 17,467 + 3,377
Mechanical 6,301
Mechanical 6,301
Mechanical 6,301
Cane delivery Trucks (capacity < 20 tonnes) 61,635
Trucks (capacity < 20 tonnes) 61,635
Trucks (capacity < 20 tonnes) 61,635
Trucks (capacity < 20 tonnes) 61,635
Trucks (capacity > 20 tonnes) 16,765
-62-

Energy input due to fertiliser and its transport (GJ/yr)
200,716 938
140,957 659
129,091 603
115,458 540
115,458 540
Energy input due to herbicides (GJ/yr)
0 29,502 27,018 24,165 24,165
Electricity output (GWh/yr)
65 65 65 65 65
Electricity output (GJ/yr)
234,000 234,000 234,000 234,000 234,000
NEV (GJ/yr) 197,582 205,118 208,228 208,498 212,531 NREV (GJ/yr) 199,678 206,324 209,056 208,839 212,705 Energy yield ratio 6.8177 8.4551 9.3811 9.3000 10.9886
-63-
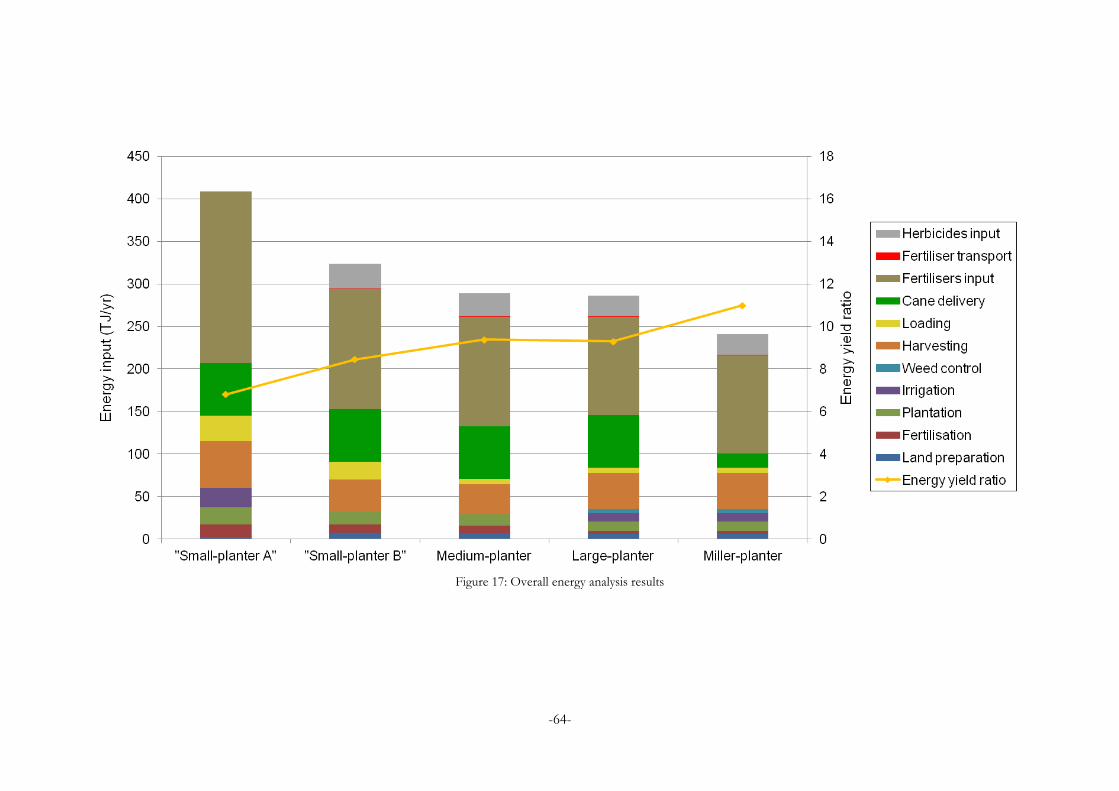
Figure 17: Overall energy analysis results
-64-

5.4. ENERGY ANALYSIS DISCUSSIONS A summary of all energy analysis results is given in Table 17, in which fossil-based energy input
and renewable energy input are presented separately for manual operations and electricity-
driven irrigation. Energy input due to fertiliser is also displayed separately from energy input
due to fertiliser transport. Overall energy analysis results are also depicted in Figure 17 which
highlights the relative shares of the different components with respect to energy input. The
largest energy input to the system is from fertilisers.
Since most of the operations depend on the sugarcane field area, larger fields consume more
input energy, usually in the form of diesel. Comparing the sugarcane planter systems on an
energy basis essentially evaluates how expected increase in input energy consumption due to
mechanisation of operations is offset by the associated higher sugarcane yield.
The positive NEV for all planters indicates that the produced useful energy in the form of
electricity is greater than the required input energy, showing an overall energy gain by such a
sugarcane bioenergy system, which makes it attractive. Considering that renewable energy input
is inexhaustible and hence could potentially not be accounted for as energy input, the system is
even more energetically appealing, as observed from the more positive NREV. With increased
mechanisation when moving from “small-planter A” to miller-planter, the difference between
NEV and NREV for each planter category, representing the renewable energy input, is found
to decrease accordingly.
The energy yield ratio is also observed to be greater than 1 for all planter categories, although
generally increasing in magnitude from “small-planter A” to “miller-planter” and thus showing
an improvement in the bioenergy system’s ability to produce energy significantly in excess of
what it requires.
“Small-planter A” and miller-planter are found to have the least and the most positive NEV,
NREV and energy yield ratio respectively out of the 5 categories of planters. The smaller field
necessary due to higher sugarcane yield seems to over-compensate extensively for the increased
energy input due to mechanisation of operations.
More detailed energy input (without allocation) on a per hectare basis to compare between
manual and mechanical operations is carried out and presented in Table 18. It is observed that
mechanisation of operations does not necessarily result in higher total energy input (both fossil-
based and renewable). Indeed, mechanically conducting fertilisation and irrigation requires less
input energy than manually doing them. The same observation is made with cane loading which
-65-

consumes 29.68 MJ/tonne cane and 6.30 MJ/tonne cane for manual and mechanical loading
respectively. Since fertilisation, irrigation and loading are mechanically done in the case of large-
and miller-planters, the input energy associated with these operations is lower and therefore
helps these planters to have better energy performance indicators than small- and medium-
planters. These results, together with a guarantee of higher cane yields, are strong arguments to
shift towards full mechanisation of operations, whenever possible.
Table 18: Comparison of energy inputs between manual and mechanical operations
Total energy input (MJ/ha) Fossil-based energy input (MJ/ha)
Manual Mechanical Manual Mechanical Land preparation 131.83 506.46 110.48 506.46 Fertilisation 662.55 257.70 555.21 257.70 Plantation 939.53 910.60 787.33 910.60 Irrigation 1,091.25 777.60 914.47 619.02 Weed control 0.00 386.55 0.00 386.55 Harvesting 2,561.10 3,450.54 2,146.20 3,450.54
Due to the identical cane yield for both large- and miller-planters, direct comparison between
them is possible. As the energy input requirements of manual and mechanical plantation are
found to be quite similar, the higher NEV, NREV and energy yield ratio for miller-planters are
the result of more efficient trucks which consume much less diesel for cane delivery. With the
increasing number of large-planters/FORIPs in Mauritius, it is strongly advised to use self-
loader trucks of more than 20 tonnes capacity, currently being used by miller-planters, for cane
delivery to factories.
It is also interesting to observe the quite similar values for energy performance indicators of
medium- and large-planters, where the greatest transition from manual to mechanical
operations occurs. Although large-planters seem to require less input energy overall due to their
higher NEV, their lower NREV and energy yield ratio suggest that they perform worse in terms
of sustainability since fossil-based energy is being favoured instead of renewable energy when
mechanising operations.
On a final note, it should be pointed out that manual operations and electricity-driven irrigation
are strongly dependent on the country’s electricity mix. A greener electricity mix would
positively affect the NREV and energy yield ratio.
-66-
5.4.1. Sensitivity analysis A sensitivity analysis is performed to evaluate the effects of variations in economic allocation
ratio, sugarcane yield and material/energy inputs on NEV and energy yield ratio. Based on
Table 17, the sugarcane planters’ ranking from best to worst performer in NEV was
respectively miller-planter, large-planter, medium-planter, “small-planter B” and “small-planter
A”. The corresponding ranking in energy yield ratio is miller-planter, medium-planter, large-
planter, “small-planter B” and “small-planter A”
Variation in allocation ratio
In this study, the allocation ratios are determined based on the economic values of sugar,
molasses and bagasse electricity, which were 18,682 MUR/tonne, 1,608 MUR/tonne and 3
MUR/kWh respectively. This resulted in an allocation factor of 8.92% for bagasse electricity.
When this allocation factor is increased, both NEV and energy yield ratio decrease for all
planter categories, as depicted in Figure 18. One example when allocation factor of bagasse
electricity increases is the effect of generating more electricity per tonne of cane by using more
efficient cogeneration plants. Based on the economic allocation calculation in Appendix D, if
more electricity is obtained as output, its corresponding economic value will be higher,
provided average price of electricity in MUR/kWh remains constant. A higher economic value
will automatically result in a higher economic share (or allocation factor). Therefore, this
sensitivity analysis suggests that using more efficient cogeneration plants worsens the energy
performance of the system. However, allocation factor might not necessarily increase since
average bagasse electricity price in MUR/kWh typically would be expected to decrease when
more electricity is generated.
Figure 18 also indicates that the NEV and energy yield ratio for “small-planter A” decrease to
the critical limits of 0 and 1 respectively at around 57%-60% allocation factor for electricity.
Any value lower than these limits would mean that it is not worth generating bagasse electricity
as more input energy is required than what is actually obtained from the bioenergy system.
Although the price of sugar is decreasing, it is extremely unlikely that the allocation factor for
bagasse electricity would increase from its current value (indicated in Figure 18 by the grey
dashed arrow) to such a high value since the price at which electricity is purchased from
bagasse cogeneration plants in Mauritius is already argued to be too high and the recent interest
in producing bioethanol would probably increase the economic value of molasses as well.
Therefore, it could be deduced that variation in allocation ratio could hardly affect the energy
performance of bagasse electricity generating systems.
-67-

Figure 18: Variation of NEV and energy yield ratio with allocation factor 5% - 60%
Figure 18 also enables comparing among the different planter categories. Although both the
NEV and energy yield ratio of medium- and large-planters vary in a very similar way with
respect to allocation ratio of bagasse electricity, the difference in NEV between two
consecutive planter categories is found to increase with increasing allocation ratio for bagasse
electricity. This suggests that the contribution of renewable energy input to the system, which is
most significant for “small-planter A”, becomes more important with higher allocation ratio.
This justifies why the NEV for “small-planter A” drops at a much faster rate than that of the
other planter categories, which have a higher level of fossil-based energy input.
It is also interesting to note the much steeper gradient for the energy yield ratio curves at small
allocation factors. This implies that, in this region, a variation in bagasse electricity allocation
factor would bring a large variation in energy yield ratio. To better understand this trend, NEV
and energy yield ratio for the allocation factor range from 2% to 20% are plotted in Figure 19.
Any decrease in the current allocation factor of 8.92% (indicated by the grey dashed arrow) is
therefore found to result in a significant beneficial increase in energy yield ratio. In the case of
“small-planter A”, for example, decreasing the allocation factor to 6% leads to improved NEV
and energy yield ratio of about 210 TJ/yr and 10 respectively.
-68-

Figure 19: Variation of NEV and energy yield ratio with allocation factor 2% - 20%
Finally, this sensitivity analysis suggests that as the price of bagasse electricity decreases, NEV
and energy yield ratio both increases. This could serve as an argument to promote bagasse
electricity generation. As more producers enter the bagasse electricity generation sector,
competition increases and market price of bagasse electricity tends to decrease.
Variation in sugarcane yield
Sugarcane yield determines the cultivation area needed and therefore directly affects the energy
input requirements of the sugarcane planter systems. Since “small-planter A” and “miller-
planter” have the lowest and highest yields, namely 46.68 tonne/ha and 81.15 tonne/ha
respectively, variation in NEV and energy yield ratio is determined over the cane yield range of
35 tonne/ha and 90 tonne/ha and given in Figure 20, in which the grey dashed arrows indicate
the cane yield of each sugarcane planter, as used in the base study.
Miller-planter is found to perform the best both in terms of NEV and energy yield ratio across
the whole range of sugarcane yield considered. When considering the NEV, “small-planter A”,
medium- and large-planters are observed to have a similar variation below around 45 tonne/ha.
Beyond this value, “small-planter A” performs slightly better than medium-planter whereas the
increase in NEV for large-planter occurs at a lower rate. The same trend is noticed when
-69-
considering the energy yield ratios, in which “small-planter A” performs as second-best just
behind “miller-planter”. However, in practice, it is very difficult to increase the cane yield of
“small-planter A” without changing the input energy requirements. The change of manual
farming practices to improve cane yield would typically require the input of additional man-
hours.
“Small-planter B” is found to be the worst performer both in terms of NEV and energy yield
ratio at low sugarcane yields. This suggests that the additional energy requirement due to
mechanical land preparation for small-planters does not serve any useful purpose at low yields.
However, with increase in sugarcane yield, “small-planter B” ultimately performs better than
large-planter as from around 52.5 tonne/ha for energy yield ratio and as from around 65
tonne/ha for NEV.
Overall, this sensitivity analysis shows that both NEV and energy yield ratio increase for all
planter categories when sugarcane yield increases. The relatively greater rate of increase for
both small-planters A and B indicates that small-planters would be the ones, among all planter
categories, to benefit the most from any improvement in sugarcane yield.
-70-
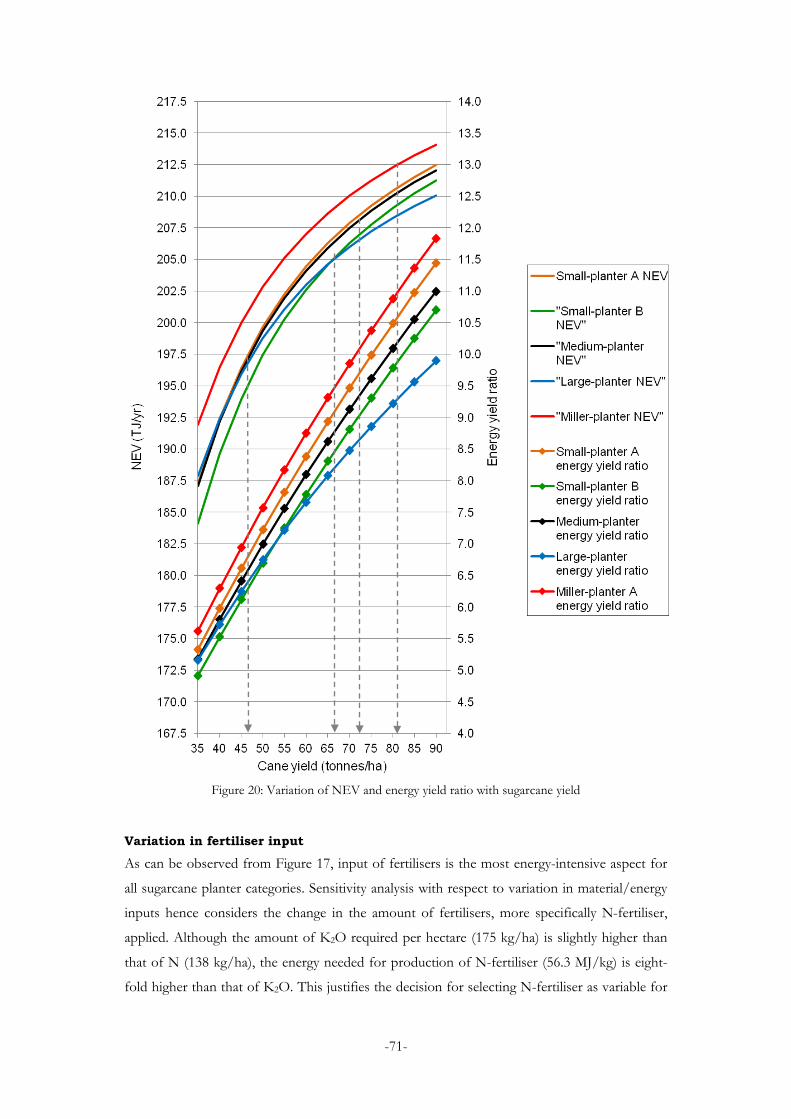
Figure 20: Variation of NEV and energy yield ratio with sugarcane yield
Variation in fertiliser input
As can be observed from Figure 17, input of fertilisers is the most energy-intensive aspect for
all sugarcane planter categories. Sensitivity analysis with respect to variation in material/energy
inputs hence considers the change in the amount of fertilisers, more specifically N-fertiliser,
applied. Although the amount of K2O required per hectare (175 kg/ha) is slightly higher than
that of N (138 kg/ha), the energy needed for production of N-fertiliser (56.3 MJ/kg) is eight-
fold higher than that of K2O. This justifies the decision for selecting N-fertiliser as variable for
-71-

the sensitivity analysis and the results are depicted in Figure 21, in which the current level of N-
fertiliser use is indicated by the grey dashed arrow.
Figure 21: Variation of NEV and energy yield ratio with N-fertiliser input
With increase in the amount of N-fertiliser applied, energy requirement for fertiliser production
also increases. This leads to a general decrease in NEV and energy yield ratio for all planter
categories, as can be observed from Figure 21, thereby negatively affecting the overall energy
performance of the system.
Since the same amount of N-fertiliser, namely 138 kg/ha, is used by all planter categories in the
base study, their respective ranking in energy performance is expected to remain the same with
the same variation in N-fertiliser input. Although this is indeed the case for miller-planter and
small-planters both in terms of NEV and energy yield ratio, it is interesting to find that
medium-planters perform better than large-planters at low N-fertiliser input. Indeed, Figure 21
suggests that large-planters have higher NEV and energy yield ratio than medium-planters only
-72-

as from around 100 kg N/ha and 160 kg N/ha respectively. The existence of these two
different limits is justified by the fact that computation of energy yield ratio does not include
renewable energy as input energy. On the other hand, the fact that the greatest increase in
mechanisation of operations occurs when moving from medium- to large-planter explains that
it is particularly at higher kg N/ha that the positive effect of large-planter’s better sugarcane
yield on NEV and energy yield ratio becomes appreciable.
5.4.2. Comparison with other studies Khatiwada (2010) reported that the total energy requirement for cultivating 1 ha of sugarcane
farmland in Nepal and delivering the so-produced sugarcane to a factory is 45,372 MJ/ha,
which is higher than the 19,062 MJ/ha required by “Small-planter A”. The main reason for this
significant difference was found to be the energy value associated with human labour which is
10.01 MJ/man-h for Nepal and 2.78 MJ/man-h for Mauritius respectively. Indeed, based on
the “Life-Style Support Energy” method, the higher GNP per capita in Mauritius implies a
lower energy equivalent of human labour. Another important reason is the use of diesel for
irrigation pumps in Nepal, which requires 13,227.7 MJ/ha, whereas the manual irrigation by
“Small-planters A” in Mauritius consumes only 1,091 MJ/ha.
Ramjeawon (2008) reported energy yield ratio for bagasse electricity in Mauritius to be around
13, which is slightly higher than the value of 11 obtained for miller-planters in this study. This is
justified as the scope of his work was national and hence considered data essentially available
from miller-planters, despite the fact that he used a slightly higher allocation factor of 10.4%
for bagasse electricity. Moreover, this study considers the energy input to sugarcane farming in
much more detail.
An energy yield ratio of 7.63 was found for bagasse electricity in South Africa (Mashoko, et al.,
2013), which is between the values of 6.8177 and 8.4551 for “small-planter A” and “small-
planter B” respectively. The cane yield of 60 tonne/ha considered in the South African study
was also between the cane yield values of “small-planter A” and “small-planter B”. However,
detailed comparison could not be made because the scopes and practices are different.
-73-

5.5. GREENHOUSE GAS ANALYSIS RESULTS As justified in Section 4.6, the major emission factors used in this study are based on those of
Khatiwada & Silveira (2011) and are given in Table 19.
Table 19: GHG emission factors
Source of GHG emission Emission factors Units Fertilisers: N P2O5 K2O
3.485 1.165 0.700
kg CO2eq/kg kg CO2eq/kg kg CO2eq/kg
Herbicides 25.150a kg CO2eq/kg N2O from fertiliser (N-application) 5.422 kg CO2eq/kg N CO2 from fertiliser (N-application) 1.594 kg CO2eq/kg N Human labour (fossil fuel input) 0.2084b kg CO2eq/man-hour Diesel 0.0836c kg CO2eq/MJ Dry CTLs and trash burnt before harvest 0.090 kg CO2eq/kg dry matter Bagasse combustion for electricity generation 0.203d kg CO2eq/kWh Source: Khatiwada & Silveira (2011)
a Due to unavailability of data about emission factor of herbicides in kg CO2eq/kg a.i., emission factor in kg CO2eq/kg is used instead, assuming it to be reasonably accurate for the main purpose of comparing GHG emissions among the different categories of planters b Calculated from the fossil energy consumed, using the “Life-Style Support Energy” method. Of the 2.33 MJ of fossil energy used per man-hour (See Appendix D), petroleum products and coal account for 66.7% and 33.3% respectively (Statistics Mauritius, 2012a). With average emission factors of 85 kg CO2eq/GJ and 98 kg CO2eq/GJ for petroleum and coal respectively (Khatiwada & Silveira, 2011), emission factor for human labour is calculated as 0.2084 kg CO2eq/man-hour. c Emission factor of diesel in kg CO2eq/MJ was calculated by dividing emission factor of 3.232 kg CO2eq/L (Khatiwada & Silveira, 2011) by energy content of diesel of 38.655 MJ/L. d Source: Beeharry (1998)
5.5.1. “Small-planter A” GHG emissions due to operations
For “small-planter A”, GHG emissions are essentially from human labour, as given in Table 20.
Table 20: GHG emissions due to "Small-planter A" operations
Operation Manual labour input (thousand man-hours/yr)
Diesel energy input (GJ/yr)
Emissions (tonnes CO2eq/yr)
Land preparation 1,015 - 211 Fertilisation 5,099 - 1,062 Plantation 7,230 - 1,507 Irrigation 8,398 - 1,750 Weed control - - - Harvesting 19,709 - 4,107 Loading 10,662 - 2,222 Delivery - 61,635 5,153
Total 16,013
-74-

GHG emissions related to fertilisers
GHG emissions due to production and transportation of fertilisers, as well as after their
application, are given in Table 21. GHG emissions due to the actual application process are
considered in fertilisation.
Table 21: GHG emissions related to fertilisers for “small-planter A”
Source of GHG emissions
Amount input (tonnes/yr)
Emission factors (tonnes CO2eq/tonne)
Emissions (tonnes CO2eq/yr)
Production of N 2,956 3.485 10,303 Production of P2O5 1,071 1.165 1,248 Production of K2O 3,749 0.700 2,624 Diesel consumption for fertiliser transport, MJ 938 0.084 78
N2O from fertiliser (N-application) 2,956 5.422 16,029
CO2 from fertiliser (N-application) 2,956 1.594 4,712
Total 34,995
GHG emissions from bagasse combustion
Bagasse combustion to generate electricity has an emission factor of 0.203 kg CO2eq/kWh
(Beeharry, 1998). As 65 GWh/yr of bagasse electricity is generated, 13,195 tonnes CO2eq/yr are
emitted. This value is constant for all the planter categories.
GHG emission performance indicators
Total GHG emissions
= GHG emissions due to operations + GHG emissions related to fertilisers + GHG emissions
from bagasse combustion
= 16,013 tonnes CO2eq/yr + 34,995 tonnes CO2eq/yr + 13,195 tonnes CO2eq/yr
= 64,202 tonnes CO2eq/yr
Like in the energy analysis, an allocation factor of 0.0892 was used.
Therefore, GHG emissions in bagasse electricity = 0.0892 × 64,202 tonnes CO2eq/yr
= 5,726 tonnes CO2eq/yr
GHG emissions per unit bagasse electricity = 2eq5,726 tonnes CO /yr 65 GWh/yr
= 0.0881 kg CO2eq/kWh
Coal emission factor = 98 kg CO2eq/GJ (Khatiwada & Silveira, 2011)
GHG emissions in coal electricity = 98 kg CO2eq/GJ × 65 GWh/yr
= 98 kg CO2eq/GJ × 234,000 GJ/yr
= 22,932 tonnes CO2eq/yr
-75-

Avoided life cycle GHG emissions
= GHG emissions in coal electricity - GHG emissions in bagasse electricity
100%GHG emissions in coal electricity
×
= 2eq 2eq
2eq
22,932 tonnes CO /yr - 5,726 tonnes CO /yr 22,932 tonnes CO /yr
= 75.03 %
5.5.2. “Small-planter B” GHG emissions due to operations
GHG emissions due to “small-planter B” operations, as given in Table 22, were calculated in a
similar way as in “small-planter A” operations, except that GHG emissions from mechanical
land preparation are due to diesel consumption.
Table 22: GHG emissions due to "small-planter B" operations
Operation Manual labour input (thousand man-hours/yr)
Diesel energy input (GJ/yr)
Emissions (tonnes CO2eq/yr)
Land preparation - 7,619 637 Fertilisation 3,581 - 746 Plantation 5,077 - 1,058 Irrigation - - - Weed control - - - Harvesting 13,841 - 2,884 Loading 7,488 - 1,560 Delivery - 61,635 5,153
Total 12,039
GHG emissions related to fertilisers and herbicides
These were calculated in the same way as for “small-planter A” and are given in Table 23.
-76-

Table 23: GHG emissions related to fertilisers and herbicides for "Small-planter B"
Source of GHG emissions
Amount input (tonnes/yr)
Emission factors (tonnes CO2eq/tonne)
Emissions (tonnes CO2eq/yr)
Production of N 2,076 3.485 7,235 Production of P2O5 752 1.165 876 Production of K2O 2,633 0.700 1,843 Diesel consumption for fertiliser transport, MJ 659 0.084 55
N2O from fertiliser (N-application) 2,076 5.422 11,257
CO2 from fertiliser (N-application) 2,076 1.594 3,309
Production of herbicides 111,328 25.150 2,800 Total 27,376
GHG emission performance indicators
GHG emissions from bagasse combustion for electricity generation = 13,195 tonnes CO2eq
Total GHG emissions
= GHG emissions due to operations + GHG emissions related to fertilisers and herbicides +
GHG emissions from bagasse combustion
= 12,039 tonnes CO2eq/yr + 27,376 tonnes CO2eq/yr + 13,195 tonnes CO2eq/yr
= 52,610 tonnes CO2eq/yr
GHG emissions in bagasse electricity = 0.0892 × 52,610 tonnes CO2eq/yr
= 4,692 tonnes CO2eq/yr
GHG emissions per unit bagasse electricity = 2eq4,692 tonnes CO /yr 65 GWh/yr
= 0.0722 kg CO2eq/kWh
GHG emissions in coal electricity = 22,932 tonnes CO2eq/yr
Avoided life cycle GHG emissions
= 2eq 2eq
2eq
22,932 tonnes CO /yr - 4,692 tonnes CO /yr 22,932 tonnes CO /yr
= 79.54 %
5.5.3. Medium-planter GHG emissions due to operations
GHG emissions due to medium-planter operations are influenced by the greater yield than in
the case of small-planters and by the use of mechanical loading, which consumes diesel. These
emissions are evaluated and given in Table 24.
-77-

Table 24: GHG emissions due to medium-planter operations
Operation Manual labour input (thousand man-hours/yr)
Diesel energy input (GJ/yr)
Emissions (tonnes CO2eq/yr)
Land preparation - 6,978 583 Fertilisation 3,279 - 683 Plantation 4,650 - 969 Irrigation - - - Weed control - - - Harvesting 12,676 - 2,641 Loading - 6,301 527 Delivery - 61,635 5,153
Total 10,557
GHG emissions related to fertilisers and herbicides
GHG emissions related to fertilisers are determined like in the case of small-planters and are
given in Table 25.
Table 25: GHG emissions related to fertilisers and herbicides for medium-planter
Source of GHG emissions
Amount input (tonnes/yr)
Emission factors (tonnes CO2eq/tonne)
Emissions (tonnes CO2eq/yr)
Production of N 1,901 3.485 6,626 Production of P2O5 689 1.165 803 Production of K2O 2,411 0.700 1,688 Diesel consumption for fertiliser transport, MJ 603 0.084 50
N2O from fertiliser (N-application) 1,901 5.422 10,309
CO2 from fertiliser (N-application) 1,901 1.594 3,031
Production of herbicides 102 25.150 2,564 Total 25,071
GHG emission performance indicators
GHG emissions from bagasse combustion for electricity generation = 13,195 tonnes CO2eq/yr
Total GHG emissions
= GHG emissions due to operations + GHG emissions related to fertilisers and herbicides +
GHG emissions from bagasse combustion
= 10,557 tonnes CO2eq/yr + 25,071 tonnes CO2eq/yr + 13,195 tonnes CO2eq/yr
= 48,824 tonnes CO2eq/yr
Considering allocation factor of 8.92 %,
GHG emissions in bagasse electricity = 4,354 tonnes CO2eq/yr
-78-

GHG emissions per unit bagasse electricity = 2eq4,354 tonnes CO /yr 65 GWh/yr
= 0.0670 kg CO2eq/kWh
GHG emissions in coal electricity = 22,932 tonnes CO2eq/yr
Avoided life cycle GHG emissions
= 2eq 2eq
2eq
22,932 tonnes CO /yr - 4,354 tonnes CO /yr 22,932 tonnes CO /yr
= 81.01 %
5.5.4. Large-planter/FORIP GHG emissions due to operations
These are calculated in a similar way as for small- and medium-planters. In addition to
increased diesel use due to a greater extent in the mechanisation of operations, GHG emissions
due to large-planter operations are affected by the electricity-driven centre-pivot irrigation
system.
Although coal electricity is differentiated in literature, no clear distinction is made between
electricity produced from diesel, fuel oil and kerosene (Statistics Mauritius, 2011). Therefore,
diesel, fuel oil and kerosene are regrouped as petroleum products with an emission factor of 85
kg CO2eq/GJ (Khatiwada & Silveira, 2011). Based on the average of electricity produced from
different sources in Mauritius from 1999 to 2010 (Statistics Mauritius, 2011), coal and
petroleum products accounted for 30.21% and 49.43% respectively out of the total electricity
generated to the grid. Using these shares, emission factor of electricity is calculated to be 71.63
kg CO2eq/GJ. GHG emissions due to irrigation, along with other operations, are given in Table
26.
Table 26: GHG emissions due to large-planter operations
Operation Manual labour input (thousand man-hours/yr)
Diesel energy input (GJ/yr)
Emissions (tonnes CO2eq/yr)
Land preparation - 6,241 522 Fertilisation - 3,176 266 Plantation 4,159 - 867 Irrigation - - 686 Weed control - 4,763 398 Harvesting - 42,521 3,555 Loading - 6,301 527 Delivery - 61,635 5,153
Total 11,974
-79-
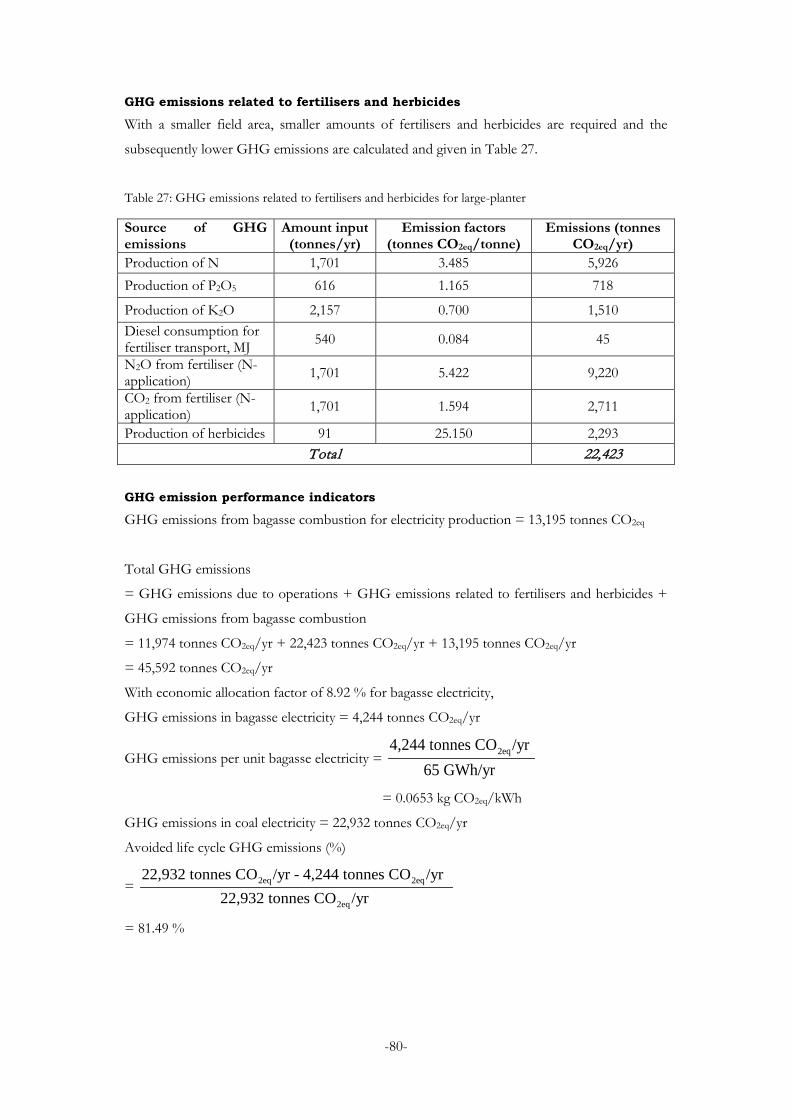
GHG emissions related to fertilisers and herbicides
With a smaller field area, smaller amounts of fertilisers and herbicides are required and the
subsequently lower GHG emissions are calculated and given in Table 27.
Table 27: GHG emissions related to fertilisers and herbicides for large-planter
Source of GHG emissions
Amount input (tonnes/yr)
Emission factors (tonnes CO2eq/tonne)
Emissions (tonnes CO2eq/yr)
Production of N 1,701 3.485 5,926 Production of P2O5 616 1.165 718
Production of K2O 2,157 0.700 1,510 Diesel consumption for fertiliser transport, MJ 540 0.084 45
N2O from fertiliser (N-application) 1,701 5.422 9,220
CO2 from fertiliser (N-application) 1,701 1.594 2,711
Production of herbicides 91 25.150 2,293 Total 22,423
GHG emission performance indicators
GHG emissions from bagasse combustion for electricity production = 13,195 tonnes CO2eq
Total GHG emissions
= GHG emissions due to operations + GHG emissions related to fertilisers and herbicides +
GHG emissions from bagasse combustion
= 11,974 tonnes CO2eq/yr + 22,423 tonnes CO2eq/yr + 13,195 tonnes CO2eq/yr
= 45,592 tonnes CO2eq/yr
With economic allocation factor of 8.92 % for bagasse electricity,
GHG emissions in bagasse electricity = 4,244 tonnes CO2eq/yr
GHG emissions per unit bagasse electricity = 2eq4,244 tonnes CO /yr 65 GWh/yr
= 0.0653 kg CO2eq/kWh
GHG emissions in coal electricity = 22,932 tonnes CO2eq/yr
Avoided life cycle GHG emissions (%)
= 2eq 2eq
2eq
22,932 tonnes CO /yr - 4,244 tonnes CO /yr 22,932 tonnes CO /yr
= 81.49 %
-80-

5.5.5. Miller-planter GHG emissions due to operations
GHG emissions due to miller-planter operations are determined like in the case of large-
planters. In addition to the expected differences arising from mechanical plantation and the use
trucks with higher capacity for cane delivery, as observed during the energy analysis, GHG
emissions due to harvesting by miller-planters are expected to be higher because of some cane
burning prior to harvesting.
It should be noted that, although pre-harvest cane burning increases the efficiency of
mechanical harvesting to 40 – 50 tonne/h as compared to 30 – 40 tonne/h when harvesting
green cane (AGRECO Consortium, 2007), it does not influence the diesel consumption of
chopper harvester which depends on the mass of cane harvested. The improved efficiency can
thus be essentially regarded as a much faster harvesting process.
GHG emissions due to miller-planter operations are given in Table 28.
Table 28: GHG emissions due to miller-planter operations
Operation Diesel energy input (GJ/yr) Emissions (tonnes CO2eq/yr) Land preparation 6,241 522 Fertilisation 3,176 266 Plantation 11,221 938 Irrigation - 686 Weed control 4,763 398 Harvesting 42,521 5,751a Loading 6,301 527 Delivery 16,765 1,402
Total 10,490
a Includes emissions of 2,195,933 kg CO2eq/yr due to cane burning prior to harvesting on 11% of the total field area (MSIRI, 2011a) with an average emission factor of 0.090 kg CO2eq/dry trash (Khatiwada & Silveira, 2011). Dry trash consists of cane tops and leaves (CTLs) and trash, and 18,000 kg of such dry trash are obtained per hectare (Deepchand, 1984 cited in Seebaluck & Seeruttun, 2009)
GHG emissions related to fertilisers and herbicides
With identical amounts of fertilisers and herbicides used as in the case of large-planters, GHG
emissions are also identical, with a total of 22,423 tonnes CO2eq/yr.
GHG emission performance indicators
GHG emissions from bagasse burning to generate electricity = 13,195 tonnes CO2eq/yr
-81-

Total GHG emissions
= GHG emissions due to operations + GHG emissions related to fertilisers and herbicides +
GHG emissions from bagasse combustion
= 10,490 tonnes CO2eq/yr + 22,423 tonnes CO2eq/yr + 13,195 tonnes CO2eq/yr
= 46,108 tonnes CO2eq/yr
GHG emissions in bagasse electricity = 8.92 % × 46,108 tonnes CO2eq/yr
= 4,112 tonnes CO2eq/yr
GHG emissions per unit bagasse electricity = 2eq4,112 tonnes CO /yr 65 GWh/yr
= 0.0633 kg CO2eq/kWh
GHG emissions in coal electricity = 22,932 tonnes CO2eq/yr
Avoided life cycle GHG emissions (%)
= 2eq 2eq
2eq
22,932 tonnes CO /yr - 4,112 tonnes CO /yr 22,932 tonnes CO /yr
= 82.07 %
-82-
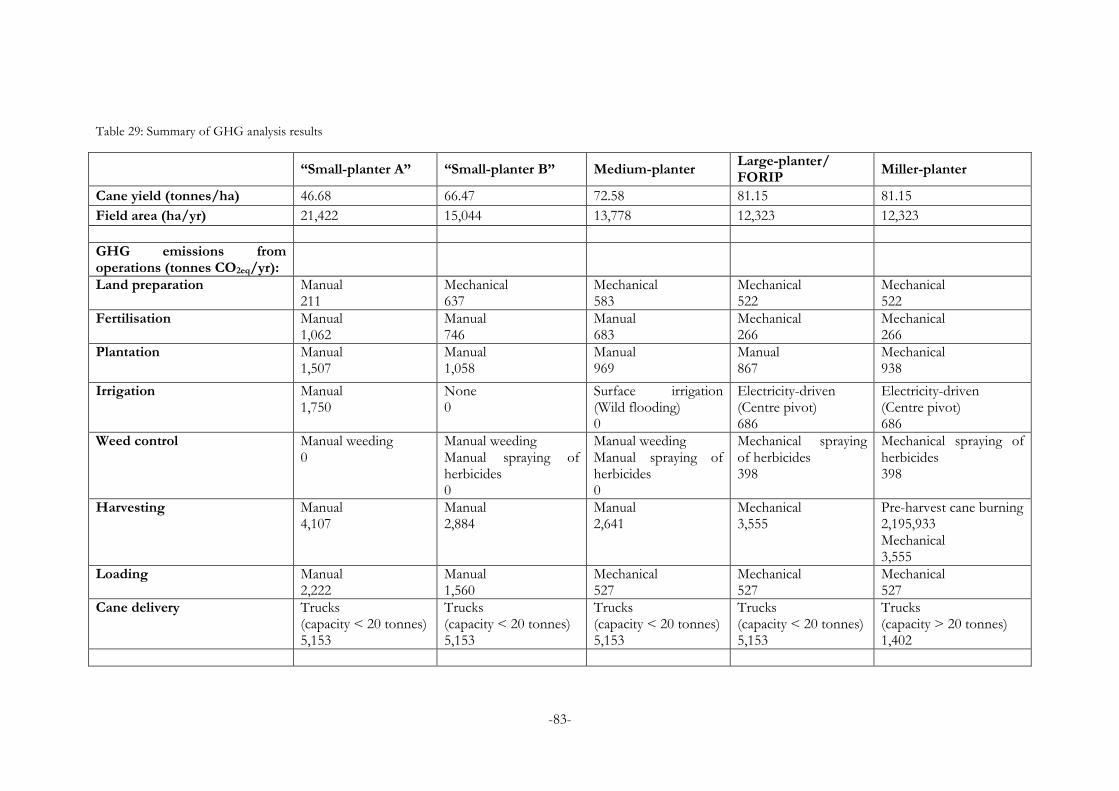
Table 29: Summary of GHG analysis results
“Small-planter A” “Small-planter B” Medium-planter Large-planter/ FORIP Miller-planter
Cane yield (tonnes/ha) 46.68 66.47 72.58 81.15 81.15 Field area (ha/yr) 21,422 15,044 13,778 12,323 12,323 GHG emissions from operations (tonnes CO2eq/yr):
Land preparation Manual 211
Mechanical 637
Mechanical 583
Mechanical 522
Mechanical 522
Fertilisation Manual 1,062
Manual 746
Manual 683
Mechanical 266
Mechanical 266
Plantation Manual 1,507
Manual 1,058
Manual 969
Manual 867
Mechanical 938
Irrigation Manual 1,750
None 0
Surface irrigation (Wild flooding) 0
Electricity-driven (Centre pivot) 686
Electricity-driven (Centre pivot) 686
Weed control Manual weeding 0
Manual weeding Manual spraying of herbicides 0
Manual weeding Manual spraying of herbicides 0
Mechanical spraying of herbicides 398
Mechanical spraying of herbicides 398
Harvesting Manual 4,107
Manual 2,884
Manual 2,641
Mechanical 3,555
Pre-harvest cane burning 2,195,933 Mechanical 3,555
Loading Manual 2,222
Manual 1,560
Mechanical 527
Mechanical 527
Mechanical 527
Cane delivery Trucks (capacity < 20 tonnes) 5,153
Trucks (capacity < 20 tonnes) 5,153
Trucks (capacity < 20 tonnes) 5,153
Trucks (capacity < 20 tonnes) 5,153
Trucks (capacity > 20 tonnes) 1,402
-83-
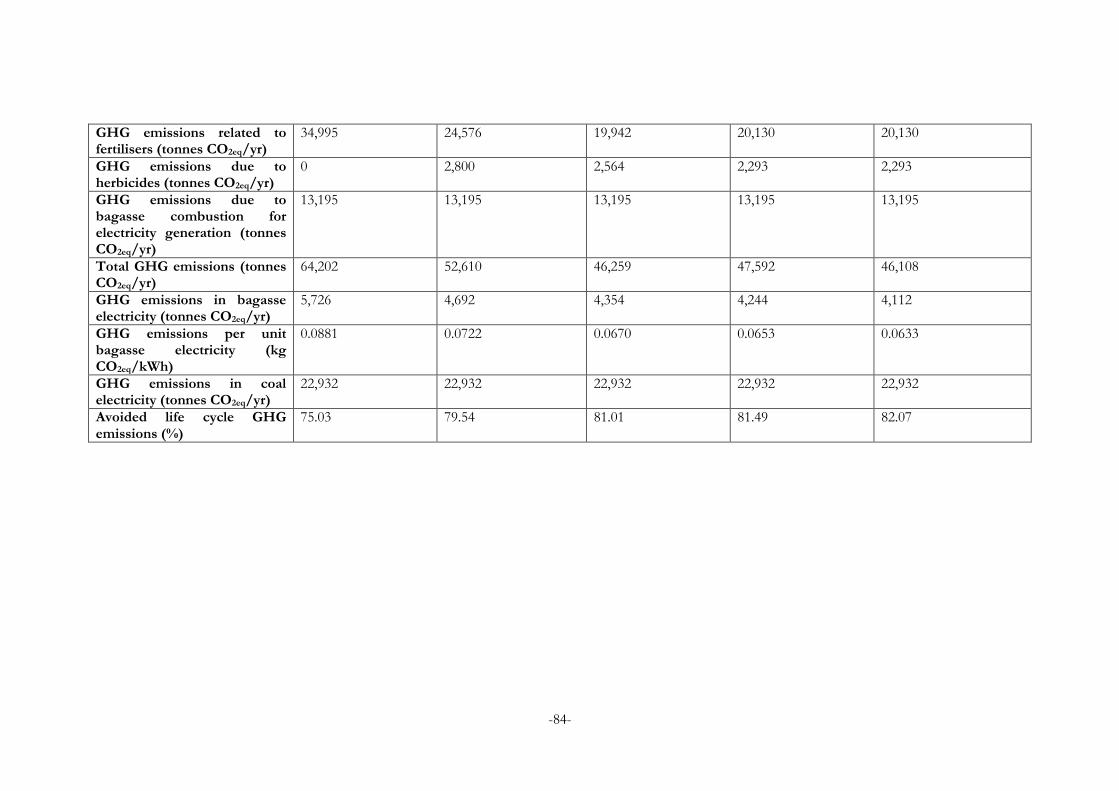
GHG emissions related to fertilisers (tonnes CO2eq/yr)
34,995 24,576 19,942 20,130 20,130
GHG emissions due to herbicides (tonnes CO2eq/yr)
0 2,800 2,564 2,293 2,293
GHG emissions due to bagasse combustion for electricity generation (tonnes CO2eq/yr)
13,195 13,195 13,195 13,195 13,195
Total GHG emissions (tonnes CO2eq/yr)
64,202 52,610 46,259 47,592 46,108
GHG emissions in bagasse electricity (tonnes CO2eq/yr)
5,726 4,692 4,354 4,244 4,112
GHG emissions per unit bagasse electricity (kg CO2eq/kWh)
0.0881 0.0722 0.0670 0.0653 0.0633
GHG emissions in coal electricity (tonnes CO2eq/yr)
22,932 22,932 22,932 22,932 22,932
Avoided life cycle GHG emissions (%)
75.03 79.54 81.01 81.49 82.07
-84-

Figure 22: Overall GHG analysis results
-85-
5.6. GREENHOUSE GAS ANALYSIS DISCUSSIONS All GHG analysis results are summarised in Table 29. From “small-planter A” to “miller-
planter”, GHG emissions in bagasse electricity are found to decrease. Comparing the sugarcane
planter systems in terms of their GHG emissions determines how the anticipated rise in GHG
emissions due to diesel combustion through mechanisation of operations is compensated by
the corresponding higher sugarcane yield. This result indicates that the lower energy input
requirement, and hence lower GHG emissions, associated with smaller cultivation areas (due to
higher sugarcane yields) largely compensates for the use of additional diesel in mechanised
operations.
The highly positive avoided life cycle GHG emissions (> 75%) for all planter categories
indicates that burning bagasse, instead of coal, to generate electricity avoids the release of a
significant amount of GHGs to the atmosphere, thereby contributing towards climate change
mitigation. This contribution is actually even more important since actual GHG emissions from
the entire life cycle of coal are higher than reported in this study, as coal mining and
transportation have not been considered.
With increased mechanisation when moving from “small-planter A” to “miller-planter”,
avoided life cycle GHG emissions are found to increase. As this indicator is directly related to
GHG emissions in bagasse electricity, this observation suggests that mechanisation of
operations is accompanied by a decrease in GHG emissions due to higher yields, and
consequently lower energy input requirement. As was done for the energy analysis, GHG
emissions (without allocation) on a per hectare basis is presented in Table 30 to differentiate
between manual and mechanical operations. It was observed in the energy analysis that manual
fertilisation and irrigation are more energy intensive when compared to their diesel or
electricity-driven counterparts. It is therefore not surprising to find that GHG emissions for
manual fertilisation and irrigation are also higher. The same observation is made with cane
loading which emits 2.22 kg CO2eq/tonne cane and 0.53 kg CO2eq/tonne cane for manual and
mechanical loading respectively. Since fertilisation, irrigation and loading are mechanically done
in the case of large- and miller-planters, the GHG emissions from these operations are lower
than in the manual operations and therefore result in these planters performing better on GHG
emission basis than small- and medium-planters.
These general observations suggest that switching from manual to mechanical operations is
beneficial both from the energetic and climate change mitigation points of view.
-86-
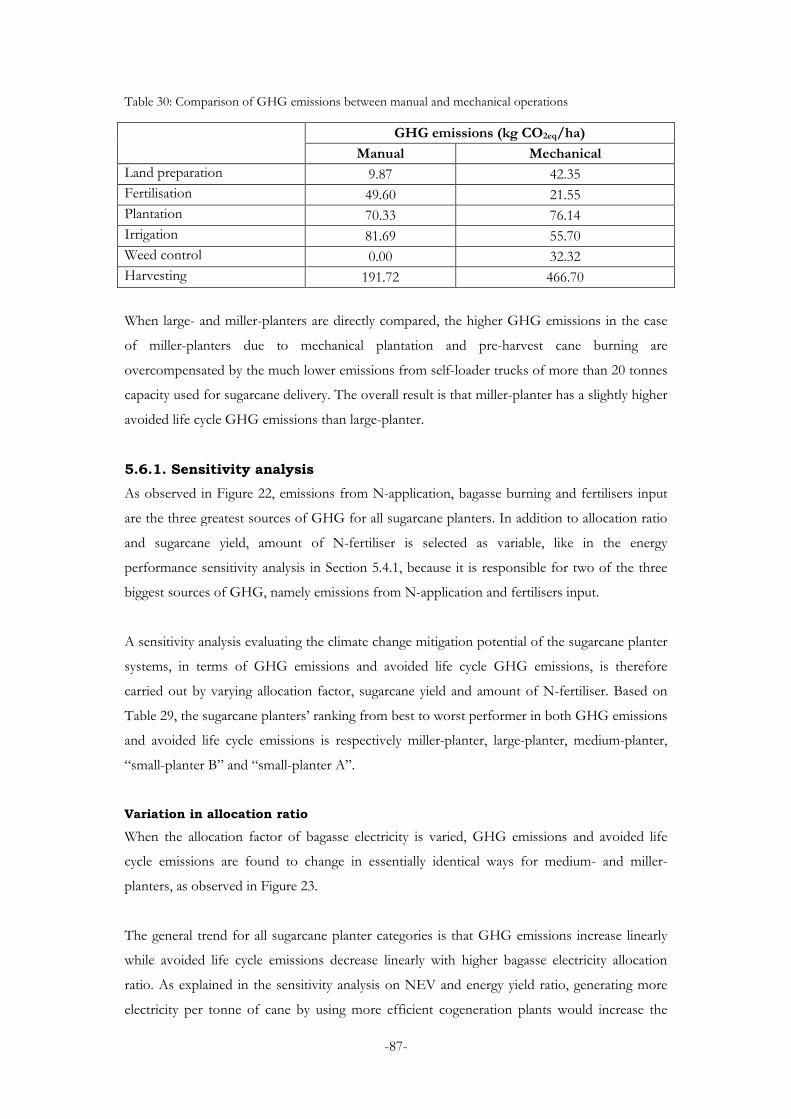
Table 30: Comparison of GHG emissions between manual and mechanical operations
GHG emissions (kg CO2eq/ha) Manual Mechanical
Land preparation 9.87 42.35 Fertilisation 49.60 21.55 Plantation 70.33 76.14 Irrigation 81.69 55.70 Weed control 0.00 32.32 Harvesting 191.72 466.70
When large- and miller-planters are directly compared, the higher GHG emissions in the case
of miller-planters due to mechanical plantation and pre-harvest cane burning are
overcompensated by the much lower emissions from self-loader trucks of more than 20 tonnes
capacity used for sugarcane delivery. The overall result is that miller-planter has a slightly higher
avoided life cycle GHG emissions than large-planter.
5.6.1. Sensitivity analysis As observed in Figure 22, emissions from N-application, bagasse burning and fertilisers input
are the three greatest sources of GHG for all sugarcane planters. In addition to allocation ratio
and sugarcane yield, amount of N-fertiliser is selected as variable, like in the energy
performance sensitivity analysis in Section 5.4.1, because it is responsible for two of the three
biggest sources of GHG, namely emissions from N-application and fertilisers input.
A sensitivity analysis evaluating the climate change mitigation potential of the sugarcane planter
systems, in terms of GHG emissions and avoided life cycle GHG emissions, is therefore
carried out by varying allocation factor, sugarcane yield and amount of N-fertiliser. Based on
Table 29, the sugarcane planters’ ranking from best to worst performer in both GHG emissions
and avoided life cycle emissions is respectively miller-planter, large-planter, medium-planter,
“small-planter B” and “small-planter A”.
Variation in allocation ratio
When the allocation factor of bagasse electricity is varied, GHG emissions and avoided life
cycle emissions are found to change in essentially identical ways for medium- and miller-
planters, as observed in Figure 23.
The general trend for all sugarcane planter categories is that GHG emissions increase linearly
while avoided life cycle emissions decrease linearly with higher bagasse electricity allocation
ratio. As explained in the sensitivity analysis on NEV and energy yield ratio, generating more
electricity per tonne of cane by using more efficient cogeneration plants would increase the
-87-

allocation factor of bagasse electricity, causing GHG emissions to increase and avoided life
cycle GHG emissions to decrease, provided average price of electricity in MUR/kWh does not
change.
Another observation is that, similar to the case of sensitivity analysis on NEV, the difference in
GHG emissions and the difference of avoided life cycle GHG emissions between two
consecutive planter categories increases with increasing allocation factor for bagasse electricity.
This is again explained by the fact that the non-GHG emitting nature of renewable energy
input to the system becomes more important in the case of small-planters where high levels of
manual operations exist, resulting in steeper gradients for their graphs, as given in Figure 23.
GHG emissions in coal electricity are found to match those of “small-planter A”, “small-
planter B”, medium-planter, large-planter and miller-planter at bagasse electricity allocation
factors of around 36%, 44%, 50%, 47% and 50% respectively (as shown by the red arrows in
Figure 23). This indicates that at allocation factors higher than these individual limits, it is not
worth to burn bagasse to generate electricity from the climate change mitigation point of view.
With the reduction in EU market sugar price, bagasse electricity allocation factor tends to
increase. However, it is not believed that the current bagasse electricity allocation factor of
8.92% (as shown by the grey arrow in Figure 23) would ever reach the first limit of 36% for
“small-planter A” as the corresponding significant decrease in sugar price would cause sugar
factories in Mauritius to cease operations since it would not be profitable anymore to
manufacture sugar.
Similarly as in the energy performance sensitivity analysis with varying allocation factor, a
decrease in bagasse electricity price would improve climate change mitigation potential of
sugarcane planter systems by decreasing their GHG emissions and accordingly increasing their
avoided life cycle GHG emissions.
-88-

Figure 23: Variation of GHG emissions and avoided life cycle GHG emissions with allocation factor
Variation in sugarcane yield
Sugarcane yield is the most important parameter responsible for differences in sugarcane
planter performances. As observed from Figure 24, an increase in cane yield from the
respective base study values (indicated by grey arrows in Figure 24) leads to a decrease in GHG
emissions and an increase in avoided life cycle GHG emissions for all the sugarcane planter
categories.
With differences of around 500 tonnes/yr of GHG emissions and 2% of avoided life cycle
GHG emissions between any two sugarcane planter categories at any specific sugarcane yield, it
can be said that all sugarcane planters perform generally equally well in terms of climate change
mitigation. Nevertheless, it is interesting to note that although miller-planter was clearly found
to perform best in terms of NEV and energy yield ratio, it is not the case for GHG emissions
and avoided life cycle GHG emissions where “small-planter A” and medium-planter perform
slightly better.
-89-
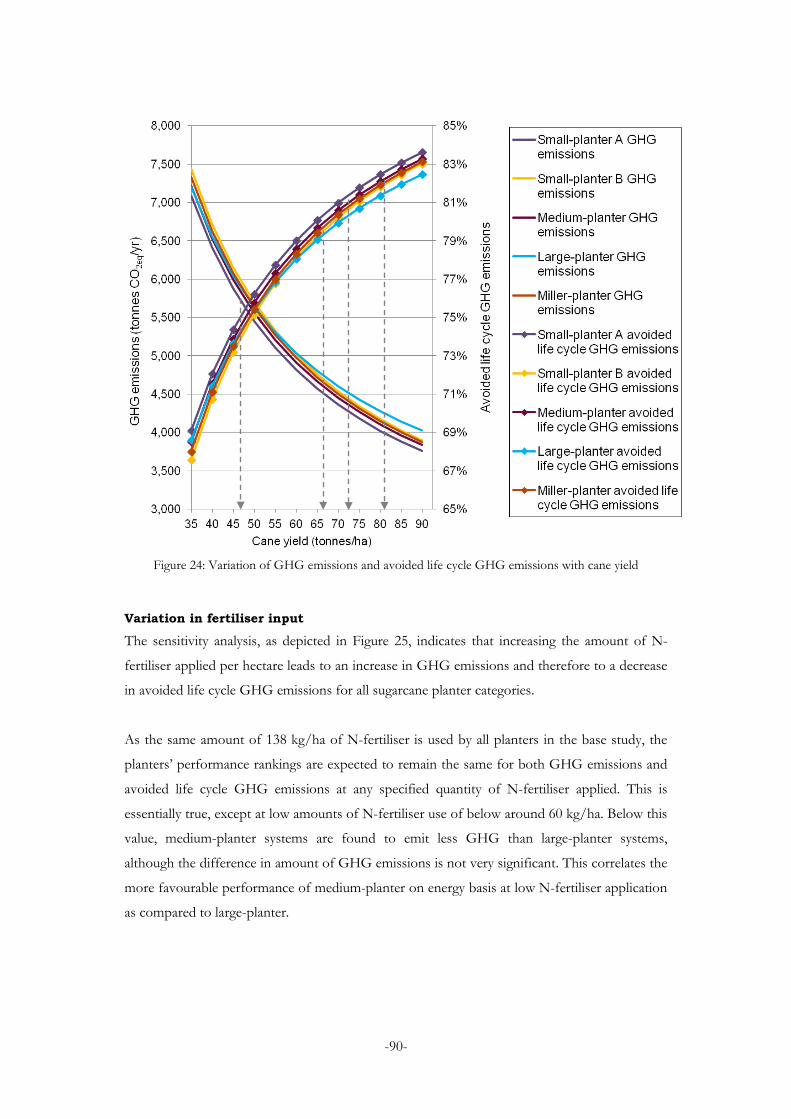
Figure 24: Variation of GHG emissions and avoided life cycle GHG emissions with cane yield
Variation in fertiliser input
The sensitivity analysis, as depicted in Figure 25, indicates that increasing the amount of N-
fertiliser applied per hectare leads to an increase in GHG emissions and therefore to a decrease
in avoided life cycle GHG emissions for all sugarcane planter categories.
As the same amount of 138 kg/ha of N-fertiliser is used by all planters in the base study, the
planters’ performance rankings are expected to remain the same for both GHG emissions and
avoided life cycle GHG emissions at any specified quantity of N-fertiliser applied. This is
essentially true, except at low amounts of N-fertiliser use of below around 60 kg/ha. Below this
value, medium-planter systems are found to emit less GHG than large-planter systems,
although the difference in amount of GHG emissions is not very significant. This correlates the
more favourable performance of medium-planter on energy basis at low N-fertiliser application
as compared to large-planter.
-90-
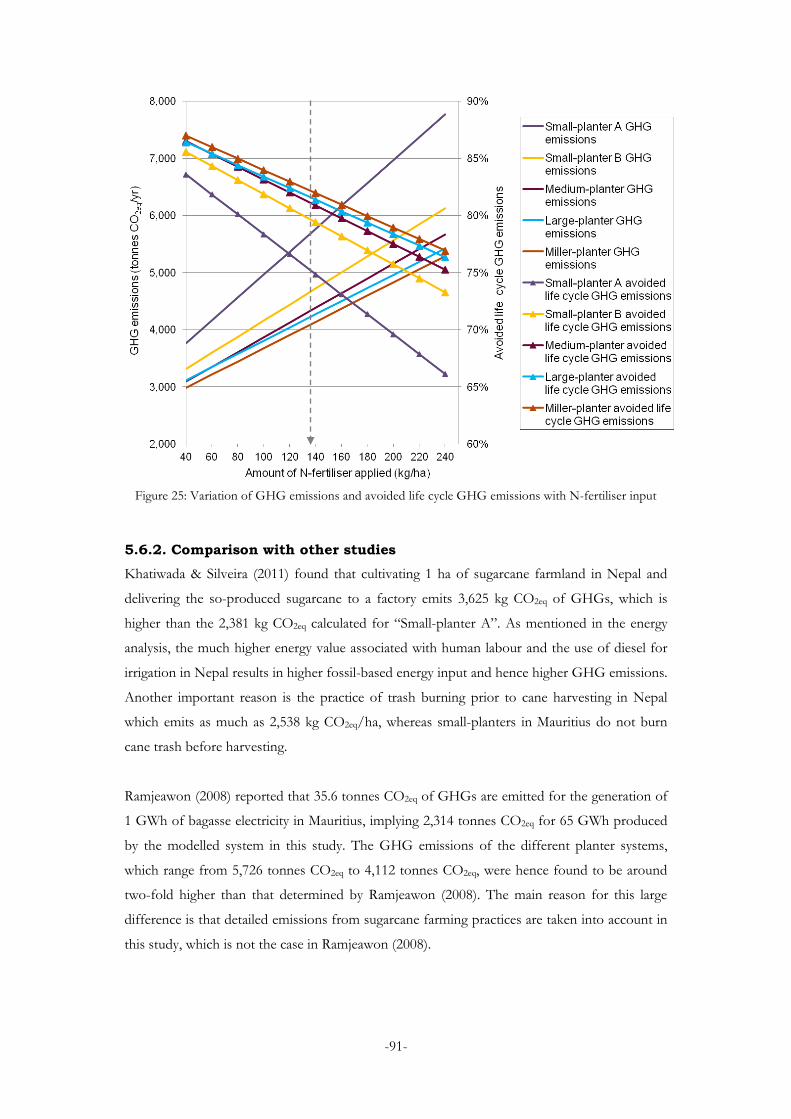
Figure 25: Variation of GHG emissions and avoided life cycle GHG emissions with N-fertiliser input
5.6.2. Comparison with other studies Khatiwada & Silveira (2011) found that cultivating 1 ha of sugarcane farmland in Nepal and
delivering the so-produced sugarcane to a factory emits 3,625 kg CO2eq of GHGs, which is
higher than the 2,381 kg CO2eq calculated for “Small-planter A”. As mentioned in the energy
analysis, the much higher energy value associated with human labour and the use of diesel for
irrigation in Nepal results in higher fossil-based energy input and hence higher GHG emissions.
Another important reason is the practice of trash burning prior to cane harvesting in Nepal
which emits as much as 2,538 kg CO2eq/ha, whereas small-planters in Mauritius do not burn
cane trash before harvesting.
Ramjeawon (2008) reported that 35.6 tonnes CO2eq of GHGs are emitted for the generation of
1 GWh of bagasse electricity in Mauritius, implying 2,314 tonnes CO2eq for 65 GWh produced
by the modelled system in this study. The GHG emissions of the different planter systems,
which range from 5,726 tonnes CO2eq to 4,112 tonnes CO2eq, were hence found to be around
two-fold higher than that determined by Ramjeawon (2008). The main reason for this large
difference is that detailed emissions from sugarcane farming practices are taken into account in
this study, which is not the case in Ramjeawon (2008).
-91-
In the South African context, Mashoko, et al. (2013) found that 67 tonnes CO2eq were emitted
per GWh of bagasse electricity, resulting in 4,355 tonnes CO2eq for 65 GWh generated by the
modelled system in this study. This value was found to be really close to that of the medium-
planter system. Since Mashoko, et al. (2013) considered agricultural tractors and harvesters in
their study, it seemed that the South African planter system is more similar to the Mauritian
large-planter system. In this case, their higher GHG emission (4,355 tonnes CO2eq compared to
4,244 tonnes CO2eq for large-planter system in Mauritius) could be due to the fact that 90% of
South African sugarcane fields are burnt before harvest, thus releasing more GHG emissions.
-92-

CHAPTER 6: CONCLUSIONS & RECOMMENDATIONS 6.1. CONCLUSIONS Generating electricity by burning bagasse is attractive for all sugarcane planter categories with
energy yield ratio ranging from 6.8177 to 10.9886 and avoided life cycle GHG emissions from
75.03% to 82.07% (with coal as reference fossil fuel). Moreover, GHG emissions per unit
bagasse electricity range from 0.0633 kg CO2eq/kWh to 0.0881 kg CO2eq/kWh, which is about
4-5 fold lower than 0.3528 kg CO2eq/kWh for coal electricity (Khatiwada & Silveira, 2011).
Since electricity generation is not even the main purpose of burning bagasse, as is the case with
coal, this makes cogeneration of heat and electricity while getting rid of bagasse a very attractive
option.
From both energy and climate change mitigation points of view,
• Miller-planter performs best out of the 5 types of sugarcane planters at the prevailing yields
• “Small-planter A” performs worst out of all the sugarcane planters at the current yields
• Sugarcane yield is the most critical and sensitive parameter influencing all sugarcane planter
categories
• Fertiliser production is the most energy-intensive and GHG emitting process
• Mechanisation of operations does not obligatorily result in increases in energy requirements
and GHG emissions. On a per hectare basis, mechanical fertilisation, electricity-driven
irrigation through centre pivot and mechanical loading consume less energy input and
release less GHG emissions than manually conducting these operations.
6.2. RECOMMENDATIONS Full mechanisation of operations is strongly advised whenever possible. In the case of small-
scale cultivation where mechanical operations are not attractive due to practical and economical
constraints, regrouping adjacent small plots to form large fields (FORIPs), are strongly
encouraged. On the other hand, cane yield for isolated small-planter plots could be improved
locally by converting “small-planter A” into “small-planter B” through the adoption of
mechanical land preparation and manual spraying of herbicides, and providing irrigation water
in the case of “small-planter B” to increase the associated cane yield to that of medium-
planter’s. These measures might increase their input energy requirements but it is strongly
believed that the increased cane yield would over-compensate for this higher input energy
requirement.
Middlemen are extremely encouraged to replace their currently used trucks of less than 20
tonnes capacity by less energy-intensive self-loader trucks of more than 20 tonnes capacity used
by miller-planters. Since middlemen represent the key link between all planters, excluding
-93-

miller-planters, and sugar mills, reducing the diesel consumption of their trucks would decrease
their own operating costs while simultaneously improving the energy and climate change
mitigation performances of small-, medium- and large-planters.
As shown by the sensitivity analysis varying allocation factor of bagasse electricity, more
independent power producers should be motivated to engage in bagasse electricity generation.
The market price of bagasse electricity would then tend to decrease, thereby improving both
the energy and global warming mitigation potential of all sugarcane planter systems if sugar and
molasses prices do not decrease.
Since fertiliser production is the most energy-consuming and GHG-emitting process, the
opportunity to improve the energy and environmental performance of bagasse electricity
generation could reside in optimising the fertiliser production process. Research could also be
done in alternative inorganic fertilisers like composts which are not industrially manufactured.
Although this was not within the scope of this study, the lack of motivation for small-planters
in Mauritius to cultivate sugarcane efficiently is also found to be a problem. Indeed, according
to Pillay, et al. (2010), most small sugarcane planters keep no records of their sugarcane
cultivation activities and do not always follow MSIRI recommendation sheets. Moreover, these
small-planters perform another occupation as their main work and grow sugarcane only as a
side activity, which is not the case of small-planters in most less-developed sugarcane-
cultivating countries. It is suggested that incentives and assistance are provided to these small-
planters for them to improve their sugarcane yields. For example, financial remuneration could
be increased. According to a small-planter in Mauritius, he earns only around USD 4 to harvest
and load one tonne of sugarcane (Oodunt, 2013).
6.3. FUTURE WORK
• Many simplifications and assumptions are made in this project due to unavailability of data
or absence of more reliable information. Examples include the use of an average value of
65 kWh/tonne cane (Ramjeawon, 2008) for bagasse electricity generation, since it can reach
up to 125 kWh/tonne cane in the cogeneration plant Terragen Ltd (Deepchand, 2005), and
no consideration of detailed emissions from sugar factory and cogeneration plant
operations. Nevertheless, these simplifications are reasonable enough for the project’s
rationale of comparing between the different sugarcane planter systems. Therefore, a
possible future work would be to refine the study with more updated and detailed data,
provided they become available.
-94-
• This study could be adapted to other sugarcane-producing countries, where different
sugarcane planters are present, in order to determine the current energy and climate change
mitigation performances of their sugarcane industry. The results could guide the
development of future national policies with regards to this sector.
• The energy and GHG analyses could be repeated with sugar as the main product of
interest, instead of bagasse electricity. Based on the results, appropriate efforts to reduce
the energy input and GHG emissions associated with the manufacture of sugar in
Mauritius could improve the competitiveness of this sweetener in the future, which is
particularly important with the current decrease of its price on the EU market.
• It would be interesting to add more economical considerations, such as the costs of shifting
from manual to mechanical operations or of regrouping small-planters, to this study and
potentially develop the optimal sustainable mix of sugarcane planter categories in the
sugarcane industry with highly positive energy performance indicators and avoided life
cycle emissions at national level.
-95-

REFERENCES Adélaïde, S., 2013. Sugarcane areas. Reduit, Mauritius: MSIRI.
AGRECO Consortium, 2007. Implementation of the multi-annual adaptation strategy for the Mauritian
sugarcane cluster (2006-2015) - Strategic environmental assessment. [Online]
Available at:
http://www.icem.com.au/documents/envassessment/seamaas/MAAS_SEA_final%20report.p
df
[Accessed 21 May 2013].
Alteo Ltd, 2012a. Deep River-Beau Champ. [Online]
Available at: http://www.fusiondrbc-fuel.com/drbc.html
[Accessed 10 April 2013].
Alteo Ltd, 2012b. Flacq United Estates Limited. [Online]
Available at: http://www.fusiondrbc-fuel.com/fuel.html
[Accessed 10 April 2013].
Alteo Ltd, 2012c. La fusion DRBC-FUEL prend effet. [Online]
Available at: http://www.fusiondrbc-fuel.com/
[Accessed 10 April 2013].
Baguant, J., 1984. Electricity production from the biomass of the sugarcane industry in
Mauritius. Biomass, 5(4), pp. 283-297.
Beeharry, R. P., 1996. Extended sugarcane biomass utilisation for exportable electricity
production in Mauritius. Biomass and Bioenergy, 11(6), pp. 441-449.
Beeharry, R. P., 1998. Biofuel characterisation and life cycle assessment of sugarcane bioenergy systems,
University of Mauritius: PhD thesis.
Beeharry, R. P., 2001. Carbon balance of sugarcane bioenergy systems. Biomass and Bioenergy,
20(5), pp. 361-370.
Bhaugeerutty, R., 2010. A critical assessment of the "Multi-Annual Adaptation Strategy action plan
2006-2015: Safeguarding the future through concensus" from a small planter's perspective, Reduit: BSc
Thesis, University of Mauritius.
BioGrace, 2013. List of standard values. [Online]
Available at: http://www.biograce.net/content/ghgcalculationtools/standardvalues
[Accessed 29 July 2013].
Bureau of Democracy, Human Rights and Labor of the US Department of State, 2013.
Country reports on human rights practices for 2012 - Mauritius. [Online]
Available at: http://www.state.gov/j/drl/rls/hrrpt/humanrightsreport/index.htm#wrapper
[Accessed 4 July 2013].
Cahoolessur, K., 2002. Life cycle assessment of cane sugar production on the island of Mauritius,
Mauritius: University of Mauritius - MSc Thesis.
-96-
Chand, S., 2010. Development Policy Blog: Some lessons from Mauritius for our island economies. [Online]
Available at: http://devpolicy.org/some-lessons-from-mauritius-for-our-island-economies/
[Accessed 22 May 2013].
Chunen, R. et al., 1994. Rapport d'activités 1992-1993, Reduit, Mauritius: Cellule Mecanisation
MSIRI.
de Figueiredo, E. B., Panosso, A. R., Romão, R. & La Scala Jr, N., 2010. Greenhouse gas
emission associated with sugar production in southern Brazil, s.l.: Carbon Balance and Management.
Deepchand, K., 2001. Commercial scale cogeneration of bagasse energy in Mauritius. Energy
for Sustainable Development, 5(1), pp. 15-22.
Deepchand, K., 2005. Sugar cane bagasse energy cogeneration - Lessons from Mauritius. [Online]
Available at:
http://www.un.org/esa/sustdev/sdissues/energy/op/parliamentarian_forum/deepchand_bag
asse.pdf
[Accessed 25 September 2013].
Deepchand, K. & Manohar Rao, P. J., 2012. Other co-products options from cane
resources. In: F. X. Johnson & V. Seebaluck, eds. Bioenergy for Sustainable Development and
International Competitiveness - The Role of Sugar Cane in Africa. London: Routledge, pp. 158-180.
Energy Information Administration, 2007. Biofuels in the U.S. transportation sector. [Online]
Available at: http://www.eia.gov/oiaf/analysispaper/biomass.html
[Accessed 16 April 2013].
Eweg, M. J., Pillay, K. P. & Travailleur, C., 2009. A survey of small-scale sugarcane farmers
in South Africa and Mauritius: Introducing project methodology, investigating new technology
and presenting the data. Proceedings of the South African Sugar Technologists' Association, Issue 82, pp.
370-383.
Gil, M. P., Contreras Moya, A. M. & Domínguez, E. R., 2013. Life cycle assessment of the
cogeneration process in the Cuban sugar industry. Journal of Cleaner Production, Volume 41, pp.
222-231.
Government of Mauritius, 2011. The Mauritius Cane Industry Authority Act 2011. [Online]
Available at:
http://agriculture.gov.mu/English//DOCUMENTS/MAURITIUS%20CANE%20INDUST
RY%20AUTHORITY%20ACT.PDF
[Accessed 6 April 2013].
IEA, 2013. Statistics - Unit converter. [Online]
Available at: http://www.iea.org/stats/unit.asp
[Accessed 4 July 2013].
Jacquin, E., McIntyre, G., Tonta, J. & Rivière, V., 1992. Plantation mécanique de la canne à
sucre. Revue Agricole et Sucrière de l'Ile Maurice, Jan, 71(1), pp. 297-305.
-97-

Jhoty, I., Ramasamy, S. & Tulloo, P. K., 2001. A survey of irrigation practices for sugarcane in
Mauritius. Brisbane, Australia, The XXIV ISSCT Congress Organising Committee.
Johnson, F. X. & Batidzirai, B., 2012. Renewable resources from sugar cane. In: F. X.
Johnson & V. Seebaluck, eds. Bioenergy for Sustainable Development and International Competitiveness -
The Role of Sugar Cane in Africa. London: Routledge, pp. 1-15.
Khatiwada, D., 2010. Assessing the sustainability of bioethanol production in Nepal, Stockholm,
Sweden: Licentiate Thesis, Division of Energy and Climate Studies, Department of Energy
Technology, KTH School of Industrial Engineering and Management.
Khatiwada, D. & Silveira, S., 2009. Net energy balance of molasses based ethanol: The case
of Nepal. Renewable and Sustainable Energy Reviews, 13(9), pp. 2515-2524.
Khatiwada, D. & Silveira, S., 2011. Greenhouse gas balances of molasses based ethanol in
Nepal. Journal of Cleaner Production, 19(13), pp. 1471-1485.
Le Gal, P. & Requis, E., 2002. The management of cane harvest at the small-scale grower level: A South
African case study. South Africa, South African Sugar Technologists' Association.
Leung Pah Hang, M. Y., 2012. Resource requirements of the cane agro-industry with bioenergy
developments, Mauritius: University of Mauritius.
Macedo, I. C., Seabra, J. E. & Silva, J. E., 2008. Green house gas emissions in the
production and use of ethanol from sugarcane in Brazil: The 2005/2006 averages and a
prediction for 2020. Biomass and Bioenergy, 32(7), pp. 582-595.
MAIF, 2006. Multi Annual Adaptation Strategy. [Online]
Available at: http://www.mspa.mu/index.php?rubrique=14
[Accessed 17 March 2013].
MAIF, 2009. Integrated assessment of trade related policies on biological diversity in the agricultural sector in
Mauritius, Mauritius: UNEP.
MAIF, 2013. About Us - An overview. [Online]
Available at: http://agriculture.gov.mu/English/AboutUs/Pages/An-overview.aspx
[Accessed 8 April 2013].
Mashoko, L., Mbohwa, C. & Thomas, V. M., 2013. Life cycle inventory of electricity
cogeneration from bagasse in the South African sugar industry. Journal of Cleaner Production,
Volume 39, pp. 42-49.
MCA, 2008. Statistical Bulletin 2007/2008 - By products of the sugar industry. [Online]
Available at: http://www.mchagric.org/images/pdf/Table%2036-39%20By%20products.pdf
[Accessed 27 July 2013].
MCA, 2009. Annual report 2007 - 2008, Port Louis: MCA.
Medine, 2013. Agriculture - Sugar. [Online]
Available at: http://www.medine.com/sugar/
[Accessed 10 April 2013].
-98-

MSIRI, 2006. Dual row planting - a new cultural practice to improve sugarcane productivity, Reduit:
MSIRI Recommendation Sheet No. 156.
MSIRI, 2006. Dual row planting - a new cultural practice to improve sugarcane productivity, Reduit:
MSIRI.
MSIRI, 2007. Annual report 2006, Reduit: MSIRI.
MSIRI, 2010a. Fertilization of plant and ratoon cane, Reduit: MSIRI Recommendation Sheet
No.169.
MSIRI, 2010b. The practice of deficit irrigation, Reduit: MSIRI Recommendation Sheet No. 177.
MSIRI, 2011a. Annual report 2010, Reduit: MSIRI.
MSIRI, 2011b. Recommended harvest periods of commercial sugarcane varieties, Reduit: MSIRI
Recommendation Sheet No. 180.
MSIRI, 2013. Extension & field experimentation. [Online]
Available at: http://www.msiri.mu/index.php?langue=eng&rub=26
[Accessed 20 May 2013].
MSPA, 2008. About sugarcane. [Online]
Available at: http://www.mspa.mu/index.php?rubrique=43
[Accessed 22 May 2013].
MSPA, 2012a. Field operations. [Online]
Available at: http://www.mspa.mu/index.php?rubrique=18
[Accessed 22 May 2013].
MSPA, 2012b. Irrigation. [Online]
Available at: http://www.mspa.mu/index.php?rubrique=20
[Accessed 22 May 2013].
MSPA, 2012c. Transport. [Online]
Available at: http://www.mspa.mu/index.php?rubrique=21
[Accessed 22 May 2013].
MSPA, 2012d. Gallery. [Online]
Available at: http://www.mspa.mu/index.php?rubrique=44
[Accessed 23 May 2013].
MSS, 2013. About us. [Online]
Available at: http://www.mauritiussugar.mu/index.php/en/about-us.html
[Accessed 15 April 2013].
Netafim, 2006a. Land preparation. [Online]
Available at: http://www.sugarcanecrops.com/agronomic_practices/land_preparation/
[Accessed 19 May 2013].
-99-

Netafim, 2006b. Fertigation. [Online]
Available at: http://www.sugarcanecrops.com/agronomic_practices/fertigation/
[Accessed 20 May 2013].
Netafim, 2006c. Planting material. [Online]
Available at: http://www.sugarcanecrops.com/agronomic_practices/planting_material/
[Accessed 20 May 2013].
Netafim, 2006d. Harvesting management. [Online]
Available at: http://www.sugarcanecrops.com/agronomic_practices/harvesting_management/
[Accessed 22 May 2013].
Netafim, 2012. Sugarcane best practices. [Online]
Available at: http://www.netafim.com/crop/sugarcane/best-practice
[Accessed 19 May 2013].
Nguyen, T. L. T., Gheewala, S. H. & Garivait, S., 2007. Full chain energy analysis of fuel
ethanol from cassava in Thailand. Environmental Science & Technology, 41(11), pp. 4135-4142.
Omnicane, 2012a. Ethanol distillery. [Online]
Available at: http://www.omnicane.com/index.php?tid=70&lang=1
[Accessed 17 March 2013].
Omnicane, 2012b. Omnicane at a glance. [Online]
Available at: http://www.omnicane.com/index.php?tid=5&lang=1
[Accessed 10 April 2013].
Omnicane, 2012. Ethanol distillery. [Online]
Available at: http://www.omnicane.com/index.php?tid=70&lang=1
[Accessed 17 March 2013].
Omnicane, 2012. Sugarcane cultivation. [Online]
Available at: http://www.omnicane.com/index.php?tid=66&lang=1
[Accessed 27 September 2013].
Oodunt, S., 2013. Le manque de main-d'oeuvre plombe les petits planteurs. L'Express, 3 June,
p. 7.
Pillay, K. P., Travailleur, C., Ramasamy, S. & Eweg, M. J., 2010. Small-scale sugarcane farmers
in Mauritius and South Africa: Limiting factors and conditions in the adoption of improved technologies,
Reduit: MSIRI.
Pillay, K. P. et al., 2001. Technology transfer to improve sugarcane production systems and planters'
productivity in Mauritius. Brisbane, Australia, The XXIV ISSCT Congress Organising Committee.
Prospère, L., 2012. L'Express - Mauritius Cane Industry Authority: signature de l’accord de principe ce
mardi 27 mars. [Online]
Available at: http://www.lexpress.mu/article/mauritius-cane-industry-authority-signature-de-
-100-
l%E2%80%99accord-de-principe-ce-mardi-27-mars
[Accessed 15 May 2013].
Ramdoyal, K., Dookun-Saumtally, A. & Badaloo, G. H., 2012. Sugar cane physiology,
breeding and biotechnology. In: F. X. Johnson & V. Seebaluck, eds. Bioenergy for Sustainable
Development and International Competitiveness - The Role of Sugar Cane in Africa. London: Routledge,
pp. 19-47.
Ramjeawon, T., 2008. Life cycle assessment of electricity generation from bagasse in
Mauritius. Journal of Cleaner Production, 16(16), pp. 1727-1734.
Sawkut, R., Verena, T., Boopen, S. & Vinesh, S., 2009. Trade and poverty in Mauritius: Impact
of EU sugar reforms on the livelihood of sugar cane workers. [Online]
Available at: http://www.tips.org.za/files/Sawkut-final-_15_12.pdf
[Accessed 16 March 2013].
Seebaluck, V. et al., 2007. Sugarcane bagasse cogeneration as a renewable energy resource for Southern
Africa. Västerås, Sweden, 3rd International Green Energy Conference .
Seebaluck, V. & Seeruttun, D., 2009. Utilisation of sugarcane agricultural residues: electricity
production and climate mitigation. Progress in Industrial Ecology - An International Journal, 6(2), pp.
168-184.
Soniah, R. K., 2005. An impact assessment of the Northern Plains Irrigation Project I, Mauritius:
University of Mauritius - MSc Thesis.
Statistics Mauritius, 2011. Digest of energy and water statistics - 2010. [Online]
Available at:
http://statsmauritius.gov.mu/English/Documents/Energy/DigestEnergy2010/energy.pdf
[Accessed 17 Mar 2013].
Statistics Mauritius, 2012a. Energy and water statistics 2011. [Online]
Available at:
http://statsmauritius.gov.mu/English/Documents/Energy/Energystats2011/energy-2011.pdf
[Accessed 17 March 2013].
Statistics Mauritius, 2012b. Digest of agricultural statistics 2011. [Online]
Available at: http://www.gov.mu/portal/goc/cso/file/DigestAgric2011.pdf
[Accessed 22 March 2013].
Statistics Mauritius, 2012c. National accounts of Mauritius 2011. [Online]
Available at: http://www.gov.mu/portal/goc/cso/file/nationalaccts.pdf
[Accessed 4 July 2013].
Statistics Mauritius, 2013. Agricultural and fish production: Year 2012. [Online]
Available at: http://statsmauritius.gov.mu/English/StatsbySubj/Pages/fish2012.aspx
[Accessed 5 April 2013].
-101-
Stutterheim, P., 2006. An integrated sugarcane supply chain model: development and demonstration,
Pietermaritzburg, South Africa: MSc Thesis, University of KwaZulu-Natal.
Terra, 2013. Terragri - Terra Milling. [Online]
Available at: http://www.terra.co.mu/clusters/cane/terragri-terra-milling.aspx
[Accessed 9 April 2013].
Terragen, 2013. Terragen. [Online]
Available at: http://www.terra.co.mu/clusters/power/terragen.aspx
[Accessed 2 September 2013].
The Guardian, 2013. Global carbon dioxide in atmosphere passes milestone level. [Online]
Available at: http://www.theguardian.com/environment/2013/may/10/carbon-dioxide-
highest-level-greenhouse-gas
[Accessed 10 May 2013].
Watson, H. K. et al., 2008. Bioenergy for sustainable development and global competitiveness: The case of
sugar cane in southern Africa - Thematic report 1: Agriculture, Stockholm: Stockholm Environment
Institute.
Wiggins, S., 2009. Can the smallholder model deliver poverty reduction and food security for a rapidly
growing population in Africa?, Brighton, United Kingdom: Future Agricultures Consortium
Secretariat, Institute of Development Studies.
Yadav, R. N. S., 2001. Present status and future thrust of sugarcane mechanisation in India. Brisbane,
Australia, The XXIV ISSCT Congress Organising Committee.
-102-

APPENDIX A: SUGAR FACTORIES IN MAURITIUS A.1. TERRA MILLING LTD. Terra Milling Ltd is found in the village of Belle-Vue Mauricia, Mapou. Around 75% of its
harvesting operations are mechanised and its processing capacity is about 330 tonnes of cane
per hour (Terra, 2013). It typically crushes 725,000 tonnes of sugarcane annually to produce
77,500 tonnes of sugar, including up to 75,000 tonnes of special sugars which are manufactured
and exported. With the closure of Mon Loisir sugar factory, around 90,000 tonnes of sugar are
expected to be produced annually from the 850,000 tonnes of cane milled (Terra, 2013).
A.2. ALTEO LTD. Alteo Ltd currently comprises of DRBC and FUEL, in addition to companies in other business
sectors. DRBC is located in the village of Beau Champ and has a daily milling capacity of 6,000
tonnes of cane. It produces 80,000 tonnes of sugar annually, including 25,000 tonnes of special
sugars (Alteo Ltd, 2012a). FUEL is found roughly mid-way between the villages of Camp de
Masque and Centre de Flacq and can crush more than 1 million tonnes of cane annually. With
the forthcoming closure of DRBC, FUEL will then mill sugarcane sourced from both factory
areas which is equal to around 1.3 million tonnes of cane on a yearly basis. In addition to
special sugars, FUEL also produces plantation white sugar which is then converted to refined
sugar in an annexed refinery called FUEL Refinery Ltd (Alteo Ltd, 2012b).
FUEL Refinery Ltd started its operations in 2009 and refines sugar originating from both
FUEL and DRBC (Alteo Ltd, 2012c). It has an output capacity of 600 tonnes of refined sugar
per day (Alteo Ltd, 2012b) and the refined sugar is essentially exported to Europe.
A.3. OMNICANE In 2011, Omnicane completed the centralisation of its milling operations. All sugarcane in the
southern part of Mauritius is now only crushed at the sugar factory of La Baraque, referred to
as Omnicane Milling Operations Ltd. This facility is the only one in the island to be equipped
with a diffuser for juice extraction and has a crushing capacity of 8,000 tonnes of cane per day.
The extracted sugar is sent to an annexed refinery with a daily output capacity of 600 tonnes of
refined sugar which is directly consumed on the European market through a contract with the
German company Sudzucker valid until 2014. The refinery typically produces about 150,000
tonnes of refined sugar annually (Omnicane, 2012b).
A.4. MEDINE Medine Sugar Milling is roughly located midway between the villages of Bambous and Flic-en-
Flac in the western region of Mauritius. Its harvesting operations are completely mechanised
-103-

and its main activity is the production of plantation white sugar. Based on a contract signed in
2010 with Omnicane, all of the plantation white sugar produced by Medine is converted to
white refined sugar at Omnicane’s refinery until 2015 (Medine, 2013).
-104-
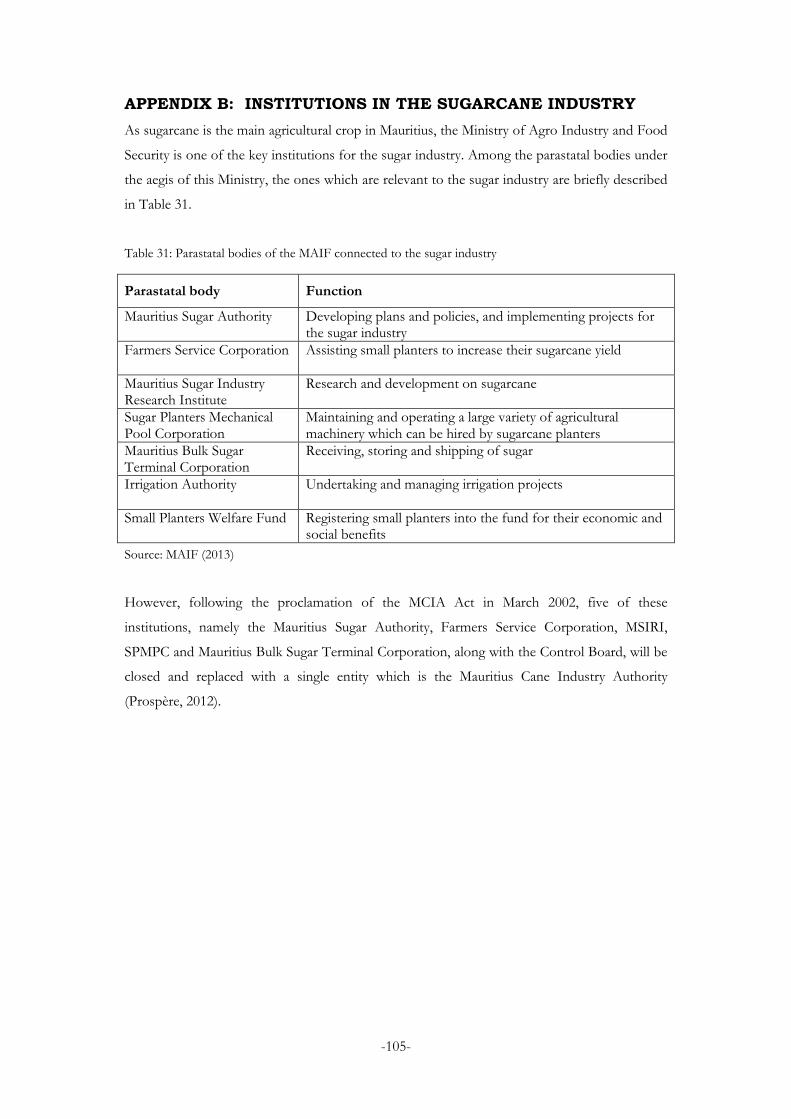
APPENDIX B: INSTITUTIONS IN THE SUGARCANE INDUSTRY As sugarcane is the main agricultural crop in Mauritius, the Ministry of Agro Industry and Food
Security is one of the key institutions for the sugar industry. Among the parastatal bodies under
the aegis of this Ministry, the ones which are relevant to the sugar industry are briefly described
in Table 31.
Table 31: Parastatal bodies of the MAIF connected to the sugar industry
Parastatal body Function
Mauritius Sugar Authority Developing plans and policies, and implementing projects for the sugar industry
Farmers Service Corporation Assisting small planters to increase their sugarcane yield
Mauritius Sugar Industry Research Institute
Research and development on sugarcane
Sugar Planters Mechanical Pool Corporation
Maintaining and operating a large variety of agricultural machinery which can be hired by sugarcane planters
Mauritius Bulk Sugar Terminal Corporation
Receiving, storing and shipping of sugar
Irrigation Authority Undertaking and managing irrigation projects
Small Planters Welfare Fund Registering small planters into the fund for their economic and social benefits
Source: MAIF (2013)
However, following the proclamation of the MCIA Act in March 2002, five of these
institutions, namely the Mauritius Sugar Authority, Farmers Service Corporation, MSIRI,
SPMPC and Mauritius Bulk Sugar Terminal Corporation, along with the Control Board, will be
closed and replaced with a single entity which is the Mauritius Cane Industry Authority
(Prospère, 2012).
-105-

APPENDIX C: SUGARCANE PLANTERS’ YIELDS The sugarcane yield per planter categories over the past years are given in Table 32 and their
calculated averages are used as representative yields for the different sugarcane planters defined
in this study.
Table 32: Sugarcane yields by planter categories in Mauritius
Year Cane yield (tonnes/ha)
Estates Metayer Owner planters Total 2002 77.4 46.9 60.9 67.4 2003 81.6 50.1 68.1 73.2 2004 83.9 47.9 70.9 75.8 2005 82.0 47.8 67.3 72.9 2006 79.8 45.6 65.9 71.2 2007 73.2 41.8 62.0 65.9 2008 83.8 49.3 65.5 73.1 2009 85.7 49.6 69.8 77.3 2010 82.0 43.2 67.6 74.4 2011 82.1 44.6 66.7 74.6
Average 81.15 46.68 66.47 72.58 Source: Statistics Mauritius (2012b)
“Small-planter A” is assumed to have an identical cane yield as that of metayers in Mauritius,
which is an average of 46.68 tonnes/ha. This number is similar to the average yield range of 30
– 50 tonnes/ha of small-planters in South Africa (Le Gal & Requis, 2002), who hardly use any
mechanisation in carrying out sugarcane agricultural operations, and to that of 40.61 tonnes/ha
in Nepal (Khatiwada & Silveira, 2009).
“Small-planter B” is assumed to have the same average sugarcane yield of 66.47 tonnes/ha as
that of owner planters, since 99.5% of owner planters are small-planters.
In the absence of information on the medium planters’ cane yield, a value of 72.58 tonnes/ha is
assumed. This number is the average overall yield for the island, calculated from the values of
2002 to 2011 (Statistics Mauritius, 2012b), and is reasonable since it is in between those of
“Small-planter B” and large-planter.
Cane yield for the large-planter is reasonably assumed to be identical to that of the miller-
planter as the only difference between their operations is at the plantation stage. Moreover,
shortage of labour, rather than improved yield, was mentioned as the rationale for introducing
mechanical planters since 1989 (Jacquin, et al., 1992). Large- and miller-planter’s cane yield is
found to be an average of 81.15 tonnes/ha.
-106-

APPENDIX D: ECONOMIC ALLOCATION FACTORS Based on values from 2002 to 2011 (Statistics Mauritius, 2012b), the average sugar extraction
rate and molasses production rate are 10.395% and 3.079% respectively. Moreover, an average
of 65 kWh of electricity are exported to the grid per tonne of cane crushed (Ramjeawon, 2008).
These values were used to calculate the output from the system, as given in Table 19.
The average price of sugar is determined by using values from 2009, 2010 and 2011 (Statistics
Mauritius, 2012b) whereas that of molasses is calculated based on the latest available values
which are those of 2005, 2006 and 2007 (MCA, 2008). The price at which electricity is sold to
the grid by bagasse cogeneration plants in Mauritius has been confidential information for
many years. Ramjeawon (2008) estimated it to be 3 MUR/kWh while the average electricity
sales price increased from 3.25 MUR/kWh in 2005 (Statistics Mauritius, 2011) to 5.69 MUR in
2011 (Statistics Mauritius, 2012a). The average price of sugar, molasses and electricity is added
to Table 33 and the respective economic share evaluated.
Table 33: Economic allocation
Product Output Average price Economic value (MUR)
Economic share (%)
Sugar 103,950 tonne 18,682 MUR/tonne 1,942,028,550 88.82 Molasses 30,792 tonne 1,608 MUR/tonne 49,505,568 2.26 Electricity 65,000,000 kWh 3 MUR/kWh 195,000,000 8.92 Total 2,186,534,118
Source: Statistics Mauritius (2012b); MCA (2008); Ramjeawon (2008) and own calculations
Taking the energy analysis as example, this economic allocation means that 88.82% of the total
energy input to the system is due to sugar production.
-107-
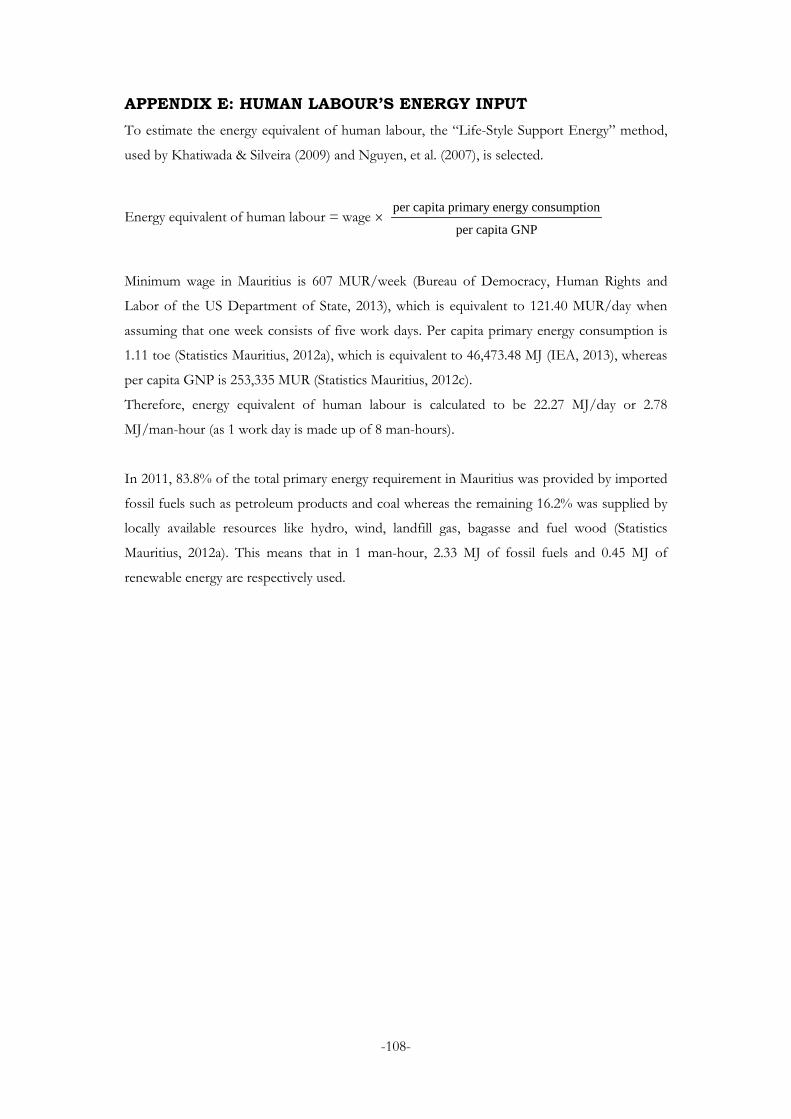
APPENDIX E: HUMAN LABOUR’S ENERGY INPUT To estimate the energy equivalent of human labour, the “Life-Style Support Energy” method,
used by Khatiwada & Silveira (2009) and Nguyen, et al. (2007), is selected.
Energy equivalent of human labour = wage × per capita primary energy consumption
per capita GNP
Minimum wage in Mauritius is 607 MUR/week (Bureau of Democracy, Human Rights and
Labor of the US Department of State, 2013), which is equivalent to 121.40 MUR/day when
assuming that one week consists of five work days. Per capita primary energy consumption is
1.11 toe (Statistics Mauritius, 2012a), which is equivalent to 46,473.48 MJ (IEA, 2013), whereas
per capita GNP is 253,335 MUR (Statistics Mauritius, 2012c).
Therefore, energy equivalent of human labour is calculated to be 22.27 MJ/day or 2.78
MJ/man-hour (as 1 work day is made up of 8 man-hours).
In 2011, 83.8% of the total primary energy requirement in Mauritius was provided by imported
fossil fuels such as petroleum products and coal whereas the remaining 16.2% was supplied by
locally available resources like hydro, wind, landfill gas, bagasse and fuel wood (Statistics
Mauritius, 2012a). This means that in 1 man-hour, 2.33 MJ of fossil fuels and 0.45 MJ of
renewable energy are respectively used.
-108-

APPENDIX F: FERTILISER USE IN MAURITIUS The area under cash crop cultivation in Mauritius is given in Table 34. It is assumed that
fertiliser use in Mauritius is meant entirely and only for the cultivation of these crops. It is
further assumed that the share of sugarcane cultivation in fertiliser use is equal to the share of
sugarcane in terms of cultivation area. This same calculation technique is used both by Beeharry
(1998) and Leung Pah Hang (2012).
Table 34: Effective area under crop cultivation in Mauritius
Year Area (ha) Fraction of
sugarcane Sugarcane Tea Tobacco Vegetables Total 2007 67,524 709 258 6740 75,231 0.8976 2008 65,710 701 256 6266 72,933 0.9010 2009 64,120 713 230 7083 72,146 0.8888 2010 62,100 698 210 7570 70,578 0.8799 2011 59,724 684 224 7484 68,116 0.8768
Source: Statistics Mauritius (2012b)
Table 35: Fertiliser use for cane cultivation in Mauritius
Year Amount of
fertilisers used (tonnes/yr)
Fraction of sugarcane
Fertilisers for cane cultivation
(tonnes/yr)
Fertilisers for cane
(tonnes/ha) 2007 38,113 0.8976 34,209 0.5066 2008 38,476 0.9010 34,665 0.5276 2009 39,592 0.8888 35,188 0.5488 2010 36,002 0.8799 31,677 0.5101 2011 41,076 0.8768 36,015 0.6030
Average 0.5392 Source: Adapted from Statistics Mauritius (2012b)
From Table 35, it is found that cane cultivation requires an average of 0.5392 tonnes/ha.
-109-