Embed Size (px)
Citation preview

ABN 22 102 912 783
32 Harrogate Street, West
Leederville WA 6007
PO Box 1385, West
Leederville WA 6901
ASX code: CXU
178,062,092 shares
7,300,000 unlisted options
Board of Directors
Tony Sage
Executive Chairman
Brett Smith
Executive Director
Qiu Derong
Non-executive Director
Catherine Grant
Company Secretary
24 March 2014
32 Harrogate Street, West Leederville WA 6007 Ph: (+618) 6181 9796 Fax: (+618) 9380 9666 PO Box 1385, West Leederville WA 6901 Web: www.cauldronenergy.com.au
Company Presentation Australian resources company, Cauldron Energy Limited (ASX: CXU) (“Cauldron” or “the Company”) is pleased to attach a copy of the presentation which will be presented by Company executives at Hong Kong Mines and Money this week.
End.
For further information, visit www.cauldronenergy.com.au or contact:
Simon Youds David Tasker
Cauldron Energy Limited Professional Public Relations
Ph: (08) 9380 9555 Ph: (08) 9388 0944
For
per
sona
l use
onl
y

MINES & MONEY, HONG KONG March, 2014
For
per
sona
l use
onl
y

Disclosure Statements Forward Looking Statements This presentation may include forward-looking statements with respect to achieving corporate objectives, developing additional project opportunities, the Company’s analysis of opportunities and the development of these and certain other matters. These statements involve risks and uncertainties which could cause actual results to differ from those contained herein. Given these uncertainties, reliance should not be placed on forward-looking statements. Analytical Method All holes were gamma logged by Borehole Wireline P/L with an Geovista 38mm total count gamma tool. The gamma tool was calibrated in Adelaide at the Department of Water, Land and Biodiversity Conservation in calibration pits constructed under the supervision of CSIRO. The gamma tool measures the total gamma ray flux in the drill hole. Readings are taken over 1 centimetre intervals and the reading and depth recorded on a portable computer. The gamma ray readings are converted to equivalent U3O8 readings by using the calibration factors derived in the Adelaide calibration pits. These factors also take into account differences in hole size and water content. The grade and calibration was calculated by Duncan Cogswell BSc(hon) MSc MAusIMM from Borehole Wireline based in South Australia. Deconvolved uranium grade values and grade thickness intervals were calculated by David Wilson BSc MSc MAusIMM from 3D Exploration Ltd based in Western Australia. The gamma radiation used to calculate the equivalent U3O8 is predominately from the daughter products in the uranium decay chain. When a deposit is in equilibrium, the measurement of the gamma radiation from the daughter products is representative of the uranium present. It takes approximately 2.4M years for the uranium decay series to reach equilibrium. Thus, it is possible that these daughter products, such as radium, may have moved away from the uranium or not yet have achieved equilibrium if the deposit is younger than 2.4M years. In these cases the measured gamma radiation will over or under estimate the amount of uranium present. Sandstone hosted roll front mineralisation may not be in equilibrium due to one of the above factors. Competent Person Statement The information in this announcement to which this statement is attached that relates to Cauldron Energy Limited’s exploration results is based on information compiled by Mr Mark Couzens who is a Member of the Australasian Institute of Mining and Metallurgy. Mr Couzens is a full-time employee at Cauldron Energy Limited in the role of Exploration Manager and has sufficient experience relevant to the styles of mineralisation and types of deposits under consideration and to the activities being undertaken to qualify as a Competent Person as defined in the 2012 Edition of the “Australasian Code for Reporting of Exploration Results, Mineral Resources and Ore Reserves”. Mr Couzens consents to the inclusion in the announcement of the matters based on their information in the form and context in which it appears. The information in this resource memorandum that relates to mineral resources is based on information evaluated by Mr Craig Harvey who is a Member of the Geological Society of Southern Africa. Mr Harvey is full time employee of Ravensgate, an independent consultancy group specialising in mineral resource estimation, evaluation and exploration. Mr Harvey has sufficient experience which is relevant to the style of mineralisation and type of deposit under consideration and to the activity which they are undertaking to qualify as a Competent Persons as defined in the 2004 Edition of the ‘Australasian Code for Report of Exploration Results, Mineral Resources and Ore Reserves’. Mr Harvey consents to the inclusion in the report of the matters based on his information in the form and context in which it appears. The calculation of the uranium grades used in the resource estimate are based on information compiled by Mr David Wilson BSc MSc MAusIMM from 3D Exploration Ltd based in Western Australia. These uranium grades form the basis of the resource estimate and have been calculated from the gamma results and from the disequilibrium testing. Mr Wilson is a consultant to Cauldron and has sufficient experience relevant to the styles of mineralisation and types of deposits under consideration and to the activities being undertaken to qualify as Competent Persons as defined in the 2012 Edition of the “Australasian Code for Reporting of Exploration Results, Mineral Resources and Ore Reserves”. Mr Wilson consents to the inclusion in the announcement of the matters based on their information in the form and context in which it appears.
Pg 2
For
per
sona
l use
onl
y

Capital Structure* Ordinary shares 178.06M
Unlisted options 12.3M
Market cap. (AUD$0.09) A$16.02M
Cash @ 31/12/13** A$1.6M
Convertible Note proceeds $1M
Corporate Overview
ASSET RICH COMPANY MAJOR STOCK PRICE IMPROVEMENT POTENTIAL
Major Shareholders* Cape Lambert Resources Ltd 22.61%
Mr D.Qiu 16.25%
Joseph Investments Int. Ltd 14.25%
* Figures as at 21/03/2014 ** Including held liquid assets
Pg 3
Board & Management Tony Sage Chairman
Brett Smith Exec. Director
Qiu Derong Non-Exec. Director
Simon Youds Head of Operations
Mark Couzens Head of Exploration
Catherine Grant CFO & Company Secretary
UNDERVALUED COMPANY | PROJECTS POISED FOR GROWTH
* As at 21/03/2014
For
per
sona
l use
onl
y

Yanrey Project, WA (U)
Bennet Well: Potential growing ISR opportunity
Leach Testing paves path to ISR (96%)
Marree Project, SA (Pb-Ag-Cu-Au)
Large target area with high grade mineralisation
Geophysical surveys have generated multiple drill targets
Rio Colorado (Cu, Ag)
Potential world-class base metals project
Uranium by-product in 16km strike can supply 100% of Argentina’s domestic nuclear energy demands
Undervalued company with Globally significant resource assets
CXU Key Uranium Assets TOP-SHELF URANIUM AND BASE METAL ASSETS
Pg 4
Core from Yanrey Project’s Bennet Well South: trays show the sedimentary contrasts and are
coincident with the gamma spikes
Argentina
Australia
For
per
sona
l use
onl
y

Pg 5
CXU Secures AU$1 Million Funding Mar. 2014
Major shareholder Cape Lambert shows further support for CXU with provision of AU$1M funding
Outstanding Uranium Extraction at Bennet Well Feb. 2014
Outstanding uranium extraction at Bennet Well indicates high recovery at low operating cost (ISR)
Takeover Offer for Energia Minerals (EMX) Extended Feb. 2014
CXU extends offer to undertake off-market scrip takeover bed: 1 CXU share for 8 EMX share basis
Bennet Well Surpasses Expectations Jan. 2014
Outstanding uranium extraction at Bennet Well indicates high recovery at low operating cost
CXU to Raise $10 Million to Fund Exploration Nov. 2013
Beijing roadshow yields mandate from Chinese investor group to raise $10M at A$0.25/share
Uranium Grows at Yanrey- Further High Grade Uranium Areas Intersected Oct. 2013 Bennet Well at gateway to the ISR project pipeline: 100% holes intersected economic uranium
CXU Commits to Drill Testing Large Anomaly at Marree’s Ooloo Mine, SA Sep. 2013 CXU to drill new, large untested geophysical anomaly discovered beneath Ooloo Mine Potential Uranium Intersected in Extensive Paleochannels at Barradale, Yanrey, WA Jul. 2013
Deep channel with section of reduced sediments showing elevated gamma readings indicative of uranium
Large High Grade Polymetallic Zone Identified at Marree, SA Jun. 2013
Discovery of new large high-grade polymetallic zone at Mt. Freeling prospect
Recent CXU News F
or p
erso
nal u
se o
nly

Energia Minerals Takeover
CXU Offer1
Offer 1 CXU share for 8 EMX shares values EMX at ~29% premium to market2
Resource at 15.6Mlb 3-4 times valuation multiple at $1-1.5/U3O8 Resource pound Regional Uranium camp consolidation reflects
confidence in CXU’s Yanrey region (WA)
M&A ACTIVITY HIGHLIGHTS URANIUM POTENTIAL
Opportunities
If accepted very good value for EMX and CXU CXU controls 95% of land prospective for low
cost ISR uranium production If rejected there is the potential for negotiation CXU/EMX activity potentially promotes M&A activity
in Yanrey region and uranium industry
Pg 6
Energia project map source: www.energiaminerals.com.au
(1) Offer closes 1st May 2014 unless further extended (2) Based on closing price of CXU shares on ASX on 14 March 2013 of $0.27
For
per
sona
l use
onl
y

Pg 7
The Target Prospects show the growth potential for the Resource at Bennet Well
ISR SUITABILITY VALIDATED BY LEACH TESTS
Resource1 upgrade required Core testing indicates significant Bennet
Well uranium grade increase 122%-147% Change to JORC 2012 Drilling from Sept 2013 to be included
Leach tests have put Bennet Well on path towards potential production Bottle Roll Test simulating ISR
conditions give 94%-98% extraction
Outstanding growth potential
Identification of uranium minerals provides Redox-front road map to aid locating additional uranium Resources locally and regionally
BENNET WELL ON THE WAY TOWARDS ISR PROJECT DEVELOPMENT
1.Bennet Well JORC 2004 Resource (E08/1493) of 15.7 million lb U3O8 at 267ppm U3O8 inclusive Indicated Resource 3.1 Mlb (1,400t) at 315ppm U3O8 and Inferred resource:12.7 Mlbs (5,700t) U3O8 @ 255ppm
Bennet Well, Yanrey Region F
or p
erso
nal u
se o
nly

Yanrey Regional Potential
Exploration Target(1) 30-115 Mlb @ 250-900 ppm eU3O8 to be reviewed following resource upgrade
Studies show grades above 250ppm eU3O8 (over 1m) are potentially economic for a ISR mining operation
11 major channel systems similar to Bennet Well identified by CXU, most with evidence of uranium mineralisation
Regional uranium competition: Paladin Energy Manyingee 25.9Mlb deposit; Energia Minerals Carley Bore 15.6 Mlb deposit
Mineralogy from Bennet Well shows different uranium minerals from different deposition environments - gives a road map for the redox deposition
WIDESPREAD URANIUM ALONG PALAEO COASTLINE SIMILAR TO BENNET WELL
(1) Exploration Target: Under clause 18 of the JORC code, the exploration targets (excluding the portion already classified into JORC Inferred Resource outlined in this report are conceptual in nature as there has been insufficient exploration (namely drilling) to define a mineral resources and it is uncertain if further exploration will result in the determination of any additional mineral resource
FUNDING IS SOLE IMPEDIMENT TO EXPANDING YANREY RESOURCE INTO EMERGING URANIUM CAMP Pg 8
For
per
sona
l use
onl
y

Leach No. Composite pH ORP (mV,
Ag/AgCl)
Temp (C)
Estimated Acid Consumption
(kg/t)
Feed U3O8 (ppm)
Residue U3O8 (ppm)
U Extraction (%)
CAULD 7 YNDD018 2.0 450 30 TBA 1,186 17 98.6 CAULD 8 1.8 450 21 0.4 47 96.0 CAULD 9 YNDD022 1.8 450 21 1.2 500 23 95.4
BOTTLE ROLL TESTS CONFIRM HIGH URANIUM EXTRACTION
Leach Results
High levels of Uranium extraction achieved and Low Cost extraction anticipated Bottle roll tests in acidic media without oxidant
Low acid consumption demonstrated
Uranium appears to exist in soluble +6 oxidation state
Low levels of impurities unlikely to impact leach solution processing
Mineralogy showed variety of uranium minerals present including Sodium Zippeite
HIGH LEVEL OF URANIUM EXTRACTION ACHIEVED LOW COST ANTICIPATED Pg 9
Uranium Extraction Results
SEM image from Hole YNDD018 at Bennet Well showing lighter uranium mineral and depicting
accessible location of Uranium
For
per
sona
l use
onl
y

89.95m – 95.05m 5.1m @ 1209ppm
U3O8
START OF MINERALISED ZONE
88.00m 55.8 md 88.10m 25.2 md
90.83m 4280 md 90.98m 4750 md
91.28m 930 md 91.34m 1050 md
91.64m 4490 md 91.82m 4590 md 92.03m 4200 md
94.80m 346 md 95.15m 67.6 md
HIGHLY UNCONSOLIDATED/PERMEABLE, UNABLE TO GET QUANTITATIVE
MEASUREMENT
Pg 10
Permeability vs Assays vs Leach Results – YNDD018
Core from YNDD018 from 87.6m to 96.7m: uranium grade of 5.1m @ 1209 ppm U3O8
Image: mineralised zone in hole YNDD018 (red) and permeability data (yellow) Highly permeable nature evident in
the sands hosting uranium at Bennet Well South Prospect
Data supports leach testwork results: 98.6% U extraction acid leach
95.3% U extraction alkaline leach
URANIUM DISTRIBUTION WITH DEPTH HOLE YNDD018
For
per
sona
l use
onl
y

Current geological interpretation of Bennet Well Resource Area
Pg 11
QEMSCAN and manual SEM testing strongly indicate several provenance areas for uranium mineralisation, all soluble = amenable to ISR
Uranium mineralisation forms in reducing environments Reducing agents (zones of fossilised wood,
abundant pyrites) found at Bennet Well
COFFINITE - primary uranium silicate mineral not yet exposed to oxidising agents or environments.
URANIFEROUS ZIRCONS - typically detrital in origin, having shed off a granitic source proximal to source
SODIUM-ZIPPEITE - secondary uranium-bearing mineral – ie re-deposited in paleo river sands
MINERALOGY PROVIDES REDOX ROADMAP
Yanrey Uranium Suited to ISR
MINERALS IDENTIFIED PROVIDE TOOLS FOR REGIONAL EXPLORATION
For
per
sona
l use
onl
y

89.95m – 95.05m 5.1m @ 1209ppm U3O8
START OF MINERALISED ZONE
Sample DD00418: 93.25m – 93.40m
4331ppm U3O8
Pg 12
Dominant uranium-
containing phase
with a chemical
composition
corresponding to the
mineral SODIUM-
ZIPPEITE
High recovery rates
suggest this uranium
species is easily
soluble and hence
highly recoverable
YNDD018 BENNET WELL
SOUTH
QEMSCAN/SEM Results
For
per
sona
l use
onl
y

Yanrey 5yr Production Plan
Geology Resource Growth
Met drilling Measured Resource
Final Reserve
Approvals Prelim EPA/ISL
Mining (SAWA)
EPA Application
EPA Approval & DIA
Approval
Technical & financial
justification Scoping study Pre feasibility
Study Feasibility
study
Board Approval /
construction ISR
Production
ISR: HIGH MARGIN PRODUCTION AT LOW COMMODITY PRICE Pg 13
2014 2015 2016 2017 2018
Sandstone roll-front ISR operations production price : $8/lb - $16/lb globally
Revenue at $50/lb is 4-5 times C1 cash cost Realistic production timeframe following first WA uranium mine to receive final approvals
Core data shows majority of uranium located in permeable sand zones amenable to ISR
ISR style mining: quick to establish, cheap to run
Fast track production to fill market demand shortfall
LOW CAPEX ISR PROJECTS PROVIDE GROWTH PLATFORM
For
per
sona
l use
onl
y

Potential World Class Deposits
Marree: Exciting potential for large deep mineralisation
Structural geophysical survey required over whole area to achieve improved definition Resolve Traditional Owners dispute
(currently being resolved) Drill priority targets subject to funding
Pg 14
Large poly-metallic alteration area, numerous historical mining sites Geophysical anomalies undercover and
adjacent to old mine Potential for large poly-metallic system
(multiple deposits) Currently 2 main deep drill targets
Map region to establish local presence & engage with local community Subject to access, conduct
reconnaissance drill program to establish consistency at depth potential for inferred resource
2014 ACTIONS
MARREE, SOUTH AUSTRALIA RIO COLORADO, ARGENTINA
16km outcrop, 11m wide, open at depth multiple samples taken average grades
>150g/t Ag, 2-3% Cu and 300ppm Uranium Access restrictions starting to ease
Early metallurgical work completed Nuclear power identified by government
as key for Argentina’s energy mix
Rio Colorado: potential for high value subject to access
2014 ACTIONS
For
per
sona
l use
onl
y

World Uranium News GLOBAL PROBLEM: GROWING DEMAND AND INSUFFICIENT SUPPLY
China on Track to Beat 2020 Nuclear Power Targets Mar. 2014 China on track to meet nuclear power targets with new plant construction expected to resume shortly
Japan to Restart 48 Nuclear Reactors Feb. 2014 After 2yrs offline, Japanese govt. has announced its intention to restart the country’s 48 nuclear reactors
Pakistan to Build 32 Nuclear Plants to Generate 40,000 MW Electricity Feb. 2014 Pakistan in process of selecting 8 sites for 32 nuclear plants to combat domestic energy crisis
US Uranium Concentration Production Rises, Russian Warhead Fuel Runs Out Feb. 2014 US 2013 uranium concentrate production up 21% following end of Megatons to Megawatts program
India, Japan Seek Early Deal on Nuclear Cooperation Jan. 2014 India and Japan agree to fast-track negotiations for possible deal on nuclear energy
Pakistan , China Discuss 3-Plant Nuclear Energy Deal Jan. 2014 Pakistan and China in talks over a deal where China sells Pakistan 3 large nuclear plants for ~$13B Argentina Competitive Bidding Process for 4 Nuclear Power Plants Jun. 2013
Govt. will tender before end of 2013 to build four new nuclear plants, worth US$16M 1st Uranium Project to be Approved in WA Apr. 2013
Wiluna Uranium Project (Toro Energy), capable of production from 2015, receives final Federal approval Pg 15
For
per
sona
l use
onl
y

World Nuclear Energy Market EMERGING ECONOMIES BANKING ON NUCLEAR POWER
TO MEET ELECTRICITY DEMANDS
Pg 16
IAEA forecasts that if policies
remain unchanged, world energy
demand is projected to increase by
over 50% by 2030*
Nuclear power is the lowest social
and economic cost power option for
developing nations
GLOBAL DEMAND FOR URANIUM & NUCLEAR ENERGY HIGHER NOW THAN PRE-FUKUSHIMA 2011
Graph source: METI, WNA *www.naturaledgeproject.net, The Great Sustainability Debate
China’s electricity demands are growing at an average annual rate of 10%
Will surpass US as largest global uranium consumer within the next 10-15 years For
per
sona
l use
onl
y
China’s Energy Market
REFORMING ENERGY OUTPUT AND CONSUMPTION PATTERS
Pg 17
In 2013, installed power capacity rose by 94M kw, including 2.21M kw from nuclear 6 new nuclear power facilities approved since
end of 2012 Construction may commence on new
facilities during 2014 Astonishing progress in nuclear
technology in recent years Electricity demands growing at average
annual rate of 10%
CHINA TO BEAT 2020 NUCLEAR TARGETS
Graph source: oilprice.com China Moves Forward with Nuclear Reactors. *Reuters: China to beat 202 Nuclear targets (Mar 2014)
Electricity demands growing at average annual rate of 10%
China National Nuclear Corp. raising $3B for expansion plans* Back on track with projects halted following 2011 Fukushima disaster China could build 20 nuclear plants in the next 6 years
For
per
sona
l use
onl
y

Uranium Market Analysis
Pg 18
CHRONIC URANIUM SHORTAGE WITHOUT NEW FLOW IN NEXT 2-3YRS
UNDERSUPPLY TO FUEL URANIUM RESTART
*Morgan Stanley: Metal Sparks, Feb 2014 **Bell Potter: Uranium Powering Up, Feb 2013 Graph source: iaea.org “Under construction reactors”
+50% price growth by 2018* Total Reactors Under Construction Globally: 72 (~20% existing)
Japan: govt. has announces intention to restart 48 nuclear reactors Pakistan: location scouting for 32 new nuclear power plants to produce 40,000 MW energy
2018 spot price to reach US$72/lb U3O8
Higher uranium prices essential Non ISR incentive price +$70/lb U3O8 Stagnated demand and low prices
unsustainable for uranium industry Paladin & Cameco announce
significant output scale-backs 2030 uranium demand estimated to be 100kt ~48% increase on current demand* ~80kt to come from new mines and mine
extensions (60% current global supply) Reactor growth is main price trigger
For
per
sona
l use
onl
y

Demand Increase/Supply Decrease
Current uranium spot price $34.85/lb
production trigger price $85/lb
Secondary supply reducing
Less high enriched warheads
Tails retreatment not cost effective at
current prices
End users unconcerned on supply
Large inventories at low prices
Supply small cost component
New supply time lag not understood
New demand growth recovery since 2011
Graph source: Japanese Ministry of Economy, Trade & Industry; WNA; Bloomberg: Market Update
LONG-TERM SUPPLY & DEMAND APPEARING TO INDICATE EXTENDED PERIOD OF UNDER SUPPLY Pg 19
COMMODITY PRICE IS BIGGEST IMPEDIMENT TO SUPPLY GROWTH
For
per
sona
l use
onl
y

Socially Responsible Power
ISR: Most Cost Effective + Safe Uranium Mining Method
Land reverts easily to its previous use after decommissioning
Water quality quickly reverts to original condition once leaching is discontinued
Only ISR uranium extraction method is economic at current prices
Image source: www.sciencephoto.com
ISR: LOW COST, LOW ENVIRONMENTAL IMPACT Pg 20
NUCLEAR ENERGY ESSENTIAL MAJOR POWER GENERATION SOURCE
Low emission power: nuclear is the only carbon-free
baseload source of electricity
Modern plants will combat smog issues experienced by
major cities inc. Beijing and Hong Kong
Renewable energies (wind, solar) as a baseload option
are realistically 50-100 years away Power growth potential in Asia evident from Japan China India comparison
By 2020, China & India will need additional >40Mlb uranium: equivalent to ~40% of 2011 global mine supply
For
per
sona
l use
onl
y

Climate Change
WITHOUT NUCLEAR ENERGY - INCREASED HEALTH RISKS FROM SMOG, RISING GLOBAL TEMPERATURE Pg 21
NUCLEAR POWER ESSENTIAL TO THE GLOBAL RESPONSE
Climate change requires +60% reduction in greenhouse gas emissions
China, Japan, India, Pakistan, Argentina embrace nuclear power as essential to new domestic
and global energy mix
Conservative estimates of the positive impacts of existing nuclear plants*
~64 gigatons of CO2 saved: 1.8 million premature deaths prevented by reducing toxic pollution
from coal fired power plants
* www.businessspectator.com “Jim Green’s distractions and James Hansen’s analysis” Image Source: www.serc.carleton.edu
Negative Impacts of the Anti-Nuclear Movement
Had the nuclear rollout continued in 1970s, 18 million premature fossil fuel related deaths and ~640 gigatons of CO2 would have been saved*
Consequence of ~640 gigatons CO2 is elevated risk of atmospheric temperature increase
Responsibility for rise in gas-fracking and exploitation of tar sands and other oil technologies
For
per
sona
l use
onl
y

Investment Highlights
Outstanding cash margin at low commodity prices
Commodity prices expected to more than double to meet world demand
Undervaluation of quality uranium miners creates credible buying opportunity
New generation of nuclear energy essential to energy mix over next 30 years
ISR C1 cost multiplies at low market price
ISR low cost production and low environmental impact
Yanrey – the new uranium camp?
Exploration target size now indicates world class uranium region
High grades & shallow horizon indicate lowest ISR production cost
Argentina – huge potential not reflected in share price
Supportive shareholders and revitalised Board & Management Team
PREDICTED UPSURGE IN URANIUM PRICE POTENTIAL FOR SIGNIFICANT RETURNS ON INVESTMENT
CXU: ASSET RICH WITH PROJECTS POISED FOR GROWTH Pg 22
For
per
sona
l use
onl
y

CONTACT US Simon Youds David Tasker/ Colin Jacoby Cauldron Energy Limited Professional Public Relations 32 Harrogate Street Tel: +61 (8) 9388 0944 West Leederville WA 6007 M: +61 (0) 433 112 936 Tel: +61 (8) 6181 9796 E: [email protected] E: [email protected] www.cauldronenergy.com.au
Pg 23
For
per
sona
l use
onl
y

Pg 24
APPENDIX
For
per
sona
l use
onl
y
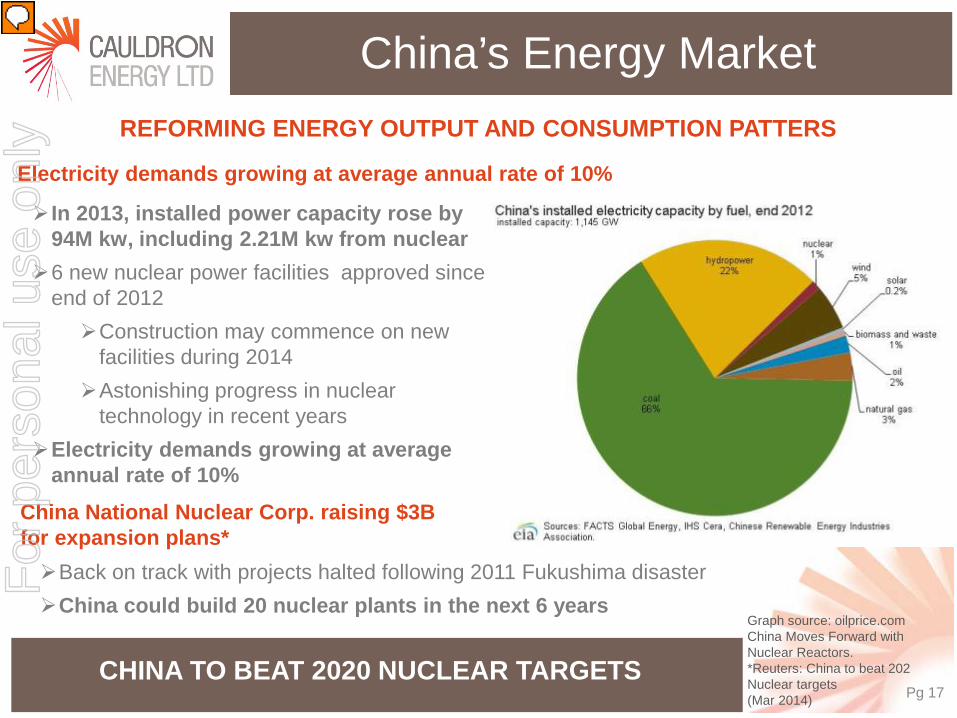
Uranium Distribution with Depth, Hole YNDD022
Pg 25
PERMEABILITY VS ASSAYS VS LEACH RESULTS – YNDD022
58.92m 55.8 md
59.10m 110 md
59.39m 604 md
59.87m 3.48 md
60.06m 15.2 md
59.58m 2400 md
58.90 – 60.00m 1.1m @
473ppm U3O8
START OF MINERALISED ZONE
Permeability data returned from the mineralised intervals in YNDD022 correspond to the zones
of increased clay concentration, HOWEVER this has clearly had NEGLIGBLE impact on the
extraction rates of the uranium, as shown by the results of the leach testwork by ANSTO:
98.4% U extraction by acid reagent and 93.5% U extraction by alkaline leach liquor.
The image shown on the left illustrates
the mineralised zone in hole
YNDD022 (red) and
permeability data (yellow).
For
per
sona
l use
onl
y

Pg 26
QEMSCAN/SEM RESULTS: YNDD022 (BENNET WELL EAST)
QEMSCAN analysis
identified URANIFEROUS ZIRCONS and
COFFINITE within the YNDD022
mineralised zone.
Manual SEM examination
clearly revealed coffinite as the
most prolific uranium species.
58.90 – 60.00m 1.1m @ 473ppm U3O8
START OF MINERALISED ZONE
Sample DD00327: 59.10m – 59.25m
1208ppm U3O8
All images from sample DD00327
The coffinite is typically present as tiny grains, finely intergrown with biotite, muscovite, kaolinite/clay,
quartz and pyrite
The high recovery rates returned from YNDD022
also suggest that these 2 uranium species are easily
soluble and therefore
extractable by leaching
For
per
sona
l use
onl
y

MODAL MINERALOGY FOR SAMPLES DD00327 (YNDD022) AND DD00418 (YNDD018)
MODAL ABUNDANCES IDENTIFIED BY QEMSCAN
0
10
20
30
40
50
60
70
80
90
100
DD00327 DD00418
Conc
entr
atio
n w
t %
Trace & Others
Total U-Minerals
Zircon
Pyrite
Rutile
Muscovite
Kaolinite/Clays
Biotite
K-Feldspar
Quartz
DD00327
Uranium Bearing Minerals in Higher Grade Intervals Mineral Chemical Formula YNDD022 YNDD018
Uranium Phase U, S, Si, Zr, O, Na 0.020 0.36 U-Zircon (Zr,U)SiO4 0.010 0.022 Coffinite U(SiO4)1-x(OH)4x 0.0002 0.013
Sodium-Zippeite Na4(UO2)6(SO4)3(OH)10 •4H2O <0.001 0.038
Gangue Minerals in Higher Grade Intervals Mineral Chemical Formula YNDD022 YNDD018 Quartz SiO2 70.9 88.5
K-Feldspar KAlSi3O8 20.6 3.80 Biotite K(Mg,Fe)3[AlSi3O10(OH,F)2] 2.95 0.35
Kaolinite/Clays Al2Si2O5(OH)4 2.82 4.16 Muscovite KAl2(Si3Al)O10(OH,F)2 1.87 1.14
Rutile TiO2 0.37 0.06 Pyrite FeS2 0.20 1.27 Zircon ZrSiO4 0.12 0.14
Carbonates (Ca,Mg,Fe)CO3 0.001 0.005 Trace & Others 0.20 0.11
Al As Ba Fe K Mg Mn Na
DD00327 3.5 <0.001 0.062 1.24 2.59 0.17 <0.001 0.093
DD00418 3.0 0.002 0.019 1.85 1.25 0.057 0.019 0.064
P Si Th Ti U V Zn Zr
DD00327 0.016 38.1 0.002 0.19 0.10 0.004 0.003 0.038
DD00418 0.011 38.2 0.002 0.26 0.37 0.003 0.008 0.032
DD00418
Elemental Analysis (wt%)
Uranium mineral occurrence at the grain boundaries supports ISL extraction method
For
per
sona
l use
onl
y

Pg 28
Diamond core assays returned an overall 12.3% increase in the total amount of uranium when compared to down-hole gamma probe data for the equivalent
intervals. Highlighted are holes YNDD018 (Bennet Well South) and YNDD022 (Bennet Well East) chosen for analysis at ANSTO, NSW.
ICP-MS AND DNA ASSAYS VS DOWNHOLE GAMMA RESULTS
Hole ID Easting Northing TD (m) RL (m) Resource Name
Assay Depth From (m)
Assay Depth
To (m)
Assay Width
(m)
ME-MS61 U308 (ppm)
DNA U308 (ppm)
Max Grade U308 (ppm)
Assay Grade Width
(ppm.m)
Probe Grade Width
(ppm.m)
Grade Width
Change (%)
YNDD015 302878 7508657 52.5 47 Bennet Well East 41.45 43.60 2.15 612 NA 2641 1316 979 +35%
YNDD016 303305 7507544 68 47 Bennet Well East 62.90 63.5 0.6 443 NA 778 266 294 -9.5%
YNDD017 303240 7507886 64.1 48 Bennet Well East
58.35 59.25 0.9 538 NA
1533 484 948 -49% 60.6 61.2 0.6 496 613 298 182 +64%
YNDD018 299975 7506937 102.1 45 Bennet Well South
87.85 88.30 0.45 NA
887 2157 399 349 +14.3% 89.95 95.05 5.1 1209 4331 6166 3901 +58% 95.35 96.25 0.9 219 309 197 155 +27%
YNDD019 300271 7506221 99.6 46 Bennet Well South
83.70 85.8 2.1 635 NA
1674 1335 1781 -25.1% 92.25 93 0.75 797 2016 598 NA NA
YNDD020 300538 7505854 90.6 46 Bennet Well South
73.35 73.95 0.6 1066 NA
2511 639 608 +5.1% 82.20 83.70 1.5 1237 5506 1855 1541 +20.4%
YNDD021 299124 7504044 68.7 45 Bennet
Well Deep South
53.90 55.40 Core Loss 602 NA
61.15 61.75 0.6 1453 NA 3278 872 689 +26.5%
YNDD022 302970 7508268 67.6 49 Bennet Well East 58.9 60 1.1 NA 473 1208 520 1349 -61%
Note: All U308 grades are calculated by multiplying the uranium assay grade by 1.179 Note: The U308 cut off used for reporting is 100ppm U308 over a depth of 0.5m Note: YNDD015 includes 0.5m core loss in the mineralised zone from 42.5m Note: YNDD021 has complete core loss of the 1.5m upper mineralised zone from 53.90m Note: The lower uranium zone in YNDD019 was not gamma probed due to hole blockage Note: ME-MS61 assay testing was completed by ALS in WA. NA indicates not applicable Note: DNA assay testing was completed by ANSTO in NSW. NA indicates not applicable Note: Ore grade Ag assay was completed on 2 samples in YNDD017. 57.5 to 57.6m had 121 g/t silver and 58.12 to 58.20m had 135 g/t silver. Note: The datum for all drillholes is GDA94_Zone50 Note: All holes were drilled vertical with a dip of -90 and an Azimuth of 0. F
or p
erso
nal u
se o
nly
Pg 29
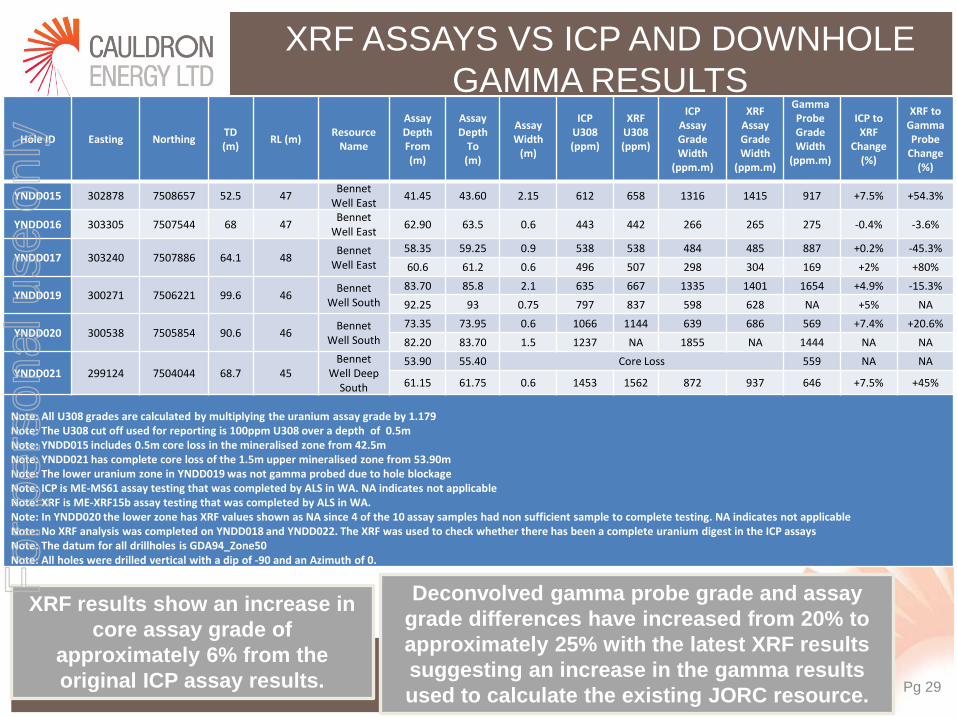
Deconvolved gamma probe grade and assay grade differences have increased from 20% to approximately 25% with the latest XRF results suggesting an increase in the gamma results used to calculate the existing JORC resource.
XRF results show an increase in core assay grade of
approximately 6% from the original ICP assay results.
Hole ID Easting Northing TD (m) RL (m) Resource
Name
Assay Depth From (m)
Assay Depth
To (m)
Assay Width
(m)
ICP U308 (ppm)
XRF U308 (ppm)
ICP Assay Grade Width
(ppm.m)
XRF Assay Grade Width
(ppm.m)
Gamma Probe Grade Width
(ppm.m)
ICP to XRF
Change (%)
XRF to Gamma Probe
Change (%)
YNDD015 302878 7508657 52.5 47 Bennet Well East 41.45 43.60 2.15 612 658 1316 1415 917 +7.5% +54.3%
YNDD016 303305 7507544 68 47 Bennet Well East 62.90 63.5 0.6 443 442 266 265 275 -0.4% -3.6%
YNDD017 303240 7507886 64.1 48 Bennet Well East
58.35 59.25 0.9 538 538 484 485 887 +0.2% -45.3% 60.6 61.2 0.6 496 507 298 304 169 +2% +80%
YNDD019 300271 7506221 99.6 46 Bennet Well South
83.70 85.8 2.1 635 667 1335 1401 1654 +4.9% -15.3% 92.25 93 0.75 797 837 598 628 NA +5% NA
YNDD020 300538 7505854 90.6 46 Bennet Well South
73.35 73.95 0.6 1066 1144 639 686 569 +7.4% +20.6% 82.20 83.70 1.5 1237 NA 1855 NA 1444 NA NA
YNDD021 299124 7504044 68.7 45 Bennet
Well Deep South
53.90 55.40 Core Loss 559 NA NA
61.15 61.75 0.6 1453 1562 872 937 646 +7.5% +45% Note: All U308 grades are calculated by multiplying the uranium assay grade by 1.179 Note: The U308 cut off used for reporting is 100ppm U308 over a depth of 0.5m Note: YNDD015 includes 0.5m core loss in the mineralised zone from 42.5m Note: YNDD021 has complete core loss of the 1.5m upper mineralised zone from 53.90m Note: The lower uranium zone in YNDD019 was not gamma probed due to hole blockage Note: ICP is ME-MS61 assay testing that was completed by ALS in WA. NA indicates not applicable Note: XRF is ME-XRF15b assay testing that was completed by ALS in WA. Note: In YNDD020 the lower zone has XRF values shown as NA since 4 of the 10 assay samples had non sufficient sample to complete testing. NA indicates not applicable Note: No XRF analysis was completed on YNDD018 and YNDD022. The XRF was used to check whether there has been a complete uranium digest in the ICP assays Note: The datum for all drillholes is GDA94_Zone50 Note: All holes were drilled vertical with a dip of -90 and an Azimuth of 0.
XRF ASSAYS VS ICP AND DOWNHOLE GAMMA RESULTS
For
per
sona
l use
onl
y

URANIUM EXTRACTION TESTWORK FINAL LEACH TESTS UNDERTAKEN AT ANSTO, NSW
Low acid consumption at < 16 kg/t
Leach Results
Sample Al As Ba Ca Cl Fe K Mg Na P S Si Sr
Average 1.4 1.3 14.6 134.2 2,144 6.8 63.1 175.9 1,524 1.7 330 25.6 2.6
Maximum 6 2 77 333 13,500 35 208 518 8,960 6 1,490 34 9
Minimum 1 1 1 48 209 3 15 26 148 1 20 8 1
Site Water Analysis (ppm)
Leach tests undertaken in Sydney tap water in small agitated vessels to minimise matrix effects
Low levels of impurities are unlikely to impact leach solution processing
HIGH LEVEL OF URANIUM EXTRACTION ACHIEVED USING ACID OR ALKALINE LEACH SOLUTIONS Pg 30
Leach No. Composite Test Type pH ORP (mV, Ag/AgCl)
Temp (C)
Estimated Acid
Consumption (kg/t)
Oxidant Addition
Fe(III), g/L
Feed U3O8 (ppm)
Residue U3O8 (ppm)
Uranium Extraction
(%)
CAULD 3 YNDD018 Agitated 1.2 600 50 13.6 2.0 1,186 17 98.6 CAULD 7 Agitated 1.8 ~450 30 tba 0.0 1,186 32 97.3 CAULD 1 Agitated 2.0 500 30 7.9 0.5 1,186 34 97.1 CAULD 8 Bottle roll 1.8 ~450 21 0.4 0.0 1,186 47 96.0 CAULD 5 Agitated Alkaline Leach 30 N/A N/A 1,186 71 94.0 CAULD 4 YNDD022 Agitated 1.2 600 50 16.3 2.0 500 9 98.2 CAULD 2 Agitated 2.0 500 30 10.1 0.5 500 19 96.2 CAULD 9 Bottle roll 1.8 ~450 21 1.4 0.0 500 23 95.4 CAULD 6 Agitated Alkaline Leach 30 N/A N/A 500 35 93.0
For
per
sona
l use
onl
y