Embed Size (px)
Citation preview

COMPANY PRESENTATION
1Q 2019 RESULTS
30 APRIL 2019

2
1
Appendix
Plantation Highlights
3
Financial Highlights
PRESENTATION OUTLINE

Integrated Agribusiness with Leading Brands
3 3
PLANTATION HIGHLIGHTS

Integrated Agribusiness with Leading Brands
44
Oil Palm Average Age ≈ 15 yearsIn Ha
31 Mar
2019
31 Dec
2018
Indonesia - Inti
Planted Area 301,383 301,721
Planted Oil Palm 250,577 251,112
- SIMP 154,347 155,073
- Lonsum 96,230 96,039
Planted Other crops
Rubber 16,798 16,678
- SIMP 851 851
- Lonsum 15,947 15,827
Sugar cane - SIMP 13,919 13,595
Others - timber, cocoa, tea 20,089 20,336
Indonesia - Plasma
Oil Palm 86,430 86,403
Brazil
Sugar cane - CMAA 82,235 79,268
- Vale do Tijuco (UVT) 53,203 50,686
- Vale do Pontal (UVP) 29,032 28,582
* CMAA acquired UVP in July 2018. Of the 82,235 Ha planted sugar cane,
46% owned by CMAA and 54% contracted 3rd party farmers
PLANTED AREA

Integrated Agribusiness with Leading Brands
55
1Q19 1Q18
YoY
Growth FY18
PRODUCTION
Mature Area (Ha) 213,383 211,050 211,707
FFB ('000 MT) 931 878 6% 4,424
- Nucleus ('000 MT) 745 695 7% 3,375
- External ('000 MT) 186 183 2% 1,049
CPO ('000 MT) 192 184 4% 921
PK ('000 MT) 47 44 6% 221
PRODUCTIVITY
FFB Yield – Nucleus (MT/Ha) 3.5 3.3 15.9
CPO Yield – Nucleus (MT/Ha) 0.8 0.7 3.5
CPO Extraction Rate (%) 22.1 22.3 22.0
PK Extraction Rate (%) 5.4 5.4 5.3
OIL PALM PLANTATION HIGHLIGHTS
* The listed figures in the tables are rounded to the nearest thousands, but the growth % are calculated based on the exact figures
Integrated Agribusiness with Leading Brands
66
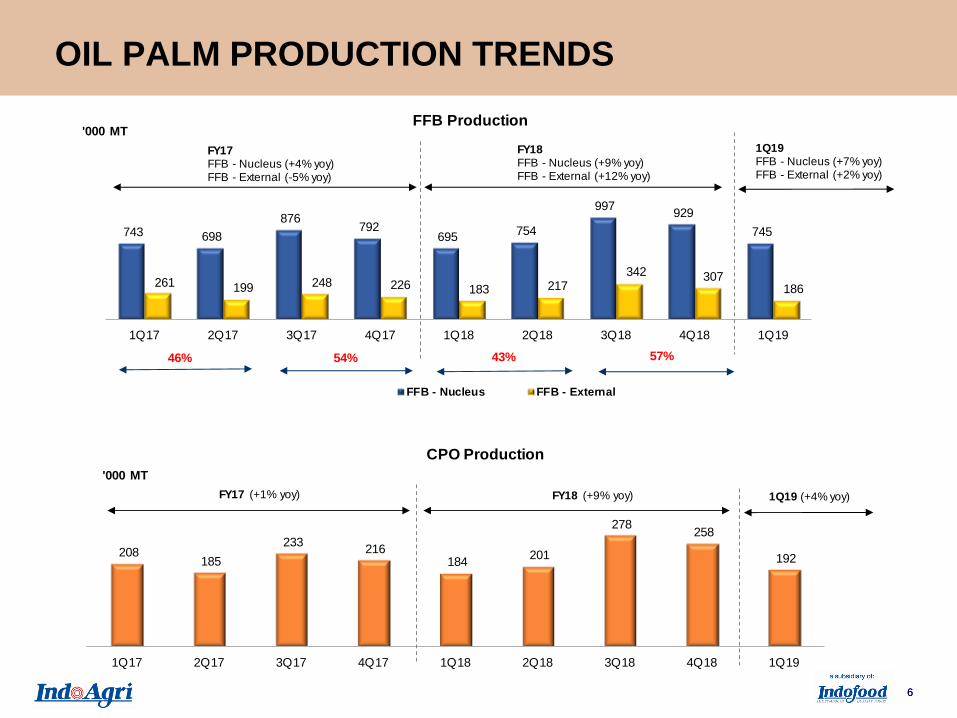
208 185
233 216
184 201
278 258
192
1Q17 2Q17 3Q17 4Q17 1Q18 2Q18 3Q18 4Q18 1Q19
'000 MT
CPO Production
FY18 (+9% yoy) 1Q19 (+4% yoy)
743 698
876 792
695 754
997 929
745
261 199 248 226 183 217 342 307
186
1Q17 2Q17 3Q17 4Q17 1Q18 2Q18 3Q18 4Q18 1Q19
'000 MTFFB Production
FFB - Nucleus FFB - External
FY18FFB - Nucleus (+9% yoy)FFB - External (+12% yoy)
1Q19FFB - Nucleus (+7% yoy)FFB - External (+2% yoy)
FY17FFB - Nucleus (+4% yoy)FFB - External (-5% yoy)
FY17 (+1% yoy)
46% 54% 43% 57%
OIL PALM PRODUCTION TRENDS

Integrated Agribusiness with Leading Brands
7 7
FINANCIAL HIGHLIGHTS

Integrated Agribusiness with Leading Brands
8
Financial Highlights
1Q19 sales increased 5% mainly due to strong sales
contribution from EOF division.
Despite higher sales volume of palm products (CPO
& PK products), Plantation division sales was flat on
weak selling prices of palm products (CPO -17%, PK
-46%).
Despite a strong EOF performance, the Group
reported lower profitability mainly attributed to a
weak plantation result.
Operational Highlights
1Q19 FFB nucleus and CPO production grew 7%
and 4% respectively to 745,000 tonnes and 192,000
tonnes.
RESULTS SUMMARY
3,190 3,358
1,1231,177
1Q18 1Q19
Rp bn REVENUE
External Inter-segment
4,536
+5%
+5%
4,313
617
419
1Q18 1Q19
Rp Bn EBITDA*
-32%
* Earnings before interests and tax expense, depreciation
and amortisation, the effects of forex and fair value
gain/(loss) on biological assets.

Integrated Agribusiness with Leading Brands
9
SALES VOLUME PLANTATION
In '000 MT 1Q19 1Q18
YoY
Growth FY18
CPO 214 171 25% 881
PK products - PK, PKO, PKE 47 43 8% 194
Sugar 5 2 225% 57
Rubber 2.3 2.6 (12%) 9.7
Oil Palm Seeds ('million) 1.7 2.6 (34%) 11.3
Note: Sales volume before elimination of inter-segment sales
* The listed figures in the tables are rounded to the nearest thousands, but the growth % are calculated based on the exact figures

Integrated Agribusiness with Leading Brands
10
AVERAGE SELLING PRICE (ASP) TREND
26,727 26,986
21,418 20,382 19,798 19,980 21,095 20,804 20,770
1Q17 2Q17 3Q17 4Q17 1Q18 2Q18 3Q18 4Q18 1Q19
Rp / kg Rubber - ASP
8,816 8,083 7,770 8,179 7,823 7,817
6,920 5,971
6,497
8,796
5,845 6,162
7,846 6,992
5,668 4,929
4,168 3,806
1Q17 2Q17 3Q17 4Q17 1Q18 2Q18 3Q18 4Q18 1Q19
Rp/kg CPO and PK - ASP
CPO PK
FY17CPO : Rp 8,217/kg (+7% yoy)PK : Rp 7,256/kg (+10% yoy)
FY17Rp 23,962/kg (+39% yoy)
FY18CPO : Rp 6,956/kg (-15% yoy)PK : Rp 5,750/kg (-21% yoy)
FY18Rp 20,481/kg (-15% yoy)
1Q19CPO (-17% yoy)PK (-46% yoy)
1Q19(+5% yoy)

Integrated Agribusiness with Leading Brands
11
FINANCIAL SUMMARY
1Q19 1Q18
YoY
Growth FY18
Sales 3,358 3,190 5% 14,059
Gross Profit 461 646 (29%) 2,198
EBITDA(1) 419 617 (32%) 2,295
Net (loss)/profit after tax (130) 53 n/m (427)
Core (loss)/profit (2) (151) 95 n/m (186)
Attributable (loss)/profit (58) 50 n/m (222)
EPS (fully diluted) - Rp (41) 36 n/m (159)
Gross profit margin 14% 20% 16%
EBITDA margin 12% 19% 16%
Net profit margin (4%) 2% (3%)
Attributable profit margin (2%) 2% (2%)
(1) Earnings before interests and tax expense, depreciation and amortisation, the effects of forex and fair value gain/(loss) on biological assets(2) Earnings before the effects of forex, fair value gain/(loss) on biological assets and changes in amortised cost of plasma receivables

Integrated Agribusiness with Leading Brands
12
SEGMENTAL RESULTS
(1) Net effects arising from elimination of unrealised profit of inter-division inventories, SFRS adjustment and regional office costs.
In Rp Bn 1Q19 1Q18
YoY
Growth FY18
Sales
Plantations 1,817 1,825 (0%) 8,585
Edible Oil & Fats 2,719 2,488 9% 10,609
Elimination & Adjustments (1,177) (1,123) 5% (5,134)
Total 3,358 3,190 5% 14,059
EBITDA
Plantations 206 492 (58%) 1,562
EBITDA % 11% 27% 18%
Edible Oil & Fats 283 52 440% 528
EBITDA % 10% 2% 5%
Share of results of associate
companies & JV(48) (9) 456% 21
Elimination & Adjustments(1) (22) 82 n/m 184
Total 419 617 (32%) 2,295

Integrated Agribusiness with Leading Brands
13
FINANCIAL POSITION
Balance Sheet (In Rp Bn) 31-Mar-19 31-Dec-18
TOTAL ASSETS 38,357 37,514
Cash 2,275 2,229
TOTAL LIABILITIES 17,661 16,661
Interest Bearing Debt 11,643 11,190
TOTAL EQUITY* 20,696 20,853
Net Debt / EBITDA Ratio 5.59x 3.91x
Net Debt / Total Equity Ratio 0.45x 0.43x
Net Assets Value per Share (in Rupiah) 8,385 8,442
Net Assets Value per Share (in SGD) ** 0.80 0.80
Cash Flow (In Rp Bn) 1Q19 1Q18 Change
Net Cash Flow generated from Operating Activities 441 234 207
Net Cash Flow used in Investing Activities (854) (506) (349)
Net Cash Flow generated from Financing Activities 467 215 252
Net Increase/ (Decrease) in Cash & Cash
Equivalents
54 (56) 110
Net Effect of Changes in Forex (8) 10 (18)
Sub-total 46 (46) 92
Cash & Cash Equivalent - Beginning 2,229 2,930 (701)
Cash & Cash Equivalent - Ending 2,275 2,883 (609)
* Total equity includes shareholders funds and minority interests
** Converted at Rp10,507/S$1

Integrated Agribusiness with Leading Brands
14 14
APPENDIX

Integrated Agribusiness with Leading Brands
15
PRODUCTION BREAKDOWN
1Q19 1Q18
YoY
Growth FY18
PRODUCTION
Mature Area (Ha) 213,383 211,050 211,707
- SIMP (Ha) 125,721 124,004 124,430
- Lonsum (Ha) 87,662 87,046 87,277
FFB ('000 931 878 6% 4,424
- Nucleus ('000 745 695 7% 3,375
- SIMP ('000 MT) 404 387 4% 1,859
- Lonsum ('000 MT) 341 308 11% 1,516
- External ('000 186 183 2% 1,049
- SIMP ('000 MT) 116 106 10% 584
- Lonsum ('000 MT) 70 77 (9%) 465
CPO ('000 192 184 4% 921
- SIMP ('000 MT) 96 95 0% 468
- Lonsum ('000 MT) 96 89 8% 453
PK ('000 47 44 6% 221
- SIMP ('000 MT) 20 21 (2%) 100
- Lonsum ('000 MT) 27 24 13% 121
PRODUCTIVITY
FFB Yield – Nucleus (MT/Ha) 3.5 3.3 15.9
- SIMP (MT/Ha) 3.2 3.1 14.9
- Lonsum (MT/Ha) 3.9 3.5 17.4
CPO Yield – Nucleus (MT/Ha) 0.8 0.7 3.5
- SIMP (MT/Ha) 0.7 0.7 3.1
- Lonsum (MT/Ha) 0.9 0.8 4.0
CPO Extraction Rate (%) 22.1 22.3 22.0
- SIMP (%) 21.0 21.4 21.0
- Lonsum (%) 23.4 23.3 23.0
PK Extraction Rate (%) 5.4 5.4 5.3
- SIMP (%) 4.4 4.6 4.5
- Lonsum (%) 6.6 6.2 6.2
* The listed figures in the tables are rounded to the nearest thousands, but the growth % are calculated based
on the exact figures

Integrated Agribusiness with Leading Brands
16
Indofood Agri Resources Ltd.
8 Eu Tong Sen Street
#16-96/97 The Central
Singapore 059818
Tel: +65 6557 2389
Fax: +65 6557 2387
www.indofoodagri.com
This presentation was prepared solely and exclusively for the parties presently being invited for the purpose of
discussion. Neither this presentation nor any of its content may be reproduced, disclosed or used without the prior
written consent of Indofood Agri Resources Ltd.
This presentation may contain statements that convey future oriented expectations which represent the Company’s
present views on the probable future events and financial plans. Such views are presented on the basis of current
assumptions, are exposed to various risks, and are subject to considerable changes at any time. Presented
assumptions are presumed correct at the, and based on the data available on the, date at which this presentation is
assembled. The Company warrants no assurance that such outlook will, in part or as a whole, eventually be
materialized. Actual results may diverge significantly from those projected.
© Indofood Agri Resources Ltd. All rights reserved.
CONTACT US