Embed Size (px)
Citation preview
COMPANY OVERVIEW
JUNE 2016
DISCLAIMER
2
Some of the statements made in this presentation are forward-looking statements and arebased on the current beliefs, assumptions, expectations, estimates, objectives and projectionsof the directors and management of Zee Entertainment Enterprises Limited (ZEE) about itsbusiness and the industry and markets in which it operates.
These forward-looking statements include, without limitation, statements relating to revenuesand earnings.
The words “believe”, “anticipate”, “expect”, “estimate”, “intend”, “project” and similarexpressions are also intended to identify forward looking statements.
These statements are not guarantees of future performance and are subject to risks,uncertainties and other factors, some of which are beyond the control of the Company and aredifficult to predict. Consequently, actual results could differ materially from those expressed orforecast in the forward-looking statements as a result of, among other factors, changes ineconomic and market conditions, changes in the regulatory environment and other businessand operational risks. ZEE does not undertake to update these forward-looking statements toreflect events or circumstances that may arise after publication.
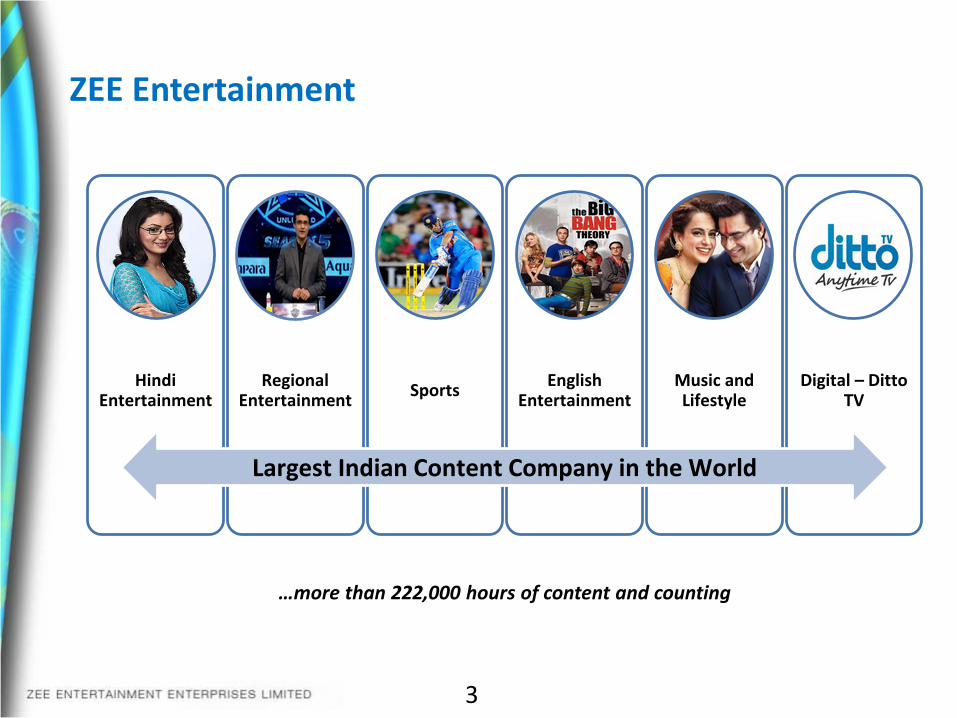
ZEE Entertainment
3
Hindi Entertainment
Regional Entertainment
SportsEnglish
EntertainmentMusic and Lifestyle
Digital – Ditto TV
Largest Indian Content Company in the World
…more than 222,000 hours of content and counting
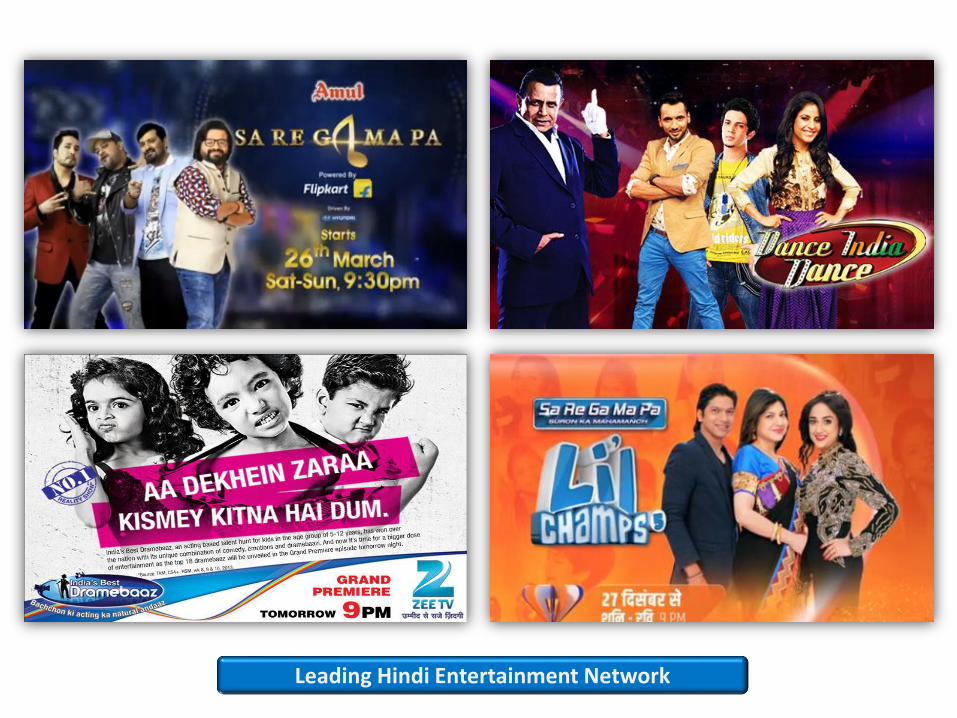
Leading Hindi Entertainment Network
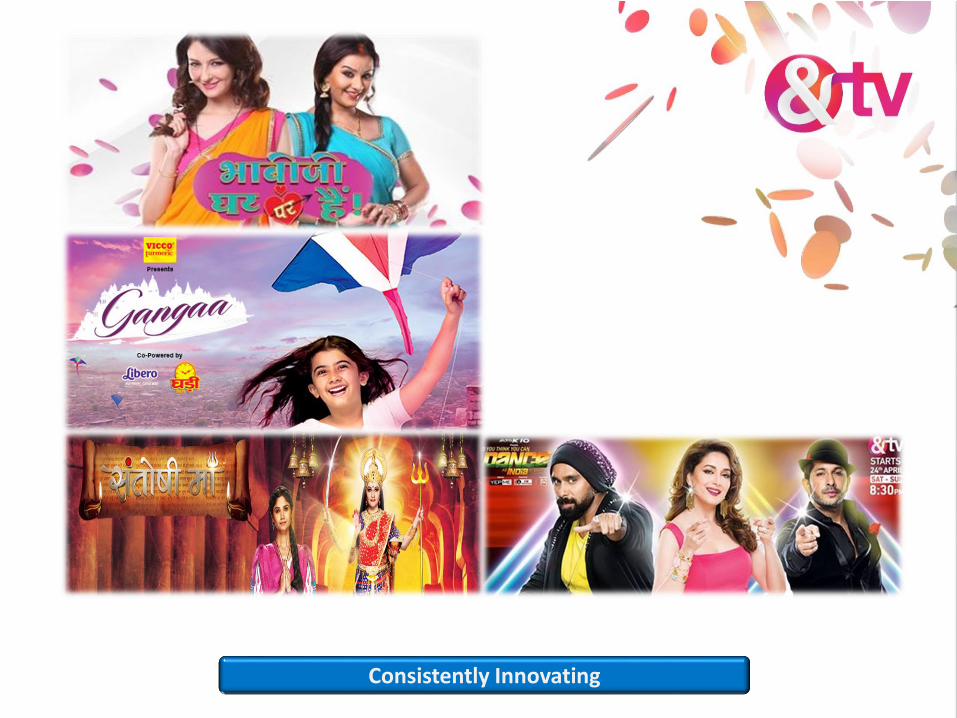
Consistently Innovating
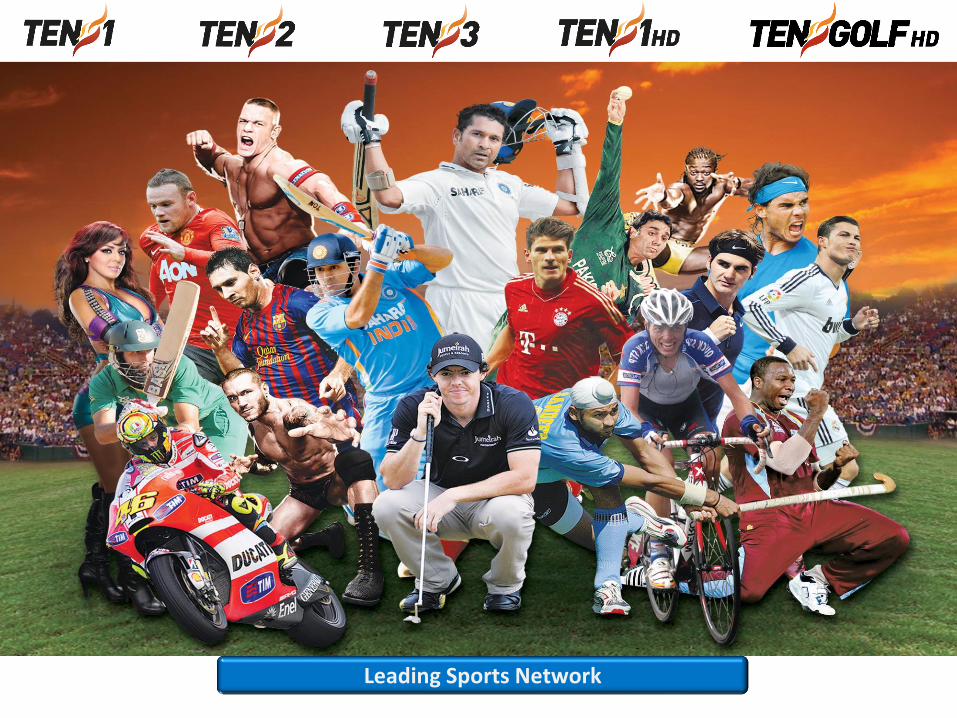
Leading Sports Network
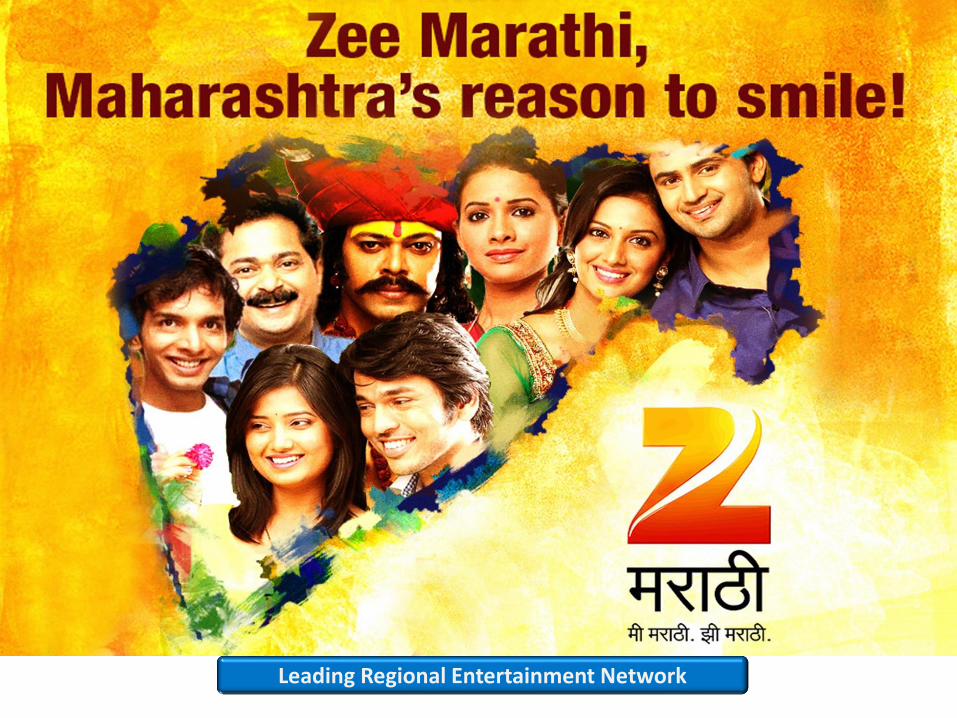
ZEE MARATHI
Leading Regional Entertainment Network
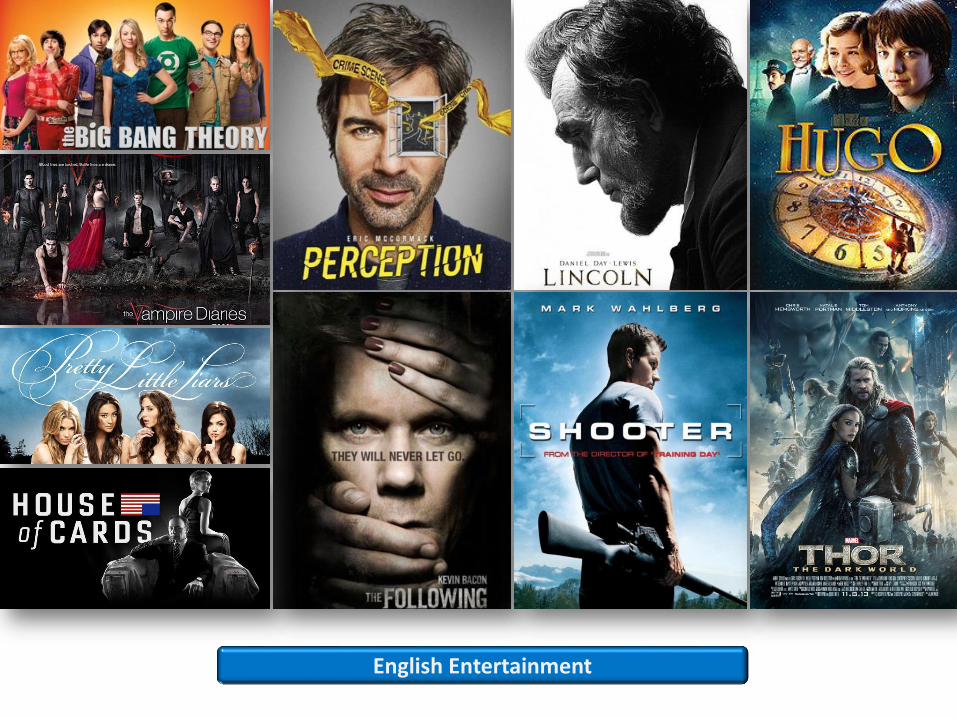
English Entertainment
9
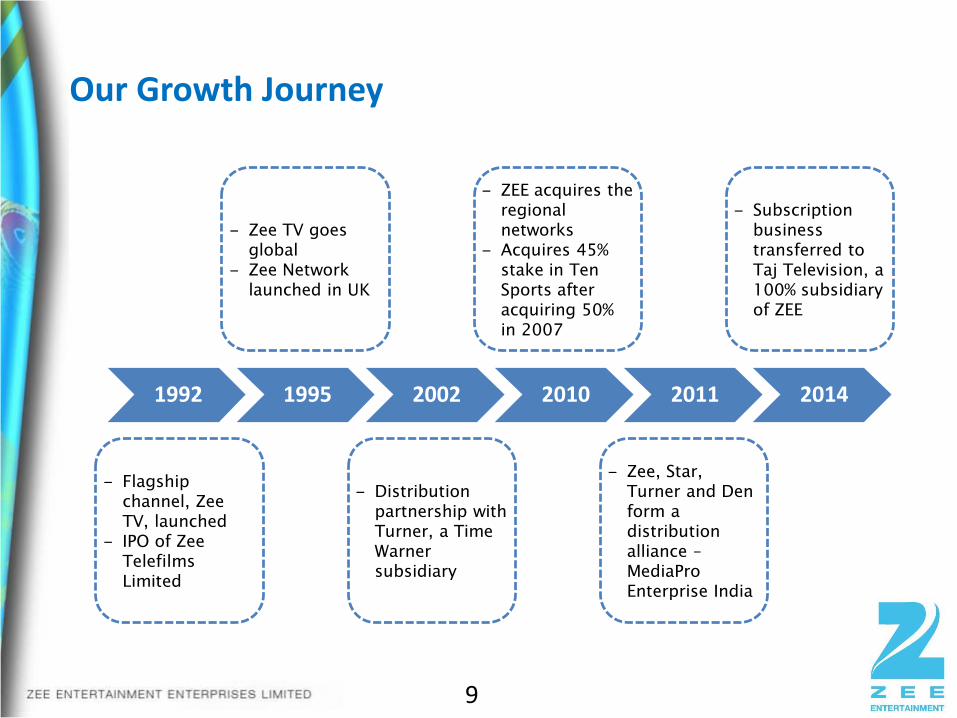
1992 1995 2002 2010 2011 2014
‒ Flagship
channel, Zee
TV, launched
‒ IPO of Zee
Telefilms
Limited
‒ Zee TV goes
global
‒ Zee Network
launched in UK
‒ Distribution
partnership with
Turner, a Time
Warner
subsidiary
‒ ZEE acquires the
regional
networks
‒ Acquires 45%
stake in Ten
Sports after
acquiring 50%
in 2007
‒ Zee, Star,
Turner and Den
form a
distribution
alliance –
MediaPro
Enterprise India
‒ Subscription
business
transferred to
Taj Television, a
100% subsidiary
of ZEE
Our Growth Journey
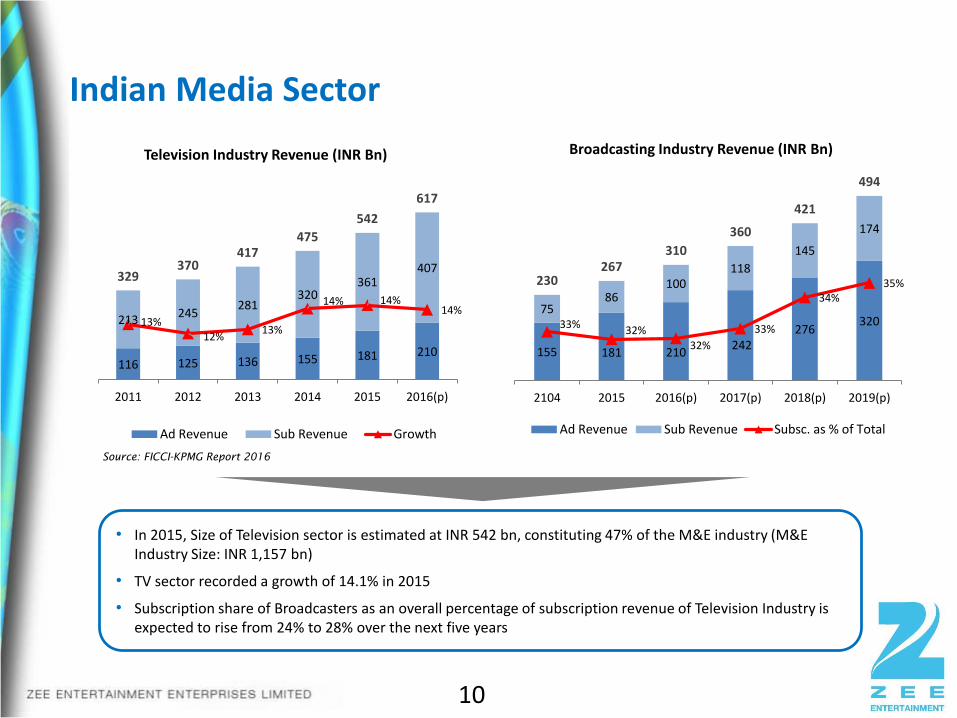
• In 2015, Size of Television sector is estimated at INR 542 bn, constituting 47% of the M&E industry (M&E Industry Size: INR 1,157 bn)
• TV sector recorded a growth of 14.1% in 2015
• Subscription share of Broadcasters as an overall percentage of subscription revenue of Television Industry is expected to rise from 24% to 28% over the next five years
Indian Media Sector
Source: FICCI-KPMG Report 2016
10
116 125 136 155 181 210
213245
281320
361407
329370
417475
542
617
13%12%
13%
14% 14%14%
9%
11%
13%
15%
17%
19%
-50
50
150
250
350
450
550
650
2011 2012 2013 2014 2015 2016(p)
Television Industry Revenue (INR Bn)
Ad Revenue Sub Revenue Growth
155 181 210242
276320
7586
100118
145
174
230267
310
360
421
494
33%32%
32%
33%
34%35%
30%
31%
32%
33%
34%
35%
36%
37%
38%
39%
40%
0
50
100
150
200
250
300
350
400
450
500
2104 2015 2016(p) 2017(p) 2018(p) 2019(p)
Broadcasting Industry Revenue (INR Bn)
Ad Revenue Sub Revenue Subsc. as % of Total
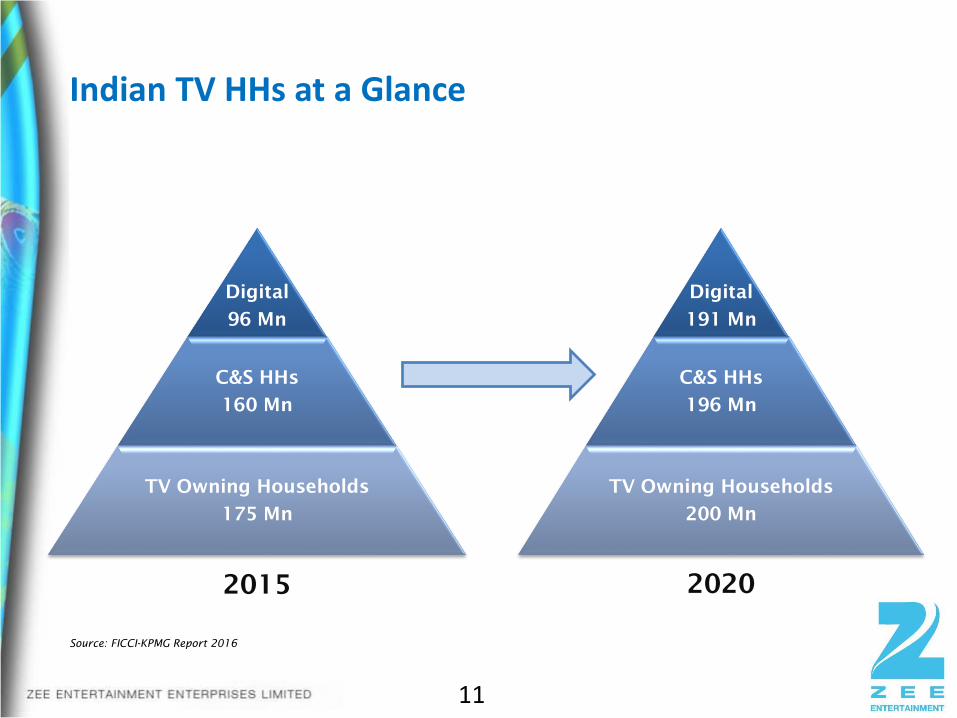
Indian TV HHs at a Glance
Digital
96 Mn
C&S HHs
160 Mn
TV Owning Households
175 Mn
2015
Source: FICCI-KPMG Report 2016
11
Digital
191 Mn
C&S HHs
196 Mn
TV Owning Households
200 Mn
2020
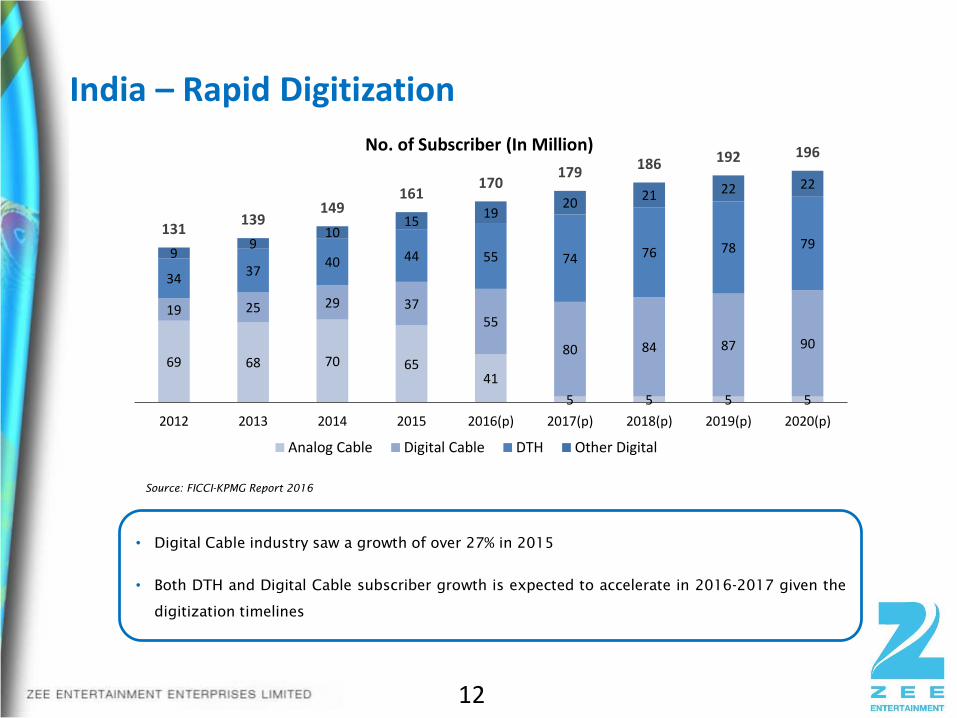
India – Rapid Digitization
Source: FICCI-KPMG Report 2016
12
• Digital Cable industry saw a growth of over 27% in 2015
• Both DTH and Digital Cable subscriber growth is expected to accelerate in 2016-2017 given the
digitization timelines
69 68 70 6541
5 5 5 5
19 25 29 3755
80 84 87 90
3437
40 44 55 74 76 78 799
910
1519
2021 22 22
131139
149161
170179
186 192 196
2012 2013 2014 2015 2016(p) 2017(p) 2018(p) 2019(p) 2020(p)
No. of Subscriber (In Million)
Analog Cable Digital Cable DTH Other Digital
13
ZEEL : A leading player in the Indian Television Market
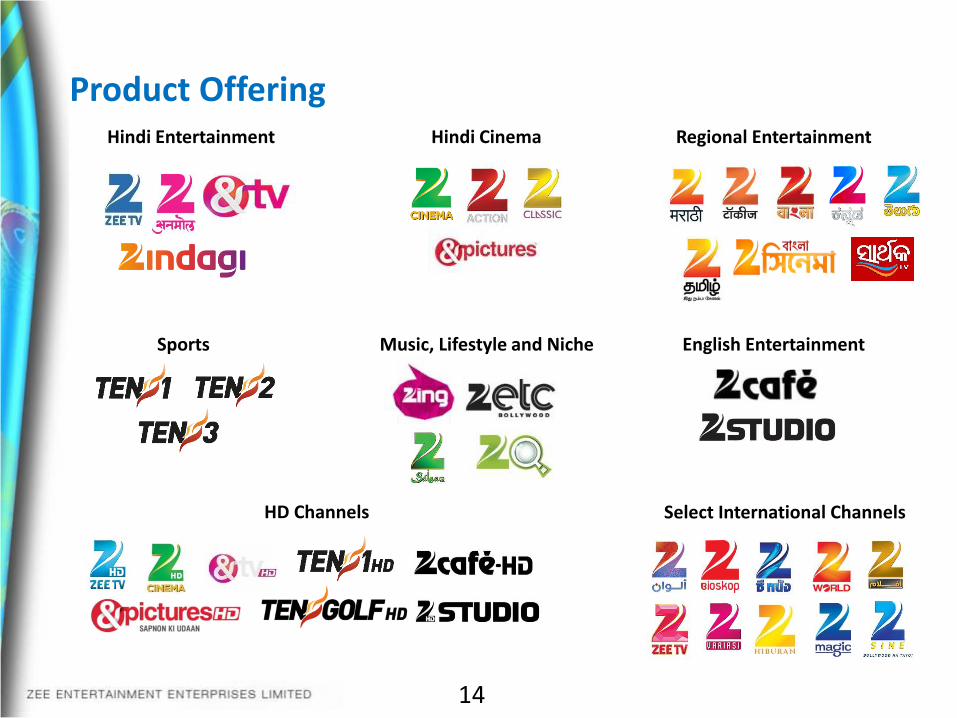
Product Offering
14
Hindi Entertainment Hindi Cinema Regional Entertainment
English EntertainmentMusic, Lifestyle and NicheSports
HD Channels Select International Channels
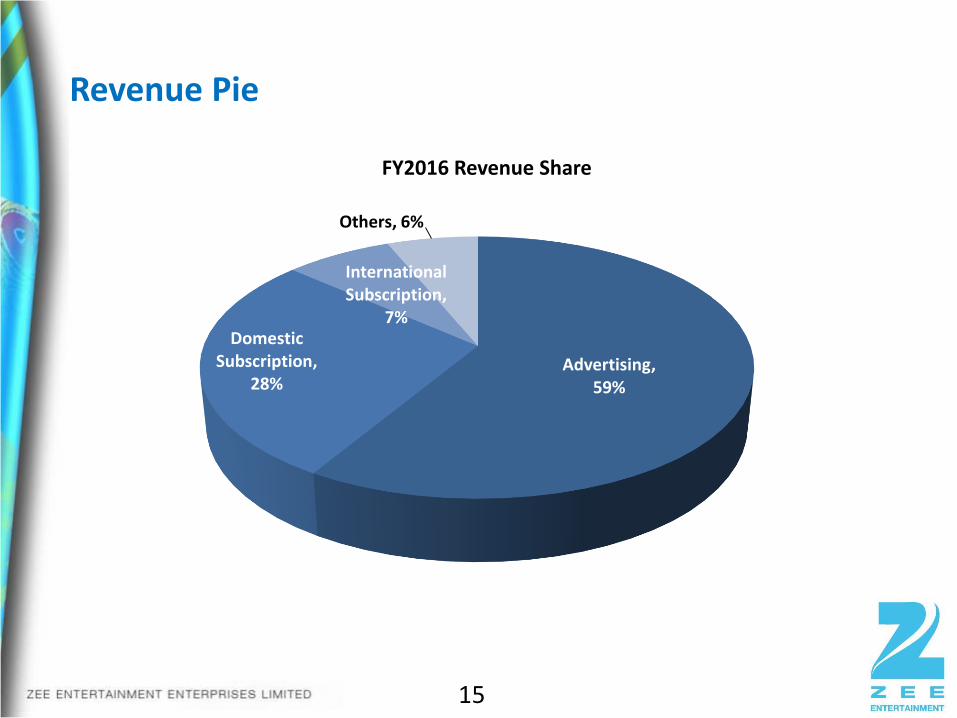
Revenue Pie
15
Advertising, 59%
Domestic Subscription,
28%
International Subscription,
7%
Others, 6%
FY2016 Revenue Share
BusinessPerformance
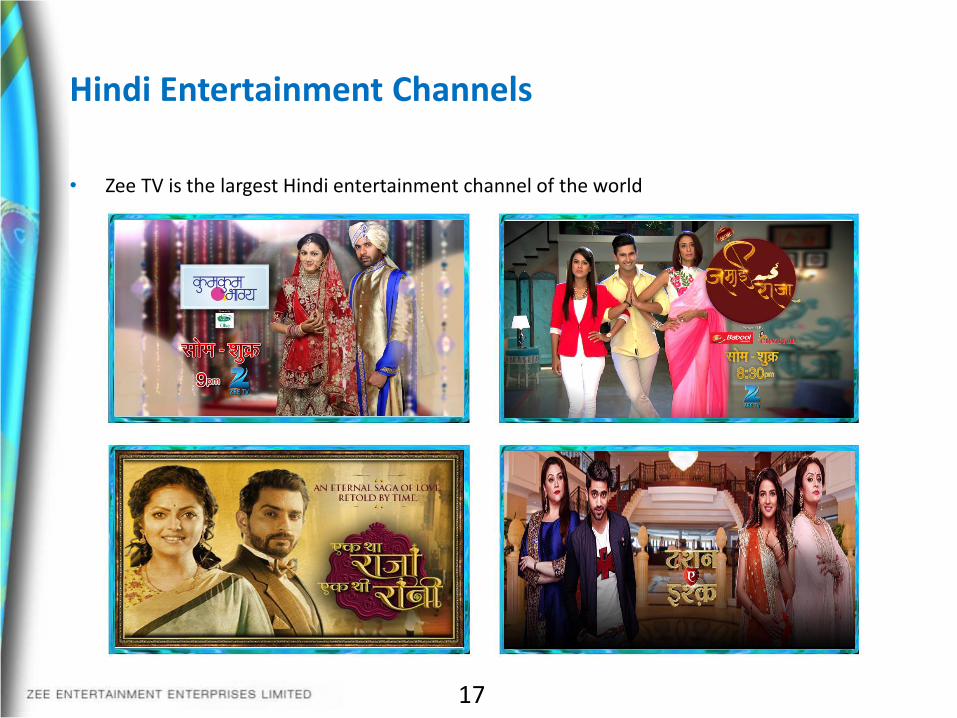
Hindi Entertainment Channels
• Zee TV is the largest Hindi entertainment channel of the world
17
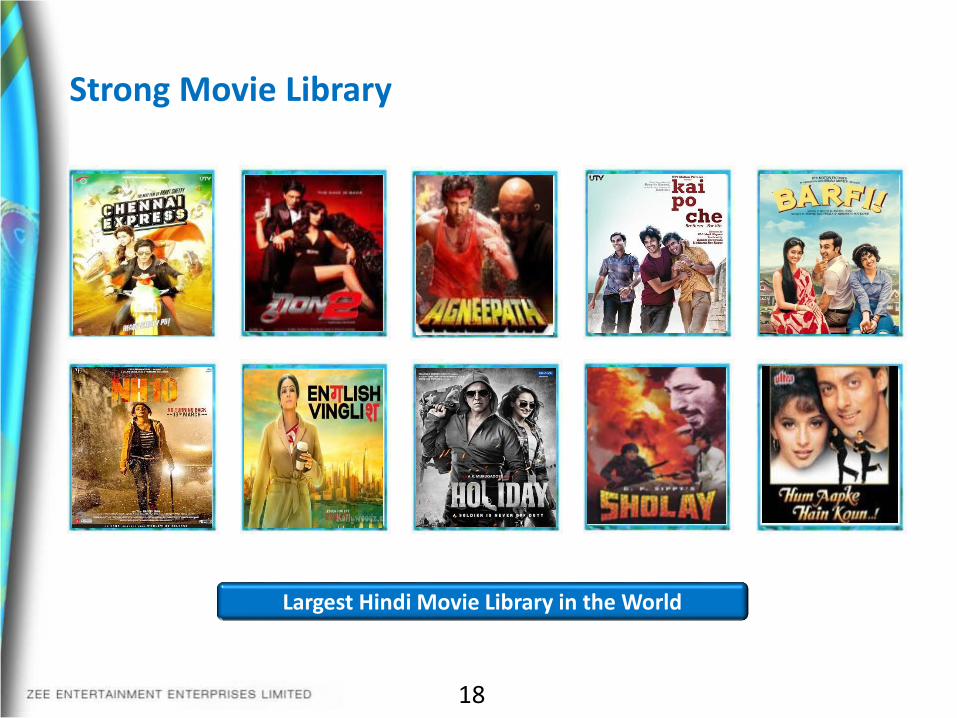
Strong Movie Library
18
Largest Hindi Movie Library in the World
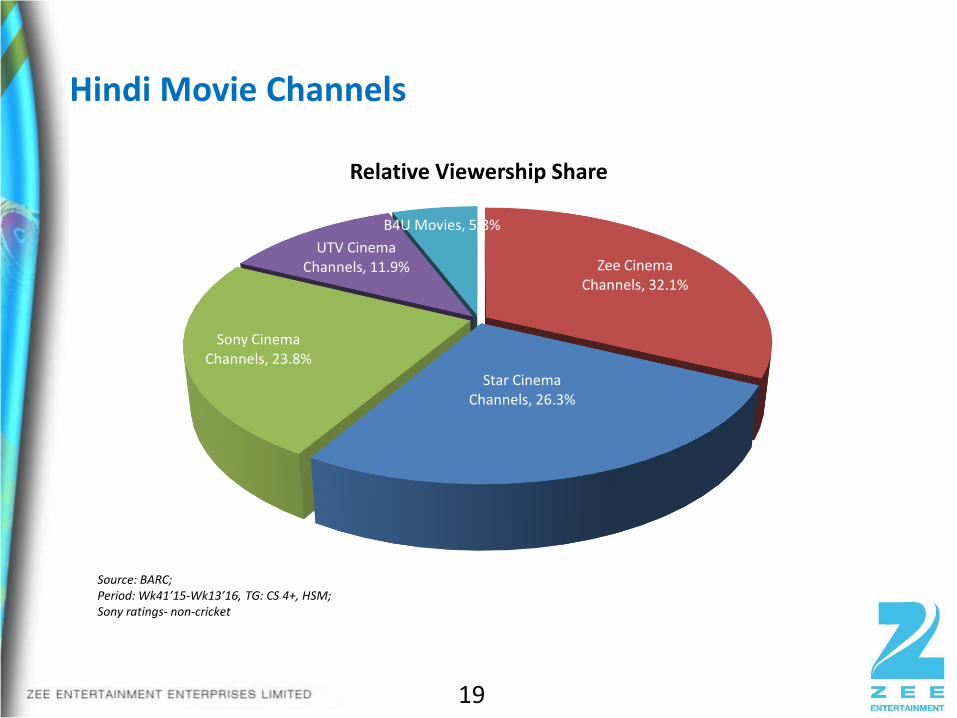
Hindi Movie Channels
19
Source: BARC; Period: Wk41’15-Wk13’16, TG: CS 4+, HSM; Sony ratings- non-cricket
Zee Cinema Channels, 32.1%
Star CinemaChannels, 26.3%
Sony Cinema Channels, 23.8%
UTV Cinema Channels, 11.9%
B4U Movies, 5.8%
Relative Viewership Share

20
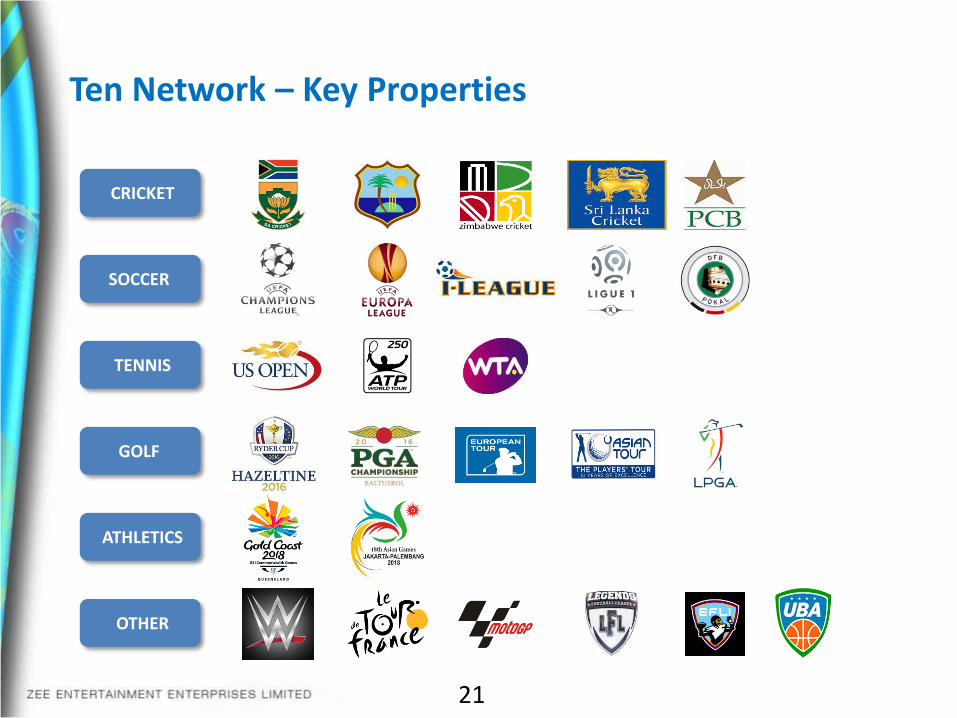
Ten Network – Key Properties
21
CRICKET
SOCCER
TENNIS
ATHLETICS
GOLF
OTHER
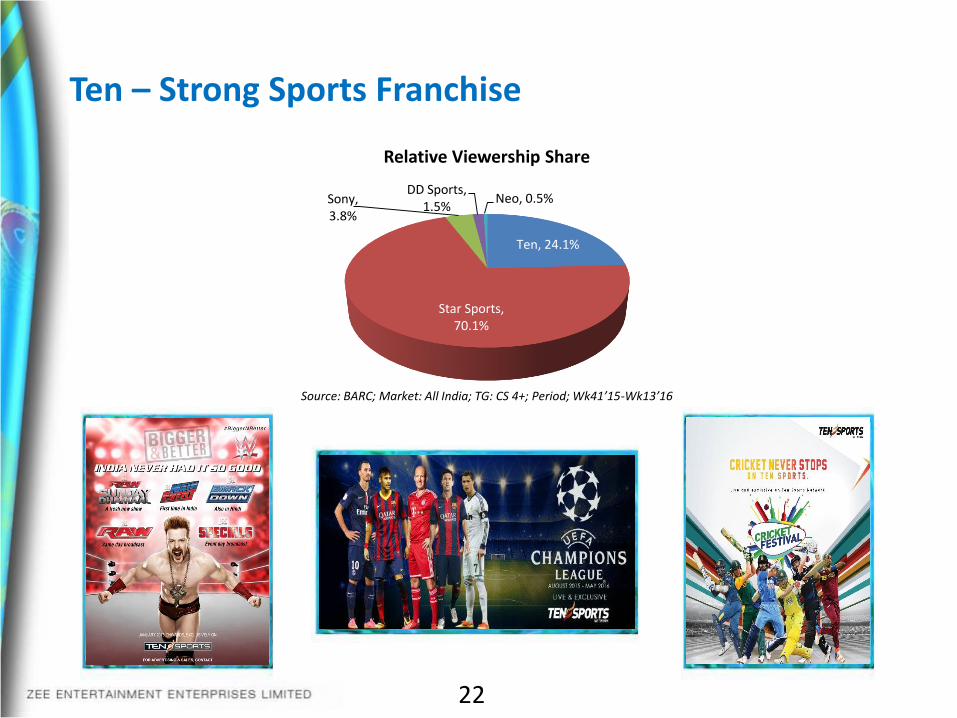
Ten – Strong Sports Franchise
22
Source: BARC; Market: All India; TG: CS 4+; Period; Wk41’15-Wk13’16
Ten, 24.1%
Star Sports, 70.1%
Sony, 3.8%
DD Sports, 1.5%
Neo, 0.5%
Relative Viewership Share
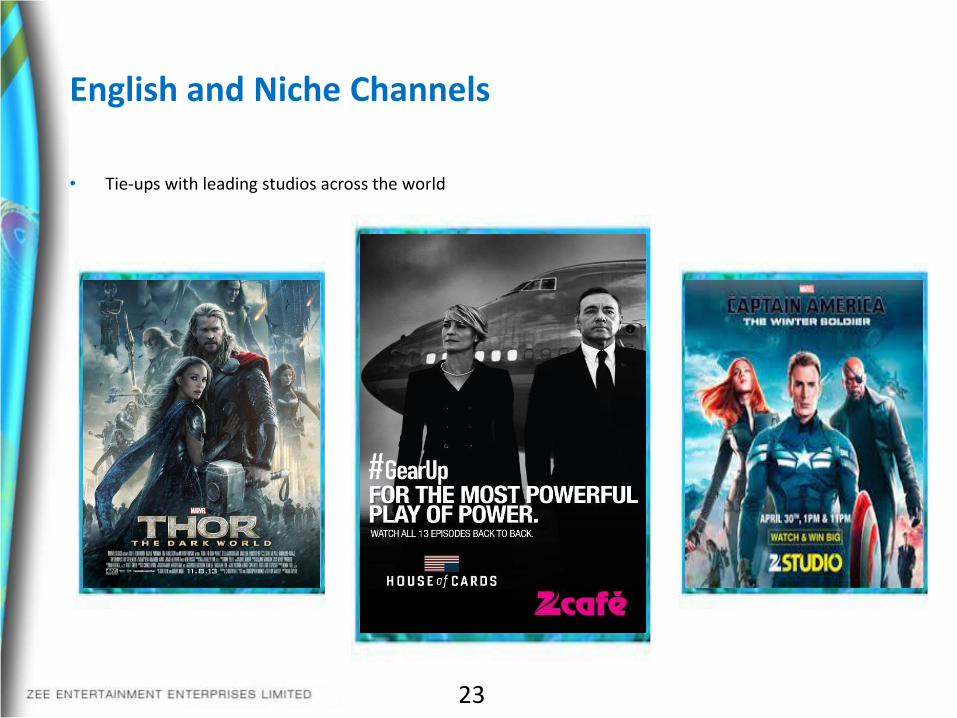
English and Niche Channels
• Tie-ups with leading studios across the world
23
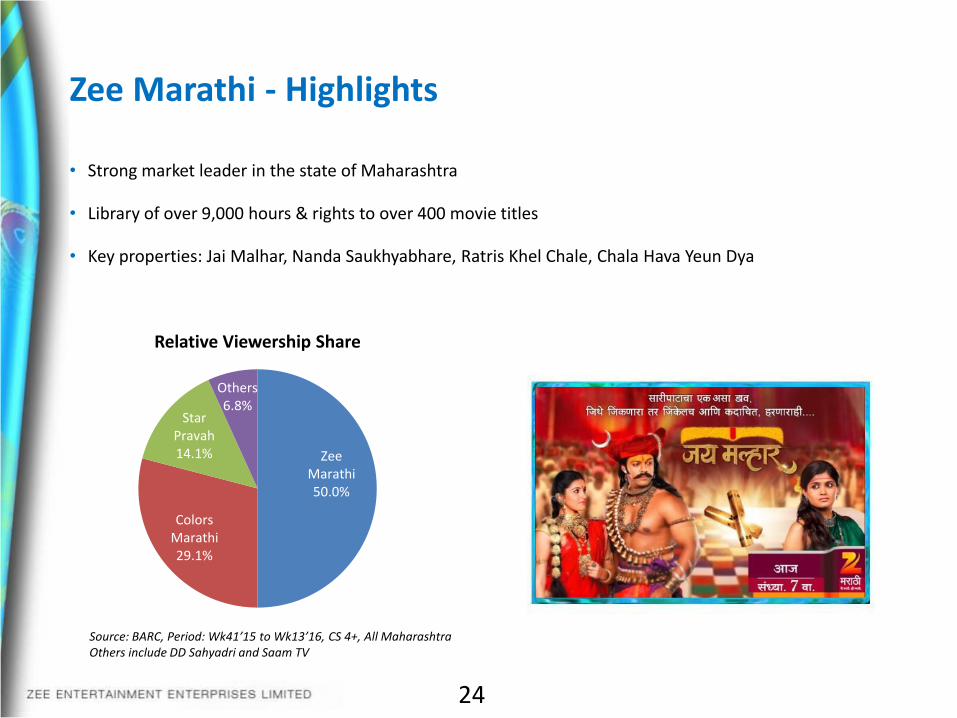
Zee Marathi - Highlights
• Strong market leader in the state of Maharashtra
• Library of over 9,000 hours & rights to over 400 movie titles
• Key properties: Jai Malhar, Nanda Saukhyabhare, Ratris Khel Chale, Chala Hava Yeun Dya
24
Source: BARC, Period: Wk41’15 to Wk13’16, CS 4+, All MaharashtraOthers include DD Sahyadri and Saam TV
Zee Marathi50.0%
Colors Marathi29.1%
Star Pravah14.1%
Others6.8%
Relative Viewership Share
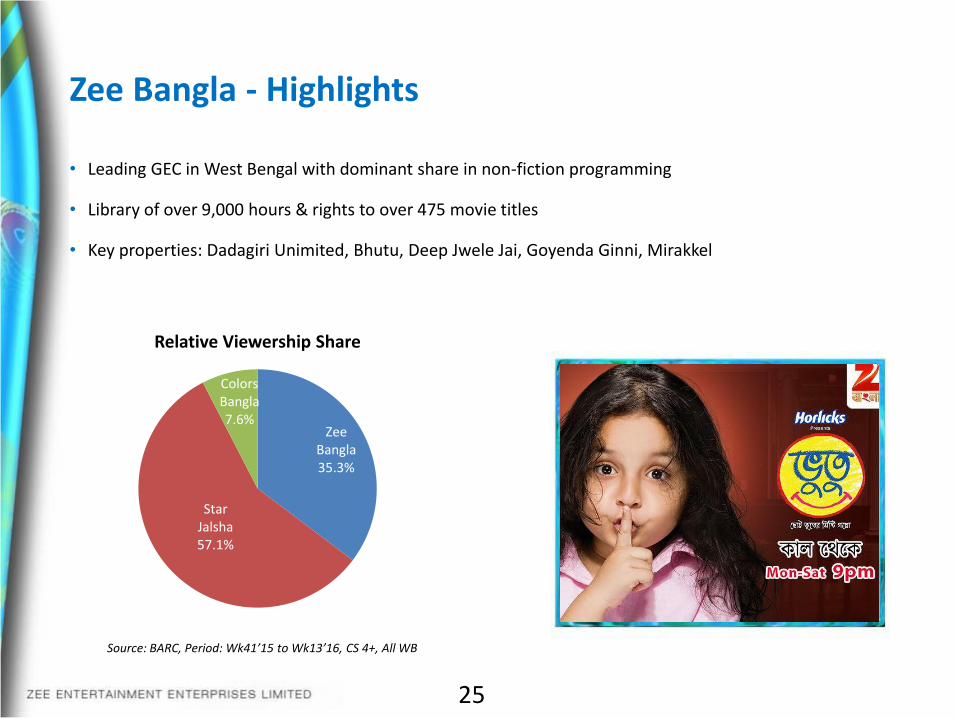
Zee Bangla - Highlights
• Leading GEC in West Bengal with dominant share in non-fiction programming
• Library of over 9,000 hours & rights to over 475 movie titles
• Key properties: Dadagiri Unimited, Bhutu, Deep Jwele Jai, Goyenda Ginni, Mirakkel
25
Source: BARC, Period: Wk41’15 to Wk13’16, CS 4+, All WB
Zee Bangla35.3%
Star Jalsha57.1%
Colors Bangla7.6%
Relative Viewership Share
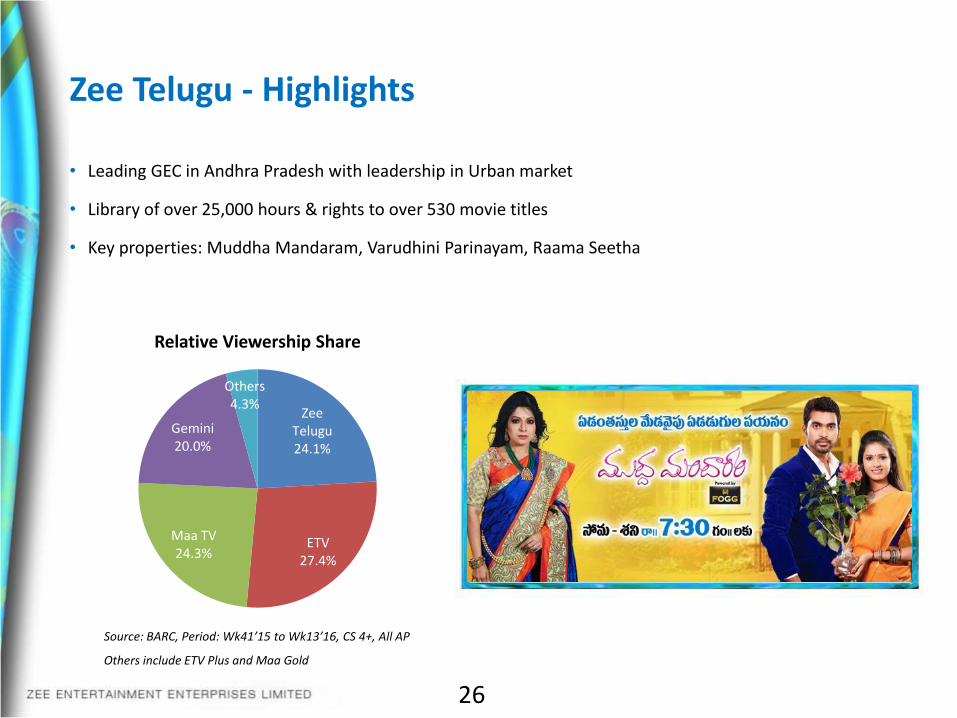
Zee Telugu - Highlights
• Leading GEC in Andhra Pradesh with leadership in Urban market
• Library of over 25,000 hours & rights to over 530 movie titles
• Key properties: Muddha Mandaram, Varudhini Parinayam, Raama Seetha
26
Source: BARC, Period: Wk41’15 to Wk13’16, CS 4+, All AP
Others include ETV Plus and Maa Gold
Zee Telugu24.1%
ETV27.4%
Maa TV24.3%
Gemini20.0%
Others4.3%
Relative Viewership Share
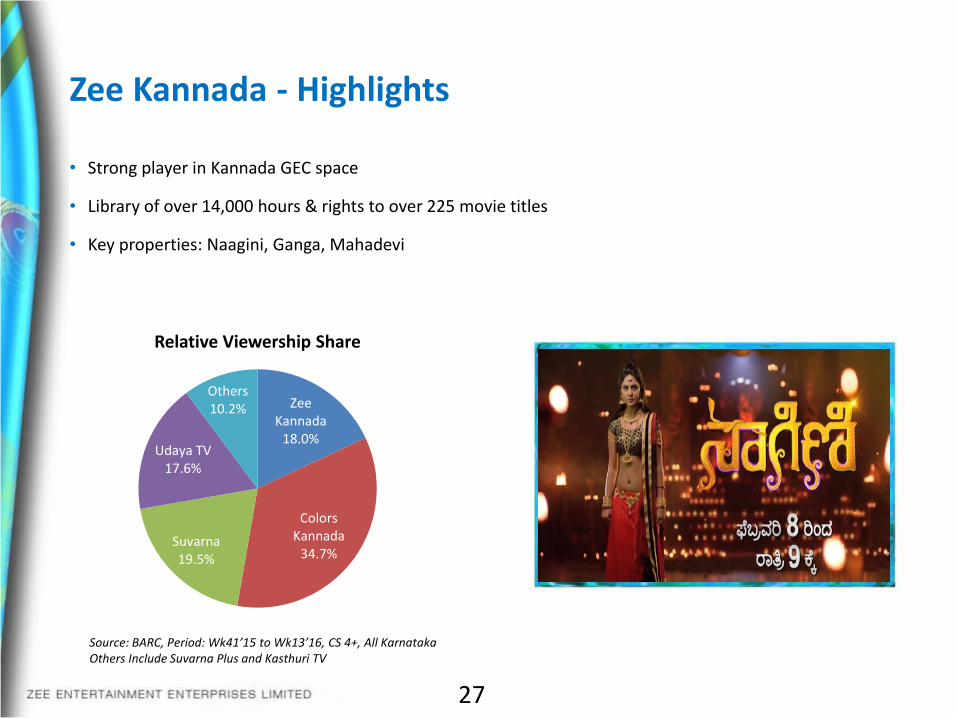
Zee Kannada - Highlights
• Strong player in Kannada GEC space
• Library of over 14,000 hours & rights to over 225 movie titles
• Key properties: Naagini, Ganga, Mahadevi
27
Source: BARC, Period: Wk41’15 to Wk13’16, CS 4+, All KarnatakaOthers Include Suvarna Plus and Kasthuri TV
Zee Kannada
18.0%
Colors Kannada
34.7%Suvarna19.5%
Udaya TV17.6%
Others10.2%
Relative Viewership Share
Other Channels
28
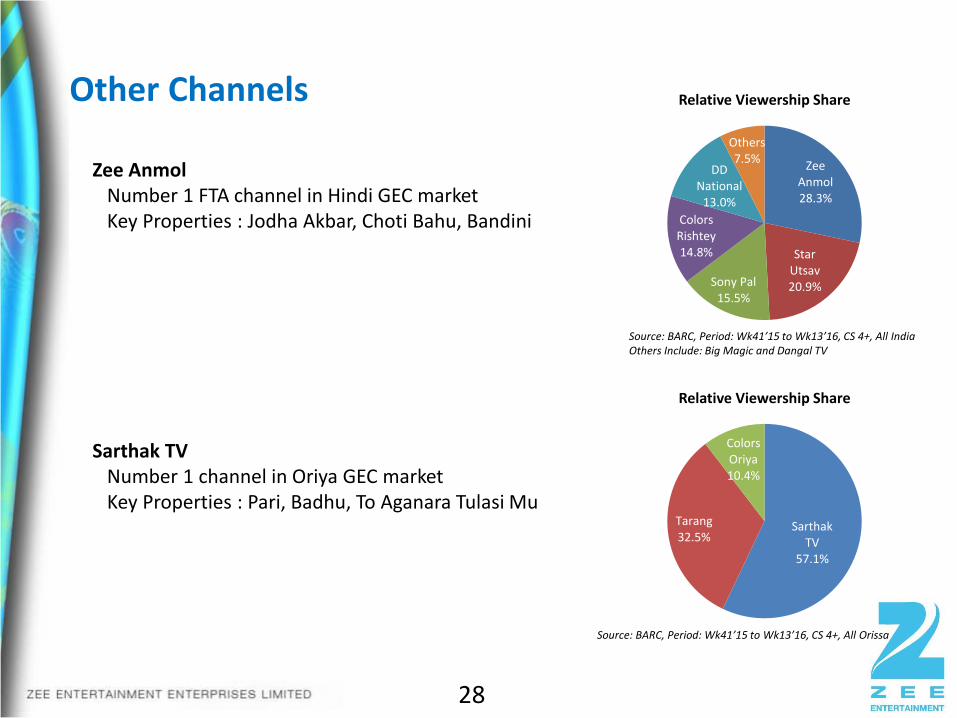
Zee Anmol Number 1 FTA channel in Hindi GEC marketKey Properties : Jodha Akbar, Choti Bahu, Bandini
Sarthak TV Number 1 channel in Oriya GEC marketKey Properties : Pari, Badhu, To Aganara Tulasi Mu
Zee Anmol28.3%
Star Utsav20.9%Sony Pal
15.5%
Colors Rishtey14.8%
DD National
13.0%
Others7.5%
Relative Viewership Share
Sarthak TV
57.1%
Tarang32.5%
Colors Oriya10.4%
Relative Viewership Share
Source: BARC, Period: Wk41’15 to Wk13’16, CS 4+, All IndiaOthers Include: Big Magic and Dangal TV
Source: BARC, Period: Wk41’15 to Wk13’16, CS 4+, All Orissa
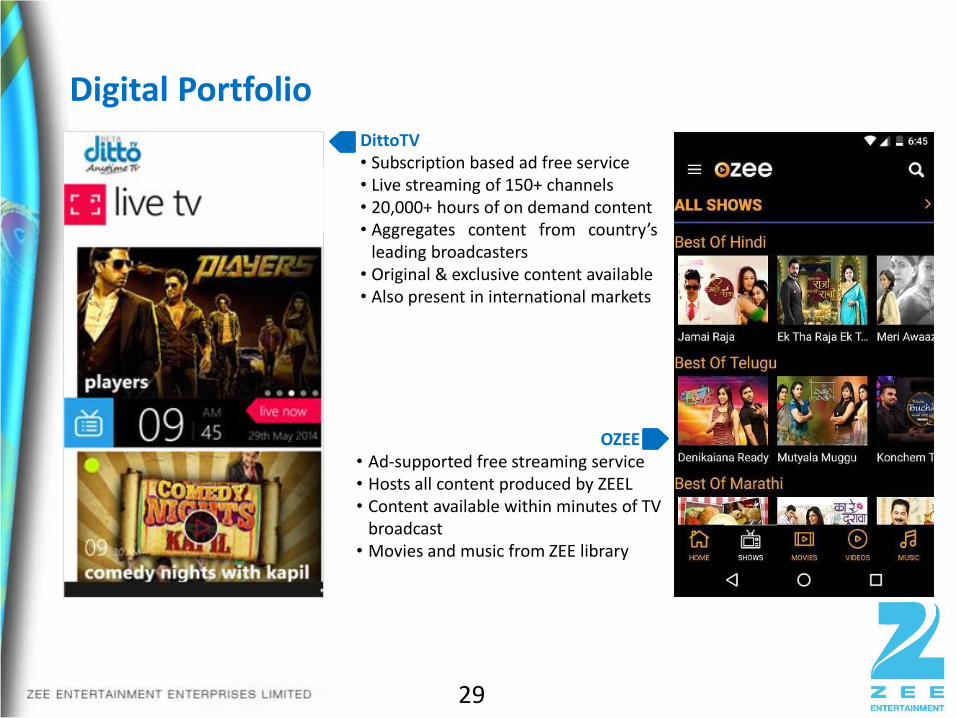
Digital Portfolio
29
DittoTV• Subscription based ad free service• Live streaming of 150+ channels• 20,000+ hours of on demand content• Aggregates content from country’s
leading broadcasters• Original & exclusive content available• Also present in international markets
OZEE• Ad-supported free streaming service• Hosts all content produced by ZEEL• Content available within minutes of TV
broadcast• Movies and music from ZEE library
• Presence across 5 continents through over
38 dedicated channels
• Catering to both South Asian as well as non
South Asian communities
• Increased reach through new distribution
deals in Caribbean, African & APAC markets
• International operations contributed 17% of
company top line in Q4FY2016
• Renewed focus on advertising as a source of
revenues
International Operations
30
Focused Investments
Digital InvestmentsRegional Channels
31
International ChannelsNational Channels
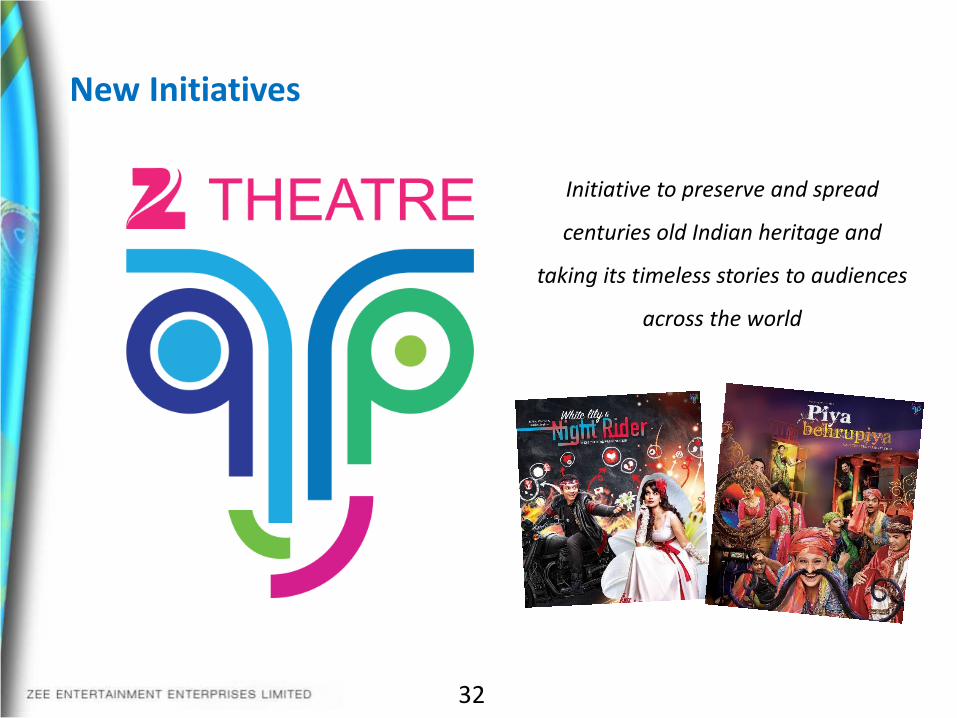
New Initiatives
32
Initiative to preserve and spread
centuries old Indian heritage and
taking its timeless stories to audiences
across the world

Key Financials
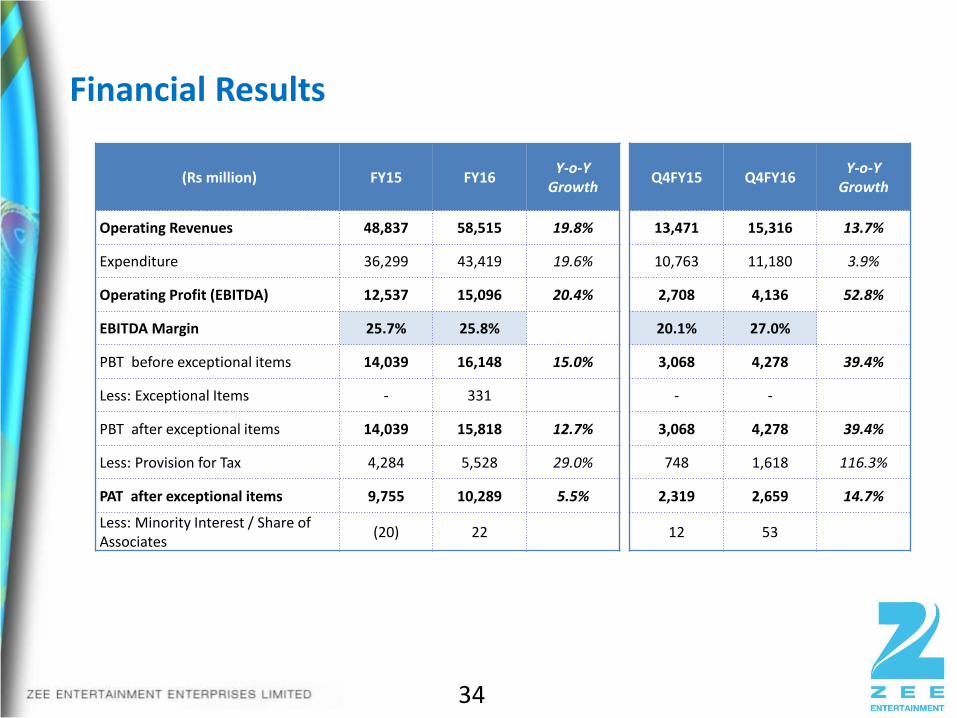
Financial Results
34
(Rs million) FY15 FY16Y-o-Y
Growth Q4FY15 Q4FY16
Y-o-Y Growth
Operating Revenues 48,837 58,515 19.8% 13,471 15,316 13.7%
Expenditure 36,299 43,419 19.6% 10,763 11,180 3.9%
Operating Profit (EBITDA) 12,537 15,096 20.4% 2,708 4,136 52.8%
EBITDA Margin 25.7% 25.8% 20.1% 27.0%
PBT before exceptional items 14,039 16,148 15.0% 3,068 4,278 39.4%
Less: Exceptional Items - 331 - -
PBT after exceptional items 14,039 15,818 12.7% 3,068 4,278 39.4%
Less: Provision for Tax 4,284 5,528 29.0% 748 1,618 116.3%
PAT after exceptional items 9,755 10,289 5.5% 2,319 2,659 14.7%
Less: Minority Interest / Share of Associates
(20) 22 12 53
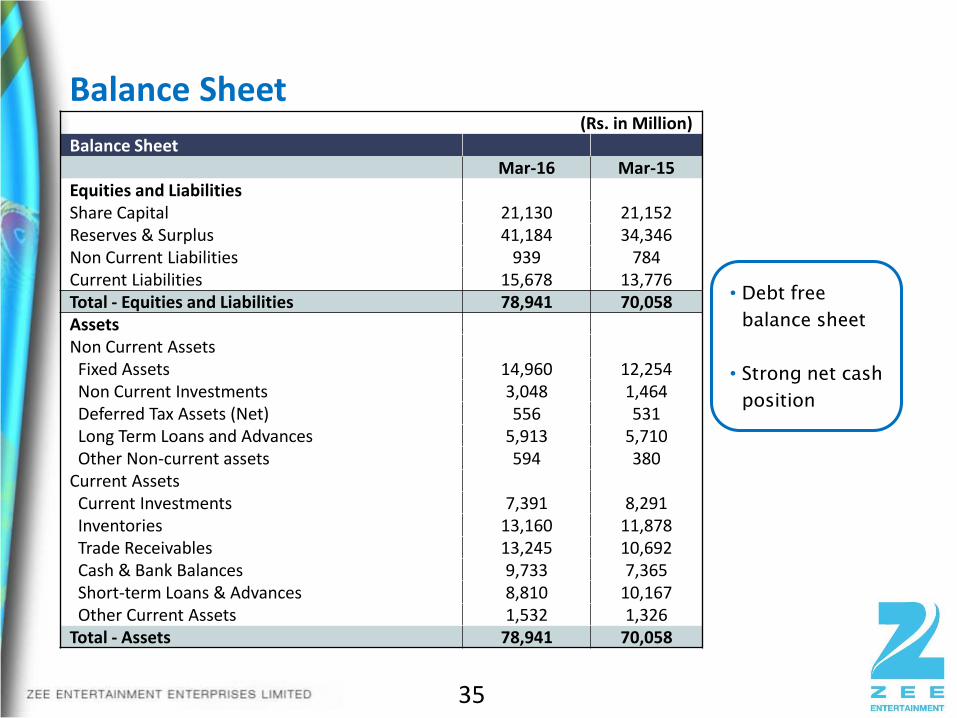
Balance Sheet
35
• Debt free
balance sheet
• Strong net cash
position
(Rs. in Million)Balance Sheet
Mar-16 Mar-15Equities and LiabilitiesShare Capital 21,130 21,152 Reserves & Surplus 41,184 34,346 Non Current Liabilities 939 784 Current Liabilities 15,678 13,776 Total - Equities and Liabilities 78,941 70,058 AssetsNon Current AssetsFixed Assets 14,960 12,254 Non Current Investments 3,048 1,464 Deferred Tax Assets (Net) 556 531 Long Term Loans and Advances 5,913 5,710 Other Non-current assets 594 380
Current AssetsCurrent Investments 7,391 8,291 Inventories 13,160 11,878 Trade Receivables 13,245 10,692 Cash & Bank Balances 9,733 7,365 Short-term Loans & Advances 8,810 10,167 Other Current Assets 1,532 1,326
Total - Assets 78,941 70,058
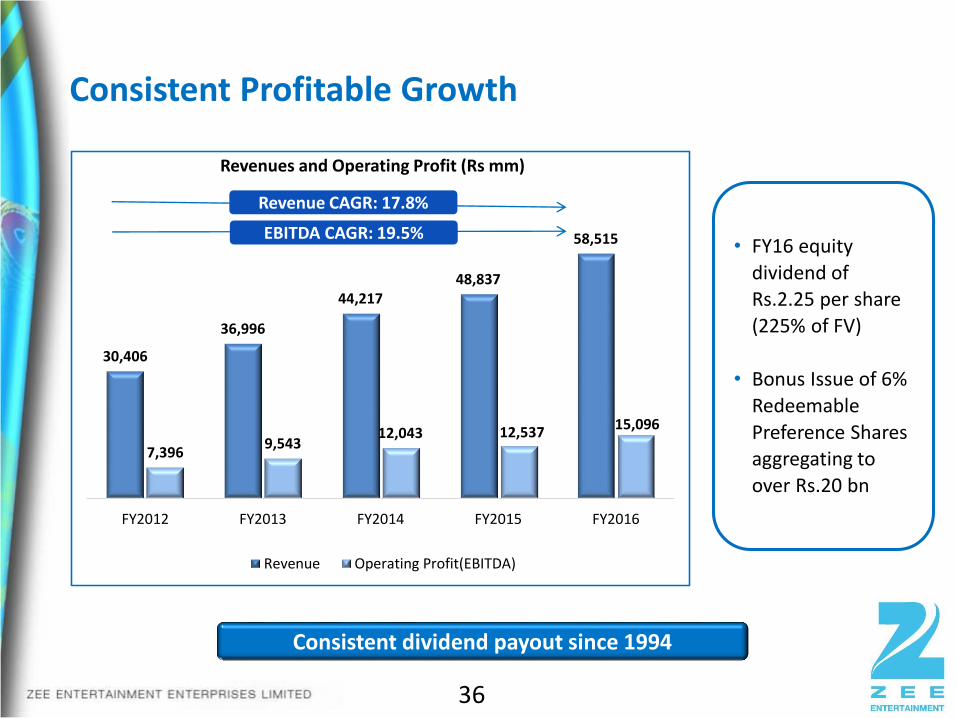
30,406
36,996
44,21748,837
58,515
7,3969,543
12,043 12,53715,096
FY2012 FY2013 FY2014 FY2015 FY2016
Revenues and Operating Profit (Rs mm)
Revenue Operating Profit(EBITDA)
Consistent Profitable Growth
36
Consistent dividend payout since 1994
Revenue CAGR: 17.8%
EBITDA CAGR: 19.5%• FY16 equity
dividend of Rs.2.25 per share
(225% of FV)
• Bonus Issue of 6%
Redeemable
Preference Shares aggregating to
over Rs.20 bn
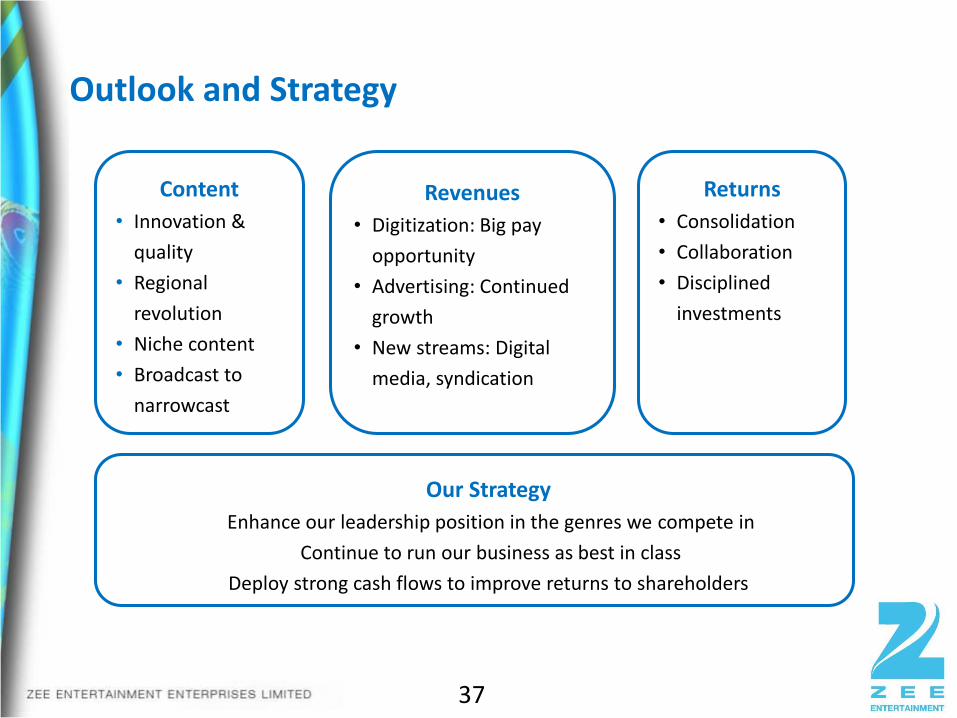
Outlook and Strategy
37
Revenues
• Digitization: Big pay
opportunity
• Advertising: Continued
growth
• New streams: Digital
media, syndication
Content
• Innovation &
quality
• Regional
revolution
• Niche content
• Broadcast to
narrowcast
Our Strategy
Enhance our leadership position in the genres we compete in
Continue to run our business as best in class
Deploy strong cash flows to improve returns to shareholders
Returns
• Consolidation
• Collaboration
• Disciplined
investments
38
Pioneer in several entertainment genres
World’s leading Indian TV network with 1 billion+ viewers in over 171 countries
Consistent performer since inception; Shareholder value CAGR of >30% since listing
The global force in entertainment