Embed Size (px)
Citation preview
Healthy Chicago 2.0
Visioning Community Themes & Strengths
Assessment
December 12, 2014

2
• Overview of Process
• Adopt Vision
• Community Themes & Strengths Assessment Findings • Online Survey • Focus Groups and Oral Histories • Community & Stakeholder Conversations
• Discussion of Findings
Presentation Outline
3
Phase 1: Partnership Development
Phase 2: Visioning
Phase 3: The Four Assessments
Phase 6: Action Cycle
Local Public Health System
Community Health Status Forces of Change Community Themes &
Strengths
Phase 4: Identify Strategic Issues
Phase 5: Formulate Goals and Strategies
4
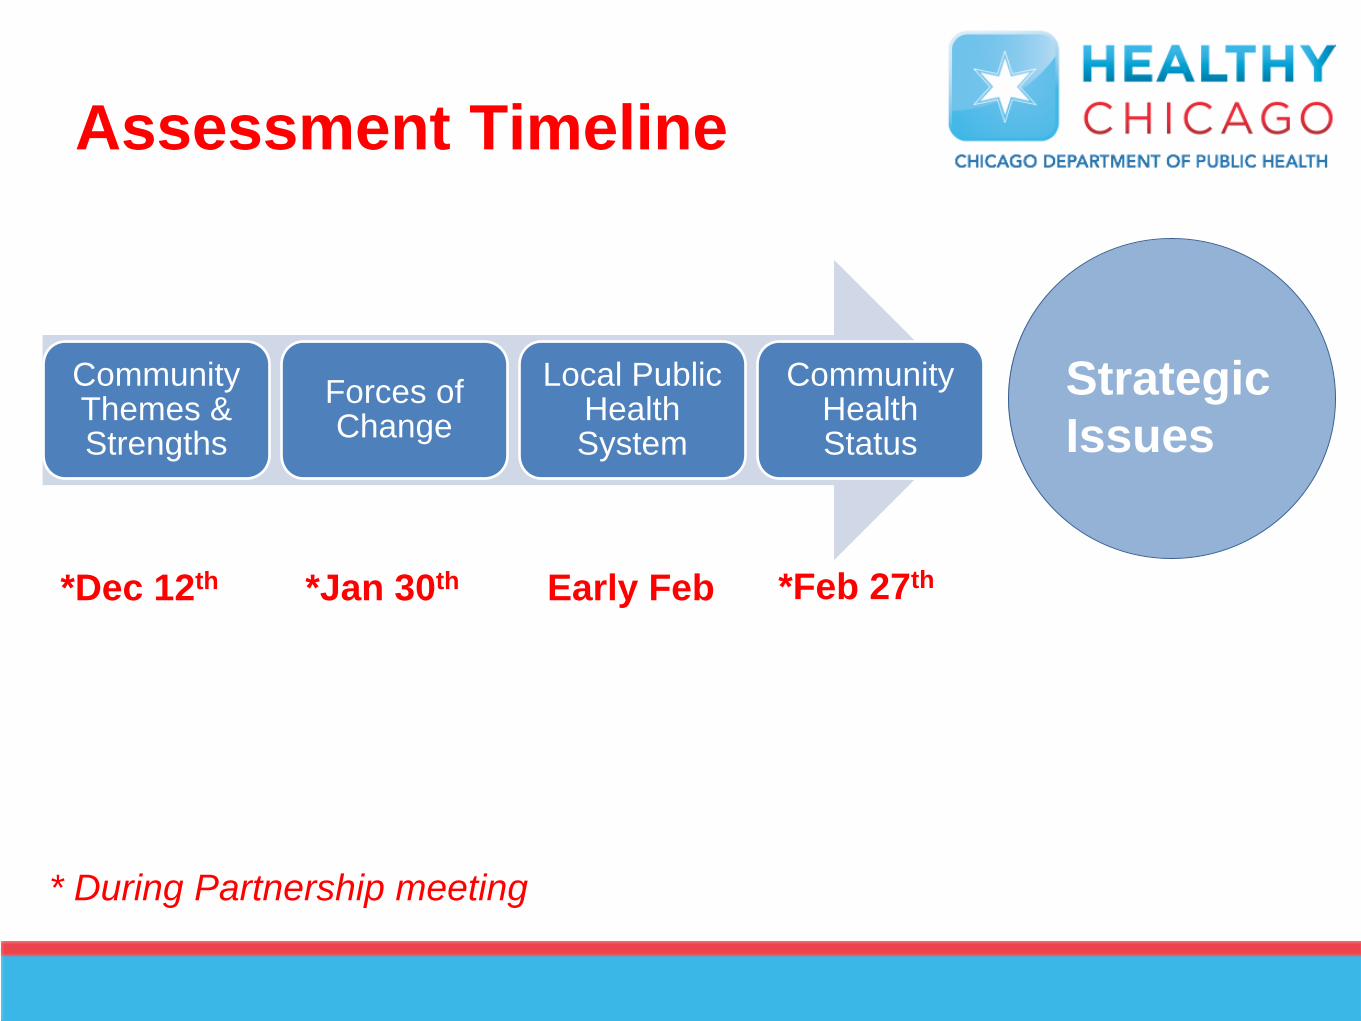
Assessment Timeline
Community Themes & Strengths
Forces of Change
Local Public Health System
Community Health Status
*Dec 12th *Jan 30th *Feb 27th Early Feb
* During Partnership meeting
Strategic Issues
Community Themes & Strengths Assessment
Goal: • To obtain feedback from community and other stakeholders
on: • Strengths/attributes of neighborhood/Chicago • Barriers to health and well-being • Strategies to improve health
• Engage community in Needs Assessment
5
Forces of Change Assessment
• Goal: Identify forces (trends, factors, or events) that are/or will influence the health and quality of life of the community and the local public health system.
• Obtained feedback from Community & Stakeholder Conversations
• Partnership will review and discuss feedback at January 30, 2015 meeting
6
7
• Data analysis of “health” of individuals and community
• Analyze variables by hardship index (income, education, age, employment status, crowded housing)
Health, housing, employment, education, environmental health, climate change, poverty, food access, open space, transportation, built environment, etc.
Community Health Status Assessment
8
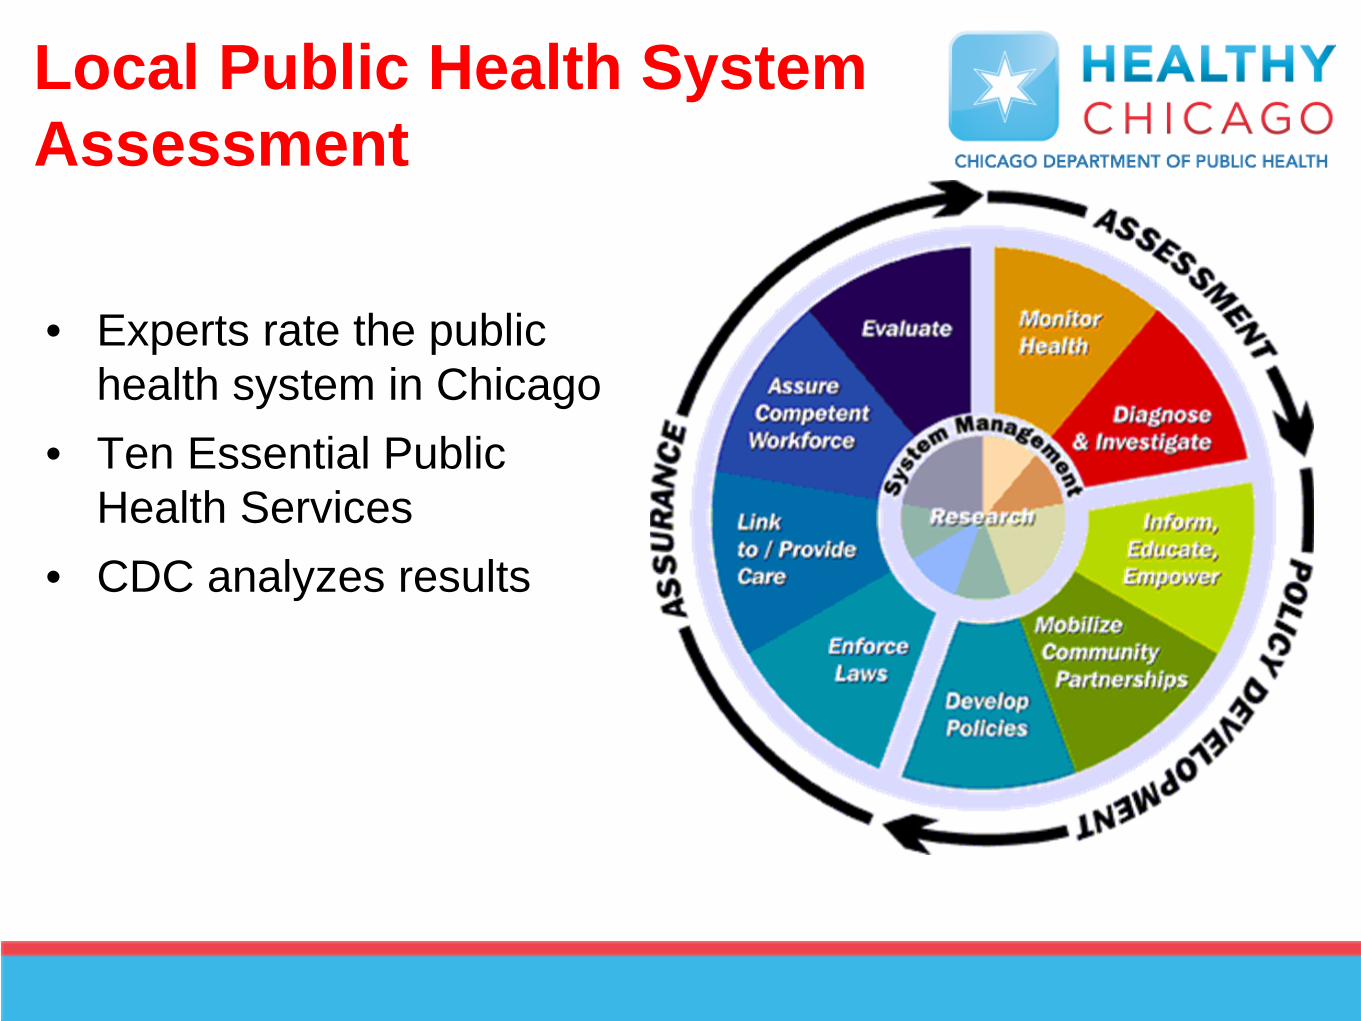
• Experts rate the public health system in Chicago
• Ten Essential Public Health Services
• CDC analyzes results
Local Public Health System Assessment
9
“A city with strong communities and collaborative stakeholders, where all residents enjoy equitable access to resources, opportunities and environments that maximize their health and well-being”
Adopt Healthy Chicago 2.0 Vision
10
• Overview of Process
• Adopt Vision
• Community Themes & Strengths Assessment Findings • Online Survey • Focus Groups and Oral Histories • Community & Stakeholder Conversations
• Discussion of Findings
Presentation Outline
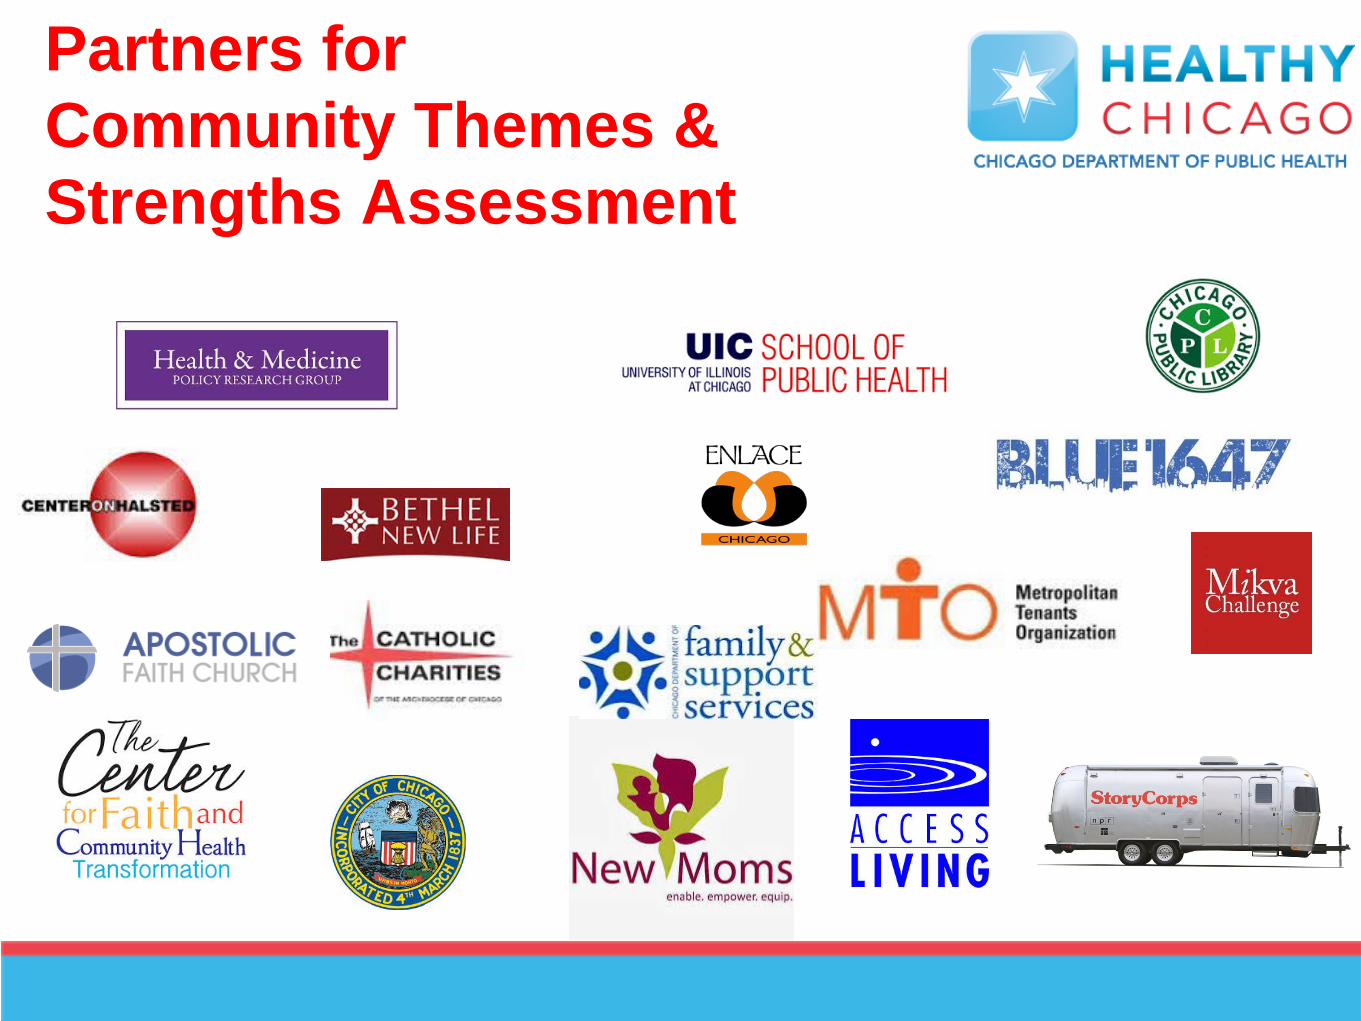
Partners for Community Themes & Strengths Assessment
11
12
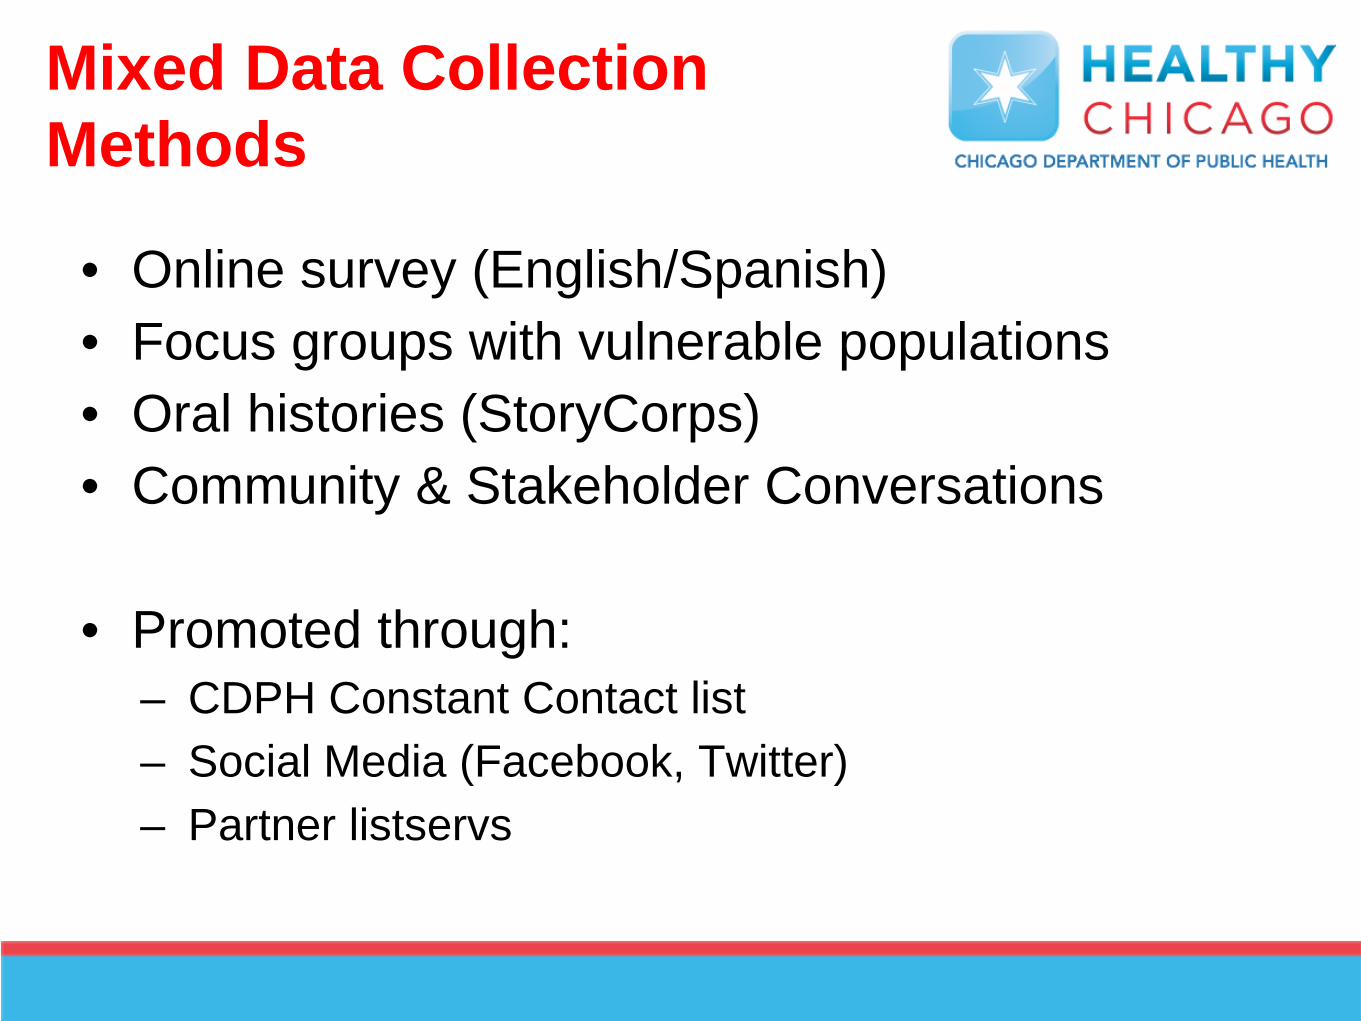
• Online survey (English/Spanish) • Focus groups with vulnerable populations • Oral histories (StoryCorps) • Community & Stakeholder Conversations
• Promoted through:
– CDPH Constant Contact list – Social Media (Facebook, Twitter) – Partner listservs
Mixed Data Collection Methods
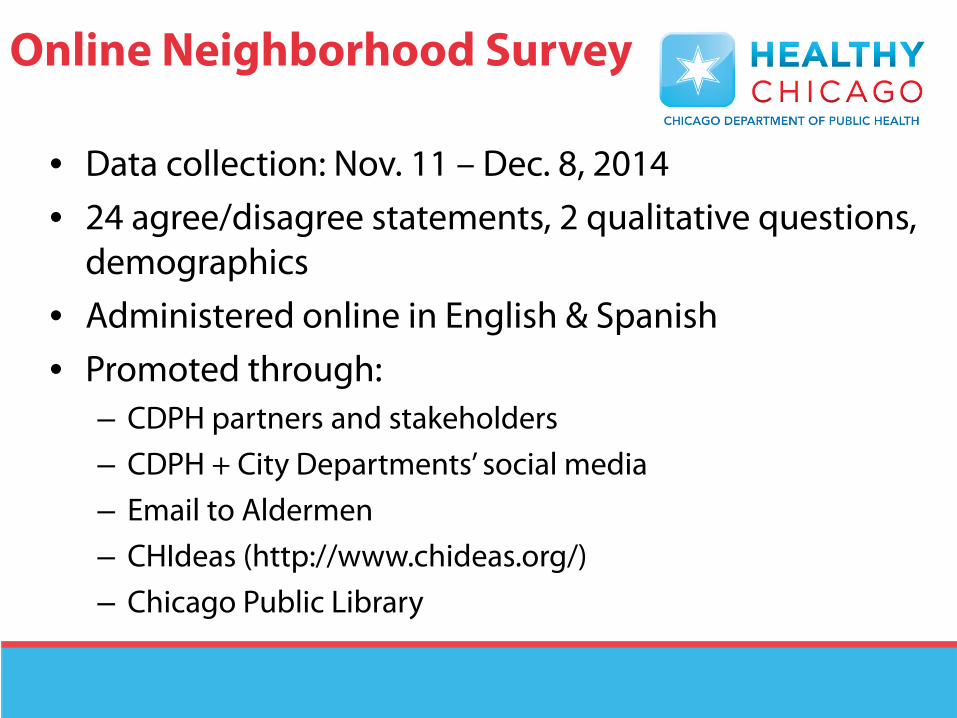
Online Neighborhood Survey
• Data collection: Nov. 11 – Dec. 8, 2014 • 24 agree/disagree statements, 2 qualitative questions,
demographics • Administered online in English & Spanish • Promoted through:
– CDPH partners and stakeholders – CDPH + City Departments’ social media – Email to Aldermen – CHIdeas (http://www.chideas.org/) – Chicago Public Library
0
10
20
30
10-19 20-29 30-39 40-49 50-59 60-69 70-79 80+
0
20
40
<20K 20-39K 40-59K 60-79K 80-99K 100K+
0
25
50
Excellent Very Good Good Fair Poor
0
20
40
60
< 9thGrade
9-12Grade
HSGrad
SomeCollege
Assoc.Deg.
Bach.Deg.
GradDeg.
0
50
100
Female Male Transgender
0
20
40
60
Hispanic Non Hispanic,Black
Non Hispanic,White
Non Hispanic,Other
Gender Age
Household Income
Health Status
Education
Race- Ethnicity
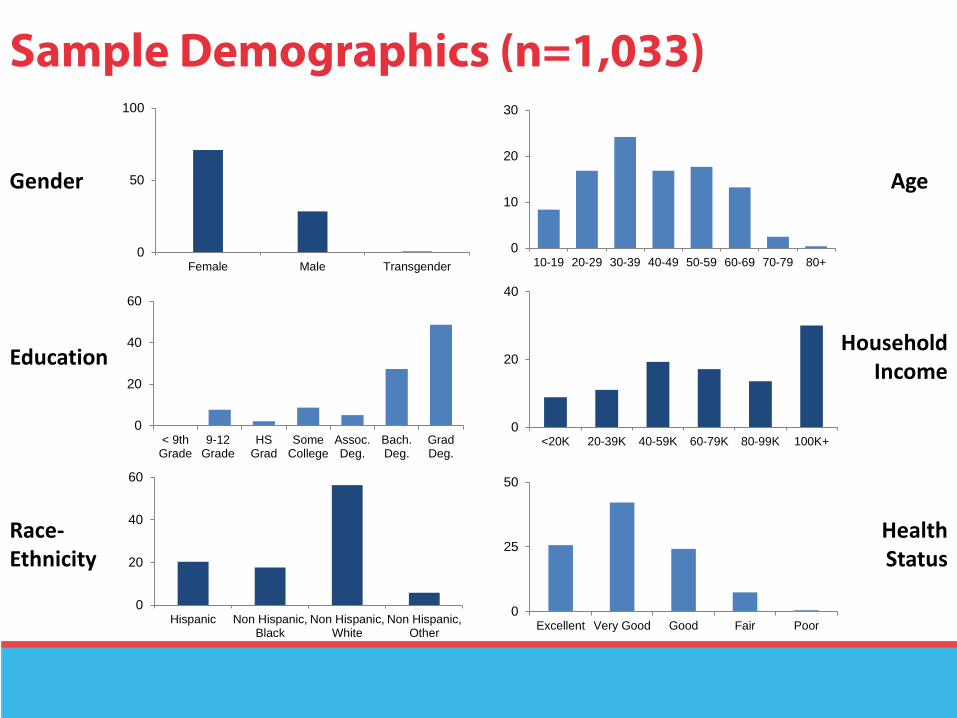
Sample Demographics (n=1,033)
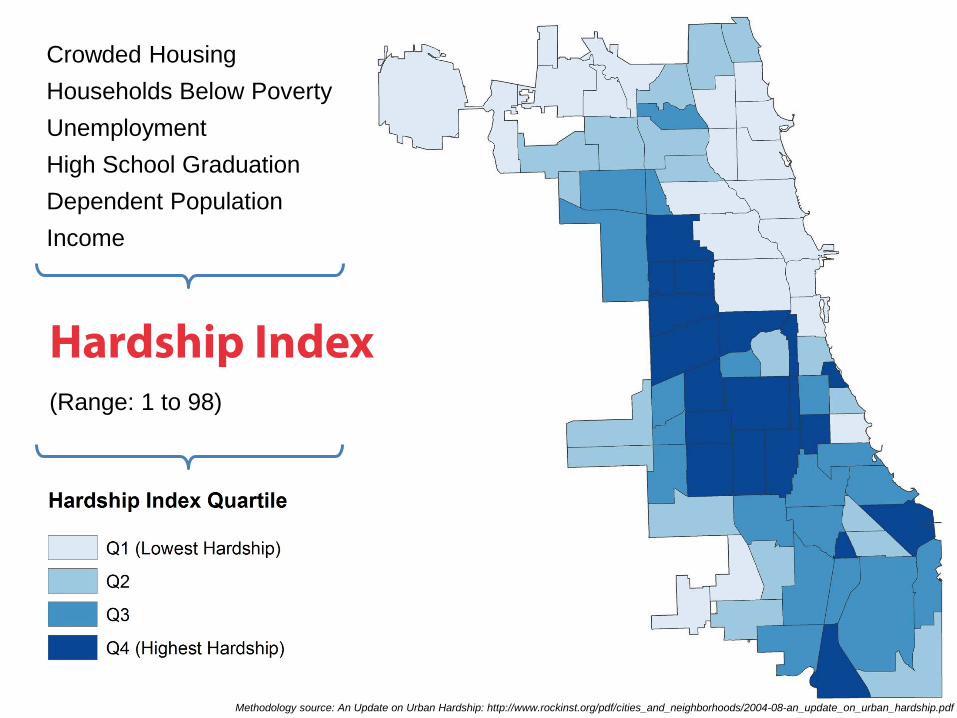
Crowded Housing Households Below Poverty Unemployment High School Graduation Dependent Population Income
Hardship Index
(Range: 1 to 98)
Methodology source: An Update on Urban Hardship: http://www.rockinst.org/pdf/cities_and_neighborhoods/2004-08-an_update_on_urban_hardship.pdf
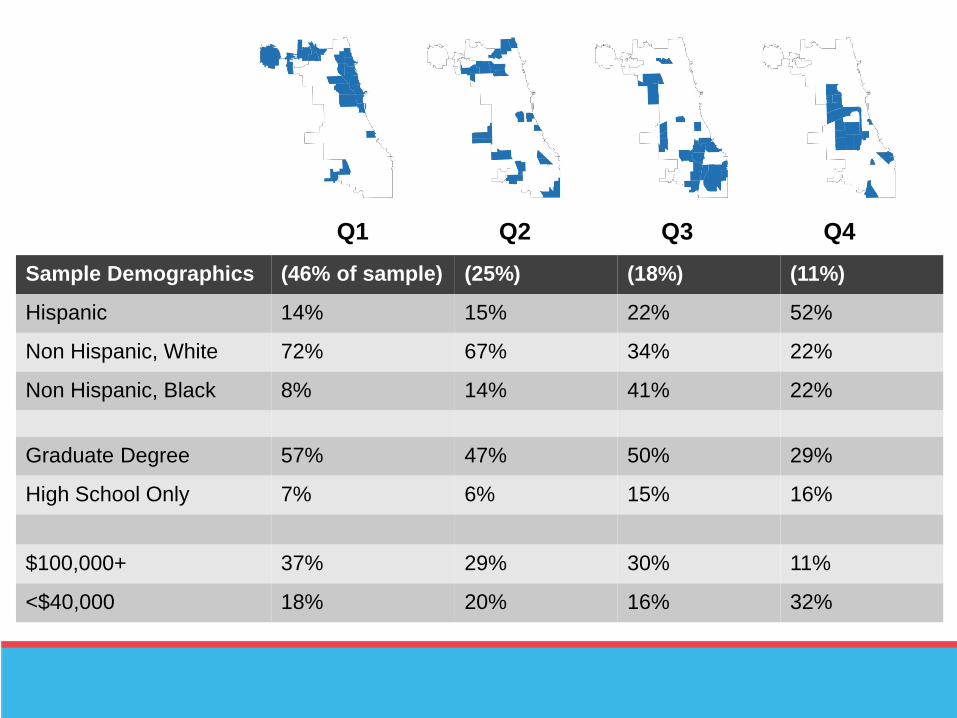
Sample Demographics (46% of sample) (25%) (18%) (11%)
Hispanic 14% 15% 22% 52%
Non Hispanic, White 72% 67% 34% 22%
Non Hispanic, Black 8% 14% 41% 22%
Graduate Degree 57% 47% 50% 29%
High School Only 7% 6% 15% 16%
$100,000+ 37% 29% 30% 11%
<$40,000 18% 20% 16% 32%
Q1 Q2 Q3 Q4
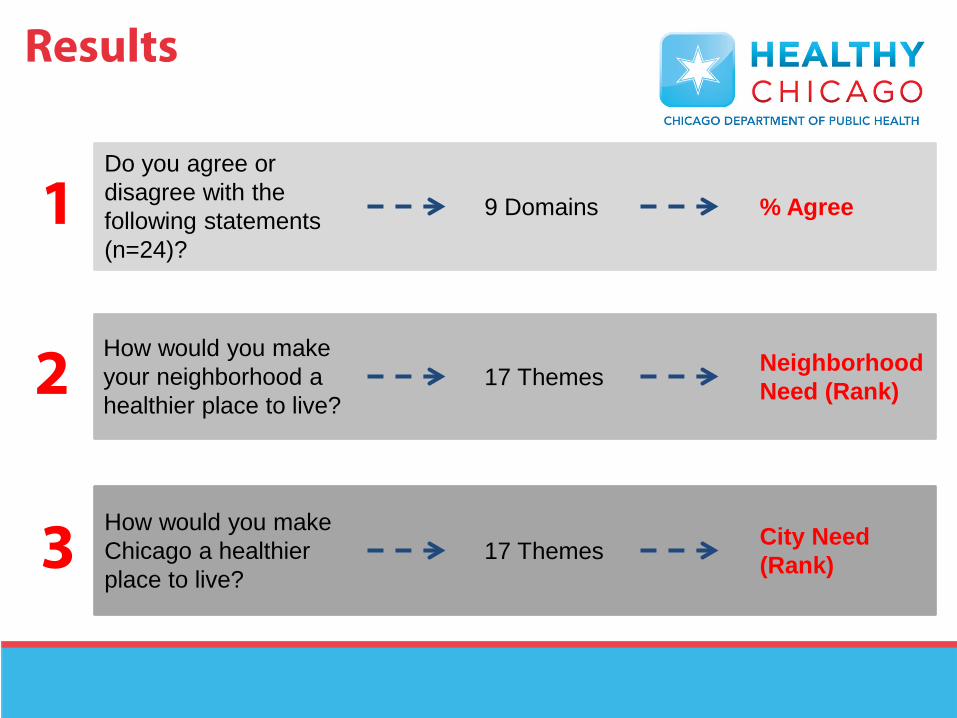
Results
Do you agree or disagree with the following statements (n=24)?
How would you make your neighborhood a healthier place to live?
How would you make Chicago a healthier place to live?
9 Domains % Agree
17 Themes
17 Themes
Neighborhood Need (Rank)
City Need (Rank)
1
2
3
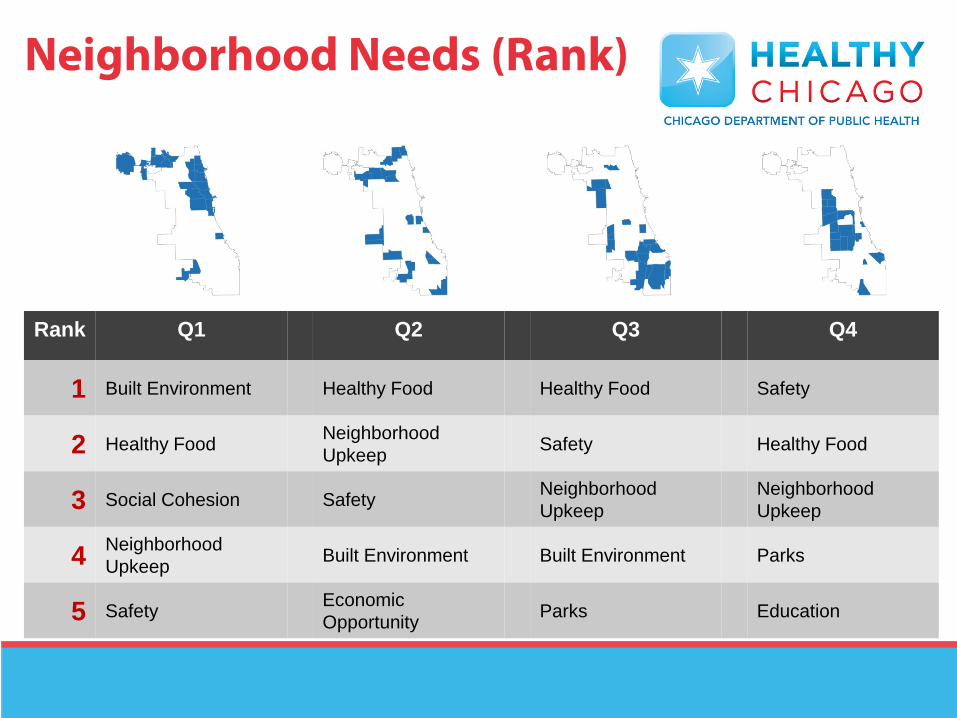
Rank Q1 Q2 Q3 Q4
1 Built Environment Healthy Food Healthy Food Safety
2 Healthy Food Neighborhood Upkeep Safety Healthy Food
3 Social Cohesion Safety Neighborhood Upkeep
Neighborhood Upkeep
4 Neighborhood Upkeep Built Environment Built Environment Parks
5 Safety Economic Opportunity Parks Education
Neighborhood Needs (Rank)
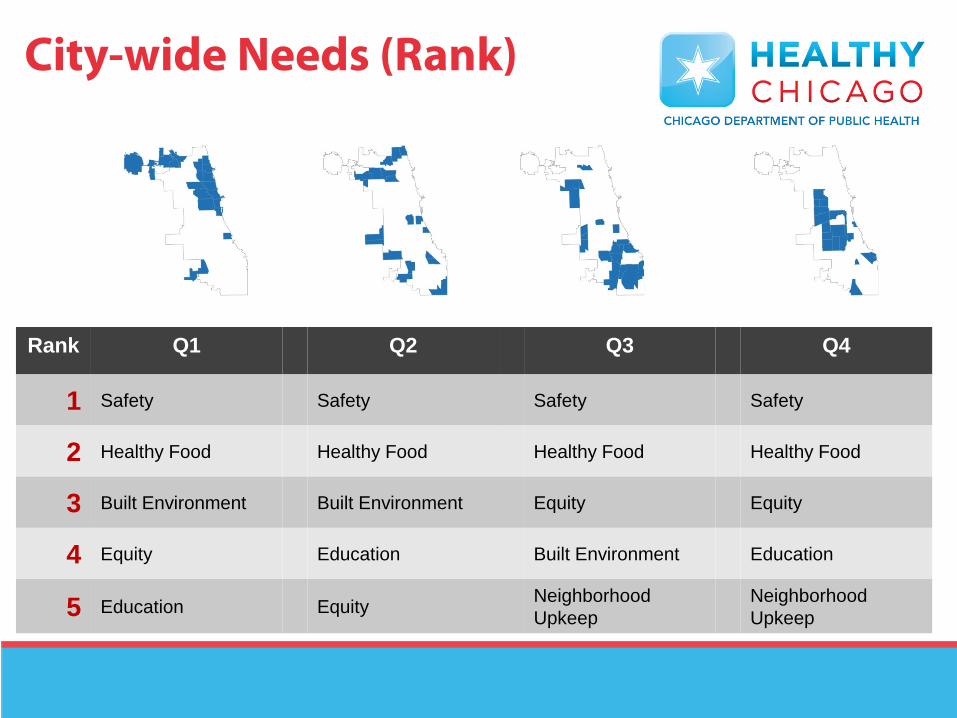
Rank Q1 Q2 Q3 Q4
1 Safety Safety Safety Safety
2 Healthy Food Healthy Food Healthy Food Healthy Food
3 Built Environment Built Environment Equity Equity
4 Equity Education Built Environment Education
5 Education Equity Neighborhood Upkeep
Neighborhood Upkeep
City-wide Needs (Rank)
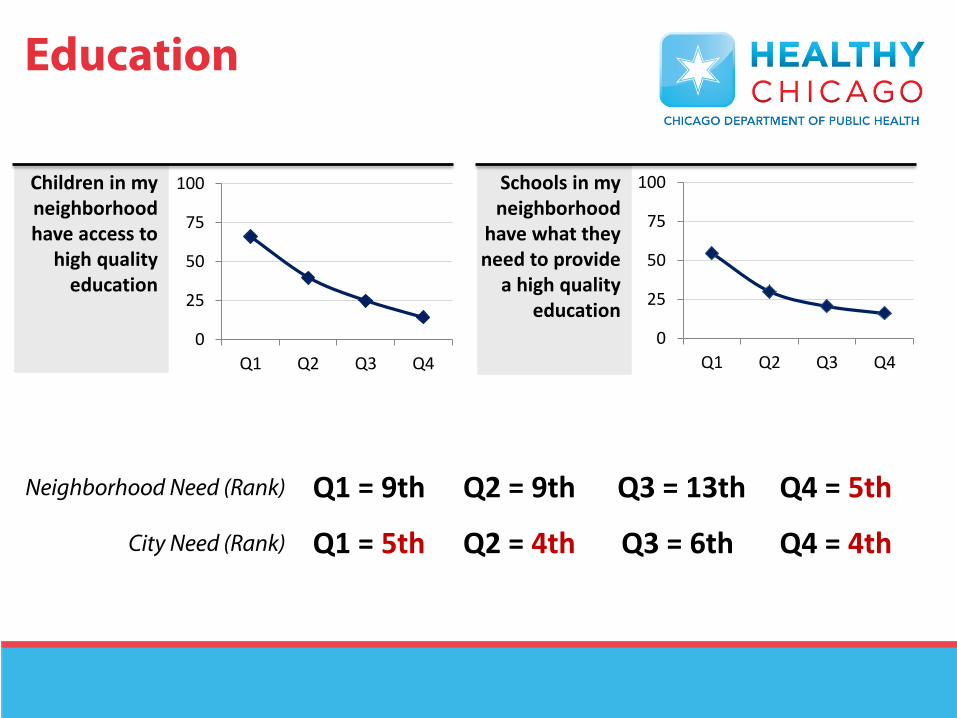
Schools in my neighborhood
have what they need to provide
a high quality education
Children in my neighborhood have access to
high quality education
Education
0
25
50
75
100
Q1 Q2 Q3 Q40
25
50
75
100
Q1 Q2 Q3 Q4
Q1 = 9th Q2 = 9th Q3 = 13th Q4 = 5th
Q1 = 5th Q2 = 4th Q3 = 6th Q4 = 4th
Neighborhood Need (Rank)
City Need (Rank)
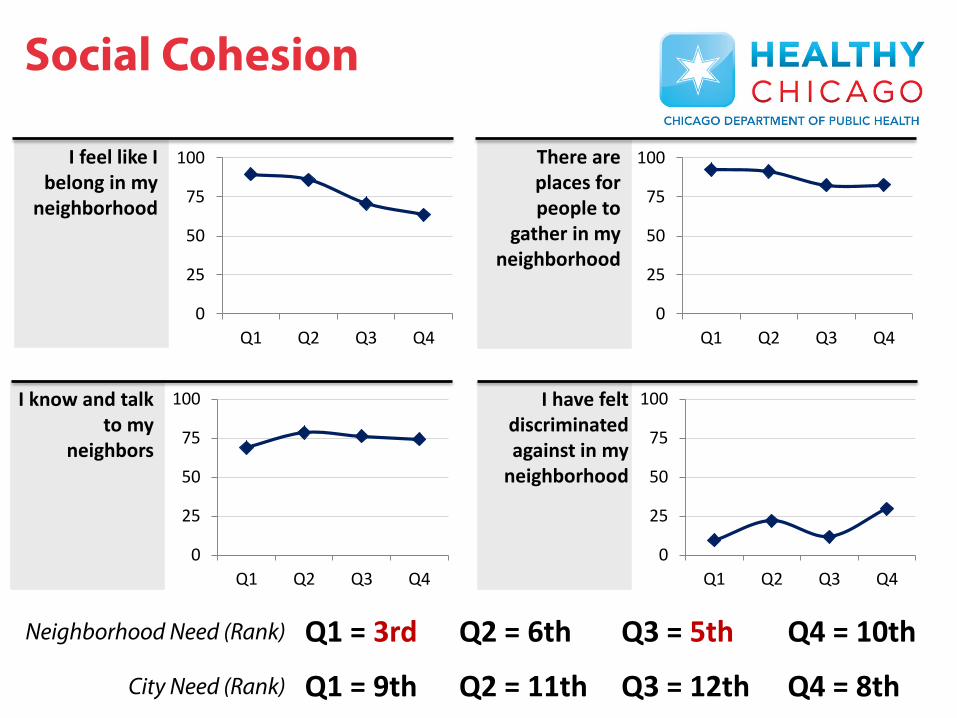
There are places for people to
gather in my neighborhood
I feel like I belong in my
neighborhood
I know and talk to my
neighbors
I have felt discriminated against in my
neighborhood
Social Cohesion
0
25
50
75
100
Q1 Q2 Q3 Q40
25
50
75
100
Q1 Q2 Q3 Q4
0
25
50
75
100
Q1 Q2 Q3 Q40
25
50
75
100
Q1 Q2 Q3 Q4
Q1 = 3rd Q2 = 6th Q3 = 5th Q4 = 10th
Q1 = 9th Q2 = 11th Q3 = 12th Q4 = 8th
Neighborhood Need (Rank)
City Need (Rank)
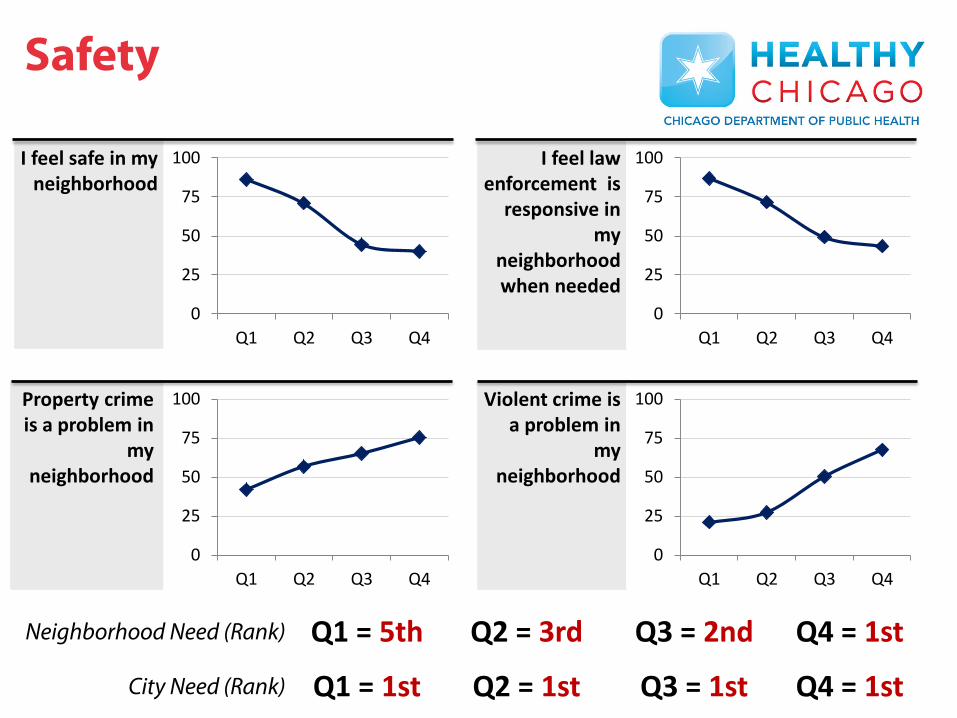
I feel law enforcement is
responsive in my
neighborhood when needed
I feel safe in my neighborhood
Property crime is a problem in
my neighborhood
Violent crime is a problem in
my neighborhood
0
25
50
75
100
Q1 Q2 Q3 Q4
0
25
50
75
100
Q1 Q2 Q3 Q40
25
50
75
100
Q1 Q2 Q3 Q4
0
25
50
75
100
Q1 Q2 Q3 Q4
Safety
Q1 = 5th Q2 = 3rd Q3 = 2nd Q4 = 1st
Q1 = 1st Q2 = 1st Q3 = 1st Q4 = 1st
Neighborhood Need (Rank)
City Need (Rank)
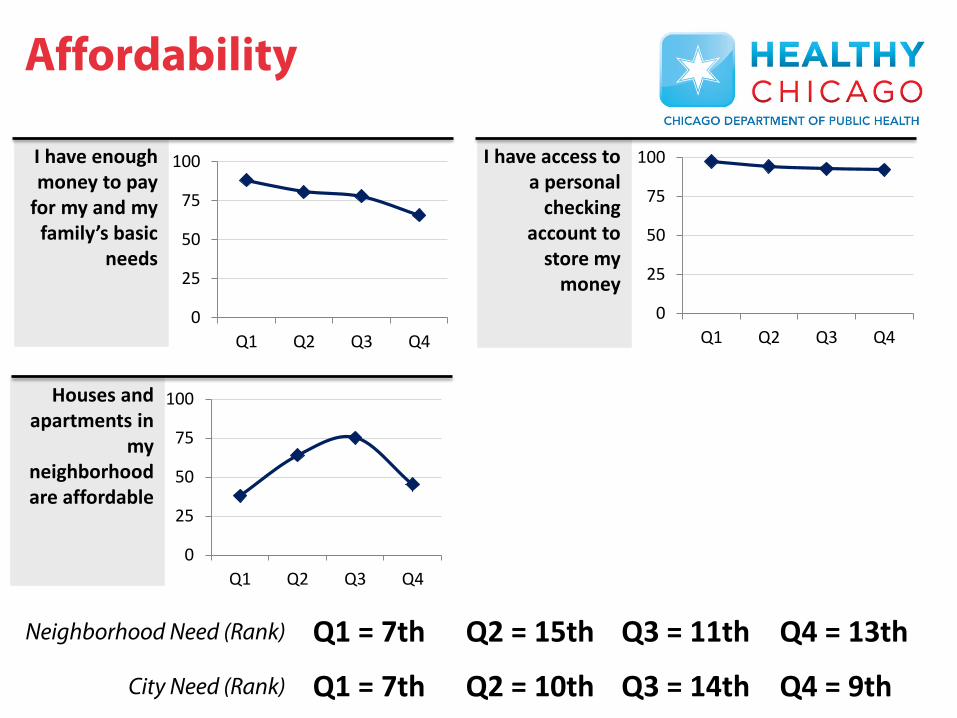
I have enough money to pay
for my and my family’s basic
needs
Houses and apartments in
my neighborhood are affordable
Affordability
I have access to a personal
checking account to
store my money
0
25
50
75
100
Q1 Q2 Q3 Q40
25
50
75
100
Q1 Q2 Q3 Q4
0
25
50
75
100
Q1 Q2 Q3 Q4
Q1 = 7th Q2 = 15th Q3 = 11th Q4 = 13th
Q1 = 7th Q2 = 10th Q3 = 14th Q4 = 9th
Neighborhood Need (Rank)
City Need (Rank)
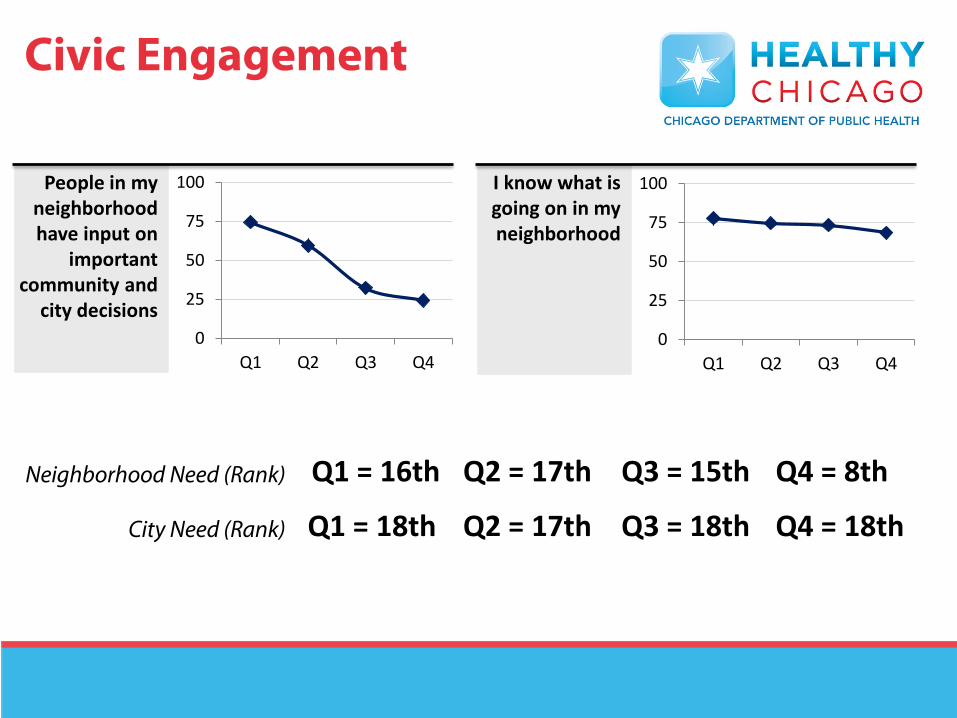
I know what is going on in my neighborhood
People in my neighborhood have input on
important community and
city decisions
Civic Engagement
0
25
50
75
100
Q1 Q2 Q3 Q40
25
50
75
100
Q1 Q2 Q3 Q4
Q1 = 16th Q2 = 17th Q3 = 15th Q4 = 8th
Q1 = 18th Q2 = 17th Q3 = 18th Q4 = 18th
Neighborhood Need (Rank)
City Need (Rank)
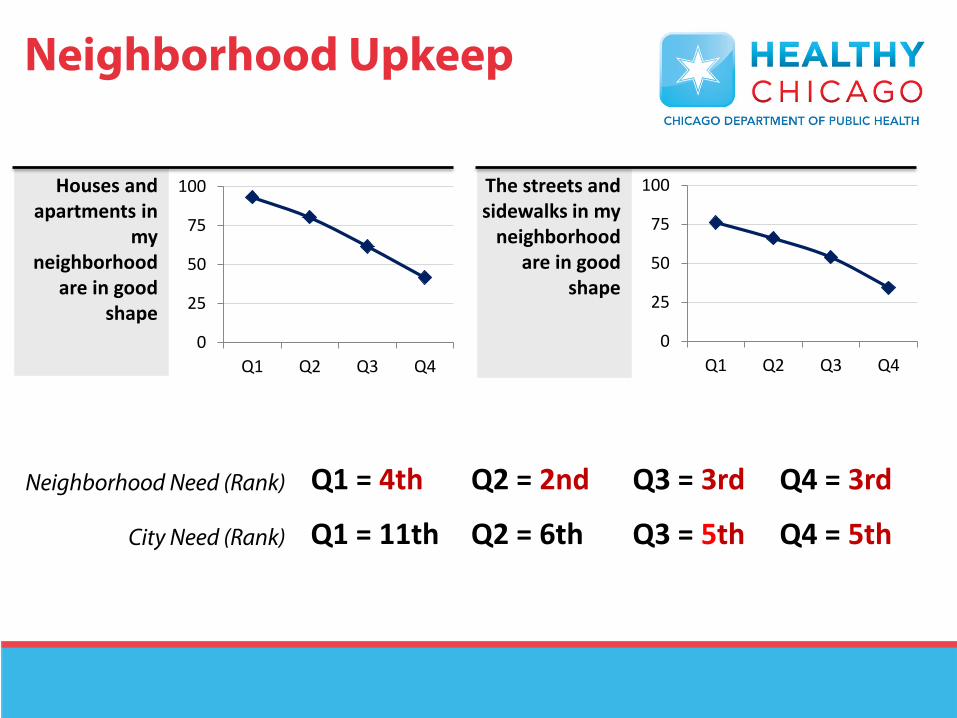
The streets and sidewalks in my
neighborhood are in good
shape
Houses and apartments in
my neighborhood
are in good shape
Neighborhood Upkeep
0
25
50
75
100
Q1 Q2 Q3 Q40
25
50
75
100
Q1 Q2 Q3 Q4
Q1 = 4th Q2 = 2nd Q3 = 3rd Q4 = 3rd
Q1 = 11th Q2 = 6th Q3 = 5th Q4 = 5th
Neighborhood Need (Rank)
City Need (Rank)
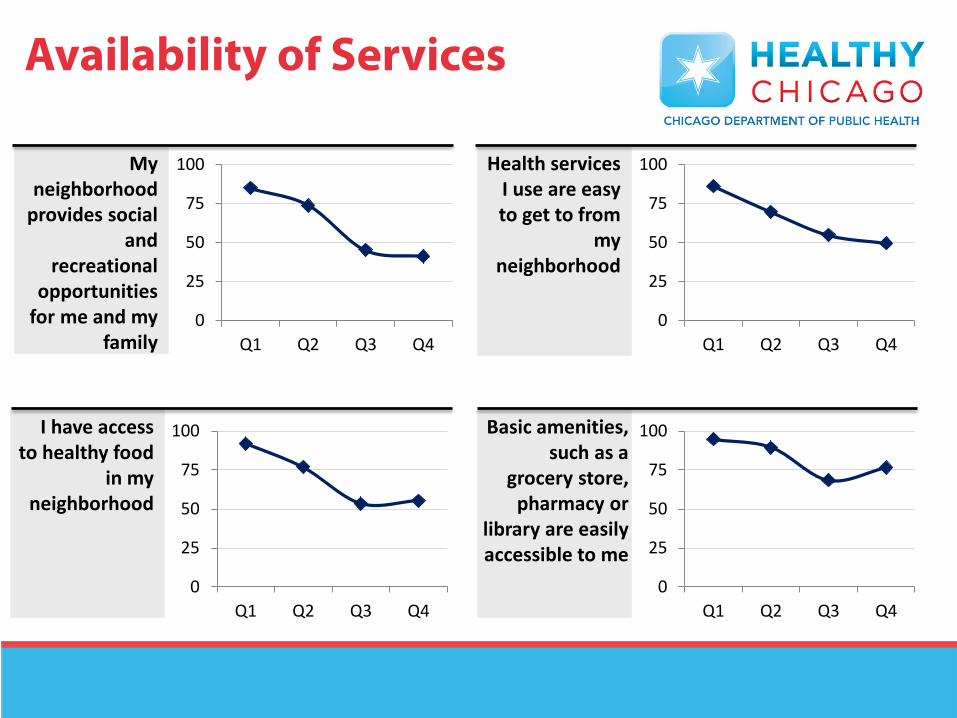
Health services I use are easy to get to from
my neighborhood
My neighborhood
provides social and
recreational opportunities
for me and my family
I have access to healthy food
in my neighborhood
Basic amenities, such as a
grocery store, pharmacy or
library are easily accessible to me
Availability of Services
0
25
50
75
100
Q1 Q2 Q3 Q40
25
50
75
100
Q1 Q2 Q3 Q4
0
25
50
75
100
Q1 Q2 Q3 Q40
25
50
75
100
Q1 Q2 Q3 Q4
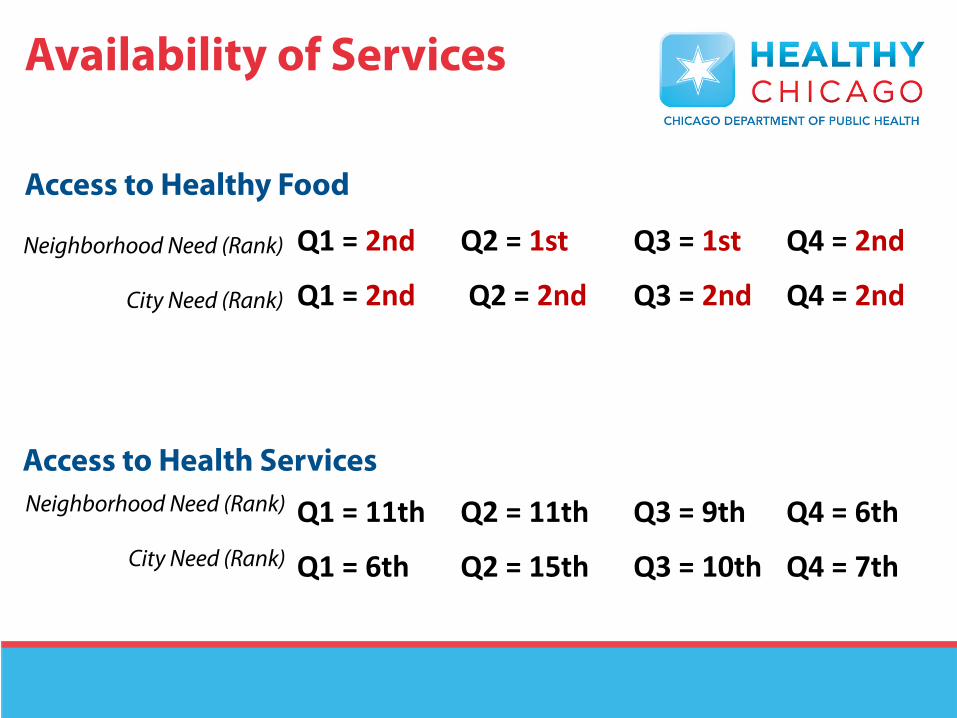
Availability of Services
Q1 = 11th Q2 = 11th Q3 = 9th Q4 = 6th
Q1 = 6th Q2 = 15th Q3 = 10th Q4 = 7th
Q1 = 2nd Q2 = 1st Q3 = 1st Q4 = 2nd
Q1 = 2nd Q2 = 2nd Q3 = 2nd Q4 = 2nd
Access to Health Services
Access to Healthy Food
Neighborhood Need (Rank)
City Need (Rank)
Neighborhood Need (Rank)
City Need (Rank)
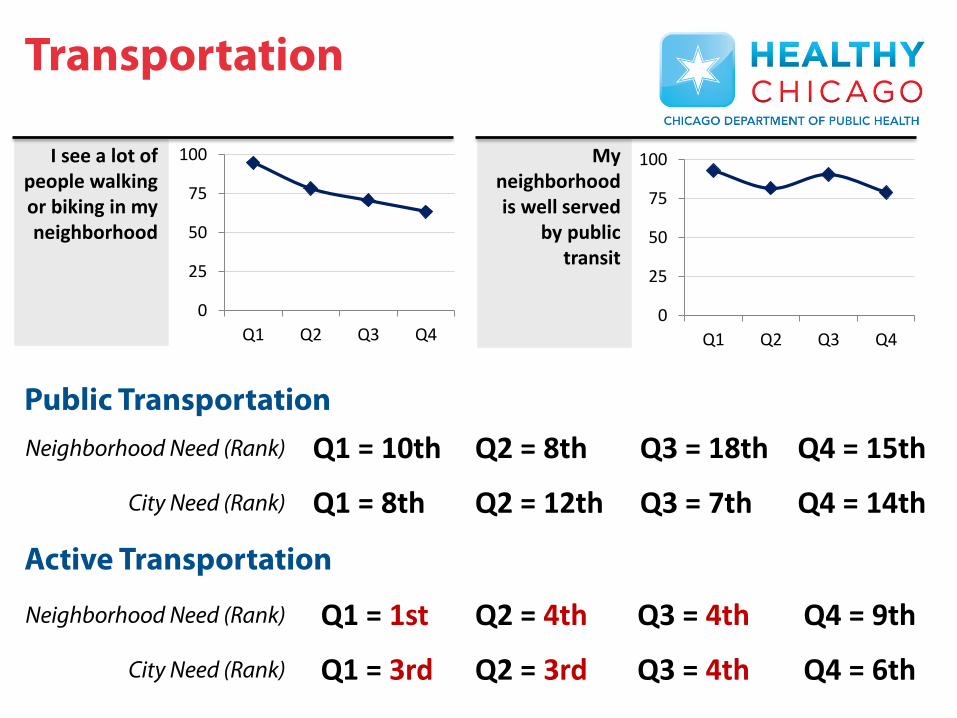
My neighborhood is well served
by public transit
I see a lot of people walking or biking in my neighborhood
Transportation
0
25
50
75
100
Q1 Q2 Q3 Q40
25
50
75
100
Q1 Q2 Q3 Q4
Q1 = 1st Q2 = 4th Q3 = 4th Q4 = 9th
Q1 = 3rd Q2 = 3rd Q3 = 4th Q4 = 6th
Q1 = 10th Q2 = 8th Q3 = 18th Q4 = 15th
Q1 = 8th Q2 = 12th Q3 = 7th Q4 = 14th
Public Transportation
Active Transportation
Neighborhood Need (Rank)
City Need (Rank)
Neighborhood Need (Rank)
City Need (Rank)
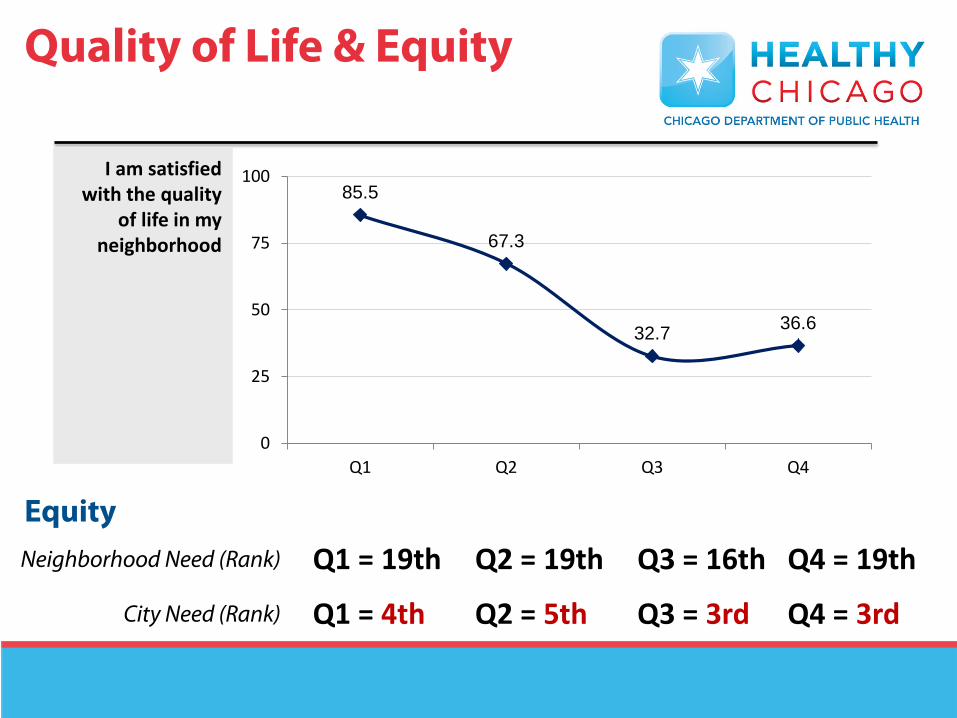
85.5
67.3
32.7 36.6
0
25
50
75
100
Q1 Q2 Q3 Q4
I am satisfied with the quality
of life in my neighborhood
Q1 = 19th Q2 = 19th Q3 = 16th Q4 = 19th
Q1 = 4th Q2 = 5th Q3 = 3rd Q4 = 3rd
Equity
Quality of Life & Equity
Neighborhood Need (Rank)
City Need (Rank)
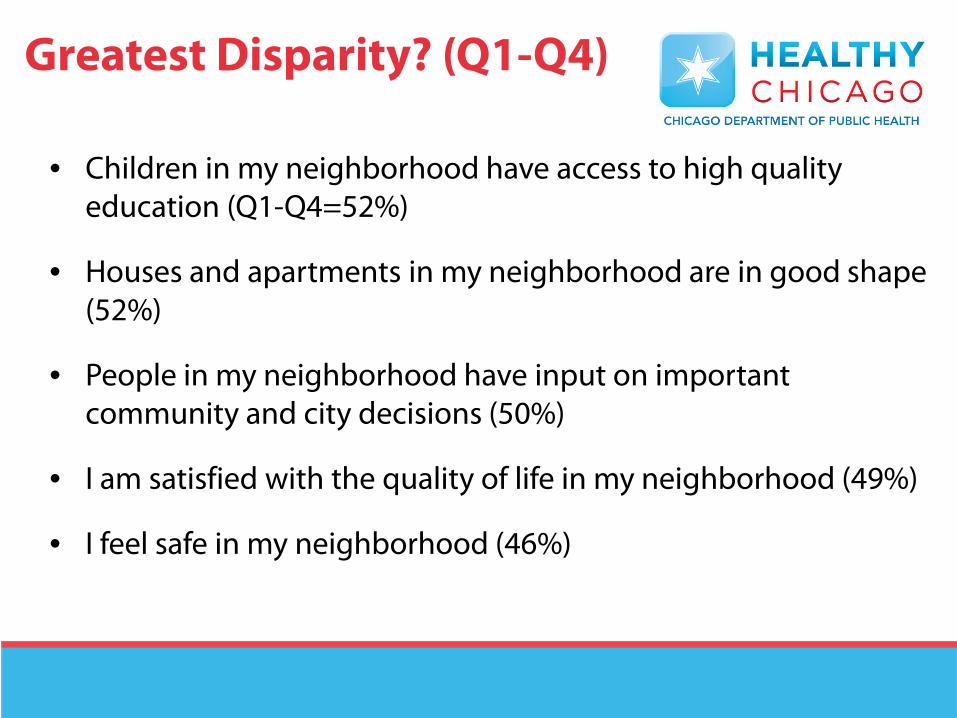
Greatest Disparity? (Q1-Q4)
• Children in my neighborhood have access to high quality education (Q1-Q4=52%)
• Houses and apartments in my neighborhood are in good shape (52%)
• People in my neighborhood have input on important community and city decisions (50%)
• I am satisfied with the quality of life in my neighborhood (49%)
• I feel safe in my neighborhood (46%)
Jennifer Hebert-Beirne, PhD, MPH,
Assistant Professor
Jennifer Felner, MPH, PhD Student, TA
Students in Fall 14 Community Health Sciences 431:
Community Health Assessment
Partnership for a Healthy Chicago
Community Themes & Strengths:
Qualitative Research
Students in Fall 2014 CHSC 431:
Community Health Assessment Jennifer Anderson
Jinsun Baek
Kaijah Blackwell
Anna Browar
Brynn D. Foss
Kelsey Gruss
Nicole Gulich
Jonathan Hofacker
Demonica Jones
Reem Kieso
Christina Larson
Jill Massino
Mwia Mutua
Geoyia Nightengale
Jennifer Norsworthy
Christina Pate
Marisa Pochter
Raeesa Sadat
Tina Schuh
Anne Scobel
Sunny Seto
Grace Sherman
Desmona Strahan
Kimi Suh
Pete Thomas
Cristina Turino
Milona Van Kanegan
Sarah Wagener
Sarah Wright
Lindsay Zeman
Special Guests: Dolores and
Yvette Castaneda
MAPP: Community Themes & Strengths
• Provides a deep understanding of the issues
residents feel are important by answering the
questions,
• “What is important to our community?”
• “How is quality of life perceived in our community?”
• “What assets do we have that can be used to
improve community health?”
MAPP, Users Handbook
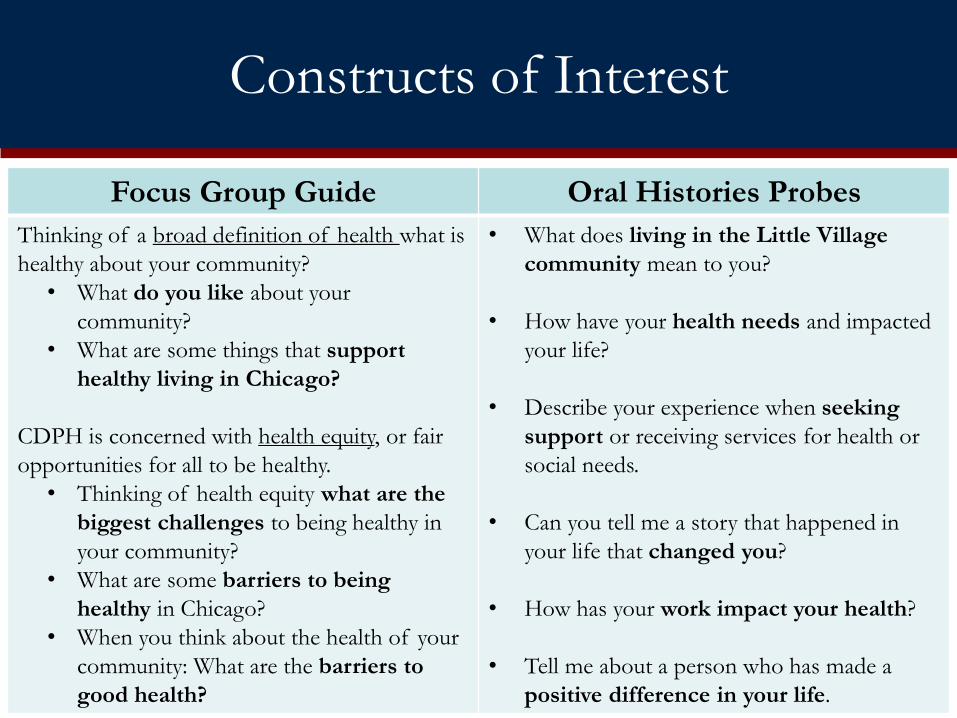
Constructs of Interest
Focus Group Guide Oral Histories Probes
Thinking of a broad definition of health what is
healthy about your community?
• What do you like about your
community?
• What are some things that support
healthy living in Chicago?
CDPH is concerned with health equity, or fair
opportunities for all to be healthy.
• Thinking of health equity what are the
biggest challenges to being healthy in
your community?
• What are some barriers to being
healthy in Chicago?
• When you think about the health of your
community: What are the barriers to
good health?
• What does living in the Little Village
community mean to you?
• How have your health needs and impacted
your life?
• Describe your experience when seeking
support or receiving services for health or
social needs.
• Can you tell me a story that happened in
your life that changed you?
• How has your work impact your health?
• Tell me about a person who has made a
positive difference in your life.
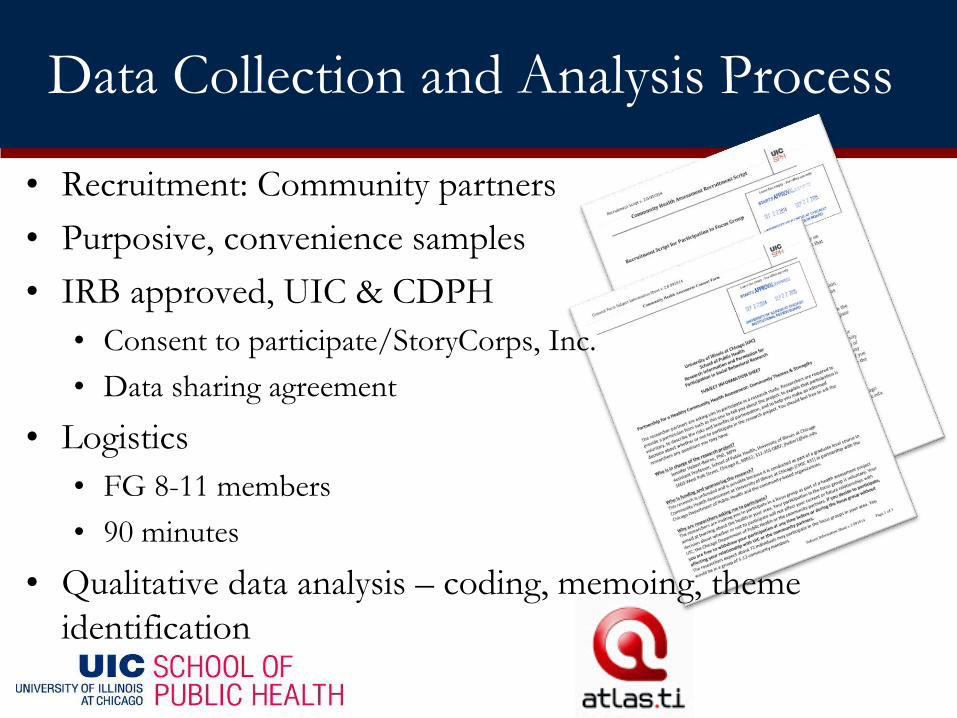
Data Collection and Analysis Process
• Recruitment: Community partners
• Purposive, convenience samples
• IRB approved, UIC & CDPH
• Consent to participate/StoryCorps, Inc.
• Data sharing agreement
• Logistics
• FG 8-11 members
• 90 minutes
• Qualitative data analysis – coding, memoing, theme
identification
The Day Reporting
Center of the Cook
County Sheriff’s
Office
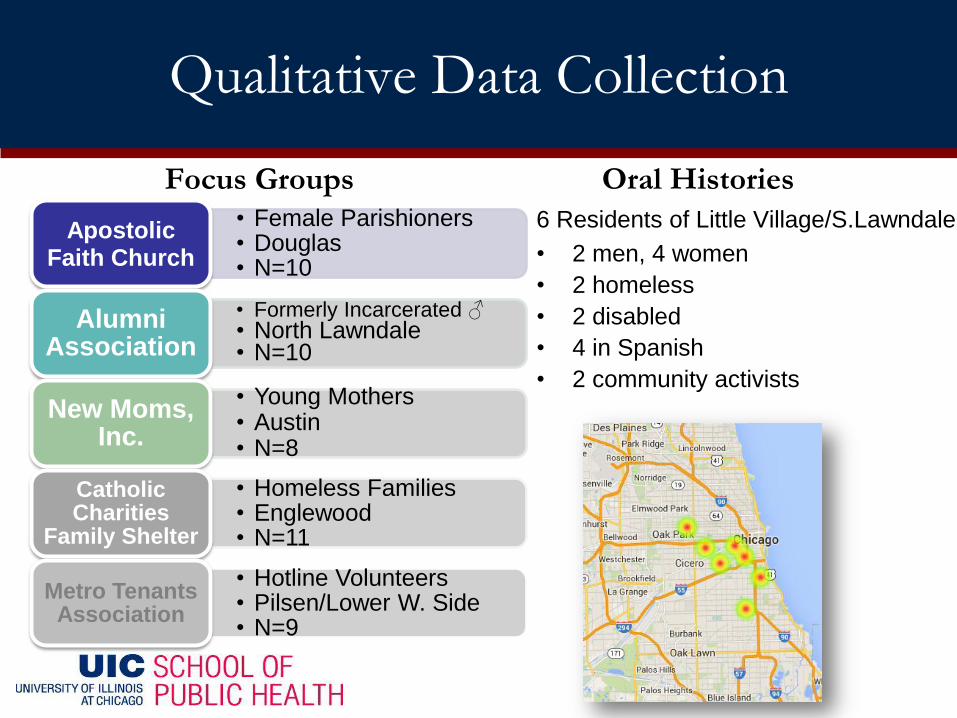
Qualitative Data Collection
Focus Groups
• Female Parishioners • Douglas • N=10
Apostolic Faith Church
• Formerly Incarcerated ♂ • North Lawndale • N=10
Alumni Association
• Young Mothers • Austin • N=8
New Moms, Inc.
• Homeless Families • Englewood • N=11
Catholic Charities
Family Shelter
• Hotline Volunteers • Pilsen/Lower W. Side • N=9
Metro Tenants Association
Oral Histories
6 Residents of Little Village/S.Lawndale
• 2 men, 4 women
• 2 homeless
• 2 disabled
• 4 in Spanish
• 2 community activists
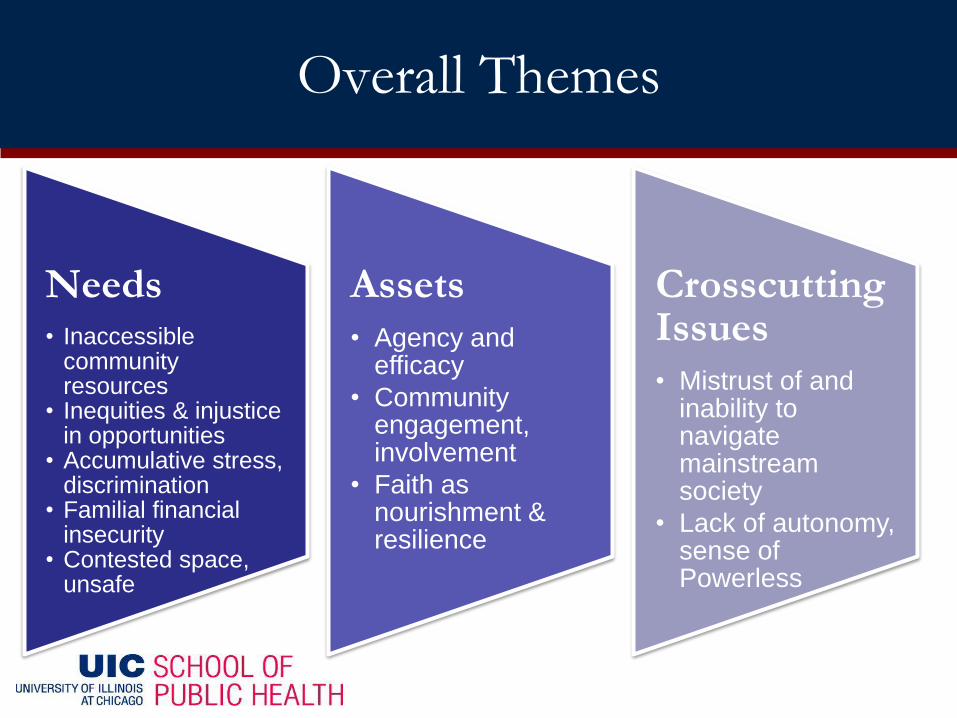
Overall Themes
Needs • Inaccessible
community resources
• Inequities & injustice in opportunities
• Accumulative stress, discrimination
• Familial financial insecurity
• Contested space, unsafe
Assets
• Agency and efficacy
• Community engagement, involvement
• Faith as nourishment & resilience
Crosscutting Issues
• Mistrust of and inability to navigate mainstream society
• Lack of autonomy, sense of Powerless
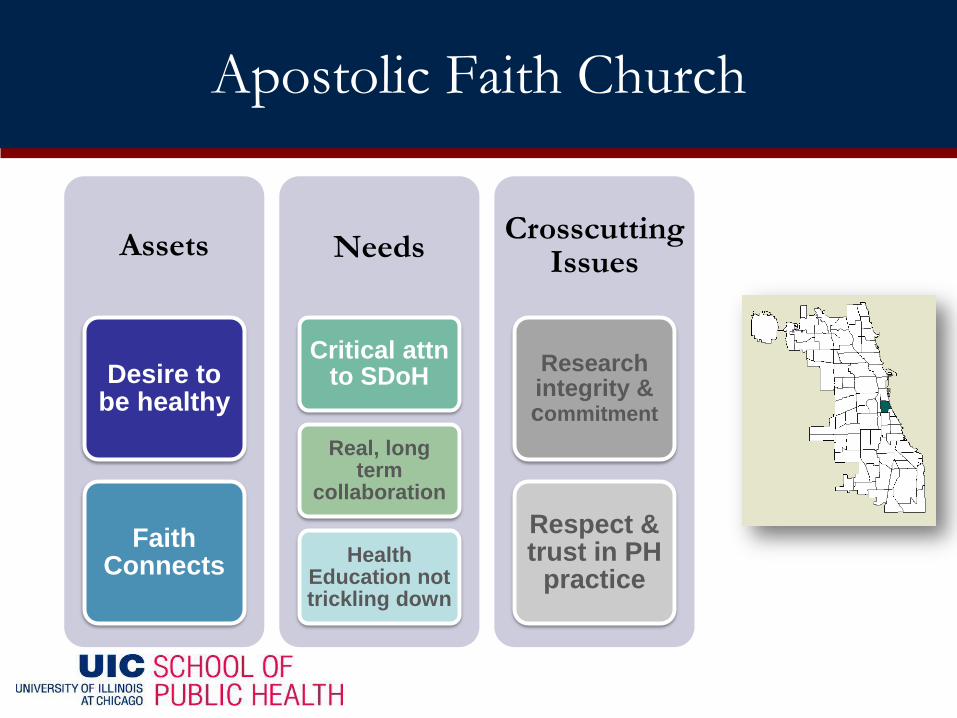
Apostolic Faith Church
Assets
Desire to be healthy
Faith Connects
Needs
Critical attn to SDoH
Real, long term
collaboration
Health Education not trickling down
Crosscutting Issues
Research integrity & commitment
Respect & trust in PH
practice
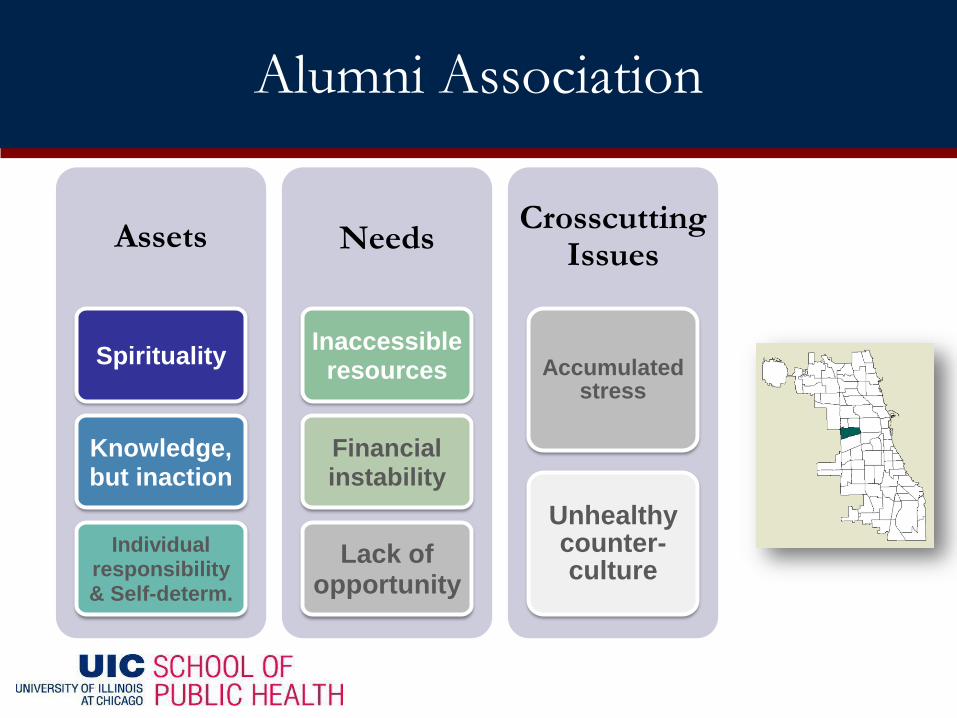
Alumni Association
Assets
Spirituality
Knowledge, but inaction
Individual responsibility & Self-determ.
Needs
Inaccessible resources
Financial instability
Lack of opportunity
Crosscutting Issues
Accumulated stress
Unhealthy counter-culture
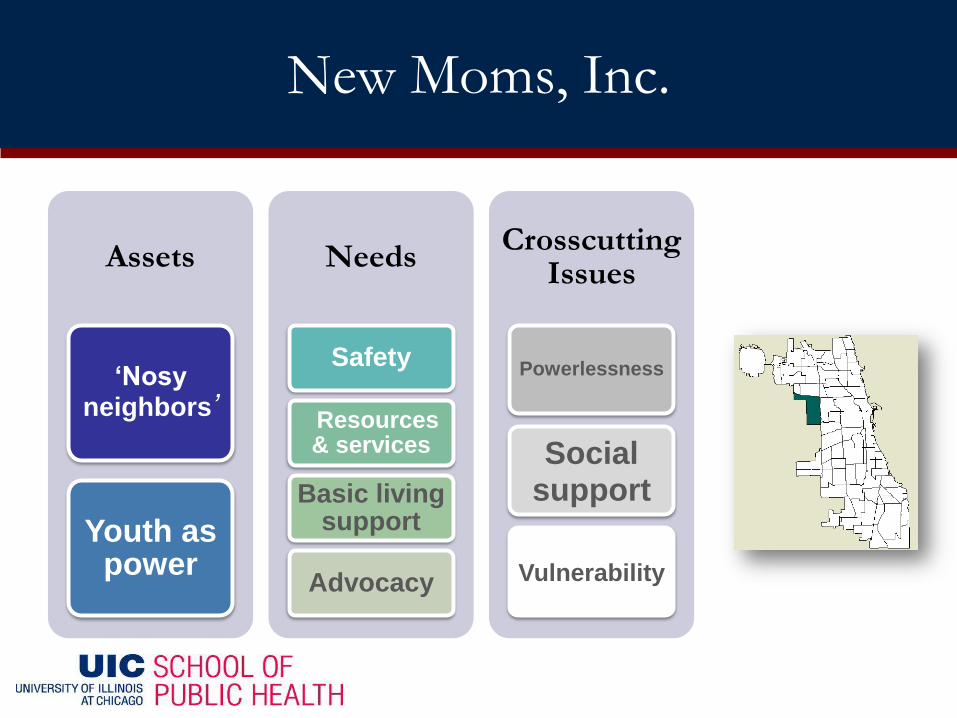
New Moms, Inc.
Assets
‘Nosy neighbors’
Youth as power
Needs
Safety
Resources & services
Basic living support
Advocacy
Crosscutting Issues
Powerlessness
Social support
Vulnerability
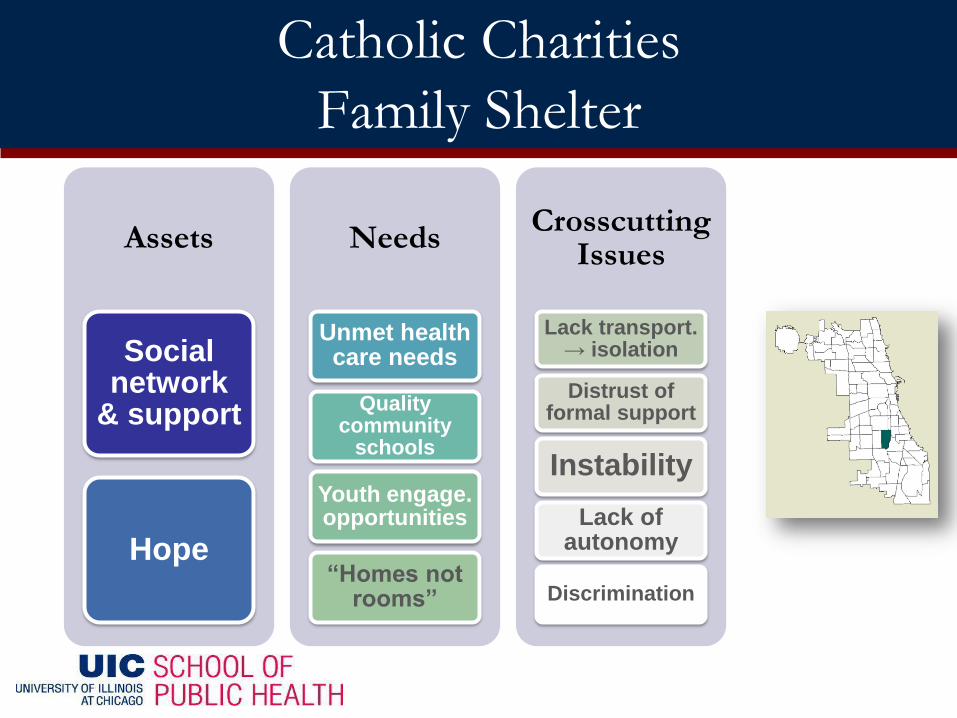
Catholic Charities
Family Shelter
Assets
Social network
& support
Hope
Needs
Unmet health care needs
Quality community
schools
Youth engage. opportunities
“Homes not rooms”
Crosscutting Issues
Lack transport. → isolation
Distrust of formal support
Instability
Lack of autonomy
Discrimination
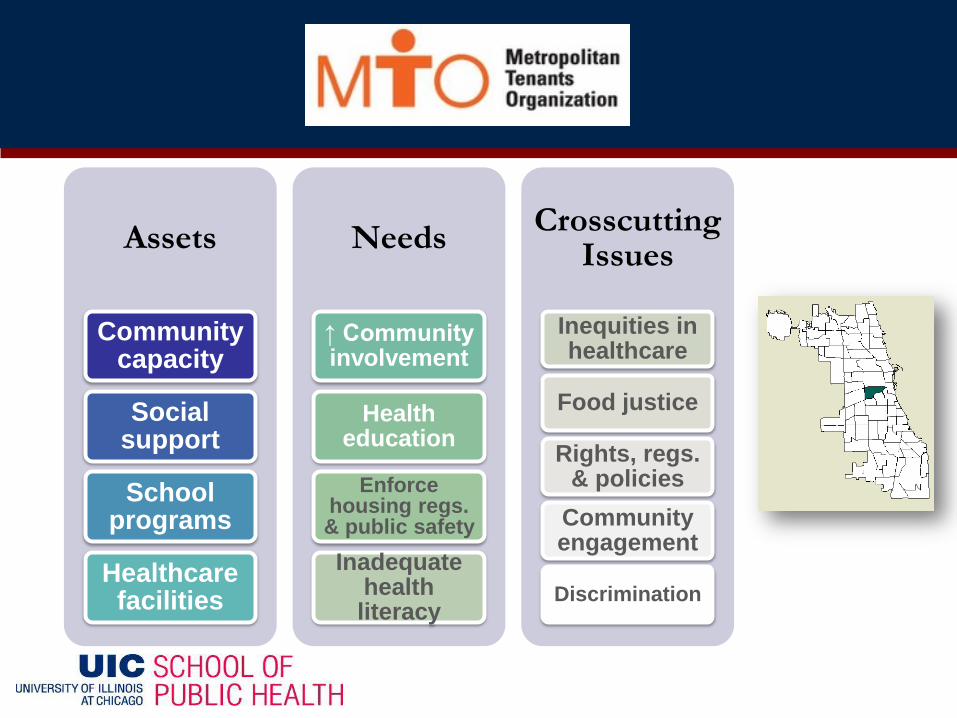
Assets
Community capacity
Social support
School programs
Healthcare facilities
Needs
↑ Community involvement
Health education
Enforce housing regs. & public safety
Inadequate health literacy
Crosscutting Issues
Inequities in healthcare
Food justice
Rights, regs. & policies
Community engagement
Discrimination
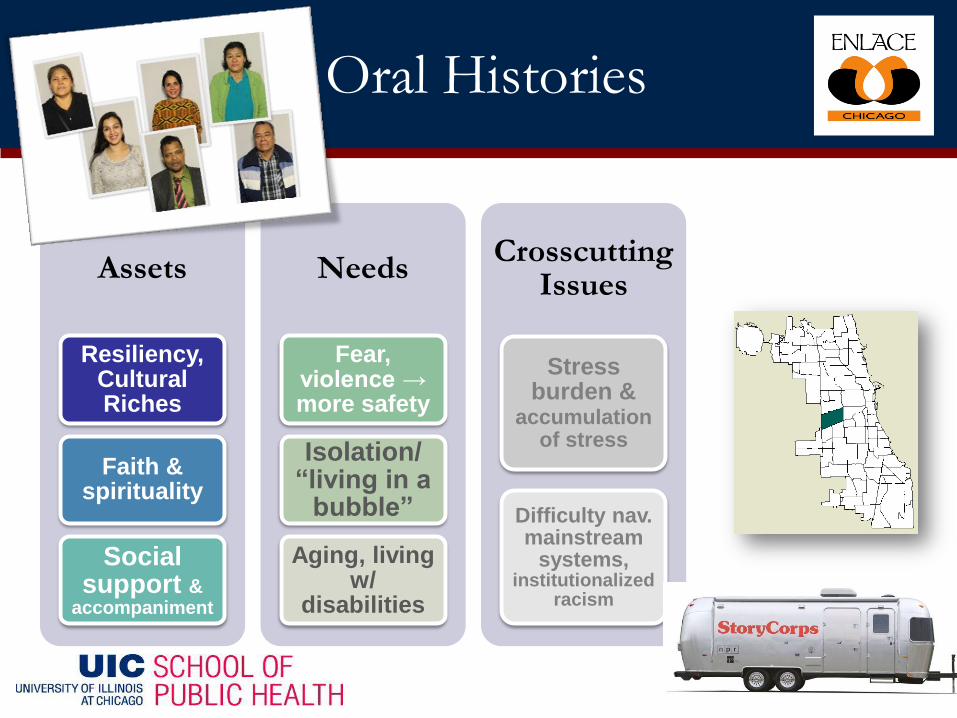
Assets
Resiliency, Cultural Riches
Faith & spirituality
Social support &
accompaniment
Needs
Fear, violence → more safety
Isolation/ “living in a
bubble”
Aging, living w/
disabilities
Crosscutting Issues
Stress burden &
accumulation of stress
Difficulty nav. mainstream
systems, institutionalized
racism
Oral Histories
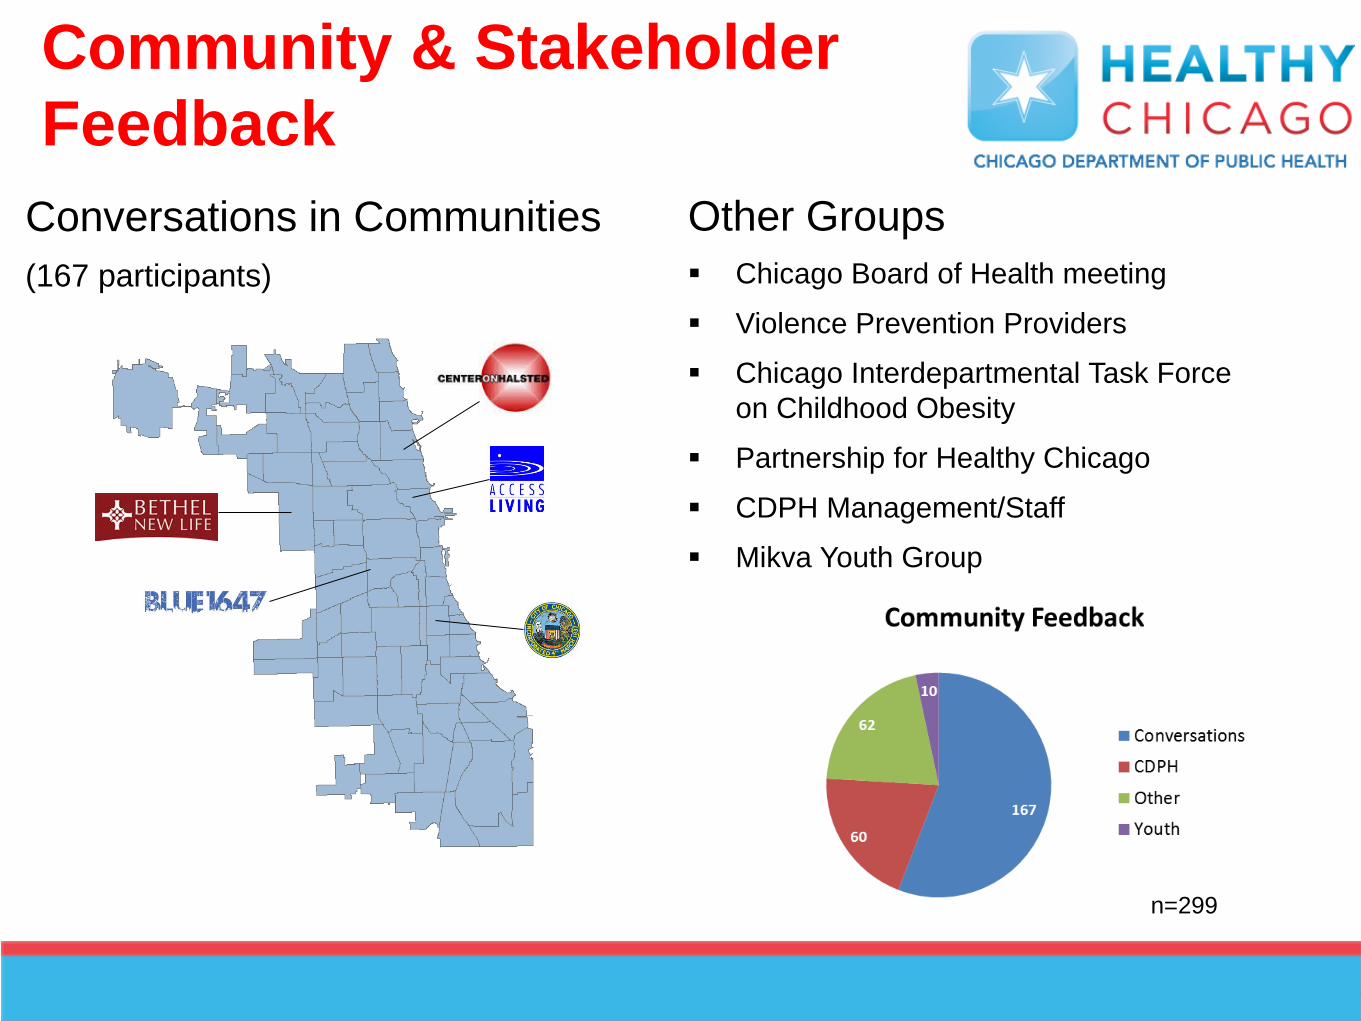
Community & Stakeholder Feedback
• Forces & trends impacting health status/system
44
Conversations in Communities (167 participants)
Other Groups Chicago Board of Health meeting
Violence Prevention Providers
Chicago Interdepartmental Task Force on Childhood Obesity
Partnership for Healthy Chicago
CDPH Management/Staff
Mikva Youth Group
n=299
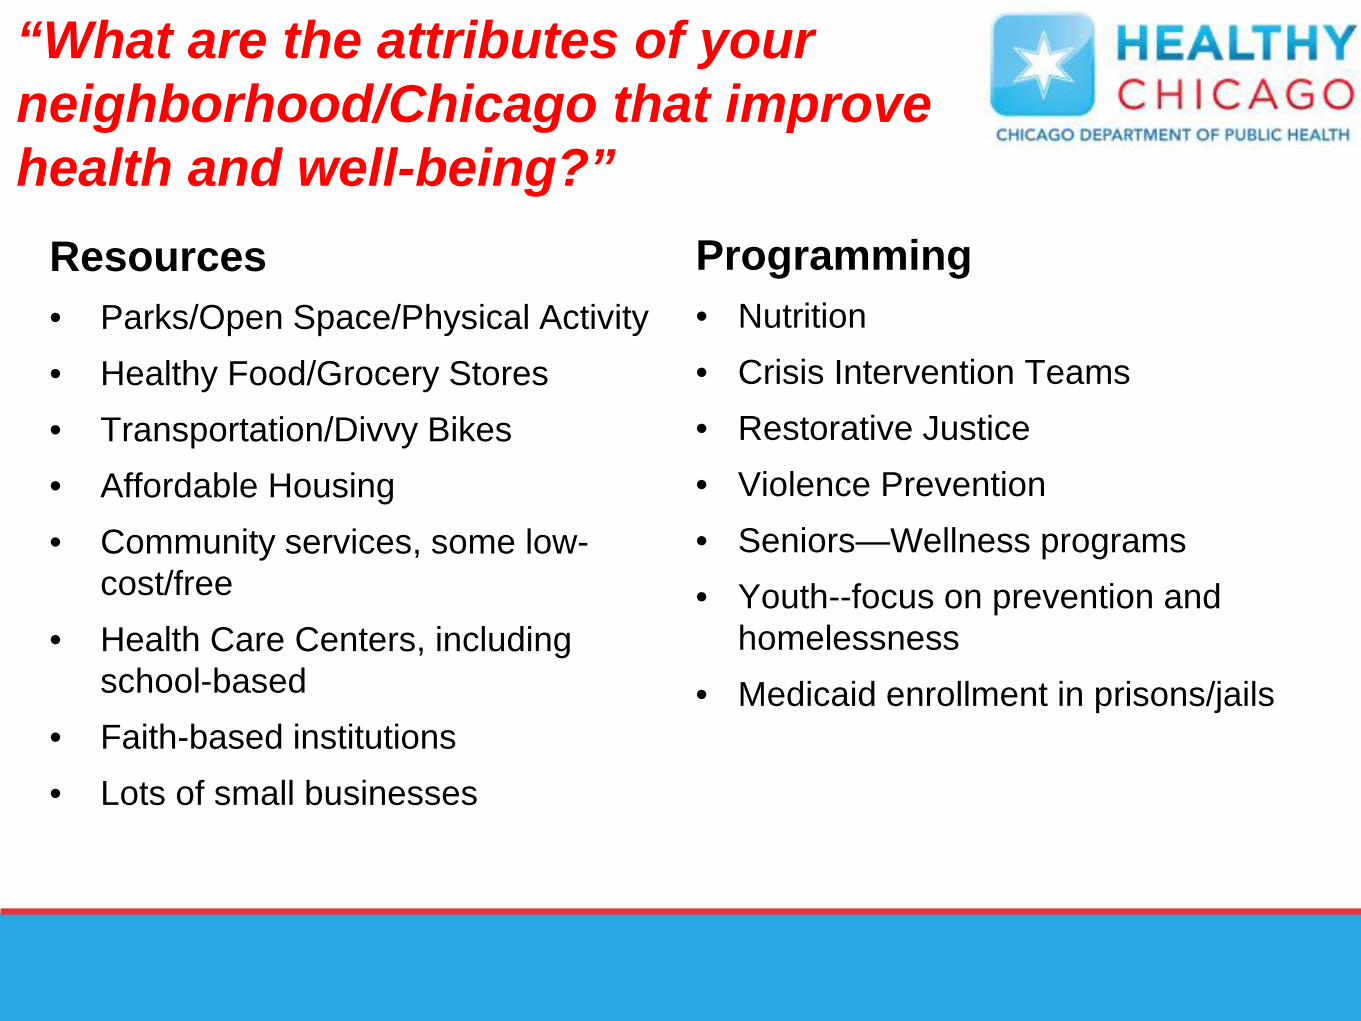
“What are the attributes of your neighborhood/Chicago that improve health and well-being?”
Resources • Parks/Open Space/Physical Activity • Healthy Food/Grocery Stores • Transportation/Divvy Bikes • Affordable Housing • Community services, some low-
cost/free • Health Care Centers, including
school-based • Faith-based institutions • Lots of small businesses
Programming • Nutrition • Crisis Intervention Teams • Restorative Justice • Violence Prevention • Seniors—Wellness programs • Youth--focus on prevention and
homelessness • Medicaid enrollment in prisons/jails
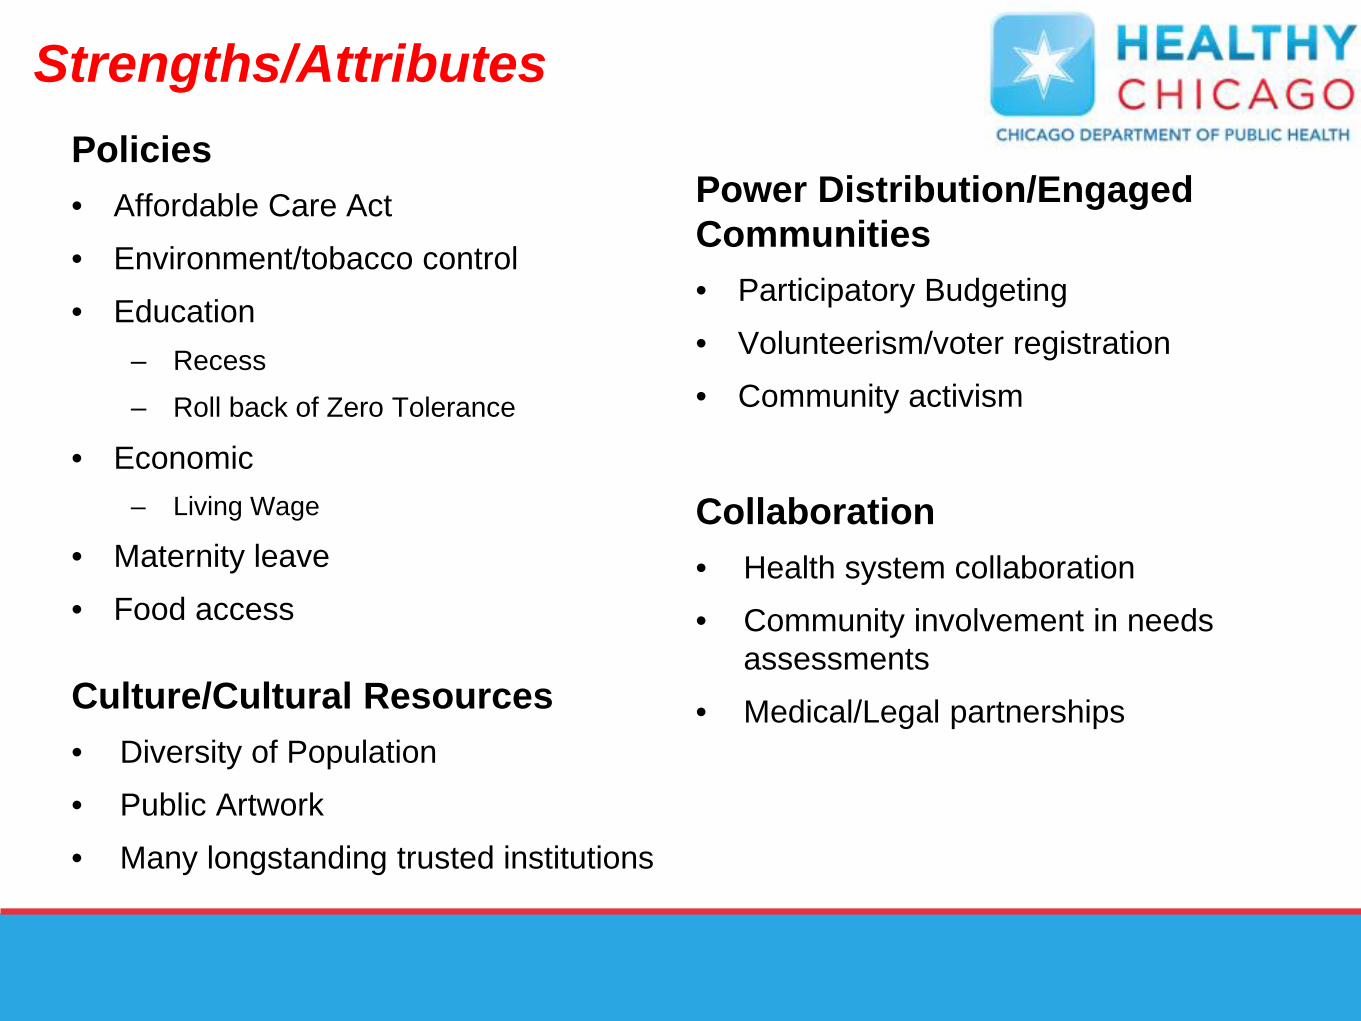
Strengths/Attributes Policies • Affordable Care Act • Environment/tobacco control • Education
– Recess
– Roll back of Zero Tolerance
• Economic – Living Wage
• Maternity leave • Food access
Culture/Cultural Resources • Diversity of Population • Public Artwork • Many longstanding trusted institutions
Power Distribution/Engaged Communities • Participatory Budgeting • Volunteerism/voter registration • Community activism
Collaboration • Health system collaboration • Community involvement in needs
assessments • Medical/Legal partnerships
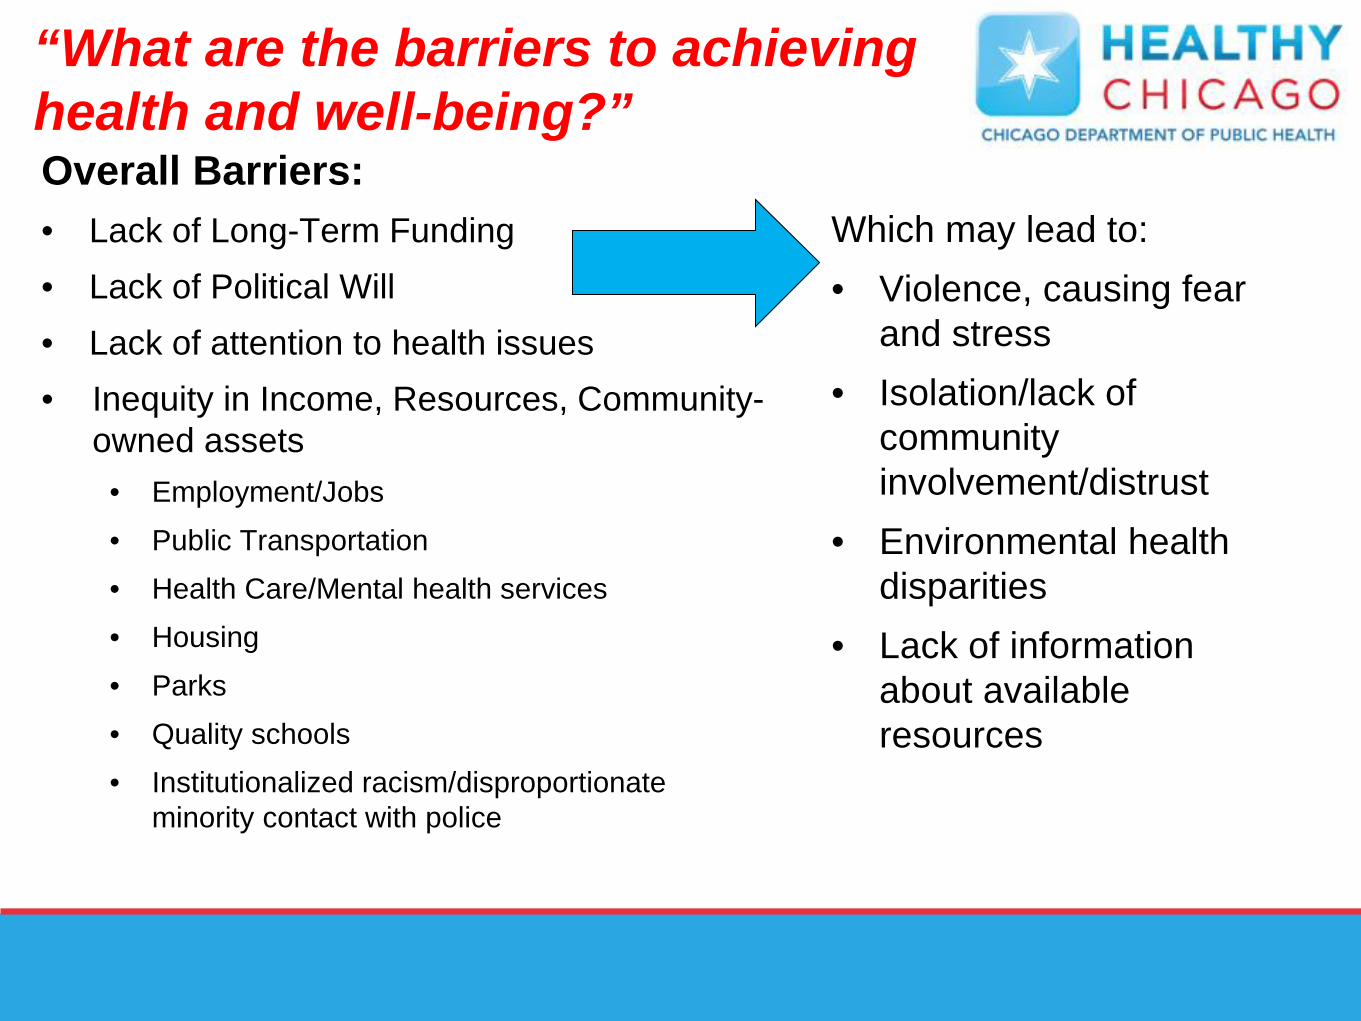
“What are the barriers to achieving health and well-being?” Overall Barriers: • Lack of Long-Term Funding • Lack of Political Will • Lack of attention to health issues • Inequity in Income, Resources, Community-
owned assets • Employment/Jobs • Public Transportation • Health Care/Mental health services • Housing • Parks • Quality schools • Institutionalized racism/disproportionate
minority contact with police
Which may lead to: • Violence, causing fear
and stress • Isolation/lack of
community involvement/distrust
• Environmental health disparities
• Lack of information about available resources
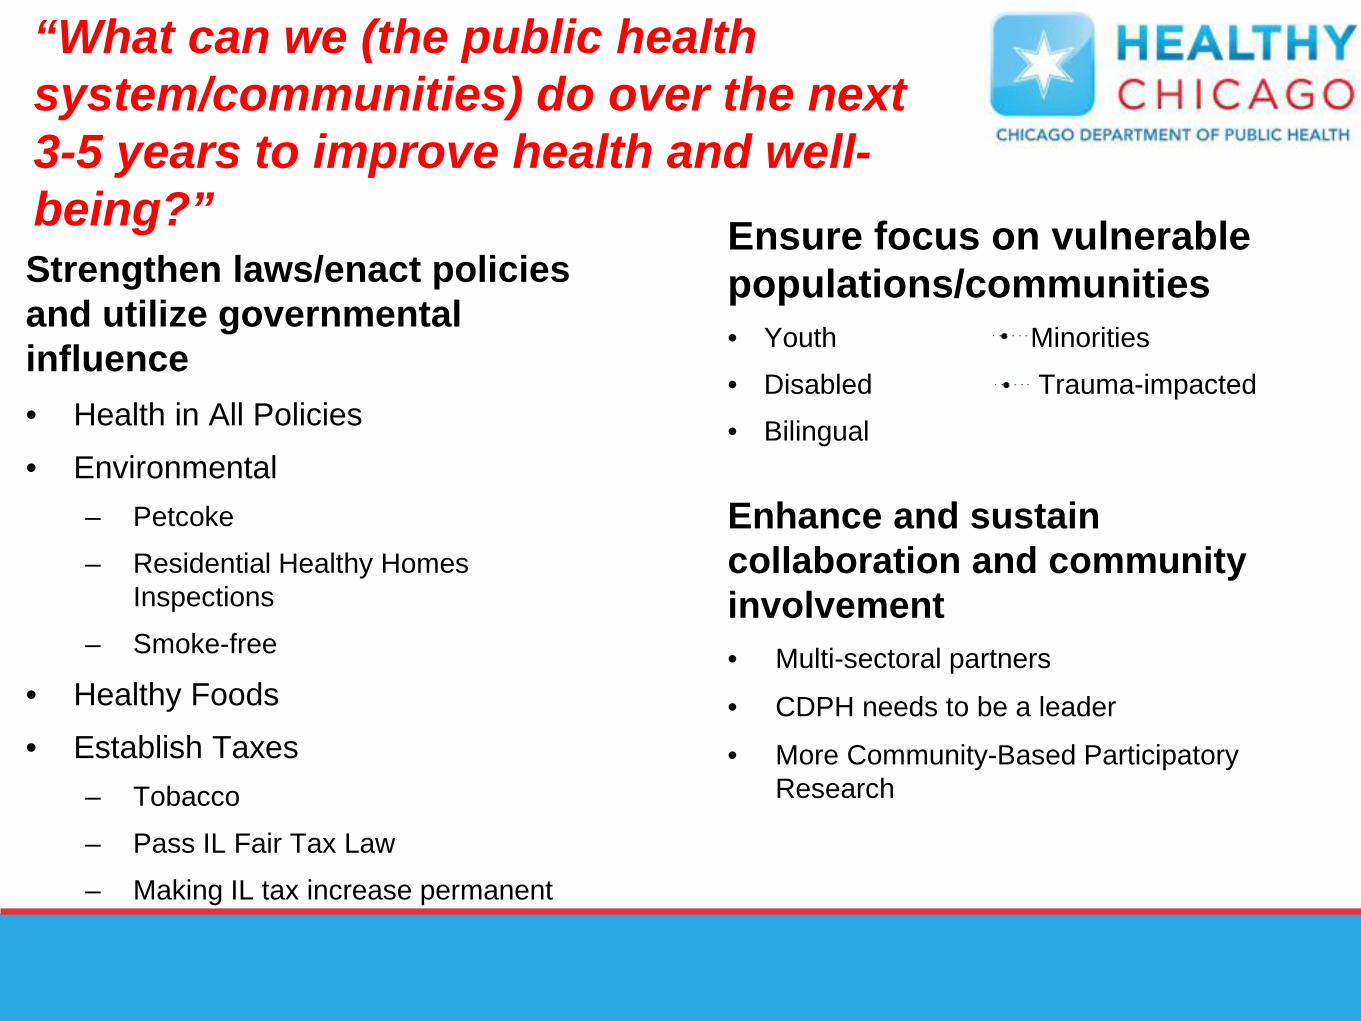
“What can we (the public health system/communities) do over the next 3-5 years to improve health and well-being?” Ensure focus on vulnerable
populations/communities • Youth Minorities
• Disabled Trauma-impacted
• Bilingual
Enhance and sustain collaboration and community involvement • Multi-sectoral partners
• CDPH needs to be a leader
• More Community-Based Participatory Research
Strengthen laws/enact policies and utilize governmental influence • Health in All Policies • Environmental
– Petcoke
– Residential Healthy Homes Inspections
– Smoke-free
• Healthy Foods • Establish Taxes
– Tobacco
– Pass IL Fair Tax Law
– Making IL tax increase permanent
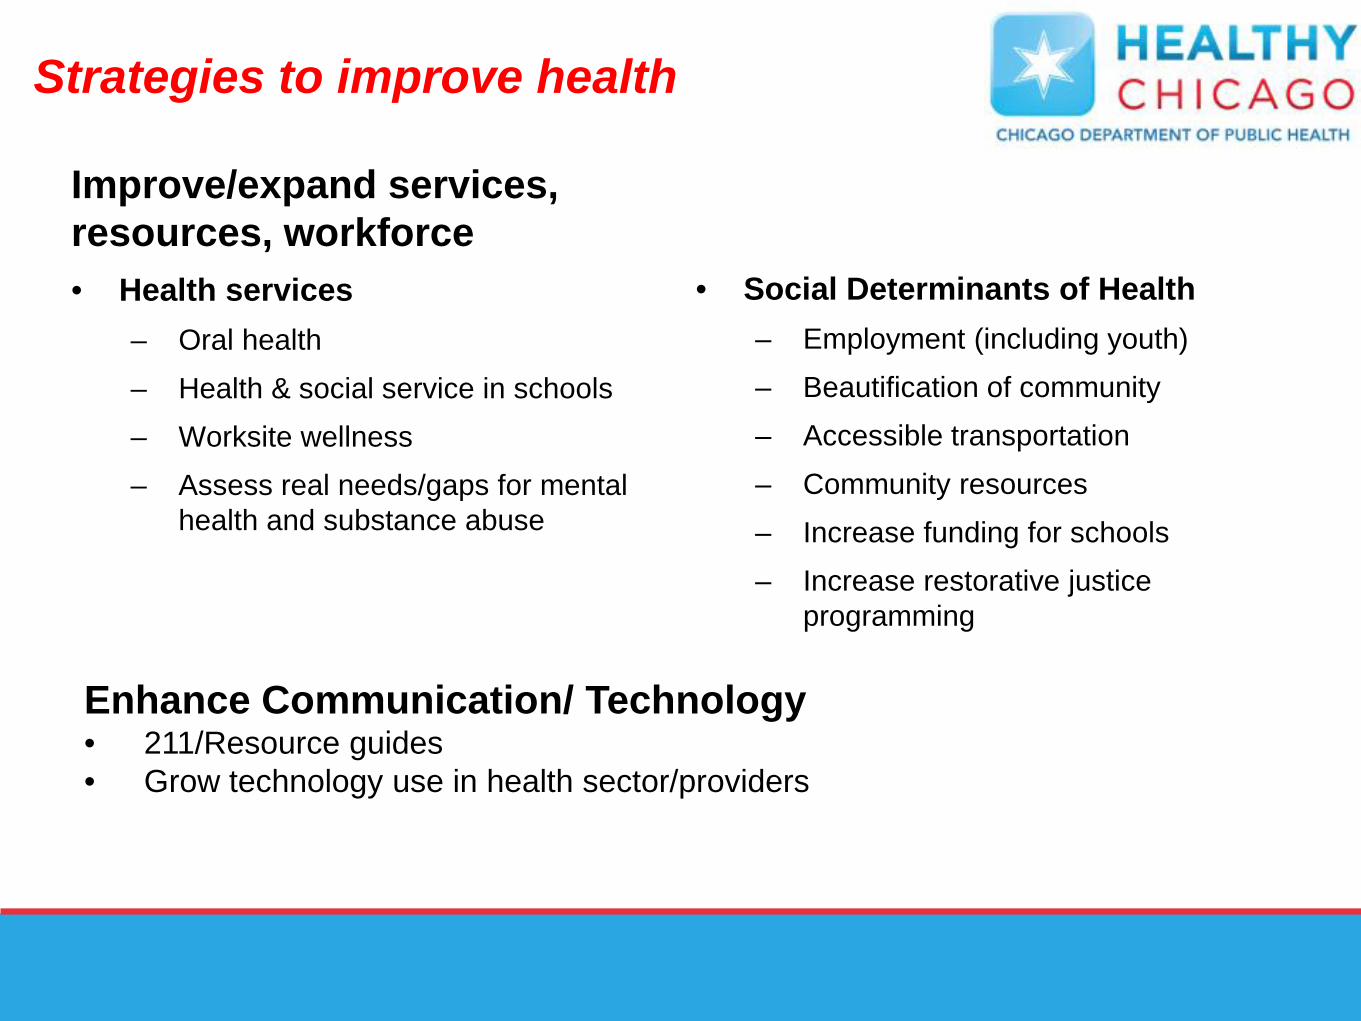
Strategies to improve health
Improve/expand services, resources, workforce • Health services
– Oral health – Health & social service in schools – Worksite wellness – Assess real needs/gaps for mental
health and substance abuse
• Social Determinants of Health – Employment (including youth) – Beautification of community – Accessible transportation – Community resources – Increase funding for schools – Increase restorative justice
programming
Enhance Communication/ Technology • 211/Resource guides • Grow technology use in health sector/providers
Discussion and Feedback
Cross Cutting Themes
• Inequity connected to poor health
• System mistrust and distrust
• Community Infrastructure and Needs
• Community Involvement/Engagement
• Policy and Resources