Embed Size (px)
Citation preview
CommunityEngagement (CE)
Database Report

2 Database Report 2017
Contents
1. Introduction 4
Background and context 4
2. CE Database in the UWC context 5
The CE database 5
CE projects in faculties and offices 5
3. The database in the context of CE model 15
UWC CE projects are linked to Boyer’s
Scholarship of Engagement 15
4. University core functions 18
CE core function 18
CE core function 19
5. CE partnerships 23
Types of partnerships in the database 20
Geographical location of partners on database 21
Map 1. UWC CE globally 23
Map 2. CE partnerships in the United
States of America 24
Map 3. CE partnerships in Europe 25
Map 4. CE partnerships in Africa 25
Map 5. CE partnerships in Southern Africa 26
Map 6. CE partnerships in South Africa 26
Map 8. CE partnerships in the City of
Cape Town 27
Map 7. CE partnerships in the Western Cape 27
UWC CE monetary value 28
A summary the partnerships and engagement
hours per week for 30
The Rector’s office 30
The DVC: Academic office 31
The DVC: Research & innovation 32
The DVC: Student development and support
services 33
The Faculty of Arts 34
The Faculty of Community and Health Sciences 35
The Faculty of Dentistry 36
The Faculty of Economic and Management
Sciences 37
The Faculty of Education 38
The Faculty of Law 39
The Faculty of Natural Science 40
Conclusion 41
Reference 42

3Database Report 2017
4 Database Report 2017
1. IntroductionThe University of the Western Cape (UWC) Community Engagement
(CE) database was launched in December 2014. It highlights
information relating to CE projects in faculties, schools and support
units at the university. It contains projects across the UWC campus
and offers access to over one hundred UWC CE projects. The database
is accessible to everyone both on and off campus. All UWC staff can
access it by logging in with their Novell user name and password,
while anyone else can access it simply by registering as a new user.
Background and contextIn 2010, the UWC celebrated fifty years as a higher education
institution. In these fifty years,the university has grown from its
humble beginnings to the vibrant environment of today, hosting
seven faculties with several schools, departments, centres and units.
Each of these entities responds to the institution’s vision and mission.
They include a wide range of CE activities facilitating community
development in one form or another.
The university has grown to such an extent that units within faculties
are often unaware of each other’s engagements, where they take
place, or what their key objectives are in being involved in community
development projects. While there was already an abundance
of CE knowledge and a wide range of projects at UWC, there was
an urgent need to share such knowledge and to coordinate and
align the projects, in order to make optimal use of our resources.
A knowledge management and sharing system for CE was clearly a
necessity at UWC.
The Community Engagement Unit (CEU), in partnership with the
Centre for Innovative Educational and Communication Technologies
(CIECT) within the Office of Deputy Vice Chancellor (Academic),
were therefore tasked with undertaking a special project on the
identification of CE activities across the UWC. The information
gathered was developed into a database which gives a brief overview
of each project and which can be accessed through the CE website or
by using the link https://ceudatabase.uwc.ac.za/portal
In effect, the aim of the CE database was to develop a resource bank
based on the collected information, highlighting the purposes of the
university’s CE activities. It also facilitates partnerships, optimises the
use of resources, and identifies placement sites which could enhance
CE delivery as it seeks to align with the vision and mission of the
university.

5Database Report 2017
2. CE database in the UWC context
The CE database both captures information and provides it on CE
projects, sourced from the office of the Rector, DVC Academic, DVC
Research, DVC Student Development and Support, and all seven
faculties. However, it is important to note that projects can only be
captured on the database if project managers and coordinators have
supplied the necessary information to the CEU.
Figure 1 only represents projects captured in the database
The CE database
Showcases CE activities.
Serves as a promotional/marketing tool, as it presents viewers (both on and off campus) with information about UWC CE activities and development.
Presents an opportunity to access information about engagement activities on and off campus.
Provides cross-links and references to CE activities.
Provides a platform for knowledge sharing and coordination.
Provides potential development of partnerships on and off campus
Bottom: CE Projects in faculties and offices
■ The Faculty of Arts
■ The Faculty of Community and Health Sciences
■ The Faculty of Dentistry
■ The Faculty of Economic and Management Sciences
■ The Faculty of Education
■ The Faculty of Law
■ The Faculty of Natural Sciences
■ Rector
■ DVC: Academic
■ DVC: Research & Innovation
■ DVC: Student Development and Support Services
UWCCE Projects
97
25%
2%
12%
7%4%
13%
8%
9%
3%
10% 7%
FIGURE 1

6 Database Report 2017
Figure 1 shows all the faculties and offices represented in the database
and indicates the following:
8% of CE projects were from the Office of Rector
9% of CE projects were from the Office of DVC: Academic
3% of CE projects were from the Office of DVC:
Research & innovation
10% of CE projects were from the Office of DVC: Student
Development & Support Services
7% of CE projects were from the Faculty of Arts
25% of CE projects were from the Faculty of Community and
Health Science
2% of CE projects were from the Faculty of Dentistry
12% of CE projects were from the Faculty of Economic and
Management Sciences
7% of CE projects were from the Faculty of Education
4% of CE projects were from the Faculty of Law
13% of CE projects were from the Faculty of Natural Sciences
SummaryAs indicated in figure 1, the Faculty of Community and Health
Sciences has the most projects captured on the database. This may
be a reflection of the learning and teaching requirements of this
particular faculty, which involve a community orientated component.
In addition, Figure 1 also indicates that the Faculty of
Dentistry has the least number of projects captured; however, this
only indicates the number of projects captured, not the number of
engagements in which the faculty was involved. This is better reflected
in the summary of the partnerships and engagement hours section of
the report.
7Database Report 2017
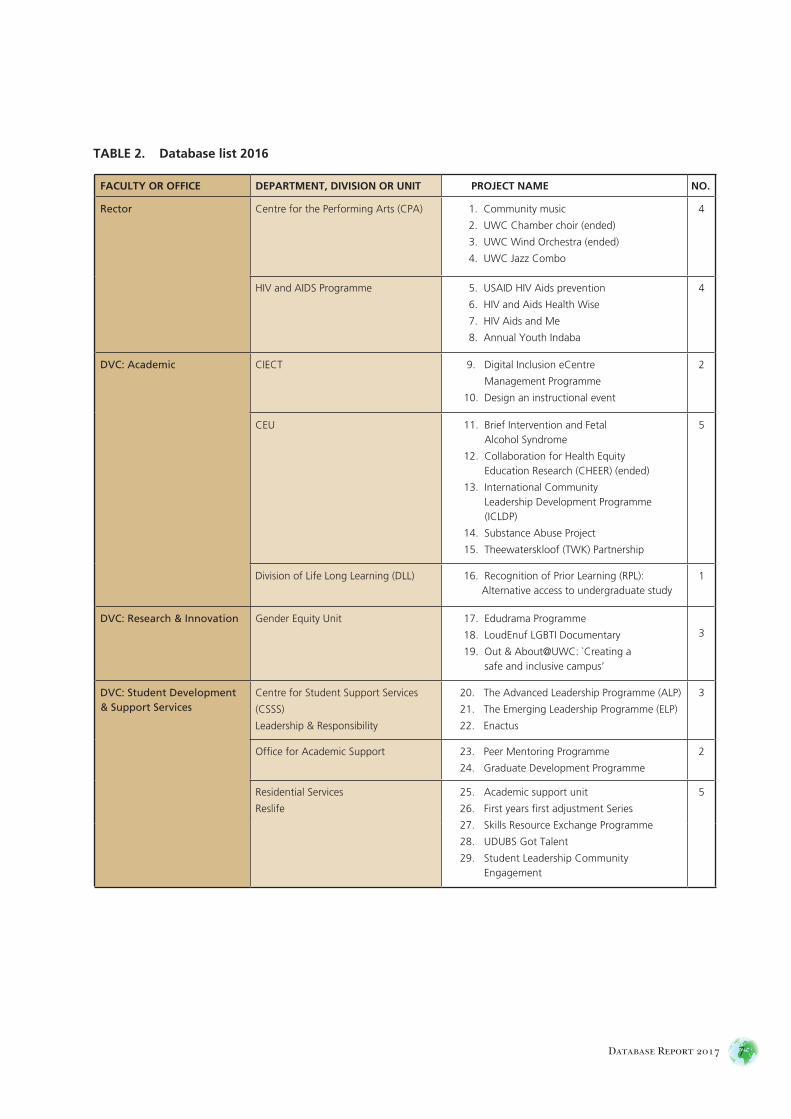
FACULTY OR OFFICE DEPARTMENT, DIVISION OR UNIT PROJECT NAME NO.
Rector Centre for the Performing Arts (CPA) 1. Community music
2. UWC Chamber choir (ended)
3. UWC Wind Orchestra (ended)
4. UWC Jazz Combo
4
HIV and AIDS Programme 5. USAID HIV Aids prevention
6. HIV and Aids Health Wise
7. HIV Aids and Me
8. Annual Youth Indaba
4
DVC: Academic CIECT 9. Digital Inclusion eCentre
Management Programme
10. Design an instructional event
2
CEU 11. Brief Intervention and Fetal Alcohol Syndrome
12. Collaboration for Health Equity Education Research (CHEER) (ended)
13. International Community Leadership Development Programme
(ICLDP)
14. Substance Abuse Project
15. Theewaterskloof (TWK) Partnership
5
Division of Life Long Learning (DLL) 16. Recognition of Prior Learning (RPL): Alternative access to undergraduate study
1
DVC: Research & Innovation Gender Equity Unit 17. Edudrama Programme
18. LoudEnuf LGBTI Documentary
19. Out & About@UWC: `Creating a safe and inclusive campus’
3
DVC: Student Development & Support Services
Centre for Student Support Services
(CSSS)
Leadership & Responsibility
20. The Advanced Leadership Programme (ALP)
21. The Emerging Leadership Programme (ELP)
22. Enactus
3
Office for Academic Support 23. Peer Mentoring Programme
24. Graduate Development Programme
2
Residential Services
Reslife
25. Academic support unit
26. First years first adjustment Series
27. Skills Resource Exchange Programme
28. UDUBS Got Talent
29. Student Leadership Community Engagement
5
TABLE 2. Database list 2016

8 Database Report 2017
The Faculty of Arts Departement van Afrikaans en Nederlands
30. Supporting creative writing
( Currently not active)
1
Department of Library and
Information Science
31. City of Cape Town continuous professional development for librarians
32. Preservation management workshop
2
Department of Religion andTheology
33. Programme for Lay Theological Education (PLATE)
1
Women and Gender Studies 34. ICTs and Women's Political Participation (ended)
1
The Centre for Humanities Research 35. Dullah Omar Centre
36. The Factory of the Arts
2
The Faculty of Community and Health Sciences
Department of Dietetics 37. Community Nutrition 402 Internship
1
Department of OccupationalTherapy
38. Cape Metro Health – Mental Health Support Programme (not active)
39. Fisantekraal – Community development projects
40. Health Promoting Schools (not active)
41. Ikamva Labantu Youth Development Programme (not active)
4
Department of Physiotherapy 42. Two Oceans Academy Outreach 1
Department of Psychology 43. A community’s participation in the development of a community-based substance abuse intervention
44. Exploring the effects of prenatal
methamphetamine exposure on the development of children
45. Inclusive identity across cultures
46. Reducing substance abuse in Vredendal
47. Sports skills for life
48. Substance abuse research
49. The development of a family resilience programme for families in a rural community, South Africa
50. The development and validation of a
measure of associated factors
8
Department of Social Work 51. 2nd Year Fieldwork Programme
52. Fourth Year BSW Student Practice
53. Intermediate Fieldwork (student placements)
54. Vredendal North, Family Resilience Project
55. Theewaterskloof (TKW) Project (not active)
5
Interdisciplinary Centre forExcellence for Sports Science andDevelopment (ICESSD)
56. Sport and Recreation for Community 1
TABLE 2. Database list 2016 contd.
9Database Report 2017
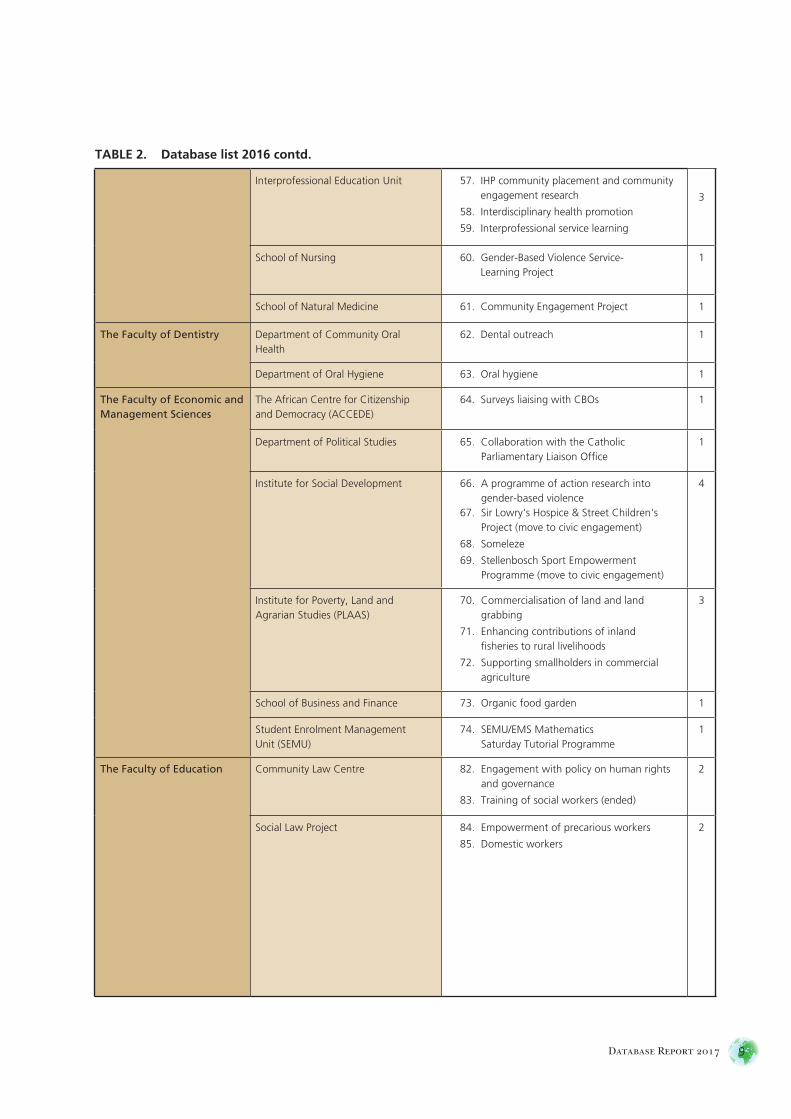
Interprofessional Education Unit 57. IHP community placement and community engagement research
58. Interdisciplinary health promotion
59. Interprofessional service learning
3
School of Nursing 60. Gender-Based Violence Service- Learning Project
1
School of Natural Medicine 61. Community Engagement Project 1
The Faculty of Dentistry Department of Community OralHealth
62. Dental outreach 1
Department of Oral Hygiene 63. Oral hygiene 1
The Faculty of Economic andManagement Sciences
The African Centre for Citizenshipand Democracy (ACCEDE)
64. Surveys liaising with CBOs 1
Department of Political Studies 65. Collaboration with the Catholic Parliamentary Liaison Office
1
Institute for Social Development 66. A programme of action research into gender-based violence67. Sir Lowry's Hospice & Street Children's Project (move to civic engagement)
68. Someleze
69. Stellenbosch Sport Empowerment Programme (move to civic engagement)
4
Institute for Poverty, Land andAgrarian Studies (PLAAS)
70. Commercialisation of land and land grabbing
71. Enhancing contributions of inland fisheries to rural livelihoods
72. Supporting smallholders in commercial agriculture
3
School of Business and Finance 73. Organic food garden 1
Student Enrolment ManagementUnit (SEMU)
74. SEMU/EMS Mathematics Saturday Tutorial Programme
1
The Faculty of Education Community Law Centre 82. Engagement with policy on human rights and governance
83. Training of social workers (ended)
2
Social Law Project 84. Empowerment of precarious workers
85. Domestic workers
2
TABLE 2. Database list 2016 contd.

10 Database Report 2017
The Faculty of
Natural Sciences
Department of Computer Science 86. Deaf communications
87. Rural telephony
2
Nature Reserve 88. Outreach Greening Programme
89. Environmental education
90. Research support
3
Agriculture Research Council (ARC) 91. Climate change knowledge and adaptations among livestock farming communities in the Northern and Western Cape Provinces (ended)
1
Department of Mathematics 92. Teacher Enrichment Course (FET Mathematics)
1
Department of Statistics and
Population Studies
93. Maths4Stats (ended) 1
School of Pharmacy 94. School health care
95. Environmental health
96. Clinical skills development
97. Pharmaceutical care
4
TABLE 2. Database list 2016 contd.
FACULTY OR OFFICE DEPARTMENT, DIVISION OR UNIT PROJECT NAME
Rector HIV and AIDS Programme 1. Truancy Programme
2. Healthwise Zambia
4
DVC: Student Development &Support Services
CSSSOffice for Academic Support
3. The Personal Mastery and Empowerment 1
The Faculty ofNatural Sciences
ARC 4. Assessing the drivers of livestock production in communal areas in Northern Cape
1
TABLE 3. CEU Projects 2017
11Database Report 2017
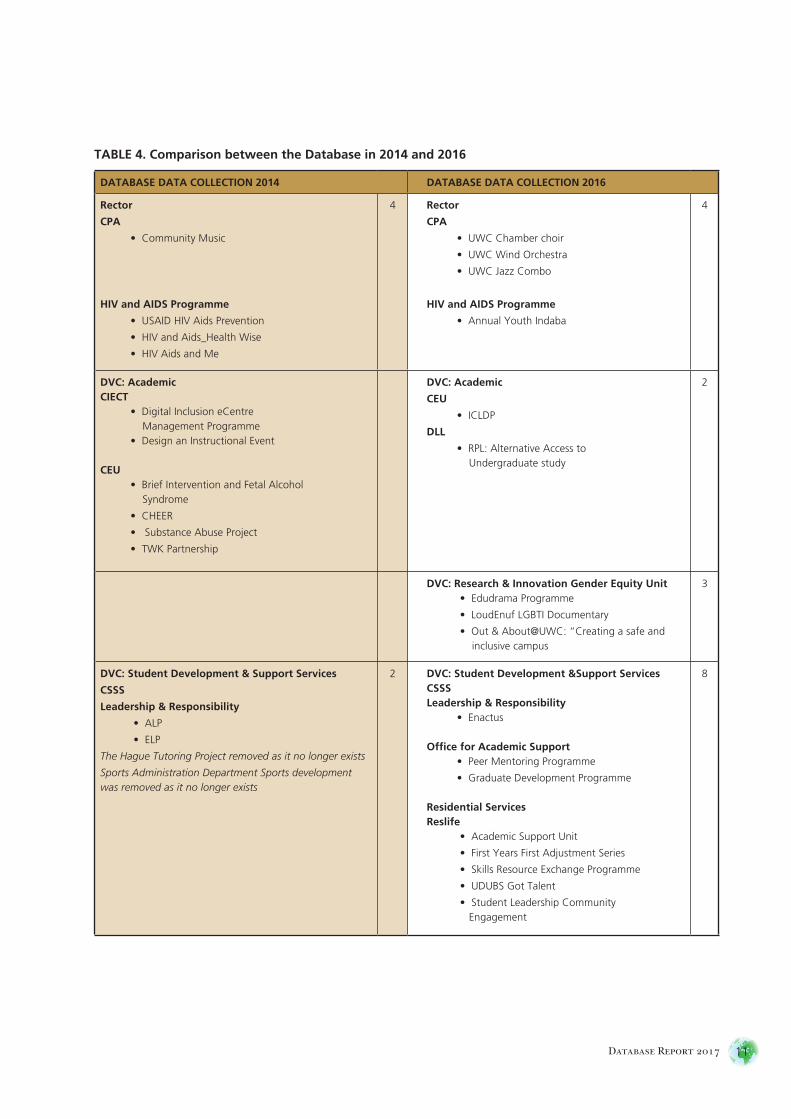
DATABASE DATA COLLECTION 2014 DATABASE DATA COLLECTION 2016
Rector
CPA
• Community Music
HIV and AIDS Programme
• USAID HIV Aids Prevention
• HIV and Aids_Health Wise
• HIV Aids and Me
4 Rector
CPA
• UWC Chamber choir
• UWC Wind Orchestra
• UWC Jazz Combo
HIV and AIDS Programme
• Annual Youth Indaba
4
DVC: AcademicCIECT
• Digital Inclusion eCentre Management Programme• Design an Instructional Event
CEU• Brief Intervention and Fetal Alcohol Syndrome
• CHEER
• Substance Abuse Project
• TWK Partnership
DVC: Academic
CEU
• ICLDP
DLL
• RPL: Alternative Access to Undergraduate study
2
DVC: Research & Innovation Gender Equity Unit • Edudrama Programme
• LoudEnuf LGBTI Documentary
• Out & About@UWC: “Creating a safe and inclusive campus
3
DVC: Student Development & Support Services
CSSS
Leadership & Responsibility
• ALP
• ELP
The Hague Tutoring Project removed as it no longer exists
Sports Administration Department Sports development was removed as it no longer exists
2 DVC: Student Development &Support ServicesCSSSLeadership & Responsibility
• Enactus
Office for Academic Support• Peer Mentoring Programme
• Graduate Development Programme
Residential ServicesReslife
• Academic Support Unit
• First Years First Adjustment Series
• Skills Resource Exchange Programme
• UDUBS Got Talent
• Student Leadership Community Engagement
8
TABLE 4. Comparison between the Database in 2014 and 2016
12 Database Report 2017
The Faculty of Arts
Departement van Afrikaans en Nederlands
• Supporting creative writing
Department of Religion and Theology
• PLATE
Women and Gender Studies
• ICTs and women's political participation
3 The Faculty of Arts
Department of Library and information science
• City of Cape Town continuous professional development for librarians
• Preservation management workshop
The Centre for Humanities Research
• Dullah Omar Centre
• The Factory of the Arts
4
The Faculty of Community and Health Sciences
Department of Occupational Therapy
• Cape Metro Health – Mental Health Support Programme
Department of Physiotherapy
• Two Oceans Academy Outreach
Department of Psychology
• Substance abuse research
• Reducing substance abuse in Vredendal
Department of Social Work
• Fourth year BSW student practice
• Intermediate fieldwork (student placements)
• Vredendal North, Family Resilience Project
• TKW Project
The Diatesda Oiknonia Welfare Project was removed as it no longer exists
ICESSD
• Sport and recreation for community development
Interprofessional Education Unit
• IHP community placement and community engagement research
• Interdisciplinary health promotion
• Interprofessional service learning
School of Nursing
• Gender-Based Violence Service-Learning Project
School of Natural Medicine
• TWK community engagement project
14 The Faculty of Community and Health Sciences
Department of Occupational Therapy
• Cape Metro Health – Mental Health Support Programme
• Fisantekraal – Community development projects
• Fisantekraal – Community development projects
Department of Psychology
• A community’s participation in the development of a community-based substance abuse intervention
• Exploring the effects of prenatal methamphetamine exposure on the development of children
• Inclusive identity across cultures
• Sports skills for life
• The development of a family resilience programme for families in a rural community, South Africa
• The development and validation of a measure of associated factors
Department of Social Work
• 2nd Year fieldwork programme
10
The Faculty of Dentistry
Department of Community Oral Health
• Dental outreach
Department of Oral Hygiene
• Oral hygiene
2
TABLE 4. Comparison between the Database in 2014 and 2016 contd.

13Database Report 2017
The Faculty of Economic and Management Sciences
ACCEDE
• Surveys liaising with CBO’s
Department of Political Studies
• Collaboration with the Catholic Parliamentary
Liaison Office
SEMU
• SEMU/EMS Mathematics Saturday
Tutorial Programme
3 The Faculty of Economic and Management Sciences
Institute for Social Development
• A programme of action research into
gender-based violence
• Sir Lowry's Hospice & Street Children' Project
• Someleze
• Stellenbosch Sport Empowerment Programme
PLAAS
• Commercialisation of land and land grabbing
• Enhancing contributions of inland fisheries to rural livelihoods
• Supporting smallholders in commercial agriculture
School of Business and Finance
• Organic food garden
8
The Faculty of Education UWC-SLCA
• Construction of UWC Science Learning Centres (laboratorium)
• FET and GET training in science education
• Science competition
• Upgrading of science educators in the Eastern
Cape
4 The Faculty of Education UWC-SLCA
• DST National Science Week
• Women in mathematics
Educational Psychology
• Teacher Well-Being Project
3
The Faculty of LawCommunity Law Centre
• Engagement with policy on human rights and governance
• Training of social workers
Social Law Project
• Empowerment of precarious workers
3 The Faculty of LawSocial Law Project
• Domestic workers
The Faculty of Natural Sciences
Department of Computer Science
• Deaf Communications
• Rural Telephony
Department of Mathematics
• Teacher Enrichment Course (FET Mathematics)
Department of Statistics and Population Studies
• Maths4Stats
School of Pharmacy
• Service learning (this has been expanded to what we see in 2016)
The Faculty of Natural Sciences
Nature Reserve
• Outreach Greening Programme
• Environmental Education
• Research Support
ARC
• Climate change knowledge and adaptations amongst livestock farming communities in the Northern and Western Cape Provinces
School of Pharmacy
• School Health Care
• Environmental Health
• Clinical skills development
• Pharmaceutical Care
TOTAL 46 TOTAL 51
TABLE 4. Comparison between the Database in 2014 and 2016 contd.
14 Database Report 2017
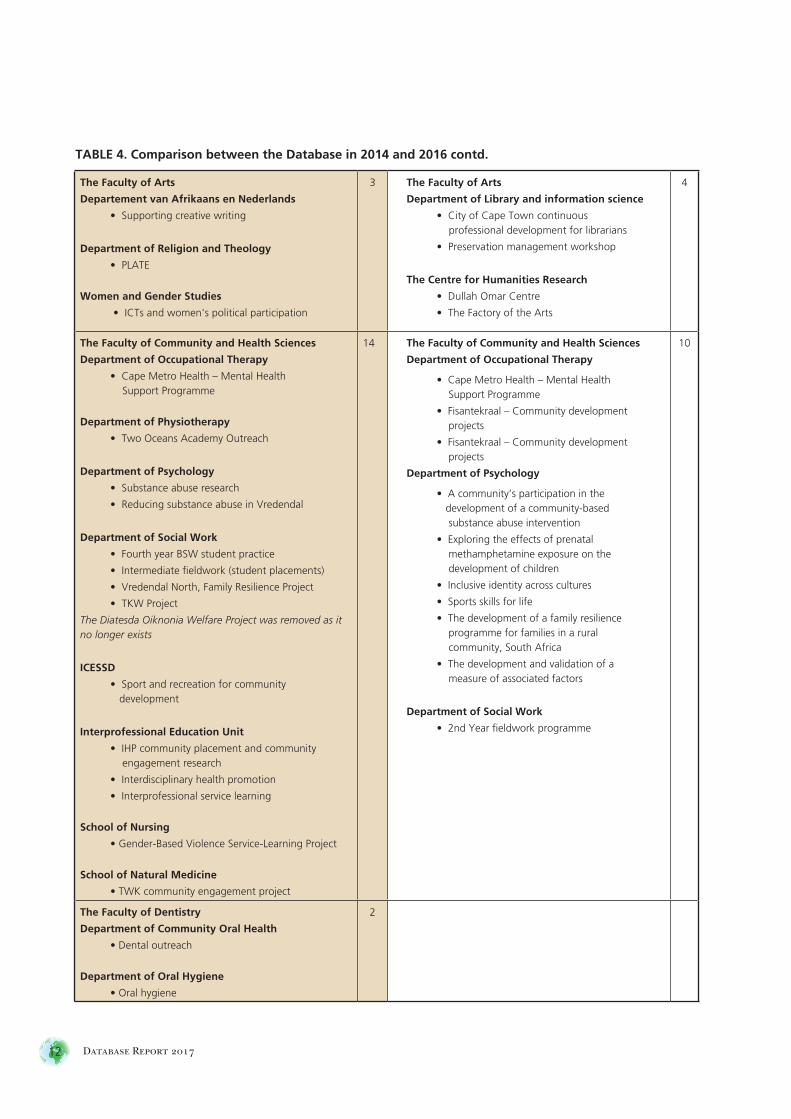
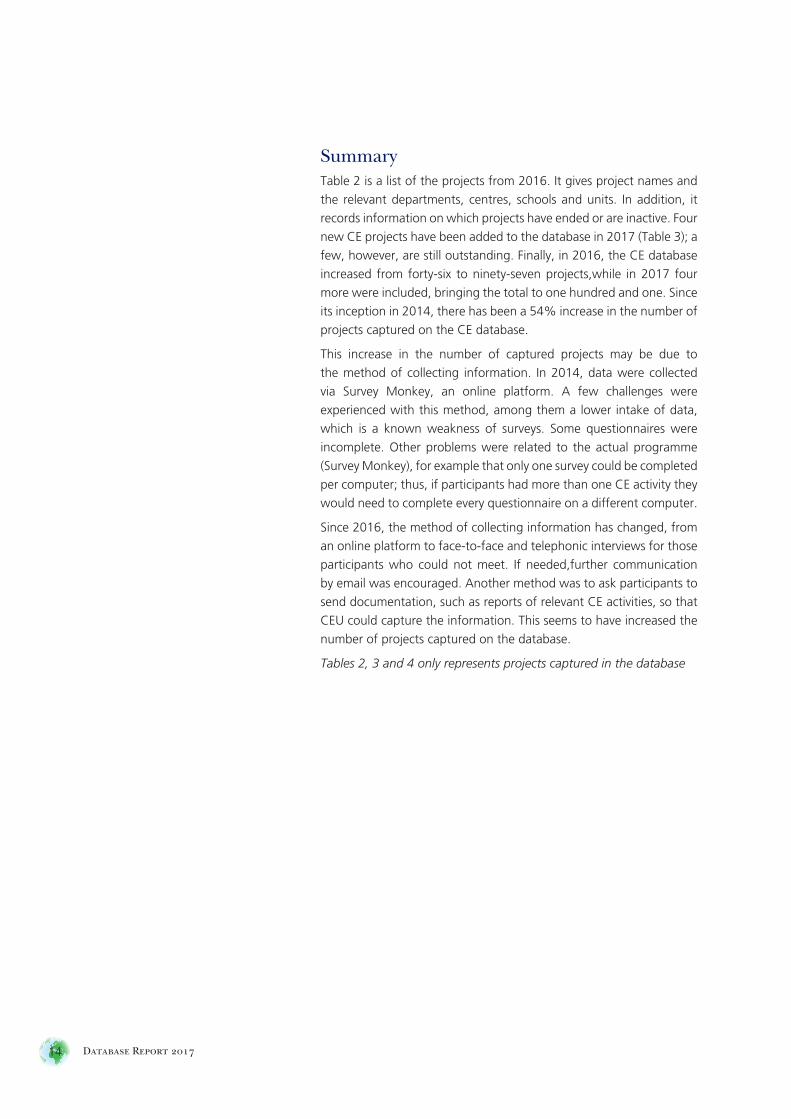
SummaryTable 2 is a list of the projects from 2016. It gives project names and
the relevant departments, centres, schools and units. In addition, it
records information on which projects have ended or are inactive. Four
new CE projects have been added to the database in 2017 (Table 3); a
few, however, are still outstanding. Finally, in 2016, the CE database
increased from forty-six to ninety-seven projects,while in 2017 four
more were included, bringing the total to one hundred and one. Since
its inception in 2014, there has been a 54% increase in the number of
projects captured on the CE database.
This increase in the number of captured projects may be due to
the method of collecting information. In 2014, data were collected
via Survey Monkey, an online platform. A few challenges were
experienced with this method, among them a lower intake of data,
which is a known weakness of surveys. Some questionnaires were
incomplete. Other problems were related to the actual programme
(Survey Monkey), for example that only one survey could be completed
per computer; thus, if participants had more than one CE activity they
would need to complete every questionnaire on a different computer.
Since 2016, the method of collecting information has changed, from
an online platform to face-to-face and telephonic interviews for those
participants who could not meet. If needed,further communication
by email was encouraged. Another method was to ask participants to
send documentation, such as reports of relevant CE activities, so that
CEU could capture the information. This seems to have increased the
number of projects captured on the database.
Tables 2, 3 and 4 only represents projects captured in the database

15Database Report 2017
3. The database in the context of the CE modelThe process of CE involves an evolution and transformation of
knowledge, as opposed to the simple transfer of information from
one learning partner to another (Boyer, 2008). The CEU presented this
model as a theoretical framework for the CE activities at UWC. The
CEU researched various CE models, to find one which best suited UWC.
Boyer’s model was adopted because it closely matched the vision and
mission of UWC. There may yet be challenges, such as ensuring co-
creation and equity, but these should be seen as leading to discussions
on how best to integrate the model. Below is an overview of the five
scholarships of engagement.
• Scholarship of research aims at monitoring and evaluating the CE
process through a structured reflective praxis.
• Scholarship of integration aims at continuous facilitation integration
and promotion of CE through capacity building, mentoring and
coaching between role-players and stakeholders towards enhancing
partnerships.
• Scholarship of theory and practice aims at partnership and citizenry
building for the purpose of empowerment.
• Scholarship of application aims at facilitating sustainable communities
through the recognition of indigenous knowledge and resilience.
• Scholarship engagement facilitates an enabling environment for
sustainable communities through CE and has its foundation and
structure within Higher Education Institution frameworks.
HIGHER EDUCATION INSTITUTION(Policies, Mission, Ethos, etc, which GUIDE engagement)
SustainableCommunities
Partnership & Citizenry
Facilitation / Promotion
Monitoring and EvaluationScholarship of research
Scholarship of integration
Scholarship of Theory andPractice
Scholarship of Application
Scholarship of Engagement
16 Database Report 2017
SCHOLARSHIP PRACTICE
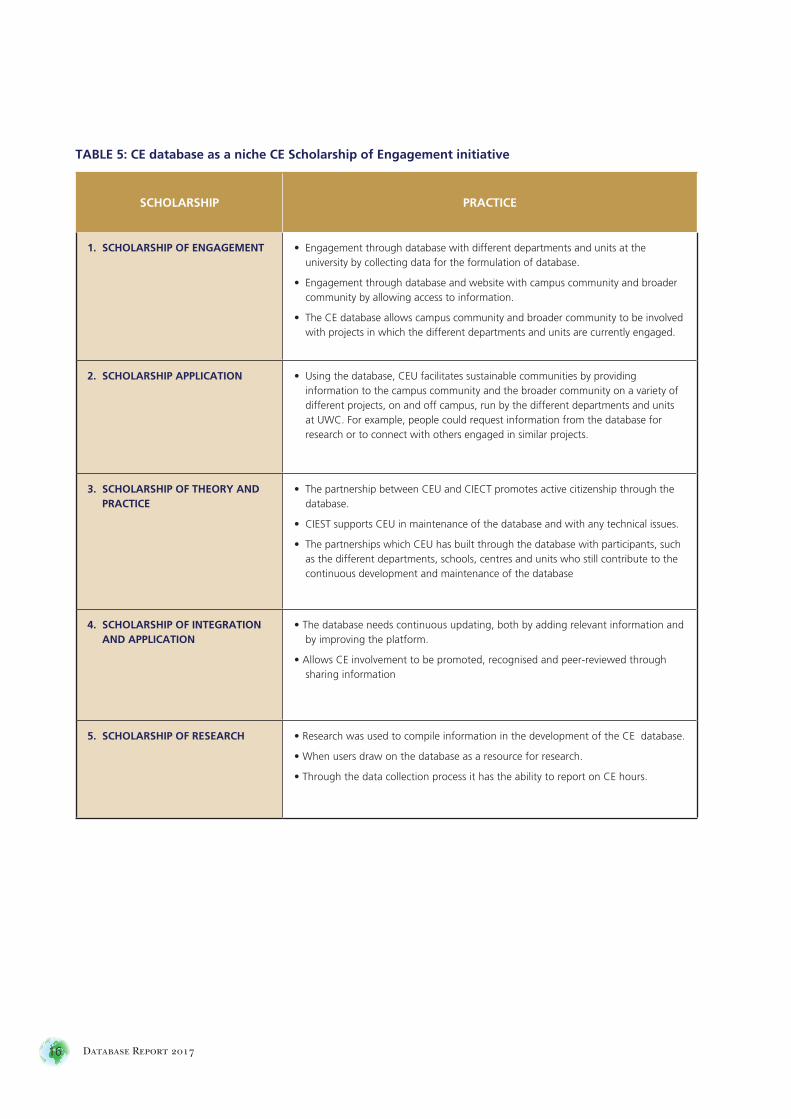
1. SCHOLARSHIP OF ENGAGEMENT • Engagement through database with different departments and units at the university by collecting data for the formulation of database.
• Engagement through database and website with campus community and broader community by allowing access to information.
• The CE database allows campus community and broader community to be involved with projects in which the different departments and units are currently engaged.
2. SCHOLARSHIP APPLICATION • Using the database, CEU facilitates sustainable communities by providing information to the campus community and the broader community on a variety of different projects, on and off campus, run by the different departments and units at UWC. For example, people could request information from the database for research or to connect with others engaged in similar projects.
3. SCHOLARSHIP OF THEORY AND PRACTICE
• The partnership between CEU and CIECT promotes active citizenship through the database.
• CIEST supports CEU in maintenance of the database and with any technical issues.
• The partnerships which CEU has built through the database with participants, such as the different departments, schools, centres and units who still contribute to the continuous development and maintenance of the database
4. SCHOLARSHIP OF INTEGRATION AND APPLICATION
• The database needs continuous updating, both by adding relevant information and by improving the platform.
• Allows CE involvement to be promoted, recognised and peer-reviewed through sharing information
5. SCHOLARSHIP OF RESEARCH • Research was used to compile information in the development of the CE database.
• When users draw on the database as a resource for research.
• Through the data collection process it has the ability to report on CE hours.
TABLE 5: CE database as a niche CE Scholarship of Engagement initiative

17Database Report 2017
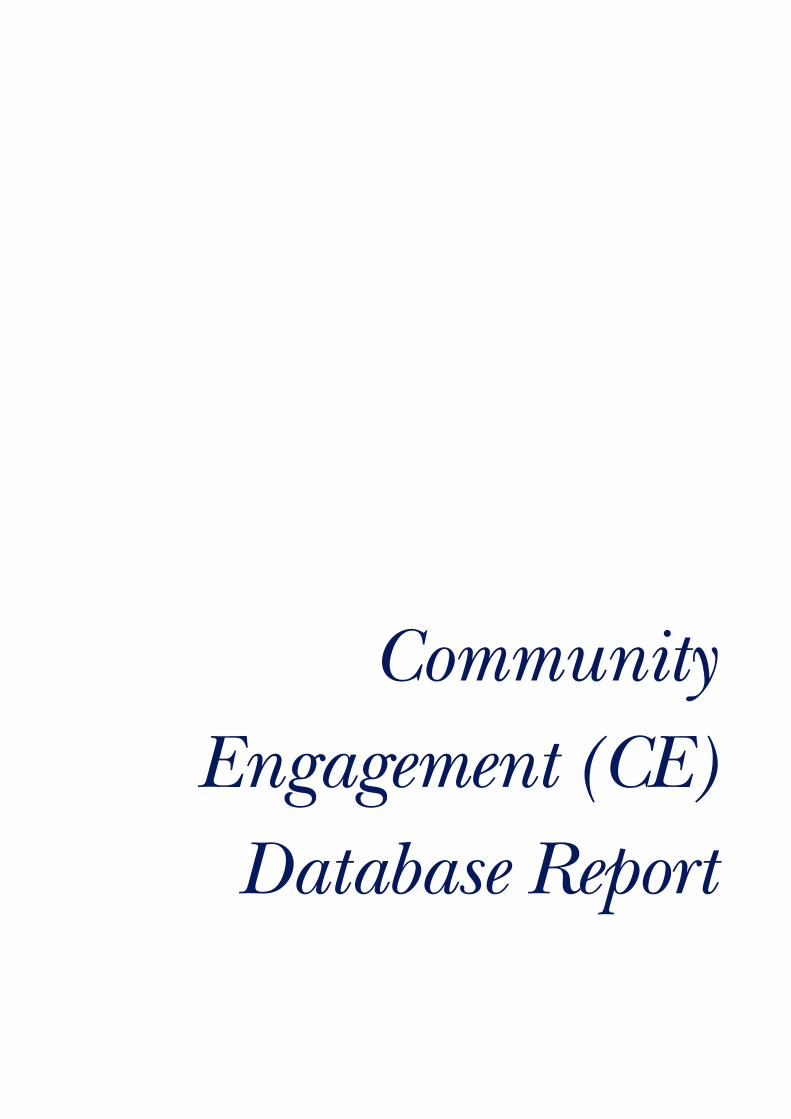
16 % of the projects are aligned with the
scholarship of research
25% of the projects are aligned with the
scholarship of integration
23% of the projects are aligned with the
scholarship of theory and practice
14% of the projects are aligned with the
scholarship of application
22% of the projects are aligned with the
scholarship engagement
SummaryTable 3 demonstrates how the database falls within the CEU model.
Figure 3 further indicates a linkage between the CE projects and the
scholarship of engagement. UWC CE projects are thus aligned with
the CEU model.
Above: UWC CE projects are linked to Boyer’s Scholarship of Engagement
■ Scholarship of research
■ Scholarship of integration
■ Scholarship of theory
■ Scholarship of application
■ Scholarship of engagement
FIGURE 3
Scholarships
16%22%
14%
23%
25%
18 Database Report 2017
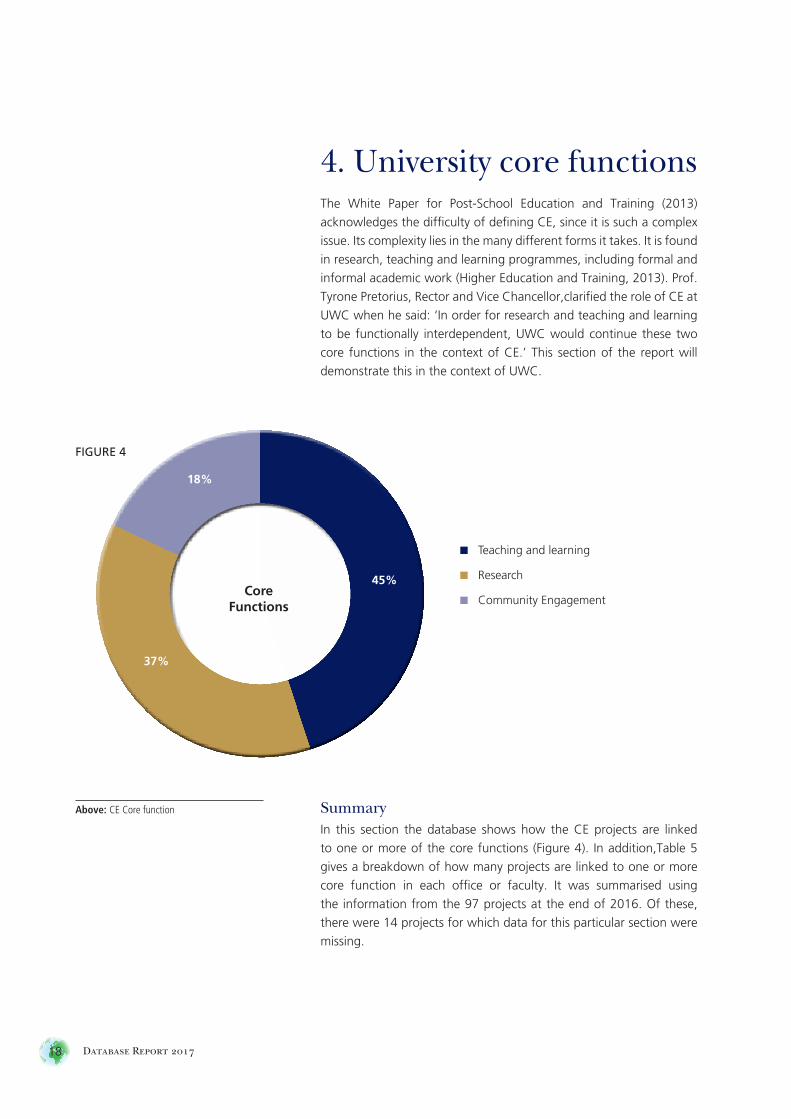
4. University core functionsThe White Paper for Post-School Education and Training (2013)
acknowledges the difficulty of defining CE, since it is such a complex
issue. Its complexity lies in the many different forms it takes. It is found
in research, teaching and learning programmes, including formal and
informal academic work (Higher Education and Training, 2013). Prof.
Tyrone Pretorius, Rector and Vice Chancellor,clarified the role of CE at
UWC when he said: ‘In order for research and teaching and learning
to be functionally interdependent, UWC would continue these two
core functions in the context of CE.’ This section of the report will
demonstrate this in the context of UWC.
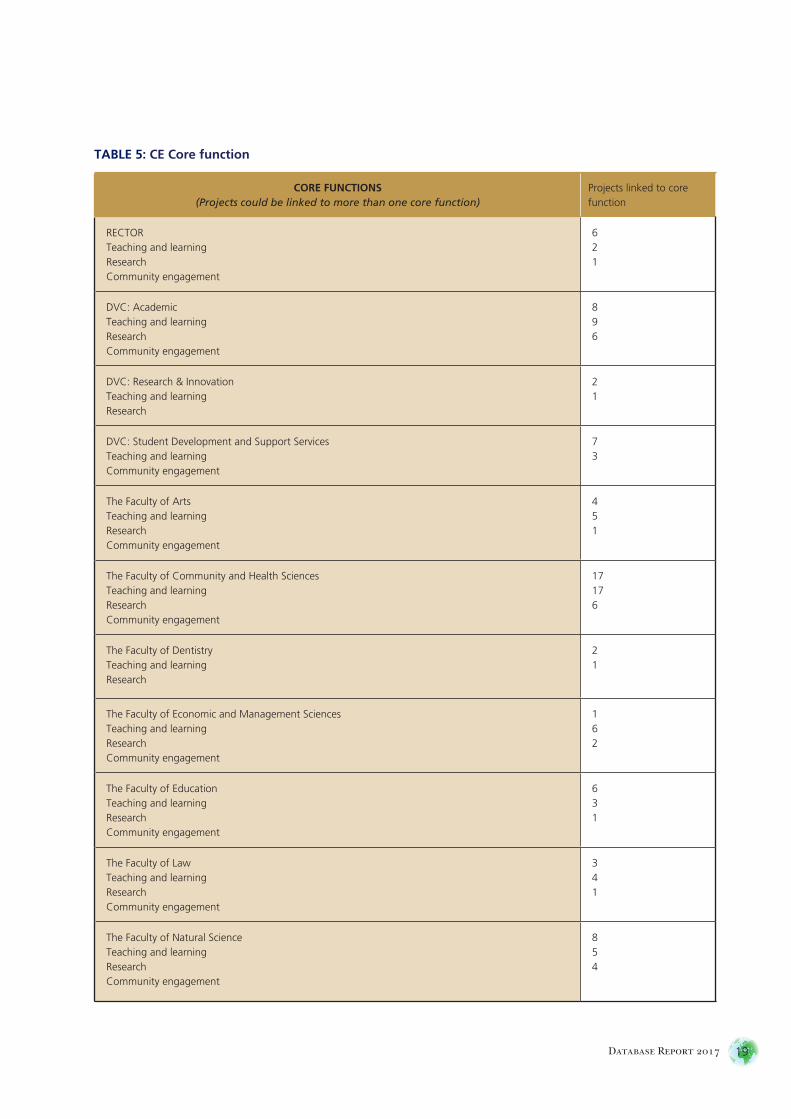
SummaryIn this section the database shows how the CE projects are linked
to one or more of the core functions (Figure 4). In addition,Table 5
gives a breakdown of how many projects are linked to one or more
core function in each office or faculty. It was summarised using
the information from the 97 projects at the end of 2016. Of these,
there were 14 projects for which data for this particular section were
missing.
CoreFunctions
18%
37%
45%
■ Teaching and learning
■ Research
■ Community Engagement
FIGURE 4
Above: CE Core function
19Database Report 2017
CORE FUNCTIONS(Projects could be linked to more than one core function)
Projects linked to core function
RECTORTeaching and learningResearchCommunity engagement
621
DVC: AcademicTeaching and learningResearchCommunity engagement
896
DVC: Research & InnovationTeaching and learningResearch
21
DVC: Student Development and Support ServicesTeaching and learningCommunity engagement
73
The Faculty of ArtsTeaching and learningResearchCommunity engagement
451
The Faculty of Community and Health SciencesTeaching and learningResearchCommunity engagement
17176
The Faculty of DentistryTeaching and learningResearch
21
The Faculty of Economic and Management SciencesTeaching and learningResearchCommunity engagement
162
The Faculty of EducationTeaching and learningResearchCommunity engagement
631
The Faculty of LawTeaching and learningResearchCommunity engagement
341
The Faculty of Natural ScienceTeaching and learningResearchCommunity engagement
854
TABLE 5: CE Core function
20 Database Report 2017
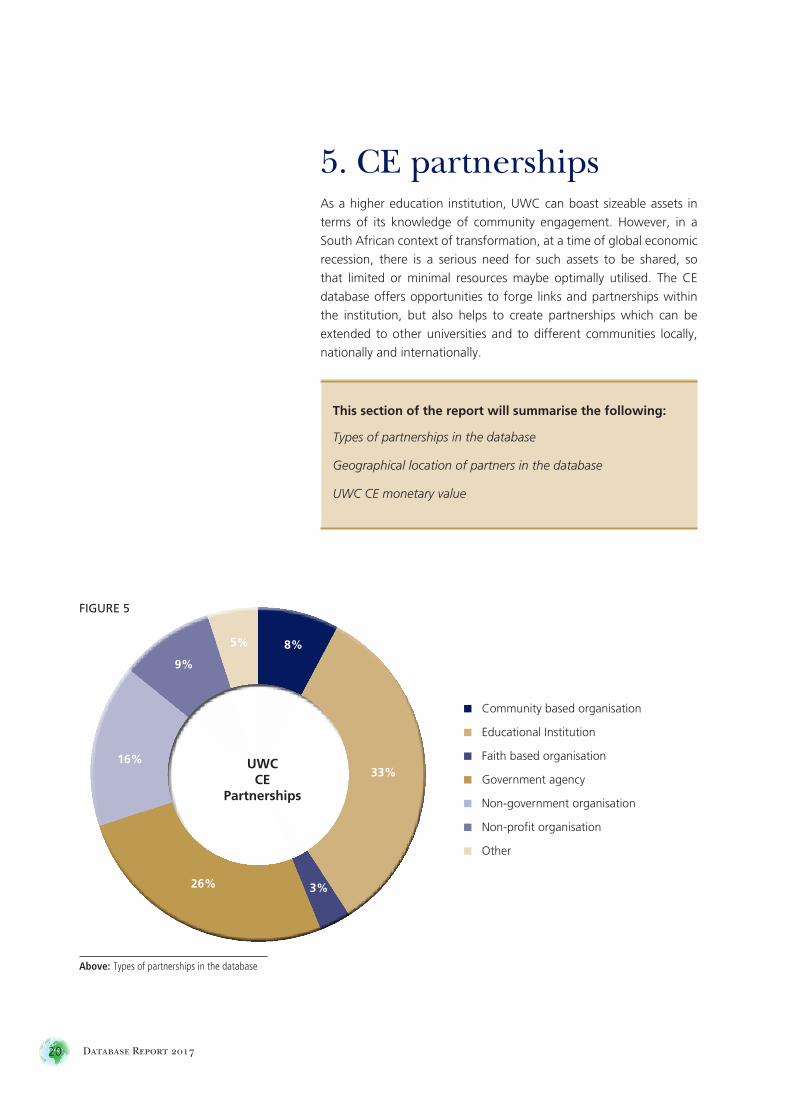
5. CE partnershipsAs a higher education institution, UWC can boast sizeable assets in
terms of its knowledge of community engagement. However, in a
South African context of transformation, at a time of global economic
recession, there is a serious need for such assets to be shared, so
that limited or minimal resources maybe optimally utilised. The CE
database offers opportunities to forge links and partnerships within
the institution, but also helps to create partnerships which can be
extended to other universities and to different communities locally,
nationally and internationally.
16%
26%
33%UWC
CEPartnerships
■ Community based organisation
■ Educational Institution
■ Faith based organisation
■ Government agency
■ Non-government organisation
■ Non-profit organisation
■ Other
FIGURE 5
Above: Types of partnerships in the database
This section of the report will summarise the following:
Types of partnerships in the database
Geographical location of partners in the database
UWC CE monetary value
3%
9%
8%5%

FIGURE 6
76%
5%
9%
6% 4%
21Database Report 2017
Figure 5 indicates the following:
8% of all the projects had partnerships with community-basedorganisations
33% of all the projects had partnerships with educational
institutions (schools were placed in this category)
3% of all the projects had partnerships with faith-basedorganisations
26% of all the projects had partnerships with a government agency
16% of all the projects had partnerships with non-government organisations
9% of all the projects had partnerships with a non-profit organisation
5% of all the projects had other partnerships
SummaryThe various offices and faculties represented in the database reported
521 community partnerships for year-end 2016. According to Figure
5, a third of UWC partnerships are with other educational institutions
and a quarter with government agencies.
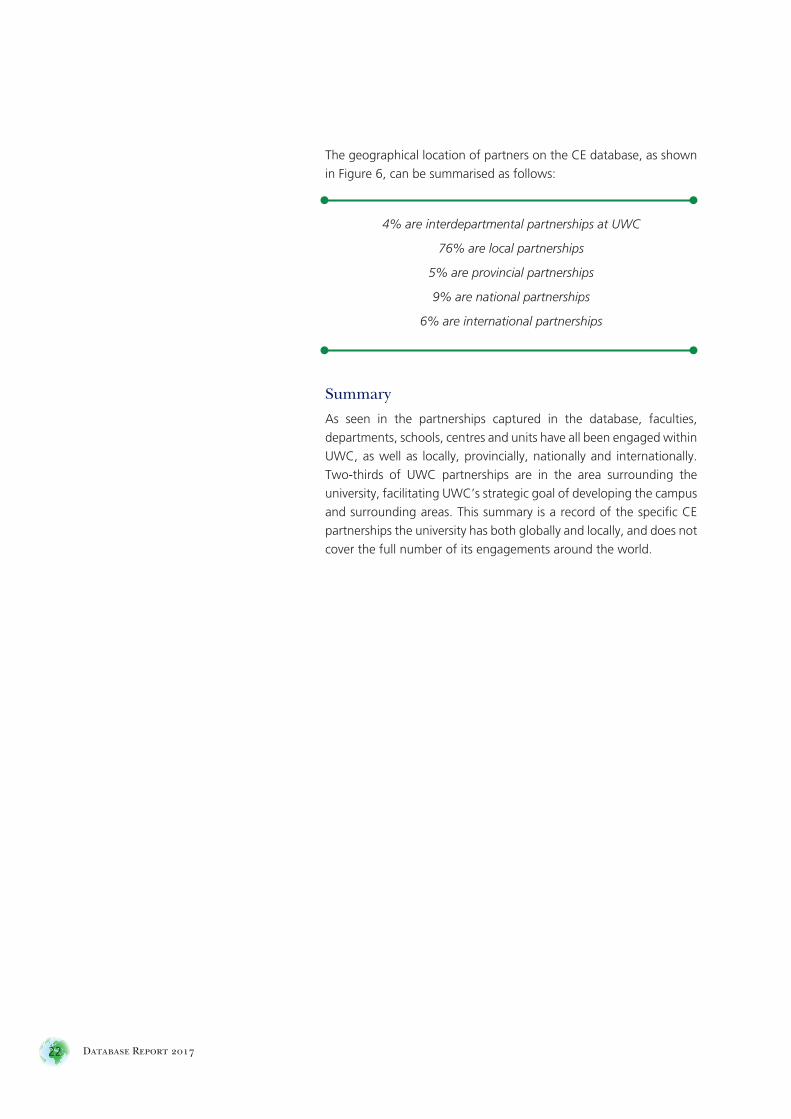
■ UWC
■ Local
■ Provincial
■ National
■ International
Above: Geographical location of partners on
the database
Location of
Partners
22 Database Report 2017
The geographical location of partners on the CE database, as shown
in Figure 6, can be summarised as follows:
4% are interdepartmental partnerships at UWC
76% are local partnerships
5% are provincial partnerships
9% are national partnerships
6% are international partnerships
Summary
As seen in the partnerships captured in the database, faculties,
departments, schools, centres and units have all been engaged within
UWC, as well as locally, provincially, nationally and internationally.
Two-thirds of UWC partnerships are in the area surrounding the
university, facilitating UWC’s strategic goal of developing the campus
and surrounding areas. This summary is a record of the specific CE
partnerships the university has both globally and locally, and does not
cover the full number of its engagements around the world.

23Database Report 2017
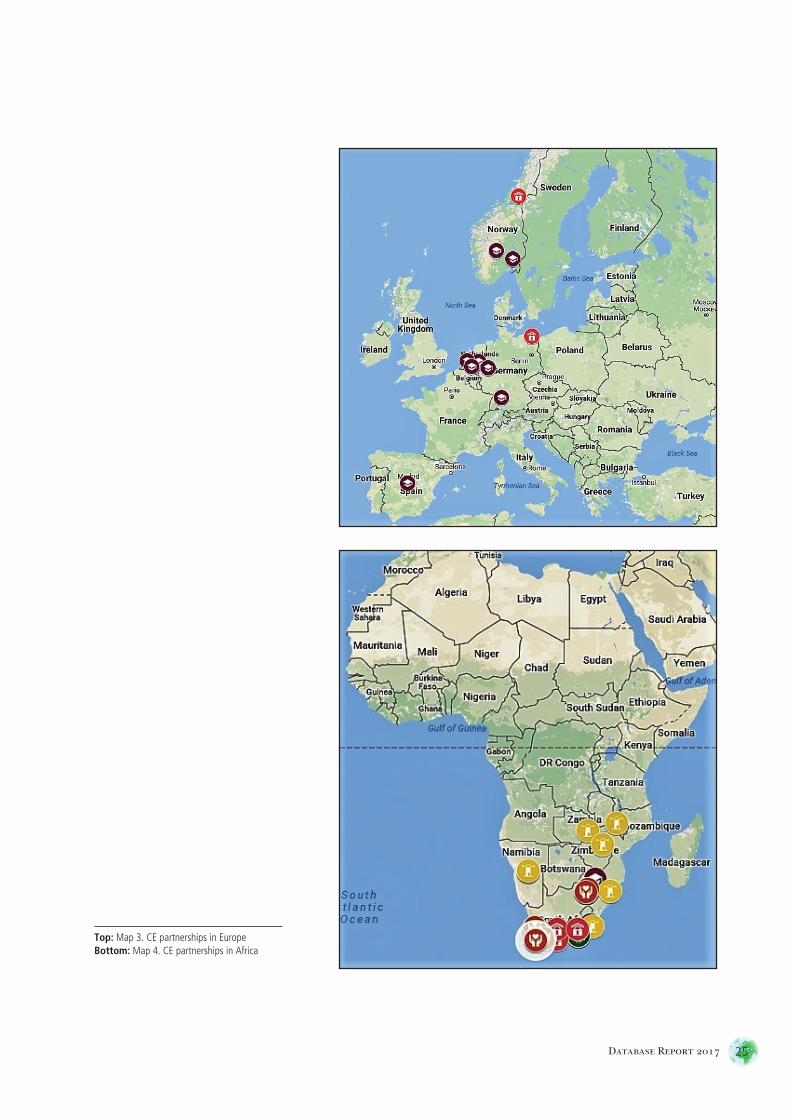
Map 1 provides a clear indication that UWC has many CE partners
around the globe. They are located in the following regions.
• The United States of America (Map 2)
• Europe (Map 3)
• Africa (mostly Southern Africa) (Maps 4 and 5)
• South Africa (Local, provincial and national) (Maps 6, 7 and 8)
(See maps on pages 29 and 30)
Top: Map 1. UWC CE globally

24 Database Report 2017
Top: Table 6. Map ledgerBottom: Map 2. CE partnerships in the United States of America
ICON ORGANISATIONS/INSTITUTIONS
Primary and High School
Universities and other Higher Institutions
Faith-Based Organisations
Government Departments
Library
Law Enforcement/Correctional Services
Clinic/Community Health Centre
Hospital
Non-Profit Organisation
Businesses
Hotel
Community-Based Organisation
Non-Government Organisation
25Database Report 2017
Top: Map 3. CE partnerships in EuropeBottom: Map 4. CE partnerships in Africa

26 Database Report 2017
Top: Map 5. CE partnerships in Southern AfricaBottom: Map 6. CE partnerships in South Africa

27Database Report 2017
Top: Map 7. CE partnerships in the Western CapeBottom: Map 8. CE partnerships in the City of Cape Town
28 Database Report 2017
UWC CE monetary value
The following section highlights the amount of time engaged in CE
projects and summarises the partnerships and engagement hours for
each office and faculty.
The Volunteer Investment and Value Audit (VIVA) was developed to
calculate the value of volunteering in organisations, as a practical
concept rather than a methodological one (Tice & Salamon, 2000).
One of the approaches used to calculatethe monetary value of
engagement is based on replacement cost. This refers to the cost of
the engaged person’s function in the organisation if it were bought
on the labour market (Mook, Richmond & Quarter, 2009). In addition,
organisations estimating the value of volunteers simply use a gross
hourly average for the calculations in any particular industrial sector
(Brown, 1999).
In this report, the replacement cost approach was applied to the time
spent by staff and students in community engagement activities. The
average monthly earnings in the social and personal service industry
(Statssa, 2017) was used to estimate the value of engagement for
staff, but the average work-study rate was used for students.
The calculation of monetary value was included in the report to
demonstrate the impact of CE. It also acknowledges the input of
UWC’s partners involved in curricula based projects.
Through 521 documented partnerships, staff have given
7549 hours and students 37569 hours per week. The monetary
value of CE for staff per week was R958 723. The monetary
value of CE for students per week was R2 930 382.
Staff’s projected total hours for a 45-week academic year
were estimated at 359275 hours and the monetary value was
R42 376 090. Students’ projected total hours for a 45-week
academic year were estimated at 169 06 05 hours and the
monetary value was R131 867 190.
(See Figures 6a and b)
29Database Report 2017
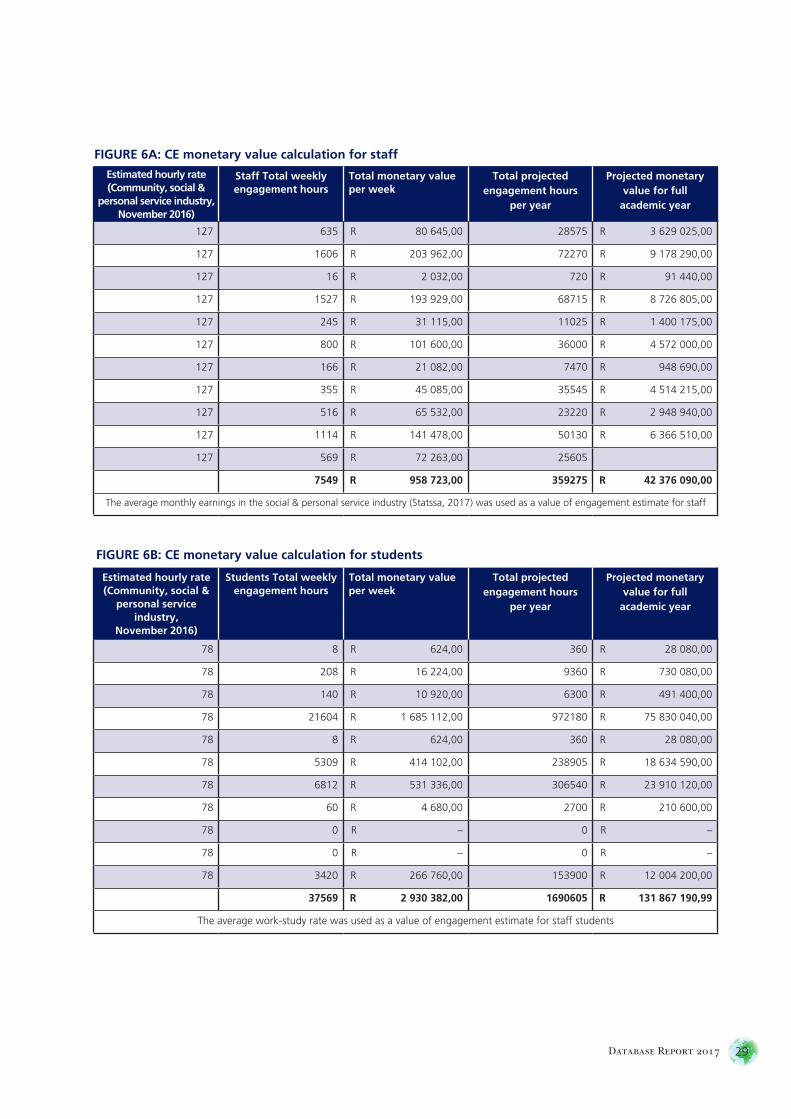
Estimated hourly rate(Community, social &
personal service industry,November 2016)
Staff Total weeklyengagement hours
Total monetary value per week
Total projected engagement hours
per year
Projected monetaryvalue for full
academic year
127 635 R 80 645,00 28575 R 3 629 025,00
127 1606 R 203 962,00 72270 R 9 178 290,00
127 16 R 2 032,00 720 R 91 440,00
127 1527 R 193 929,00 68715 R 8 726 805,00
127 245 R 31 115,00 11025 R 1 400 175,00
127 800 R 101 600,00 36000 R 4 572 000,00
127 166 R 21 082,00 7470 R 948 690,00
127 355 R 45 085,00 35545 R 4 514 215,00
127 516 R 65 532,00 23220 R 2 948 940,00
127 1114 R 141 478,00 50130 R 6 366 510,00
127 569 R 72 263,00 25605
7549 R 958 723,00 359275 R 42 376 090,00
The average monthly earnings in the social & personal service industry (Statssa, 2017) was used as a value of engagement estimate for staff
Estimated hourly rate(Community, social &
personal service industry,
November 2016)
Students Total weeklyengagement hours
Total monetary value per week
Total projected engagement hours
per year
Projected monetaryvalue for full
academic year
78 8 R 624,00 360 R 28 080,00
78 208 R 16 224,00 9360 R 730 080,00
78 140 R 10 920,00 6300 R 491 400,00
78 21604 R 1 685 112,00 972180 R 75 830 040,00
78 8 R 624,00 360 R 28 080,00
78 5309 R 414 102,00 238905 R 18 634 590,00
78 6812 R 531 336,00 306540 R 23 910 120,00
78 60 R 4 680,00 2700 R 210 600,00
78 0 R – 0 R –
78 0 R – 0 R –
78 3420 R 266 760,00 153900 R 12 004 200,00
37569 R 2 930 382,00 1690605 R 131 867 190,99
The average work-study rate was used as a value of engagement estimate for staff students
FIGURE 6A: CE monetary value calculation for staff
FIGURE 6B: CE monetary value calculation for students

30 Database Report 2017
A summary the partnerships and engagement hours per week for the Rector’s Office
The summary only represents information captured
RECTOR
89 partnerships involving 2 units.
Through these partnerships, staff have given 635 CE hours and students have given 8 CE hours per week.
The CE projects were linked to the following partnerships.
Type of partnership Number of projects
Community-based organisation 9
Educational institution 68
Faith-based organisation 0
Government agency 5
Non-government organisation 3
Non-profit organisation 4
Other 0
Communitybased
organisation
9
Educationalinstitution
68
Faith-basedorganisation
0
Governmentagency
5
Non-governmentorganisation
3
Non-profitorganisation
4
Other, pleasespecify
0
0
10
20
30
40
50
60
70
RECTOR

31Database Report 2017
The DVC: Academic office
The summary only represents information captured
DVC: ACADEMIC
10 partnerships involving 3 units.
Through these partnerships, staff have given 1606 CE hours and students have given 208 CE hours per week.
The CE projects were linked to the following partnerships.
Type of partnership Number of projects
Community-based organisation 0
Educational institution 2
Faith-based organisation 0
Government agency 6
Non-government organisation 0
Non-profit organisation 1
Other 1
Communitybased
organisation
0
Educationalinstitution
2
Faith-basedorganisation
0
Governmentagency
6
Non-governmentorganisation
0
Non-profitorganisation
1
Other, pleasespecify
1
0
1
2
3
4
5
6
DVC: ACADEMIC

32 Database Report 2017
The DVC: Research and innovation
DVC: RESEARCH AND INNOVATION
9 partnerships involving 1 unit.
Through these partnerships, staff have given 16 CE hours and students have given 140 CE hours per week.
The CE projects were linked to the following partnerships.
Type of partnership Number of projects
Community-based organisation 0
Educational institution 2
Faith-based organisation 0
Government agency 2
Non-government organisation 1
Non-profit organisation 1
Other 3
The summary only represents information captured
Communitybased
organisation
0
Educationalinstitution
2
Faith-basedorganisation
0
Governmentagency
2
Non-governmentorganisation
1
Non-profitorganisation
1
Other, pleasespecify
3
0
0,5
1
1,5
2
2,5
3
DVC: RESEARCH & INNOVATION

33Database Report 2017
The DVC: Student development and support services
DVC: STUDENT DEVELOPMENT AND SUPPORT SERVICES
10 partnerships involving 1 centre and 1 unit.
Through these partnerships, staff have given 1527 CE hours and students have given 21604 CE hours per week.
The CE projects were linked to the following partnerships.
Type of partnership Number of projects
Community-based organisation 0
Educational institution 7
Faith-based organisation 0
Government agency 1
Non-government organisation 2
Non-profit organisation 0
Other 0
The summary only represents information captured
Communitybased
organisation
0
Educationalinstitution
7
Faith-basedorganisation
0
Governmentagency
1
Non-governmentorganisation
2
Non-profitorganisation
0
Other, pleasespecify
0
0
10
20
30
40
50
60
70
DVC: STUDENT DEVELOPMENT AND SUPPORT SERVICES
34 Database Report 2017
The Faculty of Arts
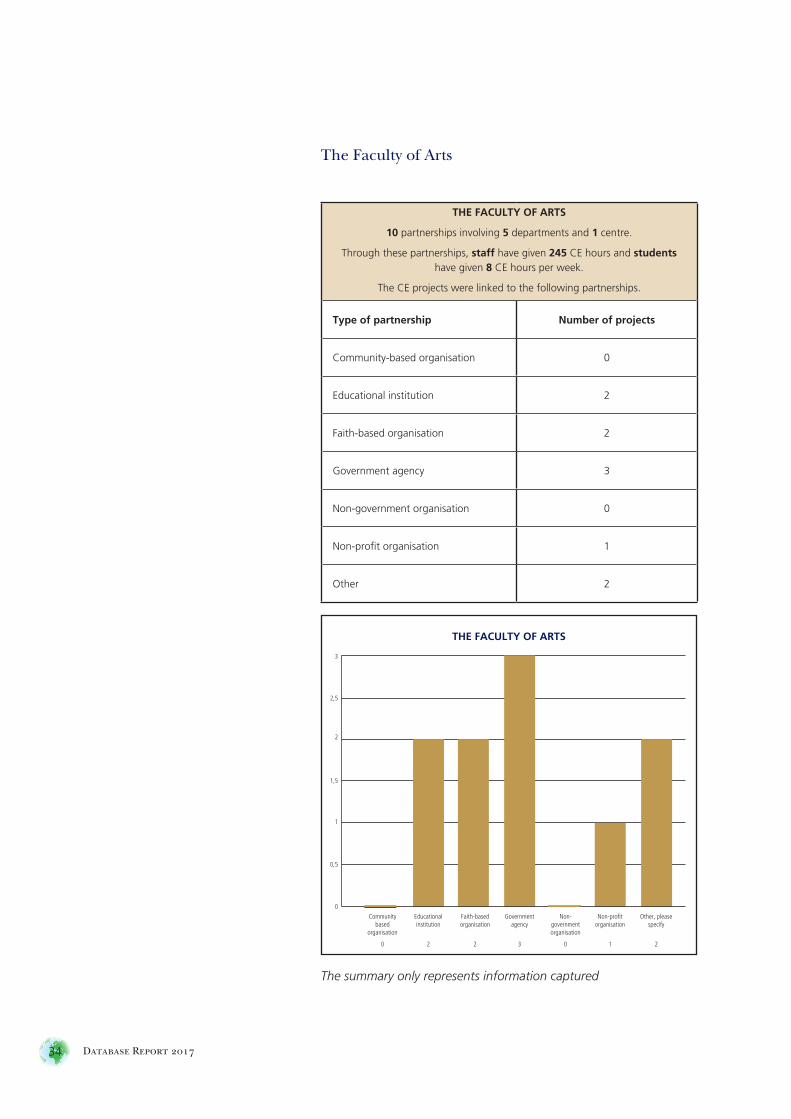
THE FACULTY OF ARTS
10 partnerships involving 5 departments and 1 centre.
Through these partnerships, staff have given 245 CE hours and students have given 8 CE hours per week.
The CE projects were linked to the following partnerships.
Type of partnership Number of projects
Community-based organisation 0
Educational institution 2
Faith-based organisation 2
Government agency 3
Non-government organisation 0
Non-profit organisation 1
Other 2
Communitybased
organisation
0
Educationalinstitution
2
Faith-basedorganisation
2
Governmentagency
3
Non-governmentorganisation
0
Non-profitorganisation
1
Other, pleasespecify
2
0
0,5
1
1,5
2
2,5
3
THE FACULTY OF ARTS
The summary only represents information captured
Communitybased
organisation
16
Educationalinstitution
44
Faith-basedorganisation
3
Governmentagency
39
Non-governmentorganisation
46
Non-profitorganisation
23
Other, pleasespecify
3
0
5
10
15
20
25
30
35
40
45
50
THE FACULTY OF COMMUNITY AND HEALTH SCIENCES
The summary only represents information captured
35Database Report 2017
The Faculty of Community and Health Sciences
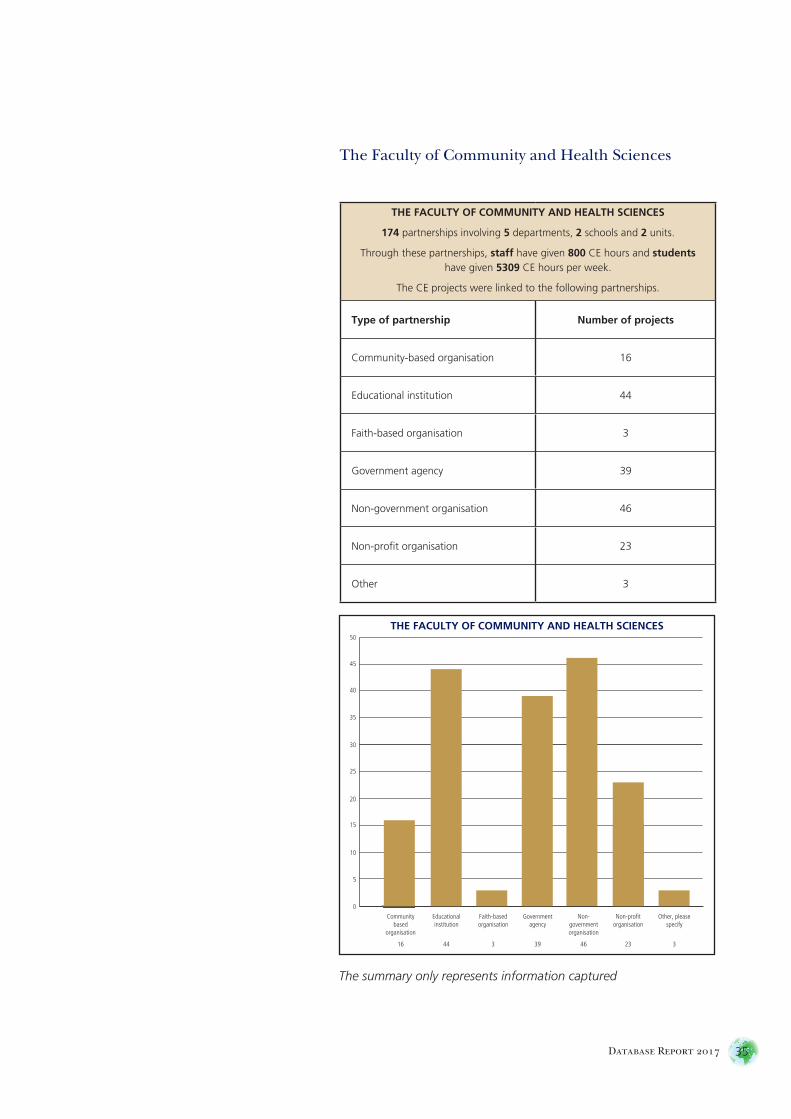
THE FACULTY OF COMMUNITY AND HEALTH SCIENCES
174 partnerships involving 5 departments, 2 schools and 2 units.
Through these partnerships, staff have given 800 CE hours and students have given 5309 CE hours per week.
The CE projects were linked to the following partnerships.
Type of partnership Number of projects
Community-based organisation 16
Educational institution 44
Faith-based organisation 3
Government agency 39
Non-government organisation 46
Non-profit organisation 23
Other 3
Communitybased
organisation
0
Educationalinstitution
7
Faith-basedorganisation
0
Governmentagency
6
Non-governmentorganisation
4
Non-profitorganisation
0
Other, pleasespecify
0
0
1
2
3
4
5
6
7
THE FACULTY OF DENTISTRY
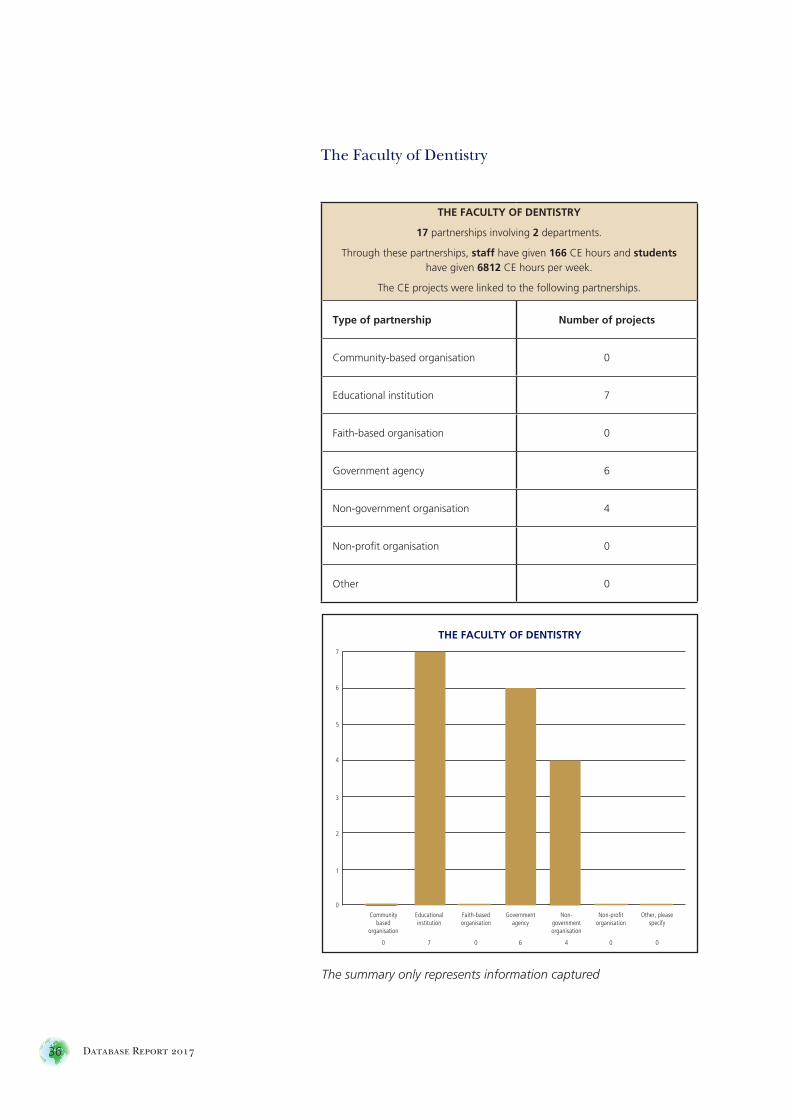
The summary only represents information captured
36 Database Report 2017
The Faculty of Dentistry
THE FACULTY OF DENTISTRY
17 partnerships involving 2 departments.
Through these partnerships, staff have given 166 CE hours and students have given 6812 CE hours per week.
The CE projects were linked to the following partnerships.
Type of partnership Number of projects
Community-based organisation 0
Educational institution 7
Faith-based organisation 0
Government agency 6
Non-government organisation 4
Non-profit organisation 0
Other 0

37Database Report 2017
The Faculty of Economic and Management Sciences
THE FACULTY OF ECONOMIC AND MANAGEMENT SCIENCES
22 partnerships involving 1 department, 1 centre, 2 Institutes, 1 school and 1 unit.
Through these partnerships, staff have given 355 CE hours and students have given 60 CE hours per week.
The CE projects were linked to the following partnerships.
Type of partnership Number of projects
Community-based organisation 0
Educational institution 4
Faith-based organisation 2
Government agency 2
Non-government organisation 4
Non-profit organisation 7
Other 3
The summary only represents information captured
Communitybased
organisation
0
Educationalinstitution
4
Faith-basedorganisation
2
Governmentagency
2
Non-governmentorganisation
4
Non-profitorganisation
7
Other, pleasespecify
3
0
1
2
3
4
5
6
7
THE FACULTY OF ECONOMIC AND MANAGEMENT SCIENCES
38 Database Report 2017
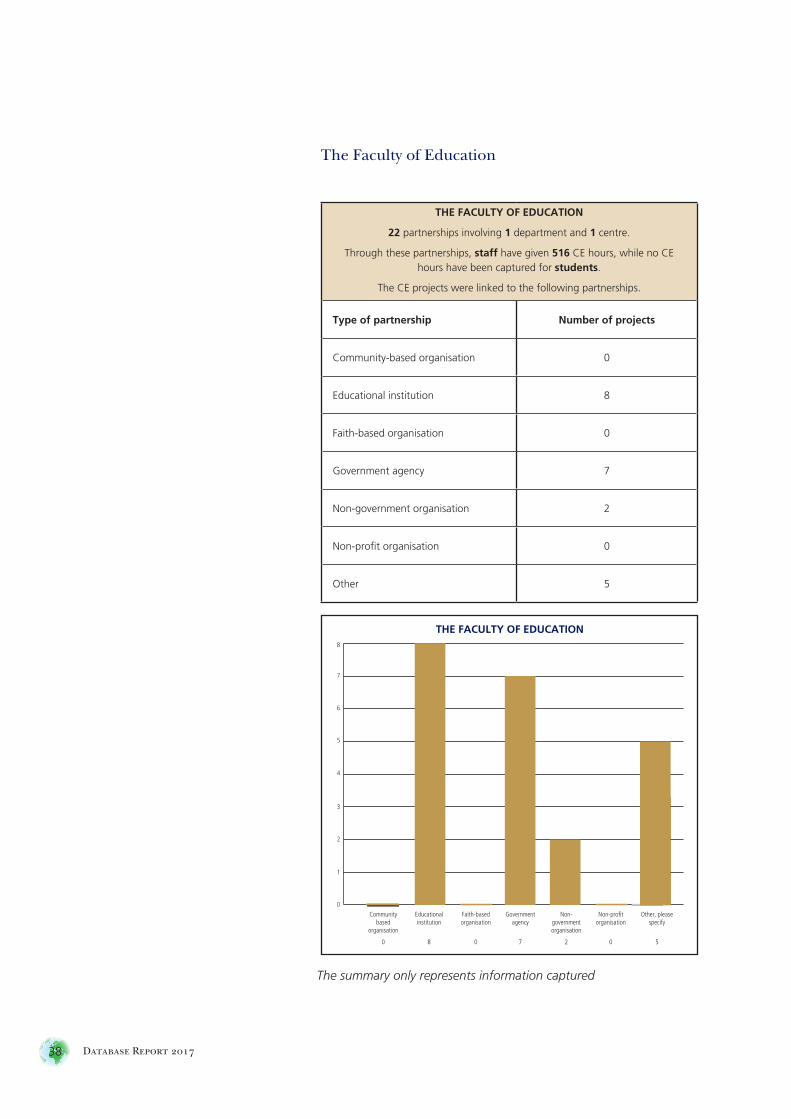
The Faculty of Education
THE FACULTY OF EDUCATION
22 partnerships involving 1 department and 1 centre.
Through these partnerships, staff have given 516 CE hours, while no CE hours have been captured for students.
The CE projects were linked to the following partnerships.
Type of partnership Number of projects
Community-based organisation 0
Educational institution 8
Faith-based organisation 0
Government agency 7
Non-government organisation 2
Non-profit organisation 0
Other 5
The summary only represents information captured
Communitybased
organisation
0
Educationalinstitution
8
Faith-basedorganisation
0
Governmentagency
7
Non-governmentorganisation
2
Non-profitorganisation
0
Other, pleasespecify
5
0
1
2
3
4
5
6
7
8
THE FACULTY OF EDUCATION

39Database Report 2017
The Faculty of Law
THE FACULTY OF LAW
29 partnerships involving 1 centre and 1 unit.
Through these partnerships, staff have given 1114 CE hours, while no CE hours have been captured for students.
The CE projects were linked to the following partnerships.
Type of partnership Number of projects
Community-based organisation 0
Educational institution 6
Faith-based organisation 0
Government agency 7
Non-government organisation 15
Non-profit organisation 1
Other 5
The summary only represents information captured
Communitybased
organisation
0
Educationalinstitution
6
Faith-basedorganisation
0
Governmentagency
7
Non-governmentorganisation
15
Non-profitorganisation
1
Other, pleasespecify
0
0
2
8
6
4
12
10
16
14
THE FACULTY OF LAW

Communitybased
organisation
10
Educationalinstitution
21
Faith-basedorganisation
0
Governmentagency
59
Non-governmentorganisation
3
Non-profitorganisation
6
Other, pleasespecify
2
0
10
20
30
40
50
60
THE FACULTY OF NATURAL SCIENCE
The summary only represents information captured
40 Database Report 2017
The Faculty of Natural Science
THE FACULTY OF NATURAL SCIENCE
101 partnerships involving 4 departments and 1 school.
Through these partnerships, staff have given 569 CE hours and students have given 3420 CE hours per week.
The CE projects were linked to the following partnerships.
Type of partnership Number of projects
Community-based organisation 10
Educational institution 21
Faith-based organisation 0
Government agency 59
Non-government organisation 3
Non-profit organisation 6
Other 2
41Database Report 2017
ConclusionThis report reviewed the original need for the UWC CE database and
looked at how it was created. It explained the purpose of the database
in the context of UWC, and showed how it is aligned with the CEU
model, making it one of the niche initiatives of the CEU. It illustrated
how the CE projects encompass one or more of the core functions of
the university. Finally, it reported on the various types of partnerships,
their geographical location and the monetary value of the different
engagements.
The database is a platform which allows project managers and
coordinators in faculties and offices to share their CE activities with
their colleagues, as well as with all thosewho have access to it. This
report, like the database, should be seen as a resource, to promote
the departments, schools, centres and units of UWC. As a baseline
document, it is hoped that it will encourage further discussions about
community engagement.
42 Database Report 2017
ReferenceBrown, E. (1999). Assessing the value of volunteer activity. Non-profit and voluntary sector quarterly, 28(1), 3-17.
Mook, L., Richmond, B. J., & Quarter, J. (2009). Calculating the value
of volunteer contributions for financial statements. The Philanthropist, 18(1), 71-83.
Statssa (2017) Quarterly Employment Statistics (QES). Retrieved from www.statssa.gov.za
Tice, H. S., & Salamon, L. M. (2000, August). The handbook of
non-profit institutions in the system of national accounts: an
introduction and overview. In 26th General Conference of the International Association for research in income and wealth, Cracow, Poland (Vol. 27).