Embed Size (px)
Citation preview
Communication and Information Management in the Nonprofit Arts Sector Findings from a Survey of Arts Organizations and Arts Administrators on the Behaviors, Protocols, Preferences, and Perceptions of Communication and Information Use and Management
Prepared by Barry Hessenius
January 2016

2
“We are drowning in information but starved for knowledge.”
John Naisbitt
“Information is not knowledge.”
Albert Einstein
LS3.1

3
Preface Internet and digital technologies have increased not only the volume of information available in the world but also access to that information and ways to communicate it. That volume of information and the tools available to communicate information continue to grow exponentially. The nonprofit arts field, like the rest of society, seeks to keep abreast of knowledge germane to its work and to communicate both within and outside of its own sphere to its constituents, stakeholders, governing authorities, and the public. Communication is at the very essence of everything the sector does--key to its mission, operations, and its success as an enterprise. No sector today lives in a vacuum distinct or apart from the technology that has changed the world. Facebook, Twitter, YouTube, Instagram, Vine, and scores of other communication platforms did not exist a decade ago. Smart phones, tablets, mobile apps, and even email are relatively new realities. All of these tools make it easier to access information, data, thinking, opinions and ideas, and that access is both a boon to what the nonprofit arts community does and an increasing challenge for it in managing how it communicates. While available information is virtually infinite, the resources of the sector and its component organizations are not. Chief among the scarce resources with which the nonprofit arts field contends is time. Limited funding streams impact the ability of arts organizations to employ the personnel necessary to adequately identify, analyze, and apply the volume of information available in some useful way to a typical arts organization’s business operation and other objectives. The learning curves of new technologies themselves require an increasing investment of time to master. While a perceived information overload, and the consequential implications of such a status, are nothing new, the nonprofit arts field has a dearth of information about which communication tools we use, how we are managing that usage, and the impact of that usage on organizations and leaders within those organizations. This report seeks to provide a baseline of knowledge about the communication tools being used by nonprofit arts organizations and personnel and the management of its communication activities—both within and between—arts organizations. A national representative survey instrument designed to ascertain arts organization and leadership communication perceptions, behavior, habits, and usage was created to obtain that baseline information in an attempt to begin to understand how arts organizations are communicating.
LS3.1

4
Specifically, the inquiry sought to understand which communication tools arts organizations and personnel use and to what extent; which sources of information are valued and trusted; how arts administrators are managing the volume of available information; and the impact of the increased available information on a variety of markers relating to productivity, job satisfaction, and organizational efficiency. The survey also sought to determine whether or not the increased volume of available information is thought to constitute information overload [exposure to or provision of too much information or data] for the field. While the volume of available information is increasing, as are the number of ways to communicate that information, the capacity of human beings to process the increased information is not getting any faster. Causes of the rise of available information and resultant overload include: i) the ease and cost-effectiveness of sending more information to more people, ii) the lack of filters to simplify and summarize information, iii) the chances of factual errors and inconsistencies in the available information, and iv) the failure of people who pass on information to first process it themselves. Every communication, ours included, adds to the potential of overload. The natural response to the paralysis of overload is for human beings to install filters that can make the inflow manageable. Thus, for example, one response to too many emails in your inbox is to simply not read a certain percentage of them. If your email to someone with whom you want to communicate falls into this category, you have not communicated at all. Effective communication increasingly must concern itself with getting past the filters installed by people to manage the overflow. How we communicate, how we manage our communication strategies and tools, and the impact of our communication choices are complex subjects. The project recognized early on that preliminary data is needed on which future research and inquiry, by both theorists and practitioners within our field, can build. Drilling deeper into our preferences, perceptions, and behaviors will be necessary in order to better enable our field to improve the effectiveness of its communications, minimize the negative aspects of the information onslaught, and maximize the positive impacts of how we manage information going into the future. The challenge to our organizations is twofold: First, to effectively and efficiently manage the flow of communication and information, and second, to translate the information we access into knowledge that will benefit our operations and advance our missions. Given the time expended in managing communication and information and the centrality of those efforts to almost everything we do, it is essential for organizations to proactively address the challenges faced in this arena.
LS3.1

5
Summary of Findings A survey of a representative sampling of arts organizations finds that their internal and external communication includes a variety of traditional and technological methods, each varying in its preferred usage and perceived effectiveness. While this study was intended to establish a baseline of communication perceptions, behaviors, and impacts, the following conclusions may be reasonably drawn from the survey responses:
1. Communication from arts administrators and organizations, and from others to them, is a major occupier of time. Email in particular dominates average weekly time expenditures.
2. The field’s perception of the value and impact of the increased information available to it, and the communication it sends and receives, indicates a struggle with that volume, with a large bloc believing the sheer volume is--or is becoming--unmanageable.
3. While the increase in information being communicated and being received is perceived as having a positive impact on organization productivity, there is a bloc of respondents that believes it is negative on a personal level.
4. Despite the struggle with managing communication of all types and the pervasive feeling among the respondents that there are significant negative impacts on their time and ability to do their jobs, most arts organizations do not have any formal plan to address these issues.
5. Due to the limitations of this survey, it is unclear the extent to which arts organizations are aware of, and are dealing with, communication and information issues, including the challenges posed to staff personnel.
6. Most arts organizations do not have the resources to engage a full-time communications officer.
7. Administrators are challenged to relate the increased information to their specific needs. 8. It may be a myth that executive summaries in reports are the preferred method of
reviewing information by arts administrators. For many organizations, this respondent's observation encapsulates the challenge with communication and information management: “We have 20th century resources in a 21st century environment.” Internal Communication Preferred methods of communication While a wide range of communication tools are employed by arts organizations, including traditional and technological, three principal means dominate: email, face-to-face meetings (one-on-one and staff/department), and the telephone—all of which might today be considered “old school.”
LS3.1

6
Communications plans/staff officers:
• More than three-quarters of arts organizations do not have a formal communications plan for internal organizational communication.
• Sixty-five percent of arts organizations do not have a staff communications officer. • Nearly 60 percent of arts organizations do not have a formal plan for external
communications.
These figures suggest that a large bloc of arts organizations may not be dealing directly with communication issues within their organizations. One can speculate on the reasons for the lack of communications plans: 1) a lack of resources—time, money; 2) the difficulty in creating organization-wide plans due to differences in staff/generational preferences for the use of various communication tools; 3) a belief that such a plan is/would not be of sufficient value to justify its creation; 4) the possibility that such a plan would be outdated on creation; and 5) unawareness of the challenges administrators are having in this area. External Communications Effectiveness of various external communication tools: In order of perceived effectiveness, the respondents' top five communication tools are:
• Email • Websites • Convenings/Events • Facebook • Telephone
Again, with the possible exception of Facebook, these tools are basically “traditional.” Of the surveyed organizations that use Facebook, 34 percent post a few times a week, 22 percent post daily, 23 percent post two to four times per day, and 10 percent post once per week. Preferred sources of incoming information: Of the communications received from sources outside of the surveyed organizations, the ones most often read/reviewed are from, in order:
• Colleagues/Peers • Constituents • Community leaders • Foundations • Other arts organizations within the discipline
Effectiveness of various communications: The most effective tools for external communications for the organizations surveyed are, in order:
LS3.1

7
• Email • Convenings/events • Websites • Facebook • Meetings
Managing Communication and Information: Coping with the increase:
• Sixty-three percent of the arts organizations surveyed indicated that the volume of information and communication is growing, making it increasingly more difficult to keep pace.
• Fifteen percent of respondents indicated that they believe the volume of information is out of hand and they are feeling overwhelmed.
• Twenty-one percent of respondents indicated that the amount of communication they receive is reasonable and they have no trouble handling it.
Perhaps the single most important finding from the survey is the number of arts administrators who view the increase in the volume of communication—to and from others—as a real or potential problem; one that is a threat/drain to their most important resource—time. Perception of the value of the information available:
• Thirty-eight percent of respondents indicated that they believe about 25 percent of available information/received communication is of value to them.
• Twenty-eight percent of respondents indicated that they believe about half of the available information/received communication is of value to them.
• Eighteen percent of respondents indicated that they believe less than 10 percent of the available information/received communication is of value to them.
Challenges to managing communication:
• Nearly 80 percent of respondents indicated that they believe a lack of time is the biggest challenge in staying abreast of all the information available.
• Nearly 40 percent of respondents indicated that they believe that their biggest challenge in staying abreast of incoming communication is relating the available information to their needs.
Hours spent per week dealing with various communication tools: Email:
• Twenty-three percent of respondents spent seven to ten hours per week reading and responding to email.
LS3.1

8
• Twenty-two percent of respondents spent 11 to 15 hours per week reading and responding to email.
• Eighteen percent of respondents spent 16 to 20 hours per week reading and responding to email.
• Sixteen percent of respondents spent more than 20 hours per week reading and responding to email.
More than half of the respondents spent 11 or more hours dealing with email each week—or one-quarter of a traditional 40-hour work week. Conferring one-to-one with coworkers within the organization:
• Thirty-three percent of respondents spent four to six hours per week conferring one-on-one.
• Twenty-two percent of respondents spent seven to ten hours per week conferring one-on-one.
• Thirteen percent of respondents spent 11 to 15 hours per week conferring one-on-one. Other major time-consuming activities:
• Twenty-eight percent of respondents spent four to six hours per week talking on the telephone.
• Thirty-one percent of respondents spent four to six hours per week searching the internet.
• Twenty-eight percent of respondents spent four to six hours per week attending staff/department meetings.
• Twenty-three percent of respondents spent four to six hours per week on social networking sites.
Impact of the increased volume of communication:
• Thirty-six percent of respondents indicated that they believe the volume of communication/information positively impacts their productivity. Twenty-seven percent of respondents indicated that they believe the volume of communication/information negatively impacts their productivity.
• Forty-four percent of respondents indicated that they believe the volume of communication/information negatively impacts their time to reflect and brainstorm. Twenty-eight percent of respondents indicated that they believe the volume of communication/information positively impacts their time to reflect and brainstorm.
• Forty-three percent of respondents indicated that they believe the volume of communication/information negatively impacts their ability to effectively manage their time.
• Forty-six percent of respondents indicated that they believe the volume of communication/information positively impacts their organization’s success.
LS3.1

9
• Fifty-eight percent of respondents indicated that they believe the volume of communication/information positively impacts innovation.
• Forty-eight percent of respondents indicated that they believe the volume of communication/information positively impacts organizational adaptability.
Other Findings Reports and Studies Volume of reports received:
• Nearly 40 percent of respondents reported that they receive three to five studies and/or reports per month.
• Eighteen percent of respondents reported that they receive six to ten studies and/or reports per month.
• Ten percent of respondents reported that they receive ten or more reports per month. Reports reviewed:
• Nearly 60 percent of respondents reported that they read or scan one to two reports per month.
• Thirty percent of respondents reported that they review three to five reports per month. • Less than 5 percent of respondents reported that they review more than ten ports per
month. Preferred method of review:
• Forty-one percent of respondents reported that they read selected sections of the reports and studies they receive.
• Twenty-eight percent of respondents reported that they scan the whole report. • Twenty-five percent of respondents reported that they read or scan the executive
summary. Crowdfunding:
• Nineteen percent of respondents reported having been engaged in a crowdfunding campaign in the past year. Of that number, 18 percent reported having been engaged in more than one such campaign.
• Twenty percent of respondents that engaged in a crowdfunding campaign reported raising $5,000 to $10,000. Another 20 percent reported raising $10,000 to $20,000.
LS3.1

10
Introduction: Evaluating the Communication of the Nonprofit Arts Sector About This Survey This survey was designed to explore how nonprofit arts organizations and their leaders are navigating and adapting to a changing technological communication landscape, including the Internet, social platforms, and digital applications. The survey also seeks to measure the impact of perceptions, preferences, and behavior on the operations and missions of these organizations, as well as the challenges and opportunities these organizations face in the management of their future communication strategies. The survey results reported here are based on a non-probability sample of 1,601 arts organizations. Using the grantee and constituent lists of the sponsoring organizations as a baseline, national service provider organizations and widely distributed bloggers were solicited to extend the survey invitation to their lists. Individual leaders from 1,601 arts organizations responded to an invitation to take the survey; 1,332 completed the entire survey, which was available online from September 17, 2015 to October 16, 2015. Several respondents from the same organization may have completed the survey. In order to increase the response rate to the survey invitation, the survey omitted an open-ended narrative response option, except for one question at the end inviting respondents to share additional thoughts. The final sample includes a representation of arts organizations located across the country--of all sizes, ages, budgets, geographical locations, communities served, and disciplines. Individual respondents included a sampling of job positions, years in current position, age, and gender. Complete survey profiles of both organizations and individual respondents from those organizations are included in the report.
LS3.1

11
Organizational Respondent Profile Organizational Classification: Survey respondents predominantly identified their organizations as nonprofit (75.45 percent), followed by respondents that categorized their organizations as government agencies (10.06 percent). The percentage of respondents that identified their organizations as associated with a university was 7.25 percent, and 4.12 percent of the respondents classified their organizations as for-profit.
LS3.1

12
Organizational Type: There was a representative breakdown as to the types of arts organizations included in the survey. Of the types of organizations represented in the survey, 23.74 percent are performing arts organizations, 11.74 percent are presenting organizations, 10 percent are government agencies (federal, regional, state or local (city/county)), 6.06 percent are arts education organizations, 3.12 percent are museums, 2 percent are foundations, 5.06 percent are service provider organizations, and 6.12 percent are performing arts facilities.
Arts Council/Agency – Federal 0.19% Arts Council/Agency – Regional 2.87% Arts Council/Agency – State 3.06% Arts Council/Agency – Local 12.49% Arts Education 6.06% Art Museum 3.12% Presenter 11.74% Advocacy Organization 1.81% Foundation or Grantmaker 2.00% Academic/University Program 2.25% Arts Service Provider Organization 5.06% Fair/Festival 1.37% Performing Arts Group 23.74% Performance Facility 6.12% Research 0.31% Consultant 2.31% Media – Radio/TV 0.62% Literary Magazine 0.06% Private Sector 0.12%
Artist Services/Support 1.94% Multicultural Arts 1.37% Youth Arts 1.19% Other (please specify) 10.18%
LS3.1

13
Organizational Function:
Discipline/Focus: The principal focus of the respondent organizations was spread across the various arts disciplines, with 18.68 percent categorized as theaters, 7.18 percent categorized as dance organizations, 13.37 percent categorized as music organizations, and 23.74 percent categorized as cross- or multi-disciplinary organizations, and 18.9 percent of the organizations indicating that they served all of the disciplines.
LS3.1

14
LS3.1

15
Age of Organization: The majority of the respondent organizations have existed for more than 20 years (70.71 percent), 6 percent have existed for 15 to 20 years, and 8.07 percent have existed for fewer than 5 years.
LS3.1

16
Organizational Budgets: The budgets of the organizations surveyed ranged from less than $50,000 (8.06 percent) to more than $10 million (16.11 percent). Nearly one-quarter of the responding museums had budgets of more than $10 million. Nearly 44 percent of responding foundations also had budgets of more than $10 million, as did one-third of the academic programs, and nearly one-quarter of the performance facilities that responded to the survey. Eighteen percent of the local arts councils, 14 percent of the advocacy organizations, 10 percent of the performing arts groups, and 16 percent of the consultants that responded had annual budgets under $50,000.
LS3.1
17
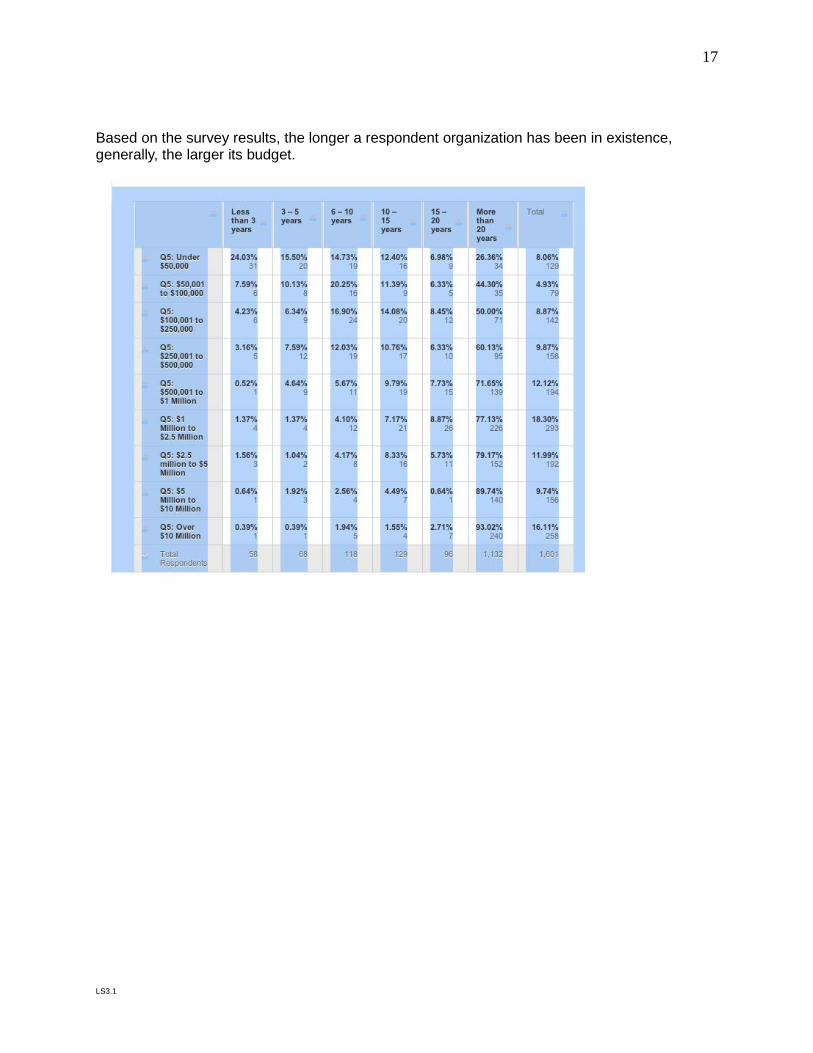
Based on the survey results, the longer a respondent organization has been in existence, generally, the larger its budget.
LS3.1

18
Staff Size: Staff sizes (full- and part-time) of the organizations surveyed ranged from volunteer-only (5.18 percent) to more than 50 staff members (22.74 percent).
LS3.1
19
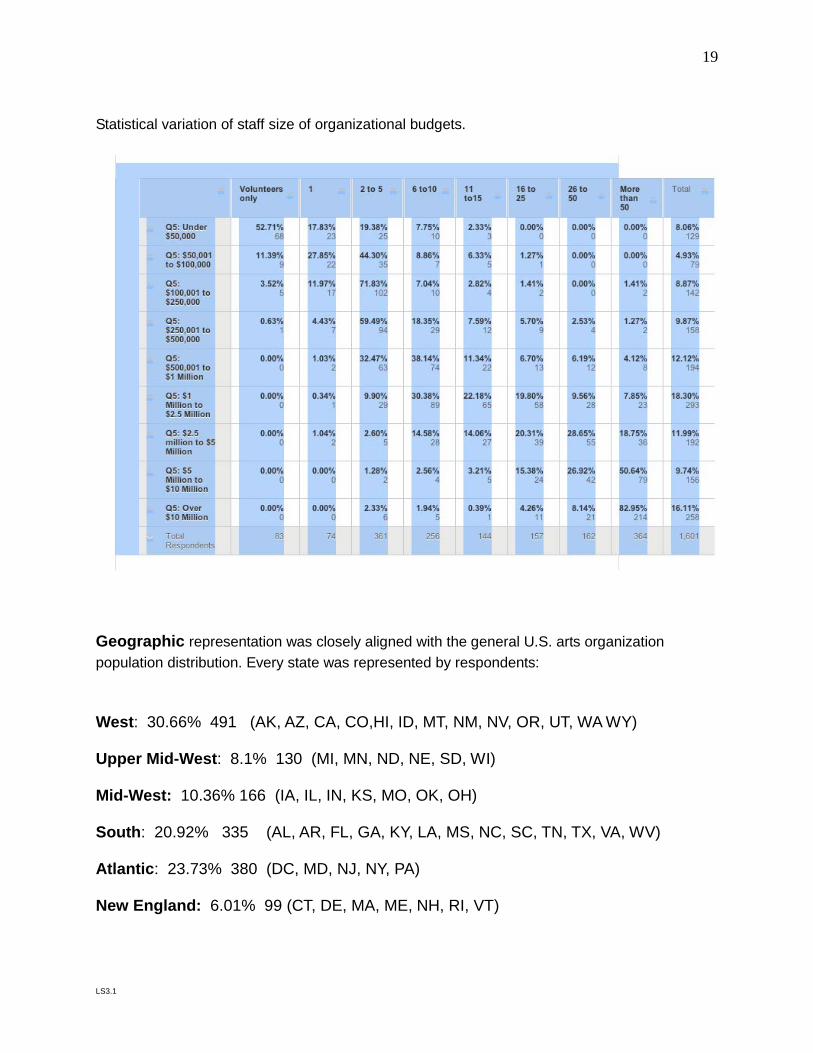
Statistical variation of staff size of organizational budgets.
Geographic representation was closely aligned with the general U.S. arts organization population distribution. Every state was represented by respondents: West: 30.66% 491 (AK, AZ, CA, CO,HI, ID, MT, NM, NV, OR, UT, WA WY) Upper Mid-West: 8.1% 130 (MI, MN, ND, NE, SD, WI) Mid-West: 10.36% 166 (IA, IL, IN, KS, MO, OK, OH) South: 20.92% 335 (AL, AR, FL, GA, KY, LA, MS, NC, SC, TN, TX, VA, WV) Atlantic: 23.73% 380 (DC, MD, NJ, NY, PA) New England: 6.01% 99 (CT, DE, MA, ME, NH, RI, VT)
LS3.1
20
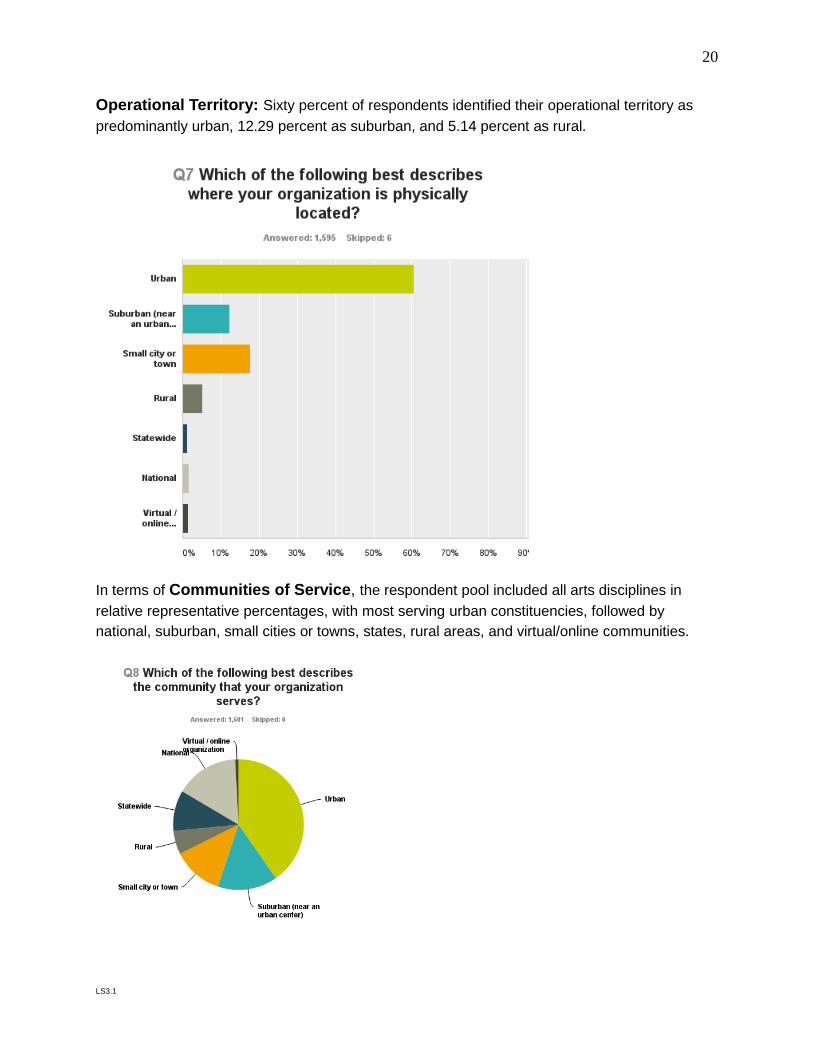
Operational Territory: Sixty percent of respondents identified their operational territory as predominantly urban, 12.29 percent as suburban, and 5.14 percent as rural.
In terms of Communities of Service, the respondent pool included all arts disciplines in relative representative percentages, with most serving urban constituencies, followed by national, suburban, small cities or towns, states, rural areas, and virtual/online communities.
LS3.1

21
Individual Respondents Profile Job Profile: The majority of the individuals who responded to the survey identified themselves as the executive director/president/CEO of the organization (35.25 percent) or program director/middle management/program officer (11.43 percent). Q10: Which of the following best describes your role in your organization?
Title % #
Executive Director/President/CEO 35.25% 558
Deputy Director/Vice-President/COO 4.74% 75
Development Director or Officer 8.09% 128
Marketing Director of Officer 0.45% 118
Programming Director or Middle-Management Program Officer 11.43% 181
Finance Director or Middle-Management Finance Officer 1.71% 27
Communications/PR Director or Middle-Management Officer 4.67% 74
Artistic Director or Assistant Artistic Director 4.80% 76
Artistic support (e.g. staging, technical) 1.01% 16
Technical (IT) 0.32% 5
Grantmaking Officer 1.71% 27
Government Affairs Director or Officer 0.32% 5
Research Director or Officer 0.51% 8
Board Member 2.78% 44
Clerical Staff 0.82% 13
Executive Assistant 1.45% 23
Other (please specify) 12.95% 20
LS3.1

22
Length of Time in Position: Forty-one percent of respondents have been in their current positions for fewer than three years, while 10.99 percent have been at their current jobs for more than fifteen years. More than 50 percent of all respondents have been at their jobs for fewer than five years, irrespective of the size of the organization’s budget.
LS3.1

23
Age: The percentage of respondents over the age of 60 was 17.25 percent. The percentage of respondents between the ages of 50 and 60 was 20.91 percent, and 17.56 percent of the respondents were under the age of 30.
Most of the respondents were between the ages of 31 and 40, followed by respondents between 51 and 60, between 41 and 50, over 60, between 26 and 30, and under 25. Thirty-eight percent of respondents were over 50, and 45 percent were between the ages of 30 and 50.
LS3.1

24
Gender: Nearly 70 percent of the survey respondents were female, and 30 percent were male.
LS3.1

25
Internal Communications Within the Arts Organization
“The single biggest problem in communication is the illusion that it has taken place.”
George Bernard Shaw
Most of the arts organizations that responded to the survey do not have a formal, written communication plan for internal communication.
Slightly over one-third of the organizations that responded to the survey have a full-time communications director/officer.
LS3.1
26
AGE: The age of the organization seems to have little bearing on whether or not it has an internal communications plan. Only 15.8 percent of the organizations surveyed that have been in existence for 20 years or more have such a plan, while 11% of those in existence for three years or fewer have such a plan. However, organizations in existence for 20 years or more were twice as likely to have an external communications plan (36 percent) than organizations under three years old (18 percent). Of the older arts organizations surveyed, 84 percent have no internal communications plan and 64 percent had no external communications plan. Regardless of years in existence, the majority of the organizations surveyed do not have a communications staffer. Of the surveyed organizations that are 20 years or older, 44 percent have a communications staffer, compared to only 13 percent of the organizations under three years old. BUDGET SIZE: Based on the results of the survey, the bigger the budget, the more likely the organization is to have a communication plan and/or a communications officer. Communication Tools Most Frequently Used: The most commonly used means of internal communication within the arts organizations surveyed is email, with 91.25 percent of respondents indicating that they use it regularly. The in-person staff meeting was the next most common means of internal communication (69 percent), followed by one-on-one meetings between staff members (64 percent). Forty-eight percent of respondents indicated that they regularly pick up the telephone and call their internal colleagues, with another 30 percent reporting that they often use the phone. At the other end of the spectrum, 72 percent of respondents indicated that they never use blogging for internal communications, 50 percent never use Twitter internally, 47 percent never send out internal memos, and 40 percent never use video conferencing. Twenty-two percent of respondents regularly use text messaging, whereas 26 percent never do. Thirty-one percent of the survey respondents use Facebook to communicate internally, while 31 percent never do. Twenty-seven percent of survey respondents use an internal newsletter, while 36 percent never do. Organizational Age: In terms of the ages of the organizations surveyed, little difference was found regarding which methods they use to communicate, except for the use of newsletters, in which case organizations six years or older are three times more likely to use newsletters than newer organizations.
LS3.1

27
Of the organizations surveyed, older organizations use the telephone twice as much as newer organizations. Older organizations also use one-on-one meetings more regularly than newer organizations. All of the organizations surveyed use emails, social platforms, and Twitter for internal communications to relatively the same extent. On average, 40 percent of the various types of arts organizations surveyed use Twitter. More than 90 percent of the organizations surveyed use email.
• On average, over 60 percent of the arts organizations surveyed have regular staff or department meetings and one-on-one meetings with staff.
• Most (more than 50 percent) of the organizations surveyed never use video
conferencing.
LS3.1

28
• Without question, email is the most used communication tool, with 91 percent of the
organizations surveyed using email regularly. The majority of respondents indicated they respond to emails within one day.
LS3.1
29
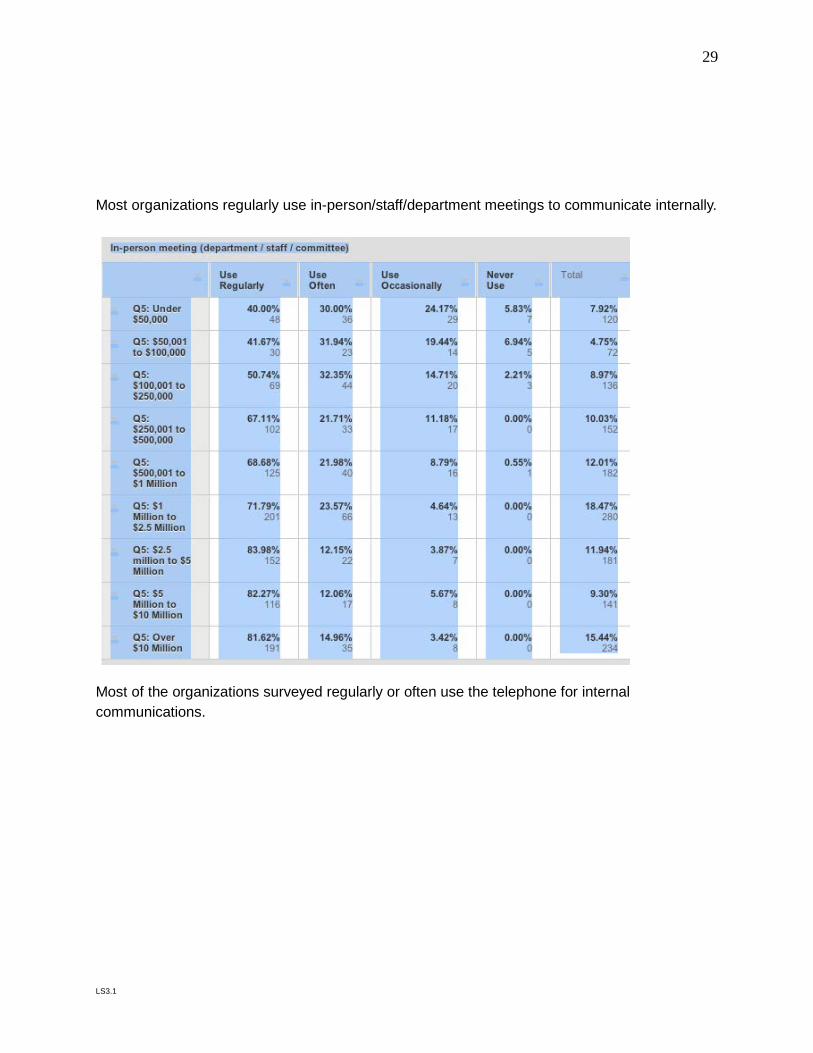
Most organizations regularly use in-person/staff/department meetings to communicate internally.
Most of the organizations surveyed regularly or often use the telephone for internal communications.
LS3.1

30
Informational Source Preferences: Of the sources of information read and reviewed by the survey respondents, information from colleagues and peers is read the most. Next were communications from constituents and community leaders, followed by communications from other arts organizations within their discipline, and then communications from foundations. Communications from consultants, researchers, universities, and general nonprofits (other than arts organizations) ranked low. Nearly 12 percent of the survey respondents never read blogs.
LS3.1

31
LS3.1
32
External Communication By and Between Arts Organizations and Others Within the Nonprofit Arts Sector
“Many attempts to communicate are nullified by saying too much.”
Robert Greenleaf
“The most important thing in communication is hearing what isn’t said.”
Peter Drucker
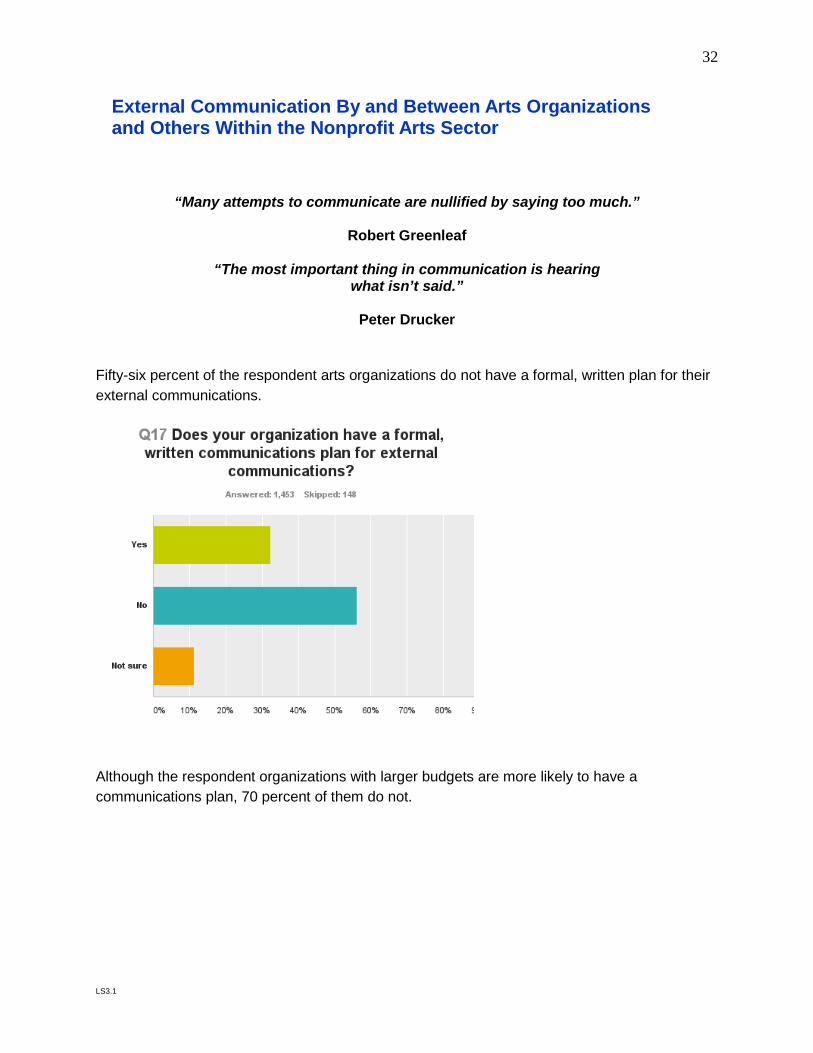
Fifty-six percent of the respondent arts organizations do not have a formal, written plan for their external communications.
Although the respondent organizations with larger budgets are more likely to have a communications plan, 70 percent of them do not.
LS3.1

33
Regarding the largest of the social networking platforms used for communication, Facebook and Twitter, of those that use Facebook to communicate externally, 23% post, on average, once per day, while 10% post once per week.
Based on the results of the survey, the smaller an organization’s budget, the more likely it is to use Facebook on a regular basis for its communications.
LS3.1

34
Facebook Posting Frequency: There is little difference in the frequency of Facebook postings based on the age of the organizations surveyed, but the oldest organizations tweet two times more frequently than the organizations that have been in existence for six years or fewer.
LS3.1

35
Regarding the organizations that use Twitter to communicate, 12 percent tweet only once per day, 20 percent tweet two to four times per day, and 26 percent tweet only a few times per week. Only 4 percent tweet more than five times per day.
Use of Social Media: There are two kinds of social networking communication platforms that are outside of the normal kinds of communications in which nonprofit arts organizations usually engage: 1) messaging to attract audiences/visitors/donors, and 2) crowdfunding campaigns to raise funds.
In response to the question: “How frequently does your organization use social media to attract audiences/visitor/donors?”, 47 percent of respondents indicated that they use social media daily. Nineteen percent use social media “as needed.” One-quarter of the arts organizations that responded to this survey indicated that they do not use social media at all.
**For a study on Arts Organizations and Digital Technologies for the Pew Research Center (Kristin Thompson, Kristen Purcell and Lee Raine—2013), see: http://www.pewinternet.org/2013/01/04/arts-organizations-and-digital-technologies/
LS3.1

36
Crowdfunding: Only 19 percent of respondents indicated that they had engaged in a crowdfunding campaign in the past year, and of those organizations, only 18 percent had engaged in more than one such campaign. Twenty percent of the organizations that had engaged in a crowdfunding campaign reported raising $5,000 to $10,000, and 20 percent of the organizations reported raising $10,000 to $20,000.
LS3.1

37
LS3.1
38
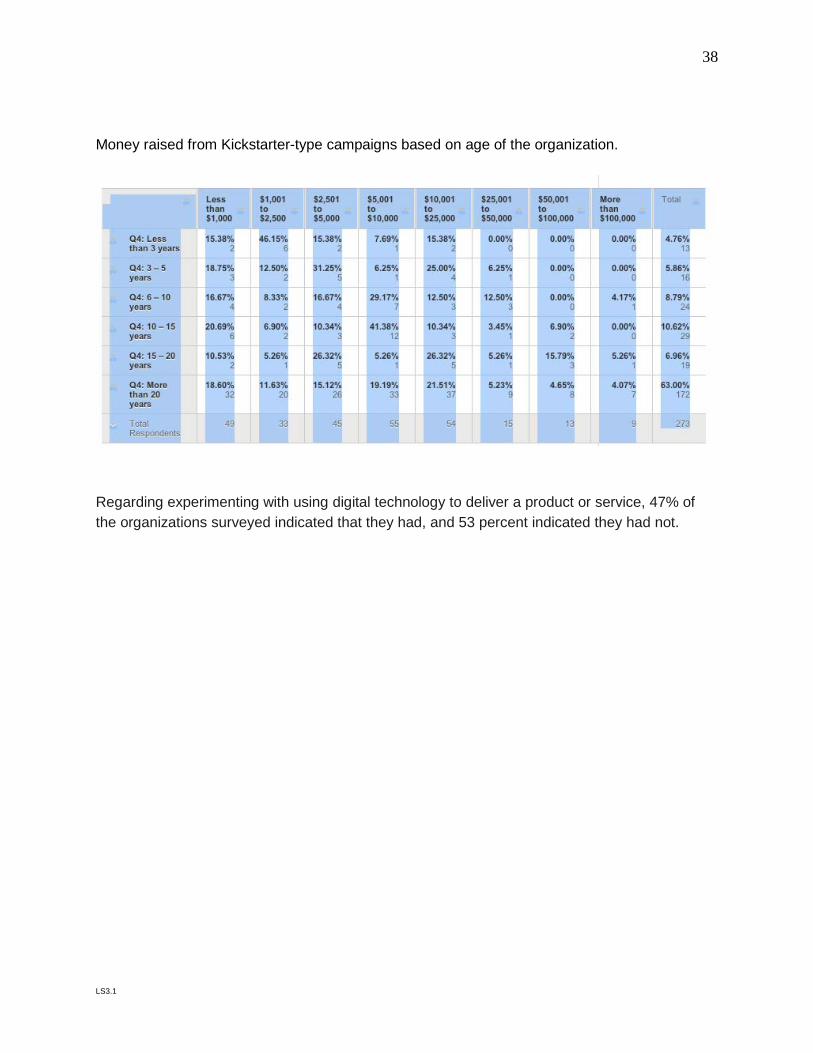
Money raised from Kickstarter-type campaigns based on age of the organization.
Regarding experimenting with using digital technology to deliver a product or service, 47% of the organizations surveyed indicated that they had, and 53 percent indicated they had not.
LS3.1
39
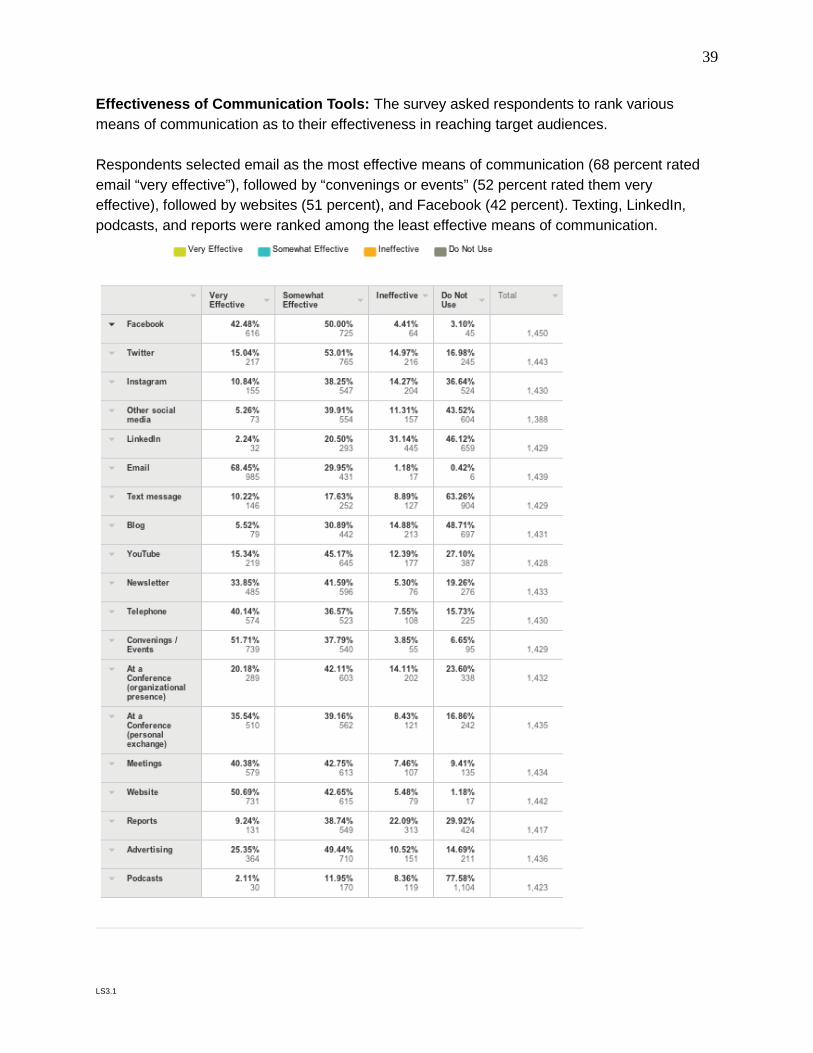
Effectiveness of Communication Tools: The survey asked respondents to rank various means of communication as to their effectiveness in reaching target audiences. Respondents selected email as the most effective means of communication (68 percent rated email “very effective”), followed by “convenings or events” (52 percent rated them very effective), followed by websites (51 percent), and Facebook (42 percent). Texting, LinkedIn, podcasts, and reports were ranked among the least effective means of communication.
LS3.1

40
Managing Communication and Information
“As a general rule, the most successful man in life
is the man who has the best information”
Benjamin Disraeli
“The result of information overload is usually distraction, and it dilutes your focus and takes you off your
game.”
Zig Ziglar
There is considerable evidence suggesting that the onslaught of information is overwhelming to a percentage of today’s workers. The survey asked respondents if they agreed or disagreed with five statements about whether the level of information/communication is manageable. Only 8 percent of respondents indicated that they “highly agreed” that they “usually get everything they need to get done during the workday.” An additional 22 percent indicated that they “agreed” with that statement, while 40 percent indicated that they “highly agreed” that “there aren’t enough hours in the day to get everything done that I need to get done,” and another 24 percent indicated that they “agreed.” Thirty-six percent of respondents indicated that they “highly agreed,” and another 26 percent indicated that they “agreed” that they had to work nights and on weekends to keep up. Ten percent, plus an additional 14 percent “highly agreed” or “agreed” that they worked “24/7.” These findings suggest that arts organizations may need to address the issue of the impact on increased communication and information on time and productivity.
LS3.1

41
When asked to select the statement that best described their ability to keep pace with the current volume of communication/information, the majority of respondents (63 percent) agreed that it is growing and becoming increasingly difficult to keep up. Fifteen percent of respondents indicated that they believed the volume of communication/information was out of hand already, and only 21 percent indicated that they believed the volume is reasonable and experience no problem in handling it.
LS3.1

42
LS3.1

43
Keeping Pace with Information: The responses indicate that the increase in the volume of information and access to that information, plus the onus of communicating, have resulted in an overload that arts workers are coping with, but barely.
“Keeping up with email and the responses needed, which entails reading, analyzing, and strategizing, is part of my #1 challenge.” “In my experience, it now often takes two or three emails to get a response from many colleagues/vendors/presenters”. “There is no way I could keep up with email if I didn't put in significantly more time over 40-50 hours a week. In my department we use email to collaborate on active projects, so I constantly have to tune out the majority of email to keep up with the collaboration on multiple projects. Then I try to weed through all the other email later so I don't miss something.” “Email, while useful, can become a time suck for internal organizational
communication. I wonder if there are better solutions for our sector, like project management software, i.e. Asana. But then someone needs to prototype this and share best practices.”
LS3.1

44
“Email is big time killer, but my solution has been to schedule it three times a day: beginning, middle, and end.” Hours Spent Per Communication Tool Per Week: When asked how many hours per work week respondents spent on various means of communication or information access, reading and responding to emails was the runaway leader, with 18 percent spending 16 to 20 hours per work week, and 16 percent spending 21 or more hours per work week dealing with emails. That’s an average of 3.5 to 5 hours per day dealing with emails. No other activity measured in this survey captures as much of the respondents’ time per week as managing emails. Clearly, that time expenditure comes at the cost of other important activities. Twenty-seven percent of respondents spend four to six hours per week talking on the telephone and 12 percent spend seven to ten hours on the phone (an average of one to two hours per day). Forty-five percent of respondents spend one to three hours per week in staff or department meetings, 41 percent spend an equal amount of time surfing the web, 41 percent spend the same amount of time conferring with colleagues outside of their organizations. Fifty percent of respondents spend one to three hours reading internal memos/communications, another 20 percent spent four to six hours on internal memos/communications. Fifteen percent of respondents reported spending no time reading internal memos/communications. One-third of respondents spend no time reading blogs, 21 percent spend no time reading newsletters, and 14 percent spend no time reading studies, research, or reports. Forty-seven percent of respondents reported spending one to three hours per week on social networks, and 23 percent reported spending four to six hours on social networks. The findings, taken together, suggest that all means of communication account for the majority of work time.
LS3.1

45
A rough averaging of hours per week spent on all of the categories in the above chart suggests that arts administrators spend an average of two hours per week on each activity, except for conferring one-on-one with coworkers (4 hours) and dealing with emails (10 hours), totaling 32 hours per week. In a theoretical 40-hour work week, that leaves just eight hours for every other kind of work activity. Based on the results of the survey, the larger the staff, the more time spent reading emails. Conversely, the smaller the staff, the more time spent on social networks. When coupled with the response that over 50 percent of arts workers feel they must work nights and on weekends to catch up, it is clear that some of the above activities are done outside the workplace and the normal business hours of 9 to 5.
LS3.1

46
The question becomes: Could the above categories of work be reduced in order to free up time for other work and allow workers to complete their business tasks within regular working hours?
LS3.1

47
Studies, Reports, and Research Review: We were interested in the sector’s response to the increasing number of studies, surveys, research, and reports crossing respondents’ desks. We asked how many such documents they received, on average, in a given month. Fifty-four percent received between three and ten. Twelve percent received more than ten.
LS3.1

48
Of the reports the respondents received, we asked how many they actually read (at least in part). Fifty-six percent read one to two, 6 percent do not read any, and less than 2 percent read ten or more.
Of the reports they receive in a given week, 41 percent of respondents indicated that they usually read select sections, and that was true irrespective of the age of the organization. Twenty-eight percent scan the whole report. Only 25 percent scan or read the entire executive summary--flying in the face of the conventional wisdom that an executive summary is the best way to get people familiar with a report or study. “So often the information I receive is so broad that a direct application to my organization requires reflective time, which I don't have. Then new information arrives and the good ideas from a previous report are overshadowed by the next before any implementation can actually be done.”
“Sometimes the hardest part about increased volumes of communication is understanding at a glance which are the priorities and which can be bookmarked for later.”
“Much of the external information I receive from foundations, consultants, etc. isn't very nuanced, particularly when it attempts to generalize about the nonprofit arts industry. So I read it and understand it, but am left thinking, "Wow, they put in a lot of effort for not a lot of insight."
LS3.1

49
“I feel sometimes like we are constantly barraged with information meant to help us, but a lot of times, I see it regurgitated among consultants/foundations and spit back out again in a different format. It's as if we are taking the same 500 words and mixing them up with more adjectives as per platform/audience. Sometimes I get good information, but lately I am feeling like we are all talking at once just to assure ourselves that 'change' is happening.”
“The most overwhelming thing for me is the number of digests/reports/blogs/etc. that I feel I need to keep up with in order to know what is going on in my field(s). I filter the majority of them into a separate folder so as not to lose emails from staff and constituents, but then I rarely manage to go back and review the information. I've found that I have to be very selective about which things I open daily and even then tend to only scan the headlines. On the flip side, we struggle with how to make sure that our emails to donors and constituents don't get filtered out in the same way.”
LS3.1

50
Perceived Value of Increased Access to Information We were interested in how those in the arts nonprofit sector viewed the increased available information in terms of its usefulness. Twenty-six percent of respondents indicated that they believe about 25 percent of all the information they access in a given month is useful. Seventeen percent of respondents feel that less than 10 percent of it is useful. Only 3 percent feel 75 percent or more of the information available is useful.
LS3.1

51
Challenges to Staying Abreast of the Increase in Information
We asked respondents what their biggest challenges are in staying abreast of all the information to which they now have access. Lack of time is the number one challenge (81 percent), followed by “relating it to my needs and work” (36 percent). Only 7% feel they lack the requisite skill sets to understand the information, 35 percent feel that relating the information to their needs is a big challenge. These results suggest that the sector needs to reframe its priorities and its modus operandi for addressing those challenges. The sector might benefit from time management development training and from each organization establishing policies about where limited time ought to first be applied.
“My biggest challenge in staying abreast of all the information available is sorting through it all to determine what is actually useful and what is just fluff, badly informed/researched, not actually relevant to me, etc. I try to follow trusted resources exclusively, but that can be limiting. On the other hand, there's too much to try new resources often.”
“If we had more staff, which means more money to have folks full-time, some of the overwhelming amount of info could be processed in a shared way...none of us are paid enough to cover the time it takes to analyze it all. . .as if that were possible.” “Our organization has Fear of Missing Out Syndrome and it has a negative affect on our success and productivity.”
LS3.1

52
Impact of Increased Information on Organizations and Administrators We also wanted to know how the increased amount of available information impacts various aspects of the arts administrator respondents’ organizational and personal lives. There is a wide range in the feelings of the respondents on the impact of increased information when comparing the impact on the organization and on the individual administrator. A substantial percentage of respondents indicated that they think the increase in available information positively impact their organizational productivity (35 percent) and their organization’s success (46 percent), innovation (58 percent), and adaptability (47 percent). On the other side of the coin, a substantial number of respondents think the increase in information negatively impacts their stress level (47 percent), time for personal and family relationships (36 percent), time to reflect and brainstorm (44 percent), and ability to effectively manage their time (43 percent). There was a split as to whether or not the increased information positively impacts their personal productivity (36 percent think it does, while 27 percent think the impact is negative).
“The growing amount of information/communication platforms--and improvements in the ability to measure the impact of communications--is beneficial but takes significant amounts of time to process and analyze. The impact on the organization can be positive, but for the staff it becomes more work with the same amount of staff.”
“Too much information can cause paralysis and delay decision-making. What a
company has the resources to accomplish is often very different than the ‘best practices.’”
“It is not communication itself that has had such a negative impact--but this
persistent notion that data and communication trump intuition and experience. There's a balance to be struck. We often think of data, communication, etc. as something more than what it is--a tool to be used as we see fit. As for its impact on time, making time (and, subsequently, not making time) for various things is a choice we make. We forget that art was made--successfully and to the same degree of quality--in the days when we weren't bombarded by studies, data, instant communication, etc.”
“I am constantly in a process of information triage. What to read, what to save, what to share, and what to act on. While an important part of my job, it is also time consuming and stressful.”
LS3.1

53
LS3.1
54
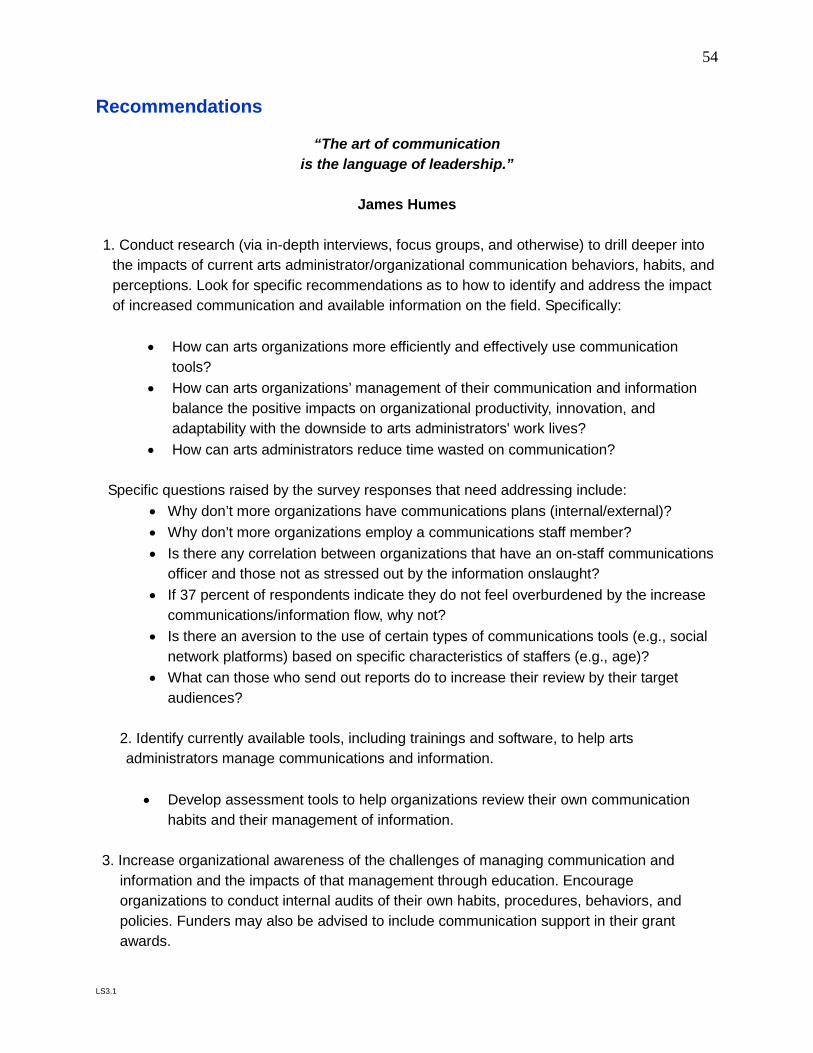
Recommendations
“The art of communication is the language of leadership.”
James Humes
1. Conduct research (via in-depth interviews, focus groups, and otherwise) to drill deeper into
the impacts of current arts administrator/organizational communication behaviors, habits, and perceptions. Look for specific recommendations as to how to identify and address the impact of increased communication and available information on the field. Specifically:
• How can arts organizations more efficiently and effectively use communication
tools? • How can arts organizations’ management of their communication and information
balance the positive impacts on organizational productivity, innovation, and adaptability with the downside to arts administrators' work lives?
• How can arts administrators reduce time wasted on communication?
Specific questions raised by the survey responses that need addressing include: • Why don’t more organizations have communications plans (internal/external)? • Why don’t more organizations employ a communications staff member? • Is there any correlation between organizations that have an on-staff communications
officer and those not as stressed out by the information onslaught? • If 37 percent of respondents indicate they do not feel overburdened by the increase
communications/information flow, why not? • Is there an aversion to the use of certain types of communications tools (e.g., social
network platforms) based on specific characteristics of staffers (e.g., age)? • What can those who send out reports do to increase their review by their target
audiences? 2. Identify currently available tools, including trainings and software, to help arts
administrators manage communications and information.
• Develop assessment tools to help organizations review their own communication habits and their management of information.
3. Increase organizational awareness of the challenges of managing communication and
information and the impacts of that management through education. Encourage organizations to conduct internal audits of their own habits, procedures, behaviors, and policies. Funders may also be advised to include communication support in their grant awards.
LS3.1

55
• Invest in the pedagogy of communication skills. 4. Develop policies regarding communication and information management that might help
individual organizations and administrators in that management, including hiring a communications staffer or assigning communications duties to an existing staff member.
LS3.1

56
Acknowledgements This project was made possible with the support of WESTAF, The John and James Knight Foundation, and the William and Flora Hewlett Foundation. Thanks to Anthony Radich, Leah Horn, Daniel Aid (WESTAF), Dennis Scholl, Jon Sotsky and Luz Gomez (Knight Foundation) and John McGuirk (Hewlett Foundation). The author would also like to acknowledge and thank the following individuals, bloggers, and organizations that helped to widen the field of invitees to take the survey by informing their members and constituents of the project, thus assuring a more representative response pool: Organizations and Individuals: Dance/USA - Amy Fitterer Theatre Communications Group - Teresa Eyring OPERA America - Mark Scorca Association of Performing Arts Presenters - Mario Garcia Durham Arts Education Partnership - Sandra Ruppert Americans for the Arts - Randy Cohen ArtPlace - Jamie Bennett Grantmakers in the Arts - Janet Brown, Jim McDonald National Association of Latino Arts and Culture - Maria Lopez De Leon Bloggers: Joe Patti - Butts in the Seats Thomas Cott - You’ve Cott Mail Doug McLennan - ArtsJournal Ian David Moss - Createquity And a special thanks to the 1,601 survey respondents. Sincerest apologies for anyone inadvertently left off this acknowledgement.
LS3.1


![Eppler Information Overload[1]](https://img.pdfslide.us/doc/110x75/54767aaab4af9fa30a8b62c7/eppler-information-overload1.jpg)