Embed Size (px)
DESCRIPTION
The Information Avalanche: Reducing Information Overload. Jim Gray Microsoft Research Onassis Foundation Science Lecture Series http://www.forth.gr/onassis/lectures/2002-07-15/index.html Heraklion, Crete, Greece, 15-19 July 2002. Thesis. - PowerPoint PPT Presentation
Citation preview
1
The Information Avalanche:Reducing Information Overload
Jim GrayMicrosoft Research
Onassis Foundation Science Lecture Serieshttp://www.forth.gr/onassis/lectures/2002-07-15/index.html
Heraklion, Crete, Greece, 15-19 July 2002

2
Thesis
• Most new information is digital(and old information is being digitized)
• A Computer Science Grand Challenge:– Capture– Organize– Summarize– Visualize
This information• Optimize Human Attention as a resource.• Improve information quality
3
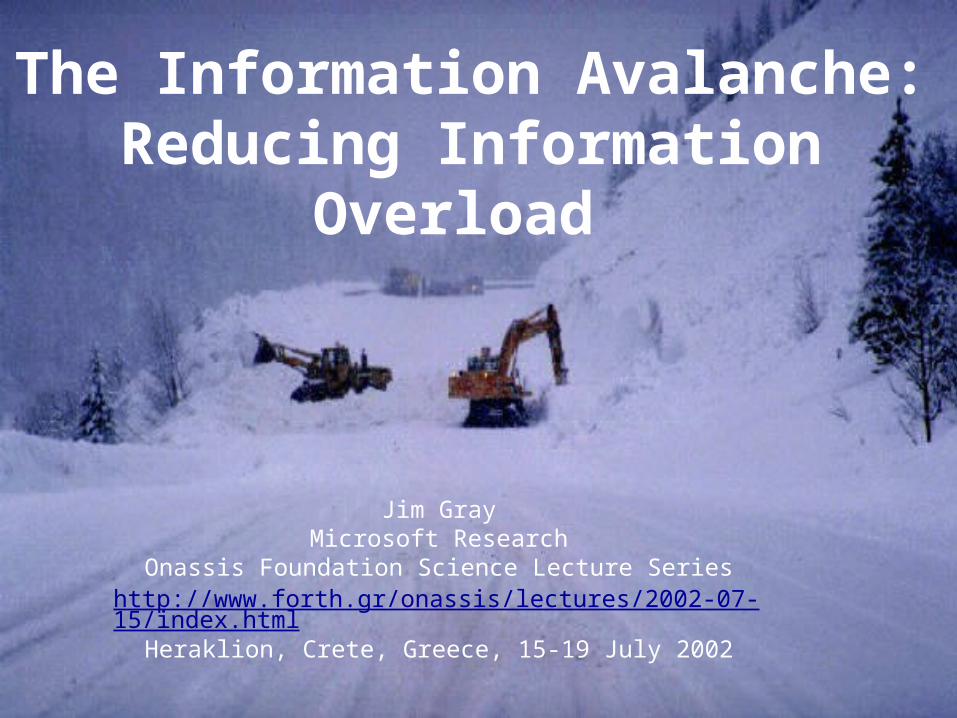
Information Avalanche• The Situation – a census of the data
– We can record everything– Everything is a LOT!
• The Good news– Changes science, education, medicine, entertainment,….– Shrinks time and space– Can augment human intelligence
• The Bad News– The end of privacy– Cyber Crime / Cyber Terrorism– Monoculture
• The Technical Challenges– Amplify human intellect– Organize, summarize and prioritize information– Make programming easy.
4
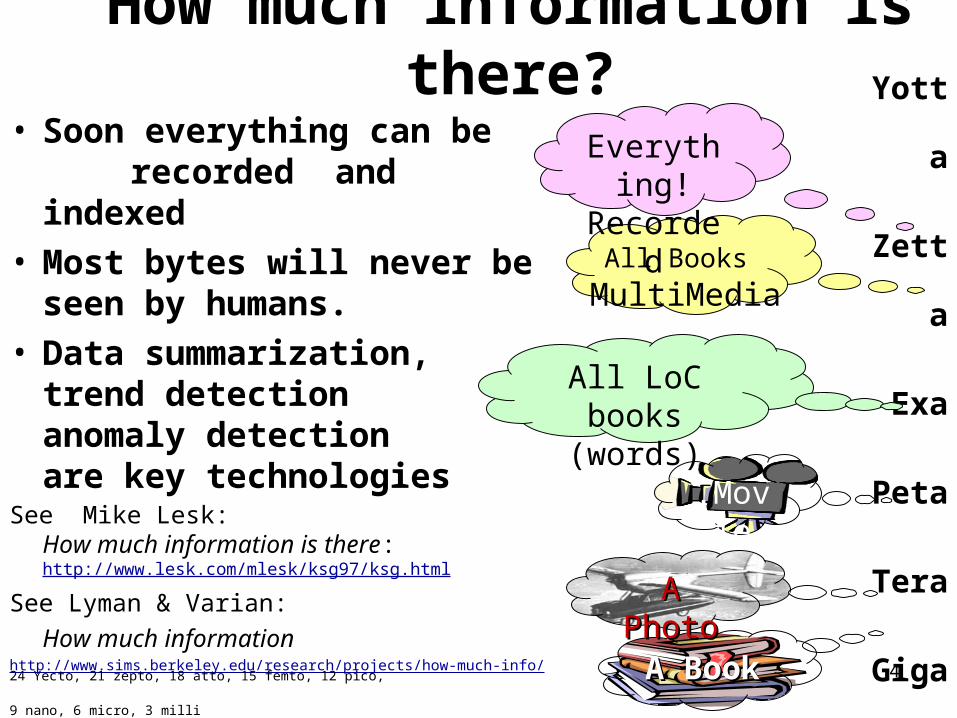
How much information is there?
• Soon everything can be recorded and indexed
• Most bytes will never be seen by humans.
• Data summarization, trend detection anomaly detection are key technologies
See Mike Lesk: How much information is there: http://www.lesk.com/mlesk/ksg97/ksg.html
See Lyman & Varian:
How much informationhttp://www.sims.berkeley.edu/research/projects/how-much-info/
Yotta
Zetta
Exa
Peta
Tera
Giga
Mega
KiloA BookA Book
.Movie
All LoC books(words)
All Books MultiMedia
Everything!
Recorded
A PhotoA Photo
24 Yecto, 21 zepto, 18 atto, 15 femto, 12 pico, 9 nano, 6 micro, 3 milli
5
PB
EB
TB
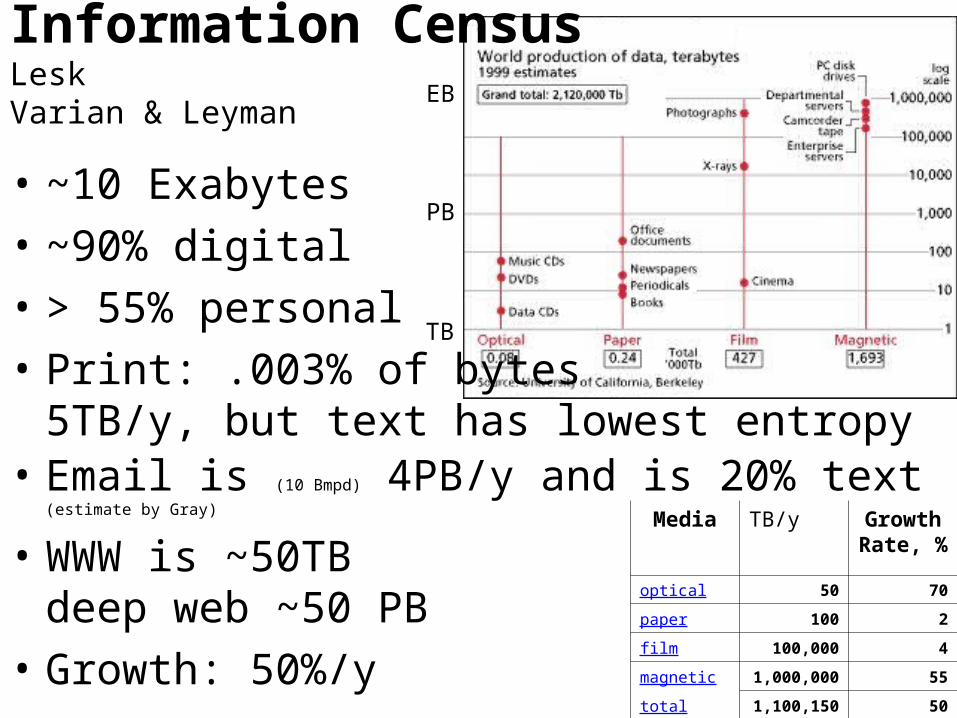
Media TB/y Growth Rate, %
optical 50 70
paper 100 2
film 100,000 4
magnetic 1,000,000 55
total 1,100,150 50
• ~10 Exabytes
• ~90% digital
• > 55% personal
• Print: .003% of bytes5TB/y, but text has lowest entropy
• Email is (10 Bmpd) 4PB/y and is 20% text (estimate by Gray)
• WWW is ~50TBdeep web ~50 PB
• Growth: 50%/y
Information CensusLesk Varian & Leyman
6
TB/y by media log scale (median estimate from Lyman/Varian)
1
10
100
1,000
10,000
100,000
1,000,000
10,000,000
Terabytes/Year Median Estimate
TB
/y
magnetic
film
paper
optical
Growth Rate, %
0
10
20
30
40
50
60
70
80
optical paper film magnetic total
TB/y by media (median estimate from Lyman/Varian)
0
200,000
400,000
600,000
800,000
1,000,000
1,200,000
Terabytes/Year Median Estimate
TB
/y
magnetic
film
paper
optical
93%
7
1E+3
1E+4
1E+5
1E+6
1E+7
1988 1991 1994 1997 2000
disk TB growth: 112%/y
Moore's Law: 58.7%/y
ExaByte
Disk TB Shipped per Year1998 Disk Trend (J im Porter)
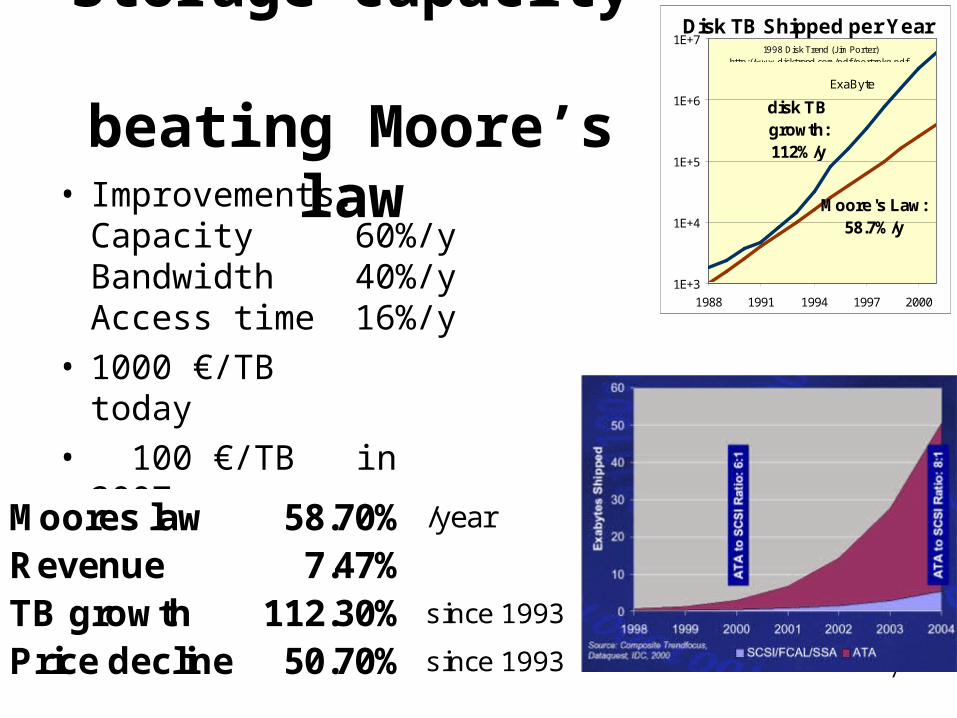
http://www.disktrend.com/pdf/portrpkg.pdf.Storage capacity beating Moore’s law
• Improvements:Capacity 60%/yBandwidth 40%/yAccess time 16%/y
• 1000 €/TB today• 100 €/TB in 2007
Moores law 58.70% /year
Revenue 7.47%TB growth 112.30% since 1993
Price decline 50.70% since 1993
8
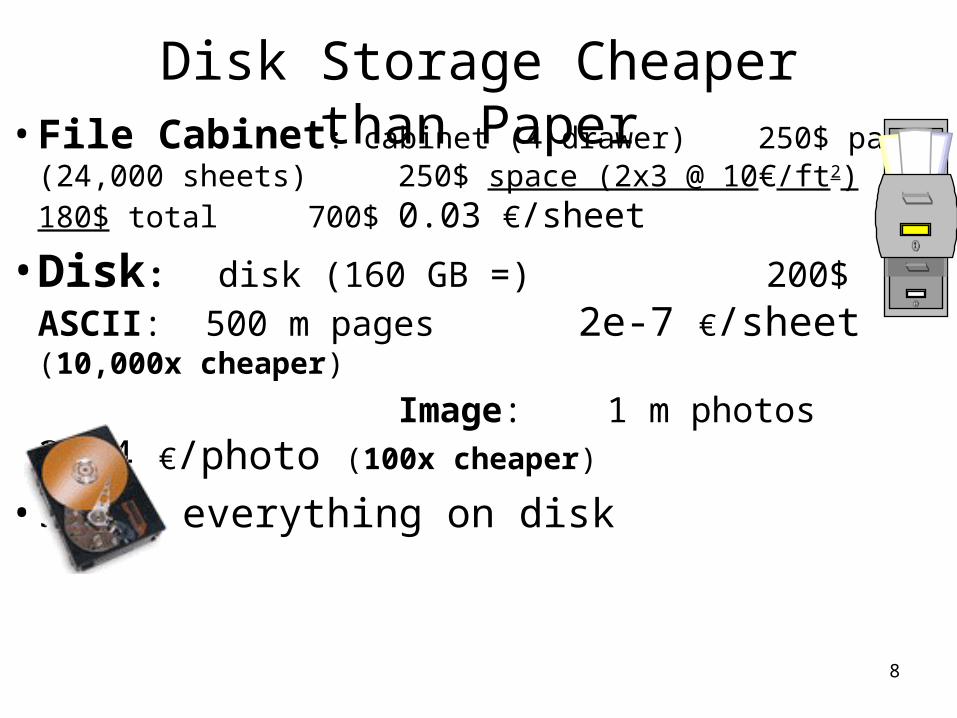
Disk Storage Cheaper than Paper• File Cabinet: cabinet (4 drawer) 250$
paper (24,000 sheets) 250$space (2x3 @ 10€/ft2) 180$
total 700$0.03 €/sheet
• Disk: disk (160 GB =) 200$ASCII: 500 m pages 2e-7 €/sheet (10,000x cheaper)
Image: 1 m photos 3e-4 €/photo (100x cheaper)
• Store everything on disk
9
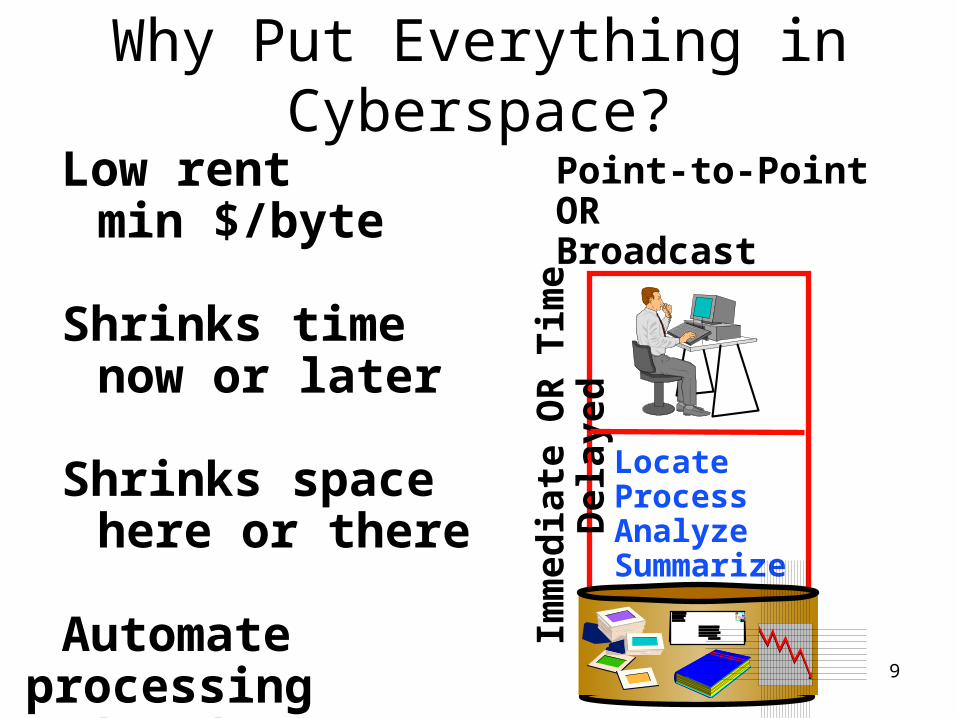
Why Put Everything in Cyberspace?
Low rentmin $/byte
Shrinks timenow or later
Shrinks spacehere or there
Automate processingknowbots
Point-to-Point OR Broadcast
Imm
edia
te O
R T
ime
Del
ayed
LocateProcessAnalyzeSummarize
10
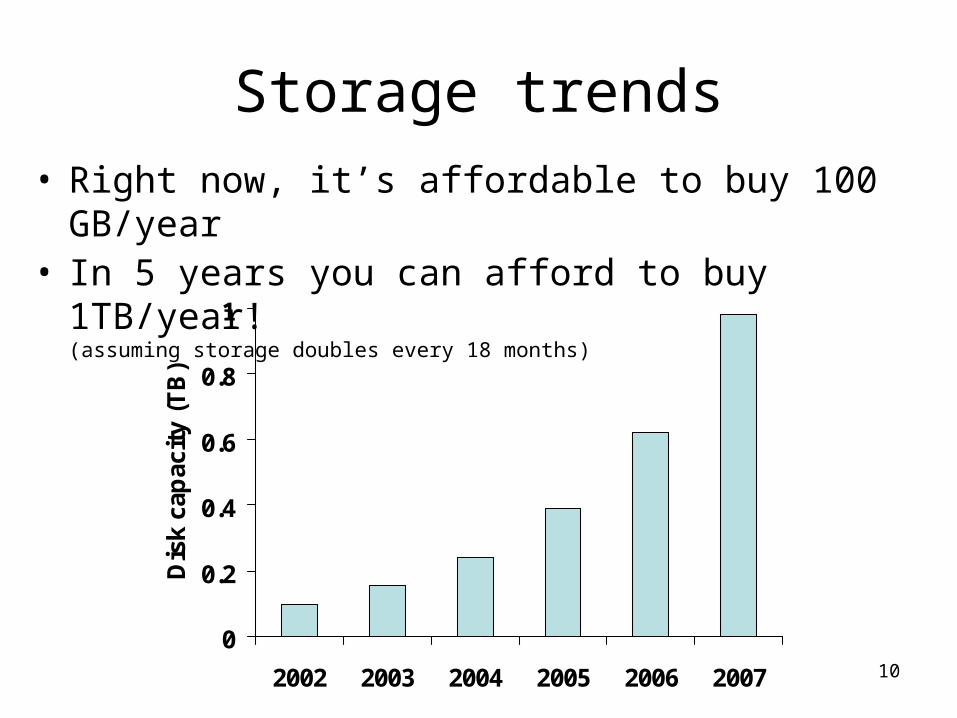
Storage trends• Right now, it’s affordable to buy 100 GB/year• In 5 years you can afford to buy 1TB/year!
(assuming storage doubles every 18 months)
0
0.2
0.4
0.6
0.8
1
2002 2003 2004 2005 2006 2007
Dis
k ca
pac
ity
(TB
)
11
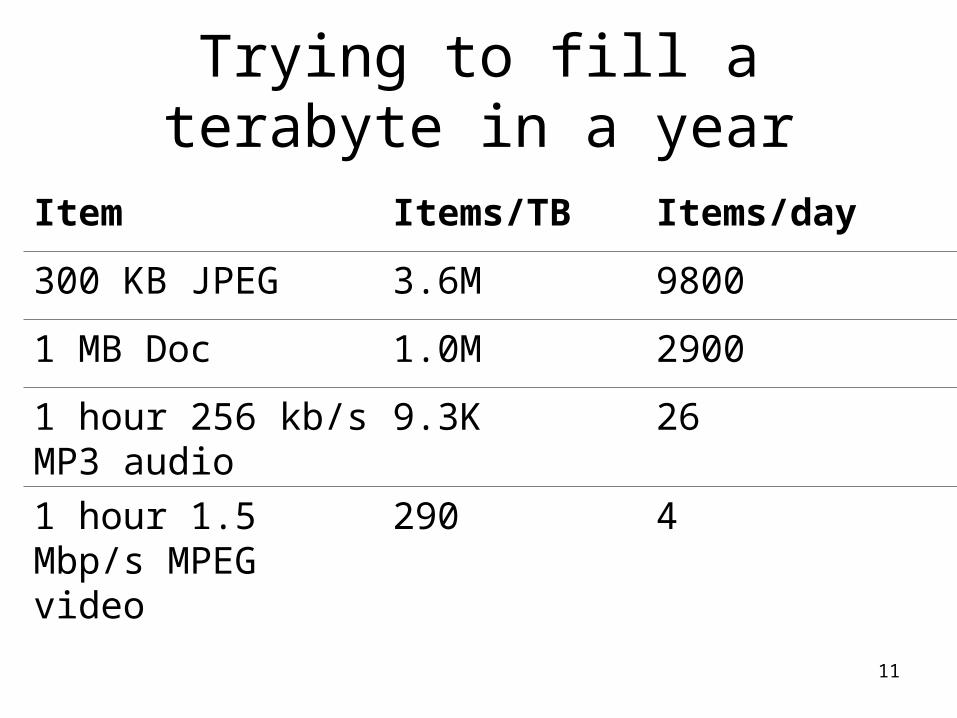
Trying to fill a terabyte in a year
Item Items/TB Items/day
300 KB JPEG 3.6M 9800
1 MB Doc 1.0M 2900
1 hour 256 kb/s MP3 audio
9.3K 26
1 hour 1.5 Mbp/s MPEG video
290 4
12
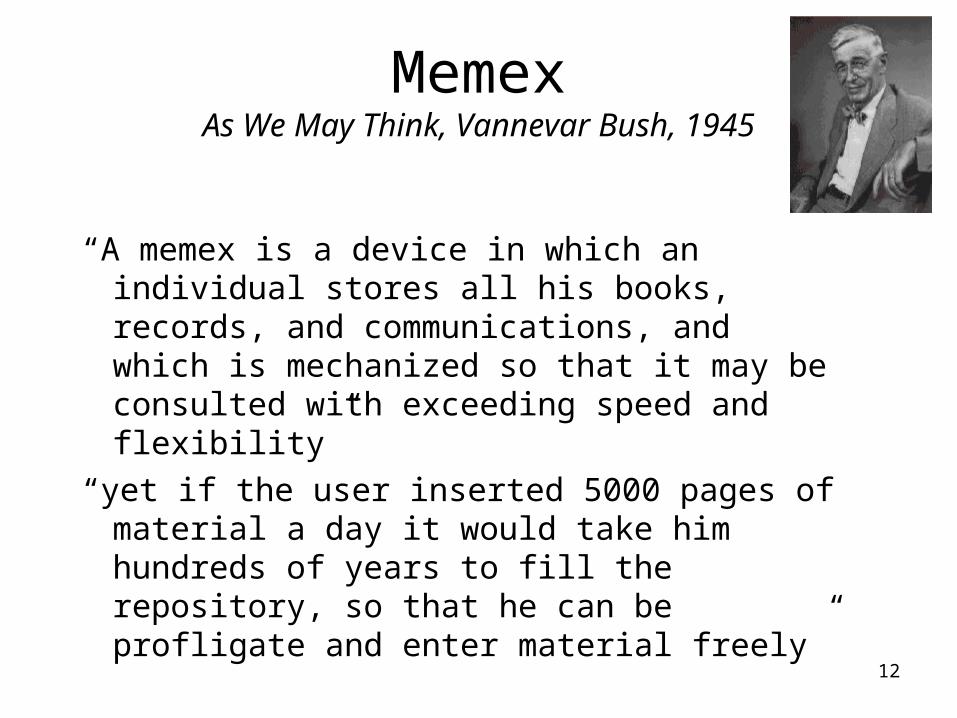
MemexAs We May Think, Vannevar Bush, 1945
“A memex is a device in which an individual stores all his books, records, and communications, and which is mechanized so that it may be consulted with exceeding speed and flexibility”
“yet if the user inserted 5000 pages of material a day it would take him hundreds of years to fill the repository, so that he can be profligate and enter material freely”
13
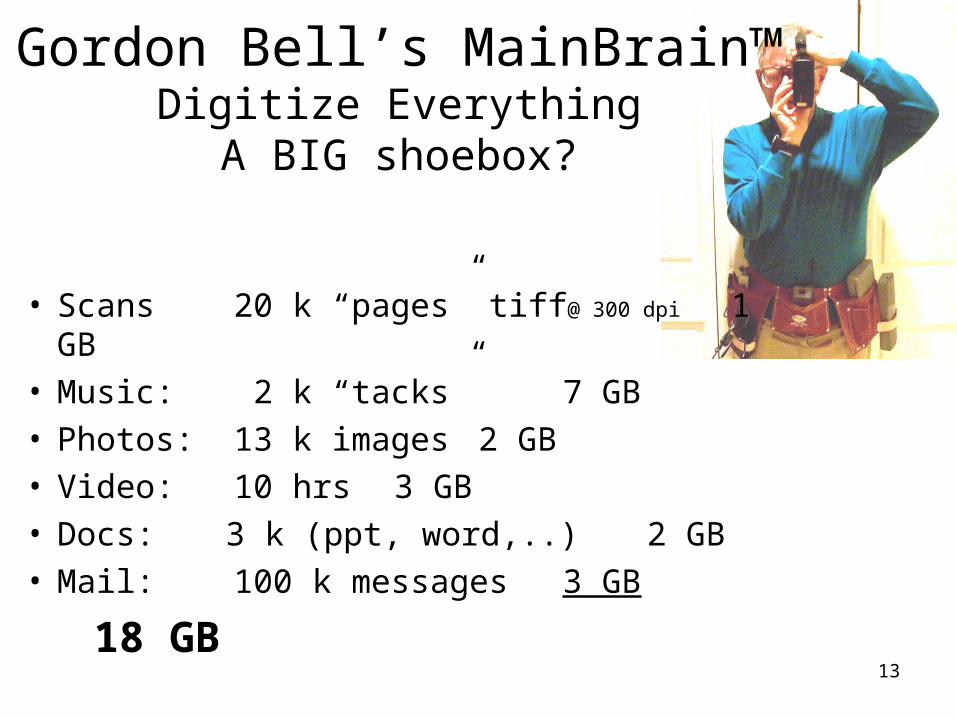
Gordon Bell’s MainBrain™Digitize EverythingA BIG shoebox?
• Scans 20 k “pages” tiff@ 300 dpi 1 GB• Music: 2 k “tacks” 7 GB• Photos: 13 k images 2 GB • Video: 10 hrs 3 GB• Docs:3 k (ppt, word,..) 2 GB• Mail: 100 k messages 3 GB
18 GB
14
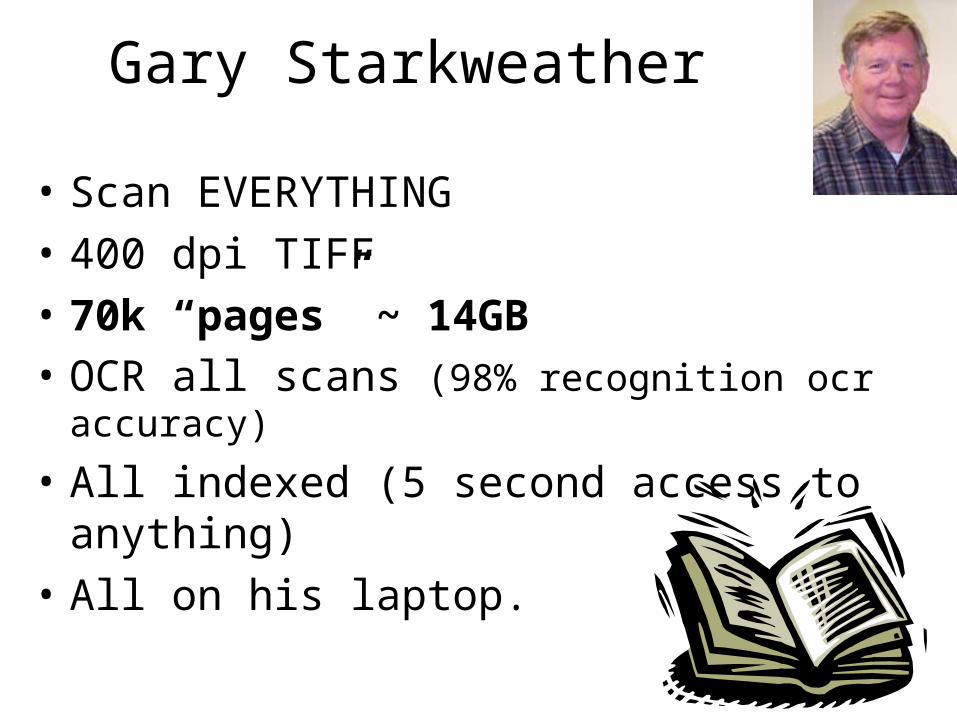
Gary Starkweather
• Scan EVERYTHING
• 400 dpi TIFF
• 70k “pages” ~ 14GB• OCR all scans (98% recognition ocr accuracy)
• All indexed (5 second access to anything)
• All on his laptop.
15
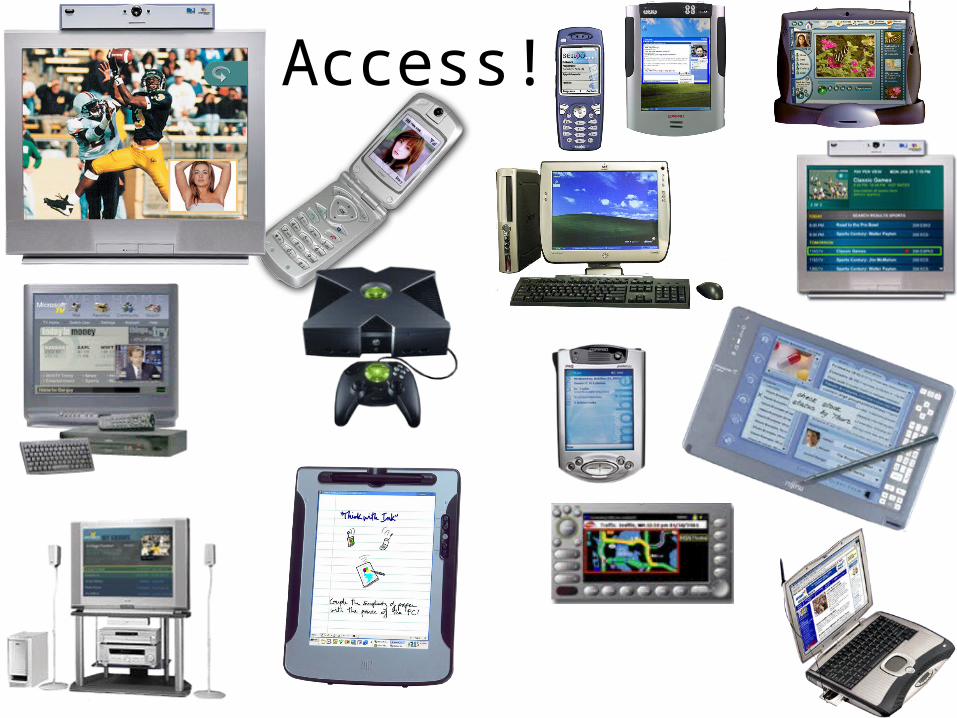
Access!
16
50% personal, What about the other 50%
• Business– Wall Mart online: 1PB and growing….– Paradox: most “transaction” systems have mere
PBs.– Have to go to image/data monitoring for big data
• Government– Online government is big thrust (cheaper, better,…)
• Science
17
CERN Tier 0
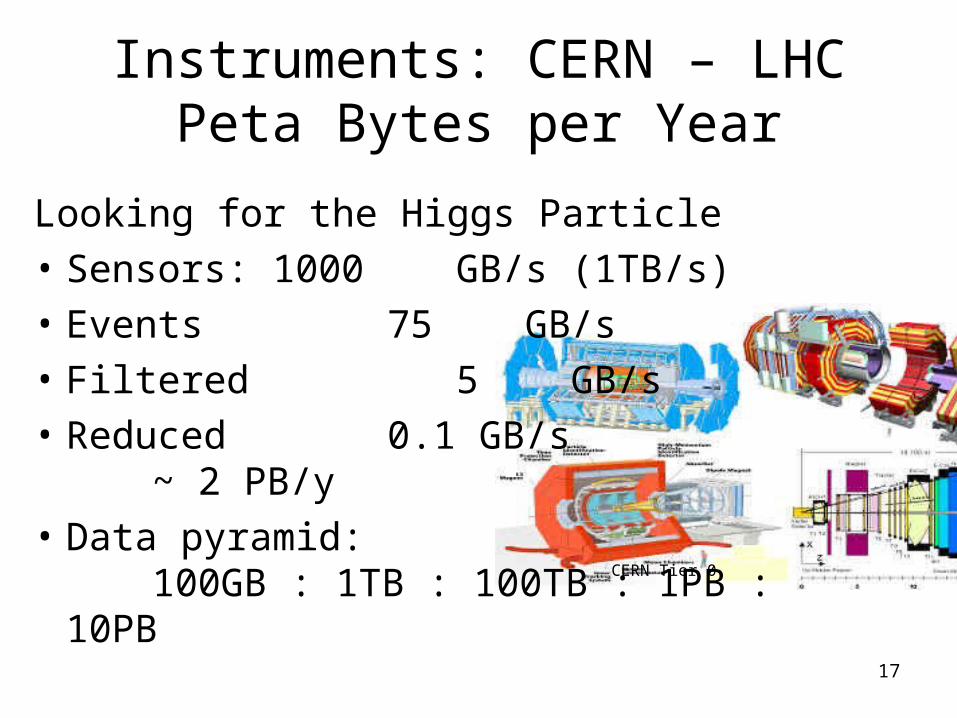
Instruments: CERN – LHCPeta Bytes per Year
Looking for the Higgs Particle
• Sensors: 1000 GB/s (1TB/s)
• Events 75 GB/s
• Filtered 5 GB/s
• Reduced 0.1 GB/s~ 2 PB/y
• Data pyramid: 100GB : 1TB : 100TB : 1PB : 10PB
18
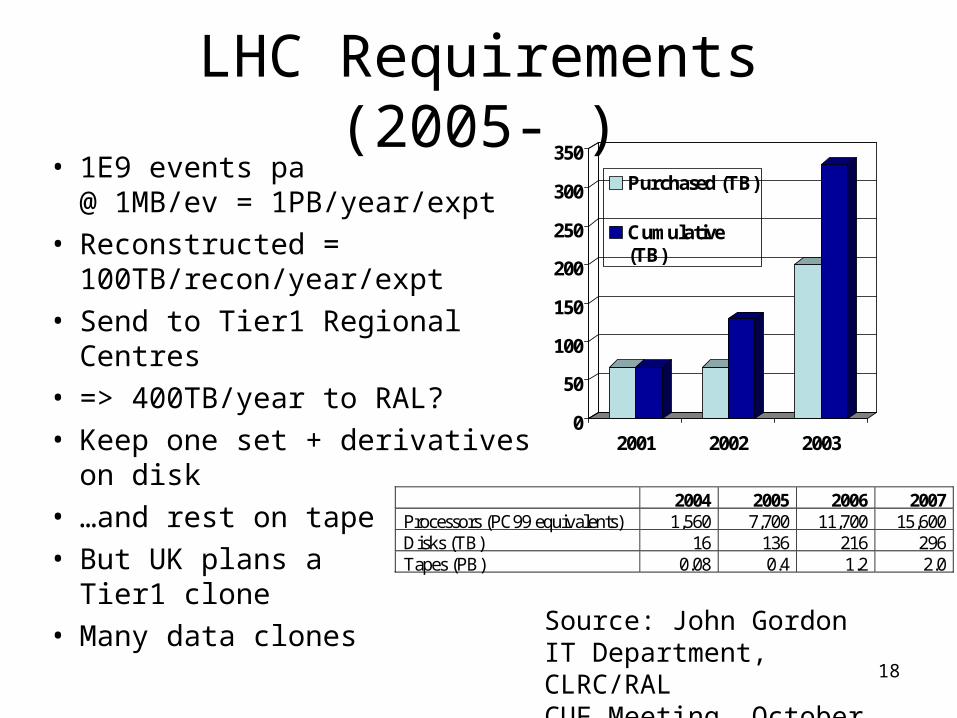
LHC Requirements (2005- )• 1E9 events pa
@ 1MB/ev = 1PB/year/expt• Reconstructed =
100TB/recon/year/expt• Send to Tier1 Regional Centres• => 400TB/year to RAL?• Keep one set + derivatives on disk• …and rest on tape• But UK plans a
Tier1 clone• Many data clones
0
50
100
150
200
250
300
350
2001 2002 2003
Purchased (TB)
Cumulative(TB)
Source: John GordonIT Department, CLRC/RALCUF Meeting, October 2000
2004 2005 2006 2007Processors (PC99 equivalents) 1,560 7,700 11,700 15,600Disks (TB) 16 136 216 296Tapes (PB) 0.08 0.4 1.2 2.0
19
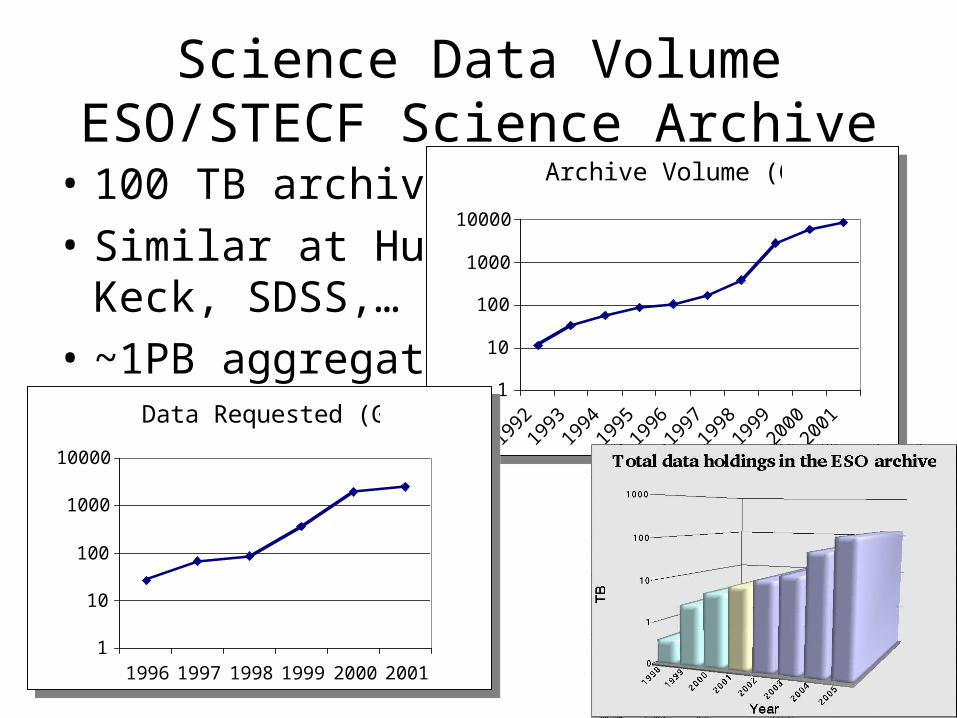
Science Data VolumeESO/STECF Science Archive
• 100 TB archive
• Similar at Hubble, Keck, SDSS,…
• ~1PB aggregate
Archive Volume (GB)
1
10
100
1000
10000
1992
1993
1994
1995
1996
1997
1998
1999
2000
2001
Archive Volume (GB)
1
10
100
1000
10000
1992
1993
1994
1995
1996
1997
1998
1999
2000
2001Data Requested (GB)
1
10
100
1000
10000
1996 1997 1998 1999 2000 2001
Data Requested (GB)
1
10
100
1000
10000
1996 1997 1998 1999 2000 2001
20
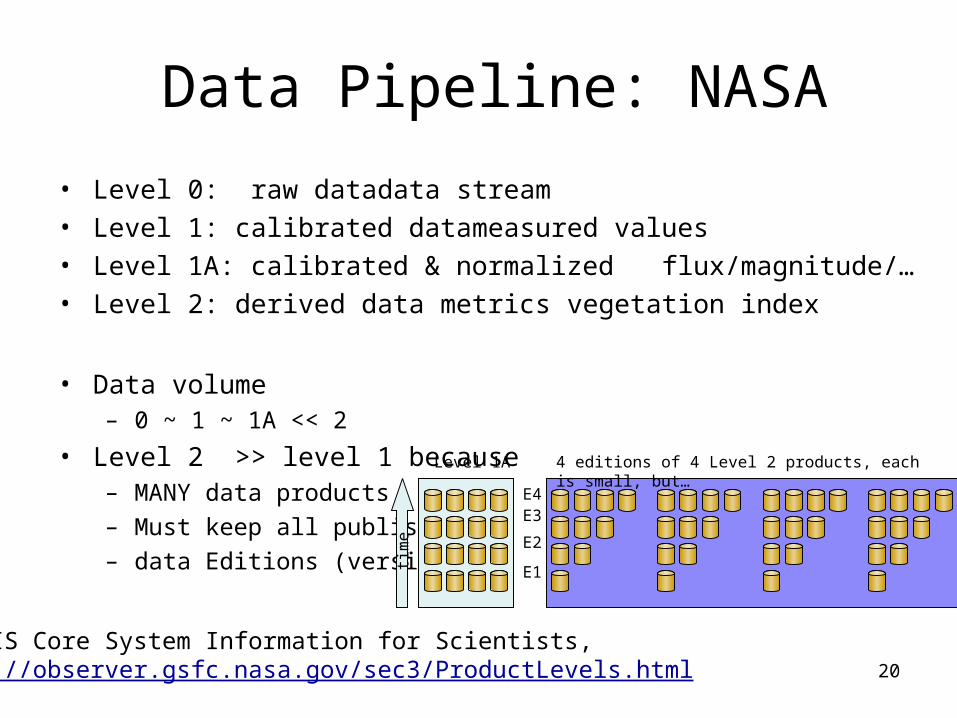
Data Pipeline: NASA
• Level 0: raw data data stream• Level 1: calibrated data measured values• Level 1A: calibrated & normalized flux/magnitude/…• Level 2: derived data metrics vegetation index
• Data volume – 0 ~ 1 ~ 1A << 2
• Level 2 >> level 1 because – MANY data products
– Must keep all published
– data Editions (versions)
EOSDIS Core System Information for Scientists, http://observer.gsfc.nasa.gov/sec3/ProductLevels.html
E1
E2
E3E4
time
Level 1A 4 editions of 4 Level 2 products, each is small, but…
21
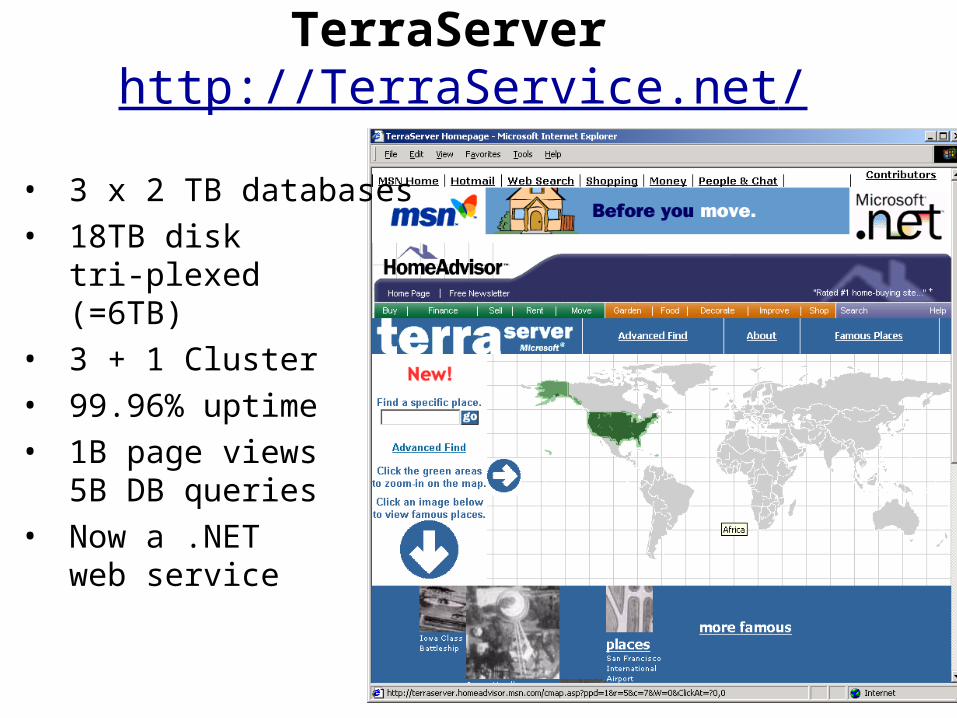
TerraServer http://TerraService.net/
• 3 x 2 TB databases• 18TB disk
tri-plexed (=6TB)
• 3 + 1 Cluster • 99.96% uptime• 1B page views
5B DB queries• Now a .NET
web service
22
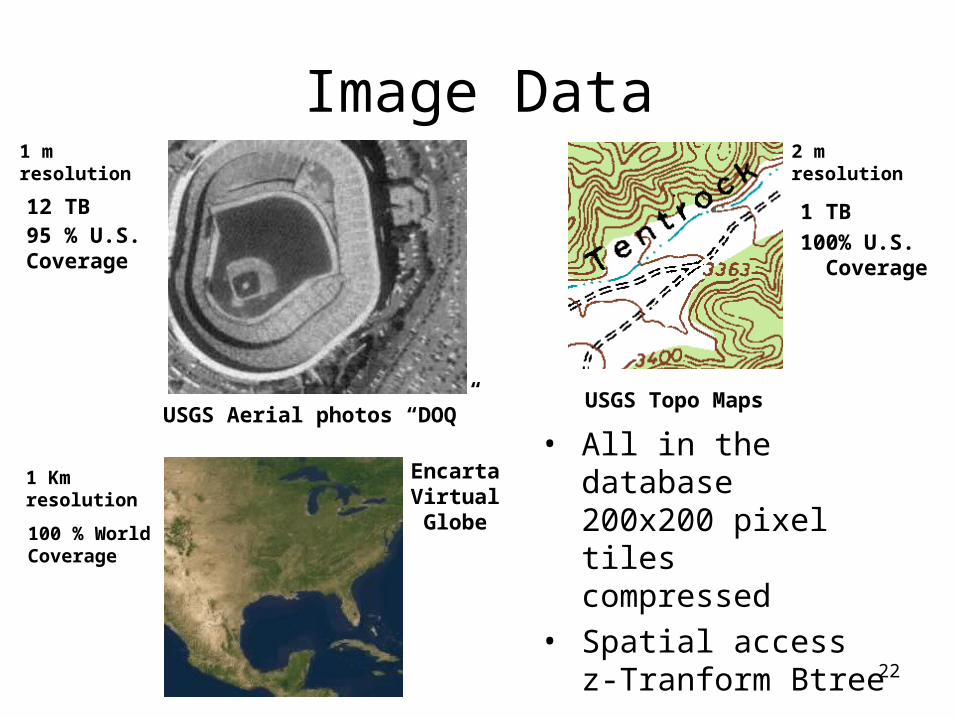
Image Data
USGS Aerial photos “DOQ”USGS Topo Maps
EncartaVirtualGlobe
1 Km resolution
100 % WorldCoverage
• All in the database 200x200 pixel tiles compressed
• Spatial access z-Tranform Btree
12 TB95 % U.S. Coverage
1 m resolution
1 TB100% U.S. Coverage
2 m resolution
23
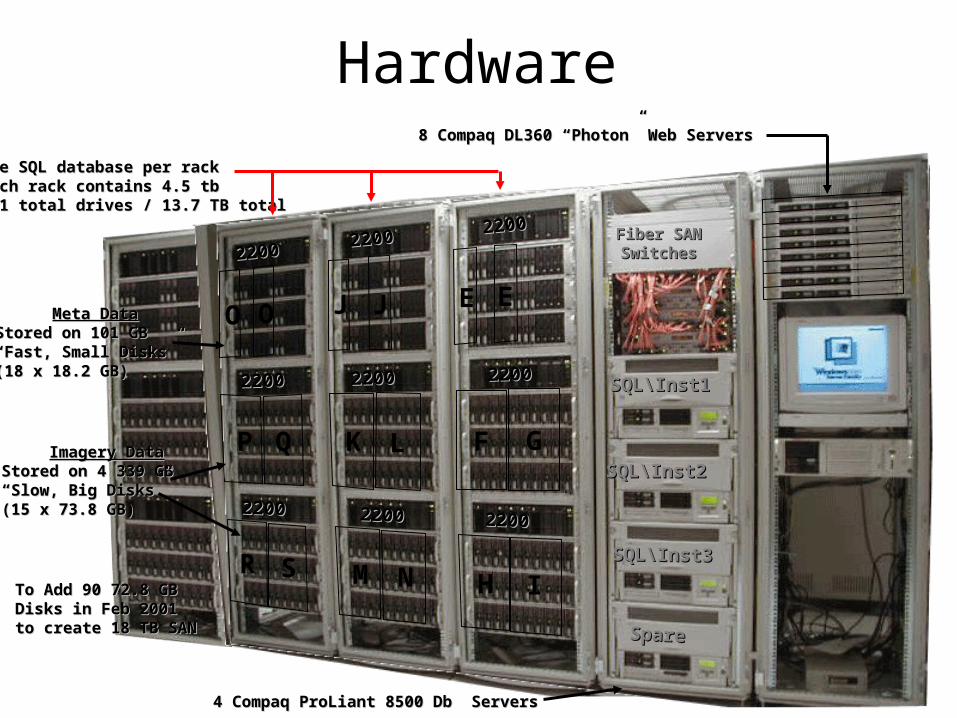
Hardware
SQL\Inst1SQL\Inst1
SQL\Inst2SQL\Inst2
SQL\Inst3SQL\Inst3
SpareSpare
F GLKP Q
E EJ JO O
IHM NR S
22002200 22002200 22002200
220022002200220022002200
22002200 22002200 22002200
One SQL database per rackOne SQL database per rackEach rack contains 4.5 tbEach rack contains 4.5 tb261 total drives / 13.7 TB total261 total drives / 13.7 TB total
Meta DataMeta DataStored on 101 GBStored on 101 GB““Fast, Small Disks”Fast, Small Disks”(18 x 18.2 GB)(18 x 18.2 GB)
Imagery DataImagery DataStored on 4 339 GBStored on 4 339 GB““Slow, Big Disks”Slow, Big Disks”(15 x 73.8 GB)(15 x 73.8 GB)
To Add 90 72.8 GBTo Add 90 72.8 GBDisks in Feb 2001Disks in Feb 2001to create 18 TB SANto create 18 TB SAN
8 Compaq DL360 “Photon” Web Servers8 Compaq DL360 “Photon” Web Servers
Fiber SANFiber SANSwitchesSwitches
4 Compaq ProLiant 8500 Db Servers4 Compaq ProLiant 8500 Db Servers
24
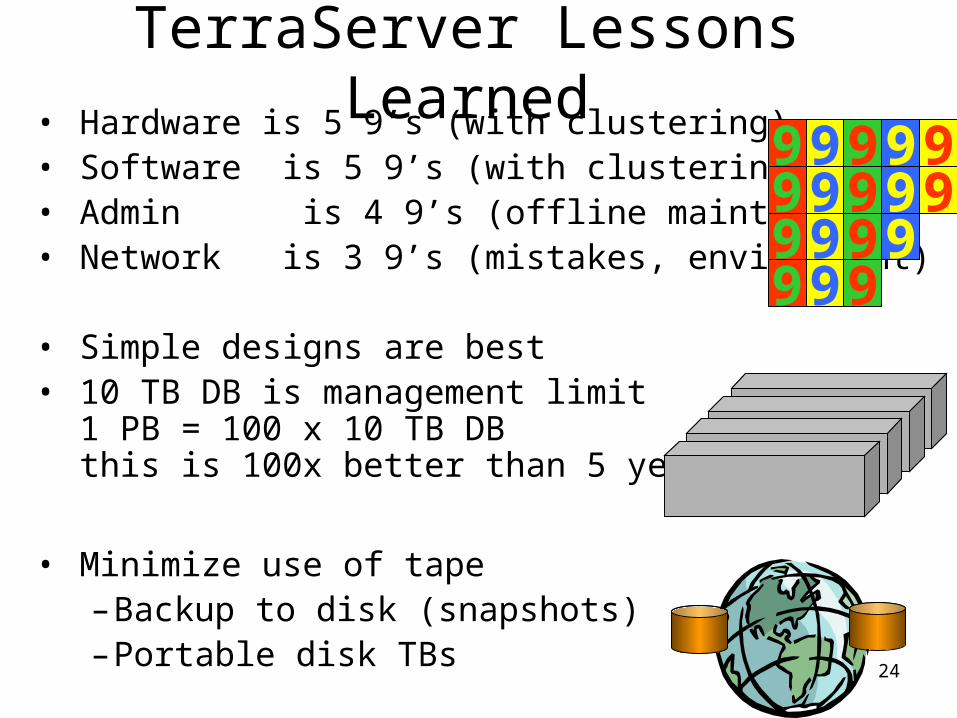
TerraServer Lessons Learned• Hardware is 5 9’s (with clustering)• Software is 5 9’s (with clustering)• Admin is 4 9’s (offline maintenance)• Network is 3 9’s (mistakes, environment)
• Simple designs are best• 10 TB DB is management limit
1 PB = 100 x 10 TB DBthis is 100x better than 5 years ago.
• Minimize use of tape–Backup to disk (snapshots)–Portable disk TBs
99 9999 9 9 999 9 999 99
25
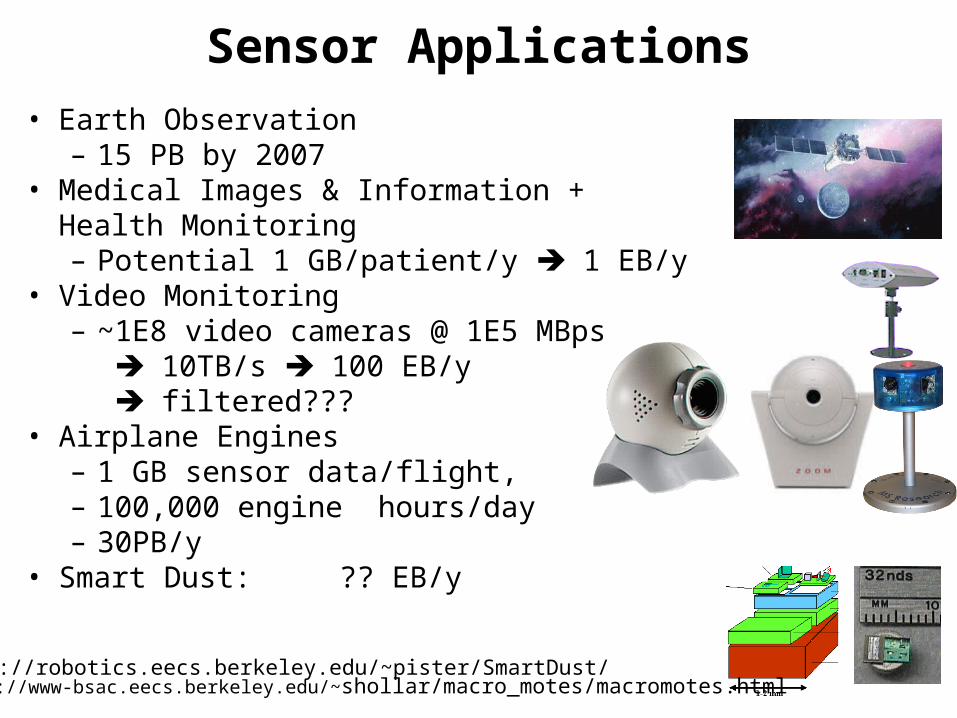
Sensor Applications• Earth Observation
– 15 PB by 2007• Medical Images & Information + Health
Monitoring– Potential 1 GB/patient/y 1 EB/y
• Video Monitoring– ~1E8 video cameras @ 1E5 MBps
10TB/s 100 EB/y filtered???
• Airplane Engines– 1 GB sensor data/flight, – 100,000 engine hours/day– 30PB/y
• Smart Dust: ?? EB/y
http://robotics.eecs.berkeley.edu/~pister/SmartDust/http://www-bsac.eecs.berkeley.edu/~shollar/macro_motes/macromotes.html
26
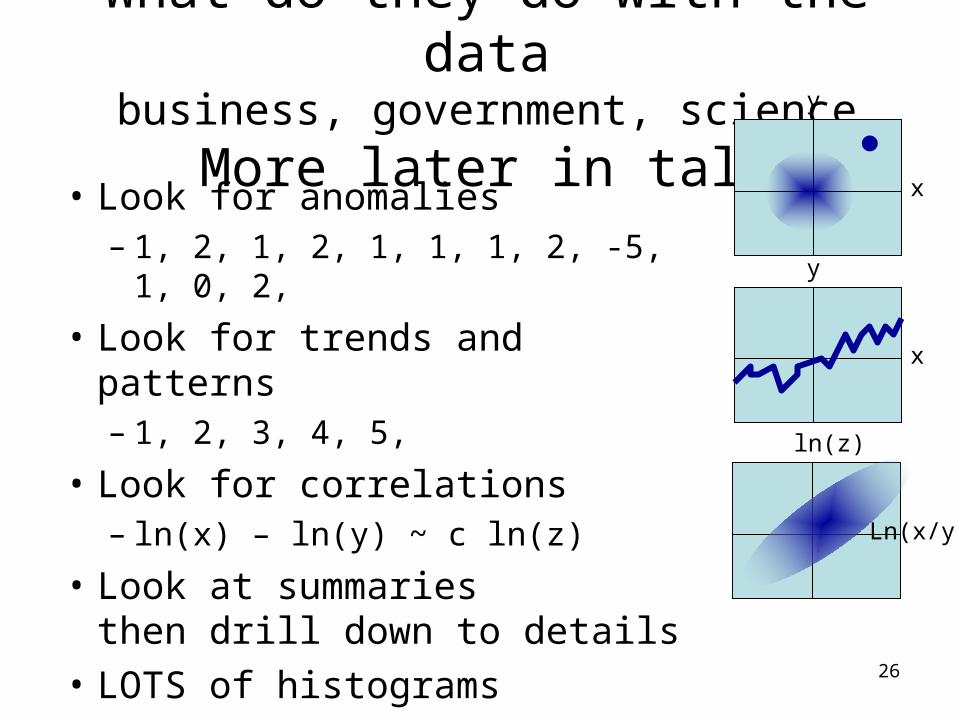
What do they do with the databusiness, government, science
More later in talk• Look for anomalies
– 1, 2, 1, 2, 1, 1, 1, 2, -5, 1, 0, 2,
• Look for trends and patterns– 1, 2, 3, 4, 5,
• Look for correlations– ln(x) – ln(y) ~ c ln(z)
• Look at summaries then drill down to details
• LOTS of histograms
y
x
y
x
ln(z)
Ln(x/y)
27
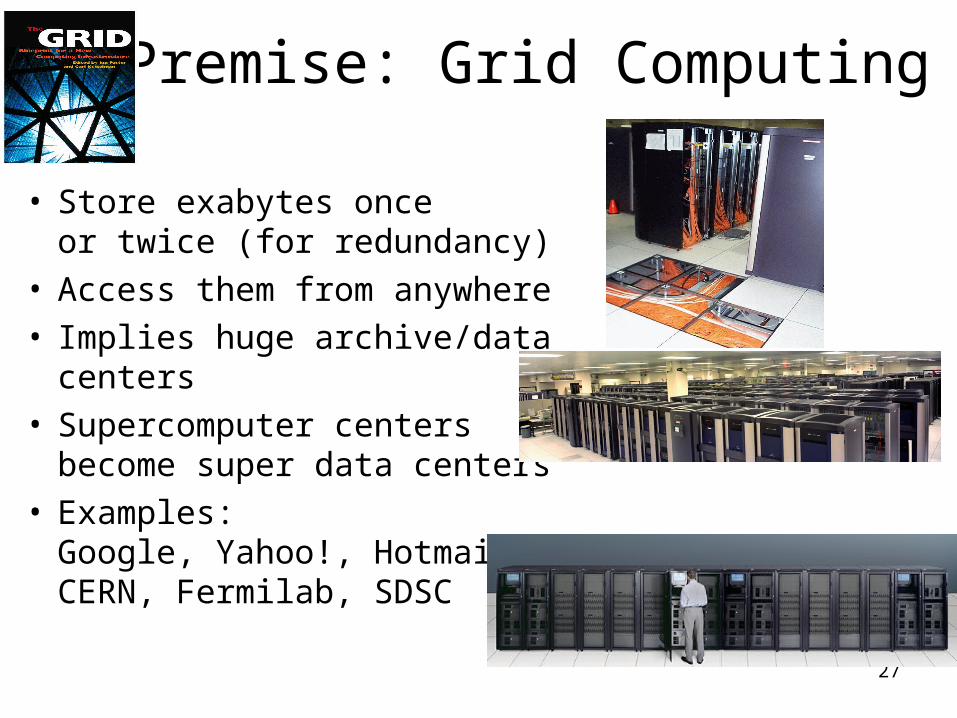
Premise: Grid Computing
• Store exabytes once or twice (for redundancy)
• Access them from anywhere• Implies huge archive/data
centers• Supercomputer centers
become super data centers• Examples:
Google, Yahoo!, Hotmail,CERN, Fermilab, SDSC
28
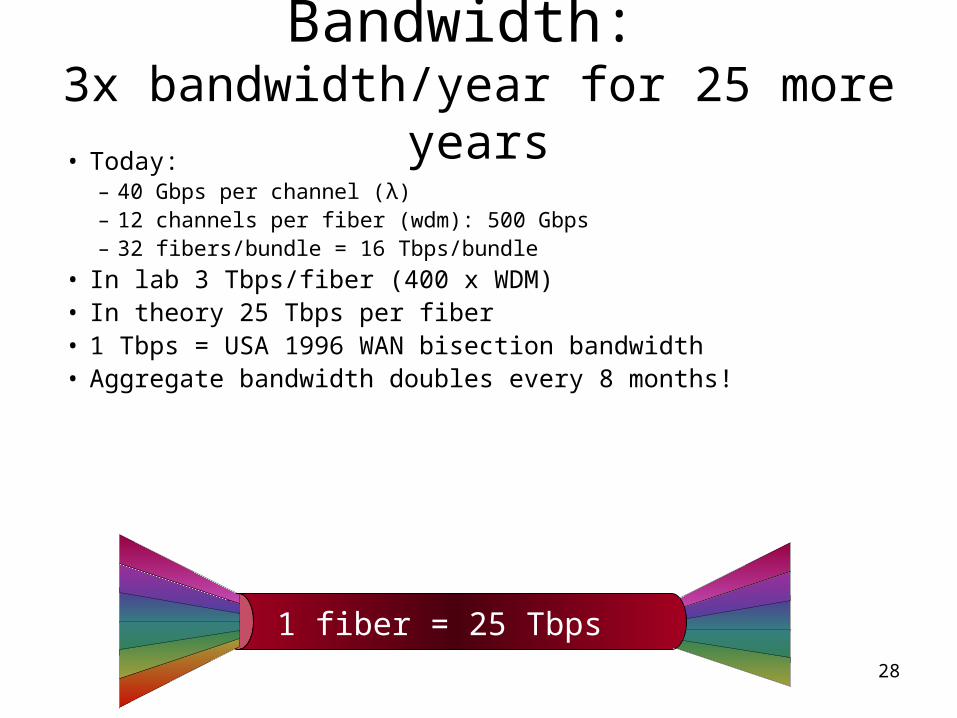
Bandwidth: 3x bandwidth/year for 25 more years
• Today: – 40 Gbps per channel (λ)– 12 channels per fiber (wdm): 500 Gbps– 32 fibers/bundle = 16 Tbps/bundle
• In lab 3 Tbps/fiber (400 x WDM)• In theory 25 Tbps per fiber• 1 Tbps = USA 1996 WAN bisection bandwidth• Aggregate bandwidth doubles every 8 months!
1 fiber = 25 Tbps
29
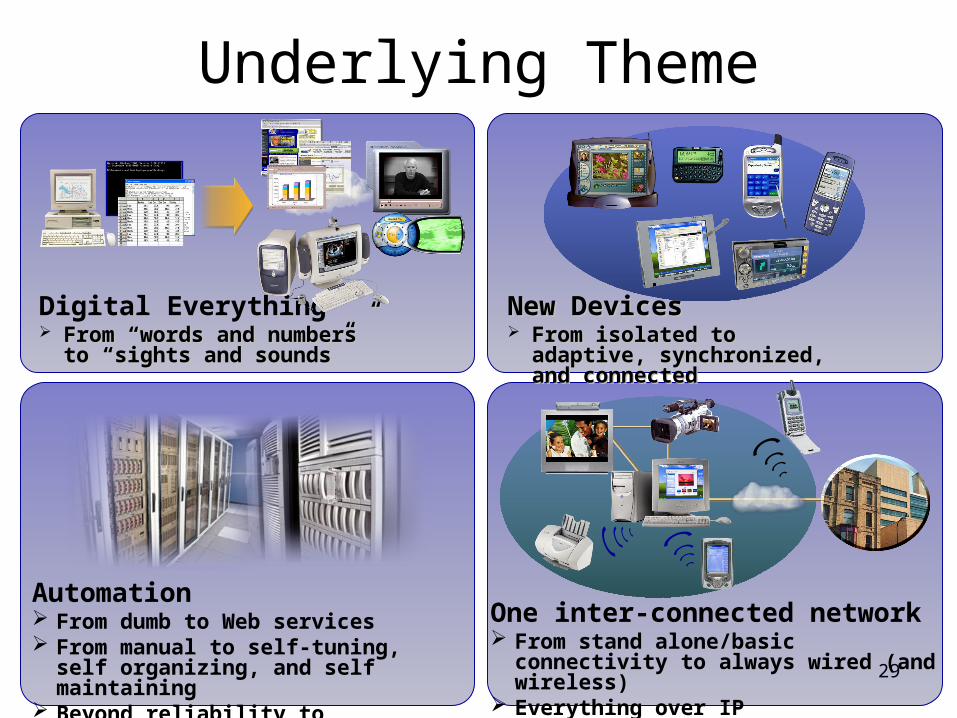
Digital Everything From “words and numbers”From “words and numbers”
to “sights and sounds”to “sights and sounds”
Underlying Theme
New DevicesNew Devices From isolated to adaptive, From isolated to adaptive,
synchronized, and connectedsynchronized, and connected
Automation From dumb to Web services From manual to self-tuning, self
organizing, and self maintaining Beyond reliability to availability
One inter-connected network From stand alone/basic connectivity to
always wired (and wireless) Everything over IP

30
Information Avalanche• The Situation – a census of the data
– We can record everything– Everything is a LOT!
• The Good news– Changes science, education, medicine, entertainment,….– Shrinks time and space– Can augment human intelligence
• The Bad News– The end of privacy– Cyber Crime / Cyber Terrorism– Monoculture
• The Technical Challenges– Amplify human intellect– Organize, summarize and prioritize information– Make programming easy.
31
Online Science
• All literature online
• All data online
• All instruments online
• Great analysis tools.
32
Online Education
• All literature online
• All lectures online
• Interactive and time-shifted education
• Just-in-time education
• Available to everyone everywhere– Economic model is not understood (who pays?)– One model: “society pays”
33
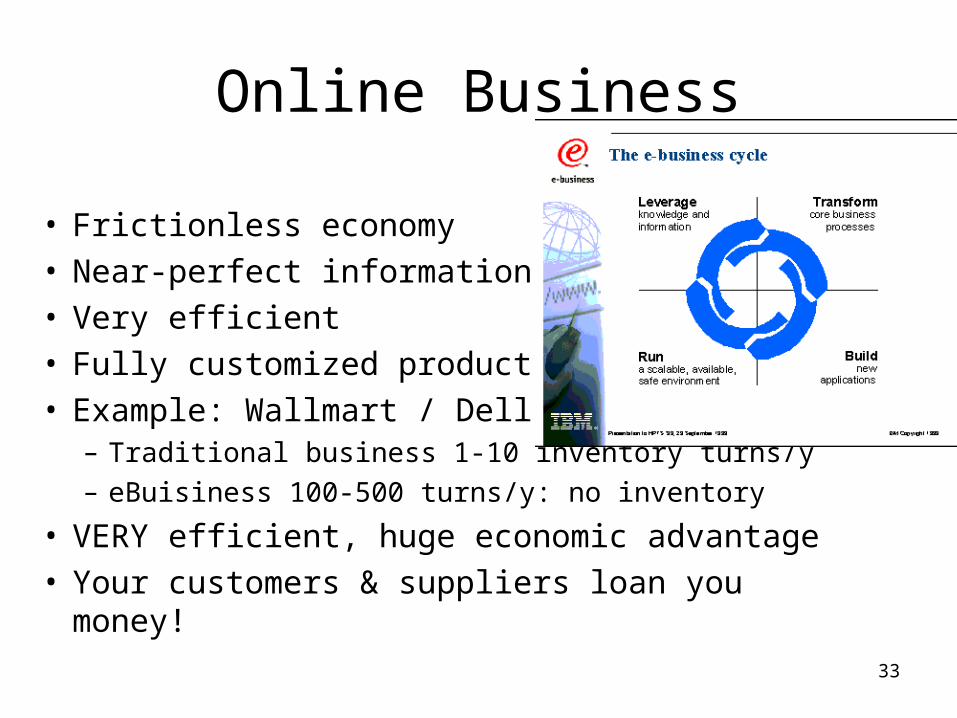
Online Business
• Frictionless economy• Near-perfect information• Very efficient• Fully customized products • Example: Wallmart / Dell:
– Traditional business 1-10 inventory turns/y– eBuisiness 100-500 turns/y: no inventory
• VERY efficient, huge economic advantage• Your customers & suppliers loan you money!
34
Online Medicine
• Traditional medicine:– Can monitor your health continuously– Instant diagnosis– Personalized drugs
• New Biology– DNA is software– “solve each disease”– Huge impact on agriculture too
35
Cyber-Space Shrinks Time and Distance
• Everyone is always connected– Can get information they want – Can communicate with friends & family
• Everything is online– You never miss a meeting/game/party/movie
(you can always watch it)– You never forget anything (its there
somewhere)
36
Sustainable Society
• Year 2050: 9 B people living at Europe’s standard of living
• 100M people in a city? • Environment can’t sustain it• More efficient cities/transportation/…• 20% consume 60% now
if 100 % consume 1/3 of current levels net consumption unchanged.
• Need to reduce energy/water/metal consumption 3x in developed world.
37
CyberSpace (data) and ToolsCan Augment Human Intelligence
• See next talk (12 CS challenges)
• MyMainBrain is a personal example:improved memory
• Data mining tools are promising

38
Information Avalanche• The Situation – a census of the data
– We can record everything– Everything is a LOT!
• The Good news– Changes science, education, medicine, entertainment,….– Shrinks time and space– Can augment human intelligence
• The Bad News– The end of privacy– Cyber Crime / Cyber Terrorism– Monoculture
• The Technical Challenges– Amplify human intellect– Organize, summarize and prioritize information– Make programming easy.
39
The End Of Privacy
• You can find out all about me.
• Organizations can precisely track us– Credit cards, email, cellphone, …
• Animals have “tags” in them, I will probably get a tag (eventually)(I already carry a dozen ID & smart cards).
• “You have no privacy, get over it” Scott Mcnealy
40
The Centralization of Power• Computers enable an Orwellian future (1984)• The government can know everything you ever
– Buy– Say– Hear– See/Read/…
• Where you are (phone company already knows)
• Who you see and talk to• OK now,
but what if Nero/Hitler/Stalin/.. comes to power?
41
Cyber Crime
• You can steal my identity – Sell my house– Accumulate huge debts– Make a video of me doing terrible things.
• You can steal on a grand scale– Now Trillions of dollars are online.– A LARGE honey-pot for criminals.
42
Cyber Terrorism
• It is easier to attack/destroy than to steal.
• Viruses, data corruption, data modification
• Denial of Service
• Hijacking and then destroying equipment– Utilities (water, energy, transportation)– Production (factories)
43
Monoculture
• Radio & TV & movies & Internetare making the world more homogenous.
• ½ the world has never made a phone call
• But this is changing fast (they want to make phone calls!)
• The wired world enables communities to form very easily – e.g. Sanskrit scholars.
• But the community has to speak a common language.
44
Information Clutter
• Most mail is junk mail• Most eMail will soon be junk mail
– 30% of hotmail, 75% of my mail (~130 m/d).
• Telemarketing wastes people’s time.• Creates info-glut• You have 50,000 new mail messages
• Need systems and interfaces to filter, summarize, prioritize information

45
Information Avalanche• The Situation – a census of the data
– We can record everything– Everything is a LOT!
• The Good news– Changes science, education, medicine, entertainment,….– Shrinks time and space– Can augment human intelligence
• The Bad News– The end of privacy– Cyber Crime / Cyber Terrorism– Monoculture
• The Technical Challenges– Amplify human intellect– Organize, summarize and prioritize information– Make programming easy.
46
Technical Challenges
• Storing information• Organizing information• Summarizing information• Visualizing information• Make programming easy
47
The personal Terabyte (all your stuff online)So you’ve got it – now what do you do with it?
• Probably not accessed very often but TREASURED (what’s the one thing you would save in a fire?)
• Can you find anything?• Can you organize that many objects?• Once you find it will you know what it is?• Once you’ve found it, could you find it again?• Research Goal:
Have GOOD answers for all these Questions
48
Bell, Gemmell, Lueder: MyLifeBits Guiding Principles
1. Freedom from strict hierarchy– Full text search & Collections
2. Many visualizations– “don’t metaphor me in”
3. Annotations add value– So make them easy!
4. Keep the links when you author– “transclusion”
5. Everything goes in a database
49
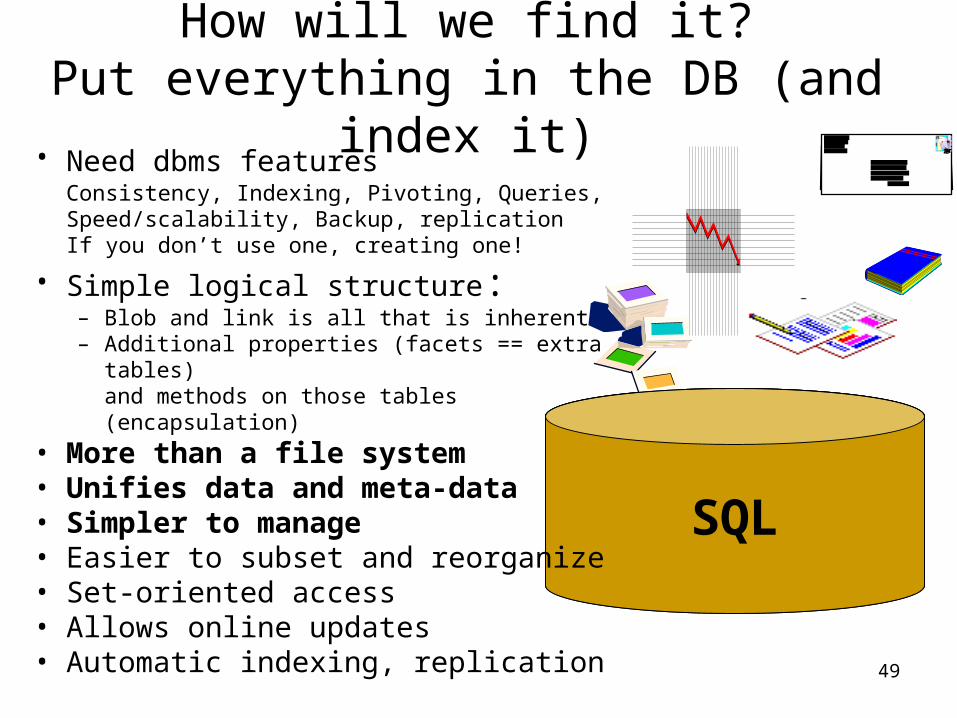
How will we find it?Put everything in the DB (and index it)
SQLSQL
• Need dbms features Consistency, Indexing, Pivoting, Queries, Speed/scalability, Backup, replicationIf you don’t use one, creating one!
• Simple logical structure: – Blob and link is all that is inherent– Additional properties (facets == extra tables)
and methods on those tables (encapsulation)
• More than a file system • Unifies data and meta-data• Simpler to manage• Easier to subset and reorganize• Set-oriented access• Allows online updates • Automatic indexing, replication
50
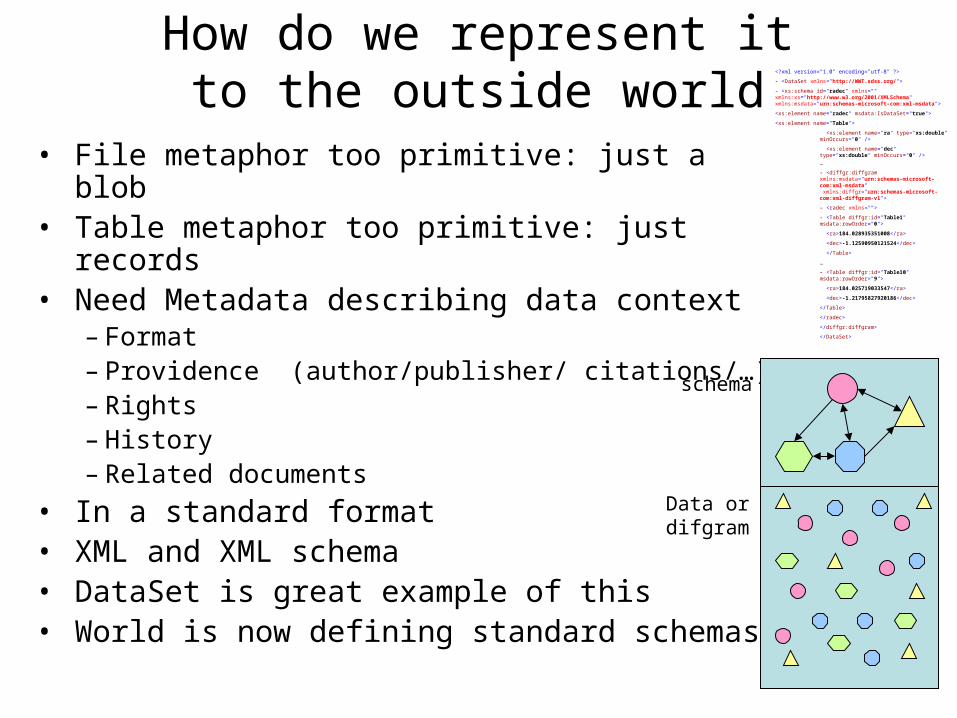
How do we represent it to the outside world?
• File metaphor too primitive: just a blob• Table metaphor too primitive: just records• Need Metadata describing data context
– Format– Providence (author/publisher/ citations/…)– Rights– History– Related documents
• In a standard format• XML and XML schema• DataSet is great example of this• World is now defining standard schemas
schema
Data ordifgram
<?xml version="1.0" encoding="utf-8" ?>
- <DataSet xmlns="http://WWT.sdss.org/">
- <xs:schema id="radec" xmlns="" xmlns:xs="http://www.w3.org/2001/XMLSchema" xmlns:msdata="urn:schemas-microsoft-com:xml-msdata">
<xs:element name="radec" msdata:IsDataSet="true">
<xs:element name="Table">
<xs:element name="ra" type="xs:double" minOccurs="0" />
<xs:element name="dec" type="xs:double" minOccurs="0" /> …
- <diffgr:diffgram xmlns:msdata="urn:schemas-microsoft-com:xml-msdata" xmlns:diffgr="urn:schemas-microsoft-com:xml-diffgram-v1">
- <radec xmlns="">
- <Table diffgr:id="Table1" msdata:rowOrder="0">
<ra>184.028935351008</ra>
<dec>-1.12590950121524</dec>
</Table>
…
- <Table diffgr:id="Table10" msdata:rowOrder="9">
<ra>184.025719033547</ra>
<dec>-1.21795827920186</dec>
</Table>
</radec>
</diffgr:diffgram>
</DataSet>
51
There is a problem
• GREAT!!!!
–XML documents are portable objects
–XML documents are complex objects–WSDL defines the methods on objects (the
class)
• But will all the implementations match?
–Think of UNIX or SQL or C or…
• This is a work in progress.
Niklaus Wirth: Algorithms + Data Structures = Programs
52
SQL(for xml)
TemplatesSchema
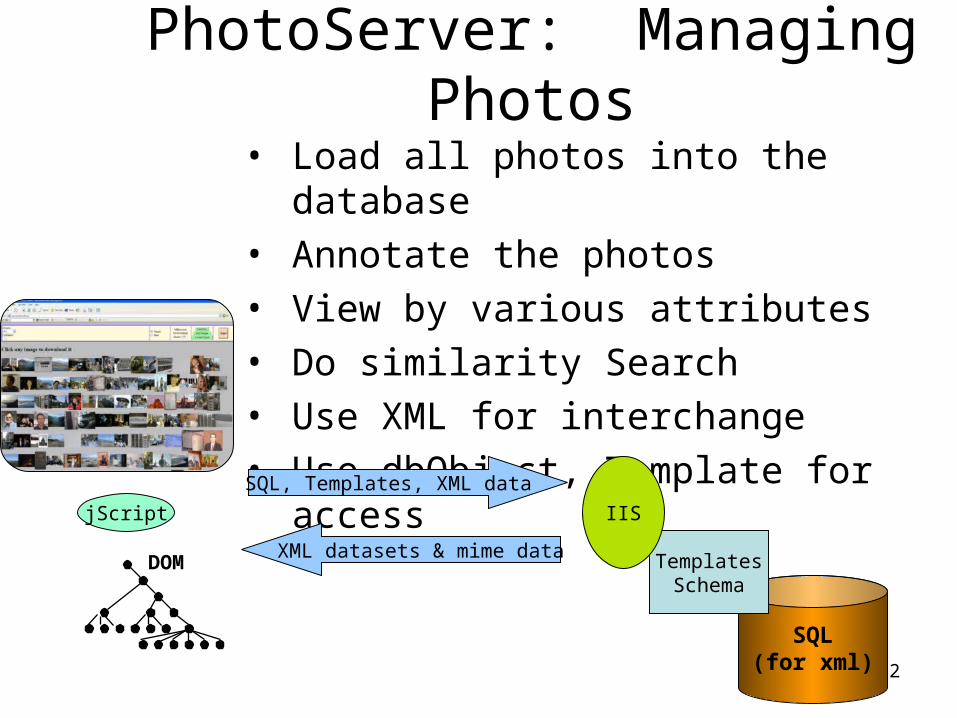
PhotoServer: Managing Photos
• Load all photos into the database• Annotate the photos• View by various attributes • Do similarity Search• Use XML for interchange• Use dbObject, Template for accessSQL, Templates, XML data
XML datasets & mime data
IIS
DOM
jScript
53
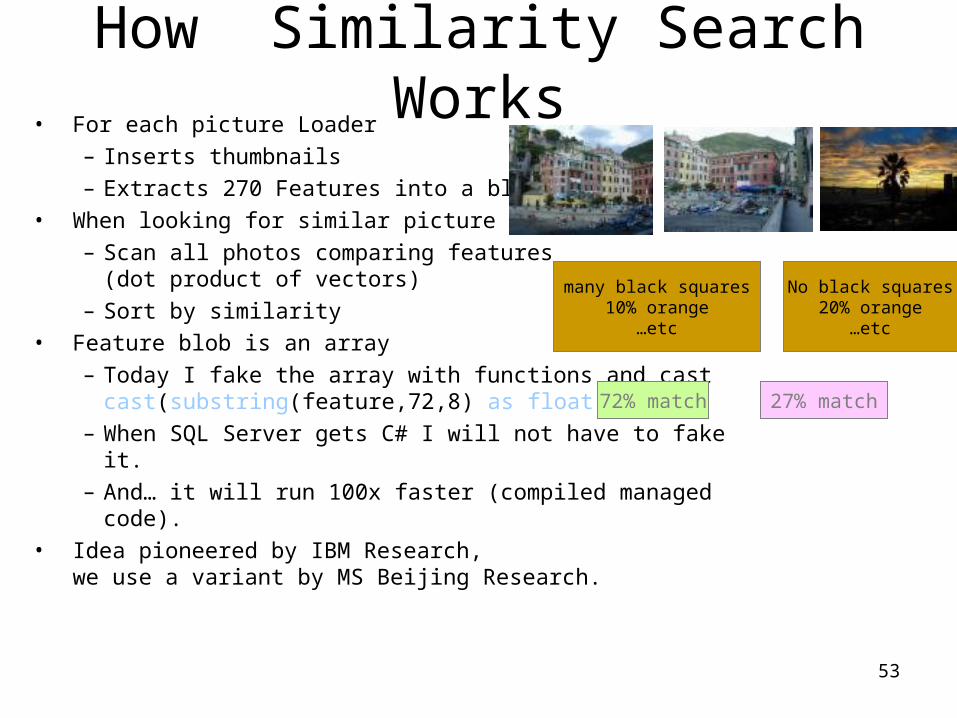
How Similarity Search Works• For each picture Loader
– Inserts thumbnails– Extracts 270 Features into a blob
• When looking for similar picture– Scan all photos comparing features
(dot product of vectors)– Sort by similarity
• Feature blob is an array– Today I fake the array with functions and cast
cast(substring(feature,72,8) as float)– When SQL Server gets C# I will not have to fake it. – And… it will run 100x faster (compiled managed code).
• Idea pioneered by IBM Research,we use a variant by MS Beijing Research.
No black squares20% orange
…etc
many black squares10% orange
…etc
72% match 27% match
54
Key Observations• Data:
– XML data sets are a universal way to represent answers– XML data sets minimize round trips: 1 request/response
• Search– It is BEST to index– You can put objects and attributes in a row
(SQL puts big blobs off-page)– If you can’t index,
You can extract attributes and quickly compare– SQL can scan at 2M records/cpu/second– Sequential scans are embarrassingly parallel.
55
What about Big Data
• Talked about organizing personal data
• What about BIG data.
• Most of the following slides inspired by (or even copied from)
Alex Szalay JHU and
George Djorgovski Cal Tech
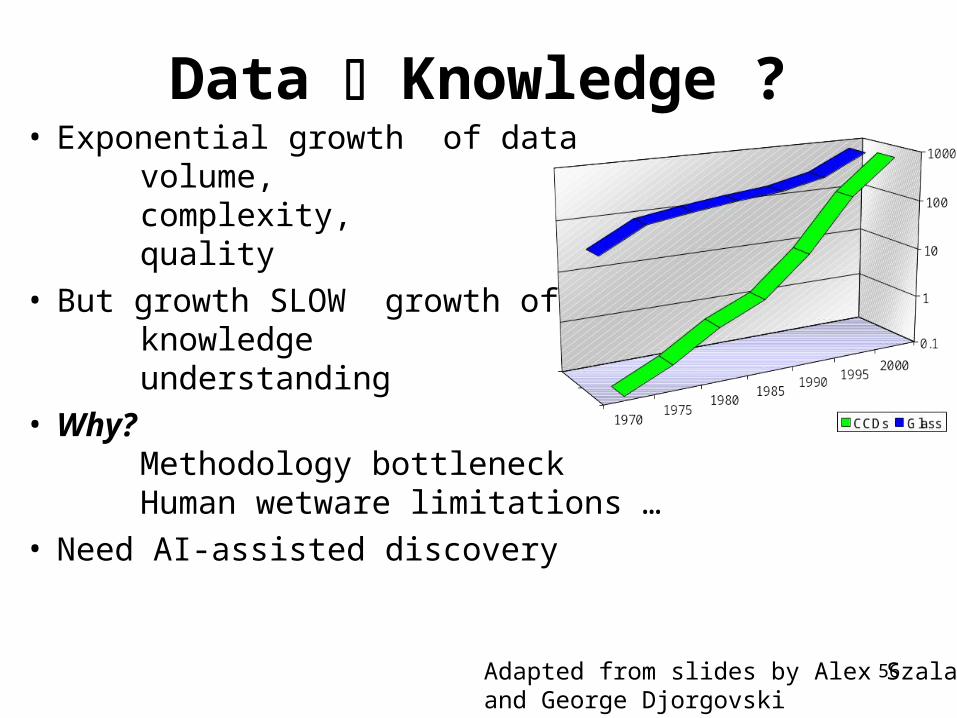
56Adapted from slides by Alex Szalay and George Djorgovski
• Exponential growth of data volume, complexity, quality
• But growth SLOW growth of knowledge understanding
• Why?Methodology bottleneck Human wetware limitations …
• Need AI-assisted discovery
Data Knowledge ?
57
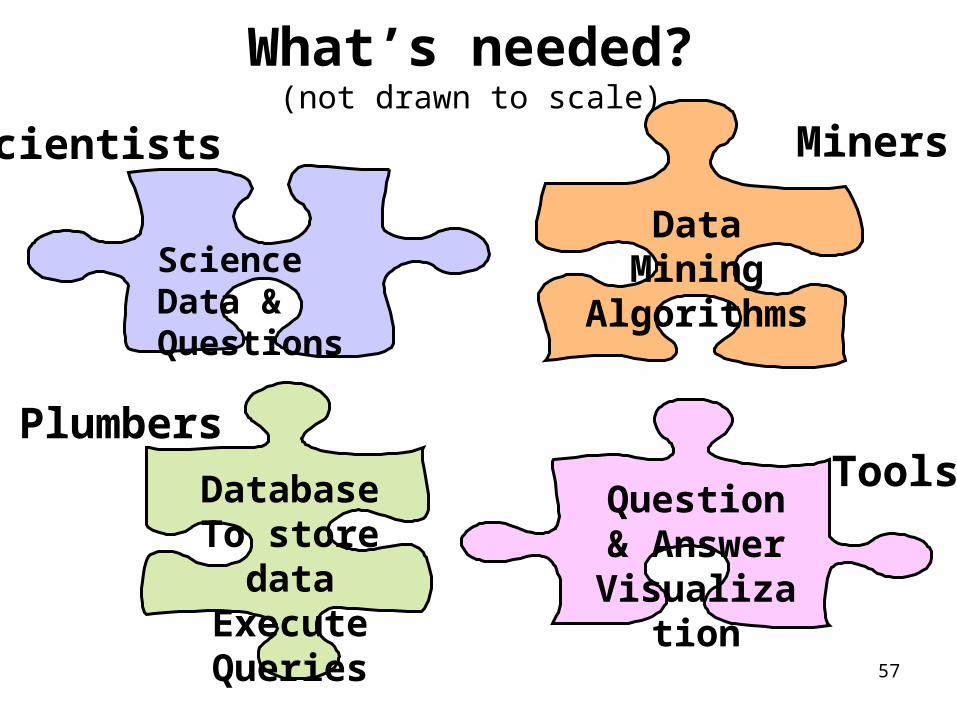
What’s needed?(not drawn to scale)
Science Data & Questions
Scientists
DatabaseTo store
dataExecuteQueries
Plumbers
Data Mining
Algorithms
Miners
Question & AnswerVisualizat
ion
Tools
58
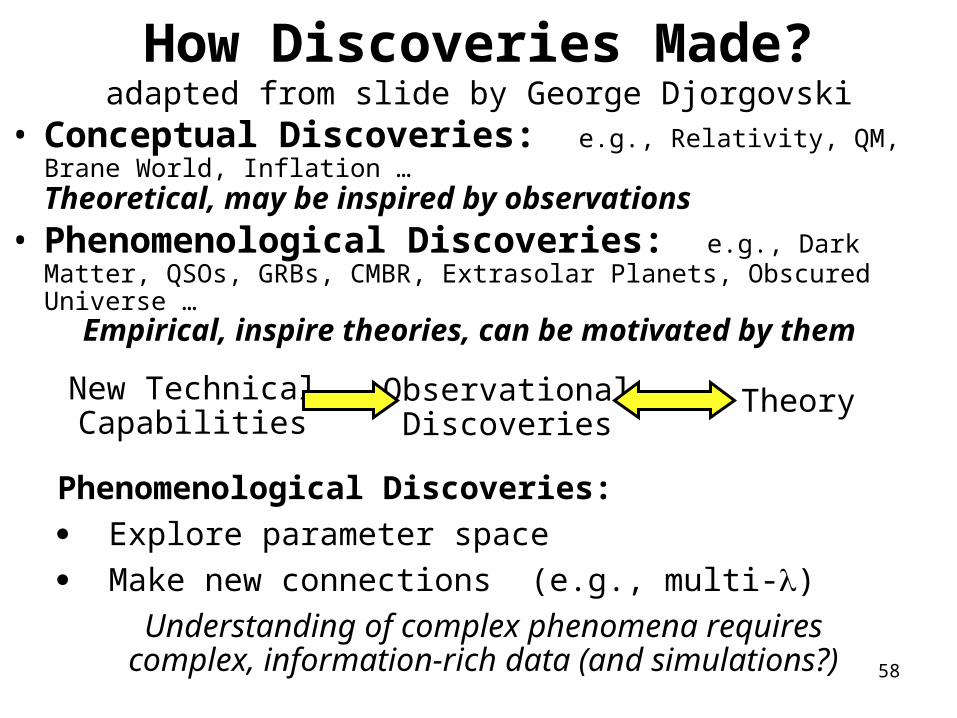
How Discoveries Made?adapted from slide by George Djorgovski
• Conceptual Discoveries: e.g., Relativity, QM, Brane World, Inflation … Theoretical, may be inspired by observations
• Phenomenological Discoveries: e.g., Dark Matter, QSOs, GRBs, CMBR, Extrasolar Planets, Obscured Universe …
Empirical, inspire theories, can be motivated by them
New TechnicalCapabilities
ObservationalDiscoveries
Theory
Phenomenological Discoveries:
Explore parameter space
Make new connections (e.g., multi-)
Understanding of complex phenomena requirescomplex, information-rich data (and simulations?)
59
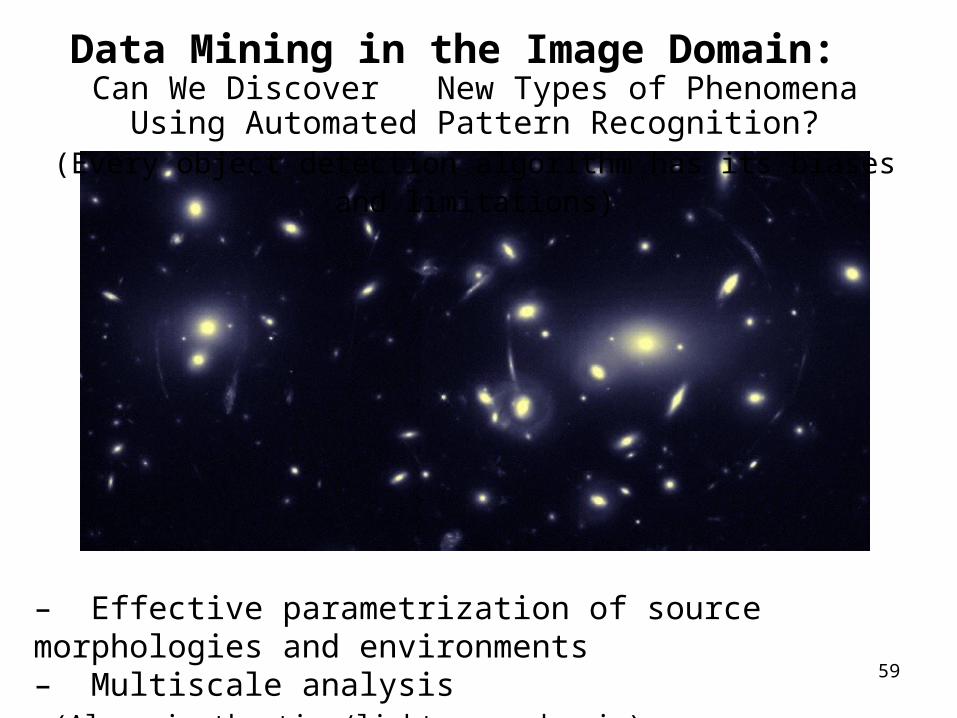
Data Mining in the Image Domain: Can We Discover New Types of Phenomena Using Automated Pattern
Recognition?(Every object detection algorithm has its biases and limitations)
– Effective parametrization of source morphologies and environments– Multiscale analysis (Also: in the time/lightcurve domain)
60
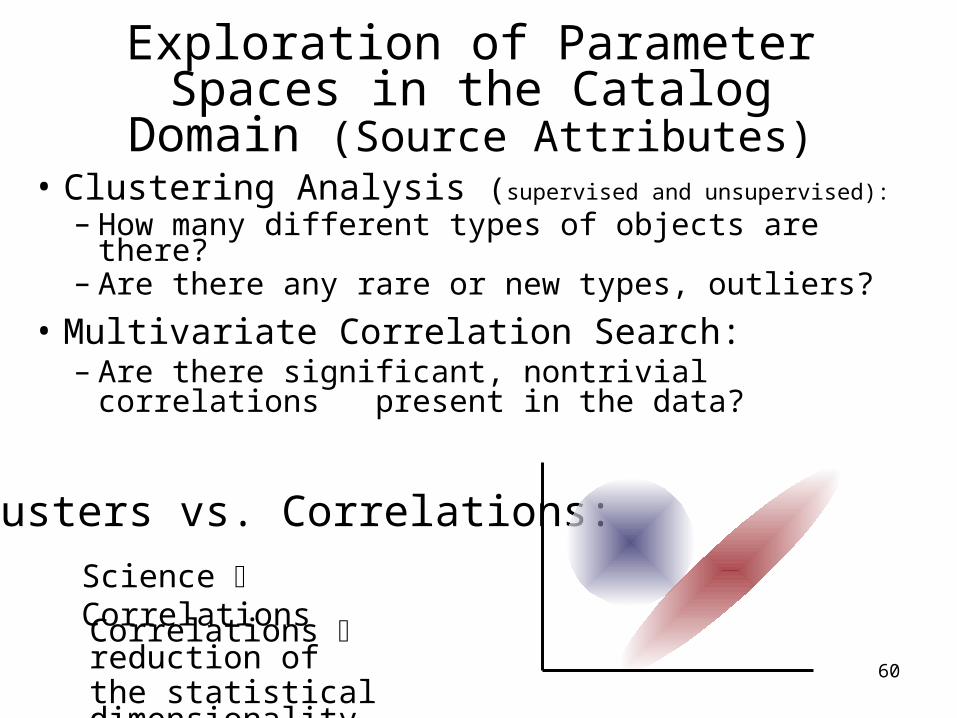
Exploration of Parameter Spaces in the Catalog Domain (Source Attributes)
• Clustering Analysis (supervised and unsupervised):
– How many different types of objects are there?– Are there any rare or new types, outliers?
• Multivariate Correlation Search:– Are there significant, nontrivial correlations
present in the data?
Clusters vs. Correlations:
Science Correlations
Correlations reduction ofthe statistical dimensionality
61
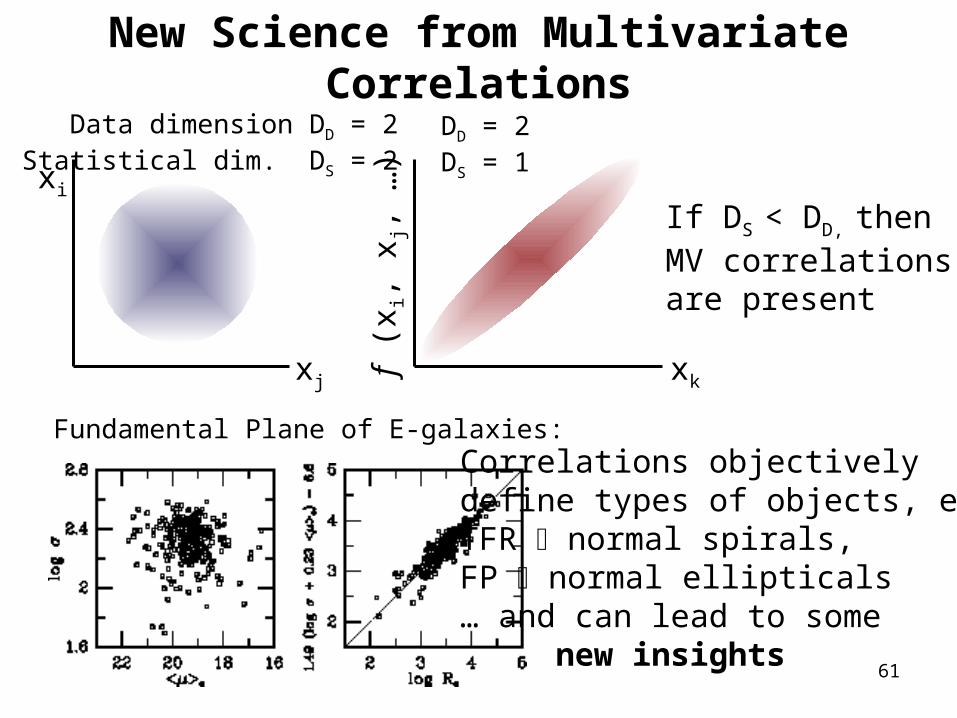
New Science from Multivariate Correlations
xi
xj xkf (
x i, x j,
…)
Data dimension DD = 2Statistical dim. DS = 2
DD = 2DS = 1
If DS < DD, thenMV correlationsare present
Correlations objectivelydefine types of objects, e.g.,TFR normal spirals,FP normal ellipticals… and can lead to some new insights
Fundamental Plane of E-galaxies:
62
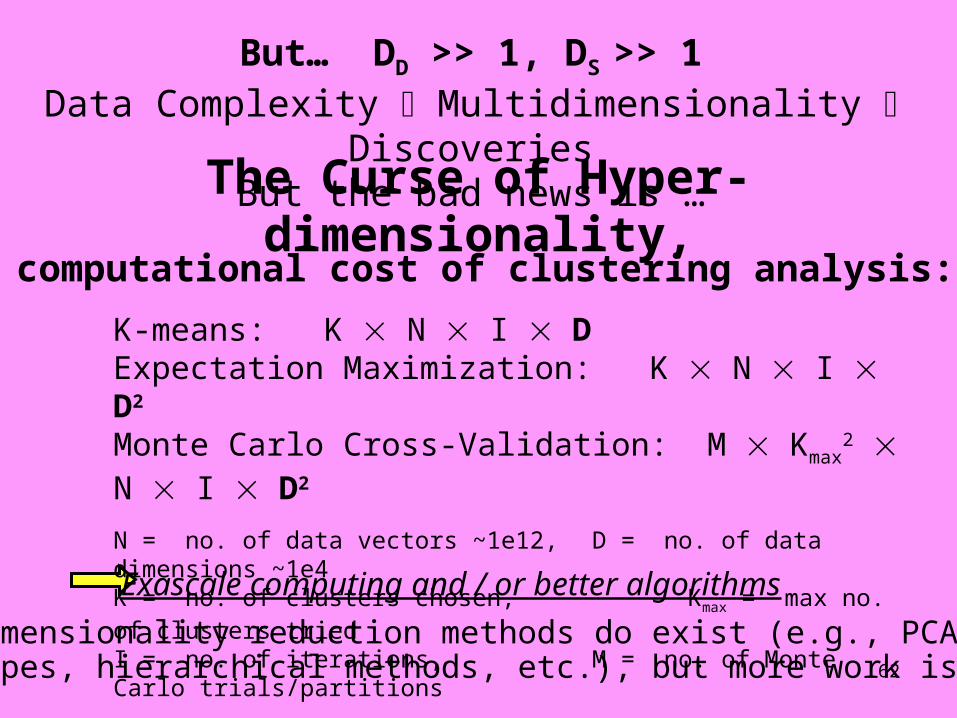
The Curse of Hyper-dimensionality,
But… DD >> 1, DS >> 1Data Complexity Multidimensionality Discoveries
But the bad news is …
The computational cost of clustering analysis:
Some dimensionality reduction methods do exist (e.g., PCA, classprototypes, hierarchical methods, etc.), but more work is needed
Exascale computing and / or better algorithms
K-means: K N I DExpectation Maximization: K N I D2
Monte Carlo Cross-Validation: M Kmax2 N I D2
N = no. of data vectors ~1e12, D = no. of data dimensions ~1e4K = no. of clusters chosen, Kmax = max no. of clusters triedI = no. of iterations, M = no. of Monte Carlo trials/partitions
63
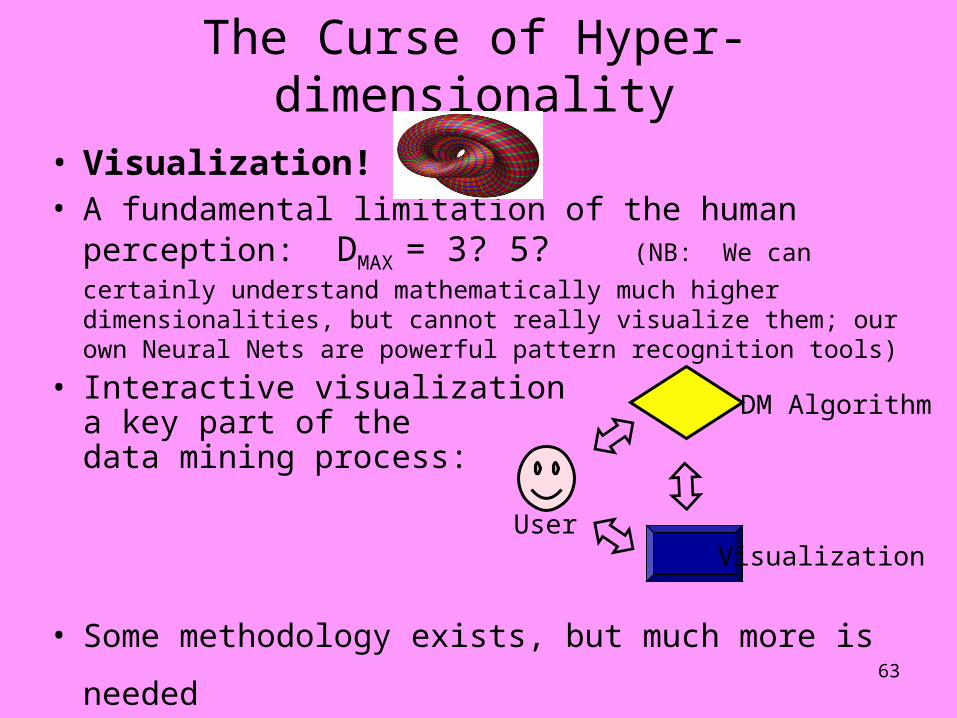
The Curse of Hyper-dimensionality
• Visualization!• A fundamental limitation of the human perception:
DMAX = 3? 5? (NB: We can certainly understand mathematically
much higher dimensionalities, but cannot really visualize them; our own Neural Nets are powerful pattern recognition tools)
• Interactive visualization a key part of the data mining process:
• Some methodology exists, but much more is needed
User
DM Algorithm
Visualization
64
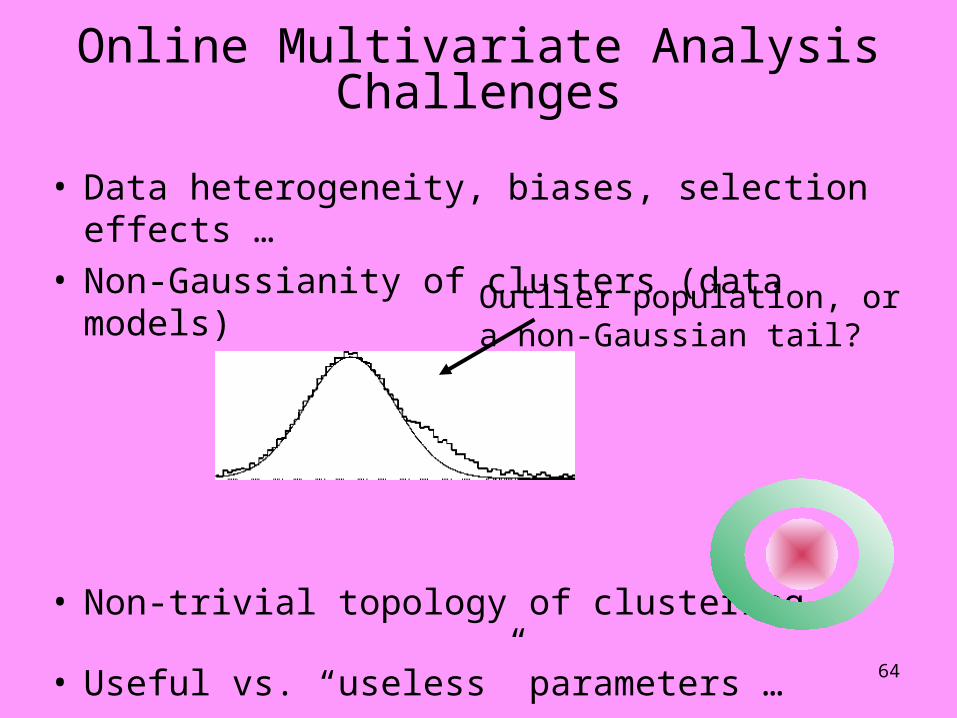
Online Multivariate Analysis Challenges
• Data heterogeneity, biases, selection effects …• Non-Gaussianity of clusters (data models)
• Non-trivial topology of clustering
• Useful vs. “useless” parameters …
Outlier population, ora non-Gaussian tail?
65
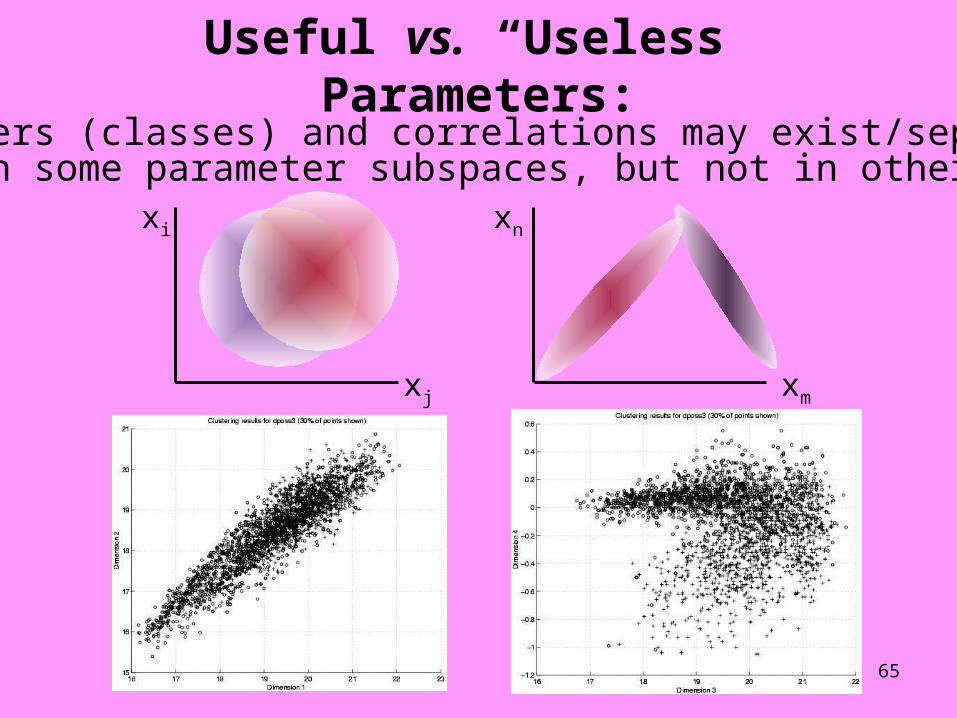
Useful vs. “Useless” Parameters:Clusters (classes) and correlations may exist/separate
in some parameter subspaces, but not in othersxi
xj
xn
xm
66
Optimal Statisticsfollowing slides adapted from Alex Szalay
• statistics algorithms scale poorly– Correlation functions N2, likelihood techniques N3
• Even if data and computers grow at same rateComputers can do at most N logN algorithms
• Possible solutions?– Assumes infinite computational resources– Assumes that only source of error is statistical– `Cosmic Variance’: we can only observe the Universe
from one location (finite sample size)
• Solutions require combination of Statistics and CS• New algorithms: not worse than N logN
67
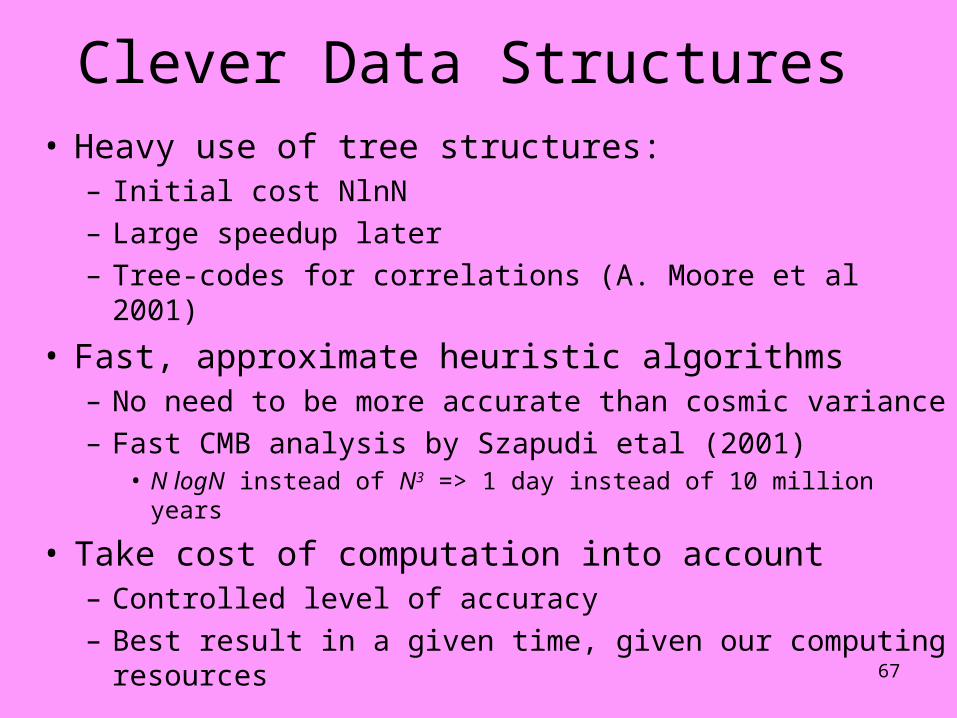
Clever Data Structures• Heavy use of tree structures:
– Initial cost NlnN– Large speedup later– Tree-codes for correlations (A. Moore et al 2001)
• Fast, approximate heuristic algorithms– No need to be more accurate than cosmic variance– Fast CMB analysis by Szapudi etal (2001)
• N logN instead of N3 => 1 day instead of 10 million years
• Take cost of computation into account– Controlled level of accuracy– Best result in a given time, given our computing resources
68
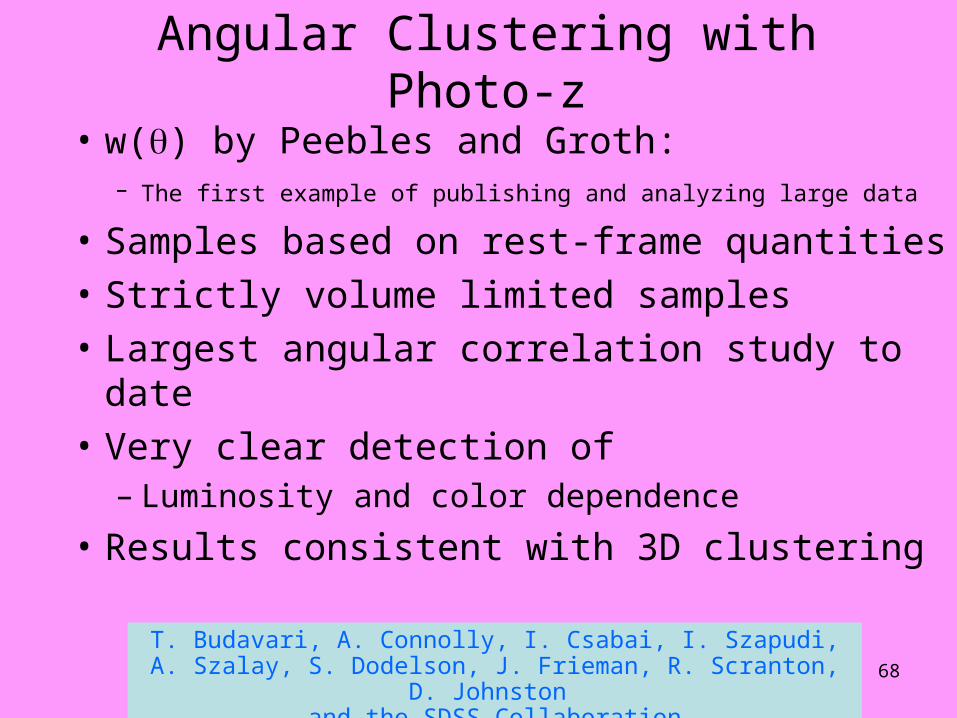
Angular Clustering with Photo-z
• w() by Peebles and Groth:– The first example of publishing and analyzing large data
• Samples based on rest-frame quantities
• Strictly volume limited samples
• Largest angular correlation study to date
• Very clear detection of – Luminosity and color dependence
• Results consistent with 3D clustering
T. Budavari, A. Connolly, I. Csabai, I. Szapudi, A. Szalay, S. Dodelson, J. Frieman, R. Scranton, D. Johnston
and the SDSS Collaboration
69
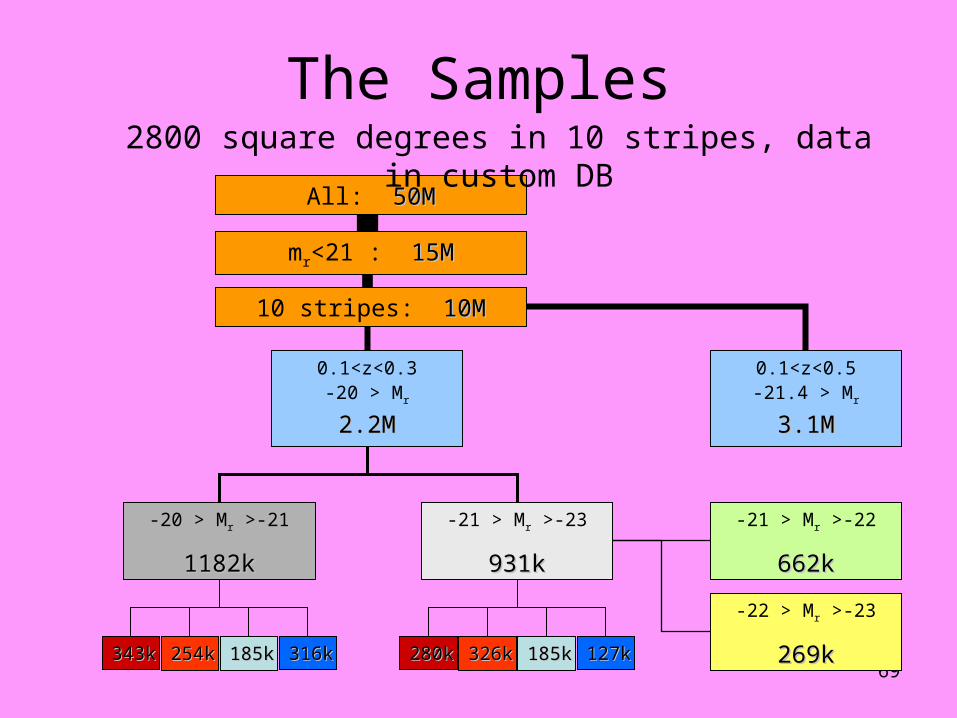
The Samples
343k343k 254k254k 185k185k 316k316k 280k280k 326k326k 185k185k 127k127k
-20 > Mr >-21
1182k1182k
-21 > Mr >-23
931k931k
0.1<z<0.3-20 > Mr
2.2M2.2M
-21 > Mr >-22
662k662k
-22 > Mr >-23
269k269k
0.1<z<0.5-21.4 > Mr
3.1M3.1M
10 stripes: 10M10M
mr<21 : 15M15M
All: 50M50M
2800 square degrees in 10 stripes, data in custom DB
70
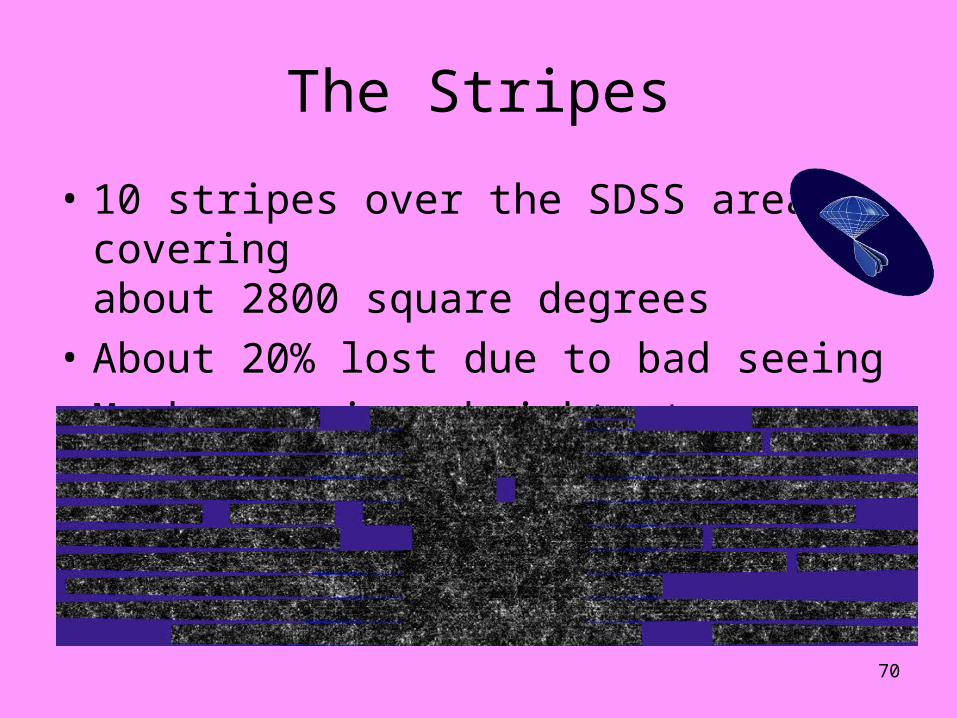
The Stripes
• 10 stripes over the SDSS area, covering about 2800 square degrees
• About 20% lost due to bad seeing
• Masks: seeing, bright stars, etc.
• Images generated from query by web service
71
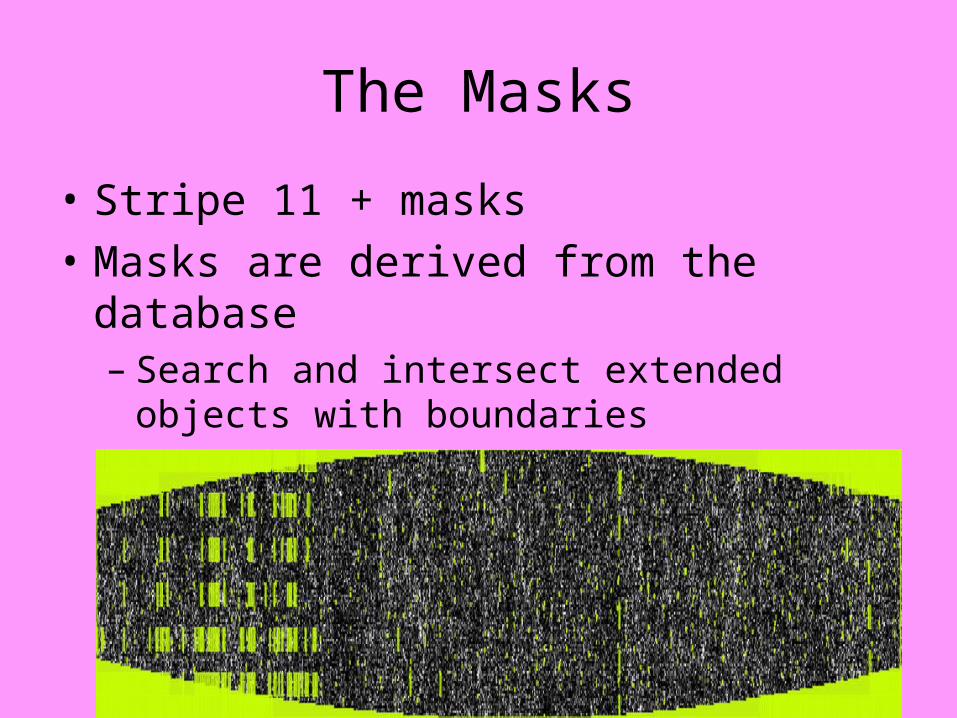
The Masks
• Stripe 11 + masks
• Masks are derived from the database– Search and intersect extended objects with
boundaries
72
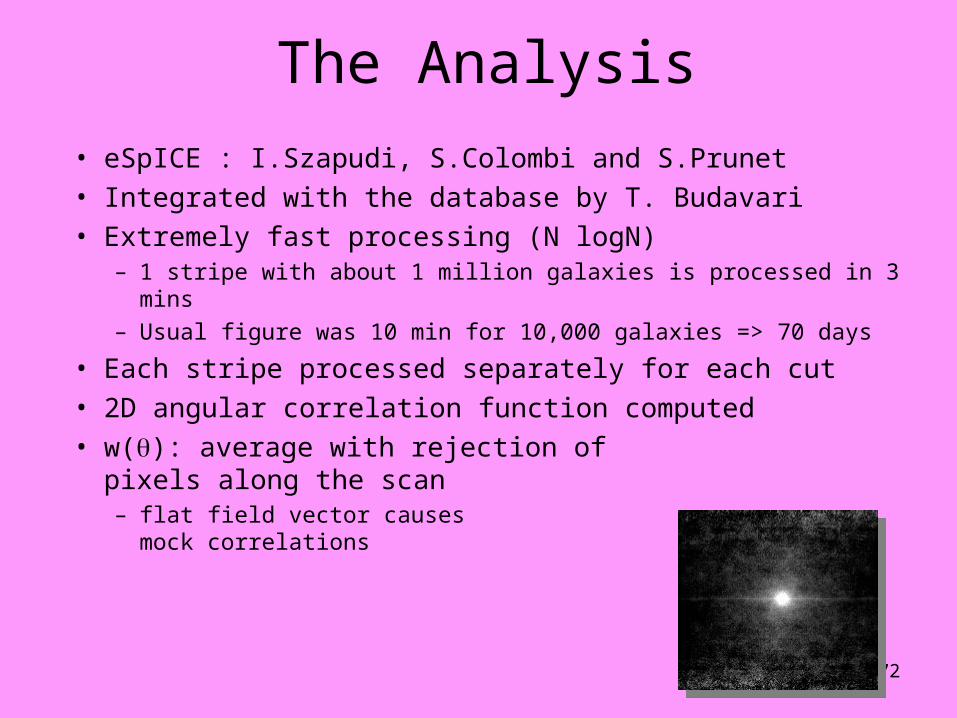
The Analysis
• eSpICE : I.Szapudi, S.Colombi and S.Prunet• Integrated with the database by T. Budavari• Extremely fast processing (N logN)
– 1 stripe with about 1 million galaxies is processed in 3 mins
– Usual figure was 10 min for 10,000 galaxies => 70 days
• Each stripe processed separately for each cut• 2D angular correlation function computed• w(): average with rejection of
pixels along the scan– flat field vector causes
mock correlations
73
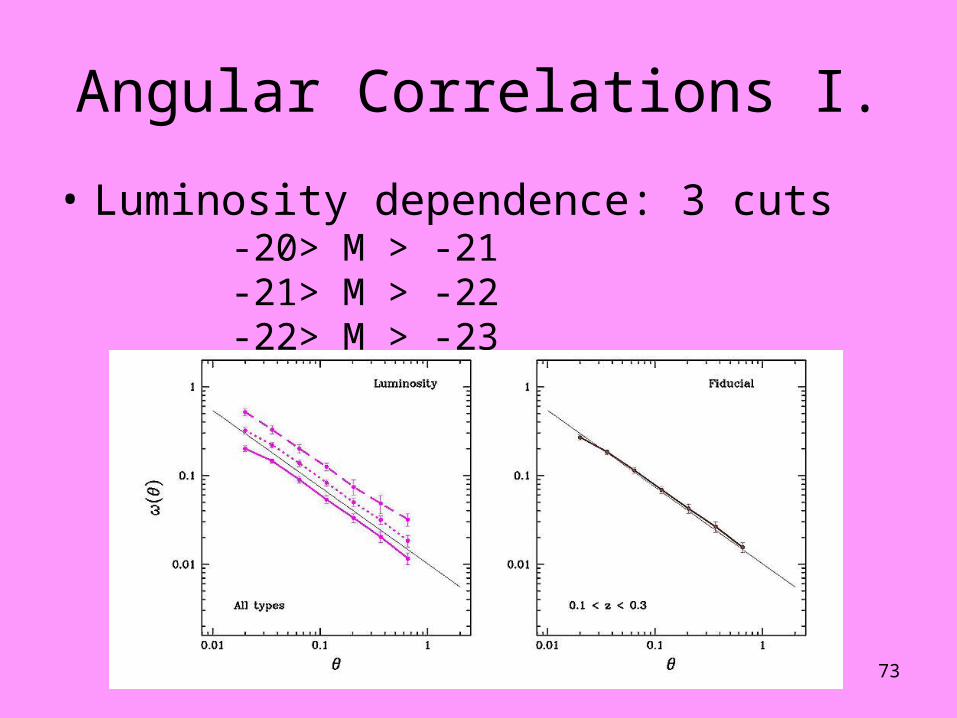
Angular Correlations I.
• Luminosity dependence: 3 cuts-20> M > -21-21> M > -22-22> M > -23
74
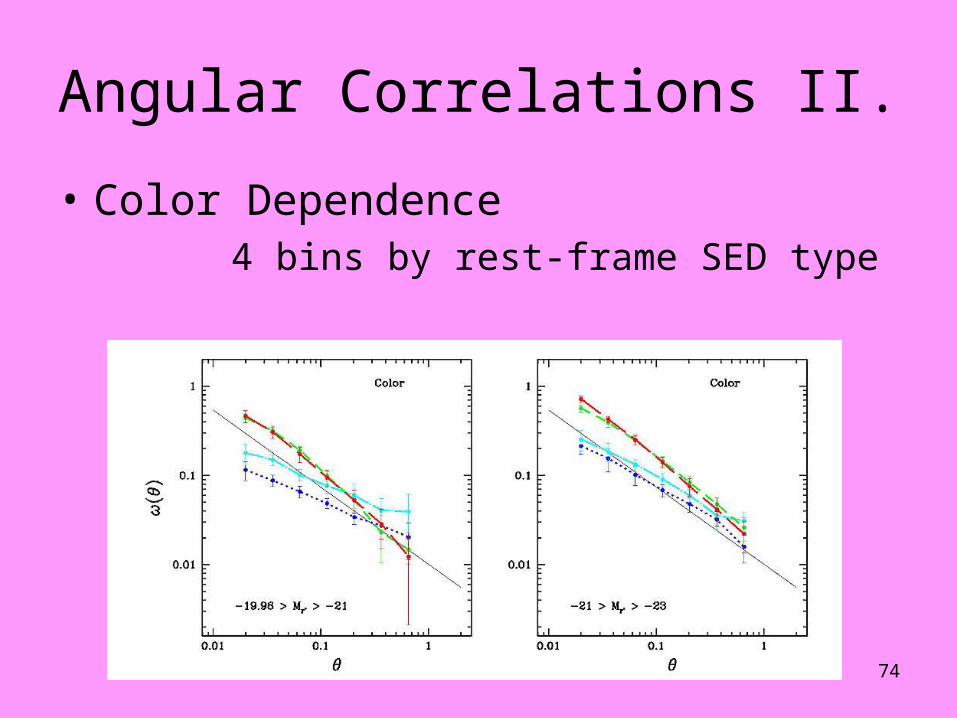
Angular Correlations II.
• Color Dependence4 bins by rest-frame SED type
75
If there’s time
• Better User Interfaces 0 TaskGalary.MPG
• Organizing photos 1 Digital Photo.mpg
• Organizing newsgroups 2 Communities.mpg
• Enhancing meetings. 3 flows.mpg
• Attentional interfaces: 4 Side Show.mpg
76
Thesis
• Most new information is digital(and old information is being digitized)
• A Computer Science Grand Challenge:– Capture– Organize– Summarize– Visualize
This information• Optimize Human Attention as a resource.• Improve information quality

77
Information Avalanche• The Situation – a census of the data
– We can record everything– Everything is a LOT!
• The Good news– Changes science, education, medicine, entertainment,….– Shrinks time and space– Can augment human intelligence
• The Bad News– The end of privacy– Cyber Crime / Cyber Terrorism– Monoculture
• The Technical Challenges– Amplify human intellect– Organize, summarize and prioritize information– Make programming easy.


![Eppler Information Overload[1]](https://img.pdfslide.us/doc/110x75/54767aaab4af9fa30a8b62c7/eppler-information-overload1.jpg)