Embed Size (px)
Citation preview
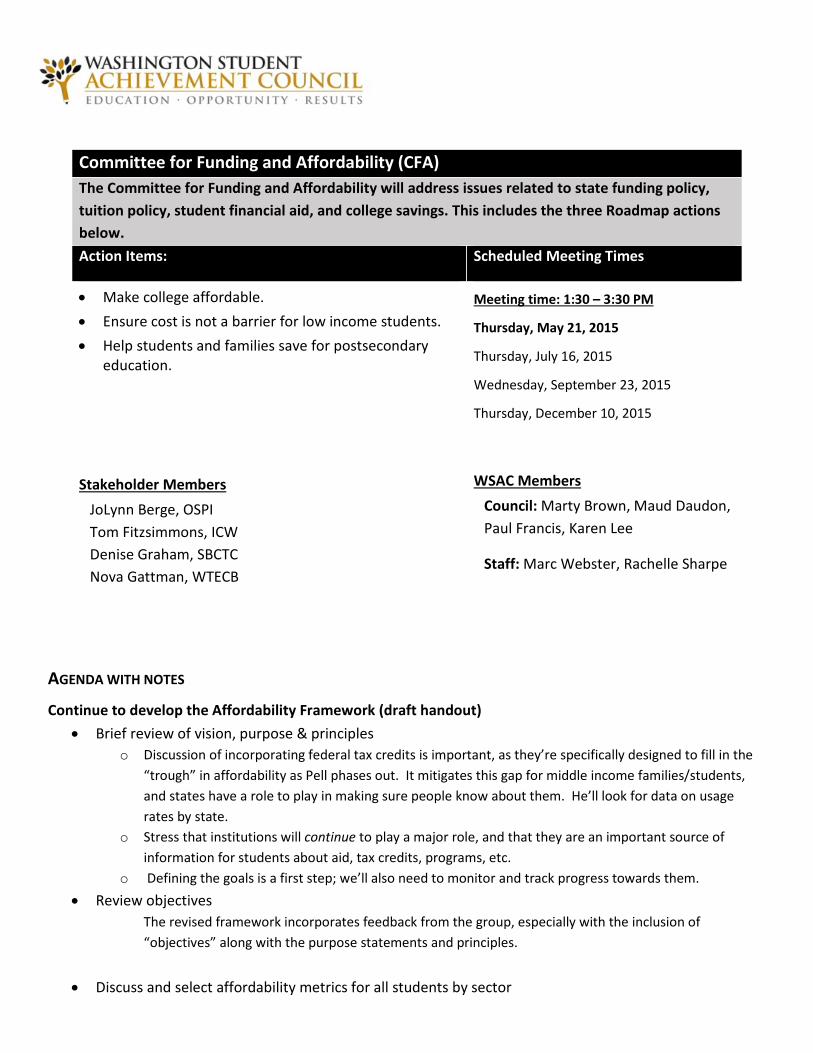
Committee for Funding and Affordability (CFA) The Committee for Funding and Affordability will address issues related to state funding policy, tuition policy, student financial aid, and college savings. This includes the three Roadmap actions below. Action Items: Scheduled Meeting Times
• Make college affordable. • Ensure cost is not a barrier for low income students. • Help students and families save for postsecondary
education.
Meeting time: 1:30 – 3:30 PM
Thursday, May 21, 2015
Thursday, July 16, 2015
Wednesday, September 23, 2015
Thursday, December 10, 2015
Stakeholder Members JoLynn Berge, OSPI Tom Fitzsimmons, ICW Denise Graham, SBCTC Nova Gattman, WTECB
WSAC Members Council: Marty Brown, Maud Daudon, Paul Francis, Karen Lee
Staff: Marc Webster, Rachelle Sharpe
AGENDA WITH NOTES
Continue to develop the Affordability Framework (draft handout) • Brief review of vision, purpose & principles
o Discussion of incorporating federal tax credits is important, as they’re specifically designed to fill in the “trough” in affordability as Pell phases out. It mitigates this gap for middle income families/students, and states have a role to play in making sure people know about them. He’ll look for data on usage rates by state.
o Stress that institutions will continue to play a major role, and that they are an important source of information for students about aid, tax credits, programs, etc.
o Defining the goals is a first step; we’ll also need to monitor and track progress towards them. • Review objectives
The revised framework incorporates feedback from the group, especially with the inclusion of “objectives” along with the purpose statements and principles.
• Discuss and select affordability metrics for all students by sector
o DRAFT metrics handed out and discussed. Measures for four-year institutions only at this point, but as they come from IPEDS, CTCs/Private 2-years could be added.
• Discuss affordability thresholds by sector for borrowing and work
o The group debated whether debt is an expectation of the framework, or simply a tool some families can use to contribute their share of the cost. That is, debt isn’t necessarily expected, but it also isn’t an automatic sign of unaffordability.
o In addition, the role of debt may differ by sector. Some wondered if regional cost of living differences should also be taken into account. That may be too detailed for the current iteration of the model, as we don’t want to take legislators a complicated multivariate model that might be too complicated to explain and could offer false precision.
• Discuss whether/where comparisons to other states are useful • July 16 Meeting:
o Bring baseline data for metrics o Allow for manipulation of data and cost outputs in AIM o Evaluate shared responsibility aspects o Develop agenda for September policy-maker meeting o The group agreed that we should invite legislators to the September meeting, and debated what to have
ready for them to react to. As Antonio mentioned, it can’t be overly determined (so legislators have no say/buy-in), and it can’t be too amorphous (so it looks like we haven’t done enough work).
o Group agreed we should have 3 of the 4 objectives done – we should determine how to measure affordability, measure the current system, and develop parameters to define limits on work and debt. Setting the state’s goals for affordability is an appropriate place to solicit and incorporate legislative input.
o Group may want to reach out to other stakeholders at some point, in between July and September, or shortly after the September meeting. The business community has a stake here, and may be receptive to the idea. Other education advocates might also have a role in promoting the concept and encouraging the legislature to use it. That said, the group hasn’t come to a consensus on when and which groups to reach out to. That’s something we can discuss in July.
o The July meeting will also focus on reviewing data on the affordability metrics we discussed and grouped into three categories: cost, aid, and student-family options. We will also finalize the agenda for September and decide when and which key legislators we’ll invite to participate.
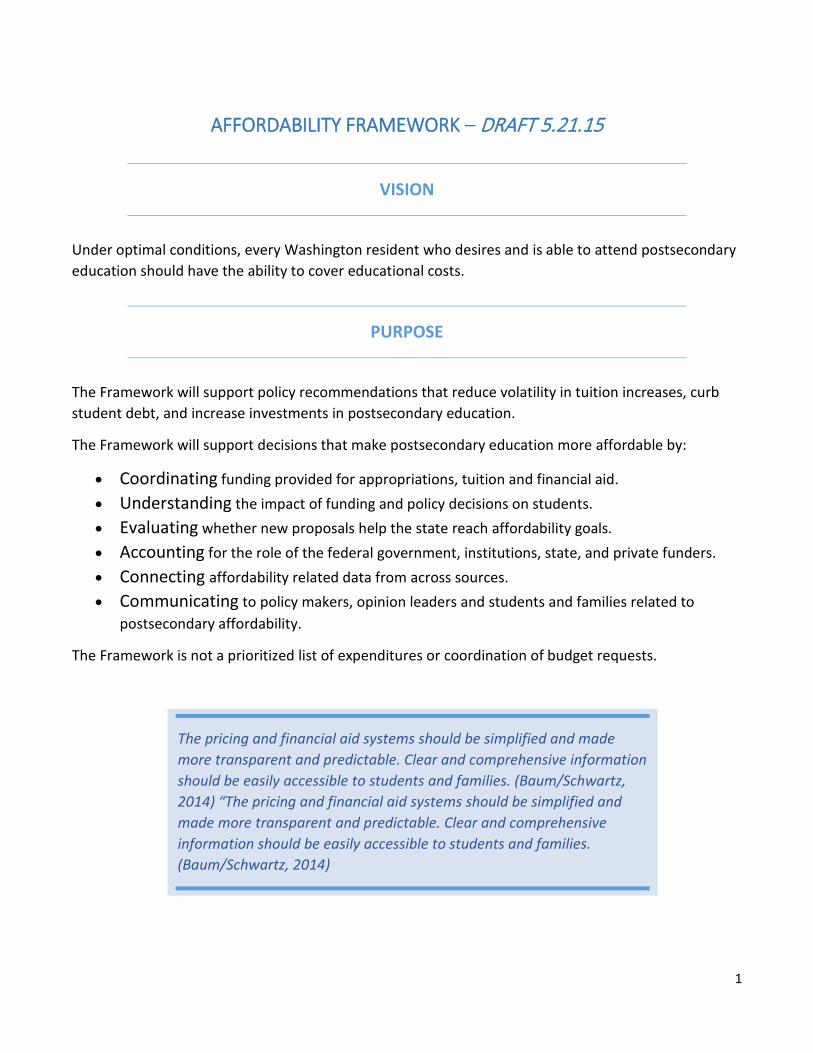
AFFORDABILITY FRAMEWORK – DRAFT 5.21.15
VISION
Under optimal conditions, every Washington resident who desires and is able to attend postsecondary education should have the ability to cover educational costs.
PURPOSE
The Framework will support policy recommendations that reduce volatility in tuition increases, curb student debt, and increase investments in postsecondary education.
The Framework will support decisions that make postsecondary education more affordable by:
• Coordinating funding provided for appropriations, tuition and financial aid. • Understanding the impact of funding and policy decisions on students. • Evaluating whether new proposals help the state reach affordability goals. • Accounting for the role of the federal government, institutions, state, and private funders. • Connecting affordability related data from across sources. • Communicating to policy makers, opinion leaders and students and families related to
postsecondary affordability.
The Framework is not a prioritized list of expenditures or coordination of budget requests.
The pricing and financial aid systems should be simplified and made more transparent and predictable. Clear and comprehensive information should be easily accessible to students and families. (Baum/Schwartz, 2014) “The pricing and financial aid systems should be simplified and made more transparent and predictable. Clear and comprehensive information should be easily accessible to students and families. (Baum/Schwartz, 2014)
1
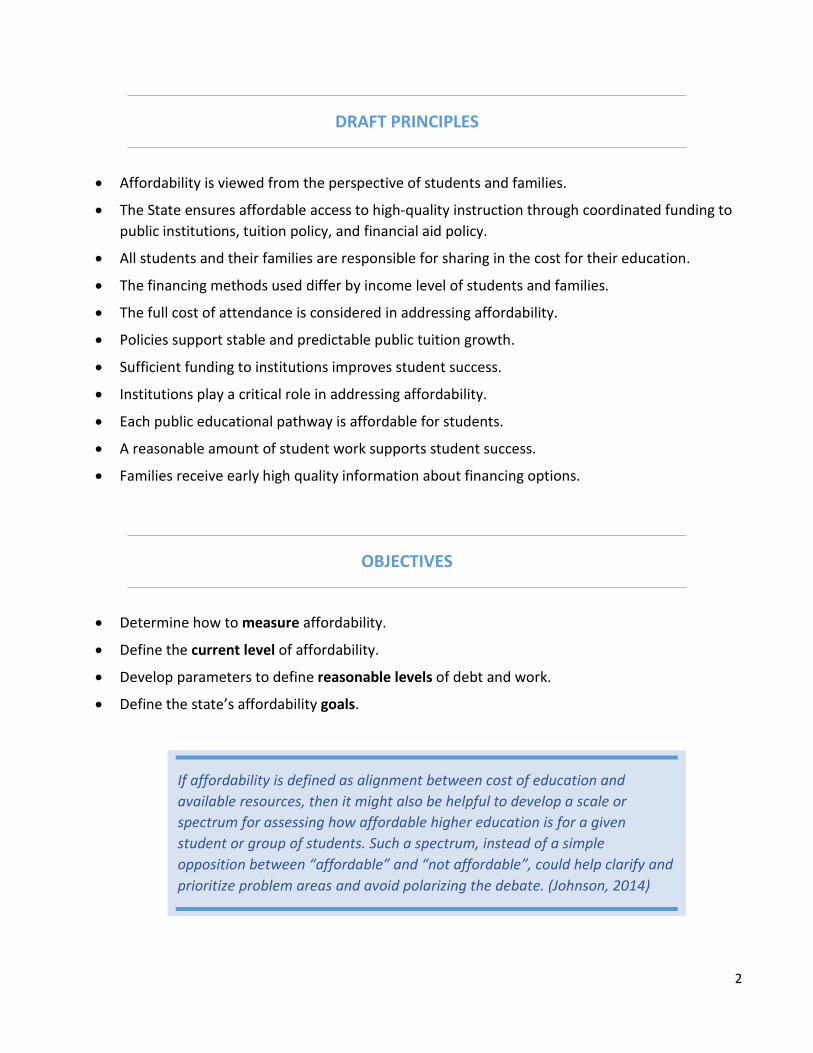
DRAFT PRINCIPLES
• Affordability is viewed from the perspective of students and families.
• The State ensures affordable access to high-quality instruction through coordinated funding to public institutions, tuition policy, and financial aid policy.
• All students and their families are responsible for sharing in the cost for their education.
• The financing methods used differ by income level of students and families.
• The full cost of attendance is considered in addressing affordability.
• Policies support stable and predictable public tuition growth.
• Sufficient funding to institutions improves student success.
• Institutions play a critical role in addressing affordability.
• Each public educational pathway is affordable for students.
• A reasonable amount of student work supports student success.
• Families receive early high quality information about financing options.
OBJECTIVES
• Determine how to measure affordability.
• Define the current level of affordability.
• Develop parameters to define reasonable levels of debt and work.
• Define the state’s affordability goals.
If affordability is defined as alignment between cost of education and available resources, then it might also be helpful to develop a scale or spectrum for assessing how affordable higher education is for a given student or group of students. Such a spectrum, instead of a simple opposition between “affordable” and “not affordable”, could help clarify and prioritize problem areas and avoid polarizing the debate. (Johnson, 2014)
2
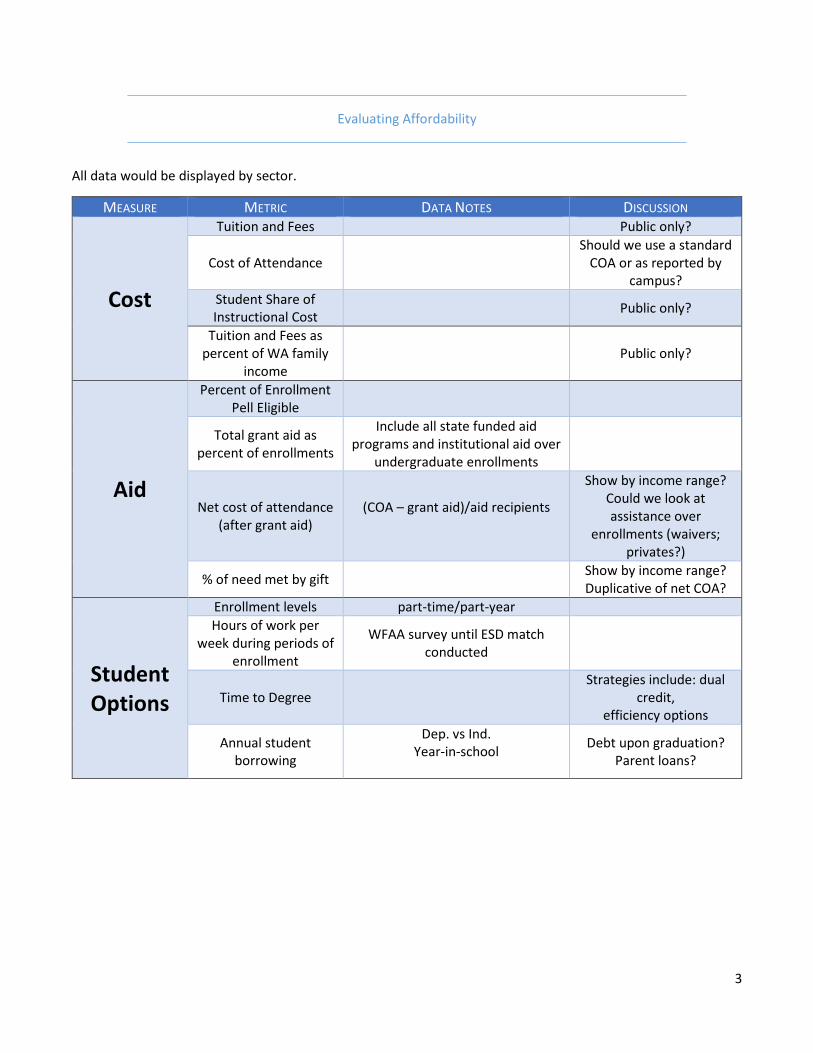
Evaluating Affordability
All data would be displayed by sector.
MEASURE METRIC DATA NOTES DISCUSSION
Cost
Tuition and Fees Public only?
Cost of Attendance Should we use a standard
COA or as reported by campus?
Student Share of Instructional Cost Public only?
Tuition and Fees as percent of WA family
income Public only?
Aid
Percent of Enrollment Pell Eligible
Total grant aid as percent of enrollments
Include all state funded aid programs and institutional aid over
undergraduate enrollments
Net cost of attendance (after grant aid)
(COA – grant aid)/aid recipients
Show by income range? Could we look at assistance over
enrollments (waivers; privates?)
% of need met by gift Show by income range? Duplicative of net COA?
Student Options
Enrollment levels part-time/part-year Hours of work per
week during periods of enrollment
WFAA survey until ESD match conducted
Time to Degree Strategies include: dual
credit, efficiency options
Annual student borrowing
Dep. vs Ind. Year-in-school
Debt upon graduation? Parent loans?
3
THRESHOLDS
There are levels of student work hours and annual student debt amount beyond which postsecondary education cannot be considered as reasonably affordable. The thresholds likely vary by educational sector.
Details TBD
Other Influencing Factors
There are several factors that influence the affordability of a post-secondary education, but which state higher education policy cannot directly impact. We need to be aware of and responsive to these factors, but they do not drive an affordability policy alone.
• Federal tax credits • Student loan interest rates • Minimum wage • Federal aid policy (Pell) • Family savings • Private/Foundation support • Institutional aid
4
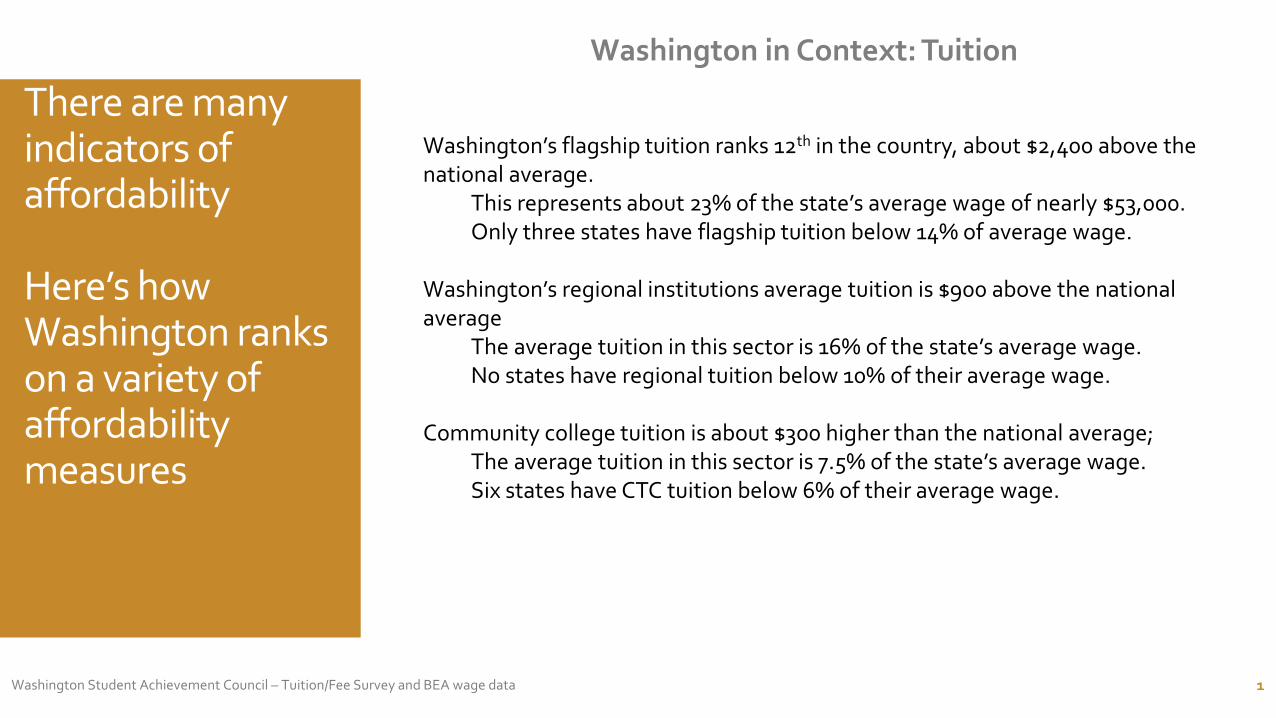
There are many indicators of affordability
Here’s how Washington ranks on a variety of affordability measures
Washington Student Achievement Council – Tuition/Fee Survey and BEA wage data 1
Washington in Context: Tuition
Washington’s flagship tuition ranks 12th in the country, about $2,400 above the national average.
This represents about 23% of the state’s average wage of nearly $53,000.Only three states have flagship tuition below 14% of average wage.
Washington’s regional institutions average tuition is $900 above the national average
The average tuition in this sector is 16% of the state’s average wage. No states have regional tuition below 10% of their average wage.
Community college tuition is about $300 higher than the national average; The average tuition in this sector is 7.5% of the state’s average wage. Six states have CTC tuition below 6% of their average wage.
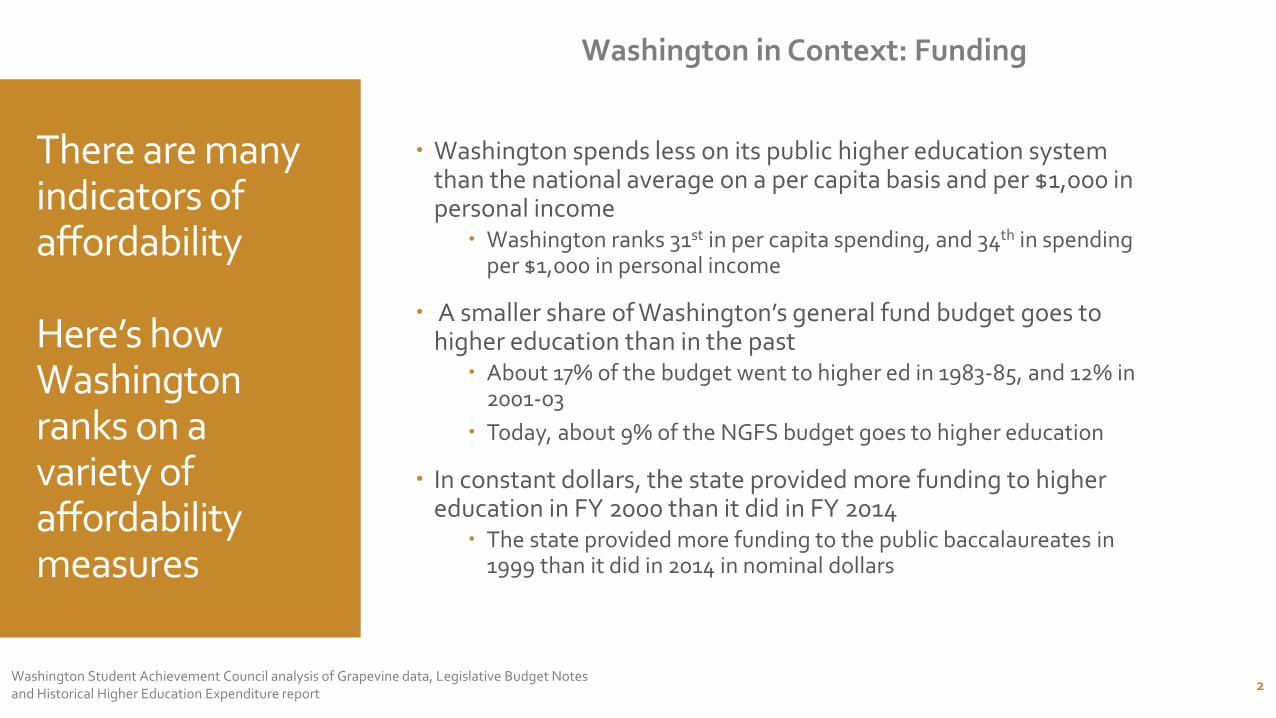
There are many indicators of affordability
Here’s how Washington ranks on a variety of affordability measures
Washington spends less on its public higher education system than the national average on a per capita basis and per $1,000 in personal income
Washington ranks 31st in per capita spending, and 34th in spending per $1,000 in personal income
A smaller share of Washington’s general fund budget goes to higher education than in the past
About 17% of the budget went to higher ed in 1983-85, and 12% in 2001-03
Today, about 9% of the NGFS budget goes to higher education
In constant dollars, the state provided more funding to higher education in FY 2000 than it did in FY 2014
The state provided more funding to the public baccalaureates in 1999 than it did in 2014 in nominal dollars
Washington Student Achievement Council analysis of Grapevine data, Legislative Budget Notes and Historical Higher Education Expenditure report 2
Washington in Context: Funding
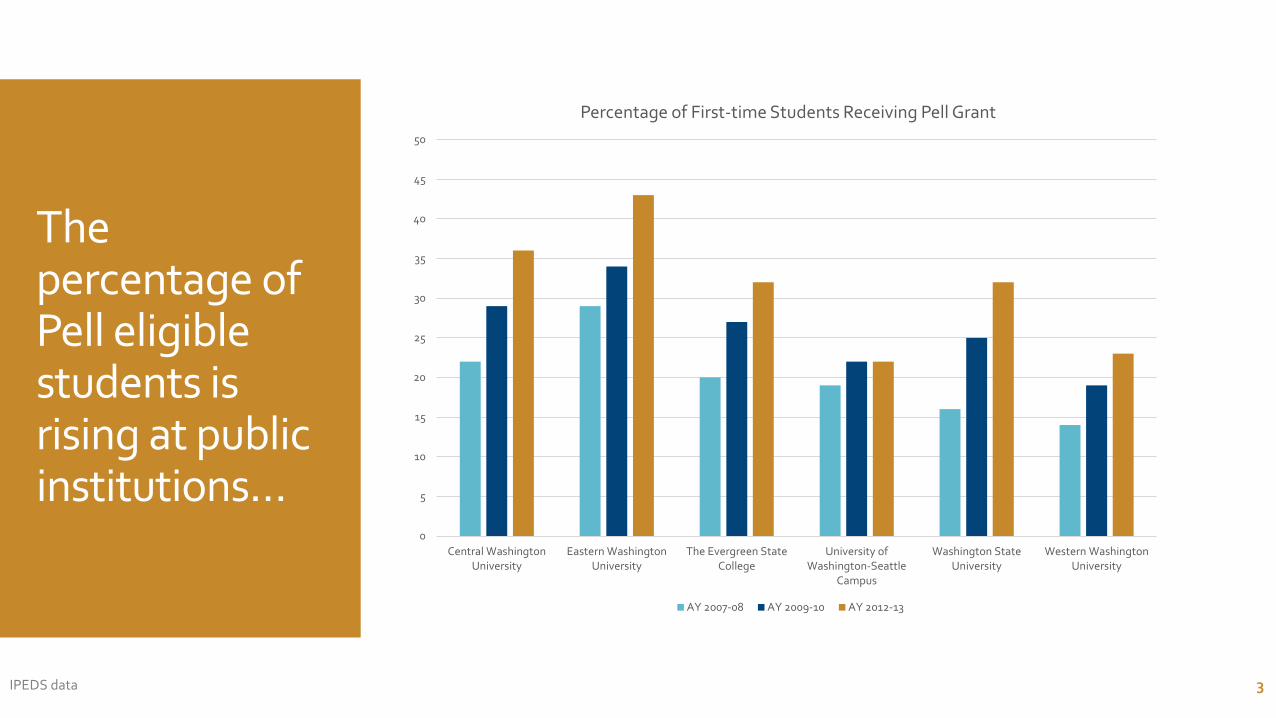
The percentage of Pell eligible students is rising at public institutions…
IPEDS data 3
0
5
10
15
20
25
30
35
40
45
50
Central WashingtonUniversity
Eastern WashingtonUniversity
The Evergreen StateCollege
University ofWashington-Seattle
Campus
Washington StateUniversity
Western WashingtonUniversity
Percentage of First-time Students Receiving Pell Grant
AY 2007-08 AY 2009-10 AY 2012-13
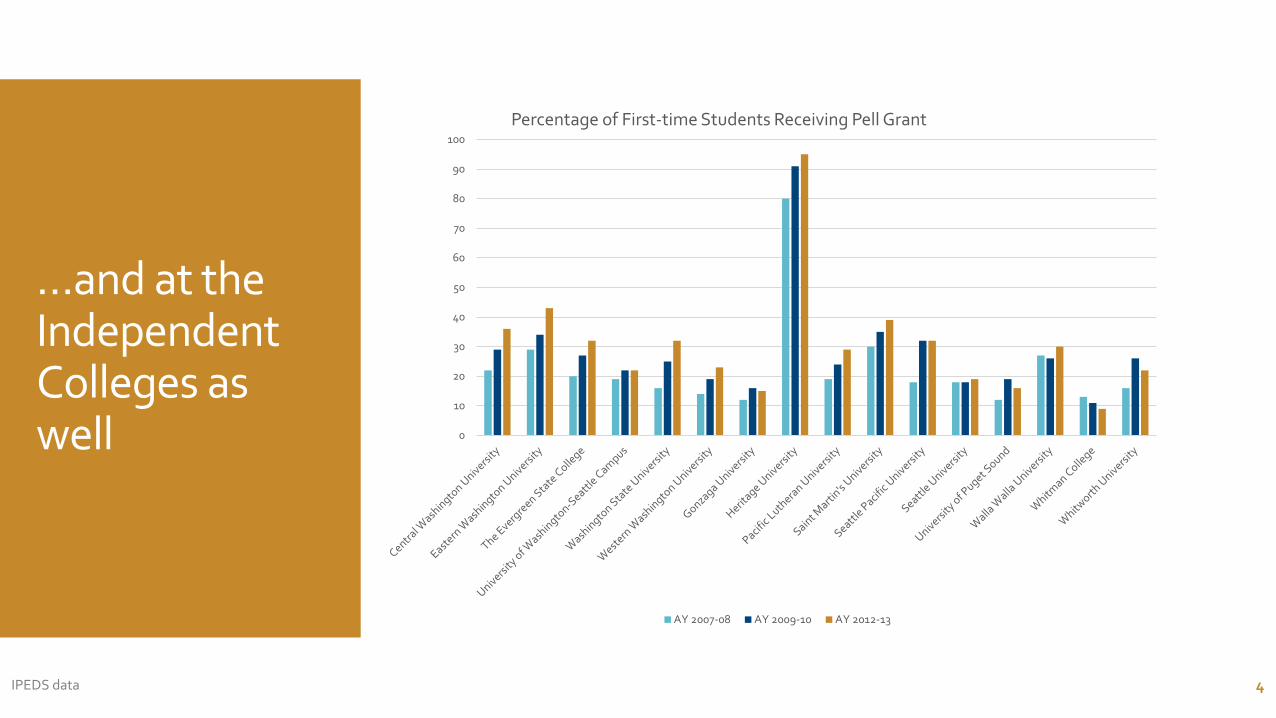
…and at the Independent Colleges as well
IPEDS data 4
0
10
20
30
40
50
60
70
80
90
100Percentage of First-time Students Receiving Pell Grant
AY 2007-08 AY 2009-10 AY 2012-13
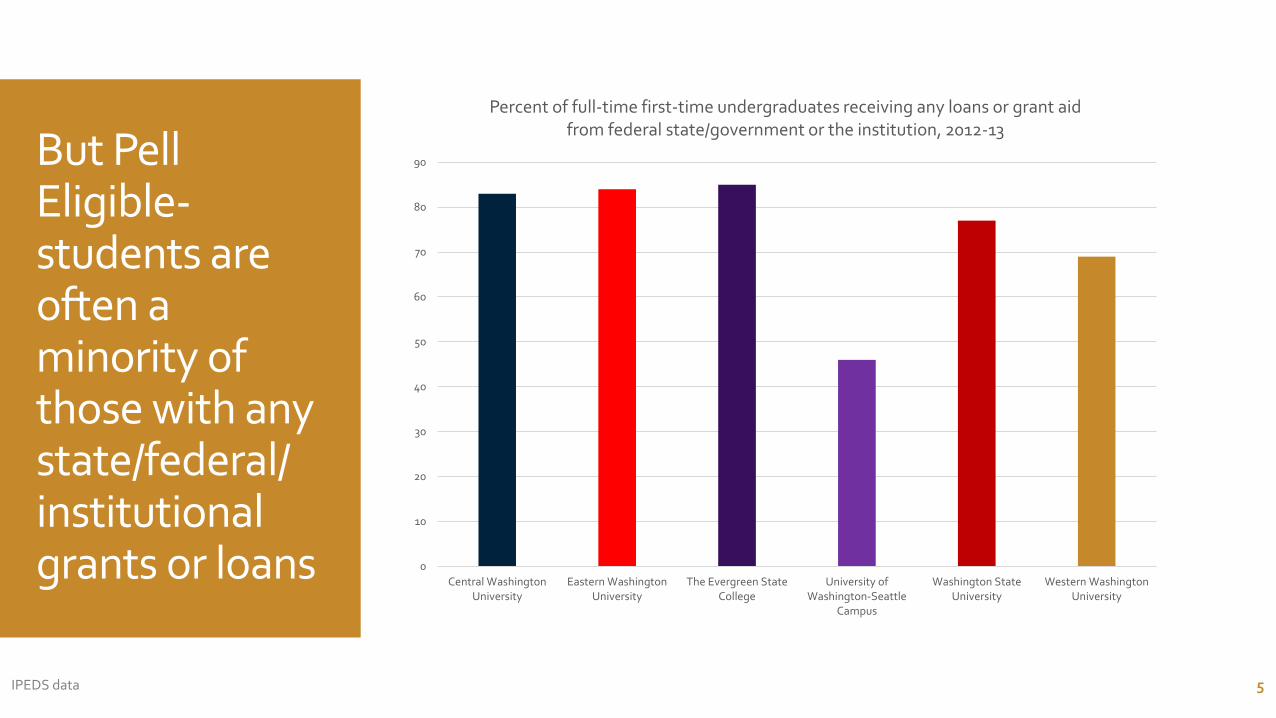
But Pell Eligible-students are often a minority of those with any state/federal/ institutional grants or loans
IPEDS data 5
0
10
20
30
40
50
60
70
80
90
Central WashingtonUniversity
Eastern WashingtonUniversity
The Evergreen StateCollege
University ofWashington-Seattle
Campus
Washington StateUniversity
Western WashingtonUniversity
Percent of full-time first-time undergraduates receiving any loans or grant aid from federal state/government or the institution, 2012-13
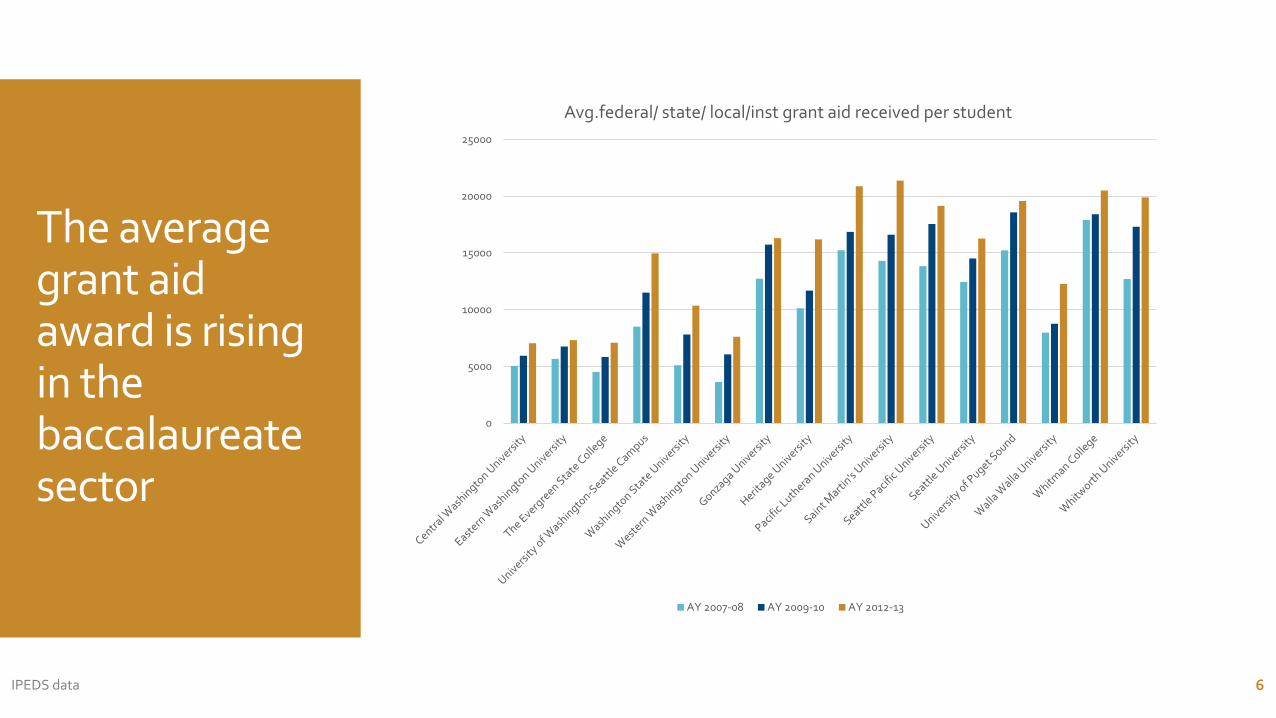
The average grant aid award is rising in the baccalaureate sector
IPEDS data 6
0
5000
10000
15000
20000
25000
Avg.federal/ state/ local/inst grant aid received per student
AY 2007-08 AY 2009-10 AY 2012-13
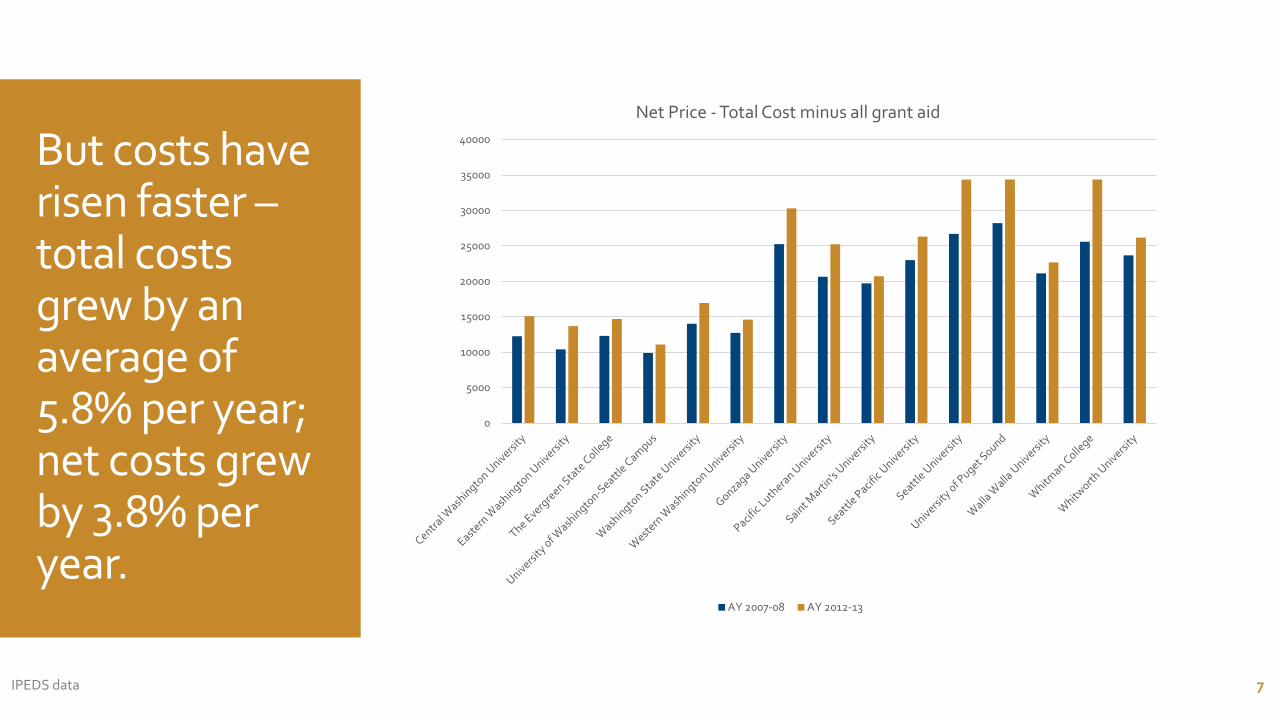
But costs have risen faster –total costs grew by an average of 5.8% per year; net costs grew by 3.8% per year.
IPEDS data 7
0
5000
10000
15000
20000
25000
30000
35000
40000
Net Price - Total Cost minus all grant aid
AY 2007-08 AY 2012-13
Can coordinated aid and support target remaining gaps?
What are students paying today, net of aid and family contribution? Where are the gaps?
What is the right amount of work/debt? What is reasonable amount to expect parents and students to
contribute?
What does “affordable” mean in each sector? Does it differ by program?
8