Embed Size (px)
Citation preview
Slide 1 – Commerzbank German Investment Seminar – 9 January 2017
Commerzbank German Investment Seminar 2017
New York, 9 January 2017
Dr. Bernd Scheifele, Group CEO
Slide 2 – Commerzbank German Investment Seminar – 9 January 2017
Disclaimer
This presentation contains forward-looking statements and information. Forward-looking statements and information are
statements that are not historical facts, related to future, not past, events. They include statements about our beliefs and
expectations and the underlying assumptions. These statements and information are based on plans, estimates,
projections as they are currently available to the management of HeidelbergCement. Forward-looking statements and
information therefore speak only as of the date they are made, and we undertake no obligation to update publicly any of
them in light of new information or future events.
By their very nature, forward-looking statements and information are subject to certain risks and uncertainties. A variety
of factors, many of which are beyond HeidelbergCements’ control, could cause actual results to differ materially from
those that may be expressed or implied by such forward-looking statement or information. For HeidelbergCement
particular uncertainties arise, among others, from changes in general economic and business conditions in Germany, in
Europe, in the United States and elsewhere from which we derive a substantial portion of our revenues and in which we
hold a substantial portion of our assets; the possibility that prices will decline to a greater extent than currently
anticipated by HeidelbergCements’ management as a result of continued adverse market conditions; developments in
the financial markets, including fluctuations in interest and exchange rates, commodity and equity prices, debt prices
(credit spreads) and financial assets generally; continued volatility and a further deterioration of capital markets; a
worsening in the conditions of the credit business and, in particular, additional uncertainties arising out of the subprime
financial market and liquidity crisis; the outcome of pending investigations and legal proceedings and actions resulting
from the findings of these investigations; as well as various other factors. Should one or more of these risks or
uncertainties materialize, or should underlying assumptions prove incorrect, actual results may vary materially from
those described in the relevant forward-looking statement or information as expected, anticipated, intended, planned,
believed, sought, estimated or projected.
Unless indicated otherwise, the financial information provided herein has been prepared under International Financial
Reporting Standards (IFRS).
Slide 3 – Commerzbank German Investment Seminar – 9 January 2017
Contents
Page
1. The new HeidelbergCement 5
2. Operational and financial performance 9
3. Accelerating growth with Italcementi (ITC) 13
4. Strategy and strengths 20
5. HeidelbergCement – the future 27
Slide 4 – Commerzbank German Investment Seminar – 9 January 2017
Contents
Page
1. The new HeidelbergCement 5
2. Operational and financial performance 9
3. Accelerating growth with Italcementi (ITC) 13
4. Strategy and strengths 20
5. HeidelbergCement – the future 27
Slide 5 – Commerzbank German Investment Seminar – 9 January 2017
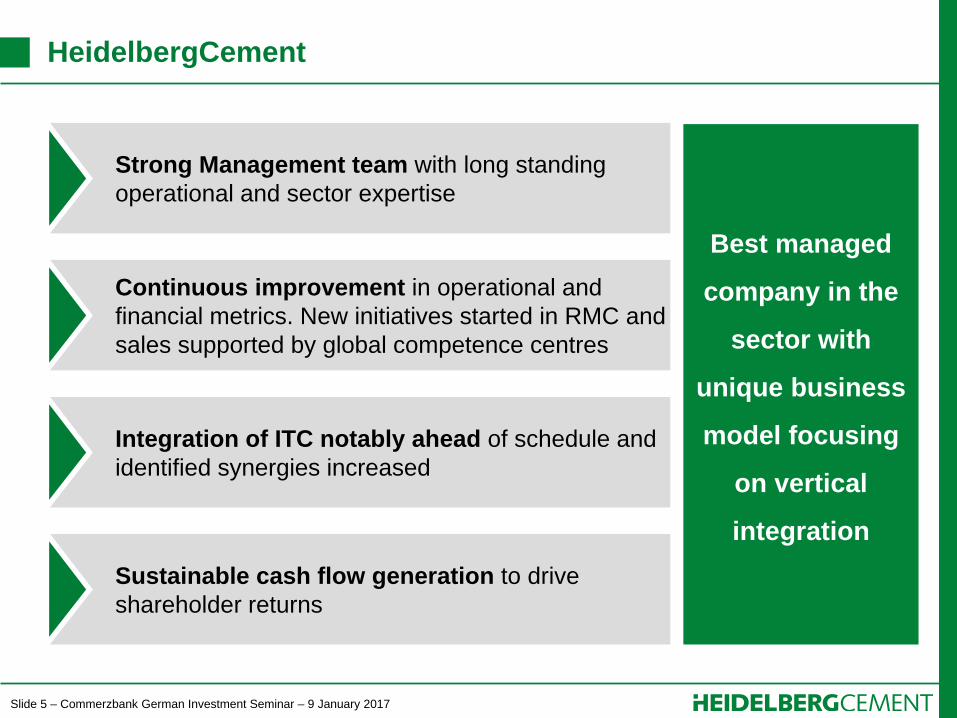
HeidelbergCement
Strong Management team with long standing
operational and sector expertise
Continuous improvement in operational and
financial metrics. New initiatives started in RMC and
sales supported by global competence centres
Sustainable cash flow generation to drive
shareholder returns
Best managed
company in the
sector with
unique business
model focusing
on vertical
integration
Integration of ITC notably ahead of schedule and
identified synergies increased
Slide 6 – Commerzbank German Investment Seminar – 9 January 2017
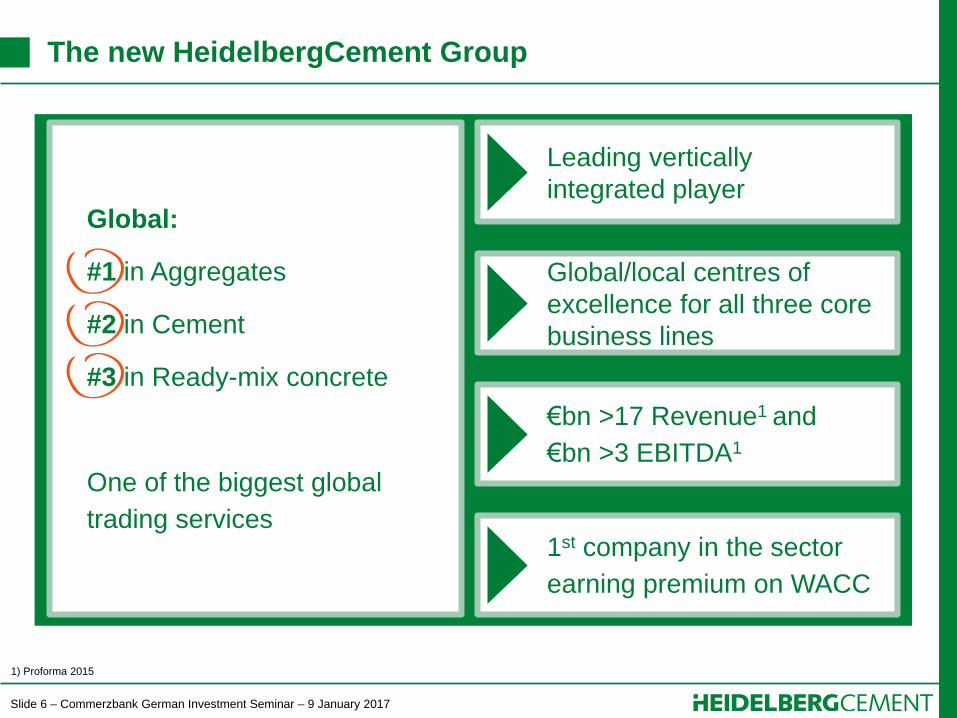
The new HeidelbergCement Group
Global:
#1 in Aggregates
#2 in Cement
#3 in Ready-mix concrete
One of the biggest global
trading services
Leading vertically
integrated player
€bn >17 Revenue1 and
€bn >3 EBITDA1
1st company in the sector
earning premium on WACC
1) Proforma 2015
Global/local centres of
excellence for all three core
business lines
Slide 7 – Commerzbank German Investment Seminar – 9 January 2017
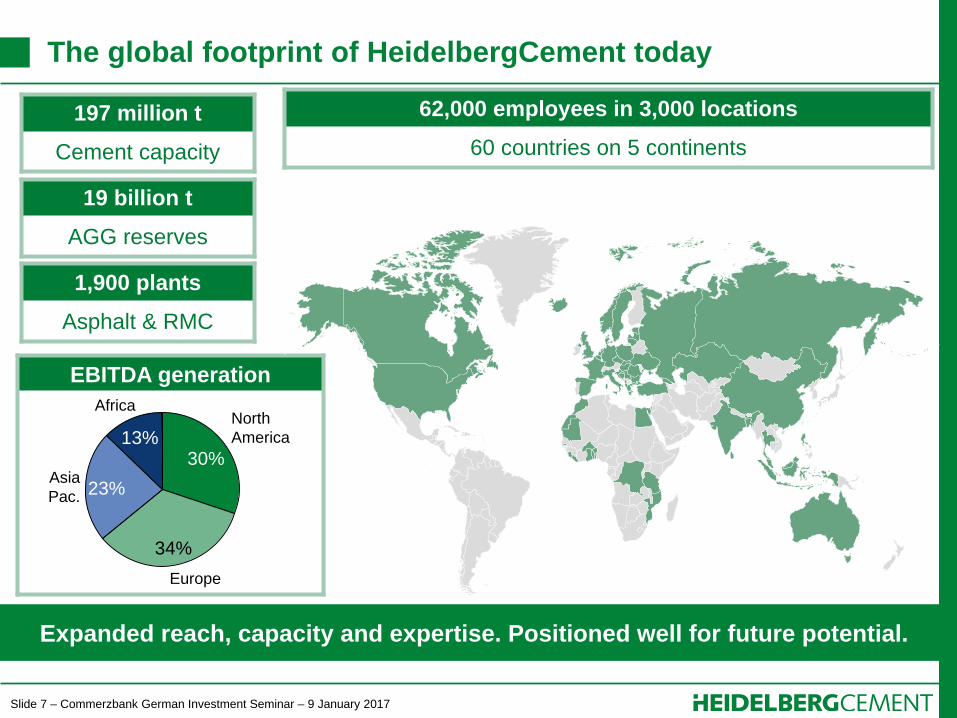
EBITDA generation
The global footprint of HeidelbergCement today
Expanded reach, capacity and expertise. Positioned well for future potential.
197 million t
Cement capacity
19 billion t
AGG reserves
1,900 plants
Asphalt & RMC
62,000 employees in 3,000 locations
60 countries on 5 continents
30%
North
America
34%
Europe
23% Asia
Pac.
13%
Africa
Slide 8 – Commerzbank German Investment Seminar – 9 January 2017
Contents
Page
1. The new HeidelbergCement 5
2. Operational and financial performance 9
3. Accelerating growth with Italcementi (ITC) 13
4. Strategy and strengths 20
5. HeidelbergCement – the future 27
Slide 9 – Commerzbank German Investment Seminar – 9 January 2017
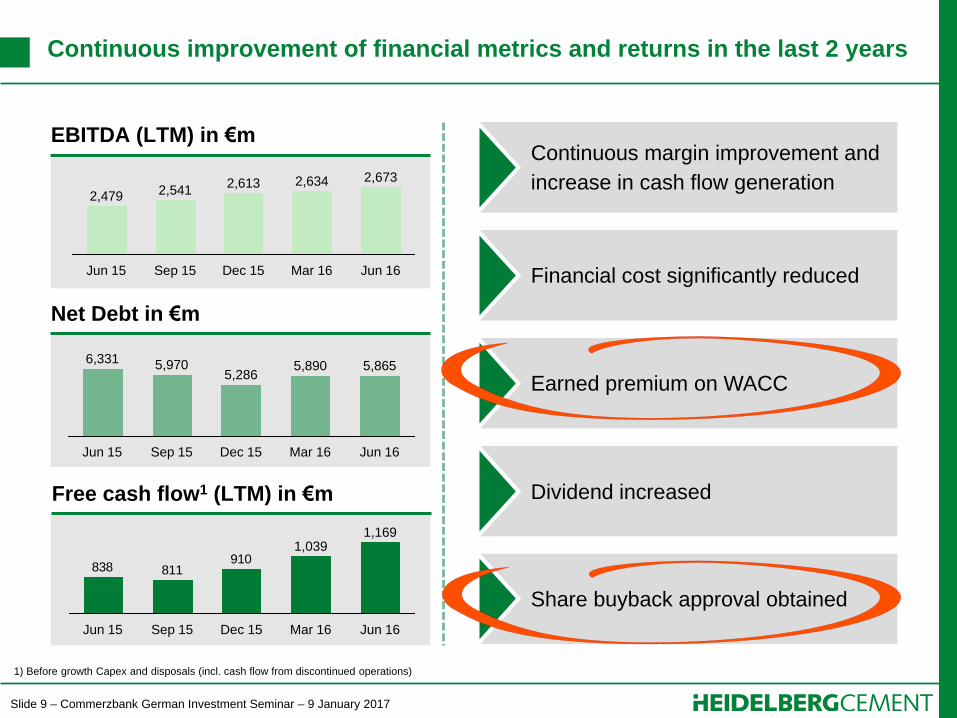
Continuous improvement of financial metrics and returns in the last 2 years
Jun 16
2,673
Mar 16
2,634
Dec 15
2,613
Sep 15
2,541
Jun 15
2,479
5,865
Mar 16
5,890
Dec 15
5,286
Sep 15
5,970
Jun 15
6,331
Jun 16
910811838
Jun 16
1,169
Mar 16
1,039
Dec 15 Sep 15 Jun 15
Earned premium on WACC
Share buyback approval obtained
Dividend increased
Continuous margin improvement and
increase in cash flow generation
Financial cost significantly reduced
EBITDA (LTM) in €m
Free cash flow1 (LTM) in €m
Net Debt in €m
1) Before growth Capex and disposals (incl. cash flow from discontinued operations)
Slide 10 – Commerzbank German Investment Seminar – 9 January 2017
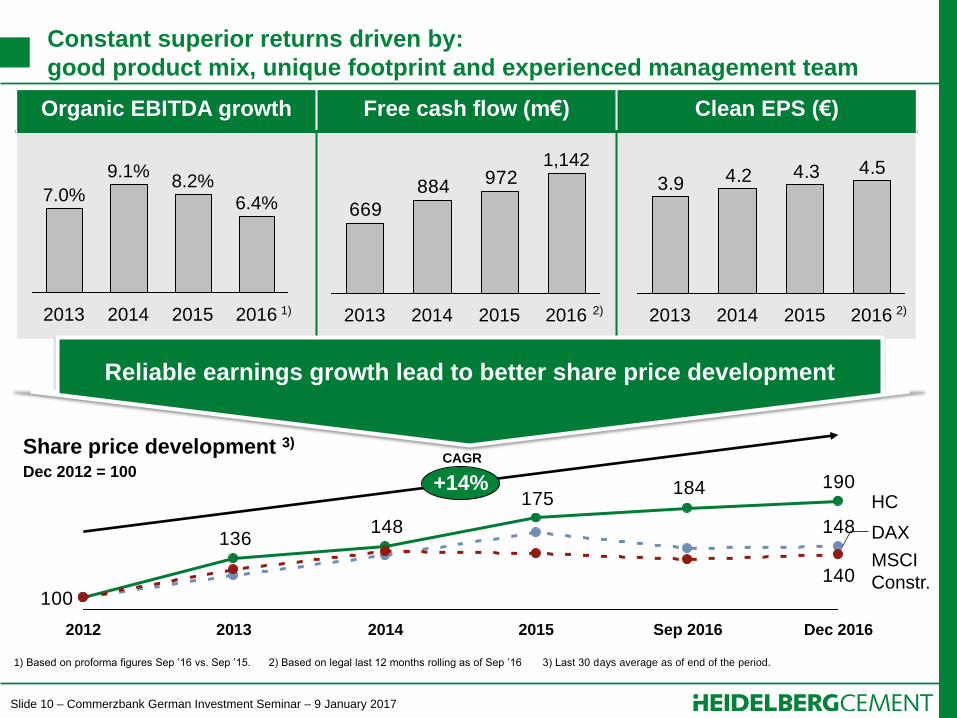
Organic EBITDA growth Free cash flow (m€) Clean EPS (€)
Constant superior returns driven by:
good product mix, unique footprint and experienced management team
2016
6.4%
2015
8.2%
2014
9.1%
2013
7.0% 972
884
669
2016
1,142
2015 2014 2013
190184175
148136
148
100
140MSCI
Constr.
DAX
HC
Dec 2016 Sep 2016 2015 2014 2013 2012
+14%
4.54.34.23.9
2016 2015 2014 2013
Reliable earnings growth lead to better share price development
1) 2) 2)
Share price development 3)
Dec 2012 = 100
1) Based on proforma figures Sep ’16 vs. Sep ’15. 2) Based on legal last 12 months rolling as of Sep ’16 3) Last 30 days average as of end of the period.
CAGR
Slide 11 – Commerzbank German Investment Seminar – 9 January 2017
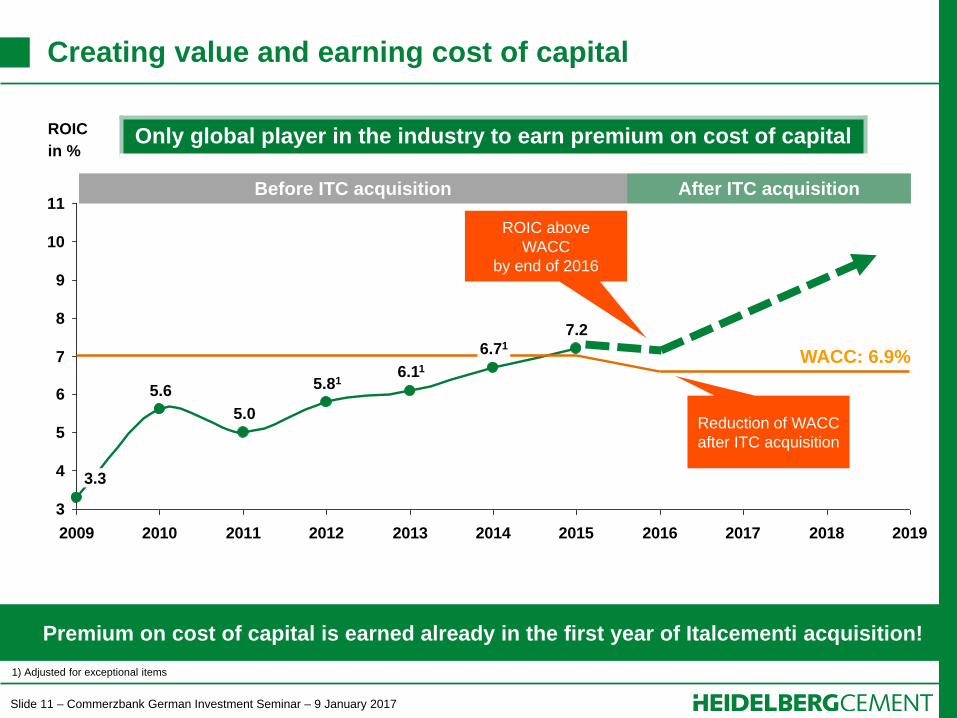
Creating value and earning cost of capital
Premium on cost of capital is earned already in the first year of Italcementi acquisition!
3
4
5
6
7
8
9
10
11
2009 2010 2011 2012 2013 2014 2015 2016 2017 2018 2019
3.3
5.6 5.81
5.0
6.71
7.2
6.11
ROIC
in %
Before ITC acquisition After ITC acquisition
Reduction of WACC
after ITC acquisition
1) Adjusted for exceptional items
WACC: 6.9%
ROIC above
WACC
by end of 2016
Only global player in the industry to earn premium on cost of capital
Slide 12 – Commerzbank German Investment Seminar – 9 January 2017
Contents
Page
1. The new HeidelbergCement 5
2. Operational and financial performance 9
3. Accelerating growth with Italcementi (ITC) 13
4. Strategy and strengths 20
5. HeidelbergCement – the future 27
Slide 13 – Commerzbank German Investment Seminar – 9 January 2017
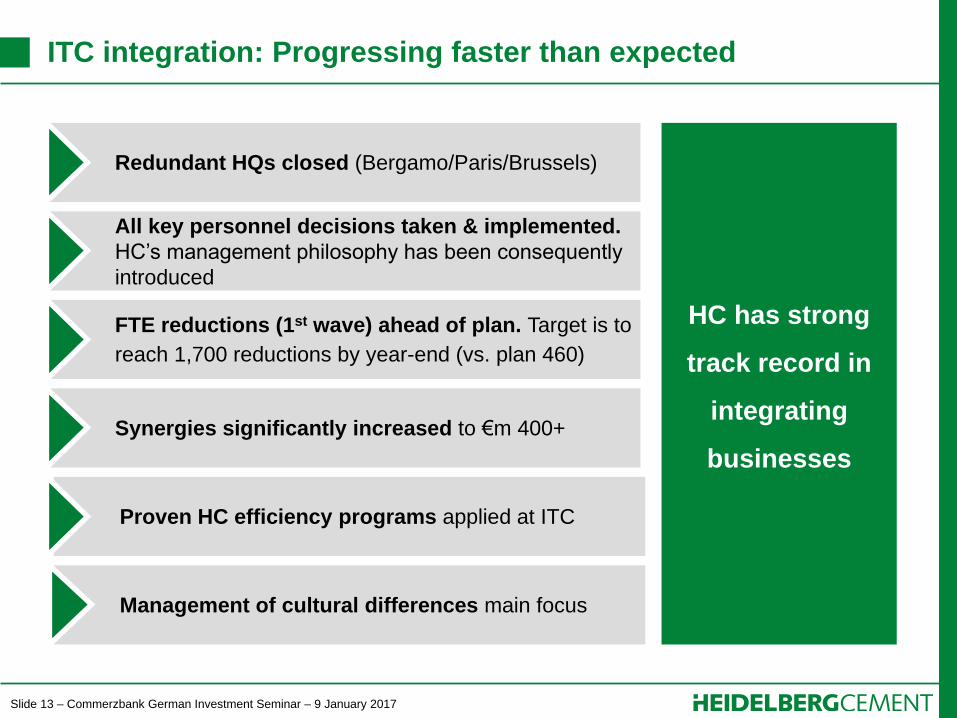
ITC integration: Progressing faster than expected
Integration & acquisition in HC DNA
Redundant HQs closed (Bergamo/Paris/Brussels)
All key personnel decisions taken & implemented.
HC’s management philosophy has been consequently
introduced
FTE reductions (1st wave) ahead of plan. Target is to
reach 1,700 reductions by year-end (vs. plan 460)
Synergies significantly increased to €m 400+
Proven HC efficiency programs applied at ITC
Management of cultural differences main focus
HC has strong
track record in
integrating
businesses
Slide 14 – Commerzbank German Investment Seminar – 9 January 2017
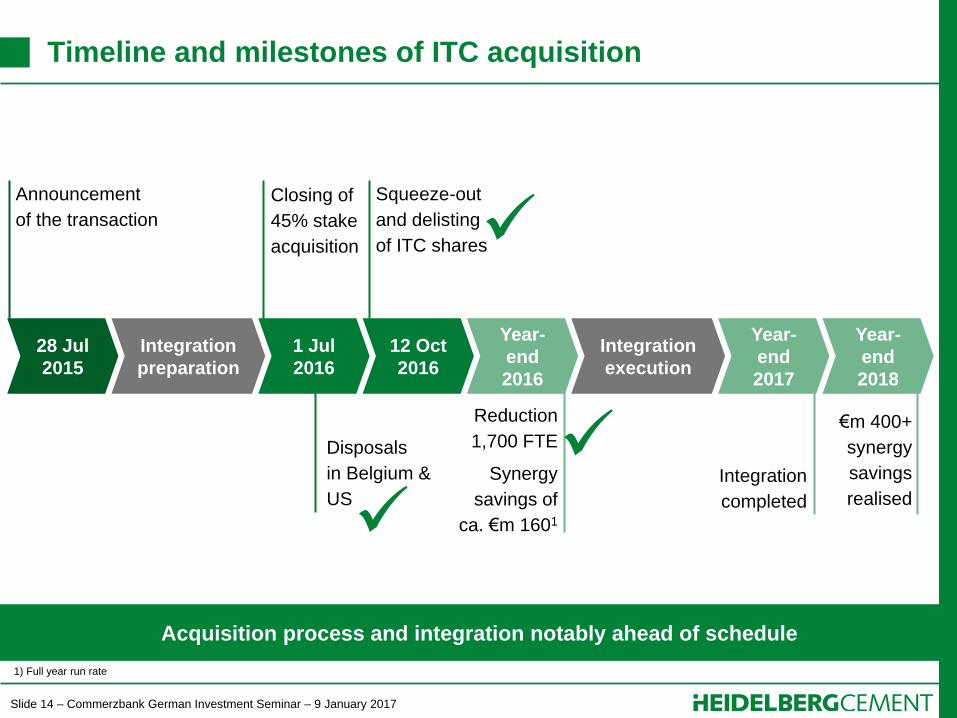
Timeline and milestones of ITC acquisition
Acquisition process and integration notably ahead of schedule
28 Jul
2015
Integration
preparation
Year-
end
2017
Announcement
of the transaction
Squeeze-out
and delisting
of ITC shares
Closing of
45% stake
acquisition
12 Oct
2016
Integration
completed
Year-
end
2018
€m 400+
synergy
savings
realised
Integration
execution
Disposals
in Belgium &
US
1 Jul
2016
Year-
end
2016
Reduction
1,700 FTE
Synergy
savings of
ca. €m 1601
1) Full year run rate
Slide 15 – Commerzbank German Investment Seminar – 9 January 2017
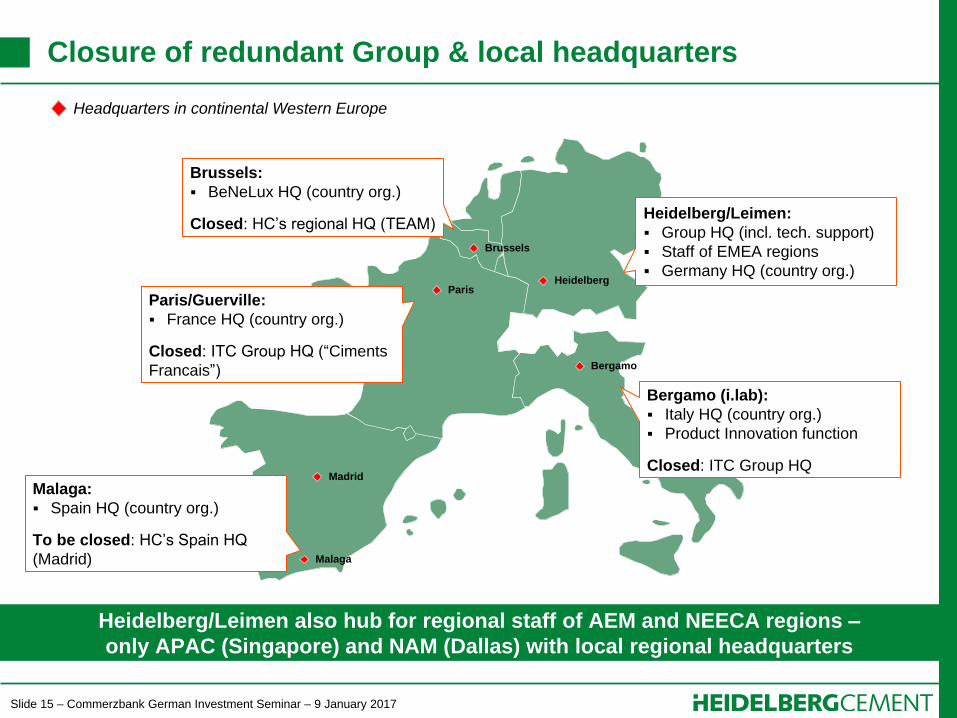
Closure of redundant Group & local headquarters
Heidelberg/Leimen also hub for regional staff of AEM and NEECA regions –
only APAC (Singapore) and NAM (Dallas) with local regional headquarters
Bergamo
Heidelberg
Brussels
Paris
Madrid
Malaga
Heidelberg/Leimen:
Group HQ (incl. tech. support)
Staff of EMEA regions
Germany HQ (country org.)
Bergamo (i.lab):
Italy HQ (country org.)
Product Innovation function
Closed: ITC Group HQ
Brussels:
BeNeLux HQ (country org.)
Closed: HC’s regional HQ (TEAM)
Paris/Guerville:
France HQ (country org.)
Closed: ITC Group HQ (“Ciments
Francais”)
Malaga:
Spain HQ (country org.)
To be closed: HC’s Spain HQ
(Madrid)
Headquarters in continental Western Europe
Slide 16 – Commerzbank German Investment Seminar – 9 January 2017
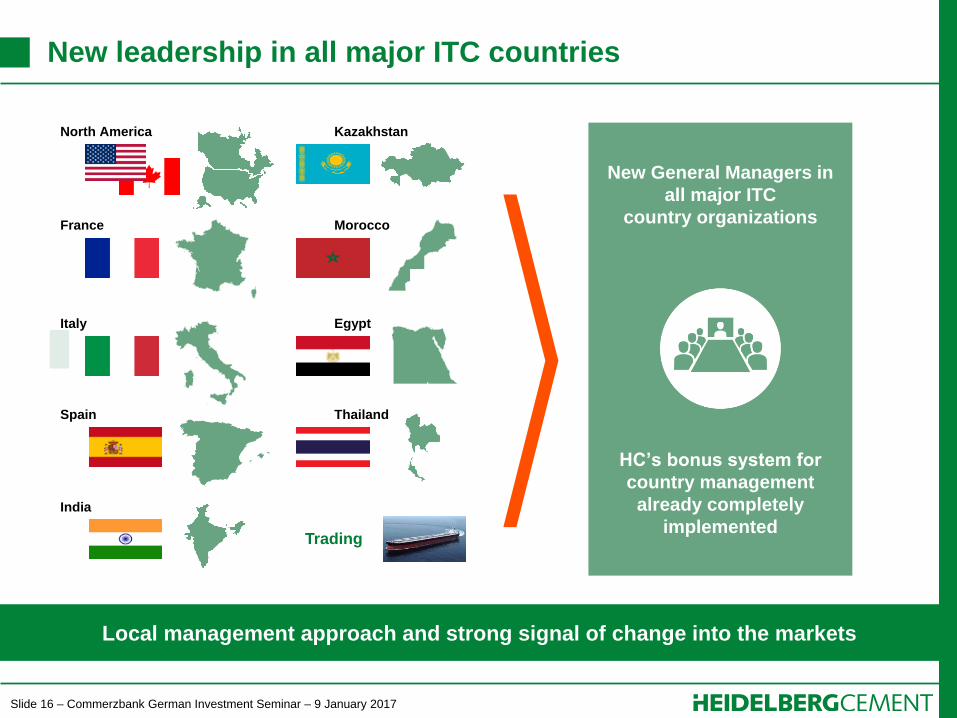
New leadership in all major ITC countries
Local management approach and strong signal of change into the markets
Trading
New General Managers in
all major ITC
country organizations
HC’s bonus system for
country management
already completely
implemented
North America
France
Italy
Spain
India
Kazakhstan
Morocco
Egypt
Thailand
Slide 17 – Commerzbank German Investment Seminar – 9 January 2017
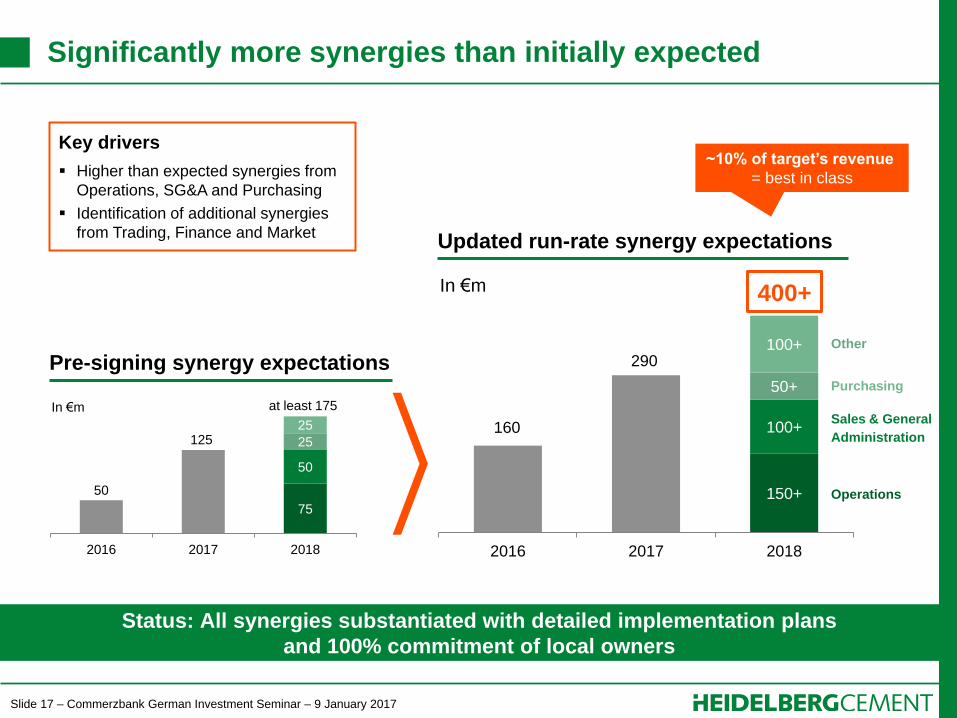
150+
100+
50+
100+
2016 2017 2018
Status: All synergies substantiated with detailed implementation plans
and 100% commitment of local owners
75
50
25
25
2016 2017 2018
at least 175
125
50
In €m
Pre-signing synergy expectations Other
Purchasing
Sales & General
Administration
Operations
290
160
In €m
Updated run-rate synergy expectations
Key drivers
Higher than expected synergies from
Operations, SG&A and Purchasing
Identification of additional synergies
from Trading, Finance and Market
400+
~10% of target’s revenue
= best in class
Significantly more synergies than initially expected
Slide 18 – Commerzbank German Investment Seminar – 9 January 2017
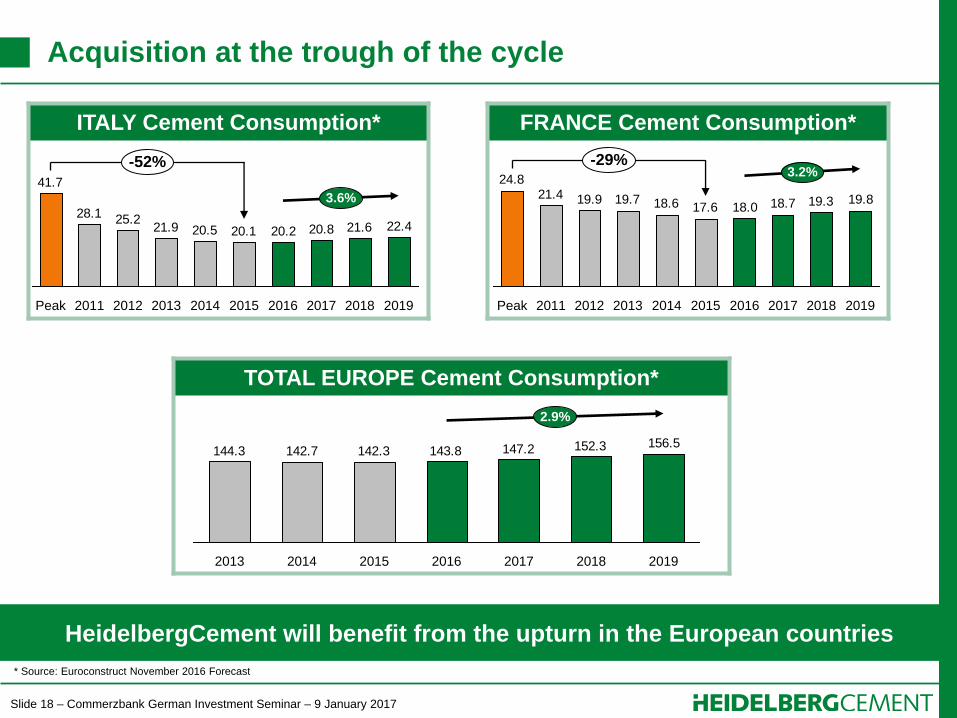
ITALY Cement Consumption*
HeidelbergCement will benefit from the upturn in the European countries
Acquisition at the trough of the cycle
22.421.620.820.220.120.521.925.228.1
41.7
3.6%
-52%
2019 2018 2017 2016 2015 2014 2013 2012 2011 Peak
FRANCE Cement Consumption*
19.819.318.718.017.618.619.719.921.424.8
Peak 2014 2012 2011 2013
3.2% -29%
2019 2018 2017 2016 2015
TOTAL EUROPE Cement Consumption*
156.5152.3147.2143.8142.3142.7144.3
2.9%
2019 2018 2017 2016 2015 2014 2013
* Source: Euroconstruct November 2016 Forecast
Slide 19 – Commerzbank German Investment Seminar – 9 January 2017
Contents
Page
1. The new HeidelbergCement 5
2. Operational and financial performance 9
3. Accelerating growth with Italcementi (ITC) 13
4. Strategy and strengths 20
5. HeidelbergCement – the future 27
Slide 20 – Commerzbank German Investment Seminar – 9 January 2017
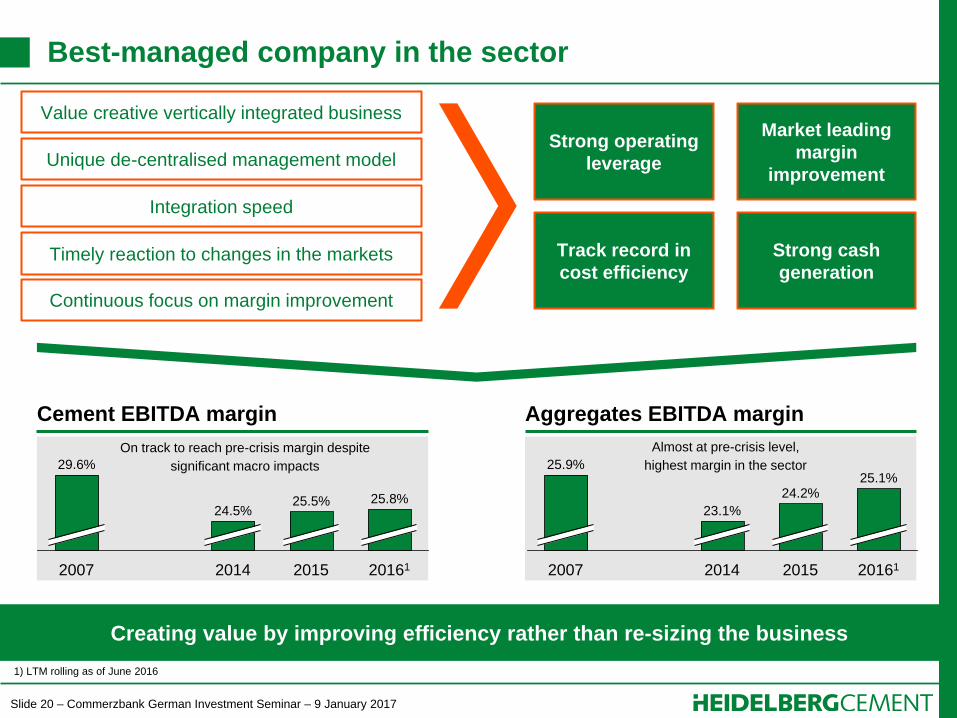
Best-managed company in the sector
Creating value by improving efficiency rather than re-sizing the business
Unique de-centralised management model Strong operating
leverage
Integration speed
Timely reaction to changes in the markets
Continuous focus on margin improvement
Market leading
margin
improvement
Track record in
cost efficiency
Strong cash
generation
25.8%
20161 2015
25.5%
2014
24.5%
2007
29.6%
23.1%
2007
24.2%
2014
25.9% 25.1%
2015 20161
On track to reach pre-crisis margin despite
significant macro impacts
Almost at pre-crisis level,
highest margin in the sector
Value creative vertically integrated business
1) LTM rolling as of June 2016
Cement EBITDA margin Aggregates EBITDA margin
Slide 21 – Commerzbank German Investment Seminar – 9 January 2017
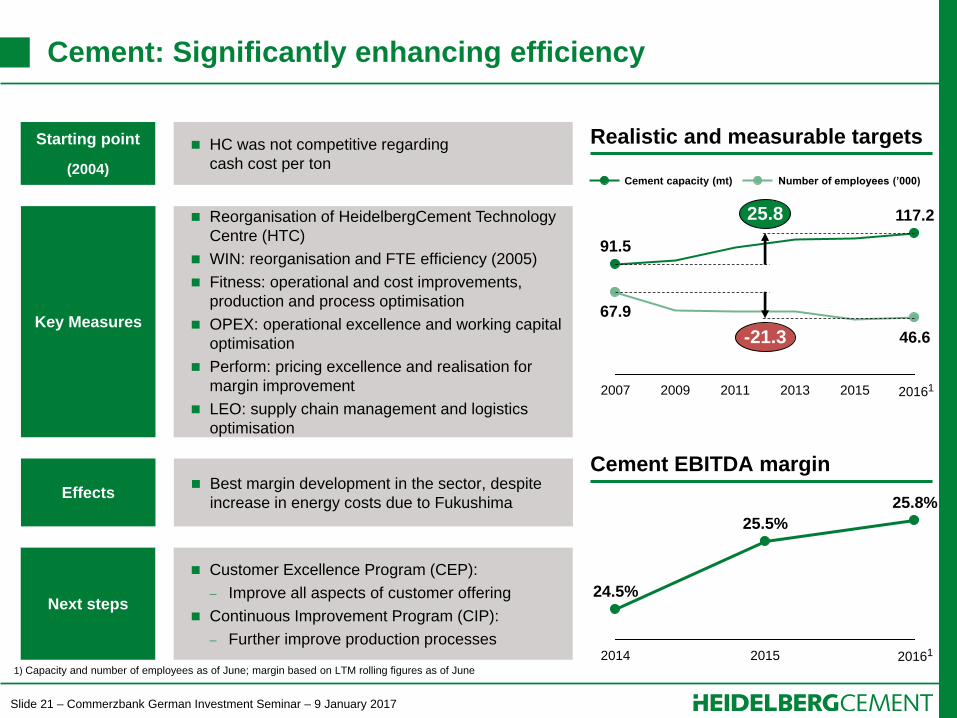
Cement: Significantly enhancing efficiency
HC was not competitive regarding
cash cost per ton
Starting point
(2004)
Best margin development in the sector, despite
increase in energy costs due to Fukushima Effects
Reorganisation of HeidelbergCement Technology
Centre (HTC)
WIN: reorganisation and FTE efficiency (2005)
Fitness: operational and cost improvements,
production and process optimisation
OPEX: operational excellence and working capital
optimisation
Perform: pricing excellence and realisation for
margin improvement
LEO: supply chain management and logistics
optimisation
Key Measures
Customer Excellence Program (CEP):
Improve all aspects of customer offering
Continuous Improvement Program (CIP):
Further improve production processes
Next steps
Realistic and measurable targets
Number of employees (’000) Cement capacity (mt)
25.8
-21.3 46.6
117.2
2015 2013 2011 2009 2007
67.9
91.5
25.8%
2015
25.5%
2014
24.5%
Cement EBITDA margin
1) Capacity and number of employees as of June; margin based on LTM rolling figures as of June
20161
20161
Slide 22 – Commerzbank German Investment Seminar – 9 January 2017
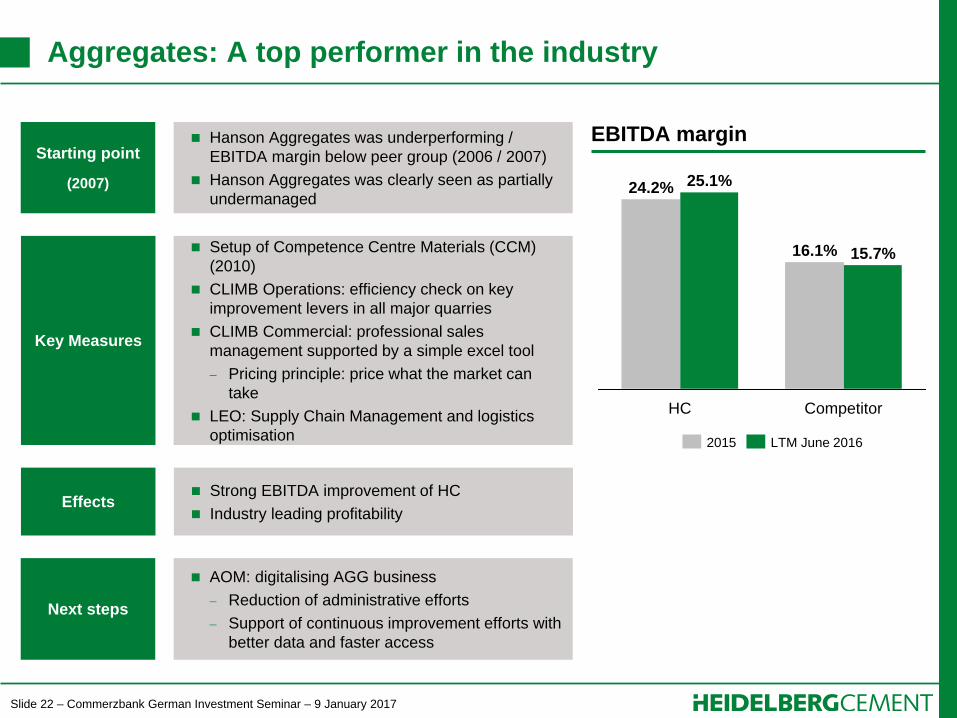
Aggregates: A top performer in the industry
Hanson Aggregates was underperforming /
EBITDA margin below peer group (2006 / 2007)
Hanson Aggregates was clearly seen as partially
undermanaged
Starting point
(2007)
Strong EBITDA improvement of HC
Industry leading profitability Effects
Setup of Competence Centre Materials (CCM)
(2010)
CLIMB Operations: efficiency check on key
improvement levers in all major quarries
CLIMB Commercial: professional sales
management supported by a simple excel tool
Pricing principle: price what the market can
take
LEO: Supply Chain Management and logistics
optimisation
Key Measures
AOM: digitalising AGG business
Reduction of administrative efforts
Support of continuous improvement efforts with
better data and faster access
Next steps
EBITDA margin
16.1%
24.2% 25.1%
15.7%
HC Competitor
2015 LTM June 2016
Slide 23 – Commerzbank German Investment Seminar – 9 January 2017
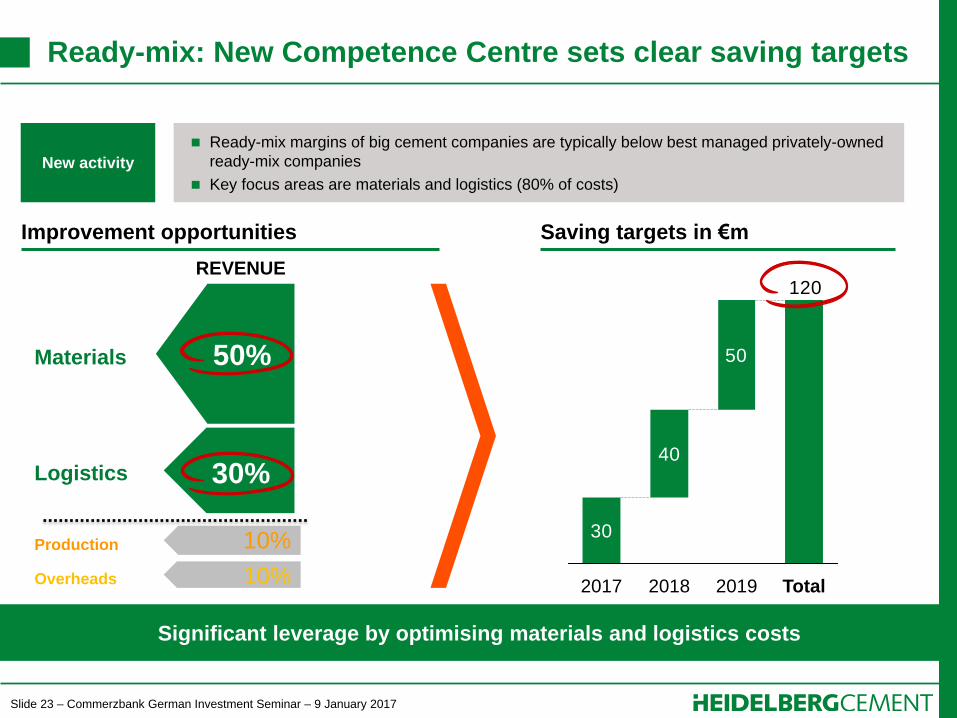
Ready-mix: New Competence Centre sets clear saving targets
Significant leverage by optimising materials and logistics costs
Ready-mix margins of big cement companies are typically below best managed privately-owned
ready-mix companies
Key focus areas are materials and logistics (80% of costs)
New activity
Improvement opportunities
REVENUE
Saving targets in €m
50%
30%
10%
10%
Materials
Logistics
Production
Overheads
30
40
50
120
Total 2017 2018 2019
Slide 24 – Commerzbank German Investment Seminar – 9 January 2017
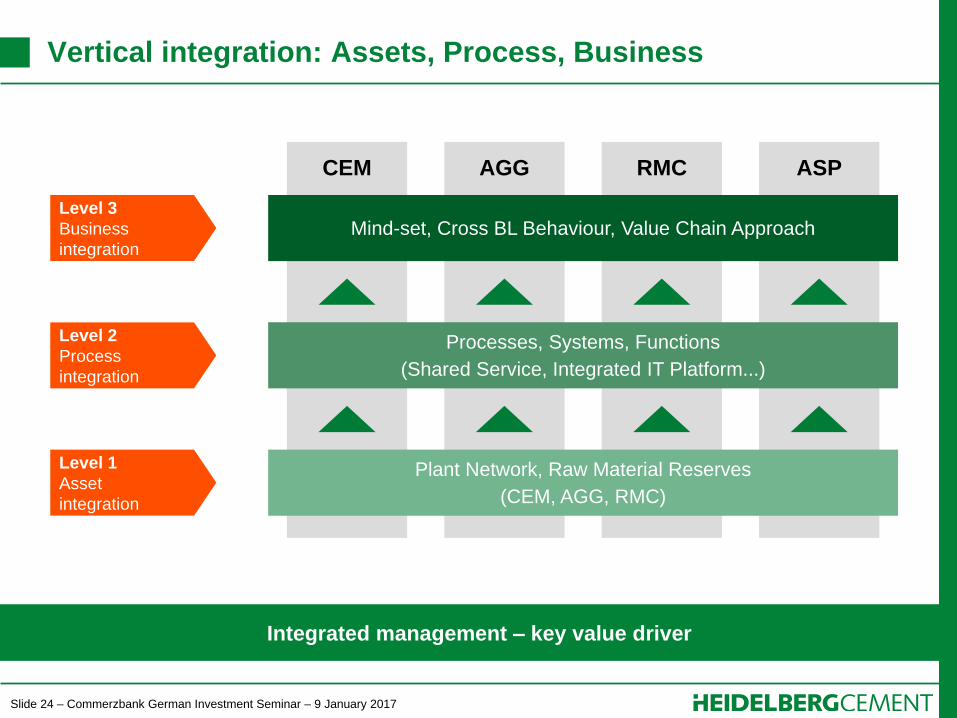
Vertical integration: Assets, Process, Business
Integrated management – key value driver
CEM AGG RMC ASP
Plant Network, Raw Material Reserves
(CEM, AGG, RMC)
Mind-set, Cross BL Behaviour, Value Chain Approach
Processes, Systems, Functions
(Shared Service, Integrated IT Platform...)
Level 3
Business
integration
Level 2
Process
integration
Level 1
Asset
integration
Slide 25 – Commerzbank German Investment Seminar – 9 January 2017
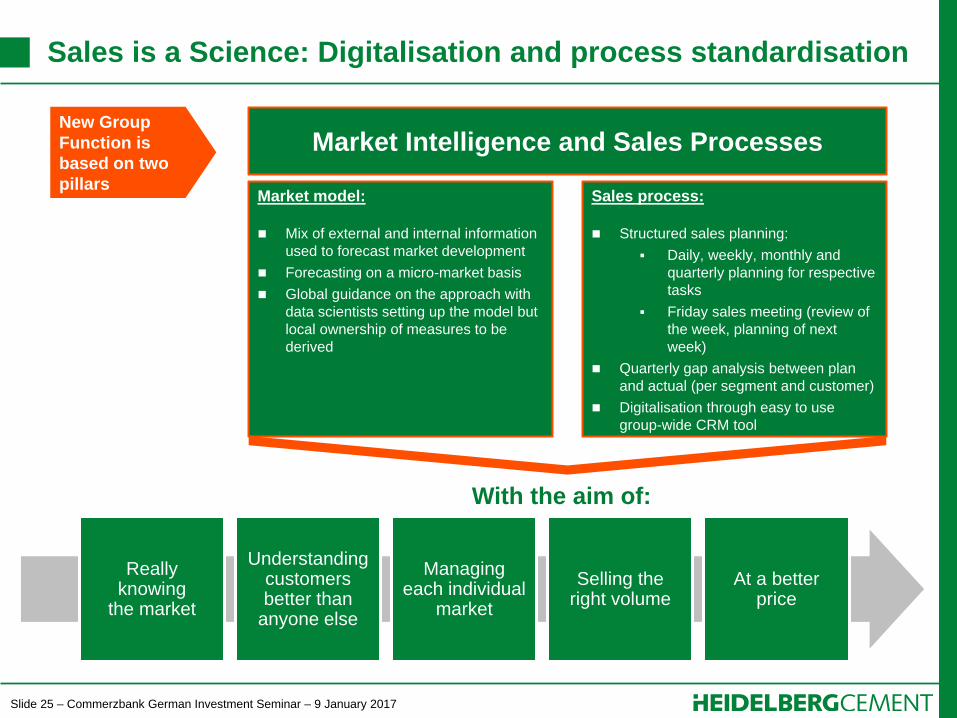
Sales is a Science: Digitalisation and process standardisation
Market model:
Mix of external and internal information
used to forecast market development
Forecasting on a micro-market basis
Global guidance on the approach with
data scientists setting up the model but
local ownership of measures to be
derived
Sales process:
Structured sales planning:
Daily, weekly, monthly and
quarterly planning for respective
tasks
Friday sales meeting (review of
the week, planning of next
week)
Quarterly gap analysis between plan
and actual (per segment and customer)
Digitalisation through easy to use
group-wide CRM tool
Really knowing
the market
Understanding customers better than
anyone else
Managing each individual
market
Selling the right volume
At a better price
With the aim of:
New Group
Function is
based on two
pillars
Market Intelligence and Sales Processes
Slide 26 – Commerzbank German Investment Seminar – 9 January 2017
Contents
Page
1. The new HeidelbergCement 5
2. Operational and financial performance 9
3. Accelerating growth with Italcementi (ITC) 13
4. Strategy and strengths 20
5. HeidelbergCement – the future 27
Slide 27 – Commerzbank German Investment Seminar – 9 January 2017
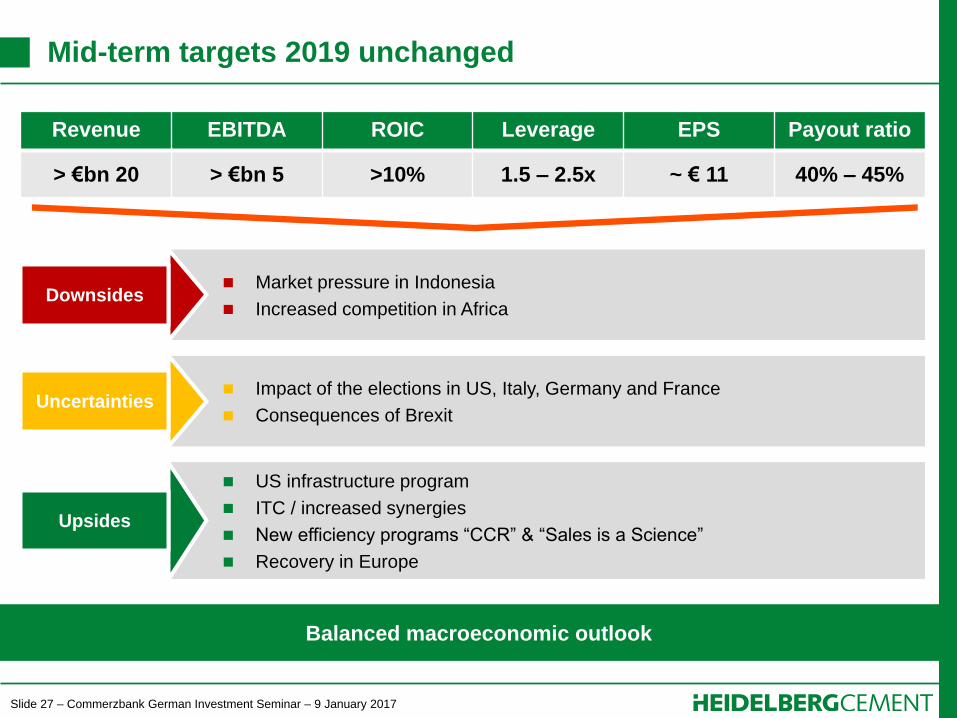
Mid-term targets 2019 unchanged
Revenue EBITDA ROIC Leverage EPS Payout ratio
> €bn 20 > €bn 5 >10% 1.5 – 2.5x ~ € 11 40% – 45%
Market pressure in Indonesia
Increased competition in Africa
US infrastructure program
ITC / increased synergies
New efficiency programs “CCR” & “Sales is a Science”
Recovery in Europe
Downsides
Upsides
Balanced macroeconomic outlook
Impact of the elections in US, Italy, Germany and France
Consequences of Brexit Uncertainties
Slide 28 – Commerzbank German Investment Seminar – 9 January 2017
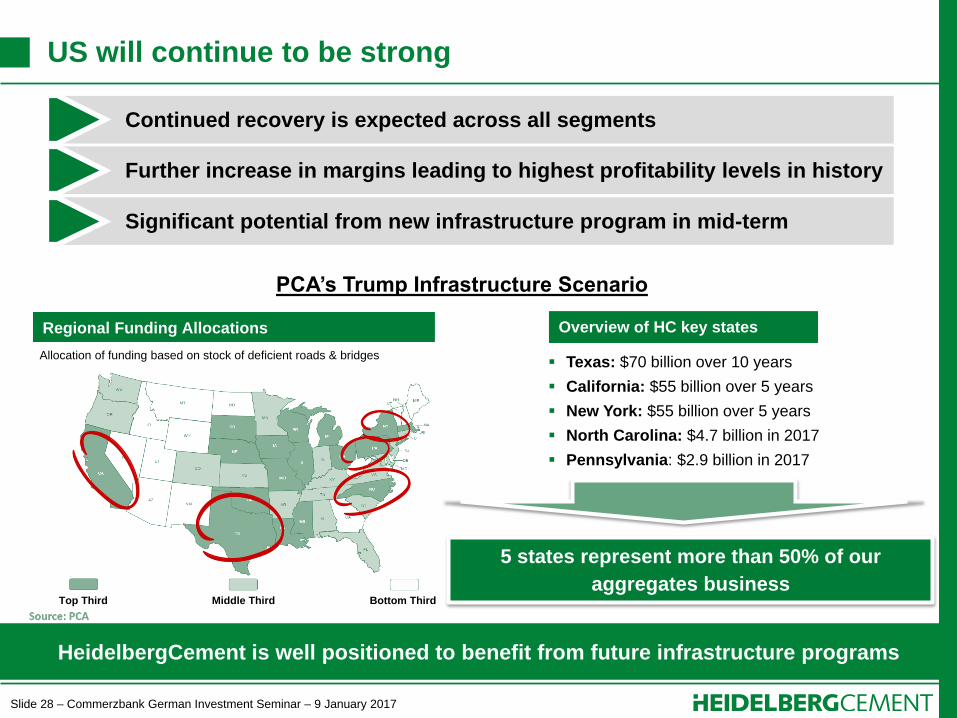
US will continue to be strong
HeidelbergCement is well positioned to benefit from future infrastructure programs
Continued recovery is expected across all segments
Further increase in margins leading to highest profitability levels in history
Significant potential from new infrastructure program in mid-term
Regional Funding Allocations
Top Third Middle Third Bottom Third
PCA’s Trump Infrastructure Scenario
Texas: $70 billion over 10 years
California: $55 billion over 5 years
New York: $55 billion over 5 years
North Carolina: $4.7 billion in 2017
Pennsylvania: $2.9 billion in 2017
Overview of HC key states
5 states represent more than 50% of our
aggregates business
Allocation of funding based on stock of deficient roads & bridges
Slide 29 – Commerzbank German Investment Seminar – 9 January 2017
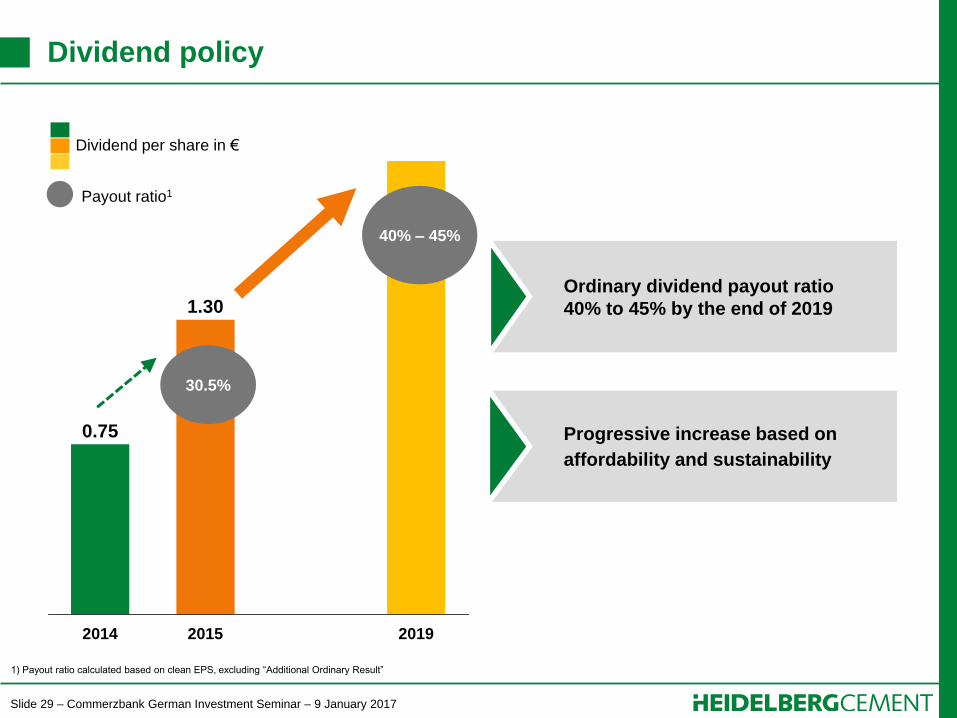
Dividend policy
Ordinary dividend payout ratio
40% to 45% by the end of 2019
Progressive increase based on
affordability and sustainability
Dividend per share in €
1.30
0.75
2019 2015 2014
40% – 45%
30.5%
Payout ratio1
1) Payout ratio calculated based on clean EPS, excluding “Additional Ordinary Result”
Slide 30 – Commerzbank German Investment Seminar – 9 January 2017
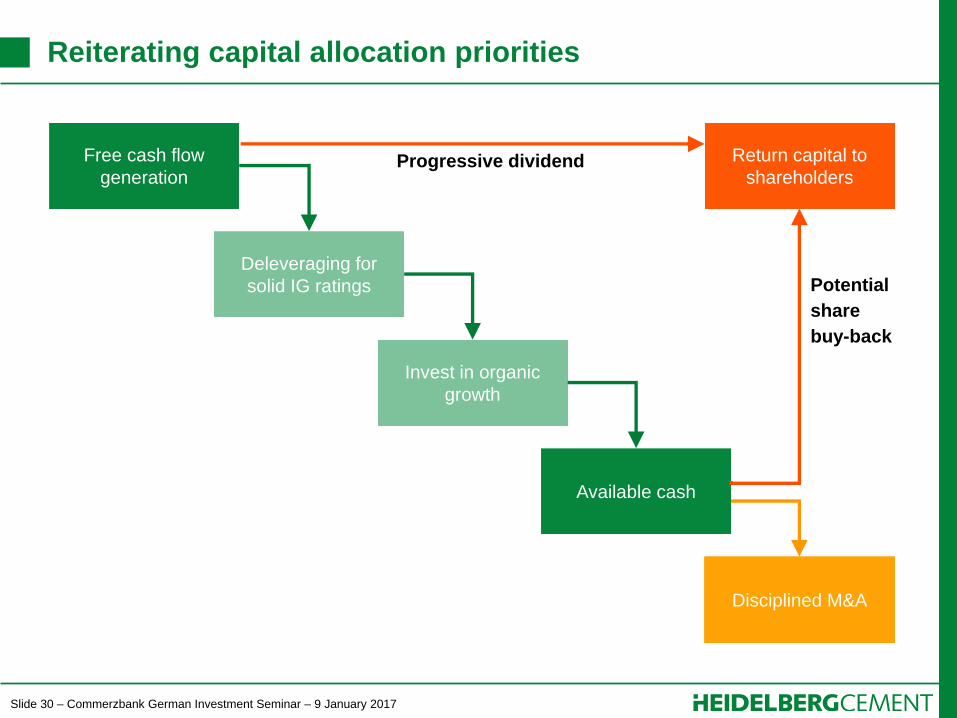
Reiterating capital allocation priorities
Free cash flow
generation
Deleveraging for
solid IG ratings
Invest in organic
growth
Available cash
Return capital to
shareholders
Disciplined M&A
Potential
share
buy-back
Progressive dividend