Embed Size (px)
Citation preview
HF-7761DE_C (2012-12)
Commerzbank German Investment Seminar 2016
HELLA KGaA Hueck & Co
New York
January 2016
2
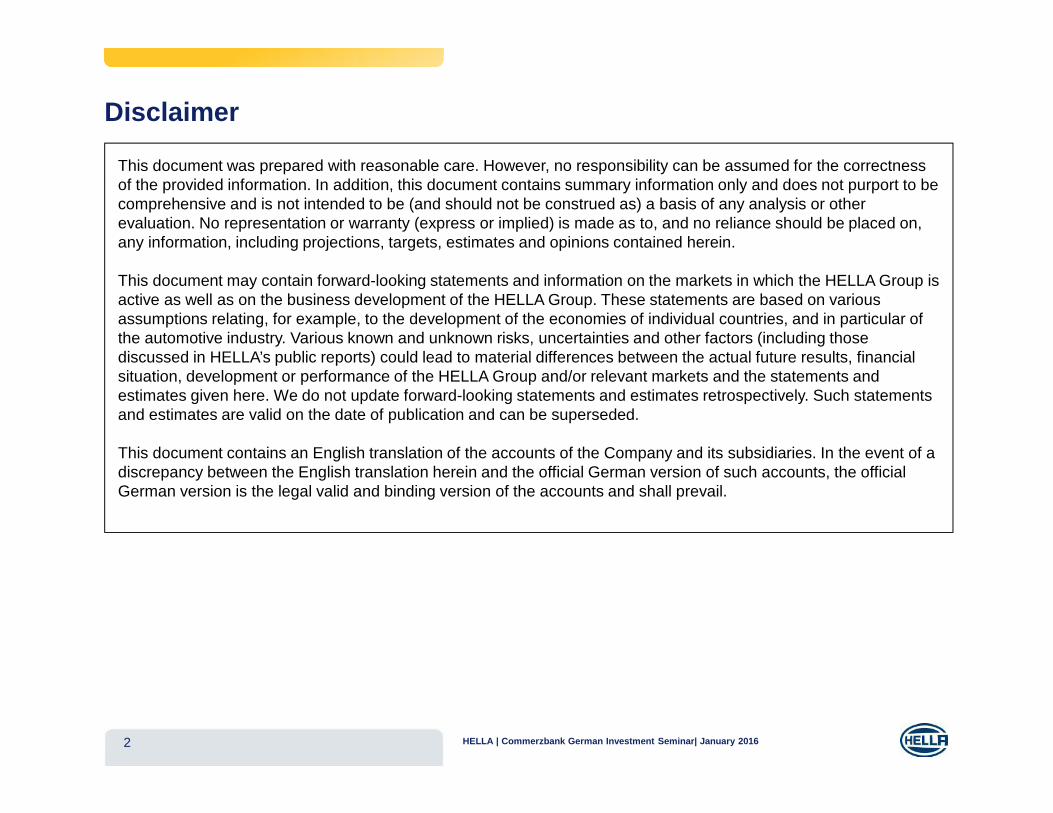
Disclaimer
This document was prepared with reasonable care. However, no responsibility can be assumed for the correctness of the provided information. In addition, this document contains summary information only and does not purport to be comprehensive and is not intended to be (and should not be construed as) a basis of any analysis or other evaluation. No representation or warranty (express or implied) is made as to, and no reliance should be placed on, any information, including projections, targets, estimates and opinions contained herein.
This document may contain forward-looking statements and information on the markets in which the HELLA Group is active as well as on the business development of the HELLA Group. These statements are based on various assumptions relating, for example, to the development of the economies of individual countries, and in particular of the automotive industry. Various known and unknown risks, uncertainties and other factors (including those discussed in HELLA’s public reports) could lead to material differences between the actual future results, financial situation, development or performance of the HELLA Group and/or relevant markets and the statements and estimates given here. We do not update forward-looking statements and estimates retrospectively. Such statements and estimates are valid on the date of publication and can be superseded.
This document contains an English translation of the accounts of the Company and its subsidiaries. In the event of a discrepancy between the English translation herein and the official German version of such accounts, the official German version is the legal valid and binding version of the accounts and shall prevail.
HELLA | Commerzbank German Investment Seminar| January 2016
HELLA – German Investment Seminar 2016Agenda
� HELLA’s Strategic Growth Path
� Financial Overview FY 2011/12 - FY 2014/15
� Results H1 FY 15/16
ANNEX
3 HELLA | Commerzbank German Investment Seminar| January 2016
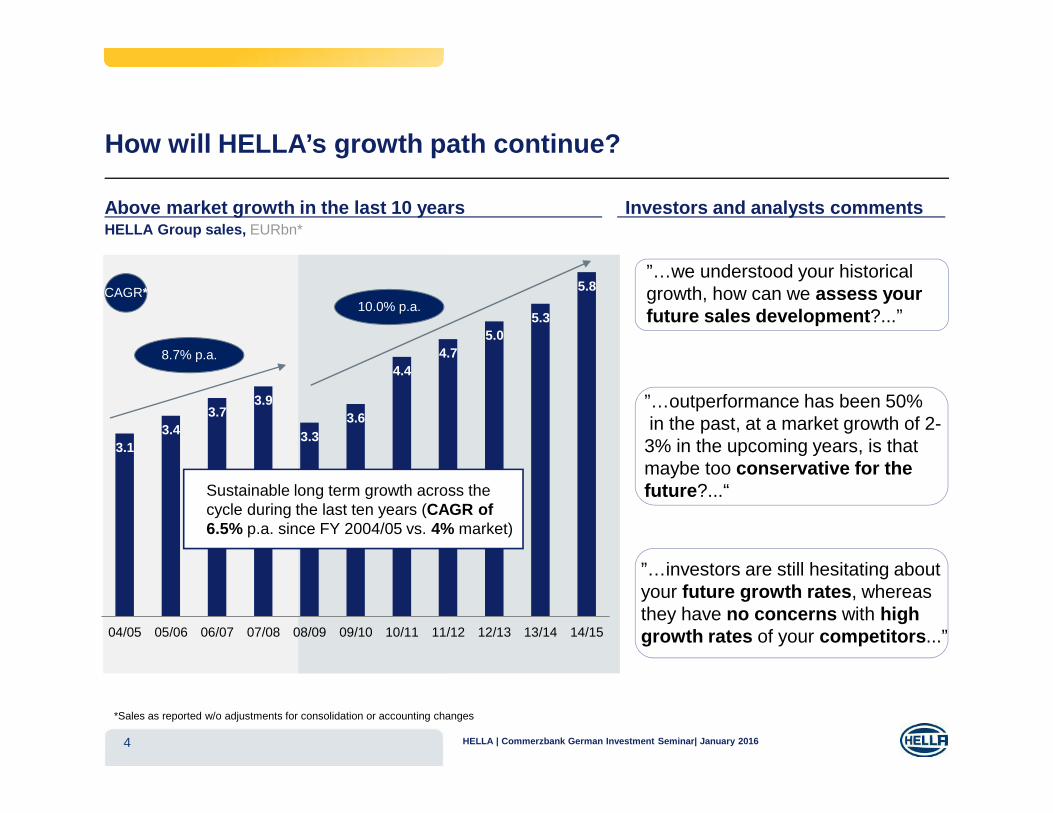
How will HELLA’s growth path continue?
4
Above market growth in the last 10 years Investors and analysts comments
”…we understood your historical growth, how can we assess your future sales development?...”
HELLA Group sales, EURbn*
*Sales as reported w/o adjustments for consolidation or accounting changes
3.13.4
3.73.9
3.33.6
4.44.7
5.05.3
5.8
04/05 05/06 06/07 07/08 08/09 09/10 10/11 11/12 12/13 13/14 14/15
CAGR*10.0% p.a.
8.7% p.a.
”…investors are still hesitating about your future growth rates, whereas they have no concerns with highgrowth rates of your competitors...”
”…outperformance has been 50%in the past, at a market growth of 2-3% in the upcoming years, is that maybe too conservative for the future?...“Sustainable long term growth across the
cycle during the last ten years (CAGR of 6.5% p.a. since FY 2004/05 vs. 4% market)
HELLA | Commerzbank German Investment Seminar| January 2016
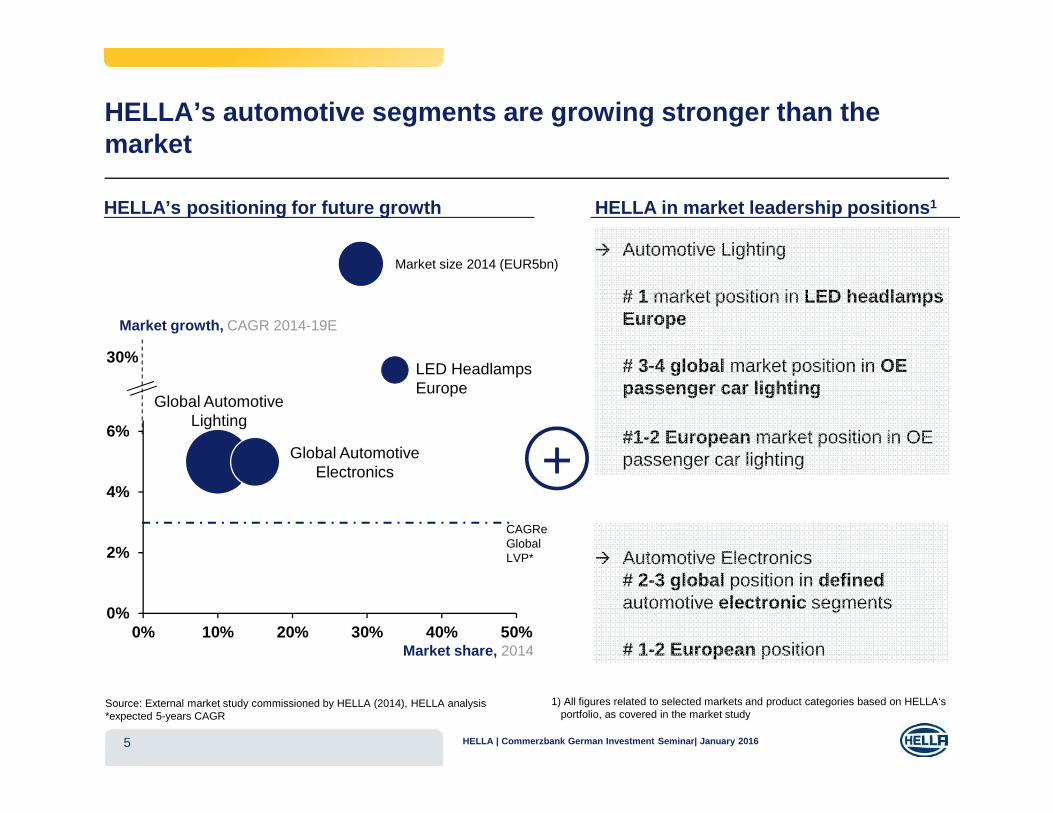
� Automotive Lighting
# 1 market position in LED headlamps Europe
# 3-4 global market position in OE passenger car lighting
#1-2 European market position in OE passenger car lighting
� Automotive Electronics# 2-3 global position in defined automotive electronic segments
# 1-2 European position
0%
2%
4%
6%
8%
0% 10% 20% 30% 40% 50%
Global Automotive Lighting
Global Automotive Electronics
Market growth, CAGR 2014-19E
Market share, 2014
Market size 2014 (EUR5bn)
HELLA’s automotive segments are growing stronger than the market
5
Source: External market study commissioned by HELLA (2014), HELLA analysis*expected 5-years CAGR
HELLA’s positioning for future growth
30%LED HeadlampsEurope
HELLA in market leadership positions1
1) All figures related to selected markets and product categories based on HELLA‘s portfolio, as covered in the market study
CAGReGlobal LVP*
+
HELLA | Commerzbank German Investment Seminar| January 2016
6
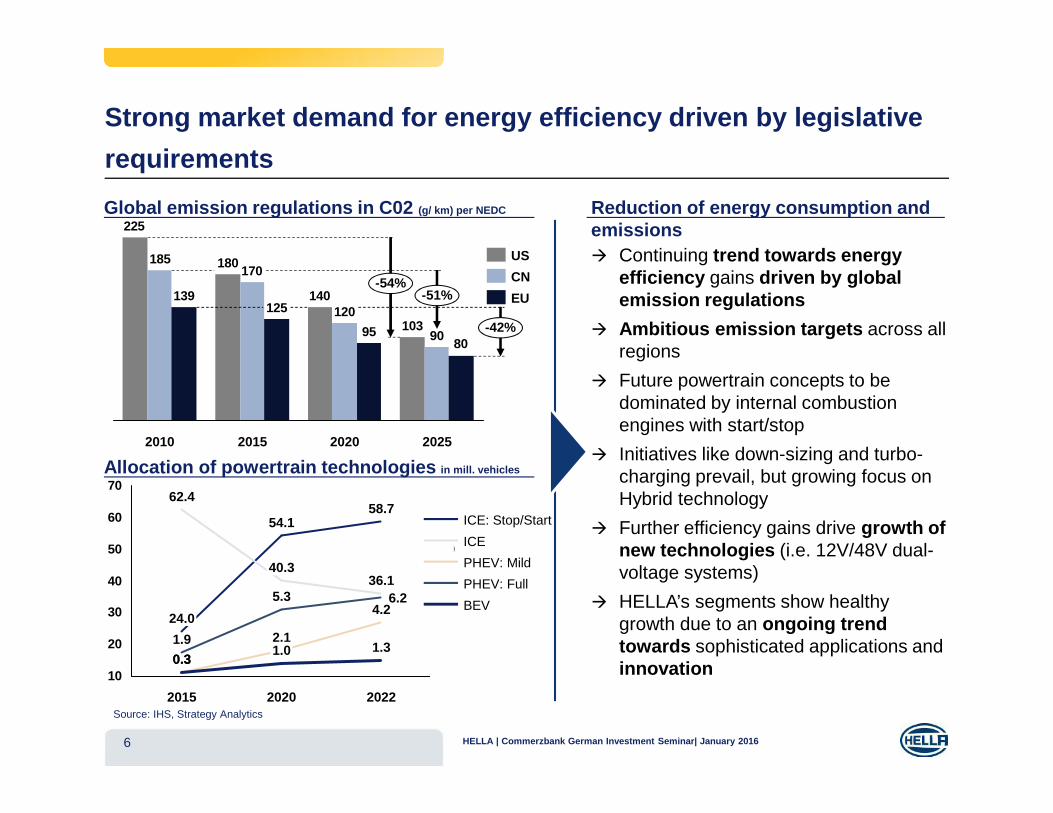
Strong market demand for energy efficiency driven by legislative
requirements
Source: IHS, Strategy Analytics
103
140
180
225
90
120
170185
8095
125139
2010 2020 20252015
-51%
-42%
-54%EU
CN
US � Continuing trend towards energy efficiency gains driven by global emission regulations
� Ambitious emission targets across all regions
� Future powertrain concepts to be dominated by internal combustion engines with start/stop
� Initiatives like down-sizing and turbo-charging prevail, but growing focus on Hybrid technology
� Further efficiency gains drive growth of new technologies (i.e. 12V/48V dual-voltage systems)
� HELLA’s segments show healthy growth due to an ongoing trend towards sophisticated applications and innovation
Global emission regulations in C02 (g/ km) per NEDC Reduction of energy consumption and emissions
HELLA | Commerzbank German Investment Seminar| January 2016
Allocation of powertrain technologies in mill. vehicles
10
20
30
40
50
60
70
0
5
10
15
36.1
54.1
40.3
0.3
1.9
0.3
2015
62.4
24.0
1.3
4.2
2022
58.7
2020
6.25.3
2.11.0
ICE: Stop/Start
BEV
PHEV: Mild
PHEV: Full
ICE
7
Source: NHTSA, Strategy Analytics, HELLA analysis
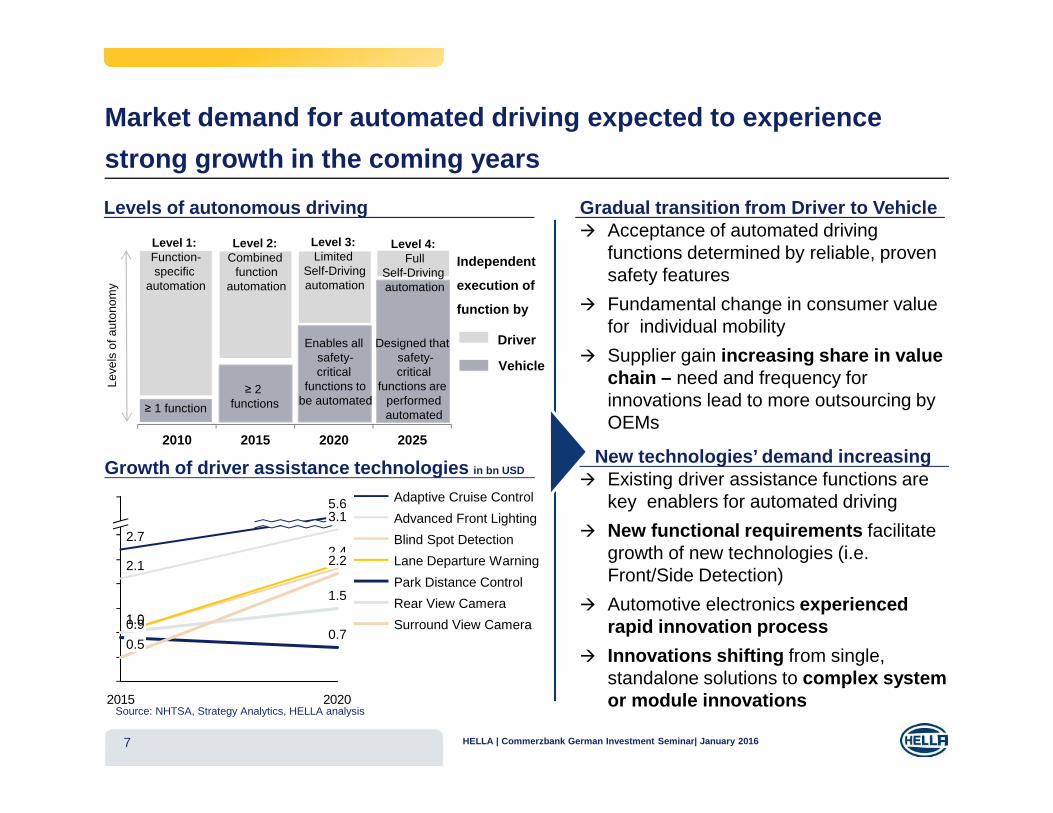
2010 2015 2020 2025
Vehicle
Driver
Leve
ls o
f aut
onom
y
Level 1: Function-specific
automation
Level 2:Combined
functionautomation
Level 3:Limited
Self-Drivingautomation
Level 4:Full
Self-Driving automation
≥ 1 function
≥ 2 functions
Enables all safety-critical
functions tobe automated
Designed that safety-critical
functions are performedautomated
Independent
execution of
function by
Levels of autonomous driving
Growth of driver assistance technologies in bn USD
Market demand for automated driving expected to experience
strong growth in the coming years
Gradual transition from Driver to Vehicle� Acceptance of automated driving
functions determined by reliable, proven safety features
� Fundamental change in consumer value for individual mobility
� Supplier gain increasing share in value chain – need and frequency for innovations lead to more outsourcing by OEMs
New technologies’ demand increasing� Existing driver assistance functions are
key enablers for automated driving
� New functional requirements facilitate growth of new technologies (i.e. Front/Side Detection)
� Automotive electronics experienced rapid innovation process
� Innovations shifting from single, standalone solutions to complex system or module innovations2015 2020
1.0
0.5
2.1
0.90.7
1.5
2.72.4
3.15.6
1.0
2.2
Advanced Front Lighting
Rear View Camera
Park Distance Control
Blind Spot Detection
Lane Departure Warning
Surround View Camera
Adaptive Cruise Control
HELLA | Commerzbank German Investment Seminar| January 2016
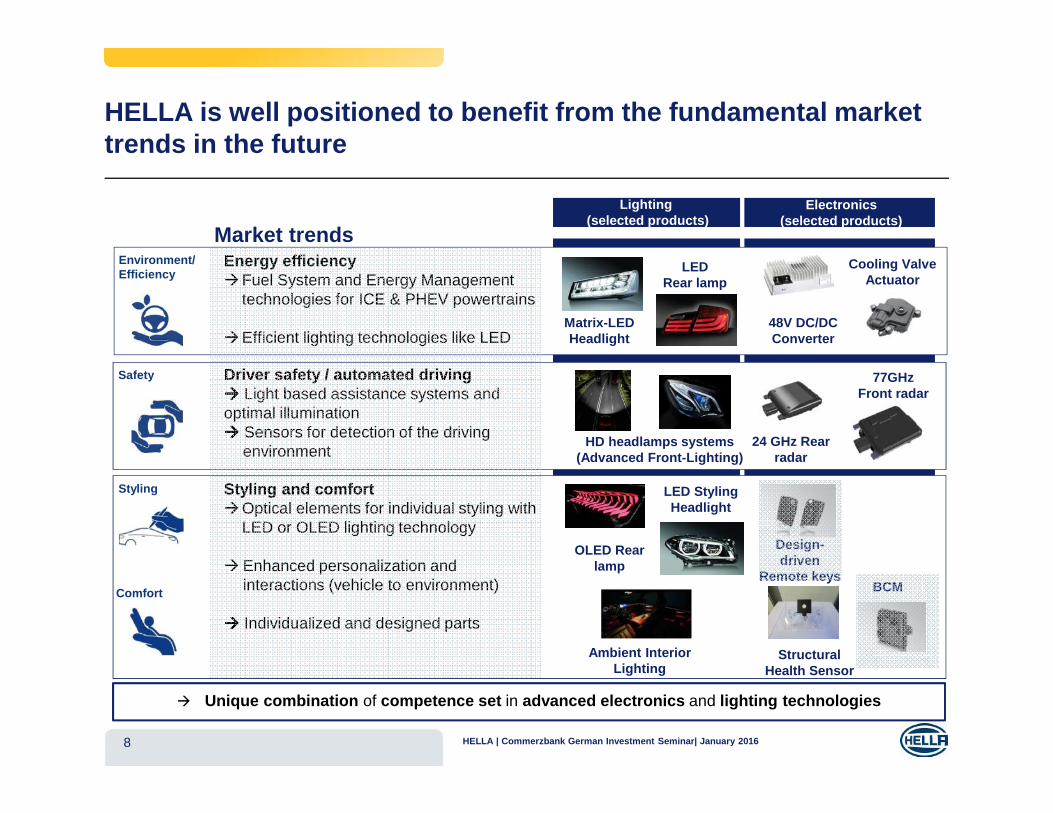
Comfort
HELLA is well positioned to benefit from the fundamental market trends in the future
Electronics (selected products)
Lighting(selected products)
Environment/Efficiency
Safety
Styling
Matrix-LED Headlight
24 GHz Rear radar
LED Rear lamp
Cooling Valve Actuator
48V DC/DC Converter
Design-driven
Remote keys
OLED Rear lamp
LED Styling Headlight
HD headlamps systems (Advanced Front-Lighting)
Structural Health Sensor
Ambient Interior Lighting
BCM
77GHz Front radar
Energy efficiency�Fuel System and Energy Management
technologies for ICE & PHEV powertrains
�Efficient lighting technologies like LED
Comfort
Driver safety / automated driving ���� Light based assistance systems and optimal illumination���� Sensors for detection of the driving
environment
Styling and comfort �Optical elements for individual styling with
LED or OLED lighting technology
� Enhanced personalization and interactions (vehicle to environment)
���� Individualized and designed parts
� Unique combination of competence set in advanced electronics and lighting technologies
Market trends
8 HELLA | Commerzbank German Investment Seminar| January 2016
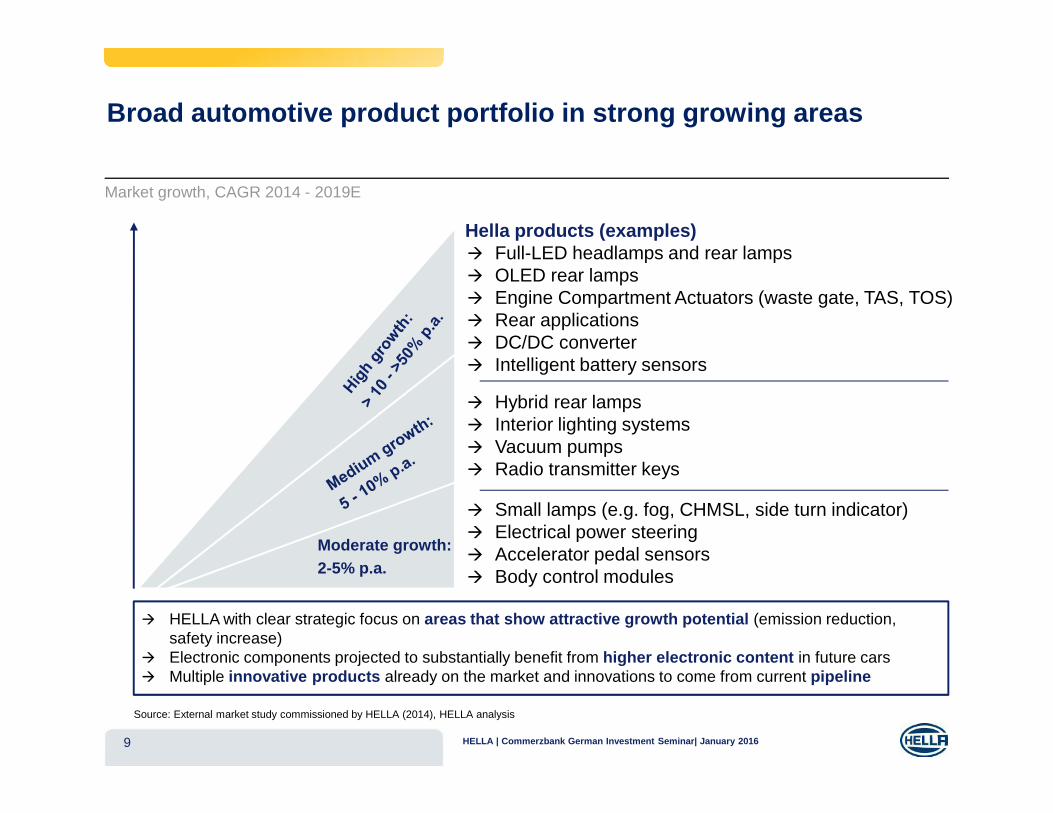
9
� HELLA with clear strategic focus on areas that show attractive growth potential (emission reduction, safety increase)
� Electronic components projected to substantially benefit from higher electronic content in future cars � Multiple innovative products already on the market and innovations to come from current pipeline
Moderate growth: 2-5% p.a.
� Full-LED headlamps and rear lamps� OLED rear lamps� Engine Compartment Actuators (waste gate, TAS, TOS)� Rear applications � DC/DC converter� Intelligent battery sensors
� Hybrid rear lamps� Interior lighting systems� Vacuum pumps� Radio transmitter keys
� Small lamps (e.g. fog, CHMSL, side turn indicator)� Electrical power steering� Accelerator pedal sensors� Body control modules
Market growth, CAGR 2014 - 2019E
Hella products (examples)
Broad automotive product portfolio in strong growing areas
Source: External market study commissioned by HELLA (2014), HELLA analysis
HELLA | Commerzbank German Investment Seminar| January 2016
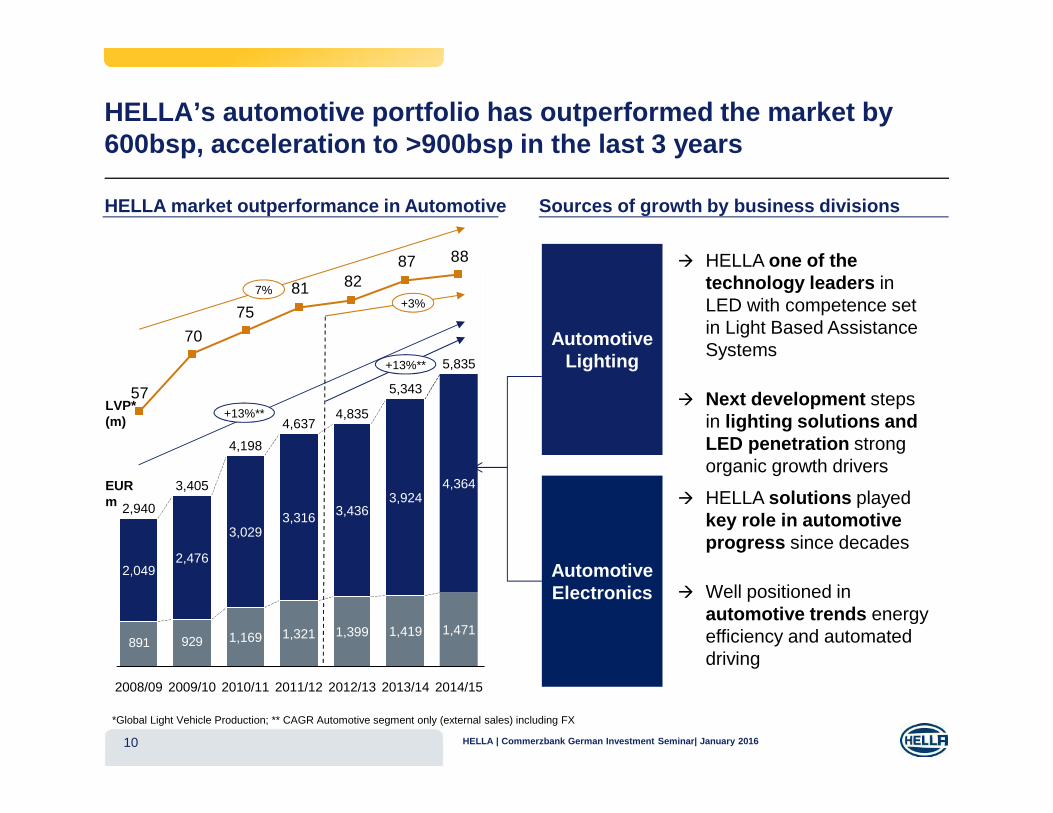
10
HELLA’s automotive portfolio has outperformed the market by 600bsp, acceleration to >900bsp in the last 3 years
Automotive Lighting
� HELLA one of the technology leaders in LED with competence set in Light Based Assistance Systems
� Next development steps in lighting solutions and LED penetration strong organic growth drivers
Automotive Electronics
� HELLA solutions played key role in automotive progress since decades
� Well positioned in automotive trends energy efficiency and automated driving
929891
88878281
75
70
57
051015202530354045505560657075808590
5,343
1,419
3,924
2012/13
4,835
1,399
3,436
2011/12
4,637
1,321
3,316
2010/11
4,198
1,169
3,029
2014/15
3,405
2,476
2008/09
2,940
2009/10
5,835
1,471
4,364
2013/14
2,049
Sources of growth by business divisionsHELLA market outperformance in Automotive
LVP* (m)
*Global Light Vehicle Production; ** CAGR Automotive segment only (external sales) including FX
EURm
+13%**
+3%7%
+13%**
HELLA | Commerzbank German Investment Seminar| January 2016
0%
1%
2%
3%
4%
5%
6%
0% 10% 20% 30% 40% 50% 60%
Garage Diagnostics*
Wholesale*
IAMEurope
Market growth, CAGR 2014-19E
Market share, 2014
Market size* 2014 (€1bn)
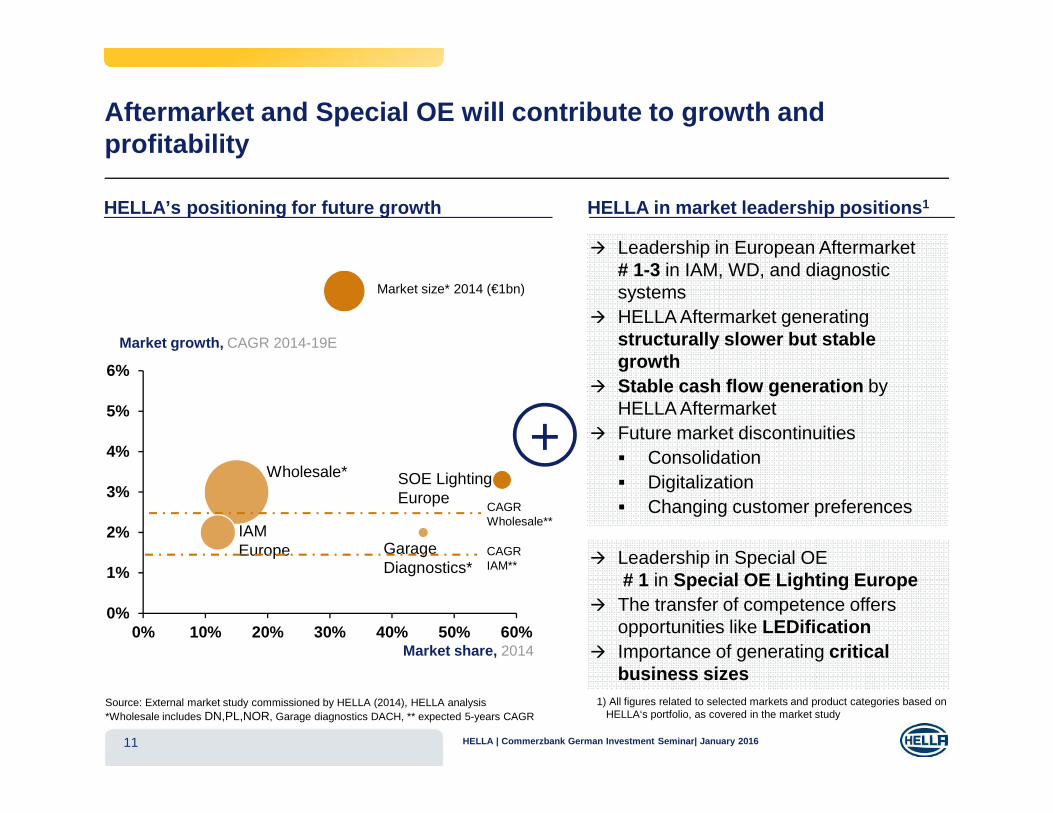
Aftermarket and Special OE will contribute to growth and profitability
11
Source: External market study commissioned by HELLA (2014), HELLA analysis*Wholesale includes DN,PL,NOR, Garage diagnostics DACH, ** expected 5-years CAGR
HELLA’s positioning for future growth HELLA in market leadership positions1
� Leadership in European Aftermarket# 1-3 in IAM, WD, and diagnostic systems
� HELLA Aftermarket generating structurally slower but stablegrowth
� Stable cash flow generation by HELLA Aftermarket
� Future market discontinuities � Consolidation� Digitalization� Changing customer preferences
� Leadership in Special OE# 1 in Special OE Lighting Europe
� The transfer of competence offers opportunities like LEDification
� Importance of generating critical business sizes
1) All figures related to selected markets and product categories based on HELLA‘s portfolio, as covered in the market study
CAGRIAM**
CAGRWholesale**
SOE LightingEurope
+
HELLA | Commerzbank German Investment Seminar| January 2016
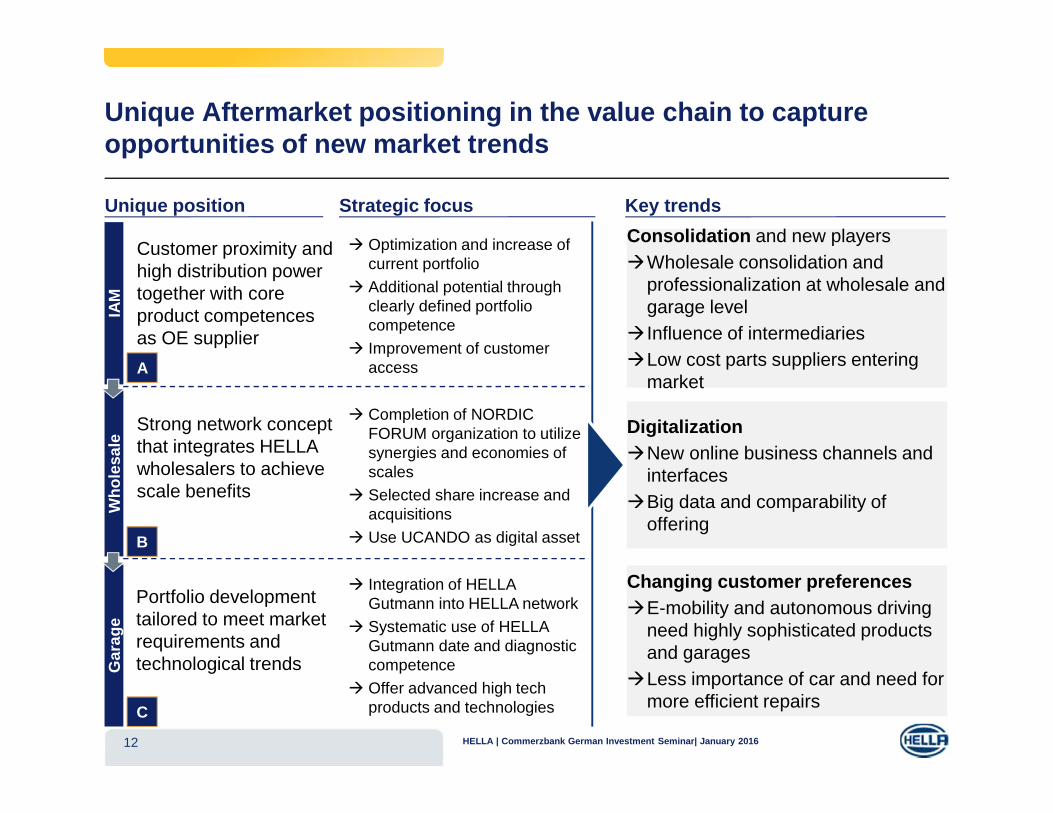
Unique Aftermarket positioning in the value chain to capture opportunities of new market trends
12
Digitalization �New online business channels and
interfaces �Big data and comparability of
offering
Consolidation and new players �Wholesale consolidation and
professionalization at wholesale and garage level
� Influence of intermediaries�Low cost parts suppliers entering
market
Changing customer preferences�E-mobility and autonomous driving
need highly sophisticated products and garages
�Less importance of car and need for more efficient repairs
� Integration of HELLA Gutmann into HELLA network
� Systematic use of HELLA Gutmann date and diagnostic competence
� Offer advanced high tech products and technologies
� Completion of NORDIC FORUM organization to utilize synergies and economies of scales
� Selected share increase and acquisitions
� Use UCANDO as digital asset
Unique position
Customer proximity and high distribution power together with core product competences as OE supplier
Strong network concept that integrates HELLA wholesalers to achieve scale benefits
Portfolio development tailored to meet market requirements and technological trends
Strategic focus Key trends
� Optimization and increase of current portfolio
� Additional potential through clearly defined portfolio competence
� Improvement of customer access
IAM
Wh
ole
sale
Gar
age
A
B
C
HELLA | Commerzbank German Investment Seminar| January 2016
HELLA | Commerzbank German Investment Seminar| January 201613
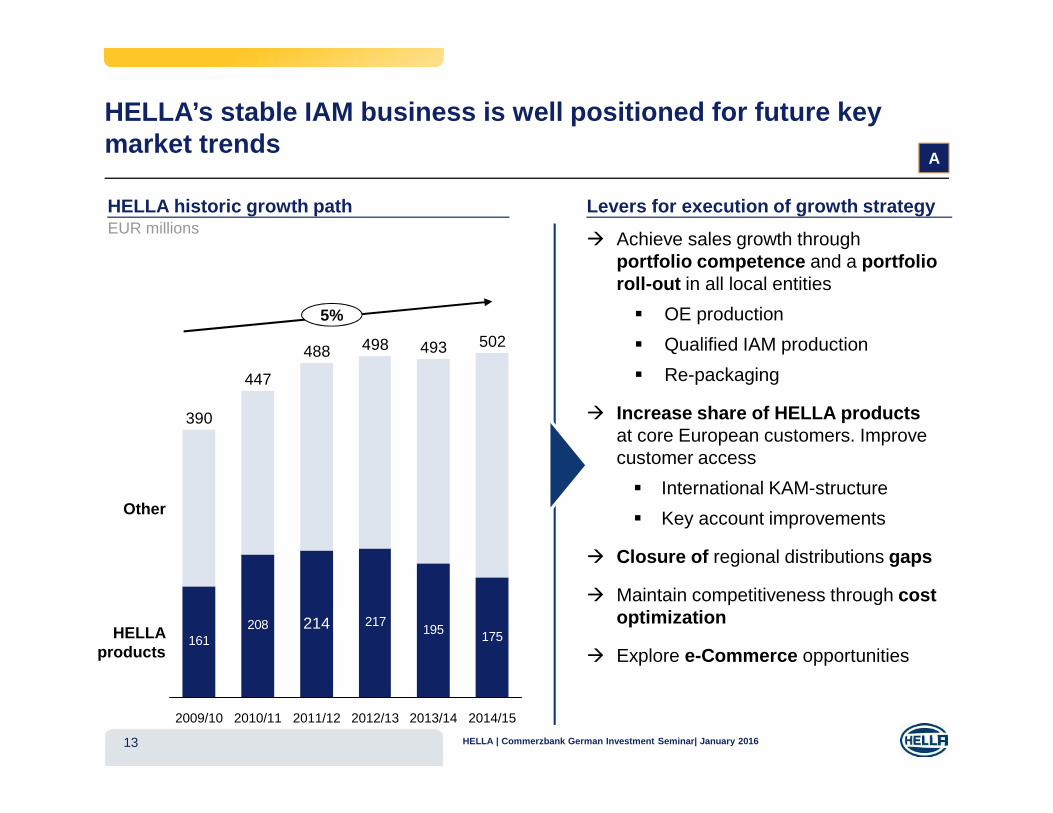
HELLA’s stable IAM business is well positioned for future key market trends
HELLA historic growth path
� Achieve sales growth through portfolio competence and a portfolio roll-out in all local entities
� OE production
� Qualified IAM production
� Re-packaging
� Increase share of HELLA productsat core European customers. Improve customer access
� International KAM-structure
� Key account improvements
� Closure of regional distributions gaps
� Maintain competitiveness through cost optimization
� Explore e-Commerce opportunities161
208 217195 175
214HELLA
products
Other
2014/15
502
2013/14
493
2012/13
498
2011/12
488
2010/11
447
2009/10
390
EUR millions
A
Levers for execution of growth strategy
5%
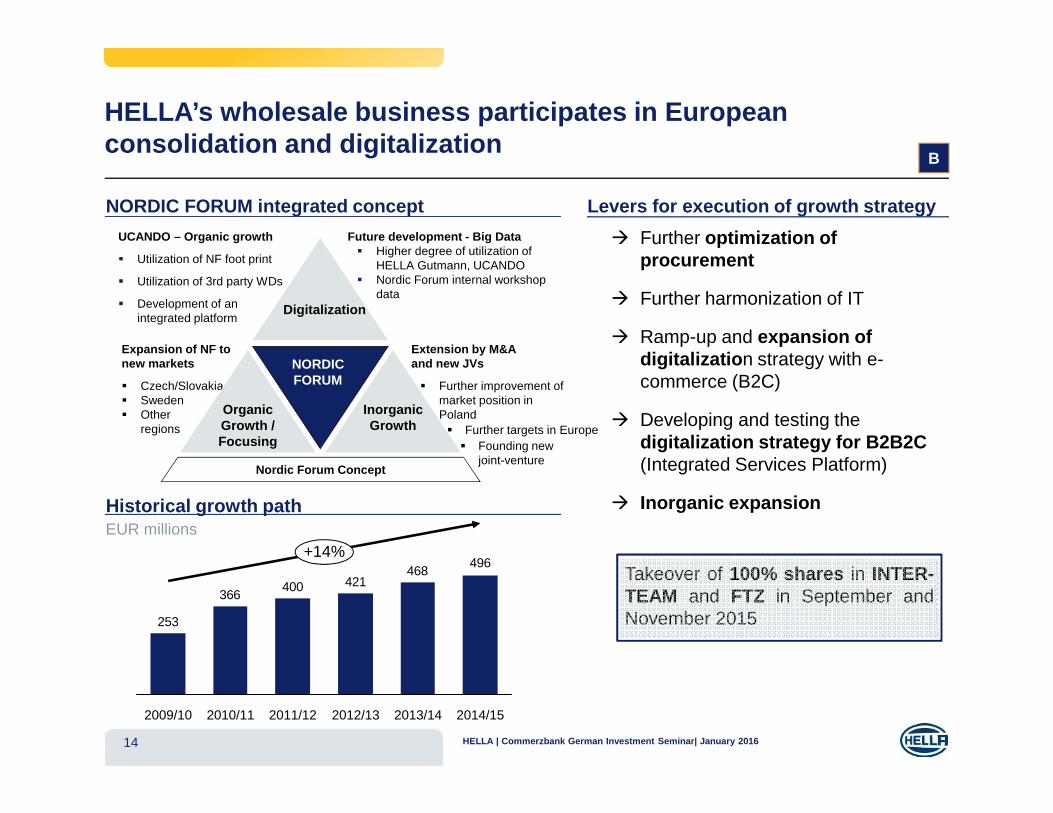
HELLA’s wholesale business participates in European consolidation and digitalization
14
NORDIC FORUM integrated concept Levers for execution of growth strategy
� Founding new joint-venture
Expansion of NF to new markets
� Czech/Slovakia� Sweden� Other
regions
Extension by M&A and new JVs
� Further improvement of market position in Poland
UCANDO – Organic growth
� Utilization of NF foot print
� Utilization of 3rd party WDs
� Development of an integrated platform
Nordic Forum Concept
Organic Growth / Focusing
InorganicGrowth
NORDIC FORUM
Digitalization
Future development - Big Data� Higher degree of utilization of
HELLA Gutmann, UCANDO� Nordic Forum internal workshop
data
� Further optimization of procurement
� Further harmonization of IT
� Ramp-up and expansion of digitalization strategy with e-commerce (B2C)
� Developing and testing the digitalization strategy for B2B2C(Integrated Services Platform)
� Inorganic expansion EUR millionsHistorical growth path
496468
421400366
253
+14%
2014/152013/142012/132011/122010/112009/10
B
Takeover of 100% shares in INTER-TEAM and FTZ in September andNovember 2015
� Further targets in Europe
HELLA | Commerzbank German Investment Seminar| January 2016
HELLA | Commerzbank German Investment Seminar| January 201615
61
4944
39
28 31
17%
2014/152012/132009/10 2010/11 2013/142011/12
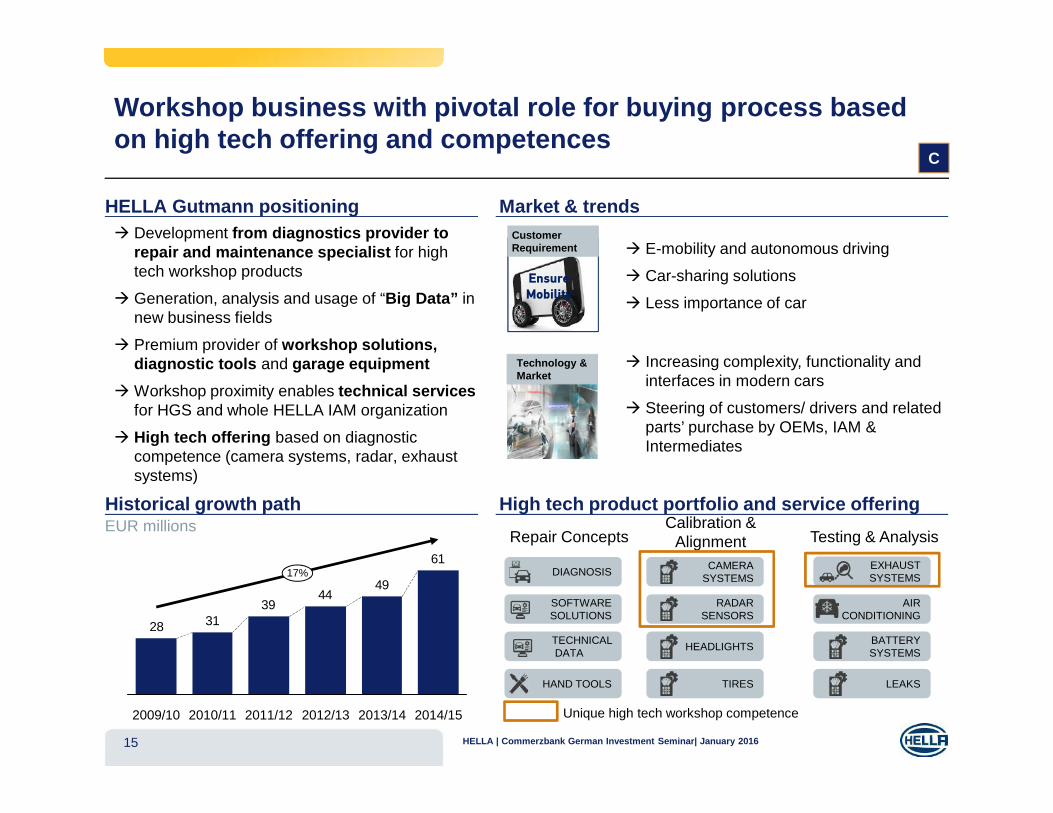
HELLA Gutmann positioning
Ensure Mobility
Customer Requirement
� Increasing complexity, functionality and interfaces in modern cars
� Steering of customers/ drivers and related parts’ purchase by OEMs, IAM & Intermediates
Technology & Market
� E-mobility and autonomous driving
� Car-sharing solutions
� Less importance of car
Market & trends� Development from diagnostics provider to
repair and maintenance specialist for high tech workshop products
� Generation, analysis and usage of “Big Data” in new business fields
� Premium provider of workshop solutions, diagnostic tools and garage equipment
� Workshop proximity enables technical services for HGS and whole HELLA IAM organization
� High tech offering based on diagnostic competence (camera systems, radar, exhaust systems)
High tech product portfolio and service offering
DIAGNOSIS
SOFTWARE SOLUTIONS
TECHNICALDATA
HAND TOOLS
Repair Concepts
CAMERA SYSTEMS
RADARSENSORS
HEADLIGHTS
TIRES
Calibration & Alignment
EXHAUST SYSTEMS
AIR CONDITIONING
BATTERY SYSTEMS
LEAKS
Testing & Analysis
Workshop business with pivotal role for buying process based on high tech offering and competences
Historical growth pathEUR millions
C
Unique high tech workshop competence
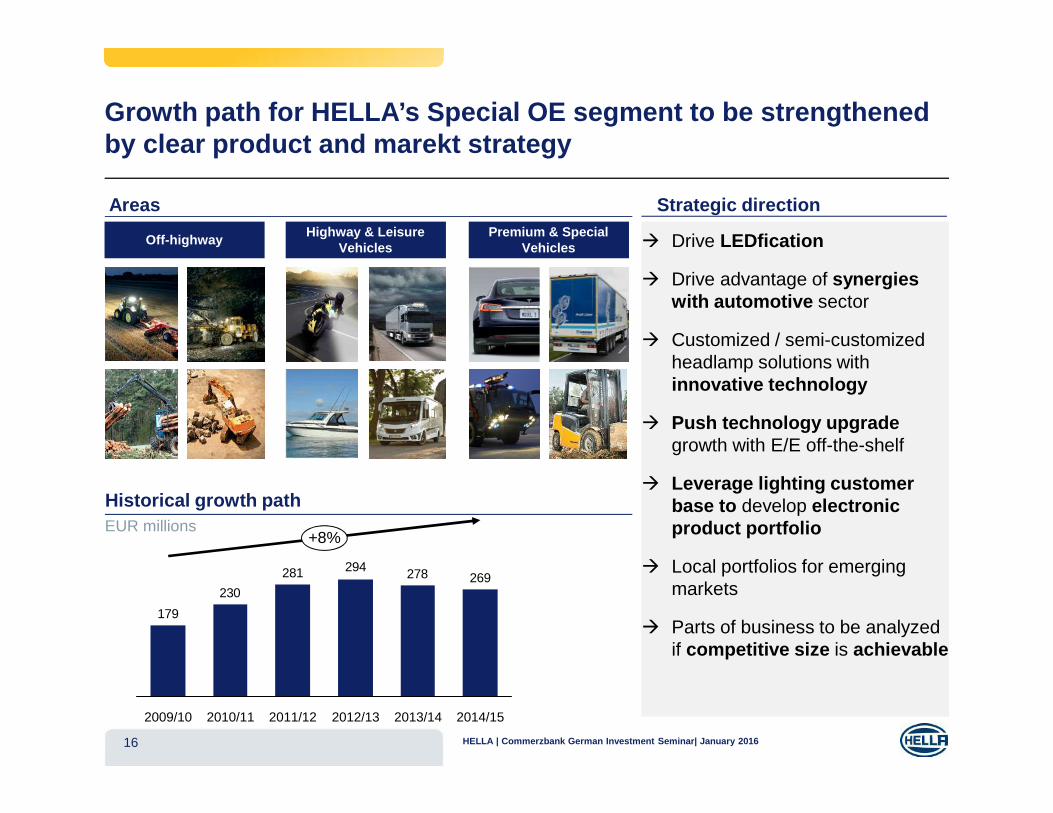
Growth path for HELLA’s Special OE segment to be strengthened by clear product and marekt strategy
16
Areas
� Drive LEDfication
� Drive advantage of synergies with automotive sector
� Customized / semi-customized headlamp solutions with innovative technology
� Push technology upgradegrowth with E/E off-the-shelf
� Leverage lighting customer base to develop electronic product portfolio
� Local portfolios for emerging markets
� Parts of business to be analyzed if competitive size is achievable
Off-highwayHighway & Leisure
VehiclesPremium & Special
Vehicles
Strategic direction
Historical growth pathEUR millions
269278294281
230
179
2011/122010/112009/10 2013/142012/13
+8%
2014/15
HELLA | Commerzbank German Investment Seminar| January 2016
17
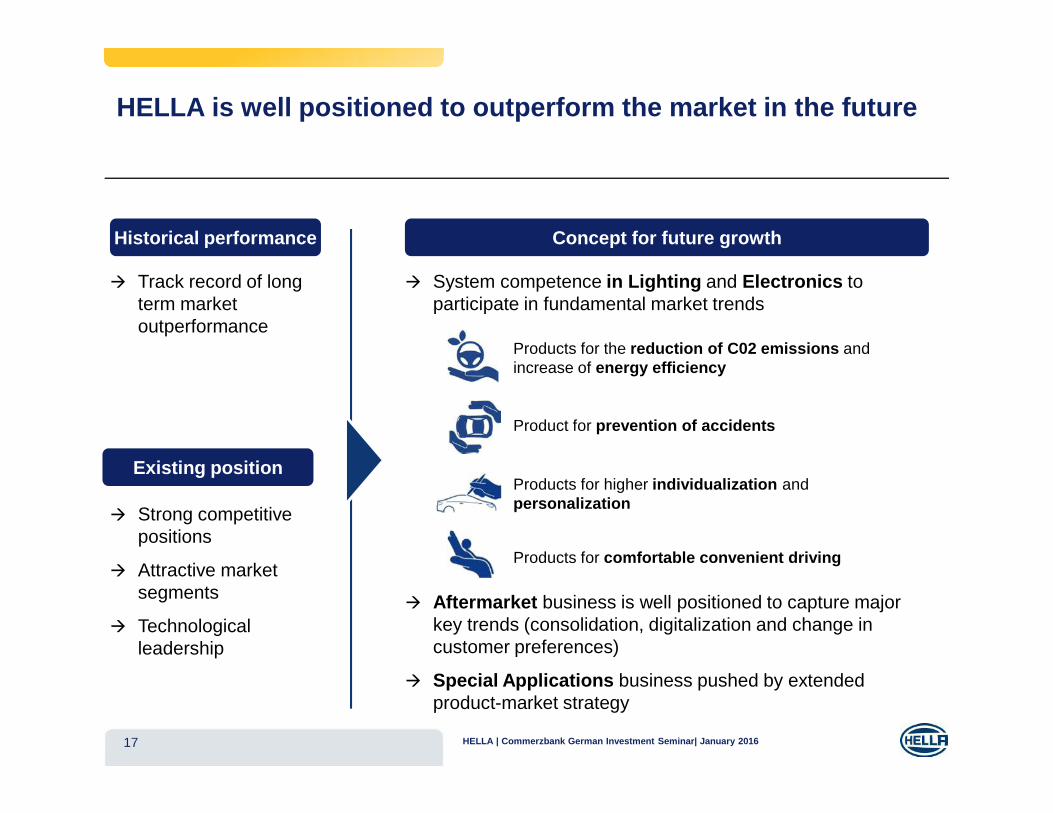
HELLA is well positioned to outperform the market in the future
� Track record of long term market outperformance
Historical performance
� Strong competitive positions
� Attractive market segments
� Technological leadership
Existing position
Product for prevention of accidents
Concept for future growth
� System competence in Lighting and Electronics to participate in fundamental market trends
Products for higher individualization and personalization
Products for comfortable convenient driving
Products for the reduction of C02 emissions and increase of energy efficiency
� Aftermarket business is well positioned to capture major key trends (consolidation, digitalization and change in customer preferences)
� Special Applications business pushed by extended product-market strategy
HELLA | Commerzbank German Investment Seminar| January 2016
HELLA – German Investment Seminar 2016Agenda
18
� HELLA’s Strategic Growth Path
� Financial Overview FY 2011/12 - FY 2014/15
� Results H1 FY 15/16
ANNEX
HELLA | Commerzbank German Investment Seminar| January 2016
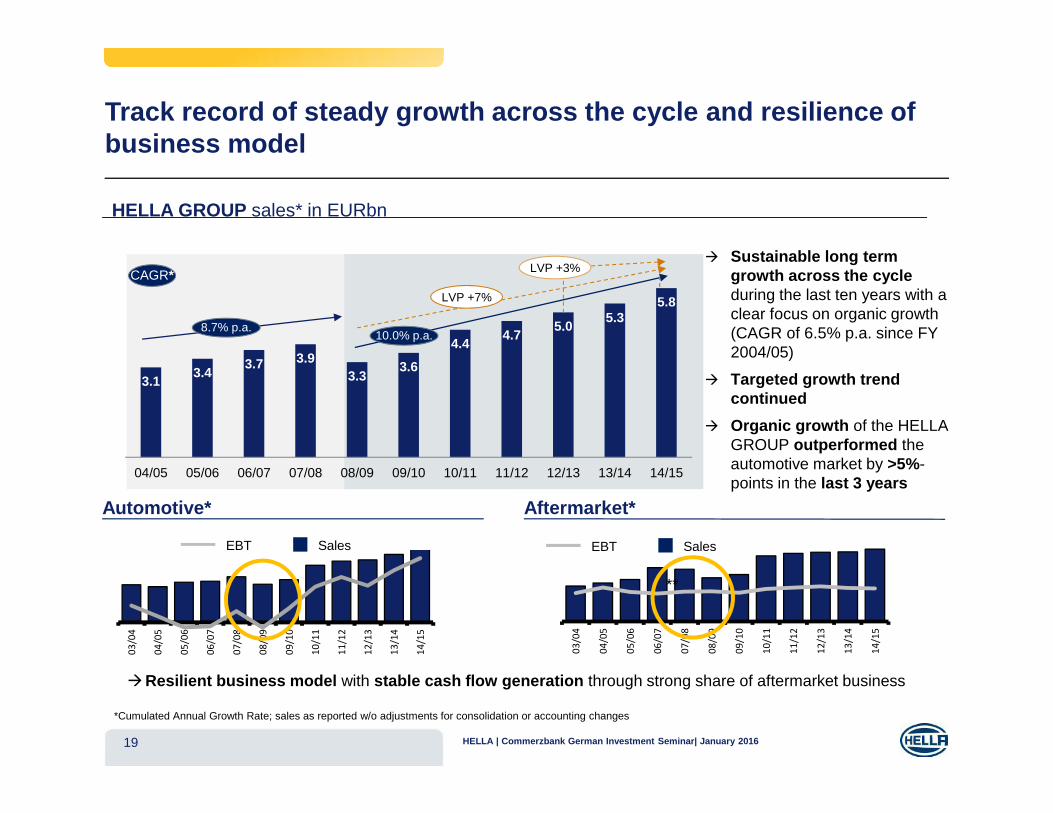
HELLA GROUP sales* in EURbn
3.13.4
3.7 3.93.3
3.6
4.44.7
5.05.3
5.8
04/05 05/06 06/07 07/08 08/09 09/10 10/11 11/12 12/13 13/14 14/15
CAGR*
10.0% p.a.8.7% p.a.
19
*Cumulated Annual Growth Rate; sales as reported w/o adjustments for consolidation or accounting changes
Track record of steady growth across the cycle and resilience of business model
03/0
4
04/0
5
05/0
6
06/0
7
07/0
8
08/0
9
09/1
0
10/1
1
11/1
2
12/1
3
13/1
4
14/1
5
SalesEBT
Automotive*
03/0
4
04/0
5
05/0
6
06/0
7
07/0
8
08/0
9
09/1
0
10/1
1
11/1
2
12/1
3
13/1
4
14/1
5
Aftermarket*
**
SalesEBT
�Resilient business model with stable cash flow generation through strong share of aftermarket business
� Sustainable long term growth across the cycle during the last ten years with a clear focus on organic growth (CAGR of 6.5% p.a. since FY 2004/05)
� Targeted growth trend continued
� Organic growth of the HELLA GROUP outperformed the automotive market by >5%-points in the last 3 years
LVP +7%
LVP +3%
HELLA | Commerzbank German Investment Seminar| January 2016
20
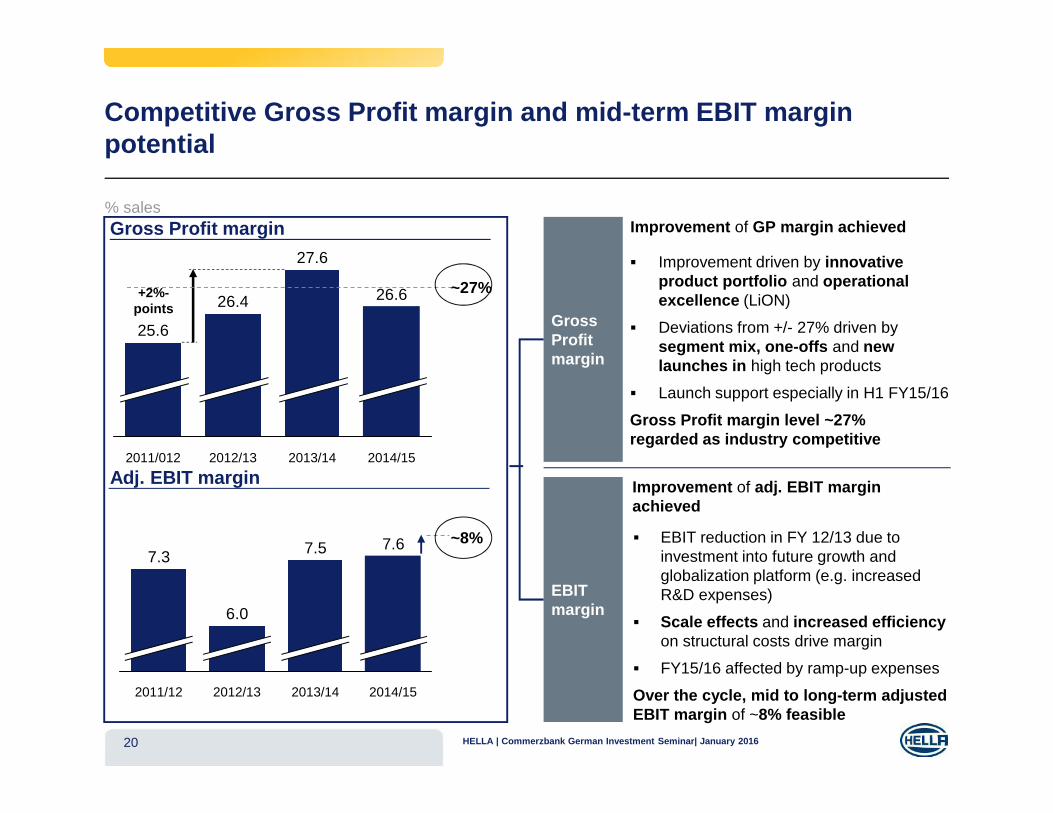
Competitive Gross Profit margin and mid-term EBIT margin potential
27.6
26.4 26.6
25.6
2014/152013/142012/132011/012
7.67.5
2014/152013/14
7.3
2011/12 2012/13
6.0
Gross Profit margin
Adj. EBIT margin
EBIT margin
Improvement of adj. EBIT margin achieved
� EBIT reduction in FY 12/13 due to investment into future growth and globalization platform (e.g. increased R&D expenses)
� Scale effects and increased efficiency on structural costs drive margin
� FY15/16 affected by ramp-up expenses
Over the cycle, mid to long-term adjusted EBIT margin of ~8% feasible
Gross Profit margin
Improvement of GP margin achieved
� Improvement driven by innovative product portfolio and operational excellence (LiON)
� Deviations from +/- 27% driven by segment mix, one-offs and new launches in high tech products
� Launch support especially in H1 FY15/16
Gross Profit margin level ~27% regarded as industry competitive
% sales
~27%
~8%
+2%-points
HELLA | Commerzbank German Investment Seminar| January 2016
21
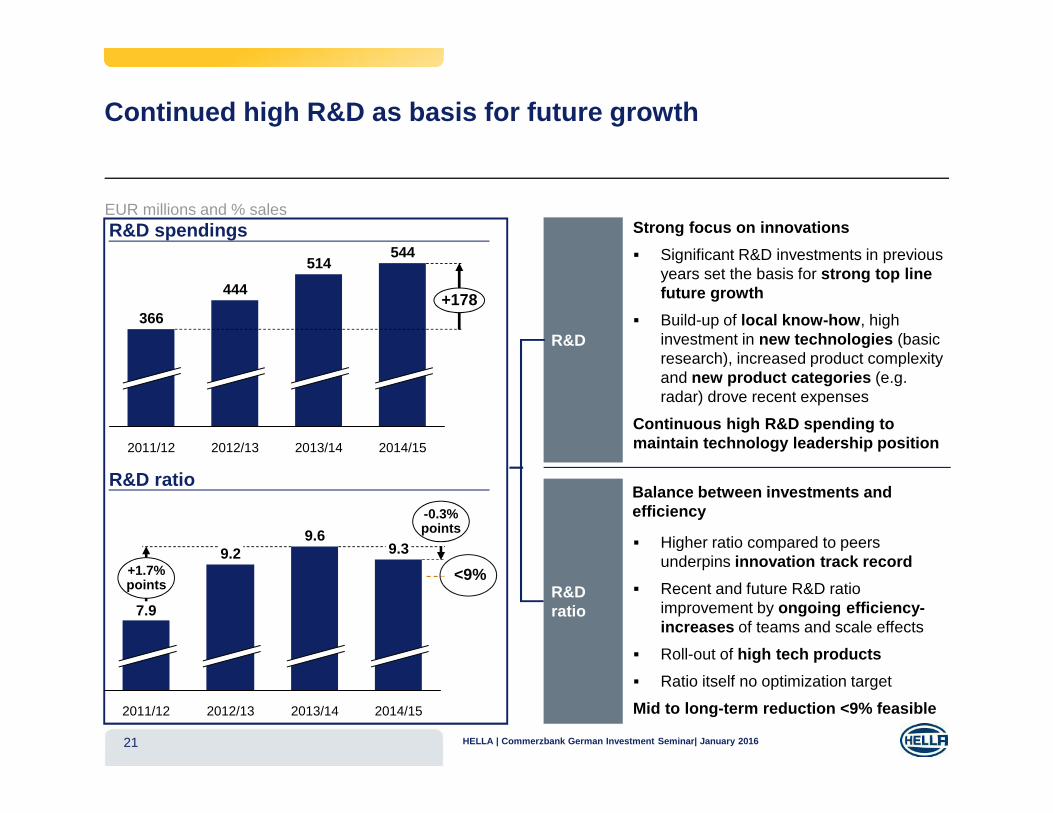
544
+178
2014/152013/14
514
2012/13
444
2011/12
366
Continued high R&D as basis for future growth
9.3
-0.3%points
7.9
+1.7%points
2014/152013/14
9.6
2012/13
9.2
2011/12
R&D spendings
R&D ratio
EUR millions and % sales
R&D ratio
Balance between investments and efficiency
� Higher ratio compared to peers underpins innovation track record
� Recent and future R&D ratio improvement by ongoing efficiency-increases of teams and scale effects
� Roll-out of high tech products
� Ratio itself no optimization target
Mid to long-term reduction <9% feasible
R&D
Strong focus on innovations
� Significant R&D investments in previous years set the basis for strong top line future growth
� Build-up of local know-how, high investment in new technologies (basic research), increased product complexity and new product categories (e.g. radar) drove recent expenses
Continuous high R&D spending to maintain technology leadership position
<9%
HELLA | Commerzbank German Investment Seminar| January 2016
22
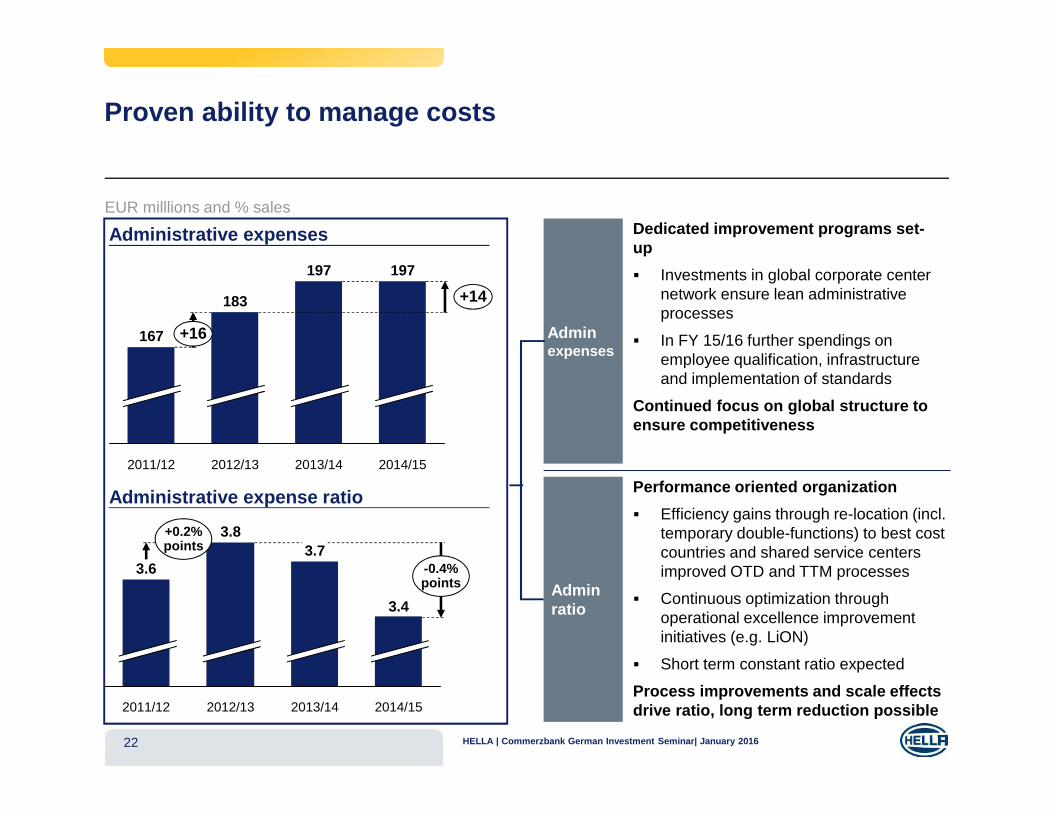
Proven ability to manage costs
2014/152013/14
197
2012/132011/12
167 +16
183 +14
197
3.4
-0.4%points
3.6
+0.2%points
2014/152013/14
3.7
2012/13
3.8
2011/12
Administrative expenses
Administrative expense ratio
EUR milllions and % sales
Admin ratio
Performance oriented organization
� Efficiency gains through re-location (incl. temporary double-functions) to best cost countries and shared service centers improved OTD and TTM processes
� Continuous optimization through operational excellence improvement initiatives (e.g. LiON)
� Short term constant ratio expected
Process improvements and scale effects drive ratio, long term reduction possible
Admin expenses
Dedicated improvement programs set-up
� Investments in global corporate center network ensure lean administrative processes
� In FY 15/16 further spendings on employee qualification, infrastructure and implementation of standards
Continued focus on global structure to ensure competitiveness
HELLA | Commerzbank German Investment Seminar| January 2016
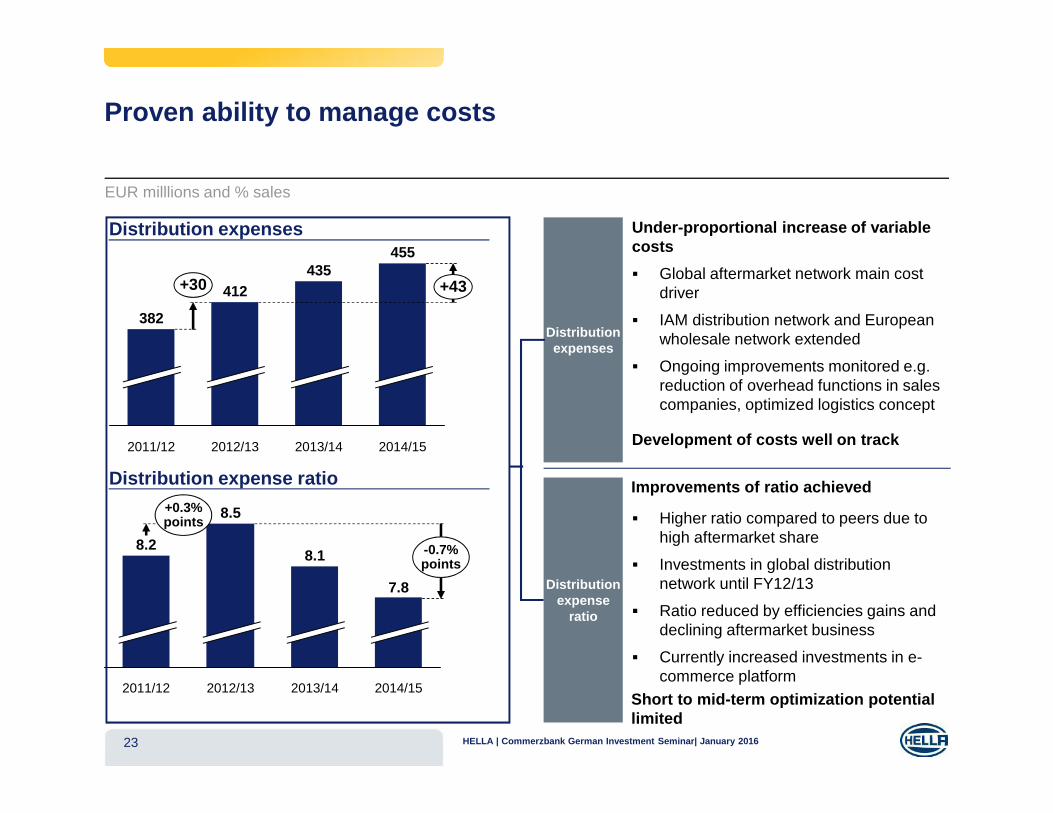
23
412+30
455
+43
2014/152013/14
435
2012/132011/12
382
7.8
-0.7%points
8.2
+0.3%points
2014/152013/14
8.1
2012/13
8.5
2011/12
Distribution expenses
Distribution expense ratio
EUR milllions and % sales
Distribution expense
ratio
Improvements of ratio achieved
� Higher ratio compared to peers due to high aftermarket share
� Investments in global distribution network until FY12/13
� Ratio reduced by efficiencies gains and declining aftermarket business
� Currently increased investments in e-commerce platform
Short to mid-term optimization potential limited
Distribution expenses
Under-proportional increase of variable costs
� Global aftermarket network main cost driver
� IAM distribution network and European wholesale network extended
� Ongoing improvements monitored e.g. reduction of overhead functions in sales companies, optimized logistics concept
Development of costs well on track
Proven ability to manage costs
HELLA | Commerzbank German Investment Seminar| January 2016
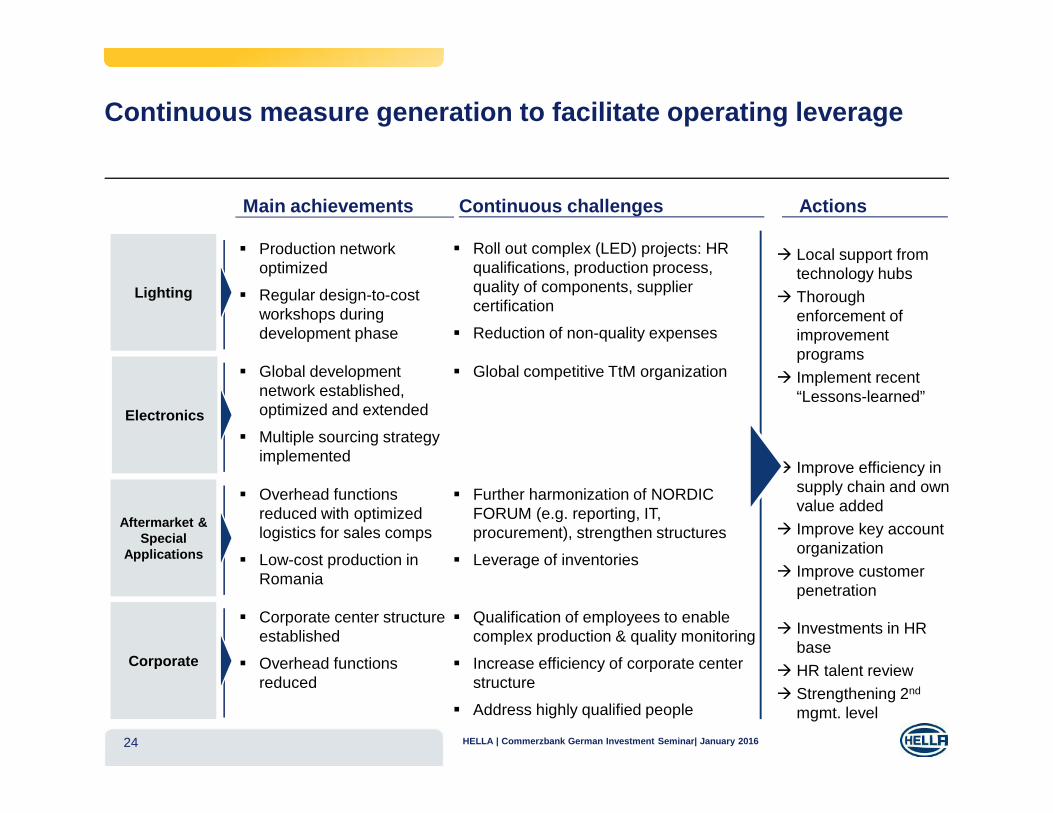
24
Actions
� Production network optimized
� Regular design-to-cost workshops during development phase
� Global development network established, optimized and extended
� Multiple sourcing strategy implemented
� Overhead functions reduced with optimized logistics for sales comps
� Low-cost production in Romania
� Improve efficiency in supply chain and own value added
� Improve key account organization
� Improve customer penetration
� Local support from technology hubs
� Thorough enforcement of improvement programs
� Implement recent “Lessons-learned”
� Investments in HR base
� HR talent review
� Strengthening 2nd
mgmt. level
� Corporate center structure established
� Overhead functions reduced
Corporate
Aftermarket & Special
Applications
Electronics
Main achievements
Lighting
Continuous challenges
� Roll out complex (LED) projects: HR qualifications, production process, quality of components, supplier certification
� Reduction of non-quality expenses
� Global competitive TtM organization
� Qualification of employees to enable complex production & quality monitoring
� Increase efficiency of corporate center structure
� Address highly qualified people
Continuous measure generation to facilitate operating leverage
� Further harmonization of NORDIC FORUM (e.g. reporting, IT, procurement), strengthen structures
� Leverage of inventories
HELLA | Commerzbank German Investment Seminar| January 2016
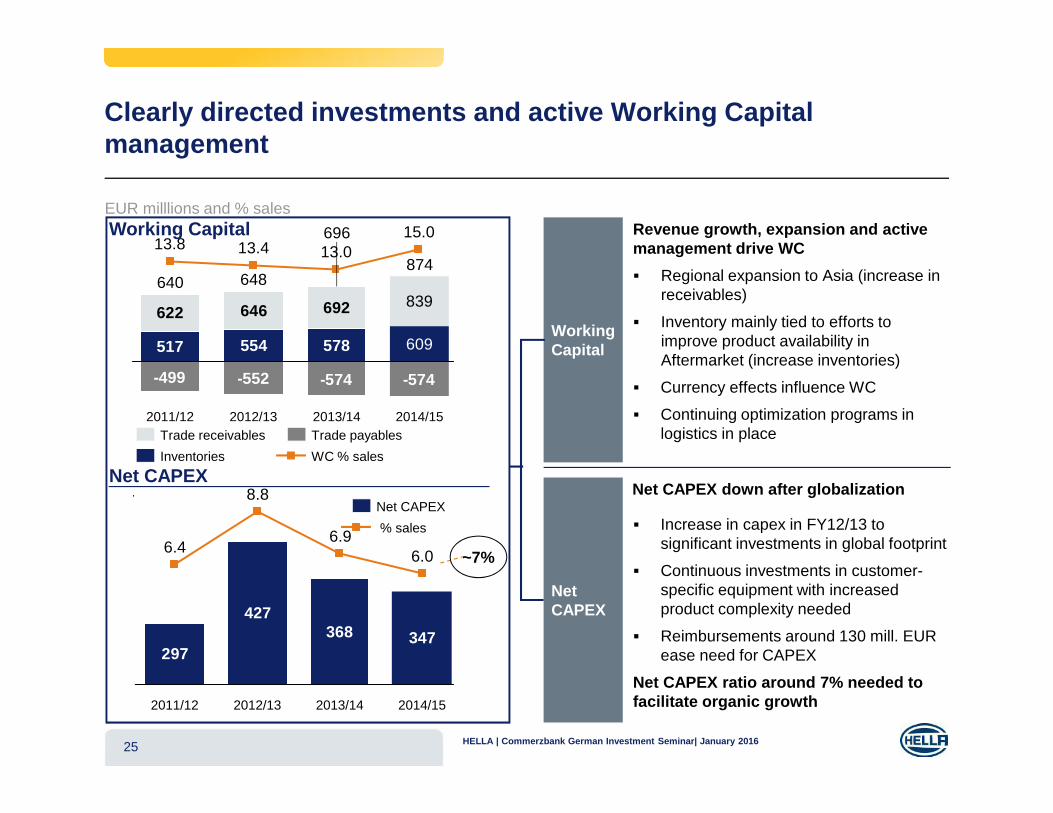
25
Clearly directed investments and active Working Capital management
-499 -552 -574 -574
517 554 578
622 646 692
609
839
2014/15
874
15.0
2013/14
69613.0
2012/13
648
13.4
2011/12
640
13.8
WC % sales
Trade payables
Inventories
Trade receivables
297
427368 347
2014/15
6.0
2013/14
6.9
2012/13
8.8
2011/12
6.4% sales
Net CAPEX
Working Capital
Net CAPEX
Net CAPEX
Net CAPEX down after globalization
� Increase in capex in FY12/13 to significant investments in global footprint
� Continuous investments in customer-specific equipment with increased product complexity needed
� Reimbursements around 130 mill. EUR ease need for CAPEX
Net CAPEX ratio around 7% needed to facilitate organic growth
Working Capital
Revenue growth, expansion and active management drive WC
� Regional expansion to Asia (increase in receivables)
� Inventory mainly tied to efforts to improve product availability in Aftermarket (increase inventories)
� Currency effects influence WC
� Continuing optimization programs in logistics in place
EUR milllions and % sales
~7%
HELLA | Commerzbank German Investment Seminar| January 2016
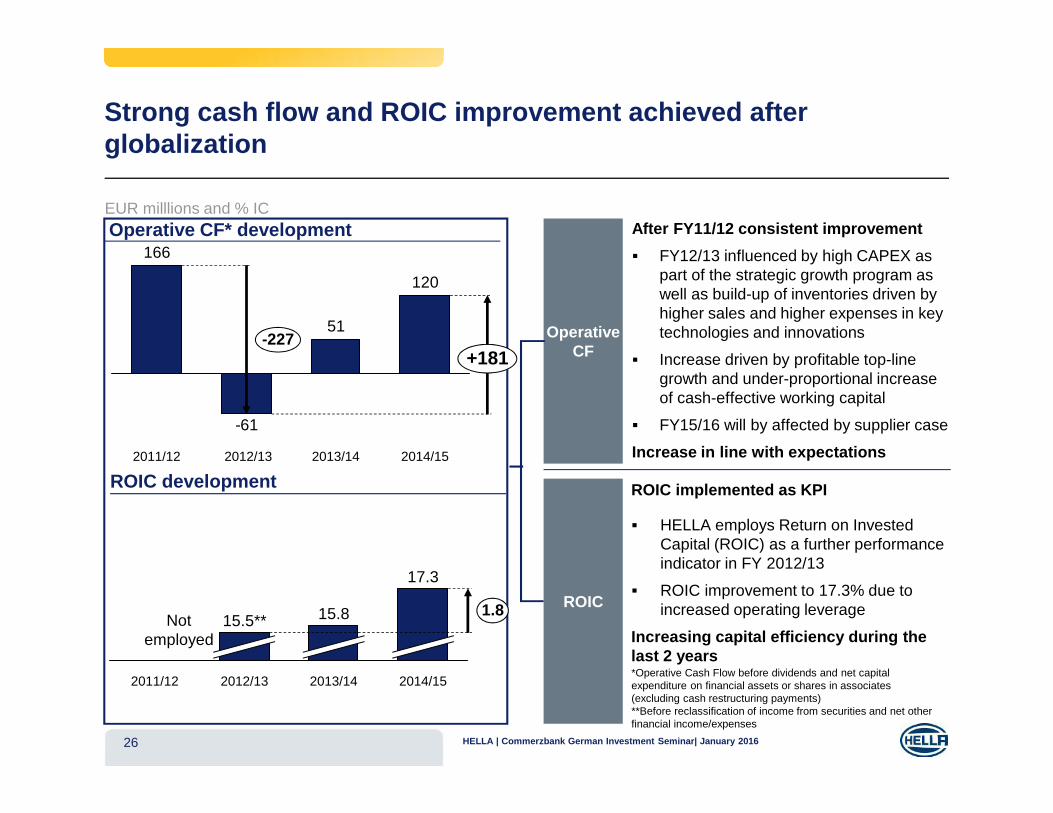
HELLA | Commerzbank German Investment Seminar| January 2016
Operative CF* development
120
51
-61
166
+181-227
2014/152013/142012/132011/12
*Operative Cash Flow before dividends and net capital expenditure on financial assets or shares in associates (excluding cash restructuring payments)**Before reclassification of income from securities and net other financial income/expenses
26
17.3
1.8
2014/152013/14
15.8
2012/13
15.5**
2011/12
ROIC development
Strong cash flow and ROIC improvement achieved after globalization
Not employed
EUR milllions and % IC
ROIC
ROIC implemented as KPI
� HELLA employs Return on Invested Capital (ROIC) as a further performance indicator in FY 2012/13
� ROIC improvement to 17.3% due to increased operating leverage
Increasing capital efficiency during the last 2 years
Operative CF
After FY11/12 consistent improvement
� FY12/13 influenced by high CAPEX as part of the strategic growth program as well as build-up of inventories driven by higher sales and higher expenses in key technologies and innovations
� Increase driven by profitable top-line growth and under-proportional increase of cash-effective working capital
� FY15/16 will by affected by supplier case
Increase in line with expectations
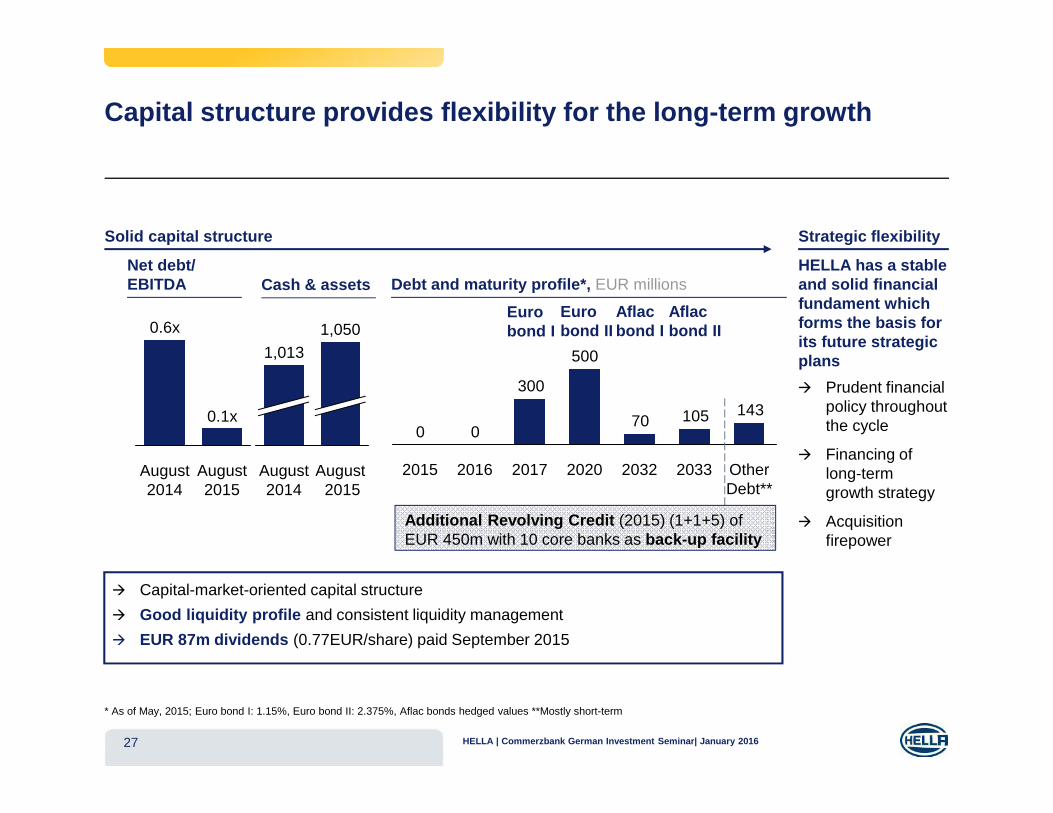
27
Solid capital structure
� Capital-market-oriented capital structure
� Good liquidity profile and consistent liquidity management
� EUR 87m dividends (0.77EUR/share) paid September 2015
Net debt/EBITDA
0.6x
August2015
0.1x
August2014
Strategic flexibility
� Prudent financial policy throughout the cycle
� Financing of long-term growth strategy
� Acquisition firepower
HELLA has a stable and solid financial fundament which forms the basis for its future strategic plans
14310570
500
300
00
Other Debt**
203320322020201720162015
Eurobond I
Aflacbond II
Aflacbond I
Debt and maturity profile*, EUR millions
* As of May, 2015; Euro bond I: 1.15%, Euro bond II: 2.375%, Aflac bonds hedged values **Mostly short-term
Capital structure provides flexibility for the long-term growth
1,050
August2015
August2014
1,013
Cash & assets
Eurobond II
Additional Revolving Credit (2015) (1+1+5) of EUR 450m with 10 core banks as back-up facility
HELLA | Commerzbank German Investment Seminar| January 2016
HELLA – German Investment Seminar 2016Agenda
28
� HELLA’s Strategic Growth Path
� Financial Overview FY 2011/12 - FY 2014/15
� Results H1 FY 15/16
ANNEX
HELLA | Commerzbank German Investment Seminar| January 2016
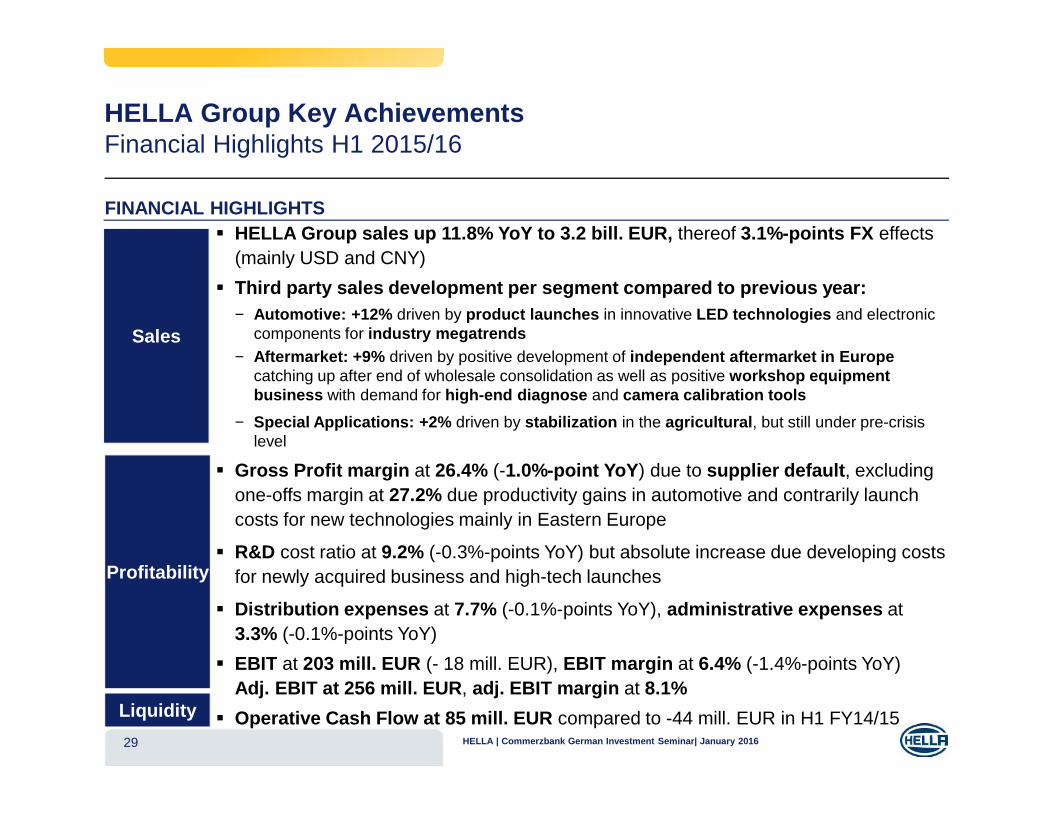
HELLA Group Key AchievementsFinancial Highlights H1 2015/16
� HELLA Group sales up 11.8% YoY to 3.2 bill. EUR, thereof 3.1%-points FX effects (mainly USD and CNY)
� Third party sales development per segment compared to previous year:− Automotive: +12% driven by product launches in innovative LED technologies and electronic
components for industry megatrends − Aftermarket: +9% driven by positive development of independent aftermarket in Europe
catching up after end of wholesale consolidation as well as positive workshop equipment business with demand for high-end diagnose and camera calibration tools
− Special Applications: +2% driven by stabilization in the agricultural, but still under pre-crisis level
� Gross Profit margin at 26.4% (-1.0%-point YoY) due to supplier default, excluding one-offs margin at 27.2% due productivity gains in automotive and contrarily launch costs for new technologies mainly in Eastern Europe
� R&D cost ratio at 9.2% (-0.3%-points YoY) but absolute increase due developing costs for newly acquired business and high-tech launches
� Distribution expenses at 7.7% (-0.1%-points YoY), administrative expenses at3.3% (-0.1%-points YoY)
� EBIT at 203 mill. EUR (- 18 mill. EUR), EBIT margin at 6.4% (-1.4%-points YoY)Adj. EBIT at 256 mill. EUR, adj. EBIT margin at 8.1%
� Operative Cash Flow at 85 mill. EUR compared to -44 mill. EUR in H1 FY14/15
FINANCIAL HIGHLIGHTS
Sales
Profitability
Liquidity
29 HELLA | Commerzbank German Investment Seminar| January 2016
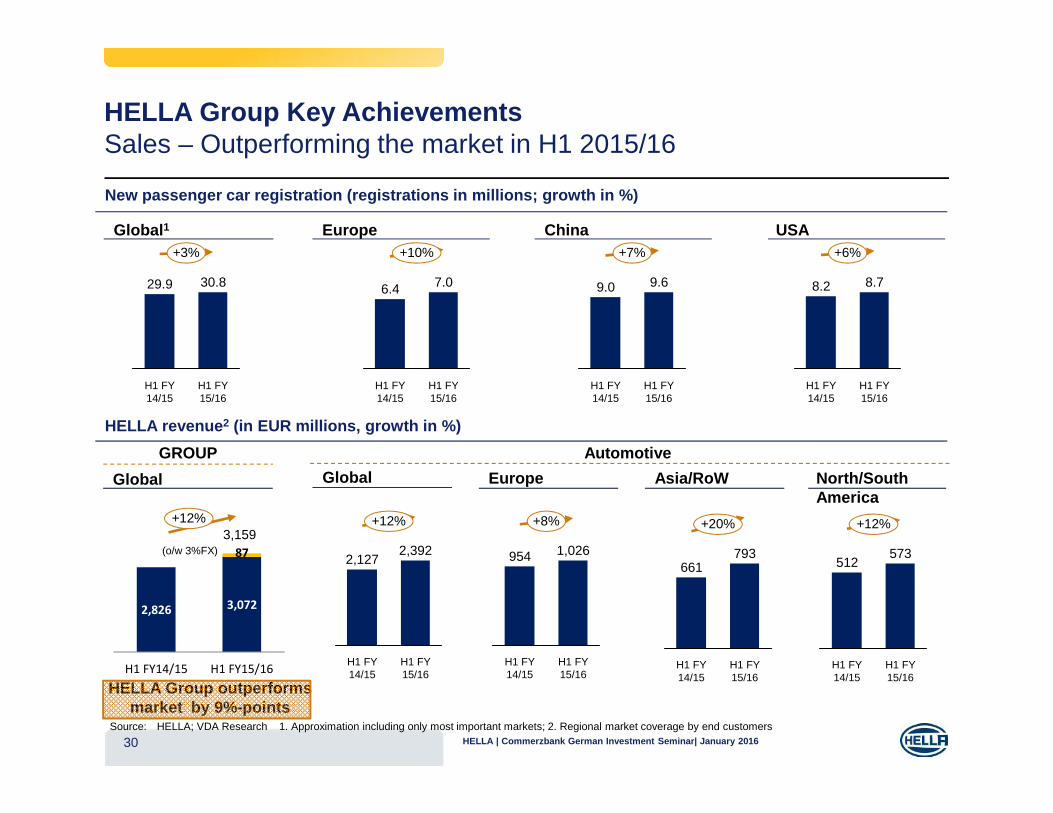
2,826 3,072
87
H1 FY14/15 H1 FY15/16
HELLA Group Key AchievementsSales – Outperforming the market in H1 2015/16
Source: HELLA; VDA Research
New passenger car registration (registrations in millions; growth in %)
30
Global Europe Asia/RoW North/South America
HELLA revenue2 (in EUR millions, growth in %)
1. Approximation including only most important markets; 2. Regional market coverage by end customers
H1 FY 15/16
+20%
793
H1 FY 14/15
661
H1 FY 14/15
+12%
512
H1 FY 15/16
573
H1 FY 14/15
1,026954
+8%
H1 FY 15/16
Global1 Europe China USA
+12%
(o/w 3%FX)
GROUP Automotive
3,159
9.6
+7%
9.0
H1 FY 14/15
H1 FY 15/16
8.2 8.7
H1 FY 14/15
+6%
H1 FY 15/16
H1 FY 15/16
H1 FY 14/15
7.06.4
+10%
H1 FY 15/16
30.8
+3%
H1 FY 14/15
29.9
HELLA Group outperforms market by 9%-points
Global
H1 FY 14/15
2,3922,127
+12%
H1 FY 15/16
HELLA | Commerzbank German Investment Seminar| January 2016
HELLA Group Key AchievementsP&L (I) – H1 2014/15 to H1 2015/16
773
+88
861
+61
H1 FY15/16
834
H1 FY14/15
773
GP
adj.* GP
31
27.2
-1.0**
H1 FY15/16
26.4
H1 FY14/15
27.327.3
GPM
adj.* GPM
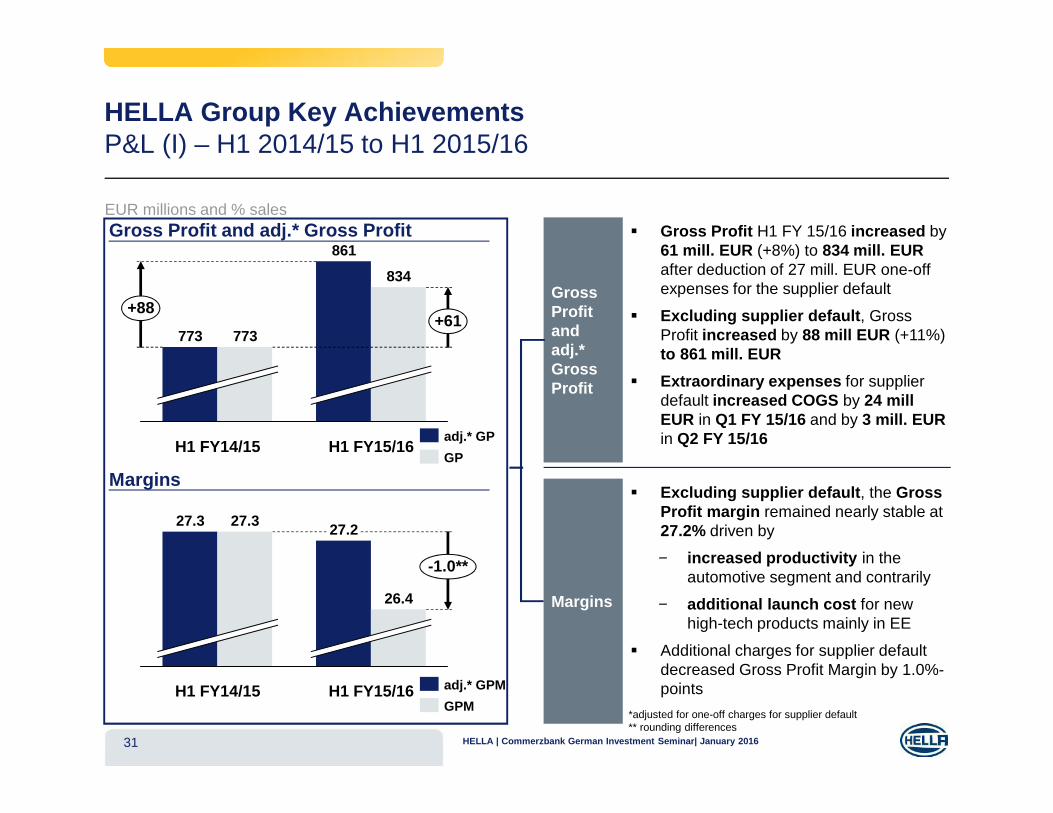
Gross Profit and adj.* Gross ProfitEUR millions and % sales
Margins
Margins
Gross Profit and adj.* Gross Profit
� Gross Profit H1 FY 15/16 increased by 61 mill. EUR (+8%) to 834 mill. EUR after deduction of 27 mill. EUR one-off expenses for the supplier default
� Excluding supplier default, Gross Profit increased by 88 mill EUR (+11%) to 861 mill. EUR
� Extraordinary expenses for supplier default increased COGS by 24 mill EUR in Q1 FY 15/16 and by 3 mill. EUR in Q2 FY 15/16
� Excluding supplier default, the Gross Profit margin remained nearly stable at 27.2% driven by
− increased productivity in the automotive segment and contrarily
− additional launch cost for new high-tech products mainly in EE
� Additional charges for supplier default decreased Gross Profit Margin by 1.0%-points
*adjusted for one-off charges for supplier default** rounding differences
HELLA | Commerzbank German Investment Seminar| January 2016
HELLA Group Key AchievementsP&L (II) – H1 2014/15 to H1 2015/16
32
R&D (in mill. EUR, % of sales)
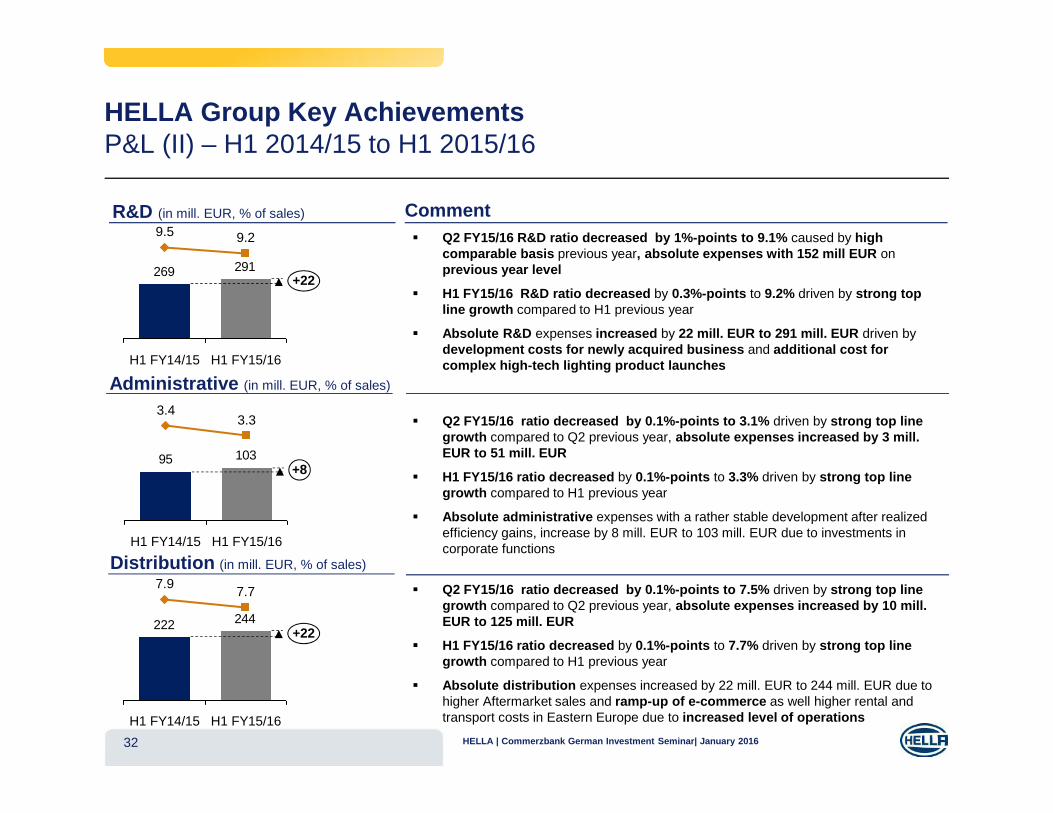
� Q2 FY15/16 R&D ratio decreased by 1%-points to 9.1% caused by high comparable basis previous year, absolute expenses with 152 mill EUR on previous year level
� H1 FY15/16 R&D ratio decreased by 0.3%-points to 9.2% driven by strong top line growth compared to H1 previous year
� Absolute R&D expenses increased by 22 mill. EUR to 291 mill. EUR driven by development costs for newly acquired business and additional cost for complex high-tech lighting product launches
Comment
Administrative (in mill. EUR, % of sales)
Distribution (in mill. EUR, % of sales)
3.7%
3.4%
9.3%
8.1%
7.8%
� Q2 FY15/16 ratio decreased by 0.1%-points to 3.1% driven by strong top line growth compared to Q2 previous year, absolute expenses increased by 3 mill. EUR to 51 mill. EUR
� H1 FY15/16 ratio decreased by 0.1%-points to 3.3% driven by strong top line growth compared to H1 previous year
� Absolute administrative expenses with a rather stable development after realized efficiency gains, increase by 8 mill. EUR to 103 mill. EUR due to investments in corporate functions
� Q2 FY15/16 ratio decreased by 0.1%-points to 7.5% driven by strong top line growth compared to Q2 previous year, absolute expenses increased by 10 mill. EUR to 125 mill. EUR
� H1 FY15/16 ratio decreased by 0.1%-points to 7.7% driven by strong top line growth compared to H1 previous year
� Absolute distribution expenses increased by 22 mill. EUR to 244 mill. EUR due to higher Aftermarket sales and ramp-up of e-commerce as well higher rental and transport costs in Eastern Europe due to increased level of operations
291269+22
H1 FY15/16
9.2
H1 FY14/15
9.5
244222+22
H1 FY15/16
7.7
H1 FY14/15
7.9
10395+8
H1 FY15/16
3.3
H1 FY14/15
3.4
HELLA | Commerzbank German Investment Seminar| January 2016
HELLA Group Key AchievementsP&L (III) – H1 2014/15 to H1 2015/16
H1 FY15/16
227
H1 FY14/15
203
221+29
256
-18
Adj EBIT
EBIT
33
+0.1 8.18.0
H1 FY15/16
-1.4
6.4
H1 FY14/15
7.8Adj EBIT
EBIT
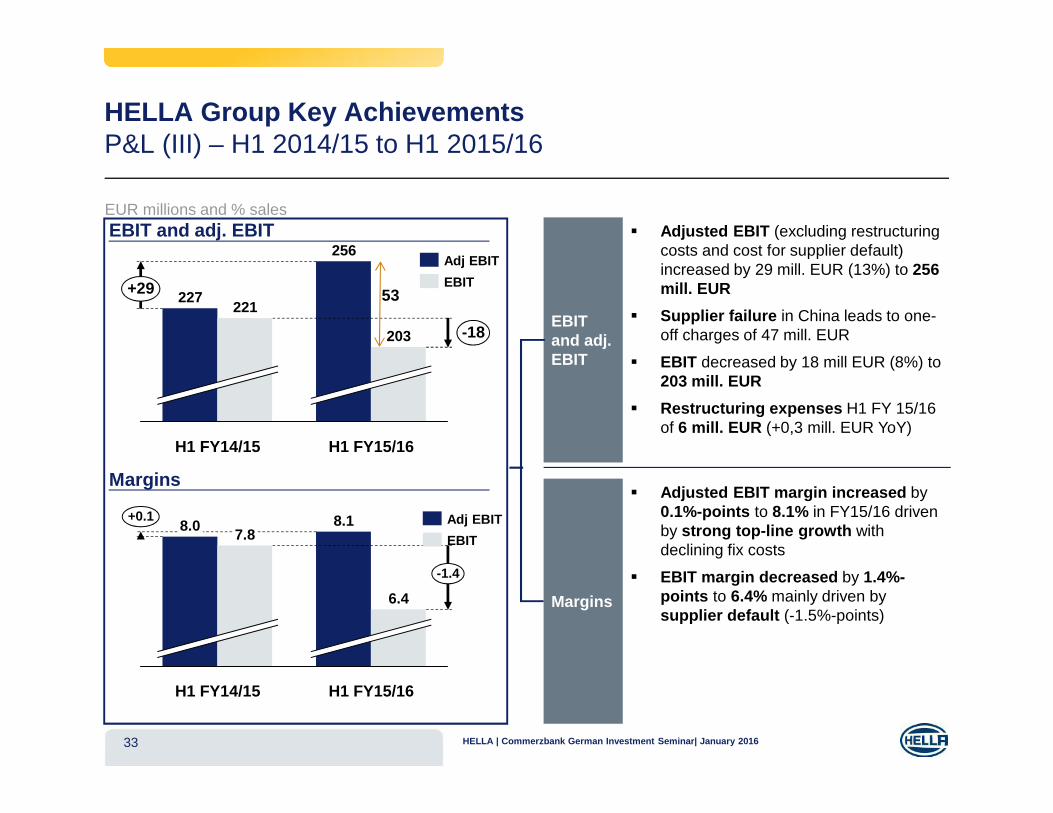
EBIT and adj. EBITEUR millions and % sales
Margins
Margins
EBIT and adj. EBIT
� Adjusted EBIT (excluding restructuring costs and cost for supplier default) increased by 29 mill. EUR (13%) to 256 mill. EUR
� Supplier failure in China leads to one-off charges of 47 mill. EUR
� EBIT decreased by 18 mill EUR (8%) to 203 mill. EUR
� Restructuring expenses H1 FY 15/16 of 6 mill. EUR (+0,3 mill. EUR YoY)
� Adjusted EBIT margin increased by 0.1%-points to 8.1% in FY15/16 driven by strong top-line growth with declining fix costs
� EBIT margin decreased by 1.4%-points to 6.4% mainly driven by supplier default (-1.5%-points)
53
HELLA | Commerzbank German Investment Seminar| January 2016
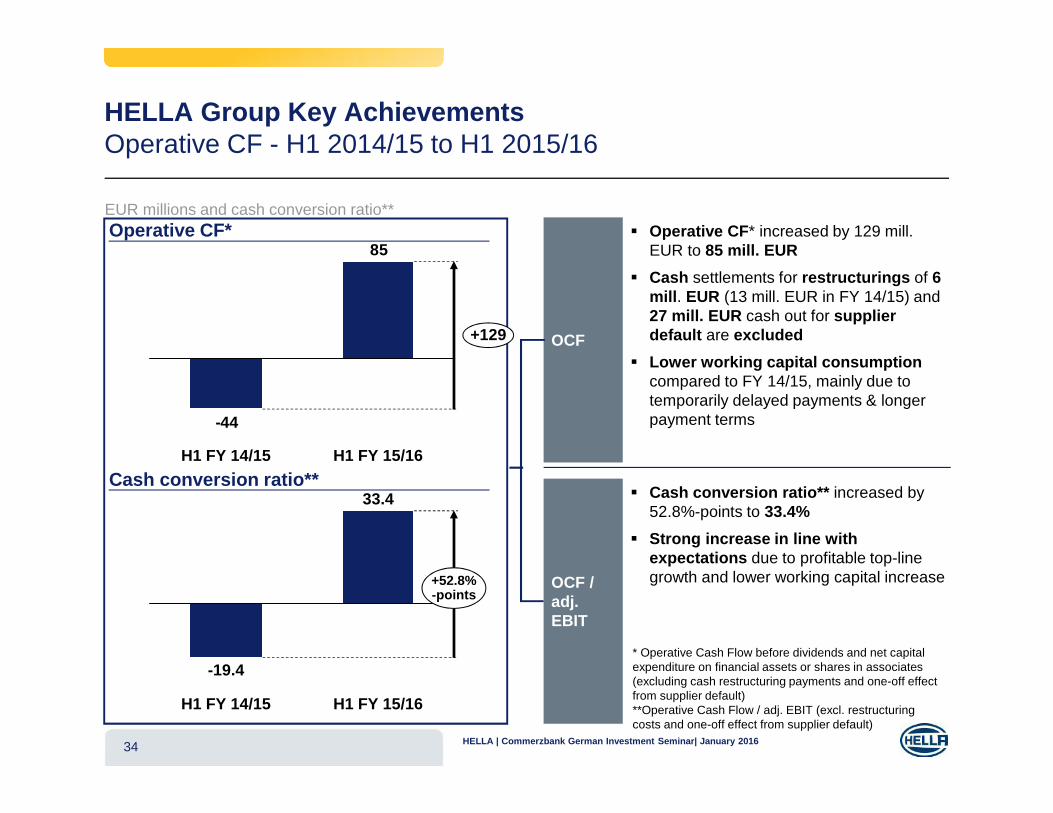
EUR millions and cash conversion ratio**
HELLA Group Key AchievementsOperative CF - H1 2014/15 to H1 2015/16
34
� Operative CF* increased by 129 mill. EUR to 85 mill. EUR
� Cash settlements for restructurings of 6 mill. EUR (13 mill. EUR in FY 14/15) and 27 mill. EUR cash out for supplier default are excluded
� Lower working capital consumption compared to FY 14/15, mainly due to temporarily delayed payments & longer payment terms
85
-44
H1 FY 15/16
+129
H1 FY 14/15
* Operative Cash Flow before dividends and net capital expenditure on financial assets or shares in associates (excluding cash restructuring payments and one-off effect from supplier default)**Operative Cash Flow / adj. EBIT (excl. restructuring costs and one-off effect from supplier default)
Operative CF*
Cash conversion ratio**33.4
H1 FY 15/16
+52.8%-points
-19.4
H1 FY 14/15
OCF / adj. EBIT
OCF
� Cash conversion ratio** increased by 52.8%-points to 33.4%
� Strong increase in line with expectations due to profitable top-line growth and lower working capital increase
HELLA | Commerzbank German Investment Seminar| January 2016
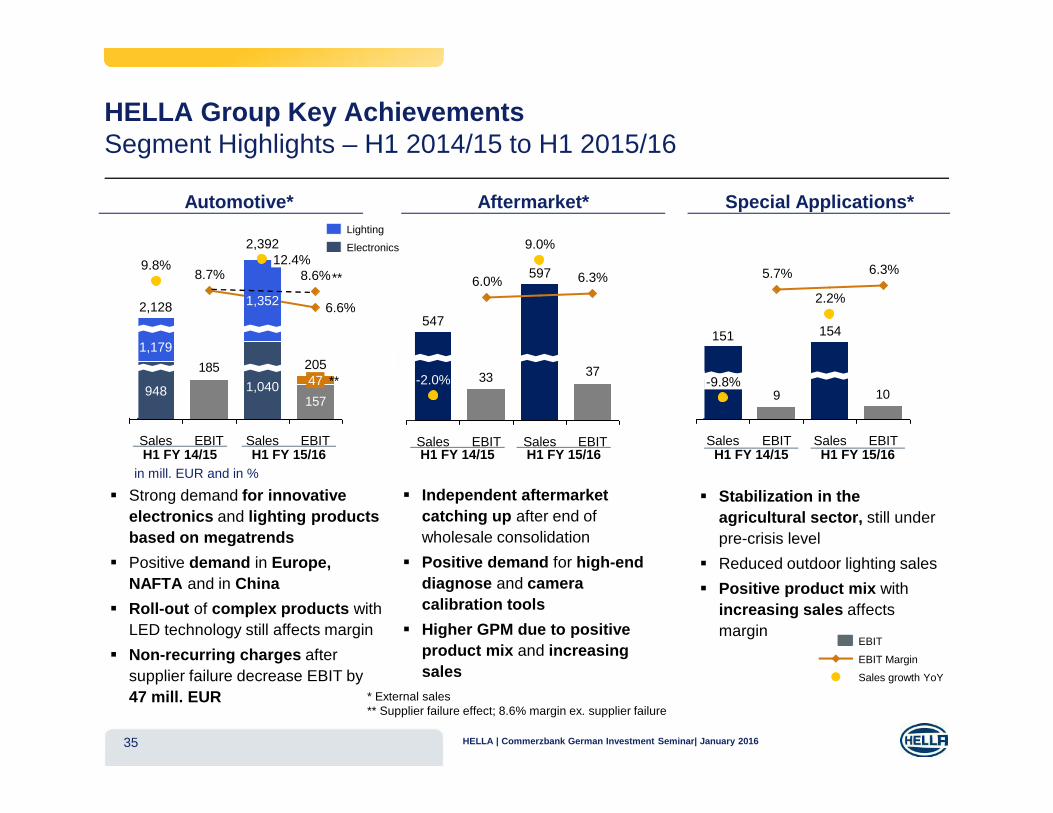
HELLA Group Key AchievementsSegment Highlights – H1 2014/15 to H1 2015/16
35
Aftermarket*Automotive* Special Applications*
in mill. EUR and in %
* External sales** Supplier failure effect; 8.6% margin ex. supplier failure
� Strong demand for innovative electronics and lighting products based on megatrends
� Positive demand in Europe, NAFTA and in China
� Roll-out of complex products with LED technology still affects margin
� Non-recurring charges after supplier failure decrease EBIT by 47 mill. EUR
� Independent aftermarket catching up after end of wholesale consolidation
� Positive demand for high-end diagnose and camera calibration tools
� Higher GPM due to positive product mix and increasing sales
� Stabilization in the agricultural sector, still under pre-crisis level
� Reduced outdoor lighting sales
� Positive product mix withincreasing sales affects margin
537 646
157
185
EBIT
205
2,128
9.8%8.7%
Sales
8.6%
948
1,179
6.6%
47
Sales
2,39212.4%
1,040
1,352
EBIT
3733
Sales
547
-2.0%
EBIT
6.3%
Sales
597
9.0%
EBIT
6.0%
109
EBIT
6.3%
Sales
154
2.2%
EBIT
5.7%
Sales
151
-9.8%
H1 FY 14/15 H1 FY 15/16 H1 FY 14/15 H1 FY 15/16 H1 FY 14/15 H1 FY 15/16
**
**
Sales growth YoY
EBIT Margin
EBIT
Electronics
Lighting
HELLA | Commerzbank German Investment Seminar| January 2016
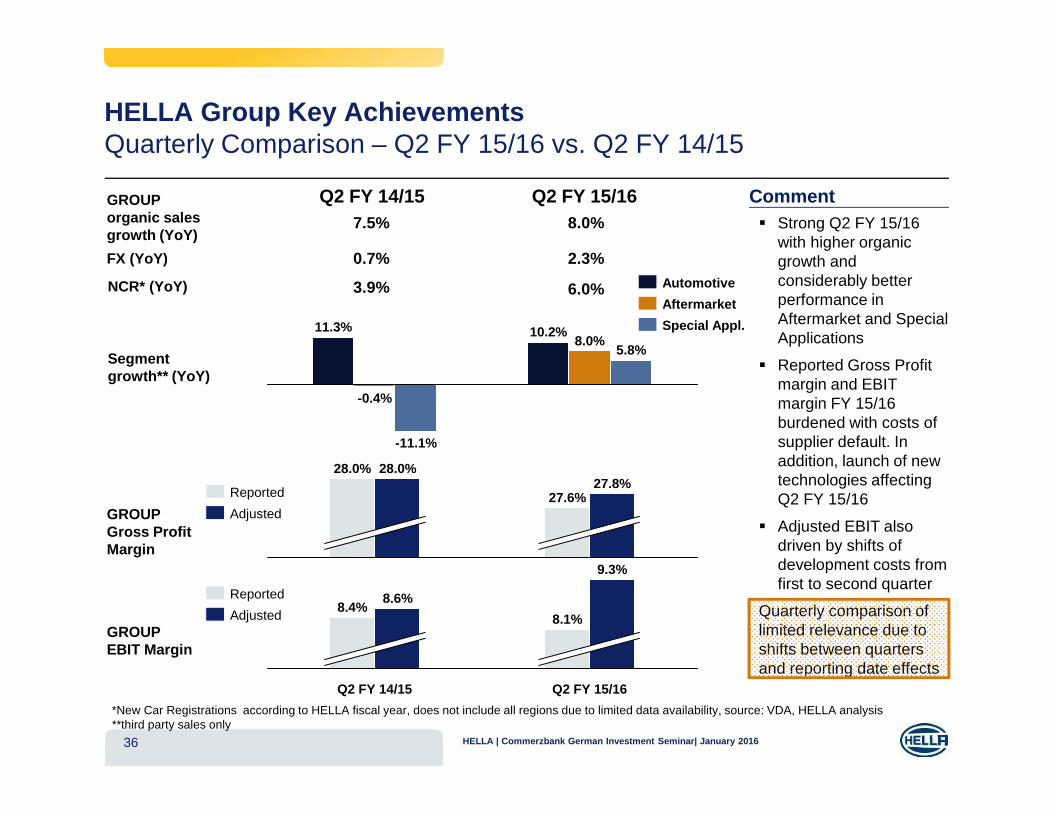
HELLA Group Key AchievementsQuarterly Comparison – Q2 FY 15/16 vs. Q2 FY 14/15
36
Segment growth** (YoY)
GROUPGross Profit Margin
GROUPEBIT Margin
*New Car Registrations according to HELLA fiscal year, does not include all regions due to limited data availability, source: VDA, HELLA analysis **third party sales only
GROUP organic salesgrowth (YoY)
7.5% 8.0%
0.7% 2.3%FX (YoY)
NCR* (YoY) 3.9% 6.0%
5.8%8.0%
10.2%
-11.1%
-0.4%
11.3% Special Appl.
Aftermarket
Automotive
Q2 FY 14/15 Q2 FY 15/16� Strong Q2 FY 15/16
with higher organic growth and considerably better performance in Aftermarket and Special Applications
� Reported Gross Profit margin and EBIT margin FY 15/16 burdened with costs of supplier default. In addition, launch of new technologies affecting Q2 FY 15/16
� Adjusted EBIT also driven by shifts of development costs from first to second quarter
Quarterly comparison of limited relevance due to shifts between quarters and reporting date effects
Comment
27.8%27.6%
28.0%28.0%
Adjusted
Reported
9.3%
8.4%
Q2 FY 15/16
8.6%
8.1%
Q2 FY 14/15
Adjusted
Reported
HELLA | Commerzbank German Investment Seminar| January 2016
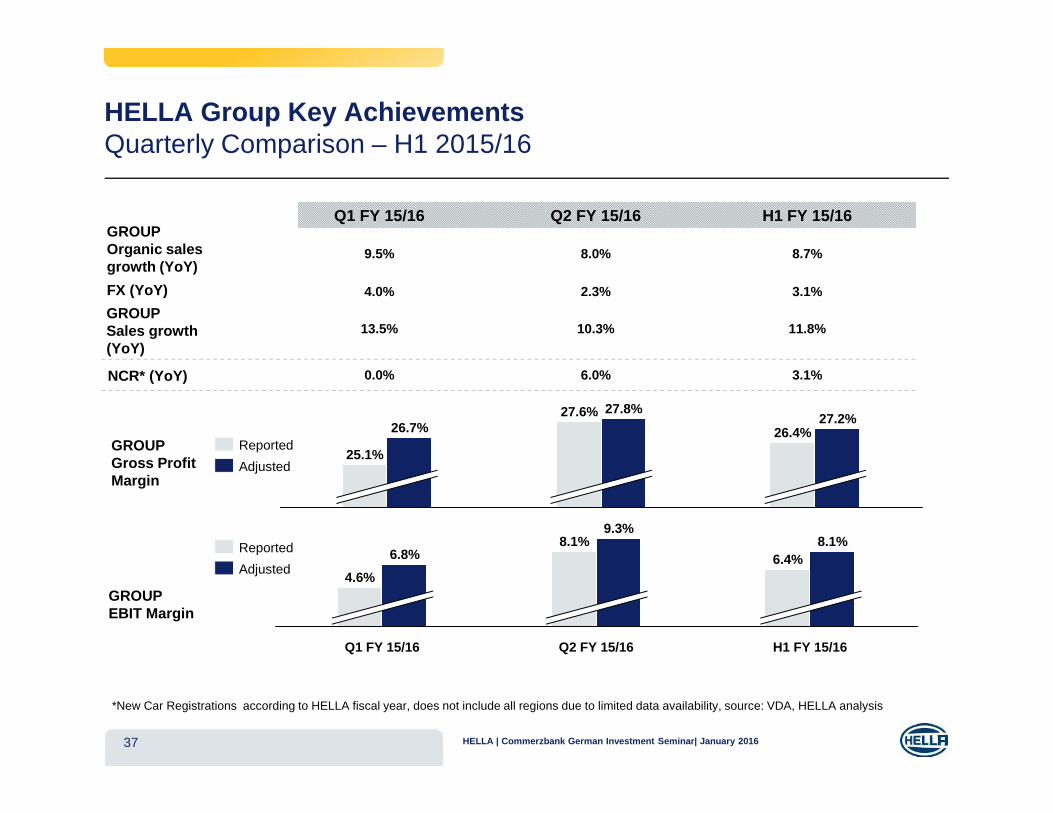
HELLA Group Key AchievementsQuarterly Comparison – H1 2015/16
37
GROUPGross Profit Margin
GROUPEBIT Margin
*New Car Registrations according to HELLA fiscal year, does not include all regions due to limited data availability, source: VDA, HELLA analysis
GROUPOrganic salesgrowth (YoY)
9.5% 8.0% 8.7%
4.0% 2.3% 3.1%FX (YoY)
NCR* (YoY) 0.0% 6.0% 3.1%
Q1 FY 15/16 Q2 FY 15/16 H1 FY 15/16
13.5% 10.3% 11.8%GROUPSales growth(YoY)
25.1%
27.6%26.7% 26.4%
27.2%27.8%
Adjusted
Reported
8.1%
H1 FY 15/16
8.1%9.3%
Q1 FY 15/16
6.8%
4.6%
Q2 FY 15/16
6.4%Adjusted
Reported
HELLA | Commerzbank German Investment Seminar| January 2016
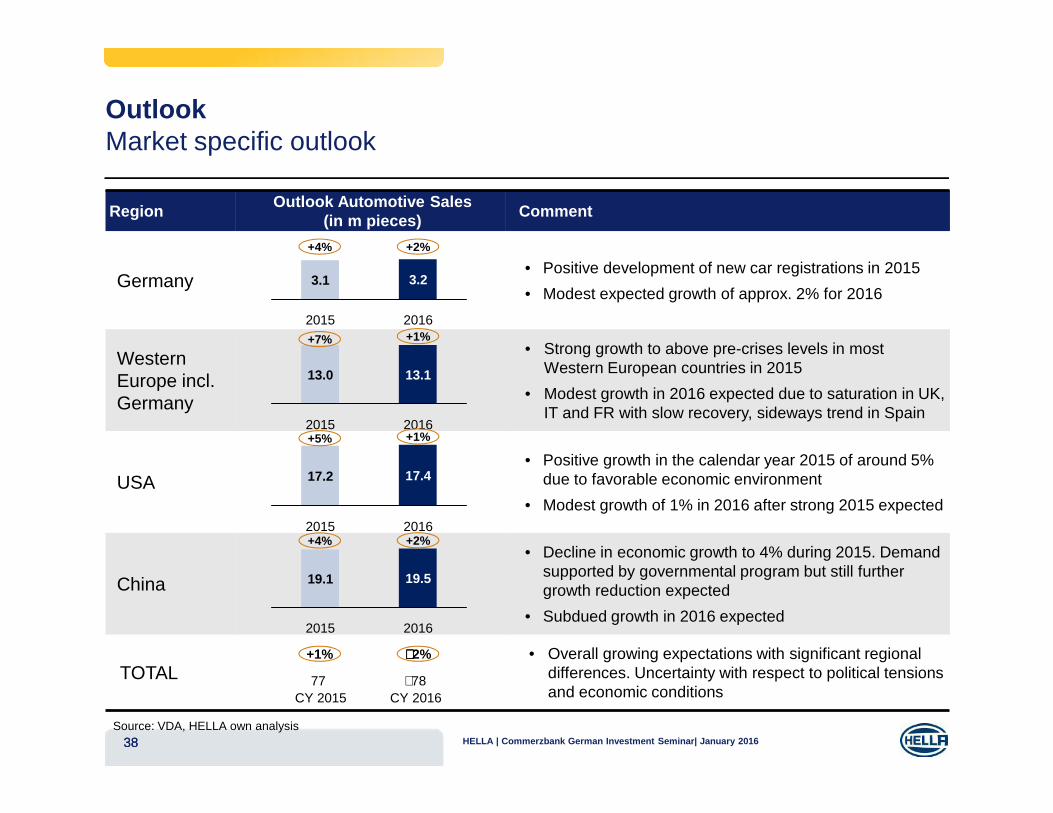
RegionOutlook Automotive Sales
(in m pieces)Comment
Germany• Positive development of new car registrations in 2015
• Modest expected growth of approx. 2% for 2016
WesternEurope incl. Germany
• Strong growth to above pre-crises levels in most Western European countries in 2015
• Modest growth in 2016 expected due to saturation in UK, IT and FR with slow recovery, sideways trend in Spain
USA• Positive growth in the calendar year 2015 of around 5%
due to favorable economic environment
• Modest growth of 1% in 2016 after strong 2015 expected
China
• Decline in economic growth to 4% during 2015. Demandsupported by governmental program but still further growth reduction expected
• Subdued growth in 2016 expected
TOTAL• Overall growing expectations with significant regional
differences. Uncertainty with respect to political tensions and economic conditions
38
OutlookMarket specific outlook
Source: VDA, HELLA own analysis
77 ∼ 78
+1% ∼∼∼∼ 2%
38
CY 2015 CY 2016
2015
3.1 3.2
2016
13.0
20162015
13.1
17.417.2
20162015
2016
19.519.1
2015
+4% +2%
+7% +1%
+5% +1%
+2%+4%
HELLA | Commerzbank German Investment Seminar| January 2016
39
OutlookCompany specific outlook FY 2015/16
39
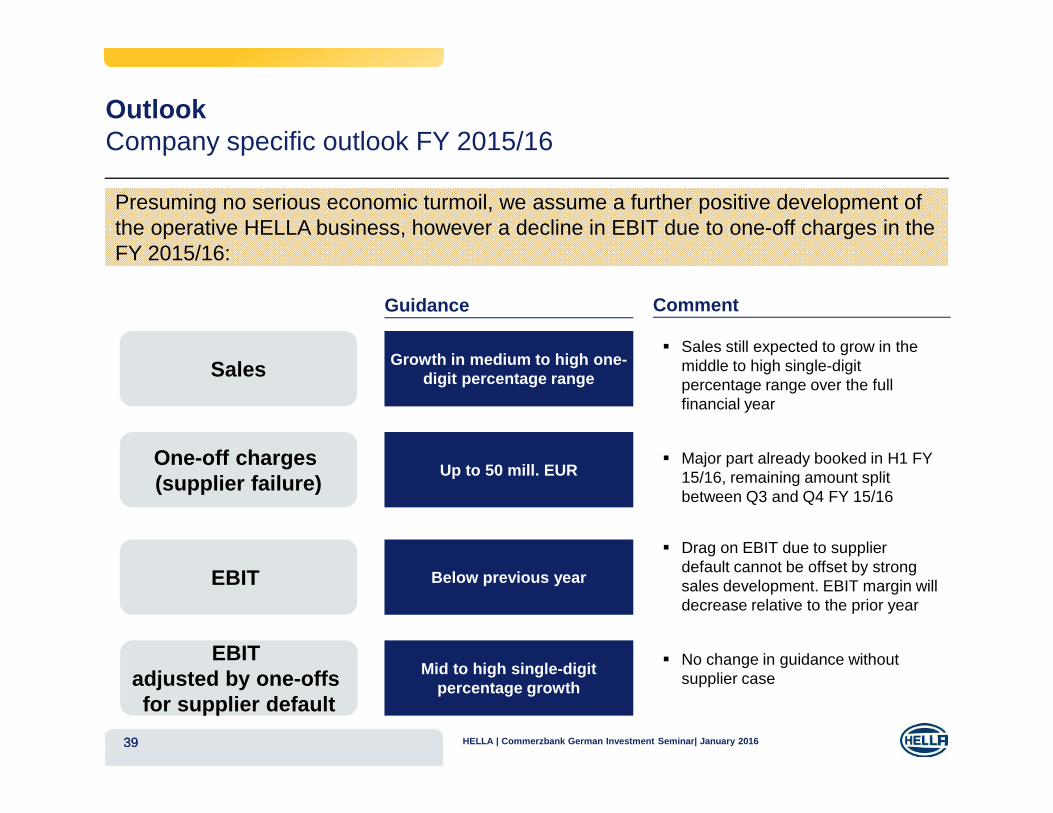
Presuming no serious economic turmoil, we assume a further positive development of the operative HELLA business, however a decline in EBIT due to one-off charges in the FY 2015/16:
Growth in medium to high one-digit percentage rangeSales
Guidance
One-off charges(supplier failure)
Up to 50 mill. EUR
EBIT Below previous year
� Sales still expected to grow in the middle to high single-digit percentage range over the full financial year
� Major part already booked in H1 FY 15/16, remaining amount split between Q3 and Q4 FY 15/16
� Drag on EBIT due to supplier default cannot be offset by strong sales development. EBIT margin will decrease relative to the prior year
� No change in guidance without supplier case
Comment
Mid to high single-digit percentage growth
EBIT adjusted by one-offs for supplier default
HELLA | Commerzbank German Investment Seminar| January 2016
HELLA – German Investment Seminar 2016Agenda
40
� HELLA’s Strategic Growth Path
� Financial Overview FY 2011/12 - FY 2014/15
� Results H1 FY 15/16
ANNEX
HELLA | Commerzbank German Investment Seminar| January 2016
41
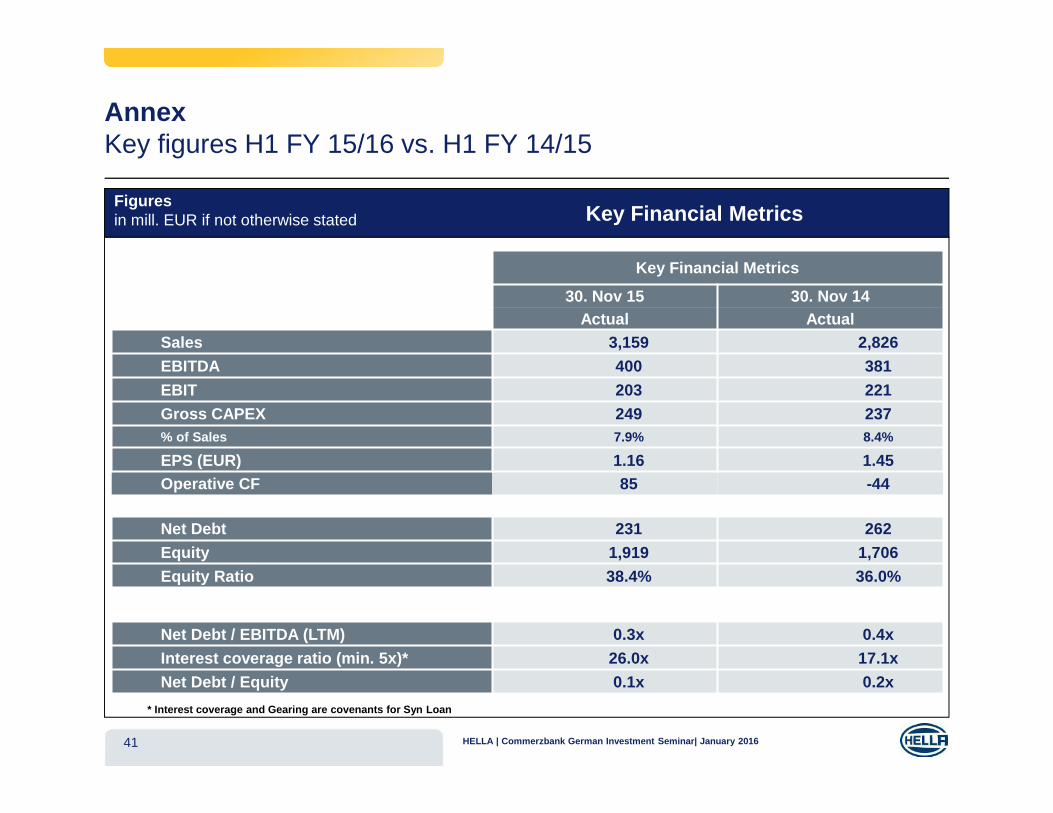
AnnexKey figures H1 FY 15/16 vs. H1 FY 14/15
Key Financial MetricsFiguresin mill. EUR if not otherwise stated
* Interest coverage and Gearing are covenants for Syn Loan
******Key Financial Metrics
30. Nov 15 30. Nov 14Actual Actual
Sales 3,159 2,826
EBITDA 400 381
EBIT 203 221
Gross CAPEX 249 237% of Sales 7.9% 8.4%
EPS (EUR) 1.16 1.45Operative CF 85 -44
Net Debt 231 262
Equity 1,919 1,706
Equity Ratio 38.4% 36.0%
Net Debt / EBITDA (LTM) 0.3x 0.4x
Interest coverage ratio (min. 5x)* 26.0x 17.1x
Net Debt / Equity 0.1x 0.2x
HELLA | Commerzbank German Investment Seminar| January 2016
42
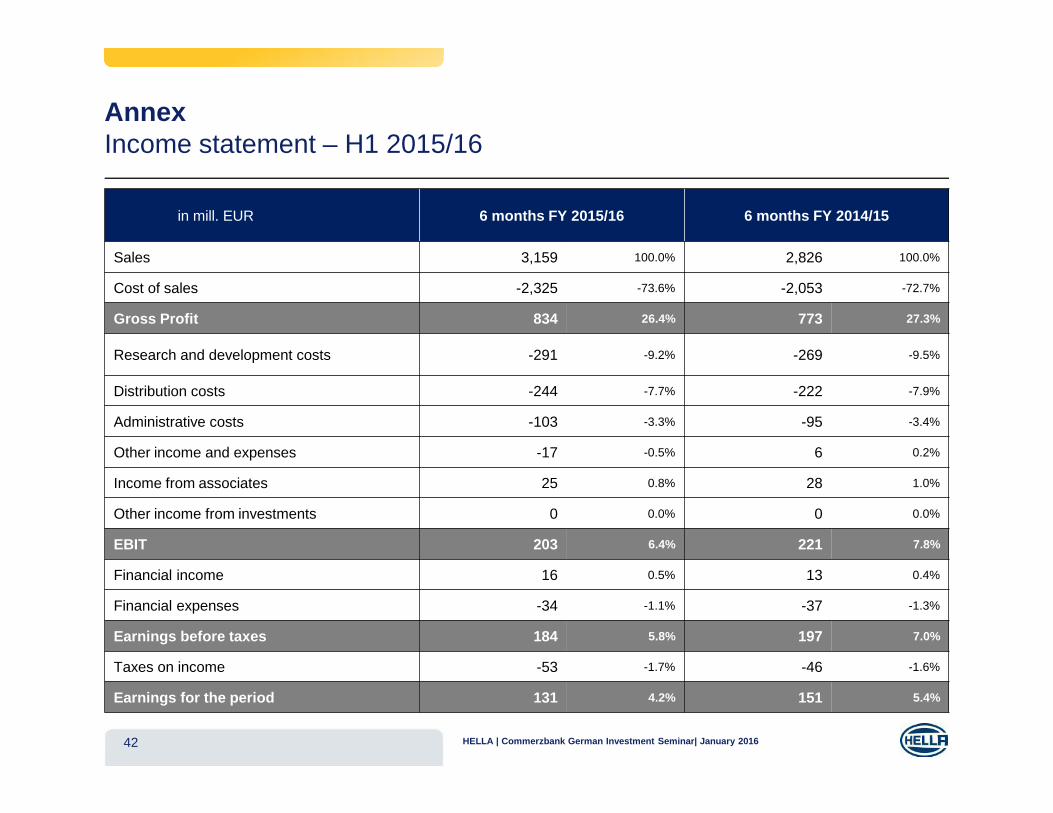
AnnexIncome statement – H1 2015/16
**in mill. EUR 6 months FY 2015/16 6 months FY 2014/15
Sales 3,159 100.0% 2,826 100.0%
Cost of sales -2,325 -73.6% -2,053 -72.7%
Gross Profit 834 26.4% 773 27.3%
Research and development costs -291 -9.2% -269 -9.5%
Distribution costs -244 -7.7% -222 -7.9%
Administrative costs -103 -3.3% -95 -3.4%
Other income and expenses -17 -0.5% 6 0.2%
Income from associates 25 0.8% 28 1.0%
Other income from investments 0 0.0% 0 0.0%
EBIT 203 6.4% 221 7.8%
Financial income 16 0.5% 13 0.4%
Financial expenses -34 -1.1% -37 -1.3%
Earnings before taxes 184 5.8% 197 7.0%
Taxes on income -53 -1.7% -46 -1.6%
Earnings for the period 131 4.2% 151 5.4%
HELLA | Commerzbank German Investment Seminar| January 2016
43
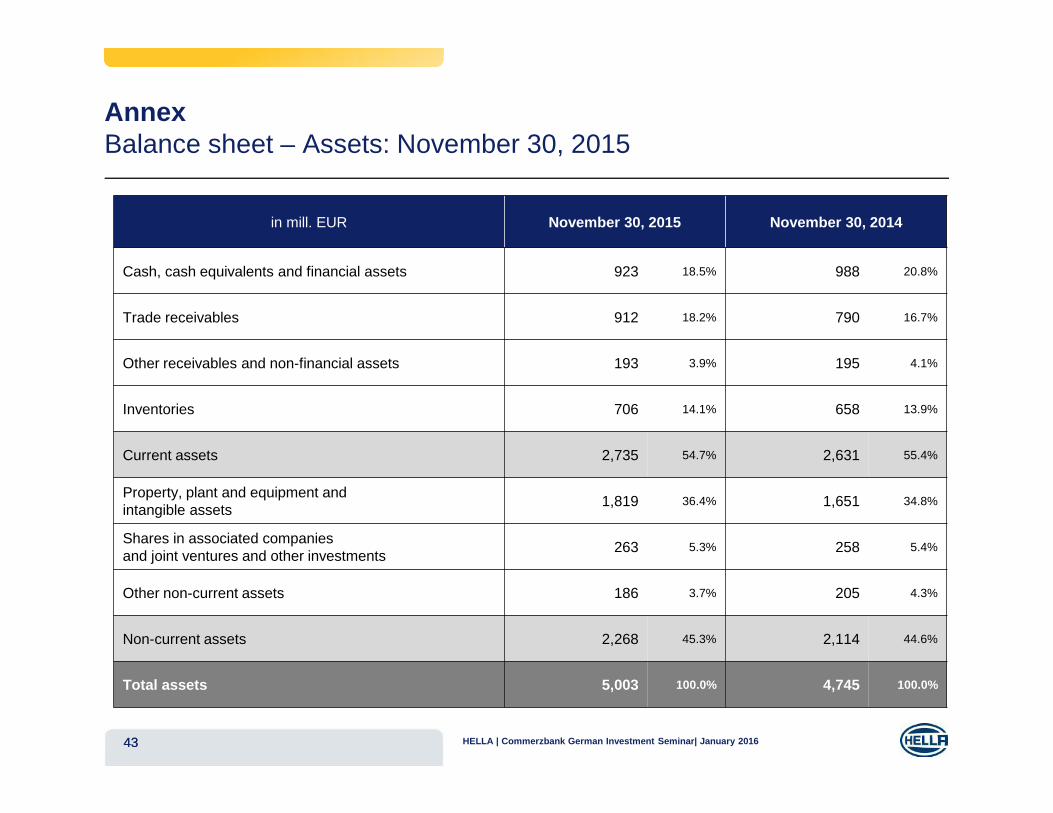
AnnexBalance sheet – Assets: November 30, 2015
*
43
in mill. EUR November 30, 2015 November 30, 2014
Cash, cash equivalents and financial assets 923 18.5% 988 20.8%
Trade receivables 912 18.2% 790 16.7%
Other receivables and non-financial assets 193 3.9% 195 4.1%
Inventories 706 14.1% 658 13.9%
Current assets 2,735 54.7% 2,631 55.4%
Property, plant and equipment and intangible assets
1,819 36.4% 1,651 34.8%
Shares in associated companiesand joint ventures and other investments
263 5.3% 258 5.4%
Other non-current assets 186 3.7% 205 4.3%
Non-current assets 2,268 45.3% 2,114 44.6%
Total assets 5,003 100.0% 4,745 100.0%
HELLA | Commerzbank German Investment Seminar| January 2016
44
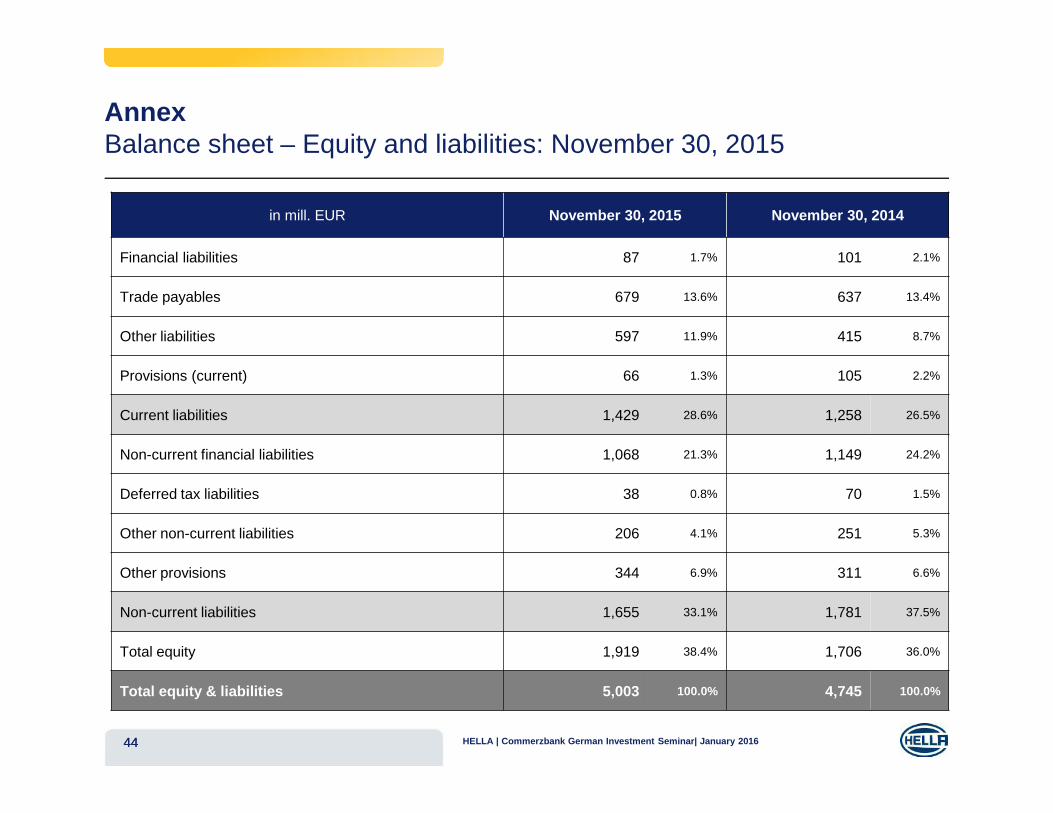
AnnexBalance sheet – Equity and liabilities: November 30, 2015
**
44
in mill. EUR November 30, 2015 November 30, 2014
Financial liabilities 87 1.7% 101 2.1%
Trade payables 679 13.6% 637 13.4%
Other liabilities 597 11.9% 415 8.7%
Provisions (current) 66 1.3% 105 2.2%
Current liabilities 1,429 28.6% 1,258 26.5%
Non-current financial liabilities 1,068 21.3% 1,149 24.2%
Deferred tax liabilities 38 0.8% 70 1.5%
Other non-current liabilities 206 4.1% 251 5.3%
Other provisions 344 6.9% 311 6.6%
Non-current liabilities 1,655 33.1% 1,781 37.5%
Total equity 1,919 38.4% 1,706 36.0%
Total equity & liabilities 5,003 100.0% 4,745 100.0%
HELLA | Commerzbank German Investment Seminar| January 2016

45
AnnexCash Flow – H1 2015/16
**
*Includes gross capital expenditures, less revenue from sale of assets, and less payments received for serial production
• Higher operative Cash Flow mainly due to lower working capital consumption
• Decrease in net capex* from 194 mill. EUR to 189 mill. EUR; customer payments exceeding previous year’s level (60 vs. 43 mill. EUR)
• Operative Cash Flow of 85 mill. EUR
in mill. EUR FY 2015/16 FY 2014/15
EBIT 203 221
Gross depreciation 197 160
Working capital changes -44 -114
Payments received for serial production 60 43
Tax payments -51 -60
Other operating activities (e.g. change in provisions) -31 -56
Gross Capital Expenditures -254 -242
Revenue from sale of assets 5 4
Operative Cash Flow 85 -44
Dividends paid -87 -59
Acquisitions -55 -20
Capital increase 0 272
Restructuring payments, Consolidation group changes, FX effects & other evaluation effects, Supplier case -39 12
Pension, Factoring, Operating Lease -5 2
Change in financial net debts -100 163
HELLA | Commerzbank German Investment Seminar| January 2016
46
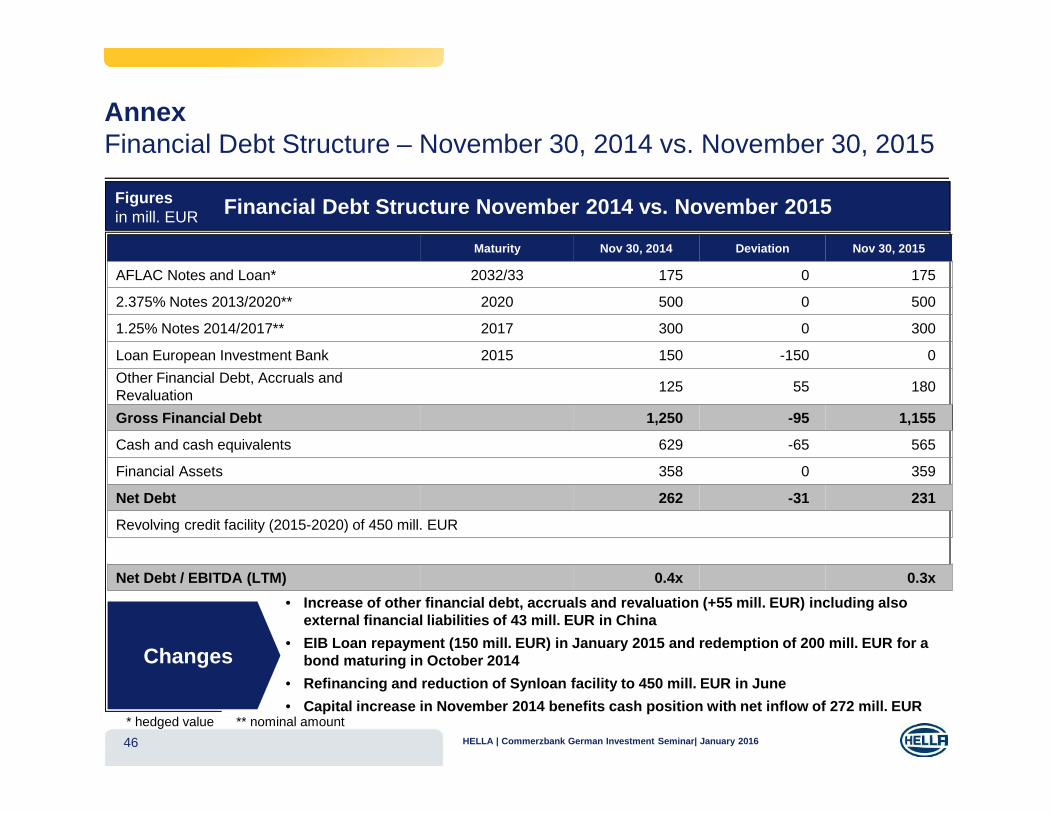
Annex Financial Debt Structure – November 30, 2014 vs. November 30, 2015
Financial Debt Structure November 2014 vs. November 2015Figuresin mill. EUR
• Increase of other financial debt, accruals and revaluation (+55 mill. EUR) including also external financial liabilities of 43 mill. EUR in China
• EIB Loan repayment (150 mill. EUR) in January 2015 and redemption of 200 mill. EUR for a bond maturing in October 2014
• Refinancing and reduction of Synloan facility to 450 mill. EUR in June
• Capital increase in November 2014 benefits cash position with net inflow of 272 mill. EUR
Changes
* hedged value ** nominal amount
Maturity Nov 30, 2014 Deviation Nov 30, 2015
AFLAC Notes and Loan* 2032/33 175 0 175
2.375% Notes 2013/2020** 2020 500 0 500
1.25% Notes 2014/2017** 2017 300 0 300
Loan European Investment Bank 2015 150 -150 0
Other Financial Debt, Accruals and Revaluation
125 55 180
Gross Financial Debt 1,250 -95 1,155
Cash and cash equivalents 629 -65 565
Financial Assets 358 0 359
Net Debt 262 -31 231
Revolving credit facility (2015-2020) of 450 mill. EUR
Net Debt / EBITDA (LTM) 0.4x 0.3x
HELLA | Commerzbank German Investment Seminar| January 2016
Thanks for your attention
Dr. Kerstin DodelInvestor Relations
Office phone +49 2941 38 - 1349 Facsimile +49 2941 38 - 471349 Mobile phone +49 174 3343454 E-Mail [email protected] Internet www.hella.com