Embed Size (px)
Citation preview
Biomed Eng Lett (2013) 3:39-46
DOI 10.1007/s13534-013-0087-x
COMETS: A MATLAB Toolbox for Simulating Local Electric Fields
Generated by Transcranial Direct Current Stimulation (tDCS)
Young-Jin Jung, Jung-Hoon Kim and Chang-Hwan Im
Received: 14 March 2013 / Accepted: 28 March 2013
© The Korean Society of Medical & Biological Engineering and Springer 2013
Abstract
Purpose Three-dimensional (3D) numerical computation of
electric fields generated by transcranial direct current
stimulation (tDCS) has widened our insight into the underlying
mechanisms of current conduction, accelerated the development
of novel electrode montages, and enabled more accurate
field concentrations to targeted brain areas. However, there is
no well-established field simulator specifically designed to
analyze electric fields due to tDCS.
Methods We developed a MATLAB-based toolbox, COMETS
(COMputation of Electric field due to Transcranial current
Stimulation), for simulating local electric fields generated by
tDCS. Since COMETS has a simple and interactive graphical
user interface, users can readily simulate various electrode
configurations, sizes, and orientations without coding any
MATLAB scripts. COMETS evaluates 3D cortical current
distributions based on the electrostatic finite element method
(FEM).
Results Although only a standard human head model is
provided in the current version, users may import their own
head model datasets for specific research. For advanced 3D
visualization of the resultant cortical current distributions,
output data can also be exported to readily accessible ASCII-
format data files. The toolbox package is freely available
at http://www.COMETStool.com for noncommercial and
academic uses.
Conclusions It is expected that our toolbox COMETS can
contribute to popularizing the numerical analysis of cortical
stimulation current in the field of noninvasive electrical brain
stimulation.
Keywords Transcranial direct current stimulation (tDCS),
Finite element method (FEM), Electrostatic field, MATLAB
toolbox, COMETS
INTRODUCTION
Transcranial direct current stimulation (tDCS) is a noninvasive
brain stimulation technique that can modulate cortical
excitability by transmitting direct current (DC) between a
pair of scalp electrodes [1-4]. Extensive studies have shown
that anodal and cathodal DC stimulation can facilitate and
inhibit cortical excitability, respectively, although the exact
underlying mechanisms have not yet been revealed [5, 6].
Since the late 1990s, tDCS have been studied in a variety
of clinical fields as a potential treatment modality for
neuropsychiatric diseases and neurological disorders including
stroke, depression, epilepsy, Alzheimer’s disease, chronic
pain, and Parkinson’s disease [4, 7-12] Although the effect of
tDCS is similar to that of repetitive transcranial magnetic
stimulation (rTMS), tDCS has garnered attention from the
neuroscience field because of its advantages over rTMS,
including better mobility, increased safety, and lower cost
[4, 6].
Since no imaging modality can image the cortical electric
field distribution generated by tDCS, electric field distributions
are generally estimated from computer-based numerical field
simulations [13-19]. Indeed, computer-based tDCS analyses
have many virtues. Since it is difficult to precisely predict
modulated cortical areas due to the non-uniform conductivity
values of head compartments and the edge effect [14],
realistic three-dimensional (3D) numerical simulations can
help researchers determine electrode locations that elicit
Young-Jin JungDepartment of Biomedical Engineering, Florida International University,Miami, FL, 33174, USA
Jung-Hoon Kim, Chang-Hwan Im ( )Department of Biomedical Engineering, Hanyang University, Seoul 133-791, Korea Tel : +82-2-2220-2322 / Fax : +82-2-2296-5943E-mail : [email protected]
ORIGINAL ARTICLE
40 Biomed Eng Lett (2013) 3:39-46
increased stimulating currents at target brain areas. Recent
studies have achieved enhanced field concentrations in target
brain areas by using 3D electric field analyses [20-22],
actualizing customized and individualized noninvasive brain
stimulation. Moreover, 3D field simulations based on the
finite element method (FEM) elucidated the underlying
mechanisms of current conduction [13, 14, 16, 20, 23-25],
accelerated the development of new electrode montages [16,
17, 19, 20], and decreased the amount of massive experimental
studies needed to verify the safety of DC stimulations [18].
However, because there has been no open software package
designed to simulate electric fields generated by tDCS, only
a few research groups could use this important technology.
In the present study, we developed a MATLAB toolbox,
COMETS (COMputation of Electric field due to Transcranial
current Stimulation), for simulating local electric fields
generated by tDCS. COMETS has interactive graphical user
interfaces (GUIs), enabling even inexperienced users to
simulate various electrode montages, sizes, and orientations
without coding any MATLAB script. COMETS is based on
an FEM program coded with Fortran 90, which was also
used in our previous tDCS simulation studies [17-19].
Although only a standard human head model is provided in
the current version, advanced users may import their own head
model datasets for their specific purposes. The remainder of
this paper introduces implemented methods and representative
examples of the COMETS toolbox.
METHODS
Overview of the toolbox
COMETS requires a MATLAB environment but does not
need any supplementary MATLAB toolboxes such as the
signal processing toolbox, spline toolbox, or statistical
toolbox. The GUIs of COMETS allow users to intuitively
analyze electric field distributions on the cortical surface
without MATLAB scripting. Users can select various locations
for cathode and anode electrodes and also adjust the size and
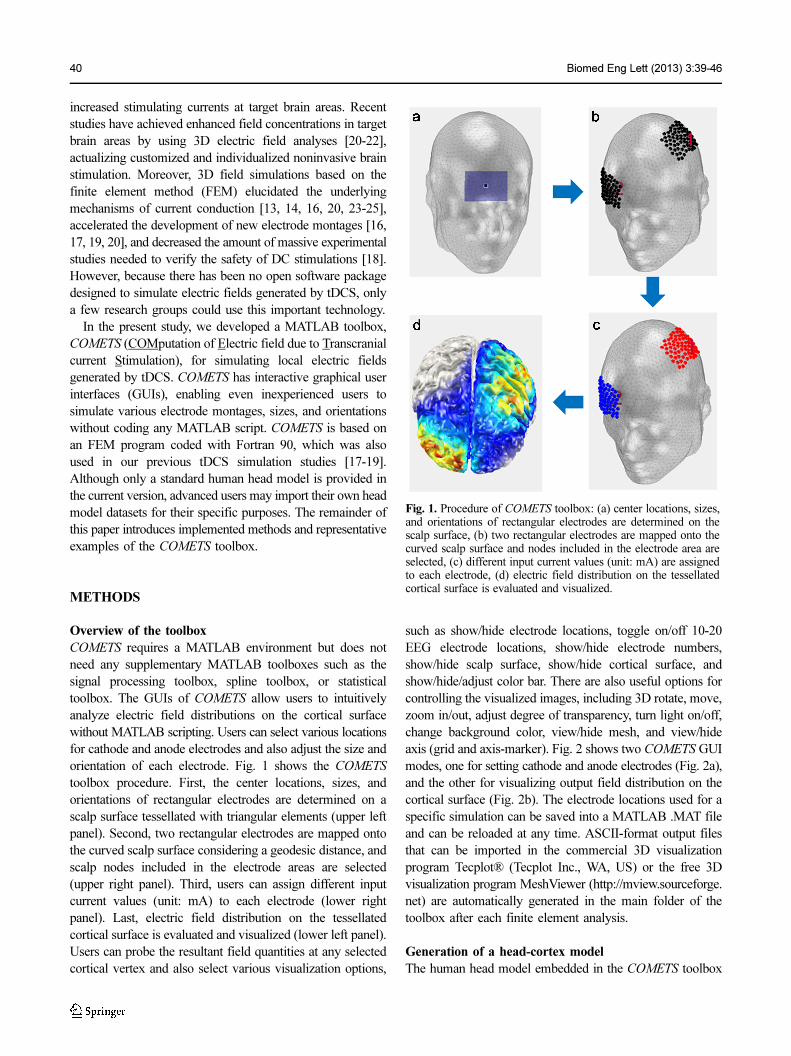
orientation of each electrode. Fig. 1 shows the COMETS
toolbox procedure. First, the center locations, sizes, and
orientations of rectangular electrodes are determined on a
scalp surface tessellated with triangular elements (upper left
panel). Second, two rectangular electrodes are mapped onto
the curved scalp surface considering a geodesic distance, and
scalp nodes included in the electrode areas are selected
(upper right panel). Third, users can assign different input
current values (unit: mA) to each electrode (lower right
panel). Last, electric field distribution on the tessellated
cortical surface is evaluated and visualized (lower left panel).
Users can probe the resultant field quantities at any selected
cortical vertex and also select various visualization options,
such as show/hide electrode locations, toggle on/off 10-20
EEG electrode locations, show/hide electrode numbers,
show/hide scalp surface, show/hide cortical surface, and
show/hide/adjust color bar. There are also useful options for
controlling the visualized images, including 3D rotate, move,
zoom in/out, adjust degree of transparency, turn light on/off,
change background color, view/hide mesh, and view/hide
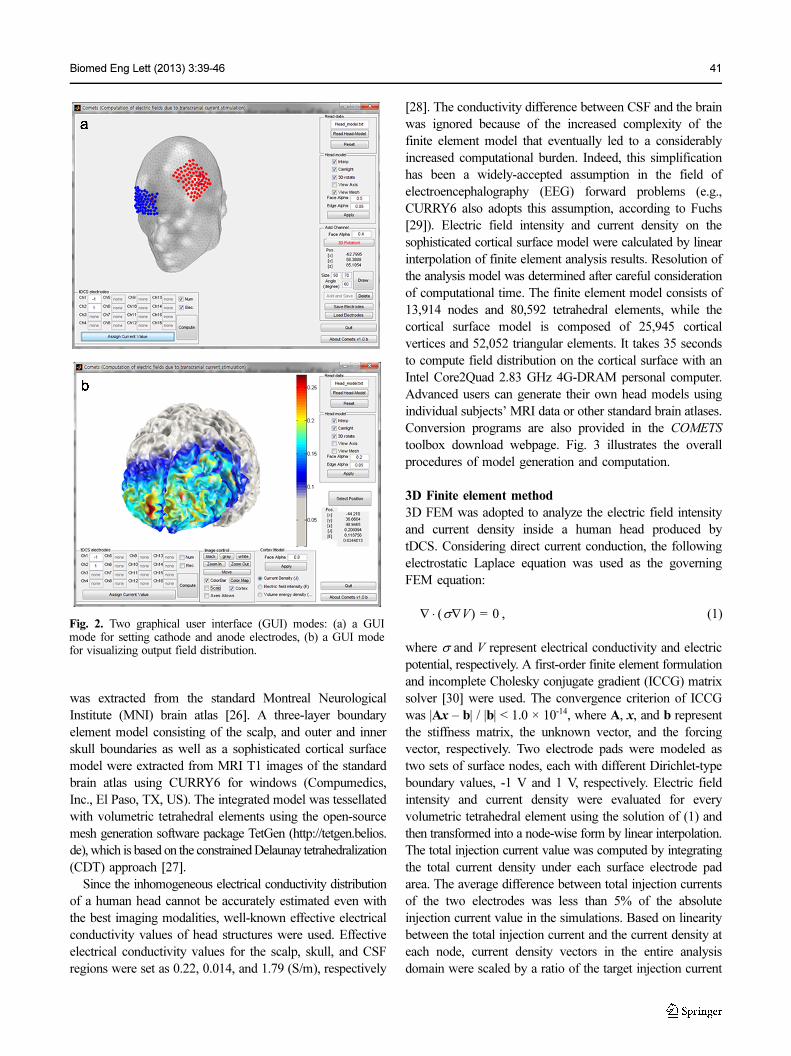
axis (grid and axis-marker). Fig. 2 shows two COMETS GUI
modes, one for setting cathode and anode electrodes (Fig. 2a),
and the other for visualizing output field distribution on the
cortical surface (Fig. 2b). The electrode locations used for a
specific simulation can be saved into a MATLAB .MAT file
and can be reloaded at any time. ASCII-format output files
that can be imported in the commercial 3D visualization
program Tecplot® (Tecplot Inc., WA, US) or the free 3D
visualization program MeshViewer (http://mview.sourceforge.
net) are automatically generated in the main folder of the
toolbox after each finite element analysis.
Generation of a head-cortex model
The human head model embedded in the COMETS toolbox
Fig. 1. Procedure of COMETS toolbox: (a) center locations, sizes,and orientations of rectangular electrodes are determined on thescalp surface, (b) two rectangular electrodes are mapped onto thecurved scalp surface and nodes included in the electrode area areselected, (c) different input current values (unit: mA) are assignedto each electrode, (d) electric field distribution on the tessellatedcortical surface is evaluated and visualized.
Biomed Eng Lett (2013) 3:39-46 41
was extracted from the standard Montreal Neurological
Institute (MNI) brain atlas [26]. A three-layer boundary
element model consisting of the scalp, and outer and inner
skull boundaries as well as a sophisticated cortical surface
model were extracted from MRI T1 images of the standard
brain atlas using CURRY6 for windows (Compumedics,
Inc., El Paso, TX, US). The integrated model was tessellated
with volumetric tetrahedral elements using the open-source
mesh generation software package TetGen (http://tetgen.belios.
de), which is based on the constrained Delaunay tetrahedralization
(CDT) approach [27].
Since the inhomogeneous electrical conductivity distribution
of a human head cannot be accurately estimated even with
the best imaging modalities, well-known effective electrical
conductivity values of head structures were used. Effective
electrical conductivity values for the scalp, skull, and CSF
regions were set as 0.22, 0.014, and 1.79 (S/m), respectively
[28]. The conductivity difference between CSF and the brain
was ignored because of the increased complexity of the
finite element model that eventually led to a considerably
increased computational burden. Indeed, this simplification
has been a widely-accepted assumption in the field of
electroencephalography (EEG) forward problems (e.g.,
CURRY6 also adopts this assumption, according to Fuchs
[29]). Electric field intensity and current density on the
sophisticated cortical surface model were calculated by linear
interpolation of finite element analysis results. Resolution of
the analysis model was determined after careful consideration
of computational time. The finite element model consists of
13,914 nodes and 80,592 tetrahedral elements, while the
cortical surface model is composed of 25,945 cortical
vertices and 52,052 triangular elements. It takes 35 seconds
to compute field distribution on the cortical surface with an
Intel Core2Quad 2.83 GHz 4G-DRAM personal computer.
Advanced users can generate their own head models using
individual subjects’ MRI data or other standard brain atlases.
Conversion programs are also provided in the COMETS
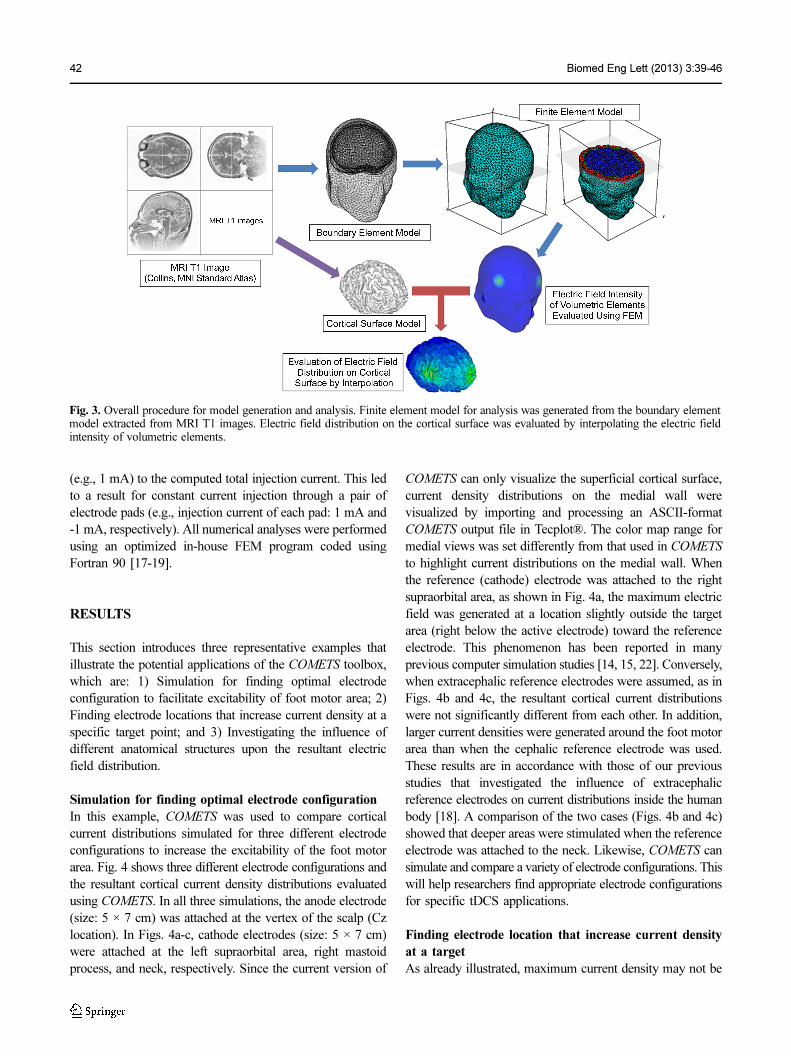
toolbox download webpage. Fig. 3 illustrates the overall
procedures of model generation and computation.
3D Finite element method
3D FEM was adopted to analyze the electric field intensity
and current density inside a human head produced by
tDCS. Considering direct current conduction, the following
electrostatic Laplace equation was used as the governing
FEM equation:
, (1)
where σ and V represent electrical conductivity and electric
potential, respectively. A first-order finite element formulation
and incomplete Cholesky conjugate gradient (ICCG) matrix
solver [30] were used. The convergence criterion of ICCG
was |Ax – b| / |b| < 1.0 × 10⁻¹⁴, where A, x, and b represent
the stiffness matrix, the unknown vector, and the forcing
vector, respectively. Two electrode pads were modeled as
two sets of surface nodes, each with different Dirichlet-type
boundary values, -1 V and 1 V, respectively. Electric field
intensity and current density were evaluated for every
volumetric tetrahedral element using the solution of (1) and
then transformed into a node-wise form by linear interpolation.
The total injection current value was computed by integrating
the total current density under each surface electrode pad
area. The average difference between total injection currents
of the two electrodes was less than 5% of the absolute
injection current value in the simulations. Based on linearity
between the total injection current and the current density at
each node, current density vectors in the entire analysis
domain were scaled by a ratio of the target injection current
∇ σ∇V( )⋅ 0=Fig. 2. Two graphical user interface (GUI) modes: (a) a GUImode for setting cathode and anode electrodes, (b) a GUI modefor visualizing output field distribution.
42 Biomed Eng Lett (2013) 3:39-46
(e.g., 1 mA) to the computed total injection current. This led
to a result for constant current injection through a pair of
electrode pads (e.g., injection current of each pad: 1 mA and
-1 mA, respectively). All numerical analyses were performed
using an optimized in-house FEM program coded using
Fortran 90 [17-19].
RESULTS
This section introduces three representative examples that
illustrate the potential applications of the COMETS toolbox,
which are: 1) Simulation for finding optimal electrode
configuration to facilitate excitability of foot motor area; 2)
Finding electrode locations that increase current density at a
specific target point; and 3) Investigating the influence of
different anatomical structures upon the resultant electric
field distribution.
Simulation for finding optimal electrode configuration
In this example, COMETS was used to compare cortical
current distributions simulated for three different electrode
configurations to increase the excitability of the foot motor
area. Fig. 4 shows three different electrode configurations and
the resultant cortical current density distributions evaluated
using COMETS. In all three simulations, the anode electrode
(size: 5 × 7 cm) was attached at the vertex of the scalp (Cz
location). In Figs. 4a-c, cathode electrodes (size: 5 × 7 cm)
were attached at the left supraorbital area, right mastoid
process, and neck, respectively. Since the current version of
COMETS can only visualize the superficial cortical surface,
current density distributions on the medial wall were
visualized by importing and processing an ASCII-format
COMETS output file in Tecplot®. The color map range for
medial views was set differently from that used in COMETS
to highlight current distributions on the medial wall. When
the reference (cathode) electrode was attached to the right
supraorbital area, as shown in Fig. 4a, the maximum electric
field was generated at a location slightly outside the target
area (right below the active electrode) toward the reference
electrode. This phenomenon has been reported in many
previous computer simulation studies [14, 15, 22]. Conversely,
when extracephalic reference electrodes were assumed, as in
Figs. 4b and 4c, the resultant cortical current distributions
were not significantly different from each other. In addition,
larger current densities were generated around the foot motor
area than when the cephalic reference electrode was used.
These results are in accordance with those of our previous
studies that investigated the influence of extracephalic
reference electrodes on current distributions inside the human
body [18]. A comparison of the two cases (Figs. 4b and 4c)
showed that deeper areas were stimulated when the reference
electrode was attached to the neck. Likewise, COMETS can
simulate and compare a variety of electrode configurations. This
will help researchers find appropriate electrode configurations
for specific tDCS applications.
Finding electrode location that increase current density
at a target
As already illustrated, maximum current density may not be
Fig. 3. Overall procedure for model generation and analysis. Finite element model for analysis was generated from the boundary elementmodel extracted from MRI T1 images. Electric field distribution on the cortical surface was evaluated by interpolating the electric fieldintensity of volumetric elements.
Biomed Eng Lett (2013) 3:39-46 43
formed directly below the active electrode, especially when
two electrodes are located at a close distance [15, 18].
Electric field simulation using COMETS can be utilized to
find electrode locations that increase current density at a
target position. Fig. 5 shows two examples of analysis results
obtained with COMETS. In both simulations, the cathode
electrode was attached at an identical location (right supraorbital
area) using the COMETS “save/load electrode locations”
function. The target cortical area was below the F3 electrode
(international 10-20 system) and roughly corresponded to the
inferior dorsolateral prefrontal cortex (DLPFC). Fig. 5a
shows cortical current density distribution when the anode
electrode was attached at the F3 location according to the
international 10-20 system. Both anode and cathode electrodes
were 5 × 7 cm. As shown in the figure, resultant current
density was mainly distributed between the two electrodes.
Conversely, when an anode electrode was attached at the
FC3 location (middle of F3 and C3), higher current density
was formed around the target position, as shown in Fig. 5b.
Current density values at the target location (marked as a red
dot with a black border line on the cortical surface) were
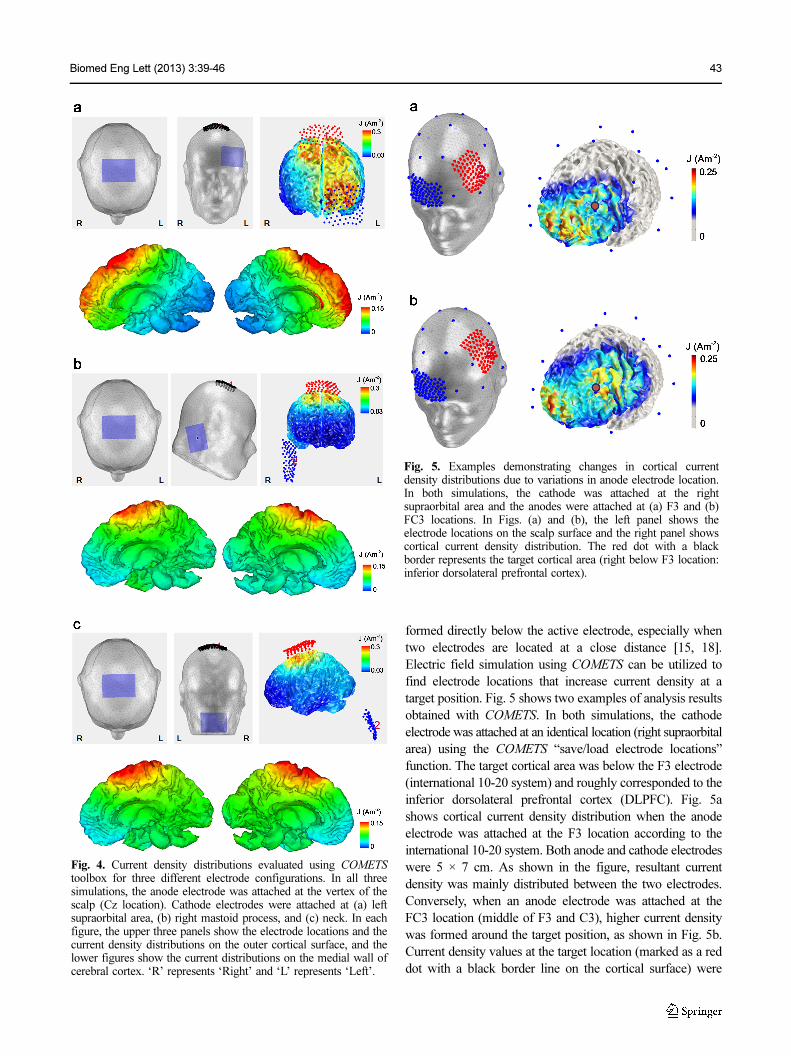
Fig. 4. Current density distributions evaluated using COMETS
toolbox for three different electrode configurations. In all threesimulations, the anode electrode was attached at the vertex of thescalp (Cz location). Cathode electrodes were attached at (a) leftsupraorbital area, (b) right mastoid process, and (c) neck. In eachfigure, the upper three panels show the electrode locations and thecurrent density distributions on the outer cortical surface, and thelower figures show the current distributions on the medial wall ofcerebral cortex. ‘R’ represents ‘Right’ and ‘L’ represents ‘Left’.
Fig. 5. Examples demonstrating changes in cortical currentdensity distributions due to variations in anode electrode location.In both simulations, the cathode was attached at the rightsupraorbital area and the anodes were attached at (a) F3 and (b)FC3 locations. In Figs. (a) and (b), the left panel shows theelectrode locations on the scalp surface and the right panel showscortical current density distribution. The red dot with a blackborder represents the target cortical area (right below F3 location:inferior dorsolateral prefrontal cortex).
44 Biomed Eng Lett (2013) 3:39-46
probed using the “probing values at a specific location”
function. The current density of the first case (anode at F3)
was 0.163 A/m2, whereas that of the second case (anode at
FC3) was 0.186 A/m2. This shows that an anode electrode
attached at FC3 can transmit more direct currents to the
cortical area below the F3 location than an electrode attached
directly at the F3 location. This example demonstrates how
COMETS can be used to find an electrode location that
increases the transmitted current at specific target locations.
Influence of anatomy on electric field distribution
Recent advances in modeling and computational methods
have enabled customized and individualized transcranial DC
stimulations, as shown in a recent review article by Bikson
[31]. COMETS can import individual head-cortex models
generated using external modeling software. In the current
version, COMETS can only import finite element head
models generated using TetGen and cortical surface models
exported from CURRY6 or CURRY7. In a later version,
more head-cortex model variety could be incorporated based
on user requests. Fig. 6 shows examples of field analysis
results obtained from COMETS, in which analysis models
were generated from MRI T1 data of two healthy subjects
(both males, 22 and 21 years old) who participated in a
simple tDCS experiment. The experiments were performed
in the rehabilitation department of Samsung Medical Center
in Korea. Participants provided written consent, and the
Samsung Medical Center Institutional Review Board (IRB)
approved the study protocol. Participants underwent a 3-back
verbal working memory task [32] before and after a 20-min
tDCS session. In the experiments, the cathode electrode was
attached at the right supraorbital area and the anode electrode
was attached at the F3 location because the target cortical
region was the left DLPFC. The F3 location was determined
using CURRY6 software and imported to COMETS. The
cortical current density distributions of both models showed
clear differences, particularly around the left DLPFC area.
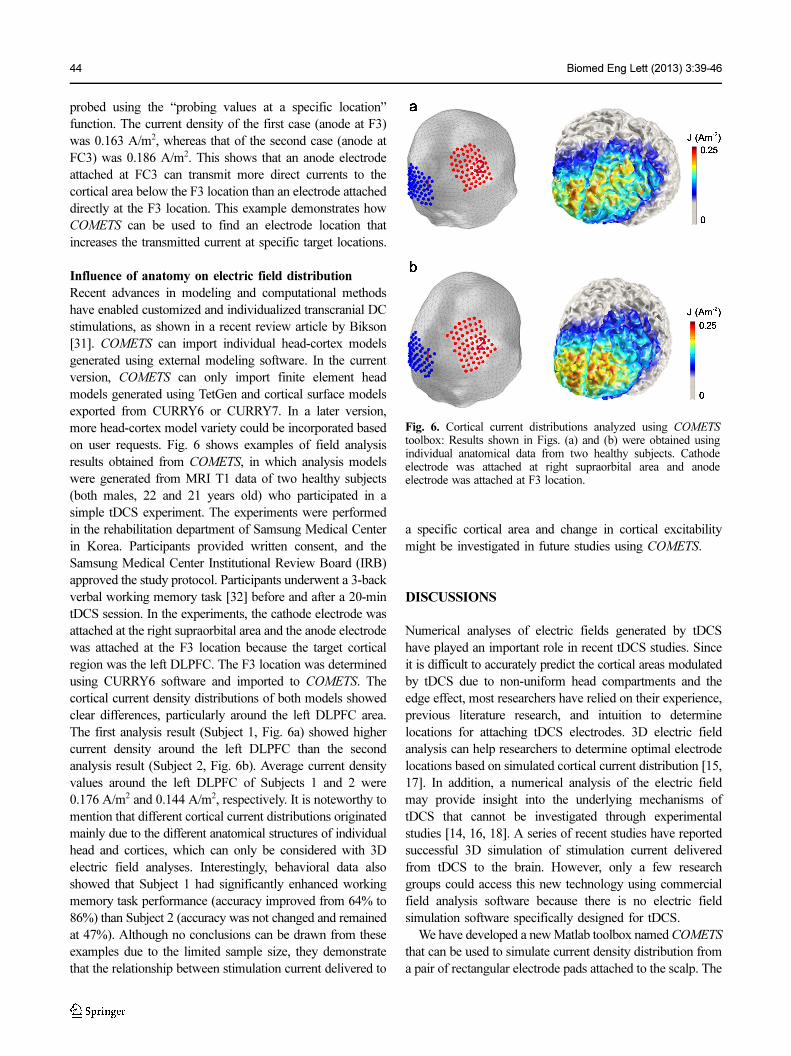
The first analysis result (Subject 1, Fig. 6a) showed higher
current density around the left DLPFC than the second
analysis result (Subject 2, Fig. 6b). Average current density
values around the left DLPFC of Subjects 1 and 2 were
0.176 A/m2 and 0.144 A/m2, respectively. It is noteworthy to
mention that different cortical current distributions originated
mainly due to the different anatomical structures of individual
head and cortices, which can only be considered with 3D
electric field analyses. Interestingly, behavioral data also
showed that Subject 1 had significantly enhanced working
memory task performance (accuracy improved from 64% to
86%) than Subject 2 (accuracy was not changed and remained
at 47%). Although no conclusions can be drawn from these
examples due to the limited sample size, they demonstrate
that the relationship between stimulation current delivered to
a specific cortical area and change in cortical excitability
might be investigated in future studies using COMETS.
DISCUSSIONS
Numerical analyses of electric fields generated by tDCS
have played an important role in recent tDCS studies. Since
it is difficult to accurately predict the cortical areas modulated
by tDCS due to non-uniform head compartments and the
edge effect, most researchers have relied on their experience,
previous literature research, and intuition to determine
locations for attaching tDCS electrodes. 3D electric field
analysis can help researchers to determine optimal electrode
locations based on simulated cortical current distribution [15,
17]. In addition, a numerical analysis of the electric field
may provide insight into the underlying mechanisms of
tDCS that cannot be investigated through experimental
studies [14, 16, 18]. A series of recent studies have reported
successful 3D simulation of stimulation current delivered
from tDCS to the brain. However, only a few research
groups could access this new technology using commercial
field analysis software because there is no electric field
simulation software specifically designed for tDCS.
We have developed a new Matlab toolbox named COMETS
that can be used to simulate current density distribution from
a pair of rectangular electrode pads attached to the scalp. The
Fig. 6. Cortical current distributions analyzed using COMETS
toolbox: Results shown in Figs. (a) and (b) were obtained usingindividual anatomical data from two healthy subjects. Cathodeelectrode was attached at right supraorbital area and anodeelectrode was attached at F3 location.
Biomed Eng Lett (2013) 3:39-46 45
friendly interface of COMETS allows even novice MATLAB
users to access various functions. As demonstrated in a series
of examples, COMETS can be utilized to simulate various
electrode configurations and to find optimal electrode locations
that increase current density at a target cortical region. In
addition, advanced users can use the individual head-cortex
model for their research purposes. COMETS can also be
used to educate practitioners about the cortical current
distributions delivered from tDCS electrodes.
Although advanced users can import their own head-
cortex models to COMETS, the originally embedded standard
head-cortex model does not have sufficiently high spatial
resolution. The main reason for this rather simplified head
model was to reduce the overall computational time required
for practical applications. In the current version, COMETS
cannot be used to analyze local electric fields in deep brain
structures [33] or to simulate current distributions when skull
defects or lesion sites are present in the analysis model [16].
COMETS also does not include the sponge (electrode) layer
in the analysis domain because new finite element models
must be generated for different electrode configurations due
to altered model geometry. If new finite element models
need to be generated at every simulation, the potential
applications of COMETS shown in this article might not be
possible in practice. Since the sponge layer passively delivers
currents from the electrodes to the scalp, the normalized
distributions of cortical stimulation currents are not affected
by omitting this layer. However, absolute cortical current
density values would be slightly decreased when the sponge
layer (electrical conductivity of this layer is generally assumed
to be 1.4 S/m) is included in the analysis domain. Although
the resolution and complexity of analysis models do not
always equate with clinical values [34], we will consider
adopting more options for simulating high-resolution head-
cortex models for refined research purposes in future versions
of COMETS.
New functions will be also adopted in future versions of
COMETS. Recently, some research groups have tried to
simultaneously stimulate multiple cortical areas using multiple
tDCS channels (e.g., http://neuroelectrics.com/about_tdcs/
tcs-multi-channel-use). This function will be considered in
the next version of COMETS. Because the COMETS toolbox
is executed in a Matlab environment, visualization of the
resultant cortical current distributions is rather slow and
its function is limited. The next version of COMETS will
incorporate an independent post-processing program coded
with C++ and OpenGL for enhanced visualization of cortical
current distribution.
The COMETS toolbox can be downloaded for free
from the title page of the Computational Neuroengineering
Laboratory in Hanyang University (http://cone.hanyang.ac.kr)
or from http://www.COMETStool.com for non-commercial
and academic uses. The toolbox can only be used for
research and education purposes, not for medical purposes.
A manual describing the details of toolbox use is included on
the download page. We invite users to provide feedback for
improving the toolbox by emailing [email protected].
We hope that our toolbox can contribute to popularizing the
numerical analysis of cortical stimulation current in the field
of noninvasive electrical brain stimulation.
ACKNOWLEDGEMENTS
This work was supported by the National Research Foundation
of Korea (NRF) grant funded by the Korean government
(MEST) (No. 2011-0017884).
CONFLICT OF INTEREST STATEMENTS
Jung YJ declares that s/he has no conflict of interest in
relation to the work in this article. Kim JH declares that s/he
has no conflict of interest in relation to the work in this
article. Im CH declares that s/he has no conflict of interest in
relation to the work in this article.
REFERENCES
[1] Antal A, Kincses TZ, Nitsche MA, Bartfai O, Paulus W.Excitability changes induced in the human primary visual cortexby transcranial direct current stimulation: direct electrophysiologicalevidence invest. Ophthalmol Vis Sci. 2004; 45:702-7.
[2] Fregni F, Boggio PS, Nitsche M, Pascual-Leone A. Transcranialdirect current stimulation. Brit J Psychiat. 2005; 186:446-7.
[3] Nitsche MA, Doemkes S, Karakose T, Antal A, Liebetanz D,Lang N, Tergau F, Paulus W. Shaping the effects of transcranialdirect current stimulation of the human motor cortex.Neurophysiol. 2007; 97:3109-17.
[4] Williams JA, Imamura M, Fregni F. Updates on the use of non-invasive brain stimulation in physical and rehabilitationmedicine. J Rehabil Med. 2009; 41:305-11.
[5] Kincses TZ, Antal A, Nitsche MA, Bartfai O, Paulus W.Facilitation of probabilistic classification learning bytranscranial direct current stimulation of the prefrontal cortex inthe human. Neuropsychologia. 2004; 42:113-7.
[6] Nitsche MA, Cohen LG, Wassermann EM, Priori A, Lang N,Antal A, Paulus W, Hummel F, Boggio PS, Fregni F, Pascual-Leone A. Transcranial direct current stimulation: state of the art2008. Brain Stimul. 2008; 1:206-23.
[7] Boggio PS, Nunes A, Rigonatti SP, Nitsche MA, Pascual-LeoneA, Fregni F. Repeated sessions of noninvasive brain DCstimulation is associated with motor function improvement instroke patients restor. Neurol Neurosci. 2007; 25:123-9.
[8] Schlaug G, Renga V, Nair D. Transcranial direct currentstimulation in stroke recovery. Arch Neurol. 2008; 65:1571-6.
[9] Nitsche MA, Boggio PS, Fregni F, Pascual-Leone A. Treatmentof depression with transcranial direct current stimulation(tDCS): a review. Exp Neurol. 2009; 219:14-9.
46 Biomed Eng Lett (2013) 3:39-46
[10] Fregni F, Thome-Souza S, Nitsche MA, Freedman SD, ValenteKD, Pascual-Leone A. A controlled clinical trial of cathodal DCpolarization in patients with refractory epilepsy. Epilepsia. 2006;47:335-42.
[11] Fregni F, Freedman S, Pascual-Leone A. Recent advances in thetreatment of chronic pain with non-invasive brain stimulationtechniques. Lancet Neurol. 2007; 6:188-91.
[12] Ferrucci R, Mameli F, Guidi I, Mrakic-Sposta S, Vergari M,Marceglia S, Cogiamanian F, Barbieri S, Scarpini E, Priori A.Transcranial direct current stimulation improves recognitionmemory in alzheimer disease. Neurol. 2008; 71:493-8.
[13] Miranda PC, Lomarev M, Hallett M. Modeling the currentdistribution during transcranial direct current stimulation. J ClinNeurophysiol. 2006; 117:1623-9.
[14] Wagner T, Fregni F, Fecteau S, Grodzinsky A, Zahn M, Pascual-Leone A. Transcranial direct current stimulation: a computer-based human model study. NeuroImage. 2007; 35:1113-24.
[15] Datta A, Bansal V, Diaz J, Patel J, Reato D, Bikson M. Gyri-precise head model of transcranial direct current stimulation:improved spatial focality using a ring electrode versusconventional rectangular pad. Brain Stimul. 2009; 2:201-7.
[16] Datta A, Bikson M, Fregni F. Transcranial direct currentstimulation in patients with skull defects and skull plates: high-resolution computational FEM study of factors altering corticalcurrent flow. NeuroImage. 2010; 52:1268-78.
[17] Im CH, Jung HH, Choi JD, Jung KY, Lee SY. Determination ofoptimal electrode positions for transcranial direct currentstimulation (tDCS). Phys Med Biol. 2008; 53:N219-25.
[18] Im CH, Park JH, Shim M, Chang WH, Kim YH. Evaluation oflocal electric fields generated by transcranial direct currentstimulation (tDCS) with an extracephalic reference electrodebased on realistic 3D body modeling. Phys Med Biol. 2012;57:2137-50.
[19] Park JH, Hong SB, Kim DW, Suh M, Im CH. A novel array-type transcranial direct current stimulation (tDCS) system foraccurate focusing on targeted brain areas. IEEE T Magn. 2011;47:882-5.
[20] Dmochowski JP, Datta A, Bikson M, Su Y, Parra LC. Optimizedmulti-electrode stimulation increases focality and intensity attarget. J Neural Eng. 2011; 8:046011.
[21] Halko MA, Datta A, Plow EB, Scaturro J, Bikson M, MerabetLB. Neuroplastic changes flowing rehabilitative trainingcorrelate with regional electrical field induced with tDCS.
NeuroImage. 2011; 57:885-91.[22] Mendonca ME, Santana MB, Baptista AF, Datta A, Bikson M,
Fregni F, Araujo CP. Transcranial DC stimulation infibromyalgia: optimized cortical target supported by high-resolution computational models. J Pain. 2011; 12:610-7.
[23] Miranda PC, Correia L, Salvador R and Basser PJ. Tissueheterogeneity as a mechanism for localized neural stimulationby applied electric fields. Phys Med Biol. 2007; 52:5603-17.
[24] Holdefer RN, Sadleir R, Russell MJ. Predicted current densitiesin the brain during transcranial electrical stimulation. J ClinNeurophysiol. 2006; 117:1388-97.
[25] Sadleir RJ, Vannorsdall TD, Schretlen DJ, Gordon B.Transcranial direct current stimulation (tDCS) in a realistic headmodel. NeuroImage. 2010; 51:1310-8.
[26] Collins DL, Neelin P, Peters TM, Evans AC. Automatic 3Dintersubject registration of MR volumetric data in standardizedtalairach space. J Comput Assist Tomo. 1994; 18:192-205.
[27] Si H. Adaptive tetrahedral mesh generation by constraineddelaunay refinement. Int J Numer Meth Eng. 2008; 75:856-80.
[28] Haueisen J, Ramon C, Eiselt M, Brauer H, Nowak H. Influenceof tissue resistivities on neuromagnetic fields and electricpotentials studied with a finite element model of the head. IEEET Bio-Med Eng. 1997; 44:727-35.
[29] Fuchs M, Wagner M, Kohler T, Wischmann H-A. Linear andnonlinear current density reconstructions. J Clin Neurophysiol.1999; 16:267-95.
[30] Jin J. The finite element method in electromagnetics. 2nd Ed.New York: John Wiley & Sons; 2002.
[31] Bikson M, Rahman A, Datta A, Fregni F, Merabet L. High-resolution modeling assisted design of customized andindividualized transcranial direct current stimulation protocols.Nueromodulation. 2012; 15:306-15.
[32] Owen AM, McMillan KM, Laird AR, Bullmore E. N-backworking memory paradigm: a meta-analysis of normativefunctional neuroimaging studies. Hum Brain Mapp. 2005;25:46-59.
[33] Dasilva AF, Mendonca ME, Zaghi S, Lopes M, Dossantos MF,Spierings EL, Bajwa Z, Datta A, Bikson M, Fregni F. tDCS-Induced analgesia and electrical fields in pain-related neuralnetworks in chronic migraine. Headache. 2012; 52:1283-95.
[34] Bikson M, Datta A. Guidelines for precise and accuratecomputational models of tDCS. Brain Stimul. 2012; 5:430-1.