Embed Size (px)
Citation preview
Hemodynamic responses in rat brain during transcranial direct current stimulation: a
functional near-infrared spectroscopy study Chang-Hee Han,1,3 Hyuna Song,2,3 Yong-Guk Kang,2 Beop-Min Kim,2,4
and Chang-Hwan Im1,* 1Department of Biomedical Engineering, Hanyang University, Wangsimni-ro, Seongdong-gu, Seoul, 133-791, South
Korea 2Department of Biomedical Engineering, Korea University, Jeongneung 3-dong, Seongbuk-ku, Seoul, 136-703, South
Korea 3Equally contributed to this study
[email protected] *[email protected]
Abstract: In the present study, we monitored hemodynamic responses in rat brains during transcranial direct current stimulation (tDCS) using functional near-infrared spectroscopy (fNIRS). Seven rats received transcranial anodal stimulation with 200 μA direct current (DC) on their right barrel cortex for 10 min. The concentration changes of oxygenated hemoglobin (oxy-Hb) were continuously monitored during stimulation (10 min) and after stimulation (20 min). The trend of hemodynamic response changes was modeled using linear regression, and the relationship between incremental and decremental rates of oxy-Hb was investigated by correlation analysis. Our results showed that the oxy-Hb concentration was almost linearly increased and decreased during and after stimulation, respectively. In addition, a significant negative correlation (p < 0.05) was found between the rate of increase of oxy-Hb during stimulation and the rate of decrease of oxy-Hb after stimulation, indicating that the recovery time after tDCS may not depend on the total amount of hemodynamic changes in the stimulated brain area. Our results also demonstrated considerable individual variability in the rate of change of hemodynamic responses even with the same direct current dose to identical brain regions. This suggests that individual differences in tDCS after-effects may originate from intrinsic differences in the speed of DC stimulation “uptake” rather than differences in the total capacity of DC uptake, and thus the stimulation parameters may need to be customized for each individual in order to maximize tDCS after-effects.
©2014 Optical Society of America
OCIS codes: (170.0170) Medical optics and biotechnology; (170.2655) Functional monitoring and imaging; (170.6510) Spectroscopy, tissue diagnostics.
References and links 1. M. A. Nitsche and W. Paulus, “Excitability changes induced in the human motor cortex by weak transcranial
direct current stimulation,” J. Physiol. 527(3), 633–639 (2000). 2. A. Antal, T. Z. Kincses, M. A. Nitsche, O. Bartfai, and W. Paulus, “Excitability changes induced in the human
primary visual cortex by transcranial direct current stimulation: direct electrophysiological evidence,” Invest. Ophthalmol. Vis. Sci. 45, 702–707 (2004).
3. F. Fregni, P. S. Boggio, M. Nitsche, and A. Pascual-Leone, “Transcranial direct current stimulation,” Br. J. Psychiatry 186(5), 446–447 (2005).
4. T. Wagner, A. Valero-Cabre, and A. Pascual-Leone, “Noninvasive human brain stimulation,” Annu. Rev. Biomed. Eng. 9(1), 527–565 (2007).
#207498 - $15.00 USD Received 5 Mar 2014; revised 18 Apr 2014; accepted 21 Apr 2014; published 13 May 2014(C) 2014 OSA 1 June 2014 | Vol. 5, No. 6 | DOI:10.1364/BOE.5.001812 | BIOMEDICAL OPTICS EXPRESS 1812
5. M. A. Nitsche, L. G. Cohen, E. M. Wassermann, A. Priori, N. Lang, A. Antal, W. Paulus, F. Hummel, P. S. Boggio, F. Fregni, and A. Pascual-Leone, “Transcranial direct current stimulation: state of the art 2008,” Brain Stimulat. 1(3), 206–223 (2008).
6. A. Priori, “Brain polarization in humans: a reappraisal of an old tool for prolonged non-invasive modulation of brain excitability,” Clin. Neurophysiol. 114(4), 589–595 (2003).
7. J. A. Williams, M. Imamura, and F. Fregni, “Updates on the use of non-invasive brain stimulation in physical and rehabilitation medicine,” J. Rehabil. Med. 41(5), 305–311 (2009).
8. P. C. Gandiga, F. C. Hummel, and L. G. Cohen, “Transcranial DC stimulation (tDCS): a tool for double-blind sham-controlled clinical studies in brain stimulation,” Clin. Neurophysiol. 117(4), 845–850 (2006).
9. M. A. Nitsche, P. S. Boggio, F. Fregni, and A. Pascual-Leone, “Treatment of depression with transcranial direct current stimulation (tDCS): a review,” Exp. Neurol. 219(1), 14–19 (2009).
10. F. Fregni, S. Freedman, and A. Pascual-Leone, “Recent advances in the treatment of chronic pain with non-invasive brain stimulation techniques,” Lancet Neurol. 6(2), 188–191 (2007).
11. A. Mignon, V. Laudenbach, F. Guischard, A. Limoge, J.-M. Desmonts, and J. Mantz, “Transcutaneous cranial electrical stimulation (Limoge’s currents) decreases early buprenorphine analgesic requirements after abdominal surgery,” Anesth. Analg. 83(4), 771–775 (1996).
12. P. S. Boggio, A. Nunes, S. P. Rigonatti, M. A. Nitsche, A. Pascual-Leone, and F. Fregni, “Repeated sessions of noninvasive brain DC stimulation is associated with motor function improvement in stroke patients,” Restor. Neurol. Neurosci. 25(2), 123–129 (2007).
13. P. S. Boggio, R. Ferrucci, S. P. Rigonatti, P. Covre, M. Nitsche, A. Pascual-Leone, and F. Fregni, “Effects of transcranial direct current stimulation on working memory in patients with Parkinson’s disease,” J. Neurol. Sci. 249(1), 31–38 (2006).
14. B. A. Coffman, M. C. Trumbo, and V. P. Clark, “Enhancement of object detection with transcranial direct current stimulation is associated with increased attention,” BMC Neurosci. 13(1), 108 (2012).
15. T. U. Hauser, S. Rotzer, R. H. Grabner, S. Mérillat, and L. Jäncke, “Enhancing performance in numerical magnitude processing and mental arithmetic using transcranial Direct Current Stimulation (tDCS),” Front Hum. Neurosci. 7, 244 (2013).
16. Y. H. Kwon, M.-H. Ko, S. H. Ahn, Y.-H. Kim, J. C. Song, C.-H. Lee, M. C. Chang, and S. H. Jang, “Primary motor cortex activation by transcranial direct current stimulation in the human brain,” Neurosci. Lett. 435(1), 56–59 (2008).
17. A. C. Merzagora, G. Foffani, I. Panyavin, L. Mordillo-Mateos, J. Aguilar, B. Onaral, and A. Oliviero, “Prefrontal hemodynamic changes produced by anodal direct current stimulation,” Neuroimage 49(3), 2304–2310 (2010).
18. D. Wachter, A. Wrede, W. Schulz-Schaeffer, A. Taghizadeh-Waghefi, M. A. Nitsche, A. Kutschenko, V. Rohde, and D. Liebetanz, “Transcranial direct current stimulation induces polarity-specific changes of cortical blood perfusion in the rat,” Exp. Neurol. 227(2), 322–327 (2011).
19. X. Zheng, D. C. Alsop, and G. Schlaug, “Effects of transcranial direct current stimulation (tDCS) on human regional cerebral blood flow,” Neuroimage 58(1), 26–33 (2011).
20. Y.-J. Jung, J.-H. Kim, D. Kim, and C.-H. Im, “An image-guided transcranial direct current stimulation system: a pilot phantom study,” Physiol. Meas. 34(8), 937–950 (2013).
21. D. Liebetanz, R. Koch, S. Mayenfels, F. König, W. Paulus, and M. A. Nitsche, “Safety limits of cathodal transcranial direct current stimulation in rats,” Clin. Neurophysiol. 120(6), 1161–1167 (2009).
22. P. Minhas, A. Datta, and M. Bikson, “Cutaneous perception during tDCS: role of electrode shape and sponge salinity,” Clin. Neurophysiol. 122(4), 637–638 (2011).
23. G. Paxinos and C. Watson, The Rat Brain in Stereotaxic Coordinates: Hard Cover Edition (Access Online via Elsevier, 2006).
24. G. Strangman, M. A. Franceschini, and D. A. Boas, “Factors affecting the accuracy of near-infrared spectroscopy concentration calculations for focal changes in oxygenation parameters,” Neuroimage 18(4), 865–879 (2003).
25. Q. L. Yao, H.-Y. Zhang, B. B. Nie, F. Fang, Y. Jiao, and G.-J. Teng, “MRI assessment of amplitude of low-frequency fluctuation in rat brains with acute cerebral ischemic stroke,” Neurosci. Lett. 509(1), 22–26 (2012).
26. J. Tanabe, D. Miller, J. Tregellas, R. Freedman, and F. G. Meyer, “Comparison of detrending methods for optimal fMRI preprocessing,” Neuroimage 15(4), 902–907 (2002).
27. S. Slobounov, J. Johnston, H. Chiang, and W. Ray, “Movement-related EEG potentials are force or end-effector dependent: evidence from a multi-finger experiment,” Clin. Neurophysiol. 113(7), 1125–1135 (2002).
28. C. Calmels, M. Hars, P. Holmes, G. Jarry, and C. J. Stam, “Non-linear EEG synchronization during observation and execution of simple and complex sequential finger movements,” Exp. Brain Res. 190(4), 389–400 (2008).
29. H. Yamaguchi, H. Yamauchi, S. Hazama, H. Hamamoto, and N. Inoue, “Correlation between cerebral oxygen metabolism and cerebral blood flow simultaneously measured before and after acetazolamide administration,” J. Biomed. Opt. 4(4), 418–423 (1999).
30. V. G. Duffy, Brain Advances in Human Aspects of Healthcare (CRC Press, 2012), Chap. 53. 31. C. K. Loo, A. Alonzo, D. Martin, P. B. Mitchell, V. Galvez, and P. Sachdev, “Transcranial direct current
stimulation for depression: 3-week, randomised, sham-controlled trial,” Br. J. Psychiatry 200(1), 52–59 (2012). 32. K. Weltman and M. Lavidor, “Modulating lexical and semantic processing by transcranial direct current
stimulation,” Exp. Brain Res. 226(1), 121–135 (2013).
#207498 - $15.00 USD Received 5 Mar 2014; revised 18 Apr 2014; accepted 21 Apr 2014; published 13 May 2014(C) 2014 OSA 1 June 2014 | Vol. 5, No. 6 | DOI:10.1364/BOE.5.001812 | BIOMEDICAL OPTICS EXPRESS 1813
33. Á. Foerster, S. Rocha, C. Wiesiolek, A. P. Chagas, G. Machado, E. Silva, F. Fregni, and K. Monte-Silva, “Site-specific effects of mental practice combined with transcranial direct current stimulation on motor learning,” Eur. J. Neurosci. 37(5), 786–794 (2013).
34. U. Palm, C. Schiller, Z. Fintescu, M. Obermeier, D. Keeser, E. Reisinger, O. Pogarell, M. A. Nitsche, H.-J. Möller, and F. Padberg, “Transcranial direct current stimulation in treatment resistant depression: a randomized double-blind, placebo-controlled study,” Brain Stimulat. 5(3), 242–251 (2012).
35. A. Datta, V. Bansal, J. Diaz, J. Patel, D. Reato, and M. Bikson, “Gyri-precise head model of transcranial direct current stimulation: improved spatial focality using a ring electrode versus conventional rectangular pad,” Brain Stimulat. 2(4), 201–207 (2009).
36. M. E. Mendonca, M. B. Santana, A. F. Baptista, A. Datta, M. Bikson, F. Fregni, and C. P. Araujo, “Transcranial DC stimulation in fibromyalgia: optimized cortical target supported by high-resolution computational models,” J. Pain 12(5), 610–617 (2011).
1. Introduction
Transcranial direct current stimulation (tDCS) is a noninvasive brain electrical stimulation technique that modulates cortical excitability with a small direct current (DC) flowing between a pair of scalp electrodes [1]. Since tDCS can effectively facilitate or inhibit cortical excitability of specific brain areas by controlling the direction of stimulating current [2–4], it has recently attracted increased attention from the neuroscience society. tDCS has several advantages over other neuromodulation modalities such as deep brain stimulation (DBS) and transcranial magnetic stimulation (TMS) in that it is cheap, non-invasive, painless, portable, and safe [5–8]. Several experimental studies have demonstrated that tDCS can be potentially used for the treatment of various neuropsychiatric diseases and neurological disorders including depression, anxiety, Parkinson’s disease, epilepsy, tinnitus, and chronic pain [9–12]. Furthermore, some recent studies have shown that tDCS could temporarily enhance cognitive functions such as working memory, performance of mental calculation, and attention in both patients and healthy people [13–15].
Although several studies have reported positive effects of tDCS, most of them focused only on the behavioral and/or functional changes after the end of stimulation [9–15]. Considering that the exact underlying mechanisms of tDCS have not yet been clearly revealed despite extensive experimental studies, observing the neural responses during tDCS might help to address some issues related to the working mechanisms of tDCS, e.g., is the inter-individual variability of tDCS after-effects due to intrinsic biological characteristics of each individual or due to anatomical differences of individual brains? Although some previous studies have observed neural signal changes in response to tDCS, they did not record neural signals continuously and simultaneously during tDCS. For example, Kwon et al. observed hemodynamic response changes during anodal tDCS using interleaved functional magnetic resonance imaging (fMRI) scanning, and found that hemodynamic response changes occurred at least 1 min after DC stimulation onset [16]. Although they observed blood oxygenation-level dependent (BOLD) signal changes during tDCS, they did not measure changes in neural activity after 1 min. More recently, Merzagora et al. [17] and Wachter et al. [18] used functional near-infrared spectroscopy (fNIRS) and laser Doppler flowmetry (LDF), respectively, to observe hemodynamic changes produced by anodal tDCS, but they also did not simultaneously record hemodynamic changes during tDCS. Both studies observed temporal changes in oxygenated hemoglobin (oxy-Hb) or cerebral blow flow (CBF) after tDCS. To the best of our knowledge, only one study done by Zheng et al. [19] recorded regional CBF (rCBF) changes simultaneously during tDCS using Arterial Spin Labeling (ASL). This previous study reported increased rCBF during anodal tDCS and decreased rCBF during cathodal tDCS. However, they did not show continuous temporal changes of rCBF due to the long acquisition time for ASL scan (only two images could be acquired during the tDCS ‘ON’ period).
#207498 - $15.00 USD Received 5 Mar 2014; revised 18 Apr 2014; accepted 21 Apr 2014; published 13 May 2014(C) 2014 OSA 1 June 2014 | Vol. 5, No. 6 | DOI:10.1364/BOE.5.001812 | BIOMEDICAL OPTICS EXPRESS 1814
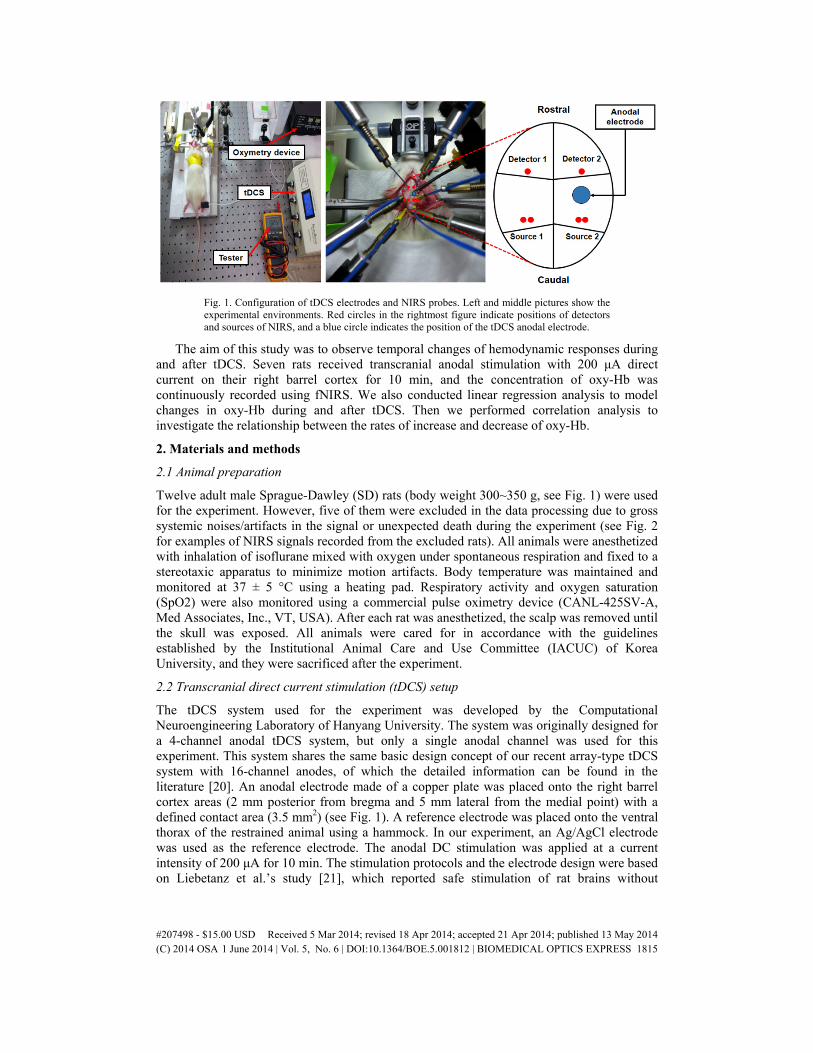
Fig. 1. Configuration of tDCS electrodes and NIRS probes. Left and middle pictures show the experimental environments. Red circles in the rightmost figure indicate positions of detectors and sources of NIRS, and a blue circle indicates the position of the tDCS anodal electrode.
The aim of this study was to observe temporal changes of hemodynamic responses during and after tDCS. Seven rats received transcranial anodal stimulation with 200 μA direct current on their right barrel cortex for 10 min, and the concentration of oxy-Hb was continuously recorded using fNIRS. We also conducted linear regression analysis to model changes in oxy-Hb during and after tDCS. Then we performed correlation analysis to investigate the relationship between the rates of increase and decrease of oxy-Hb.
2. Materials and methods
2.1 Animal preparation
Twelve adult male Sprague-Dawley (SD) rats (body weight 300~350 g, see Fig. 1) were used for the experiment. However, five of them were excluded in the data processing due to gross systemic noises/artifacts in the signal or unexpected death during the experiment (see Fig. 2 for examples of NIRS signals recorded from the excluded rats). All animals were anesthetized with inhalation of isoflurane mixed with oxygen under spontaneous respiration and fixed to a stereotaxic apparatus to minimize motion artifacts. Body temperature was maintained and monitored at 37 ± 5 °C using a heating pad. Respiratory activity and oxygen saturation (SpO2) were also monitored using a commercial pulse oximetry device (CANL-425SV-A, Med Associates, Inc., VT, USA). After each rat was anesthetized, the scalp was removed until the skull was exposed. All animals were cared for in accordance with the guidelines established by the Institutional Animal Care and Use Committee (IACUC) of Korea University, and they were sacrificed after the experiment.
2.2 Transcranial direct current stimulation (tDCS) setup
The tDCS system used for the experiment was developed by the Computational Neuroengineering Laboratory of Hanyang University. The system was originally designed for a 4-channel anodal tDCS system, but only a single anodal channel was used for this experiment. This system shares the same basic design concept of our recent array-type tDCS system with 16-channel anodes, of which the detailed information can be found in the literature [20]. An anodal electrode made of a copper plate was placed onto the right barrel cortex areas (2 mm posterior from bregma and 5 mm lateral from the medial point) with a defined contact area (3.5 mm2) (see Fig. 1). A reference electrode was placed onto the ventral thorax of the restrained animal using a hammock. In our experiment, an Ag/AgCl electrode was used as the reference electrode. The anodal DC stimulation was applied at a current intensity of 200 μA for 10 min. The stimulation protocols and the electrode design were based on Liebetanz et al.’s study [21], which reported safe stimulation of rat brains without
#207498 - $15.00 USD Received 5 Mar 2014; revised 18 Apr 2014; accepted 21 Apr 2014; published 13 May 2014(C) 2014 OSA 1 June 2014 | Vol. 5, No. 6 | DOI:10.1364/BOE.5.001812 | BIOMEDICAL OPTICS EXPRESS 1815
generation of lesions. They reported that brain lesions were not generated at a current density smaller than 142.9 A/m2 when rats were stimulated for less than 10 minutes. We determined the stimulation current intensity (200 μA) considering the contact area of an anodal electrode (3.5 mm2) and the stimulation duration (10-min). We set the average current density to be about a third of the safety limit considering the edge effect on the electrode [22]. To consistently flow a constant direct current, we continuously monitored whether the stimulating current was normally flowing using a multimeter connected between a pair of tDCS electrodes. We confirmed that our tDCS system transmitted the designated amount of direct current consistently during the entire experiment.
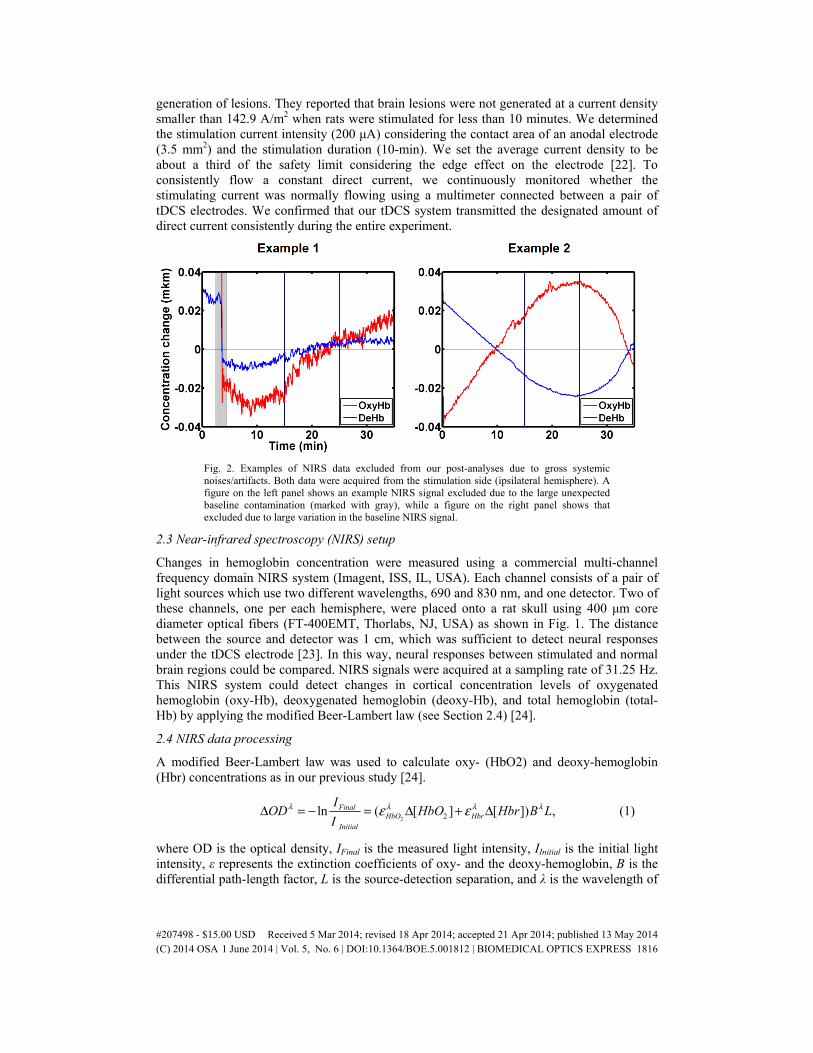
Fig. 2. Examples of NIRS data excluded from our post-analyses due to gross systemic noises/artifacts. Both data were acquired from the stimulation side (ipsilateral hemisphere). A figure on the left panel shows an example NIRS signal excluded due to the large unexpected baseline contamination (marked with gray), while a figure on the right panel shows that excluded due to large variation in the baseline NIRS signal.
2.3 Near-infrared spectroscopy (NIRS) setup
Changes in hemoglobin concentration were measured using a commercial multi-channel frequency domain NIRS system (Imagent, ISS, IL, USA). Each channel consists of a pair of light sources which use two different wavelengths, 690 and 830 nm, and one detector. Two of these channels, one per each hemisphere, were placed onto a rat skull using 400 μm core diameter optical fibers (FT-400EMT, Thorlabs, NJ, USA) as shown in Fig. 1. The distance between the source and detector was 1 cm, which was sufficient to detect neural responses under the tDCS electrode [23]. In this way, neural responses between stimulated and normal brain regions could be compared. NIRS signals were acquired at a sampling rate of 31.25 Hz. This NIRS system could detect changes in cortical concentration levels of oxygenated hemoglobin (oxy-Hb), deoxygenated hemoglobin (deoxy-Hb), and total hemoglobin (total-Hb) by applying the modified Beer-Lambert law (see Section 2.4) [24].
2.4 NIRS data processing
A modified Beer-Lambert law was used to calculate oxy- (HbO2) and deoxy-hemoglobin (Hbr) concentrations as in our previous study [24].
2 2ln ( [ ] [ ]) ,Final
HbO HbrInitial
IOD HbO Hbr B L
Iλ λ λ λε εΔ = − = Δ + Δ (1)
where OD is the optical density, IFinal is the measured light intensity, IInitial is the initial light intensity, ε represents the extinction coefficients of oxy- and the deoxy-hemoglobin, B is the differential path-length factor, L is the source-detection separation, and λ is the wavelength of
#207498 - $15.00 USD Received 5 Mar 2014; revised 18 Apr 2014; accepted 21 Apr 2014; published 13 May 2014(C) 2014 OSA 1 June 2014 | Vol. 5, No. 6 | DOI:10.1364/BOE.5.001812 | BIOMEDICAL OPTICS EXPRESS 1816
light (690 nm and 830 nm). Using the calculated ΔODλ, we can obtain Δ[HbO2] (oxy-hemoglobin concentration) and Δ[Hbr] (deoxy-hemoglobin concentration) with the following equations:
2 1
1 2
2 1
1 2 2 1
2 2
2[ ]( )
,Hbr Hbr
Hbr HbO Hbr HbO
OD OD
B BHbOL
λ λλ λ
λ λ
λ λ λ λ
ε ε
ε ε ε ε
Δ Δ−
Δ =−
(2)
and
1 2
2 1
2 21 2
1 2 2 1
2 2
[ ]( )
,HbO HbO
Hbr HbO Hbr HbO
OD OD
B BHbrL
λ λλ λ
λ λ
λ λ λ λ
ε ε
ε ε ε ε
Δ Δ−
Δ =−
(3)
changes in hemoglobin concentration were preprocessed using several signal processing methods. Oxy-Hb and deoxy-Hb data were low-pass filtered at 0.1 Hz to reduce physiological high frequency respiratory and cardiac noises [25]. This filter was designed with a fourth-order zero phase Butterworth filter. Low-frequency drift was also removed by applying a linear de-trend method [26–28] to the filtered signal (45-min) including baseline (15-min), stimulation period (10-min), and recovery period (15-min). Finally, baseline correction was performed by subtracting the mean of each baseline signal (15-min data prior to tDCS onset) from the analysis data recorded after the onset of tDCS.
We divided oxy-Hb data measured in each rat into two segments acquired during and after tDCS, then each segment was fitted with a first-order polynomial using a curve fitting toolbox implemented in MATLAB 2009a (Mathworks Inc., MA, USA). In this procedure, only concentration changes of oxy-Hb were used because the concentration of deoxy-Hb showed much smaller changes than that of oxy-Hb. After the curve fitting, the slope values of incremental (during tDCS) and decremental (after tDCS) periods were evaluated for each rat. We then performed a correlation analysis to investigate the relationship between the rates of increase and decrease of oxy-Hb. Pearson correlation coefficient and p-value were evaluated using a software package for statistics, SPSS 18.0 (IBM Inc., NY, USA). In this analysis, a significance level was set at less than 0.05.
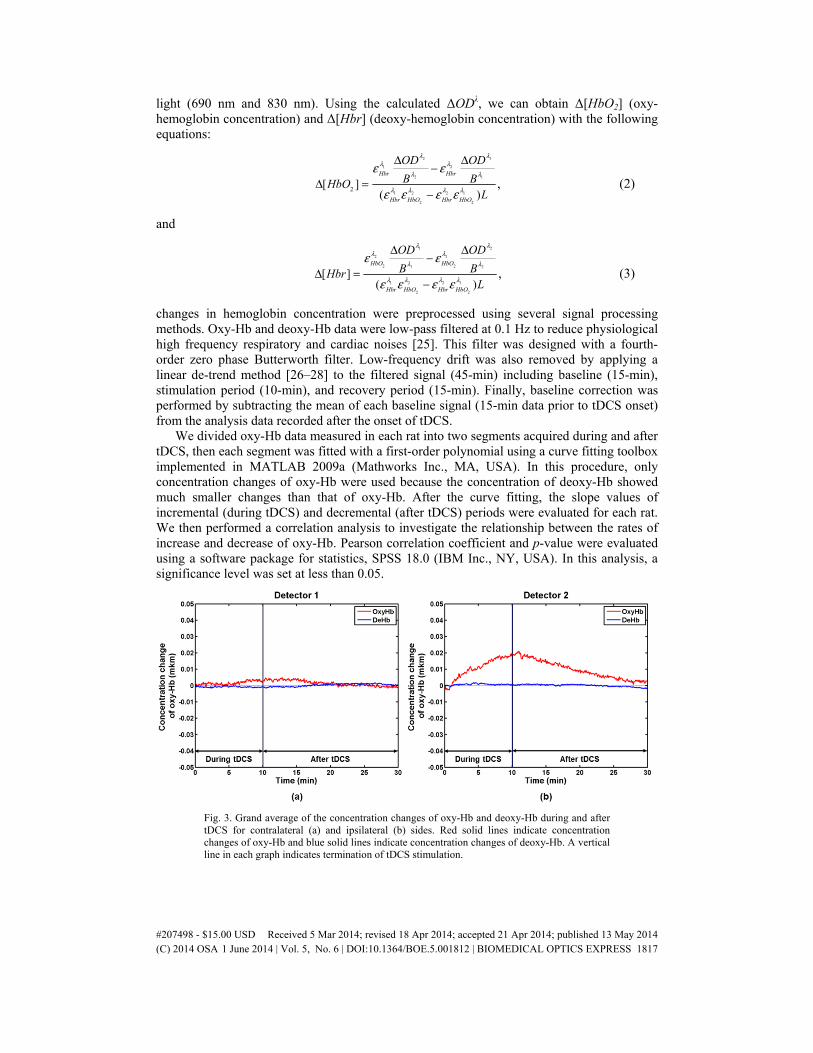
Fig. 3. Grand average of the concentration changes of oxy-Hb and deoxy-Hb during and after tDCS for contralateral (a) and ipsilateral (b) sides. Red solid lines indicate concentration changes of oxy-Hb and blue solid lines indicate concentration changes of deoxy-Hb. A vertical line in each graph indicates termination of tDCS stimulation.
#207498 - $15.00 USD Received 5 Mar 2014; revised 18 Apr 2014; accepted 21 Apr 2014; published 13 May 2014(C) 2014 OSA 1 June 2014 | Vol. 5, No. 6 | DOI:10.1364/BOE.5.001812 | BIOMEDICAL OPTICS EXPRESS 1817
3. Results
Before stimulation, we collected baseline NIRS signals for 15 min. After the acquisition of baseline signals, NIRS signals were continuously recorded for 10 min during tDCS and for 20 min afterwards. Figure 3 shows the grand average of concentration changes of oxy-Hb and deoxy-Hb during and after tDCS. A clear concentration change in response to tDCS was observed only for oxy-Hb recorded right below the stimulation site (channel 2). Oxy-Hb concentration increased during anodal DC stimulation and decreased after tDCS, but deoxy-Hb did not show any distinct change during and after tDCS, which is consistent with a previous study [17] that reported hemodynamic changes in human prefrontal cortex after tDCS. Zheng et al [19] reported that changes in oxy-Hb may reflect rCBF changes in response to tDCS since oxy-Hb is well correlated with rCBF [29, 30].
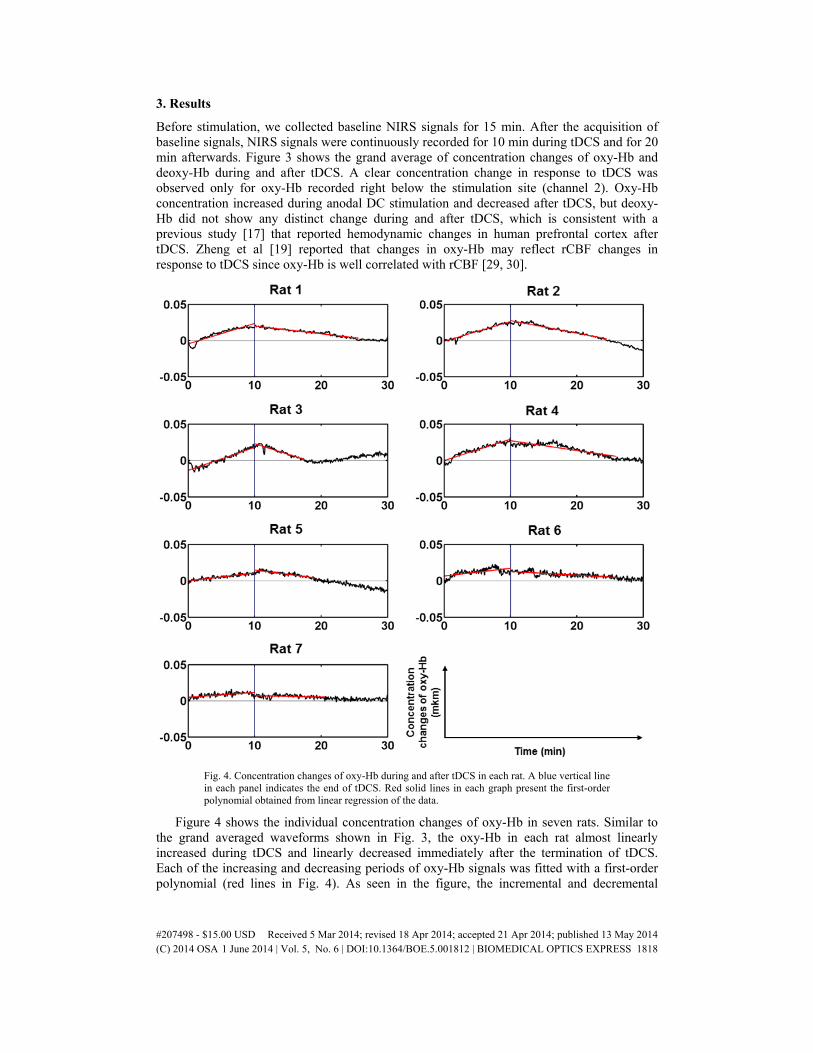
Fig. 4. Concentration changes of oxy-Hb during and after tDCS in each rat. A blue vertical line in each panel indicates the end of tDCS. Red solid lines in each graph present the first-order polynomial obtained from linear regression of the data.
Figure 4 shows the individual concentration changes of oxy-Hb in seven rats. Similar to the grand averaged waveforms shown in Fig. 3, the oxy-Hb in each rat almost linearly increased during tDCS and linearly decreased immediately after the termination of tDCS. Each of the increasing and decreasing periods of oxy-Hb signals was fitted with a first-order polynomial (red lines in Fig. 4). As seen in the figure, the incremental and decremental
#207498 - $15.00 USD Received 5 Mar 2014; revised 18 Apr 2014; accepted 21 Apr 2014; published 13 May 2014(C) 2014 OSA 1 June 2014 | Vol. 5, No. 6 | DOI:10.1364/BOE.5.001812 | BIOMEDICAL OPTICS EXPRESS 1818
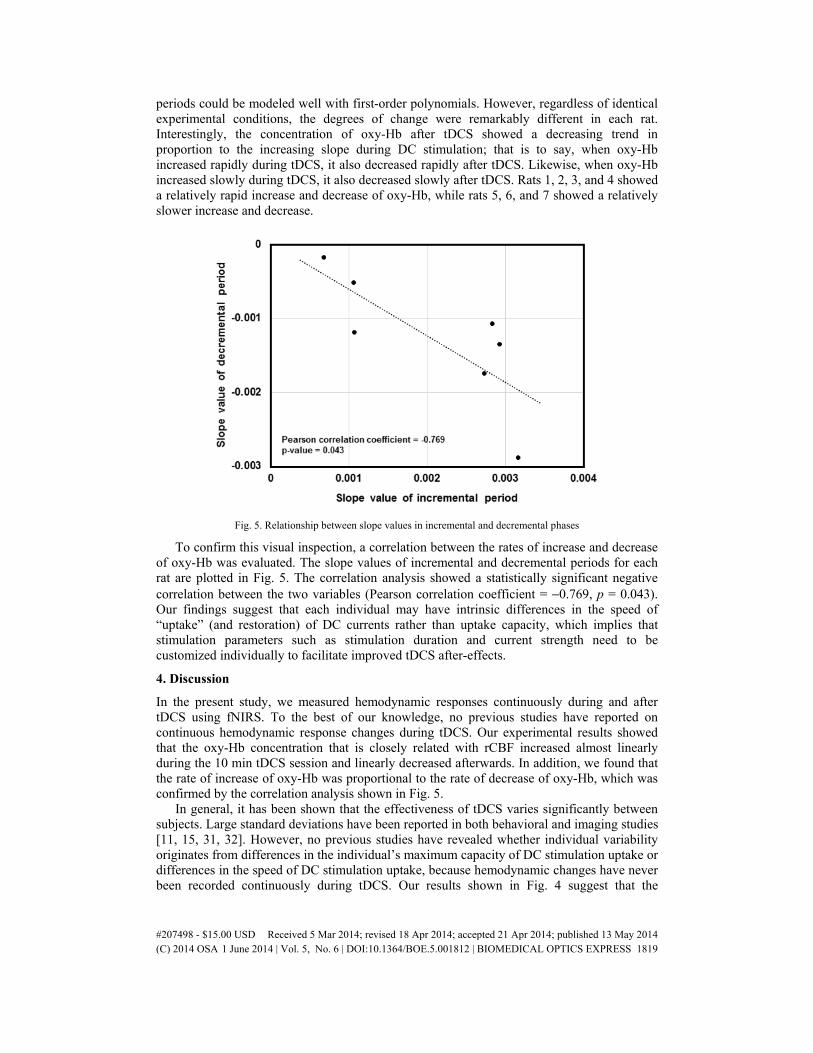
periods could be modeled well with first-order polynomials. However, regardless of identical experimental conditions, the degrees of change were remarkably different in each rat. Interestingly, the concentration of oxy-Hb after tDCS showed a decreasing trend in proportion to the increasing slope during DC stimulation; that is to say, when oxy-Hb increased rapidly during tDCS, it also decreased rapidly after tDCS. Likewise, when oxy-Hb increased slowly during tDCS, it also decreased slowly after tDCS. Rats 1, 2, 3, and 4 showed a relatively rapid increase and decrease of oxy-Hb, while rats 5, 6, and 7 showed a relatively slower increase and decrease.
Fig. 5. Relationship between slope values in incremental and decremental phases
To confirm this visual inspection, a correlation between the rates of increase and decrease of oxy-Hb was evaluated. The slope values of incremental and decremental periods for each rat are plotted in Fig. 5. The correlation analysis showed a statistically significant negative correlation between the two variables (Pearson correlation coefficient = −0.769, p = 0.043). Our findings suggest that each individual may have intrinsic differences in the speed of “uptake” (and restoration) of DC currents rather than uptake capacity, which implies that stimulation parameters such as stimulation duration and current strength need to be customized individually to facilitate improved tDCS after-effects.
4. Discussion
In the present study, we measured hemodynamic responses continuously during and after tDCS using fNIRS. To the best of our knowledge, no previous studies have reported on continuous hemodynamic response changes during tDCS. Our experimental results showed that the oxy-Hb concentration that is closely related with rCBF increased almost linearly during the 10 min tDCS session and linearly decreased afterwards. In addition, we found that the rate of increase of oxy-Hb was proportional to the rate of decrease of oxy-Hb, which was confirmed by the correlation analysis shown in Fig. 5.
In general, it has been shown that the effectiveness of tDCS varies significantly between subjects. Large standard deviations have been reported in both behavioral and imaging studies [11, 15, 31, 32]. However, no previous studies have revealed whether individual variability originates from differences in the individual’s maximum capacity of DC stimulation uptake or differences in the speed of DC stimulation uptake, because hemodynamic changes have never been recorded continuously during tDCS. Our results shown in Fig. 4 suggest that the
#207498 - $15.00 USD Received 5 Mar 2014; revised 18 Apr 2014; accepted 21 Apr 2014; published 13 May 2014(C) 2014 OSA 1 June 2014 | Vol. 5, No. 6 | DOI:10.1364/BOE.5.001812 | BIOMEDICAL OPTICS EXPRESS 1819
individual differences in tDCS after-effects may have originated from intrinsic differences in the speed of DC stimulation uptake rather than differences in the capacity of DC uptake. In addition, our findings on the proportional relationship between the rates of increase and decrease of oxy-Hb concentration suggests that the recovery time after tDCS may not depend on the total amount of hemodynamic changes in the stimulated brain area.
In most practical applications of tDCS, stimulation parameters such as stimulation duration and DC current strength are identically applied to all individuals participating in the tDCS experiments [31, 33, 34]. According to our findings, these parameters need to be customized for each individual in order to maximize tDCS after-effects and reduce individual variability. It is expected that the customized stimulation strategy may enhance the efficacy of clinical tDCS applications. For example, some side-effects of tDCS such as mild headache and dizziness might be reduced by decreasing stimulation duration for individuals whose neural excitability is modulated rapidly. On the other hands, enhanced tDCS after-effects can be expected by increasing the stimulation duration for individuals whose neural excitability is modulated relatively slowly. Our results also suggest that fNIRS might be a useful tool for predicting the tDCS after-effects of individuals as well as designing individual-specific stimulation protocols when recorded simultaneously during tDCS. Importantly, this area of research needs to be investigated further in future studies with human subjects.
For cases of human brain stimulation with tDCS, individual differences in tDCS after-effects are presumed to be related to the different distribution of electric fields on the cortical surface, which is thought to be due to individual differences in the complex folding patterns of cortical structures [35]. This may be a reasonable hypothesis since recent studies reported successful tDCS outcomes for customized stimulation based on electric field analysis [36]. On the other hand, in our experiments, although stimulation current was transmitted to identical locations on the surface of the rat brain, which does not have a complex folding structure, the resultant hemodynamic responses showed large individual variability. Therefore, our results suggest that the individual differences in tDCS effects demonstrated in previous human studies might be influenced by both individual differences in cortical folding structures and intrinsic differences in the speed of DC uptake for each individual. Our results are in line with recent human tDCS studies investigating behavioral changes in working memory performance due to tDCS [34, 35]. These recent studies showed that the behavioral outcomes of controlled tDCS experiments are influenced by intrinsic factors of each individual such as education rate and initial working memory ability. Therefore, our results further support the hypothesis that individual anatomical differences may not be the only factor contributing to large individual variability in tDCS after-effects.
There were some factors that needed to be strictly controlled during the experiment, which may have affected our study results. First, exactly the same amount of stimulating current needed to be delivered to the same brain area of each rat. Since our tDCS system basically uses a constant current source, individual differences in the electrical conductivity of the tissue did not contribute to the total amount of stimulating current. Moreover, tDCS electrodes as well as NIRS optodes were attached carefully by a single operator at the exactly same brain area of each rat using well-known anatomical landmarks. In order to check whether the stimulating current was flowing consistently throughout the entire experiment, we continuously monitored the amount of direct current flow using a multimeter connected between a pair of tDCS electrodes. Second, the anesthetic level of each rat could have also been a factor affecting differences in hemodynamic responses of each rat. To circumvent this, we continuously monitored respiratory activity and oxygen saturation (SpO2) using a commercial pulse oximetry device. We confirmed that most rats maintained stable respiratory activity and oxygen saturation during the entire experiment. Nevertheless, the best solution to overcome this issue is to conduct the same experiment without anesthesia. However, in practice, anesthesia was inevitable because the movements of rats could generate severe movement-related artifacts in the recorded NIRS signals or might also cause detachment of
#207498 - $15.00 USD Received 5 Mar 2014; revised 18 Apr 2014; accepted 21 Apr 2014; published 13 May 2014(C) 2014 OSA 1 June 2014 | Vol. 5, No. 6 | DOI:10.1364/BOE.5.001812 | BIOMEDICAL OPTICS EXPRESS 1820
tDCS electrodes and NIRS optodes from the rats. Therefore, we performed a series of preliminary experiments to determine the minimal amount of anesthetic dose that could anesthetize the movement of each rat for at least 1 hr. Considering our efforts to control the experimental parameters, we feel confident that individual differences in tDCS after-effects are partly due to the individual’s intrinsic characteristics associated with DC uptake. Nevertheless, since our experimental data may not be sufficient to elucidate the physiological meaning and mechanism of our findings, further studies with more sophisticated parameter control need to be performed in the future. For example, one of the promising topics we want to investigate in our future study is to observe hemodynamic response changes when a longer DC stimulation (e.g., 20-min) is applied to the rat brain, which would show how long the linear increase of oxy-Hb concentration holds.
Acknowledgments
This research was supported in part by the National Research Foundation of Korea (NRF) grant funded by the Korean government (MSIP) (No. NRF-2012R1A2A2A03045395) and a grant of the Korea Health Technology R&D Project through the Korea Health Industry Development Institute (KHIDI), funded by the Ministry of Health & Welfare, Republic of Korea (No: HI13C1501).
#207498 - $15.00 USD Received 5 Mar 2014; revised 18 Apr 2014; accepted 21 Apr 2014; published 13 May 2014(C) 2014 OSA 1 June 2014 | Vol. 5, No. 6 | DOI:10.1364/BOE.5.001812 | BIOMEDICAL OPTICS EXPRESS 1821