Embed Size (px)
Citation preview

Prof. Dr. Ottmar Edenhofer, Jan Steckel, Dr. Michael Jakob
Combating Climate Change and Global Poverty
Entdeken Stakeholder Workshop
Potsdam, April 19, 2012
Climate Change, Development, and Equity

Long term trends show clear evidence
• Temporal slow downs of global warming have occurred already in the past• Recent independent examination of IPCC results (Berkeley Earth Surface Temperature Project) has confirmed results
Sour
ce: B
erke
ley
Eart
h Su
rfac
e Te
mpe
ratu
re P
roje
ct

Average temperature anomaly per year
( Pet
erso
n an
d B
arin
ger2
009)
Last decade was the warmest since the beginning of industrialization !

Projections of Global Warming
(IPCC 2007)
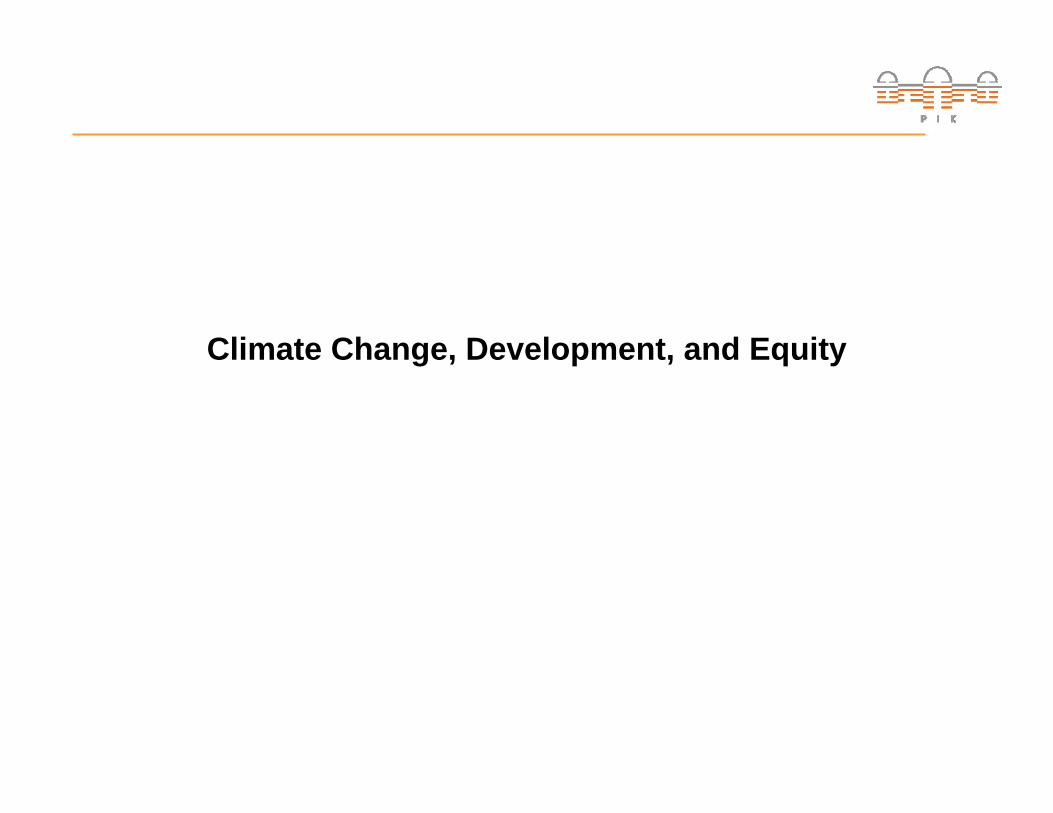
Tipping Points
(Lenton et al. 2008)

Impacts
(IPCC 2007)

Impacts for Developing Countries
(IPCC 2007)
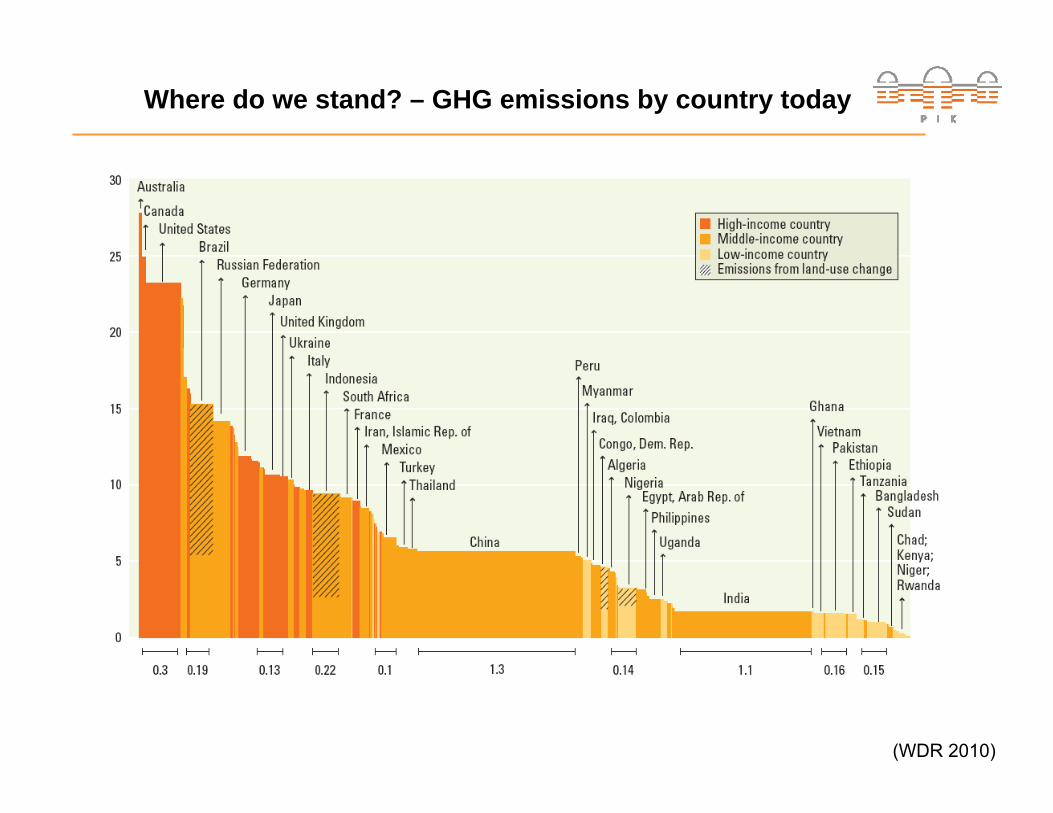
Where do we stand? – GHG emissions by country today
(WDR 2010)

103
104
105
101
102
103
104
Brazil
Mexico
Ethiopia
Russia
Egypt
France
Germany United States
India
Bangladesh
China
Japan South Africa
K: Capital stock (US$2000 per person)
P: F
ossi
l CO 2 e
mis
sion
s (k
g C
per
per
son
and
year
)
Fitting line: ln P=0.987 ln K+c
Wealth and carbon emissions
( Füssel 2007)

Economic Development, Energy Use, and CO2Emissions

The scope of the challenge
Key question for developing countries: Is leapfrogging possible?
(WD
R 2
010)
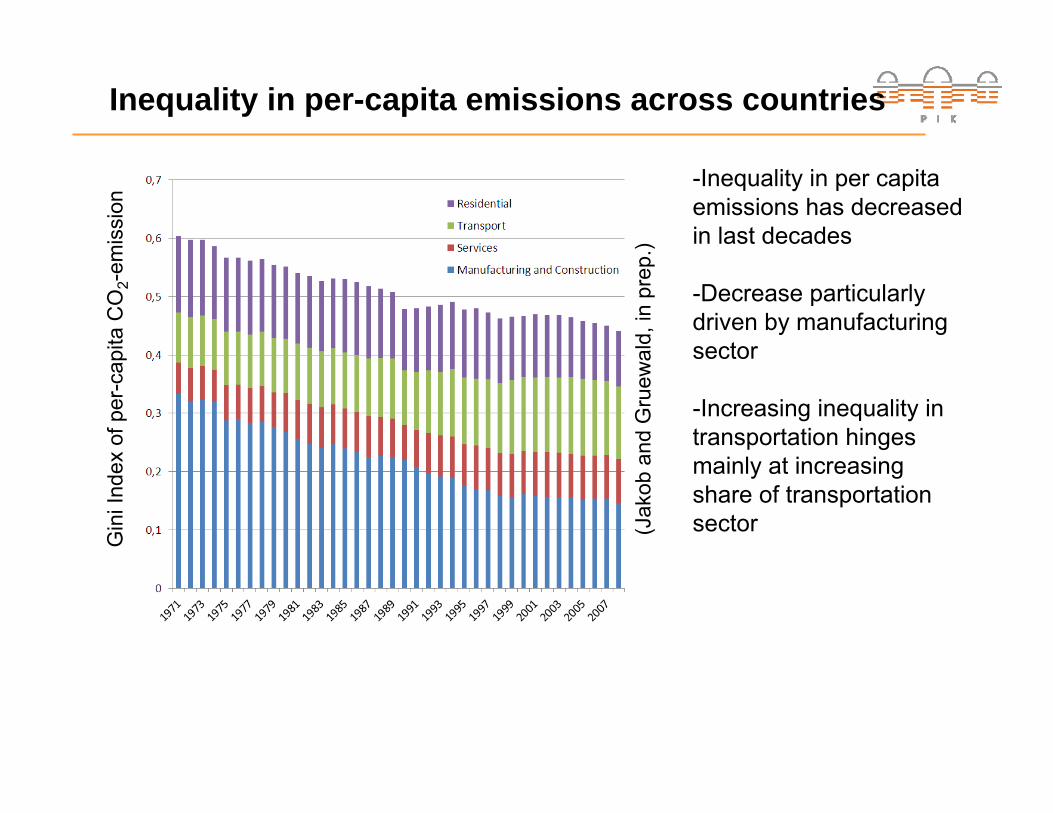
Inequality in per-capita emissions across countries
(Jak
ob a
nd G
ruew
ald,
in p
rep.
)
Gin
iInd
ex o
f per
-cap
itaC
O2-
emis
sion
-Inequality in per capita emissions has decreased in last decades
-Decrease particularly driven by manufacturing sector
-Increasing inequality in transportation hinges mainly at increasing share of transportation sector
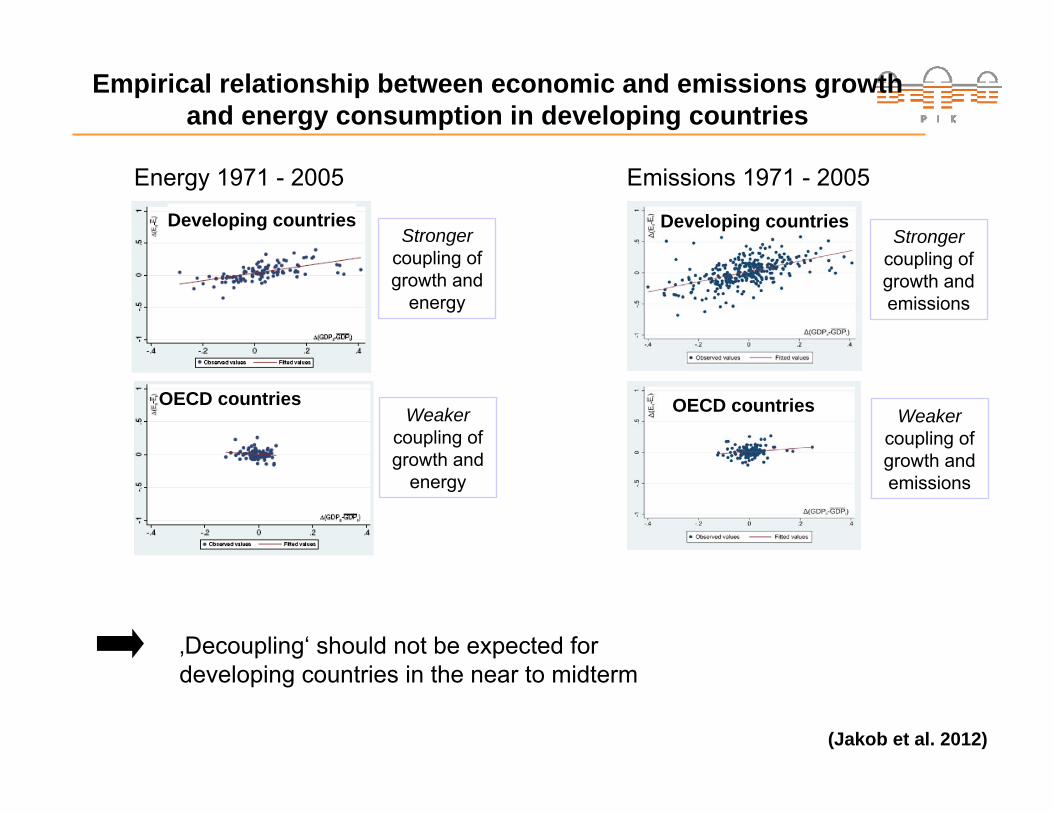
Empirical relationship between economic and emissions growth and energy consumption in developing countries
Developing countries
OECD countries
Strongercoupling of growth and emissions
Weakercoupling of growth and emissions
‚Decoupling‘ should not be expected for developing countries in the near to midterm
Developing countries
OECD countries
Strongercoupling of growth and
energy
Weakercoupling of growth and
energy
Energy 1971 - 2005 Emissions 1971 - 2005
(Jakob et al. 2012)

Development of global emissions
Contributions to net annual emissions growth coming from different characteristic factors [all in %]
China’s large contribution to recent global
emissions growth
Slower energy efficiency improvements and a growth surge, not necessarily carbonisation, explain China’s explosion of emissions
(Steckel et al. 2011)
Global emissions by countries/regions

Economic Growth as Driver of CO2 Emissions
(Ste
ckel
et a
l, 20
11)
Renaissance of Coal?
Decomposition of Carbon Intensity

17
(IMF
2011
)
Renaissance of Coal?

Fossil Fuel Scarcity vs. Limited Atmospheric Space
Conclusions 1st part
• Leapfrogging is not taking place
• Economic growth particularly in newly industrializing countriesdrives CO2 emissions

The Energy System Transformation in the Context of Global Justice

Fossil Fuels Dominate the World Energy System
Shares of Primary Energy Supply 2008
Modern bioenergy 4%Traditional biomass 6%
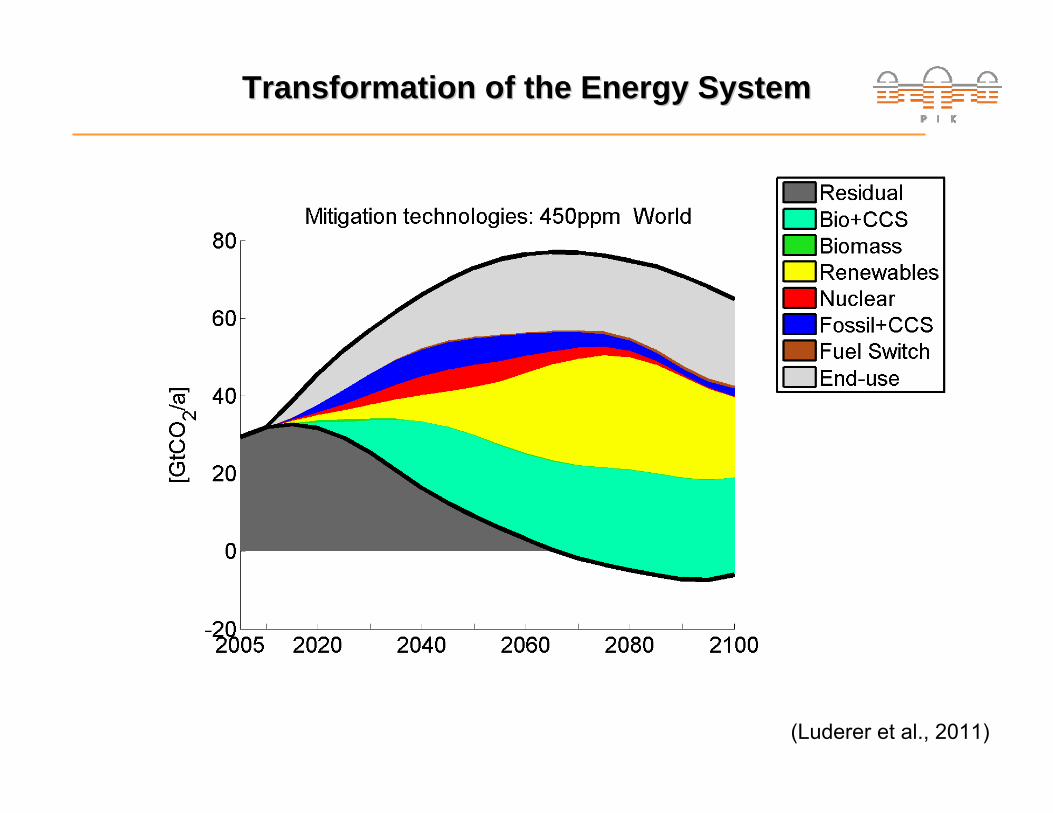
Transformation of Transformation of thethe Energy SystemEnergy System
(Luderer et al., 2011)

Transformation of the Energy System
E3MG
Bas
elin
e MERGE POLES REMINDTIMER
models
(Knopf et al. 2009)
Many different pathways to transform the energy system
Different possibilities to reach low stabilisation 400ppm can be achieved by all models
400
ppm
-eq

Renewable Energy Potentials
(Edenhofer et al. 2011)

Costs of Renewable Energy
(Edenhofer et al. 2011)

Costs of mitigation
Costs hinge critically on: • The stabilization target• The biomass potential• The availability of technologies, RE and CCS in particular
( Ede
nhof
eret
al.
2011
)

Investment Requirements
business-as-usual 450ppm-CO2
(Luderer et al. 2011)
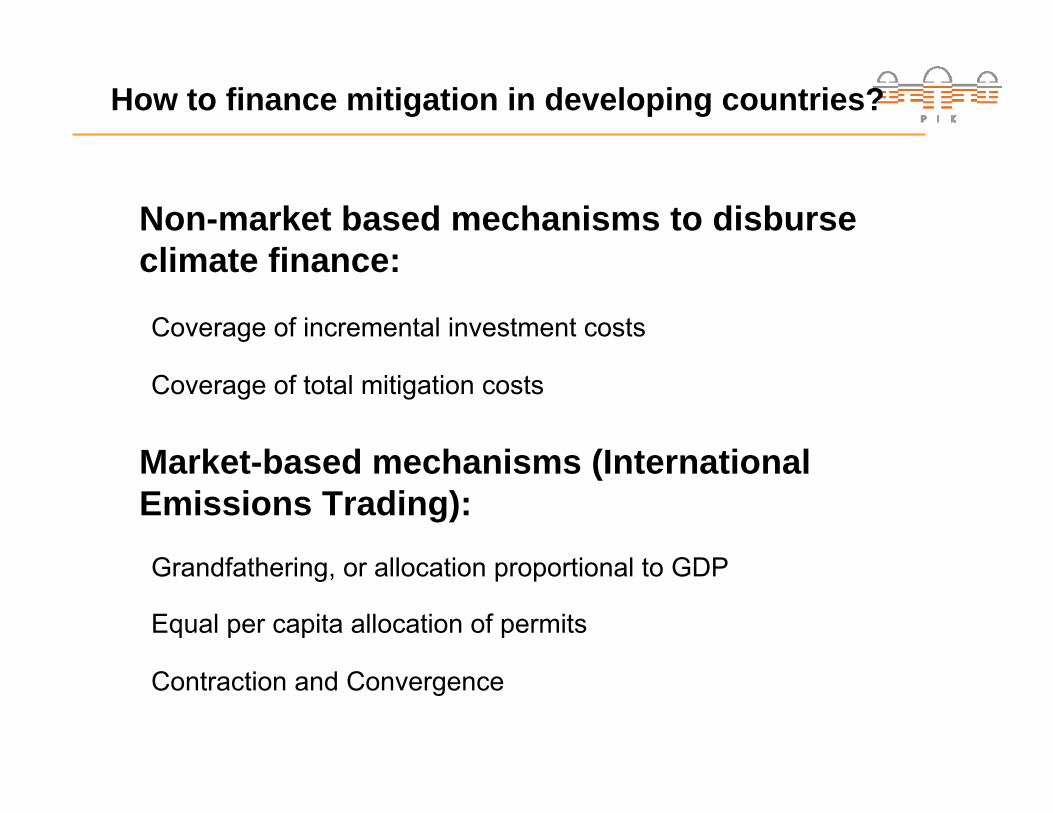
How to finance mitigation in developing countries?
Non-market based mechanisms to disburseclimate finance:
Coverage of incremental investment costs
Coverage of total mitigation costs
Market-based mechanisms (International Emissions Trading):
Grandfathering, or allocation proportional to GDP
Equal per capita allocation of permits
Contraction and Convergence

Non-Market Transfers
(Jak
ob e
t al,
subm
itted
.)

Emission Trading
(Jakob et al, submitted.)
per capita per capita

Risk of Adverse Effects
DataResource Exports, FDI: Year 2009Aid: Year 2008ETS: ReMIND scenario Year 2020
Climate Finance Range[% of GDP]

How to Avoid a Climate Finance Curse?
• Possible problems with financial inflows: volatility, Dutch disease, rent-seeking
• Higher risk of climate finance curse with emissions trading; butproblem to efficiently deliver non-market transfers
• Transfer of rents can be limited by appropriate choice of allocation; but might conflict with notions of equity
• Properly designed institutions can reduce risk of climate financecurse (e.g. price corridors, sovereign wealth funds, civil societyinvolvment)
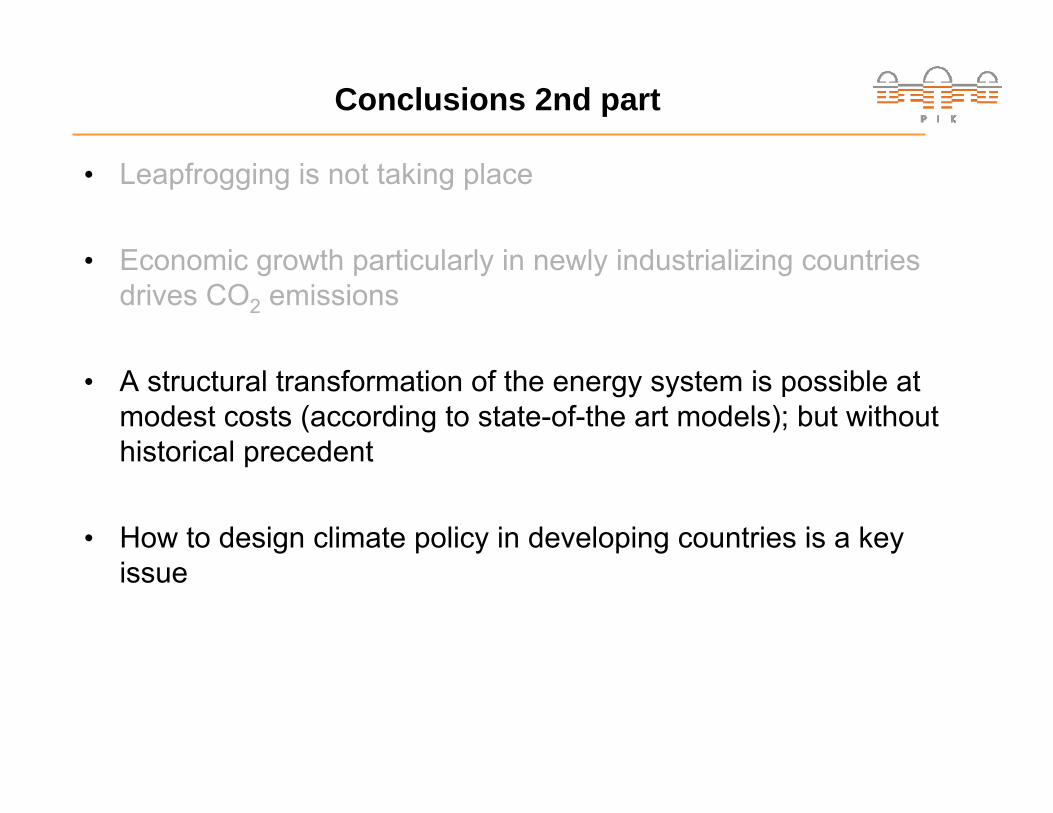
Conclusions 2nd part
• Leapfrogging is not taking place
• Economic growth particularly in newly industrializing countries drives CO2 emissions
• A structural transformation of the energy system is possible at modest costs (according to state-of-the art models); but without historical precedent
• How to design climate policy in developing countries is a key issue
Climate Policy, Poverty, and Equity
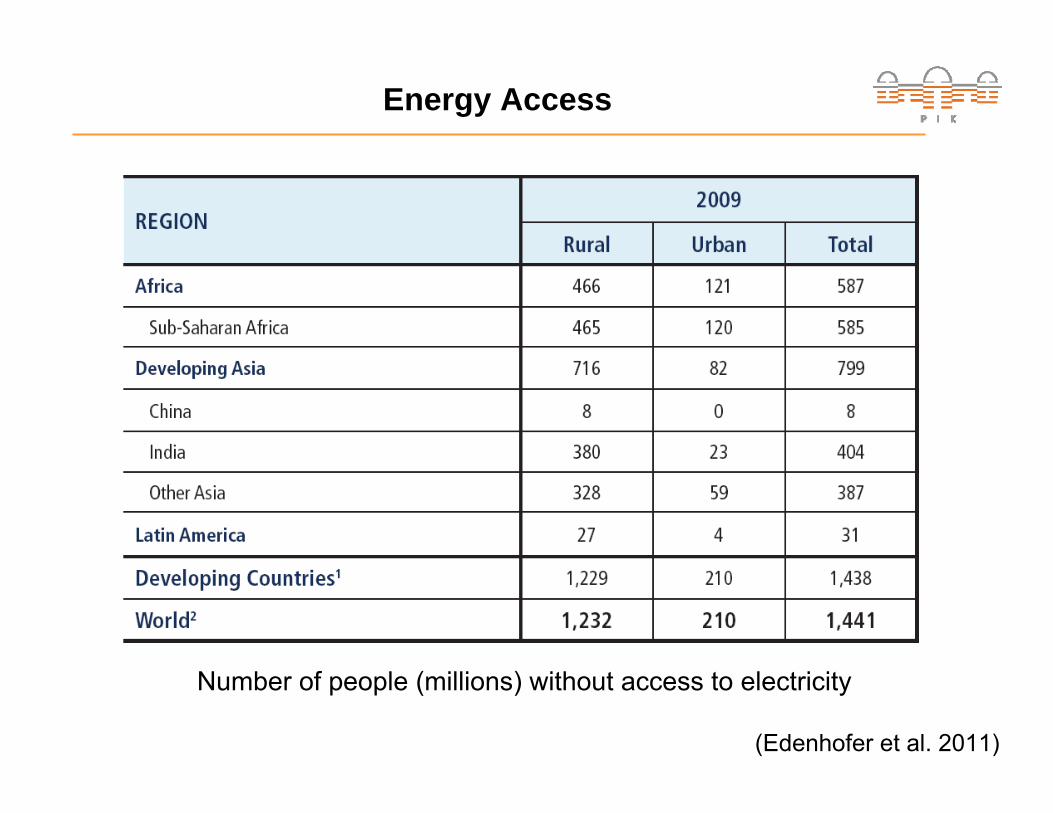
Energy Access
(Edenhofer et al. 2011)
Number of people (millions) without access to electricity
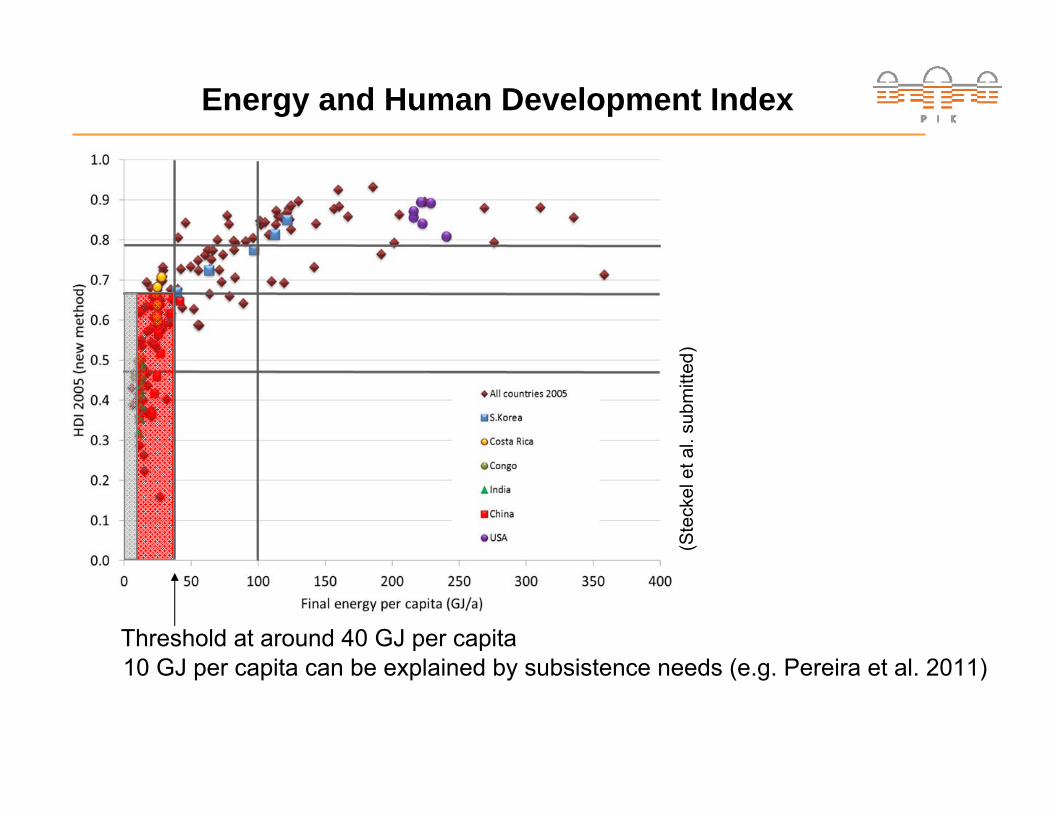
Energy and Human Development Index
(Ste
ckel
et a
l. su
bmitt
ed)
Threshold at around 40 GJ per capita10 GJ per capita can be explained by subsistence needs (e.g. Pereira et al. 2011)
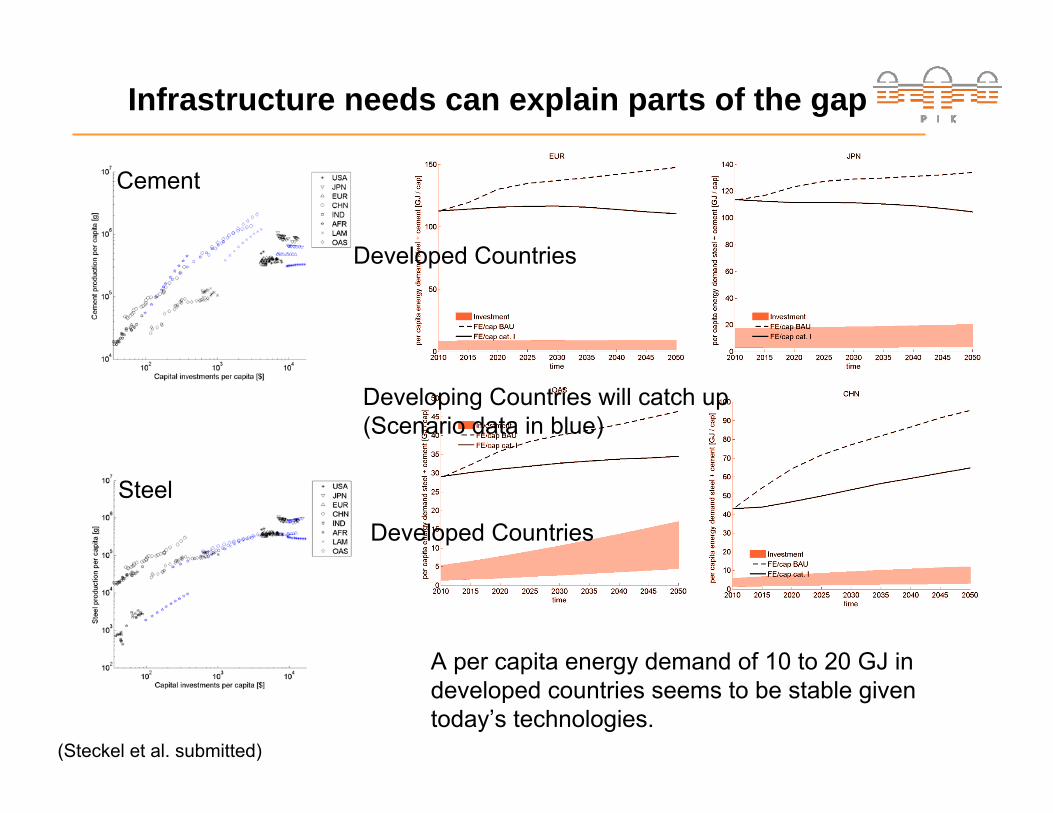
Infrastructure needs can explain parts of the gap
A per capita energy demand of 10 to 20 GJ in developed countries seems to be stable given today’s technologies.
Developed Countries
Developed Countries
Developing Countries will catch up(Scenario data in blue)
(Steckel et al. submitted)
Cement
Steel

38
Model results
Non Annex I
Annex I Europe
India
FE p
er c
apita
[GJ]
25303540455055
FE p
er c
apita
[GJ]
15
20
25
30
80
100
120
140
160
80
100
120
140FE
per
cap
ita [G
J]FE
per
cap
ita [G
J]
Bas
elin
e 20
30
Bas
elin
e 20
50
Cat
3+4
2030
Cat
3+4
2050
Cat
1+2
2030
Cat
1+2
2050
Bas
elin
e 20
30
Bas
elin
e 20
50
Cat
3+4
2030
Cat
3+4
2050
Cat
1+2
2030
Cat
1+2
2050
Bas
elin
e 20
30
Bas
elin
e 20
50
Cat
3+4
2030
Cat
3+4
2050
Cat
1+2
2030
Cat
1+2
2050
Bas
elin
e 20
30
Bas
elin
e 20
50
Cat
3+4
2030
Cat
3+4
2050
Cat
1+2
2030
Cat
1+2
2050
IAMs predict large scale reduction of energy useIn developing countries!
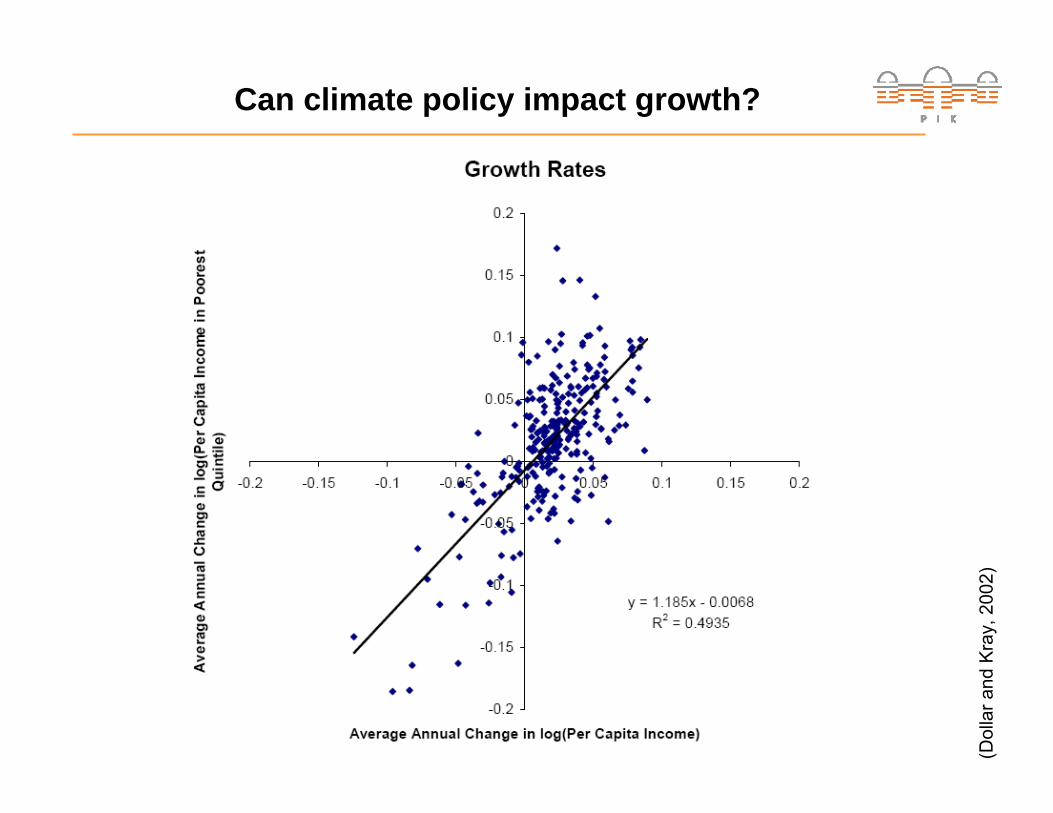
Can climate policy impact growth?
(Dol
lar a
nd K
ray,
200
2)

Mitigation trap in a Solow model
kYkskk
)(
kY Production function:
Capital formation:
In the case of climate policyβ decreases.
The trap gets more likely in the presence of climate policy in the form of βK(s) [Independent from the form of the function s(k)]
K0 KC
[$]
(Ste
ckel
201
2)

Conclusions 3rd part
• Leapfrogging is not taking place• Economic growth particularly in newly industrializing countries
drives CO2 emissions • A structural transformation of the energy system is possible at
modest costs (according to state-of-the art models); but without historical precedent
• How to design climate policy in developing countries is a key issue
• Infrastructure can next to subsidiary needs explain an energy threshold for development
• For low development levels climate policy might have the potential to induce a poverty trap
Further research needed !

Thank you for your attention!