Embed Size (px)
Citation preview

Columbia Basin Trust
2016/17 ANNUAL SERVICE PLAN REPORT

For more information on Columbia Basin Trust, contact:
300-445 13 Avenue
Castlegar, BC V1N 1G1
1.800.505.8998
or visit our website at ourtrust.org
Columbia Basin Trust
2016/17 Annual Service Plan Report 3
Board Chair’s Accountability Statement
The Columbia Basin Trust 2016/17 Annual Service Plan Report compares the corporation’s actual results to the expected results identified in the 2016/17–2018/19 Service Plan. I am accountable for those results as reported.
Rick Jensen Board Chair
Columbia Basin Trust
2016/17 Annual Service Plan Report 4
Table of Contents Board Chair’s Accountability Statement ................................................................................................ 3
Chair/CEO Report Letter ........................................................................................................................ 5
Purpose of the Organization .................................................................................................................... 6
Strategic Direction and Context .............................................................................................................. 7
Report on Performance ........................................................................................................................... 8
Goals, Strategies, Measures and Targets ............................................................................................ 8
Goal 1: Investment Program .......................................................................................................... 9
Goal 2: Delivery of Benefits ........................................................................................................ 11
Goal 3: Corporate Operations ...................................................................................................... 12
Financial Report .................................................................................................................................... 14
Discussion of Results ........................................................................................................................ 14
Financial Resource Summary Table ............................................................................................. 15
Consolidated Financial Statements ................................................................................................... 16
Appendix A - Subsidiaries and Operating Segments ............................................................................ 47
Active Subsidiaries ........................................................................................................................... 47
Holding Companies .......................................................................................................................... 48
Appendix B - Additional Information ................................................................................................... 49
Organizational Overview .................................................................................................................. 49
Corporate Governance ...................................................................................................................... 49
Appendix C - Crown Corporations Mandate and Actions Summary ................................................... 50

Columbia Basin Trust
2016/17 Annual Service Plan Report 5
Chair/CEO Report Letter Columbia Basin Trust (the Trust) exists to support the efforts of Basin residents to create a legacy of social, economic and environmental well-being. Our financial support comes from our investments, and in 2016/17, our revenues totaled over $59 million allowing us to deliver more than $38 million in benefits to the Basin. The Columbia Basin Management Plan sets out 13 strategic priorities for 2016 to 2020 and guides how we support Basin priorities. We made significant progress in several of our priority areas including:
For 2016/17, our Power Projects are above target, our Private Placements are on target, and our Market Securities saw a strong upward trend and finished the year above target. We met our targets for the maturity of our planning and risk management practices, and we exceeded our corporate operations target. Every two years, we measure how Basin residents and Trust partners perceive the Trust. On this measure, we were again above our target with positive perceptions from both audiences.
The Trust operates under the Taxpayer Accountability Principles, which strengthen our accountability, promote cost control and ensure we operate in the best interests of Basin residents and the Province as shareholder. • In compliance with the Taxpayer Accountability Principles, the Trust met with the minister
responsible and deputy minister over the past year to discuss progress on the objectives identified in the Mandate Letter.
• We continue to work with the Province, local governments and First Nations in the region to implement an aligned Board appointment process that ensures the Trust Board has the requisite balance of skills to lead the organization.
• The Taxpayer Accountability Principles are also embedded in new employee and director orientations.
Rick Jensen Johnny Strilaeff Board Chair President and Chief Executive Officer
• developing strategic frameworks for affordable housing, agriculture, broadband and economic development
• launching two new programs: Energy Retrofit Program and Built Heritage Grants
• forming the Columbia Basin Development Corp. subsidiary to further our economic development strategic priority.

Columbia Basin Trust
2016/17 Annual Service Plan Report 6
Purpose of the Organization The Columbia Basin Trust Act and the Financial Agreement formally established Columbia Basin Trust in 1995. The legislation outlines the dual accountability the Trust has to both the residents of the Columbia Basin and to the Province, its shareholder. A Memorandum of Understanding further clarifies the dual accountability and relationship with the Province. Within the provincial government, the Minister of Energy and Mines is responsible for the Trust. The Trust has two core functions:
1. Invest capital and manage the assets of the Trust (Investment Program). 2. Use the income earned from the Trust’s investments to deliver benefits to the Basin (Delivery
of Benefits). The Trust sets its priorities and goals in consultation with the residents of the region, and the Trust makes decisions related to its Investment Program and Delivery of Benefits activities within the context of its legislation and Board-approved Statement of Investment Policies and Procedures. The Trust supports the efforts of the people who live in British Columbia’s Columbia Basin, working with them to deliver social, economic and environmental benefits to the Columbia Basin Trust region. We do this by:
• investing in Basin power projects, businesses and real estate (to generate a financial return) • investing in projects that have broader community impact and where financial return is
secondary • engaging with residents to understand priorities • facilitating, convening and providing access to information to deepen our collective
understanding of issues • partnering with organizations that have complementary objectives and expertise in particular
issues or sectors to work toward attaining common goals • developing initiatives and programs that address specific needs linked to our strategic
objectives, delivered by the Trust or partners • providing grants to a wide range of community projects, as well as to the social, economic,
environment, youth, and arts and culture sectors, administered by the Trust or by partners The Trust has two operating subsidiaries: Columbia Basin Broadband Corporation (CBBC) and Columbia Basin Development Corporation (CBDC). CBBC works with Basin communities and rural areas to improve high-speed connectivity through a region-wide fibre optic cable network. The Trust formed CBDC in 2016 to lead and support efforts to advance economic growth, job creation, innovation and entrepreneurial opportunities in the Basin. The Trust also has eight wholly owned holding companies that hold our interests in investments: see Appendix A.

Columbia Basin Trust
2016/17 Annual Service Plan Report 7
Strategic Direction and Context The Trust operates under the Taxpayer Accountability Principles and an annual Mandate Letter, which defines specific priority actions for the Trust and describes accountability principles on which the Trust and the Province have agreed. The Trust’s strategic priorities are captured in the Columbia Basin Management Plan, which identifies 13 strategic priority areas that are the focus of our activities until 2020. The Trust experienced the loss of long-time President and CEO Neil Muth when he passed away in November 2016. While it was a difficult time for staff, delivery partners and residents who knew Neil well, the Trust had a succession plan, and Johnny Strilaeff, Vice President and Chief Operating Officer, was appointed President and CEO. This consistency helped the Trust maintain its strategic direction with minimal impact on the operating environment. The performance of our investments is linked in part to the larger regional and global economy. There continues to be stable performance of our resource-based industry, and an improvement in the recreational and hospitality sectors. Our investment portfolio performed well during 2016/17 despite ongoing volatility in the broader financial and commodity markets. It requires ongoing oversight to ensure risk is managed appropriately and the long-term forecasted returns are realized. Based on input from Basin residents, the Trust is moving forward with new ways of delivering benefits and meeting the needs of the region. Historically, the Trust has primarily delivered benefits to Basin residents through grants recorded as expenses for financial reporting purposes. The new approach now includes the development and management of assets for community benefit. As these types of benefits are capitalized rather than expensed, the net impact of this shift in approach is a reduction in reported expenses, both within this past fiscal year as well as in future forecasts. Both of the above approaches use Trust financial resources to address a regional priority; however, grants are expensed on the financial statements in the Statement of Operations whereas investments result in an increase in assets on the Statement of Financial Position. The accounting adjustments in no way reflect reduced Delivery of Benefits activities by the Trust in the Basin and may even represent an increased use of Trust financial resources.

Columbia Basin Trust
2016/17 Annual Service Plan Report 8
Report on Performance The Trust’s 2016/17 Mandate Letter set out two high-level objectives agreed to by the Province and the Trust.
1. Develop and implement new initiatives in response to the 2014/15 community engagement process, and ensure these new initiatives are aligned with the renewed Columbia Basin Management Plan and implemented in an effective and efficient manner. Results: The renewed Columbia Basin Management Plan for 2016 to 2020 identifies 13 strategic priority areas and confirms four methods that we use to support efforts to address these community priorities. Each of the new initiatives and programs that we developed and implemented responds to one or more of the strategic priorities, including:
o developing strategic frameworks for affordable housing, agriculture, broadband and economic development
o launching two new programs: Energy Retrofit Program and Built Heritage Grants o forming the Columbia Basin Development Corp. subsidiary to further our economic
development strategic priority.
2. Continue to engage with local government, First Nations, and the Province to ensure the Trust has the requisite balance of skills on the Board of Directors.
Results: Following consultations with the minister responsible, the regional districts and the Ktunaxa Nation Council to ensure the appropriate balance of skills and experience on the Trust Board, seven directors were re-appointed to the Board: two provincial appointees, four regional appointees and one Ktunaxa Nation Council appointee.
Consistent with the principles of the Taxpayer Accountability Principles, we have adopted several performance and efficiency measures. Financial returns from Power Projects, Private Placements and Market Securities each have defined long-term performance expectations. Power Project returns of 11.3 per cent exceeded the objective of 10 per cent, Private Placement returns of 5.7 per cent were slightly below the objective of 6 per cent and Market Securities returns of 11.8 per cent exceeded the six per cent objective.
We have adopted three measures for corporate operations that are consistent with Taxpayer Accountability Principles. Maturity of planning practices, maturity of risk management practices and budget variances for corporate operations are all indicators of efficiency and effectiveness. The Trust met or exceeded each of these measures.
Goals, Strategies, Measures and Targets The 2016/17-2018/19 Service Plan established three goals to help us track how we are achieving our mandate to manage our assets for the ongoing benefit of the region, our vision of social, economic and environmental well-being in the Basin, and efficiency in our internal operations. Prudently managing our assets will generate the financial returns required to support Delivery of Benefits activities, fund corporate operating expenses and allow for additional future investment.
Columbia Basin Trust
2016/17 Annual Service Plan Report 9
Goal 1: Investment Program Generate a predictable, sustainable and appreciating income stream to fund Delivery of Benefits obligations and corporate operating expenses.
Strategies
• Communicate directly with financial partners throughout the Basin to originate high-quality investment opportunities.
• Develop strong working relationships with the management of companies in which the Trust has invested to fully appreciate risk, as well as uncover future opportunity.
• Identify and develop investment opportunities that target areas of quality risk not otherwise addressed by conventional lenders.
• Remain fully engaged with Columbia Power and Fortis Inc. during the transition from construction to operation at the Waneta Expansion Project. Continue to work closely with partners during the operating phases of all power projects.
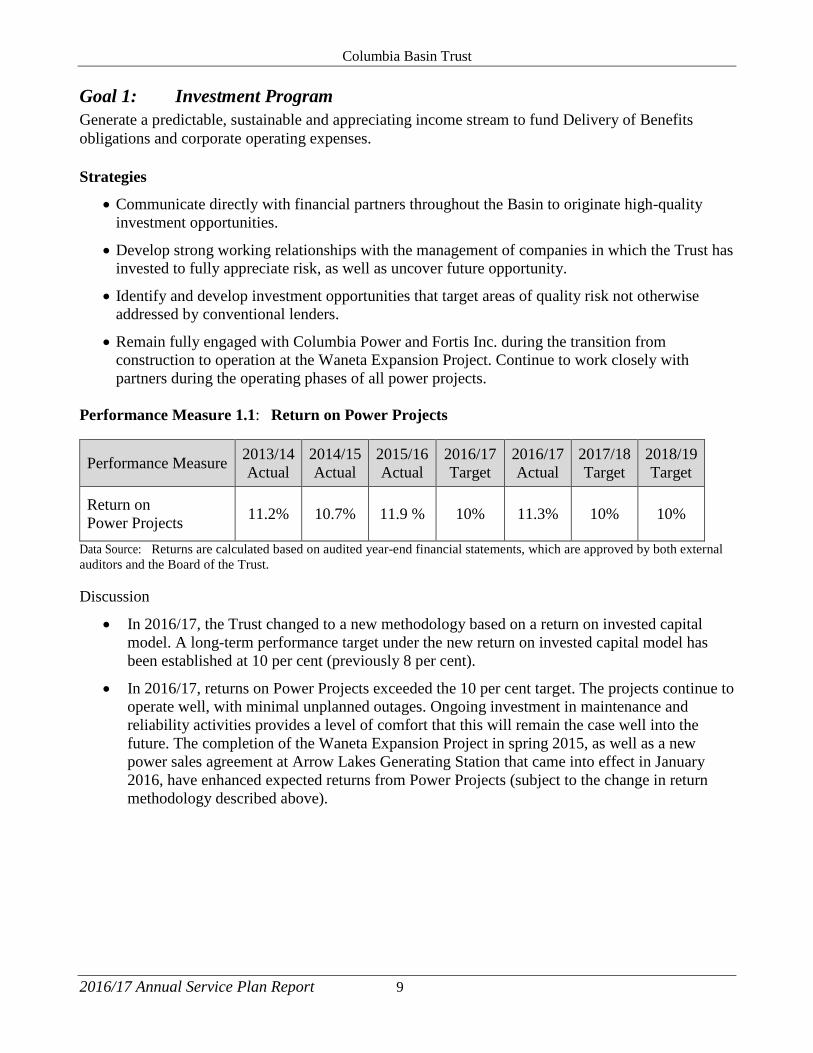
Performance Measure 1.1: Return on Power Projects
Performance Measure 2013/14 Actual
2014/15 Actual
2015/16 Actual
2016/17 Target
2016/17 Actual
2017/18 Target
2018/19 Target
Return on Power Projects 11.2% 10.7% 11.9 % 10% 11.3% 10% 10%
Data Source: Returns are calculated based on audited year-end financial statements, which are approved by both external auditors and the Board of the Trust. Discussion
• In 2016/17, the Trust changed to a new methodology based on a return on invested capital model. A long-term performance target under the new return on invested capital model has been established at 10 per cent (previously 8 per cent).
• In 2016/17, returns on Power Projects exceeded the 10 per cent target. The projects continue to operate well, with minimal unplanned outages. Ongoing investment in maintenance and reliability activities provides a level of comfort that this will remain the case well into the future. The completion of the Waneta Expansion Project in spring 2015, as well as a new power sales agreement at Arrow Lakes Generating Station that came into effect in January 2016, have enhanced expected returns from Power Projects (subject to the change in return methodology described above).

Columbia Basin Trust
2016/17 Annual Service Plan Report 10
Performance Measure 1.2: Return on Private Placements
Performance Measure 2013/14 Actual
2014/15 Actual
2015/16 Actual
2016/17 Target
2016/17 Actual
2017/18 Target
2018/19 Target
Return on Private Placements (calculated as a cash-based return on investment)
6.1% 4.7% 5.6% 6% 5.7% 6% 6%
Data Source: Returns are calculated based on audited year-end financial statements, which are approved by both external auditors and the Board of the Trust. Discussion
• In 2016/17 following a review of forecast returns, we have adjusted the target return to 6 per cent from 8 per cent to reflect the continued low interest rate environment. We continue to follow a cash-based return on investment methodology.
• In 2016/17, returns on Private Placements were expected to slightly exceed those of the prior year. Investments in Basin-based businesses continue to grow significantly, and the addition of new investments has slightly increased returns. However, even with the new additions, the relatively low interest rate environment results in returns from these investments falling short of the adjusted long-term per cent target. This will have limited impact on the budget, as these returns make up a relatively small percentage of the Trust’s revenues.
Performance Measure 1.3: Return on Market Securities
Performance Measure 2013/14 Actual
2014/15 Actual
2015/16 Actual
2016/17 Target
2016/17 Actual
2017/18 Target
2018/19 Target
Return on Market Securities
14.2% 12.1% (1.7)% 6% 11.8% 6% 6%
Data Source: Returns are calculated by BC Investment Management Corporation in accordance with Global Investment Performance Standards. Discussion
• In 2016/17, returns on Market Securities have exceeded the long-term 6 per cent target. It is critical to note the forecasting of financial market returns (particularly in the short term) is challenging, and it is possible the realized returns in the current fiscal year are materially higher or lower than the six per cent forecast. Notwithstanding this inherent challenge in predicting returns, we continue to believe the six per cent long-term objective is appropriate.
Columbia Basin Trust
2016/17 Annual Service Plan Report 11
Goal 2: Delivery of Benefits Deliver benefits that serve to strengthen the social, economic and environmental well-being of the Basin and its residents and communities.
Strategies
• Encourage long-term stewardship of the Basin’s natural assets and help build the ability to take action to meet environmental challenges.
• Actively foster and support local and regional economic resiliency and well-being.
• Help communities respond to social issues and make social considerations part of strengthening community well-being.
• Work with communities and youth to enhance youth opportunities and engagement.
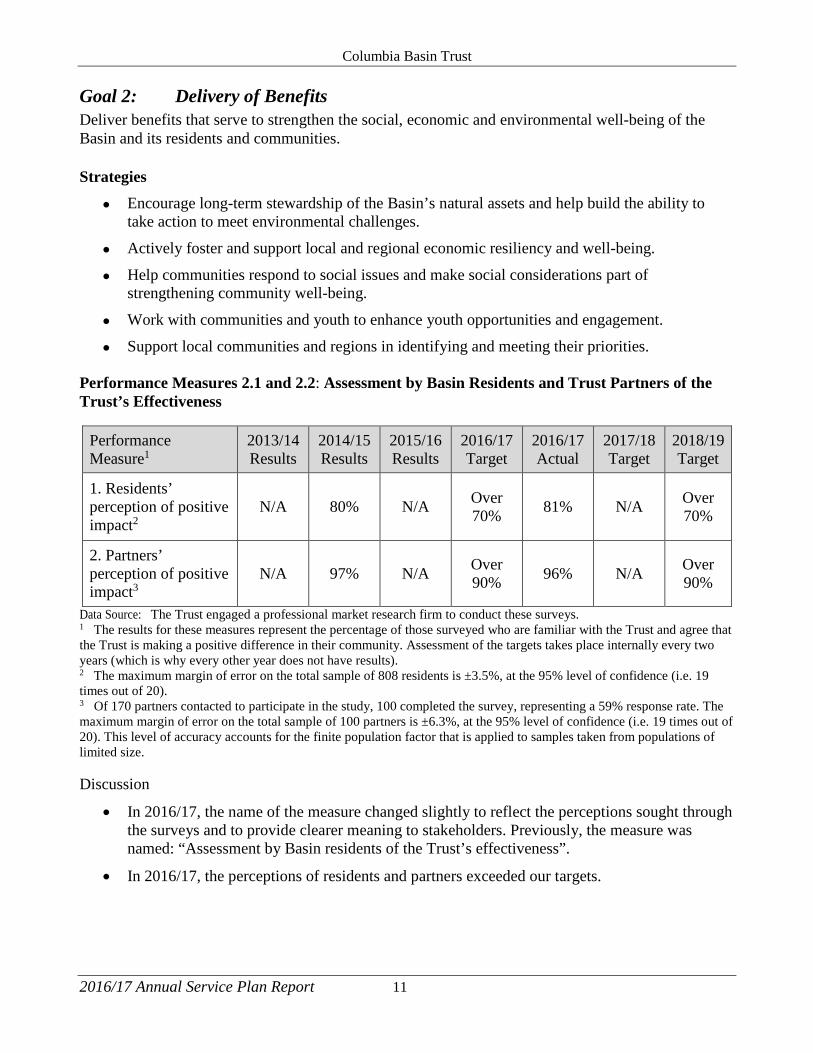
• Support local communities and regions in identifying and meeting their priorities. Performance Measures 2.1 and 2.2: Assessment by Basin Residents and Trust Partners of the Trust’s Effectiveness
Performance Measure1
2013/14 Results
2014/15 Results
2015/16 Results
2016/17 Target
2016/17 Actual
2017/18 Target
2018/19 Target
1. Residents’ perception of positive impact2
N/A 80% N/A Over 70% 81% N/A Over
70%
2. Partners’ perception of positive impact3
N/A 97% N/A Over 90% 96% N/A Over
90%
Data Source: The Trust engaged a professional market research firm to conduct these surveys. 1 The results for these measures represent the percentage of those surveyed who are familiar with the Trust and agree that the Trust is making a positive difference in their community. Assessment of the targets takes place internally every two years (which is why every other year does not have results). 2 The maximum margin of error on the total sample of 808 residents is ±3.5%, at the 95% level of confidence (i.e. 19 times out of 20). 3 Of 170 partners contacted to participate in the study, 100 completed the survey, representing a 59% response rate. The maximum margin of error on the total sample of 100 partners is ±6.3%, at the 95% level of confidence (i.e. 19 times out of 20). This level of accuracy accounts for the finite population factor that is applied to samples taken from populations of limited size. Discussion
• In 2016/17, the name of the measure changed slightly to reflect the perceptions sought through the surveys and to provide clearer meaning to stakeholders. Previously, the measure was named: “Assessment by Basin residents of the Trust’s effectiveness”.
• In 2016/17, the perceptions of residents and partners exceeded our targets.

Columbia Basin Trust
2016/17 Annual Service Plan Report 12
Goal 3: Corporate Operations Support and enable the effective management of the Investment Program and Delivery of Benefits programs and initiatives.
Strategies
• Maintain risk management registers and support a culture where risk assessment is embedded in day-to-day activities.
• Review and implement improvements to the various business processes that support the Trust’s activities, including processes related to contract management, records management and information management systems.
• Foster an open environment of communication and encourage the sharing of information between departments and initiative areas.
• Ensure the Trust is viewed as an employer of choice, including by developing human resources strategies and supports, such as an individualized employee performance framework and appropriate benefits.
• Implement appropriate sustainability principles and practices in the Trust’s everyday activities, including the execution of a corporate carbon neutral plan.
Performance Measure 3.1: Maturity of Planning Practices
Performance Measure 2013/14 Actual
2014/15 Actual
2015/16 Actual
2016/17 Target
2016/17 Actual
2017/18 Target
2018/19 Target
Maturity of Planning Practices
3 3.5 3.5 4 4 4 4
Data Source: The Trust’s Executive Management Committee assesses performance against four levels of criteria that were developed by third-party consultants. Discussion
• Practices are assessed on a scale of 1 to 4, where 1 means there are no high-level plans established, 2 is advancing toward development, 3 is adoption of strategic directions and priorities, and 4 reflects a fully mature state with alignment of resources, follow-through on responsibilities, an established process for updating plans, and monitoring and reporting of progress.
• In 2016/17, we met our target of 4 with the development and advancement of remaining plans to support the implementation of the Trust’s 13 strategic priorities, as well as emphasis on developing performance measurement frameworks to track progress in all strategic areas.

Columbia Basin Trust
2016/17 Annual Service Plan Report 13
Performance Measure 3.2: Maturity of Risk Management Practices
Performance Measure 2013/14 Actual
2014/15 Actual
2015/16 Actual
2016/17 Target
2016/17 Actual
2017/18 Target
2018/19 Target
Maturity of Risk Management Practices
3 3.5 3.5 4 4 4 4
Data Source: The Trust’s Executive Management Committee assesses performance against four levels of criteria that were developed by third-party consultants. Discussion
• Practices are assessed on a scale of 1 to 4, where 1 means corporate risks have not been identified, 2 is advancing toward identifying these risks, 3 is understanding and mitigating risks, and 4 reflects a fully mature state with a robust risk management process in place that involves regular monitoring and updating.
• In 2016/17, we met our target of 4 as we are regularly identifying, monitoring and updating corporate risks at both the organization and department levels.
Performance Measure 3.3: Budget Variance for Corporate Operations
Performance Measure 2013/14 Actual
2014/15 Actual
2015/16 Actual
2016/17 Target
2016/17 Actual
2017/18 Target
2018/19 Target
Budget Variance for Corporate Operations (5.8)% (5.2)% (5.6)% Under
5% (8.1)% Under 5%
Under 5%
Data Source: The data is calculated based on audited year-end financial statements, which are approved by both external auditors and the Board of the Trust. Discussion
• Budget variance is calculated as the difference between the budget for Corporate Operations, approved by our Board of Directors in November each year, and actual results, as reported in our consolidated financial statements at the fiscal year-end.
• In 2016/17, we were under budget by 8.1 per cent, which was primarily due to a reduction in reported staff remuneration as some budgeted positions were not recruited in the fiscal year.

Columbia Basin Trust
2016/17 Annual Service Plan Report 14
Financial Report
Discussion of Results Variance and Trend Analysis Overall, revenues in 2016/17 totaled $59.4 million, which was $1.4 million higher than budgeted. This increase was due primarily to increased power project revenues, as all projects performed well throughout the year, resulting in fewer outages than anticipated. Market Securities exceeded expectations as $1.9 million in revenue was realized compared to the $1.2 million that was budgeted.
In 2016/17, expenses recorded for Delivery of Benefits activities (less rescinds and refunds) totaled $37.5 million, which is $13.4 million less than originally budgeted. This variance from our original budget was expected and forecasted, as the Trust changed its approach to budgeting midway through the past year. This change in approach was premised on the input we received from Basin residents on how the Trust could continue to deliver benefits and meet the needs of the region by not only providing grants, but by also developing and managing assets for community benefit. For financial reporting purposes, these new benefits are capitalized rather than expensed. The net impact of this shift in approach is a reduction in reported expenses and increased surpluses, as noted above in the fiscal year. Over this past year, the Trust purchased a $1.5 million commercial building to further economic development within the region and spent just under $1 million in infrastructure to support our Broadband Initiatives. Both of these items reflected in our financial statements as an increase to our financial and non-financial assets. Community Initiatives expenses increased by $9.7 million primarily due to two new programs that were budgeted under Programs Under Development and then moved to the Community Initiatives category once the programs were fully developed and expensed. It includes a $6.8 million commitment to a new three-year partnership with Heritage BC to implement a new Built Heritage Grants program that will support the preservation, rehabilitation, and/or restoration of built heritage assets. It also reflects a new $2-million Energy Retrofit Program that the Trust launched in partnership with BC Housing and BC Non-Profit Housing Association to upgrade affordable housing in the region. In Social Initiatives, the variance reflects the renewal of our long-standing partnership with Columbia Basin Alliance for Literacy for an additional two years totaling $1 million. The Trust also continued to provide support to environment, social and recreation infrastructure through the commitment of $6.2 million through our various grant intake programs. Administration expenses for 2016/17 totaled $6.5 million, which came in under budget by $571,000, primarily due to a reduction in reported staff remuneration as some budgeted positions were not recruited in the fiscal year. Risks and Uncertainties The performance of our investments are linked in part to the larger regional and global economy. Our investment portfolio performed well during 2016/17 despite ongoing volatility in the broader financial and commodity markets. It requires ongoing oversight to ensure risk is managed appropriately and the long-term forecasted returns are realized.

Columbia Basin Trust
2016/17 Annual Service Plan Report 15
Financial Resource Summary Table
$ thousands 2012/13 Actual
2013/14 Actual
2014/15 Actual
2015/16 Actual
2016/17 Budget*
2016/17 Actual
2016/17 Budget Variance
2015/16-16/17 Variance
Revenues Power Projects $ 19,734 $ 22,825 $ 22,514 $ 34,954 $ 39,240 $ 40,770 $ 1,530 $ 5,816 Waneta Expansion - - - 5,693 10,725 10,230 (495) 4,537 Market Securities 611 1,380 2,558 2,099 1,200 1,938 738 (161) Private Placement: Commercial Loans 925 1,121 1,528 1,722 1,800 1,838 38
116
Private Placement: Real Estate 818 886 1,069 1,262 1,395 1,364 (31) 102 Grant Revenues - - - 412 1,831 1,185 (646) 773 Broadband 400 292 405 449 469 738 269 289 Short-term Investments 1,613 1,208 946 745 1,000 738 (262) (7) Loan Income 1,130 1,135 28 - - - - - Other Revenues 419 506 488 1,360 350 570 220 (790) Total Revenue 25,650 29,353 29,536 48,696 58,010 59,371 1,361 10,675 Expenses Delivery of Benefits Broadband Initiatives** 558 1,234 1,563 5,096 3,261 2,937 324 2,159 Community Initiatives 3,426 7,773 6,866 17,694 11,274 21,020 (9,746) (3,326) Economic Initiatives*** 2,304 6,592 5,074 1,347 1,800 1,685 115 (338) Other Initiatives 47 320 677 416 4,835 2,336 2,499 (1,920) Social Initiatives 5,431 1,674 2,606 1,328 1,350 2,661 (1,311) (1,333) Water and Environment Initiatives 6,118 3,491 3,428 4,941 2,725
2,788
(63)
2,153
Youth Initiatives 1,203 614 1,166 720 4,335 4,035 300 (3,315) Programs Under Development - - - - 21,320 -
21,320
-
Total Delivery of Benefits 19,087 21,698 21,380 31,542 50,900 37,462 13,438 (5,920) Administration Amortization 391 438 427 389 370 509 (139) (120) Board and Committee 200 146 174 132 180 147 33 (15) Communications 130 185 164 172 190 196 (6) (24) Corporate Travel and Meetings 218 189 239 192 240 221 19 (29) Information Technology 105 81 119 193 200 225 (25) (32) Office and General 534 532 577 667 630 620 10 47 Professional Fees 370 404 429 260 405 184 221 76 Staff Remuneration and Development 3,968 3,924 3,978 4,242 4,845 4,387 458 (145) Total Administration 5,916 5,899 6,107 6,247 7,060 6,489 571 (242) Total Expenses 25,003 27,597 27,487 37,789 57,960 43,951 14,009 (6,162) Private Placements: Impairment Loss 1,400 - 625 - - -
-
-
Annual Surplus/(Deficit) (753) 1,756 1,424 10,907 50 15,420 (15,370) 4,513 Total Debt 1,056 1,029 1,000 925 939 3,695 (2,756) 2,770 Accumulated Surplus 410,919 414,646 419,130 426,780 424,084 446,373 22,289 19,593
Note 1: The above financial information was prepared based on current Generally Accepted Accounting Principles. * The 2016/17 Budget included in this table was approved by the Trust Board of Directors in January 2016. The forecast included in
the 2016/17–2018/19 Service Plan in the Trust’s financial outlook table was derived from the Treasury Board Submission of January 2016, which included the most recent forecasts at that time.
** Broadband Initiatives includes direct CBBC costs, as well as other broadband initiatives funded directly by both CBBC and the Trust for the benefit of the Basin.
*** Economic Initiatives includes direct CBDC costs, as well as other economic initiatives funded directly by both CBDC and the Trust for the benefit of the Basin.

Columbia Basin Trust
2016/17 Annual Service Plan Report 16
Consolidated Financial Statements AS AT MARCH 31, 2017 Table of Contents Responsibility for Financial Reporting ......................................................................................... 17 Independent Auditors’ Report ....................................................................................................... 18 Consolidated Financial Statements
Statement of Financial Position ................................................................................................ 19 Statement of Operations ........................................................................................................... 20 Statement of Remeasurement Gains and Losses ...................................................................... 21 Statement of Change in Accumulated Surplus ......................................................................... 21 Statement of Change in Net Financial Assets .......................................................................... 22 Statement of Cash Flows .......................................................................................................... 23 Notes to Financial Statements .................................................................................................. 24

Columbia Basin Trust
The accompanying notes are an integral part of these consolidated financial statements. 2016/17 Annual Service Plan Report 17
Responsibility for Financial Reporting Management is responsible for the preparation of the accompanying consolidated financial statements and all of the information contained in the Annual Report. The consolidated financial statements have been prepared in accordance with the financial reporting provisions of Section 23.1 of the Budget Transparency and Accountability Act of the Province of British Columbia and include amounts that are based on estimates and judgements. Management believes that the consolidated financial statements fairly present the Trust's consolidated financial position and results of operations. The integrity of the information presented in the consolidated financial statements, including estimates and judgements relating to matters not concluded by fiscal year end, is the responsibility of management. The consolidated financial statements have been approved by the Trust's Board of Directors.
Management has established and maintained appropriate systems of internal control which are designed to provide reasonable assurance that the Trust's assets are safeguarded and that reliable financial records are maintained to form a proper basis for preparation of consolidated financial statements. These systems include formal written policies and appropriate delegation of authority and segregation of responsibilities within the organization.
The independent external auditors, KPMG, Chartered Professional Accountants, have been appointed by the Trust's Board of Directors, to express an opinion as to whether the consolidated financial statements present fairly, in all material respects, the Trust's financial position, results of operations, changes in net assets and cash flows in conformity with the financial reporting provisions of Section 23.1 of the Budget Transparency and Accountability Act of the Province of British Columbia. The Auditor's report follows and outlines the scope of their examination and their opinion on the consolidated financial statements. The Board of Directors, through the Finance and Audit Committee, is responsible for ensuring that management fulfills its responsibility for financial reporting and internal controls. The Finance and Audit Committee, comprised of directors who are not employees, meets regularly with the external auditors and management to satisfy itself that each group has properly discharged its responsibility to review the consolidated financial statements before recommending approval by the Board of Directors. The external auditors have full and open access to the Finance and Audit Committee, with and without the presence of management.
Johnny Strilaeff Christine Lloyd, CPA, CGA President & CEO Director, Finance & Operations

Columbia Basin Trust
The accompanying notes are an integral part of these consolidated financial statements. 2016/17 Annual Service Plan Report 18
Columbia Basin Trust
The accompanying notes are an integral part of these consolidated financial statements. 2016/17 Annual Service Plan Report 19
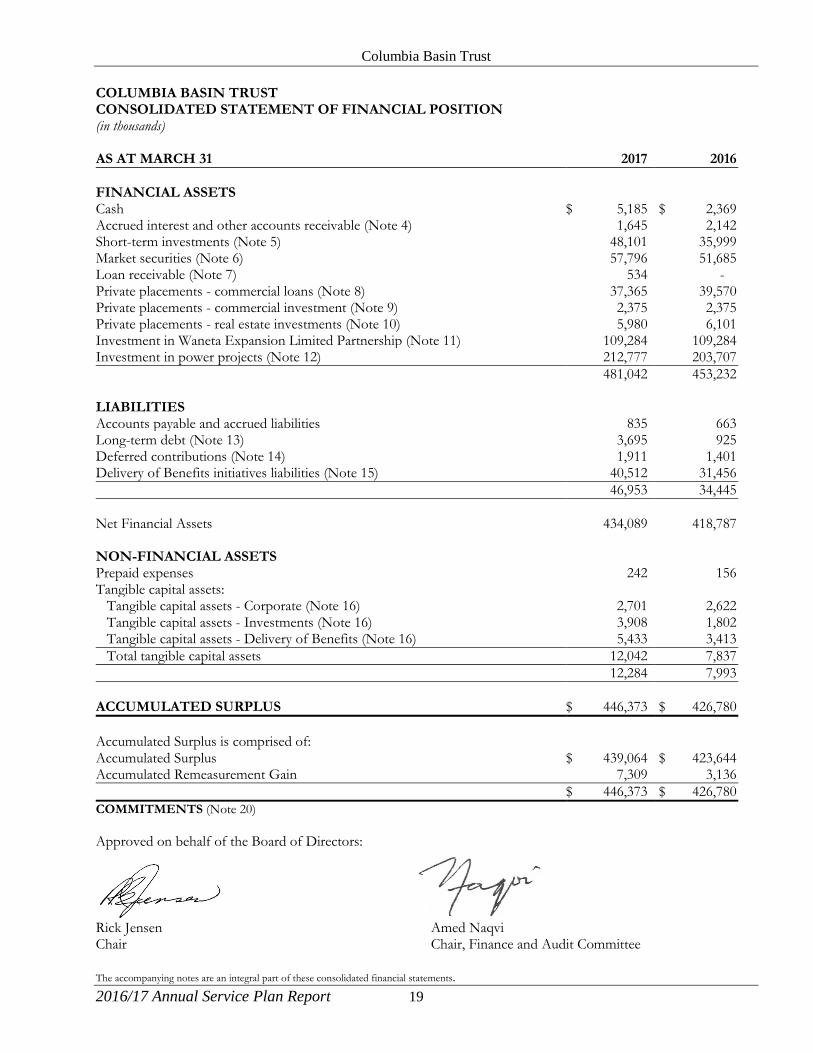
COLUMBIA BASIN TRUST CONSOLIDATED STATEMENT OF FINANCIAL POSITION (in thousands) AS AT MARCH 31 2017 2016 FINANCIAL ASSETS Cash $ 5,185 $ 2,369 Accrued interest and other accounts receivable (Note 4) 1,645 2,142 Short-term investments (Note 5) 48,101 35,999 Market securities (Note 6) 57,796 51,685 Loan receivable (Note 7) 534 - Private placements - commercial loans (Note 8) 37,365 39,570 Private placements - commercial investment (Note 9) 2,375 2,375 Private placements - real estate investments (Note 10) 5,980 6,101 Investment in Waneta Expansion Limited Partnership (Note 11) 109,284 109,284 Investment in power projects (Note 12) 212,777 203,707 481,042 453,232 LIABILITIES Accounts payable and accrued liabilities 835 663 Long-term debt (Note 13) 3,695 925 Deferred contributions (Note 14) 1,911 1,401 Delivery of Benefits initiatives liabilities (Note 15) 40,512 31,456 46,953 34,445 Net Financial Assets 434,089 418,787 NON-FINANCIAL ASSETS Prepaid expenses 242 156 Tangible capital assets: Tangible capital assets - Corporate (Note 16) 2,701 2,622 Tangible capital assets - Investments (Note 16) 3,908 1,802 Tangible capital assets - Delivery of Benefits (Note 16) 5,433 3,413 Total tangible capital assets 12,042 7,837 12,284 7,993 ACCUMULATED SURPLUS $ 446,373 $ 426,780 Accumulated Surplus is comprised of: Accumulated Surplus $ 439,064 $ 423,644 Accumulated Remeasurement Gain 7,309 3,136 $ 446,373 $ 426,780 COMMITMENTS (Note 20) Approved on behalf of the Board of Directors:
Rick Jensen Amed Naqvi Chair Chair, Finance and Audit Committee
Columbia Basin Trust
The accompanying notes are an integral part of these consolidated financial statements. 2016/17 Annual Service Plan Report 20
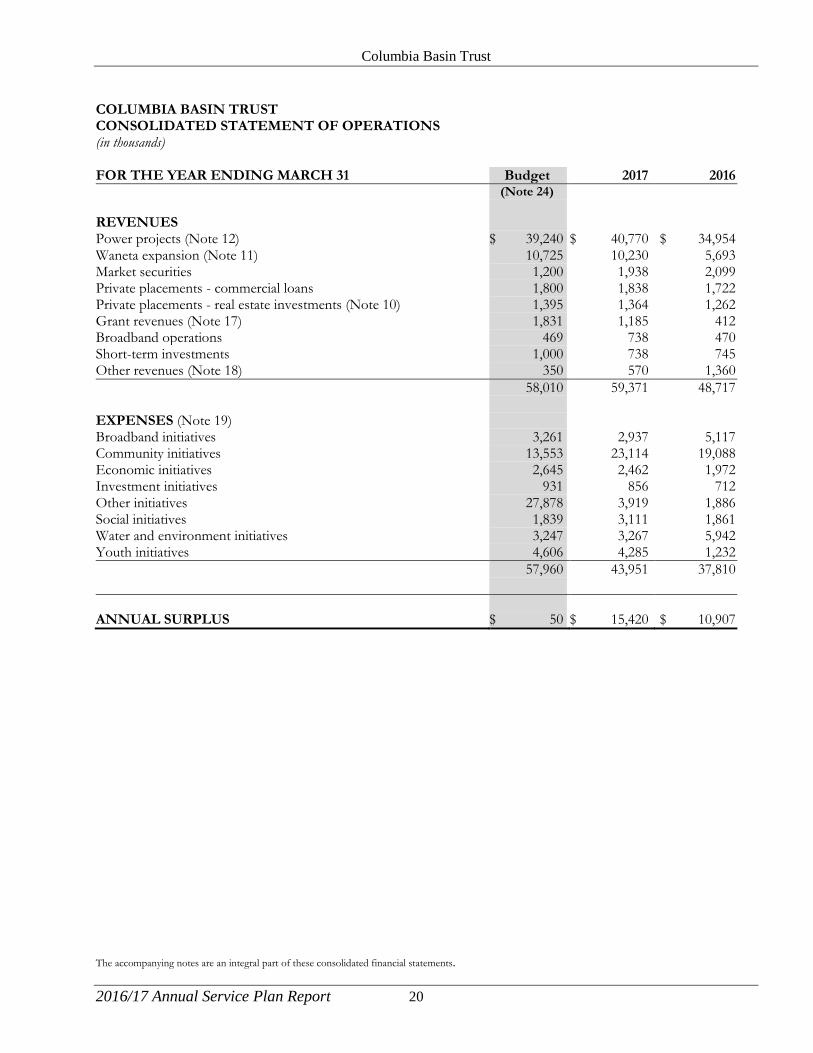
COLUMBIA BASIN TRUST CONSOLIDATED STATEMENT OF OPERATIONS (in thousands) FOR THE YEAR ENDING MARCH 31 Budget 2017 2016 (Note 24)
REVENUES Power projects (Note 12) $ 39,240 $ 40,770 $ 34,954 Waneta expansion (Note 11) 10,725 10,230 5,693 Market securities 1,200 1,938 2,099 Private placements - commercial loans 1,800 1,838 1,722 Private placements - real estate investments (Note 10) 1,395 1,364 1,262 Grant revenues (Note 17) 1,831 1,185 412 Broadband operations 469 738 470 Short-term investments 1,000 738 745 Other revenues (Note 18) 350 570 1,360 58,010 59,371 48,717 EXPENSES (Note 19) Broadband initiatives 3,261 2,937 5,117 Community initiatives 13,553 23,114 19,088 Economic initiatives 2,645 2,462 1,972 Investment initiatives 931 856 712 Other initiatives 27,878 3,919 1,886 Social initiatives 1,839 3,111 1,861 Water and environment initiatives 3,247 3,267 5,942 Youth initiatives 4,606 4,285 1,232 57,960 43,951 37,810 ANNUAL SURPLUS $ 50 $ 15,420 $ 10,907

Columbia Basin Trust
The accompanying notes are an integral part of these consolidated financial statements. 2016/17 Annual Service Plan Report 21
COLUMBIA BASIN TRUST CONSOLIDATED STATEMENT OF REMEASUREMENT GAINS AND LOSSES (in thousands) FOR THE YEAR ENDING MARCH 31 2017 2016 Accumulated remeasurement gains, beginning of year $ 3,136 $ 6,137 Unrealized gains (losses) on market securities 4,886 (2,126) Realized gains reclassified to the Statement of Operations (713) (875) Net remeasurement gains (losses) for the year 4,173 (3,001) ACCUMULATED REMEASUREMENT GAINS, end of year (Note 6) $ 7,309 $ 3,136 CONSOLIDATED STATEMENT OF CHANGE IN ACCUMULATED SURPLUS (in thousands) FOR THE YEAR ENDING MARCH 31 2017 2016 Accumulated surplus, beginning of year $ 423,644 $ 412,737 Annual surplus 15,420 10,907 ACCUMULATED SURPLUS, end of year $ 439,064 $ 423,644

Columbia Basin Trust
The accompanying notes are an integral part of these consolidated financial statements. 2016/17 Annual Service Plan Report 22
COLUMBIA BASIN TRUST CONSOLIDATED STATEMENT OF CHANGE IN NET FINANCIAL ASSETS (in thousands) FOR THE YEAR ENDING MARCH 31 Budget 2017 2016 (Note 23)
ANNUAL SURPLUS $ 50 $ 15,420 $ 10,907 Acquisition of prepaid expenses - (242) (156) Use of prepaid expenses - 156 182 Acquisition of tangible capital assets - (5,202) (1,872) Disposal of tangible capital assets - - 77 Amortization of tangible capital assets 370 997 746 370 (4,291) (1,023) Effect of remeasurement gain - 4,173 (3,001) Change in Net Financial Assets 420 15,302 6,883 NET FINANCIAL ASSETS, beginning of year 418,787 418,787 411,904 NET FINANCIAL ASSETS, end of year $ 419,207 $ 434,089 $ 418,787

Columbia Basin Trust
The accompanying notes are an integral part of these consolidated financial statements. 2016/17 Annual Service Plan Report 23
COLUMBIA BASIN TRUST CONSOLIDATED STATEMENT OF CASH FLOWS (in thousands) FOR THE YEAR ENDING MARCH 31 2017 2016 CASH FLOWS FROM (APPLIED TO) OPERATING ACTIVITIES Cash received from private placements - commercial loans $ 1,738 $ 1,635 Cash received from broadband operations 2,416 2,288 Cash received from short-term investments 731 1,619 Cash received from market securities 1,938 2,099 Cash received from tenants 506 416 Cash paid for operating expenses (7,322) (7,568) Cash paid for Delivery of Benefits obligations (26,460) (25,465) (26,453) (24,976) CASH FLOWS FROM (APPLIED TO) INVESTING ACTIVITIES Investment in Waneta Expansion Limited Partnership - (1,370) Purchase of short-term investments and market securities (139,073) (187,890) Redemption of short-term investments and market securities 125,032 186,172 Issuance of commercial loans (11,857) (15,611) Repayment of commercial loans 14,078 9,015 Issuance of other loans (578) - Repayment of other loans 16 - Dividends received from real estate investments 1,484 1,525 Dividends received from Waneta Expansion 10,230 5,693 Dividends received from power projects investments 31,700 28,148 31,032 25,682 CASH FLOWS APPLIED TO CAPITAL TRANSACTIONS Purchase of tangible capital assets, net of disposals (5,202) (1,795) CASH FLOWS FROM (APPLIED TO) FINANCING ACTIVITIES Advances to Brilliant Power 700 (700) Repayment of debt (63) (110) Advances from Community Foundations 2,802 - 3,439 (810) INCREASE (DECREASE) IN CASH 2,816 (1,899) CASH, beginning of year 2,369 4,268 CASH, end of year $ 5,185 $ 2,369

NOTES TO THE CONSOLIDATED FINANCIAL STATEMENTS As at March 31, 2017 and March 31, 2016 (Tabular amounts in thousands)
2016/17 Annual Service Plan Report 24
1. NATURE OF COLUMBIA BASIN TRUST Columbia Basin Trust (the Trust) is a corporation established by the Columbia Basin Trust Act. The purpose of the Trust is to manage its assets for the ongoing economic, social and environmental well-being of the Columbia Basin (Basin) region. The sole share of the Trust is held by the Minister of Finance on behalf of the Province of BC. 2. SUMMARY OF SIGNIFICANT ACCOUNTING POLICIES The consolidated financial statements of the Trust are prepared by management in accordance with the basis of accounting described below. Significant accounting policies of the Trust are as follows: (a) Basis of accounting The consolidated financial statements have been prepared in accordance with Section 23.1 of the Budget Transparency and Accountability Act of the Province of British Columbia (Section 23.1) supplemented by Regulations 257/2010 and 198/2011 (Regulations) issued by the Province of British Columbia Treasury Board. The Budget Transparency and Accountability Act requires that the consolidated financial statements be prepared in accordance with the set of standards and guidelines that comprise generally accepted accounting principles for senior governments in Canada, or if the Treasury Board makes a regulation, the set of standards and guidelines that comprise generally accepted accounting principles for senior governments in Canada as modified by the alternate standard or guideline or part thereof adopted in the regulation. Regulation 257/2010 requires all tax-payer supported organizations to adopt Canadian public sector accounting standards without any PS4200 elections. Regulation 198/2011 requires that restricted contributions received or receivable are to be reported as revenue depending on the nature of the restrictions on the use of the funds by the contributors as follows: i) Contributions for the purpose of acquiring or developing a depreciable tangible capital asset or
contributions in the form of a depreciable tangible capital asset are recorded and referred to as deferred capital contributions and recognized in revenue at the same rate that amortization of the related tangible capital asset is recorded. The reduction of the deferred capital contributions and the recognition of the revenue are accounted for over the fiscal periods during which the tangible capital asset is used to provide services.
ii) Contributions restricted for specific purposes other than those for the acquisition or development of a
depreciable tangible capital asset are recorded as deferred contributions and recognized in revenue in the year in which the stipulation or restriction on the contributions have been met.
For British Columbia tax-payer supported organizations, these contributions include government transfers and externally restricted contributions. The accounting policy requirements under Regulation 198/2011 are significantly different from the requirements of Canadian public sector accounting standards which requires that: i) government transfers that do not contain a stipulation that creates a liability be recognized as revenue by the
recipient when approved by the transferor and the eligibility criteria have been met in accordance with public sector accounting standard PS3410; and
NOTES TO THE CONSOLIDATED FINANCIAL STATEMENTS As at March 31, 2017 and March 31, 2016 (Tabular amounts in thousands)
2016/17 Annual Service Plan Report 25
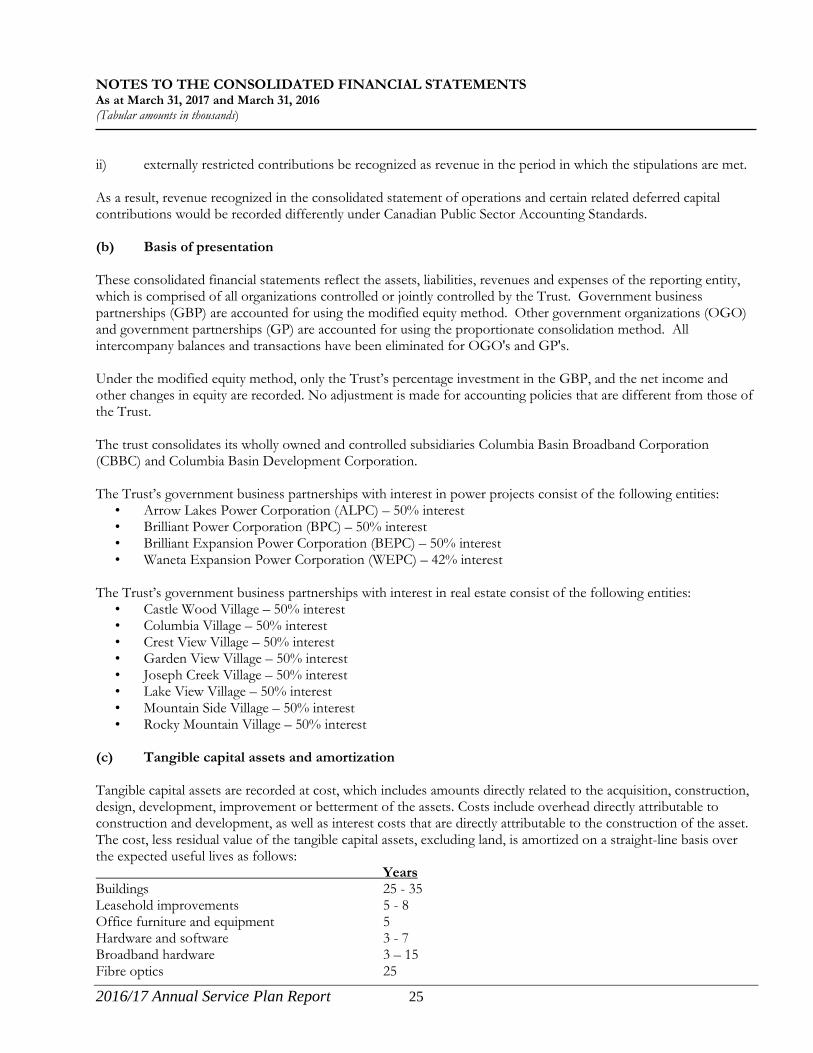
ii) externally restricted contributions be recognized as revenue in the period in which the stipulations are met. As a result, revenue recognized in the consolidated statement of operations and certain related deferred capital contributions would be recorded differently under Canadian Public Sector Accounting Standards. (b) Basis of presentation These consolidated financial statements reflect the assets, liabilities, revenues and expenses of the reporting entity, which is comprised of all organizations controlled or jointly controlled by the Trust. Government business partnerships (GBP) are accounted for using the modified equity method. Other government organizations (OGO) and government partnerships (GP) are accounted for using the proportionate consolidation method. All intercompany balances and transactions have been eliminated for OGO's and GP's. Under the modified equity method, only the Trust’s percentage investment in the GBP, and the net income and other changes in equity are recorded. No adjustment is made for accounting policies that are different from those of the Trust. The trust consolidates its wholly owned and controlled subsidiaries Columbia Basin Broadband Corporation (CBBC) and Columbia Basin Development Corporation. The Trust’s government business partnerships with interest in power projects consist of the following entities: • Arrow Lakes Power Corporation (ALPC) – 50% interest • Brilliant Power Corporation (BPC) – 50% interest • Brilliant Expansion Power Corporation (BEPC) – 50% interest • Waneta Expansion Power Corporation (WEPC) – 42% interest The Trust’s government business partnerships with interest in real estate consist of the following entities: • Castle Wood Village – 50% interest • Columbia Village – 50% interest • Crest View Village – 50% interest • Garden View Village – 50% interest • Joseph Creek Village – 50% interest • Lake View Village – 50% interest • Mountain Side Village – 50% interest • Rocky Mountain Village – 50% interest (c) Tangible capital assets and amortization Tangible capital assets are recorded at cost, which includes amounts directly related to the acquisition, construction, design, development, improvement or betterment of the assets. Costs include overhead directly attributable to construction and development, as well as interest costs that are directly attributable to the construction of the asset. The cost, less residual value of the tangible capital assets, excluding land, is amortized on a straight-line basis over the expected useful lives as follows: Years Buildings 25 - 35 Leasehold improvements 5 - 8 Office furniture and equipment 5 Hardware and software 3 - 7 Broadband hardware 3 – 15 Fibre optics 25
NOTES TO THE CONSOLIDATED FINANCIAL STATEMENTS As at March 31, 2017 and March 31, 2016 (Tabular amounts in thousands)
2016/17 Annual Service Plan Report 26
Tangible capital assets are written down to their residual value when conditions indicate they no longer contribute to the Trust’s ability to provide goods and services, or when the value of future economic benefits associated with the tangible capital assets are less than their net book value. The write-downs are accounted for as expenses in the statement of operations. Transfers of capital assets from related parties are recorded at carrying value. (d) Revenue recognition Revenues are recognized in the period in which the transaction or event occurs that gives rise to the revenues. All revenues are recorded on an accrual basis, except when the accruals cannot be determined with a reasonable degree of certainty or when their estimation is impracticable. Regulation 198/2011 requires that restricted contributions received or receivable are to be reported as revenue depending on the nature of the restrictions on the use of the funds by the contributors as follows: i) Contributions for the purpose of acquiring or developing a depreciable tangible capital asset or
contributions in the form of a depreciable tangible capital asset are recorded and referred to as deferred capital contributions and recognized in revenue at the same rate that amortization of the related tangible capital asset is recorded. The reduction of the deferred capital contributions and the recognition of the revenue are accounted for over the fiscal period during which the tangible capital asset is used to provide services.
ii) Contributions restricted for specific purposes other than those for the acquisition or development of a depreciable tangible capital asset are recorded as deferred contributions and recognized in revenue in the year in which the stipulation or restriction on the contributions have been met.
For British Columbia tax-payer supported organizations, these contributions include government transfers and externally restricted contributions. Contributions from other sources are deferred when restrictions are placed on their use by the contributor, and are recognized as revenue when used for the specific purpose. Revenue related to fees or services received in advance of the fee being earned or the service being performed is deferred and recognized when the fee is earned or service performed. (e) Expenses Expenses are reported on an accrual basis when the goods have been received or the services have been provided. The cost of all goods consumed and services received during the year is expensed. Expenses are classified by function on the statement of operations. The Trust allocates administration costs by identifying an appropriate basis of allocating and applying that basis consistently each year. Government transfers are recognized in the consolidated financial statements in the period in which the amounts of the transfers are authorized and any eligibility criteria have been met by the recipient. (f) Taxes The Trust and its wholly owned subsidiaries are exempt from income taxes under paragraph 149(1)(d) of the Income Tax Act. The Trust is also exempt from Federal Large Corporations Tax under subsection 181.1(3) of the Income Tax Act.

NOTES TO THE CONSOLIDATED FINANCIAL STATEMENTS As at March 31, 2017 and March 31, 2016 (Tabular amounts in thousands)
2016/17 Annual Service Plan Report 27
(g) Foreign currency translation Foreign currency transactions are translated at the exchange rates prevailing at the dates of transactions. Monetary assets and liabilities included in the fair value measurement category denominated in foreign currencies, are translated into Canadian dollars at the exchange rate prevailing at the financial statement date. Unrealized foreign exchange gains and losses are recognized in the statement of remeasurement gains and losses. In the period of settlement, realized foreign exchange gains and losses are recognized in the statement of operations, and the cumulative amount of remeasurement gains and losses is reversed in the statement of remeasurement gains and losses. (h) Financial instruments Derivatives and equity instruments quoted in an active market are measured at fair value. The Trust measures other specific financial instruments at cost and amortized cost to correspond with how they are evaluated and managed. Financial instruments measured at fair value are classified as level one, two or three for the purposes of describing the basis of the inputs used to measure the fair values, as described below: Level 1: Quoted prices (unadjusted) in active markets for identical assets or liabilities; Level 2: Market-based inputs other than quoted prices that are observable for the asset or liability either
directly or indirectly; and Level 3: Inputs for the asset or liability that are not based on observable market data; assumptions are based
on the best internal and external information available and are most suitable and appropriate based on the type of financial instrument being valued in order to establish what the transaction price would have been on the measurement date in an arm’s length transaction.
Unrealized gains and losses from changes in the fair value of financial instruments are recognized in the statement of remeasurement gains and losses. Upon settlement, the cumulative gain or loss is reclassified from the statement of remeasurement gains and losses and recognized in the statement of operations. For financial instruments measured using amortized cost, amortized cost is defined as the amount at which a financial asset or financial liability is measured at initial recognition minus principal repayments, plus or minus cumulative amortization using the effective interest method and minus any impairment losses. The effective interest rate method is used to determine interest revenue or expense. For portfolio investments measured at cost, the cost method records the initial investment at cost and earnings from such investments are recognized only to the extent received or receivable. When an investment is written down to recognize an impairment loss, the new carrying value is deemed to be the new cost basis for subsequent accounting purposes. Interest and dividends attributable to financial instruments are reported in the statement of operations. Financial assets are tested annually for impairment. When financial assets are impaired, impairment losses are recorded in the statement of operations and any related fair value changes previously recorded in the statement of remeasurement gains and losses are reversed to the extent of the impairment. Impairment losses are not reversed for a subsequent increase in value.

NOTES TO THE CONSOLIDATED FINANCIAL STATEMENTS As at March 31, 2017 and March 31, 2016 (Tabular amounts in thousands)
2016/17 Annual Service Plan Report 28
Transaction costs are a component of cost for financial instruments measured using cost or amortized cost. Transaction costs are expensed for financial instruments measured at fair value. The Trust has designated its financial instruments as follows: i) Cash
Cash includes cash in the bank and is measured at fair value. The Trust presents its Statement of Cash Flows using the direct method.
ii) Short-term investments
Short-term investments are accounted for as portfolio investments. Investments quoted in an active market are reported at fair value and other investments are recorded at cost or amortized cost. These investments are highly liquid and held for the purpose of meeting short-term cash commitments. Investments reported at fair value recognize any changes in fair value in the statement of remeasurement gains and losses.
iii) Market securities
Equity and debt investments quoted in an active market are reported at fair value. The Trust invests in long-term investments through pooled fund products managed by the British Columbia Investment Management Corporation, a corporation established under the Public Sector Pension Plans Act. The Trust has a diversified securities portfolio that includes short-term deposits, bonds and equities. Market securities are accounted for as portfolio investments and are reported at fair value with changes in fair value recognized in the statement of remeasurement gains and losses.
iv) Investment in Waneta Expansion Limited Partnership
The Trust accounts for its investment in Waneta Expansion Limited Partnership (WELP) as a portfolio investment and it is measured on a cost basis.
v) Private placements and loan receivable
Investments in commercial loans or loans receivable are recorded at amortized cost less any amount for impairments. Impairment losses are recorded to reflect loans receivable at the lower of amortized cost and the net recoverable value, when collectability and risk of loss exists. Impairments are recognized in the statement of operations. Interest is accrued on loans receivable to the extent it is deemed collectable. Commercial investments that have an equity interest are accounted for as portfolio investments and are measured at cost, less any amounts written off to reflect a permanent decline in value.
vi) Debt and other financial assets and financial liabilities
Debt, accrued interest and other assets, and accounts payable and accrued liabilities are measured at amortized cost and are recorded at amortized cost using the effective interest method.
(i) Employee future benefits The Trust and its employees make contributions to the Public Sector Pension Plan, which is a multi-employer defined benefit pension plan. Multi-employer defined benefit pension plans are accounted for as defined contribution plans. As a result, the Trust’s contributions are expensed as paid. Non-vesting sick leave benefits

NOTES TO THE CONSOLIDATED FINANCIAL STATEMENTS As at March 31, 2017 and March 31, 2016 (Tabular amounts in thousands)
2016/17 Annual Service Plan Report 29
accrue to the Trust’s employees with no obligation to pay sick leave benefits until the employee is injured or ill. The liability related to these benefits was actuarially determined based on length of service, best estimate of retirement ages and expected future salary and wage increases. The liability is accrued based on projected benefits pro-rated as employees render services necessary to earn the future benefits. The Trust estimated and determined its obligation for short-term disability benefits to be immaterial to recognize. (j) Measurement uncertainty The preparation of these consolidated financial statements requires management to make estimates and assumptions that affect the reported amounts of assets and liabilities, and disclosure of contingent assets and liabilities, at the date of the consolidated financial statements and the reported amounts of the revenues and expenses during the period. Significant estimates include assumptions used for recording specific impairments and general loan loss provisions on commercial loans and loans receivable and for identifying any impairment for the Trust's investment in Waneta Expansion Limited Partnership or its commercial investment. Estimates are based on the best information available at the time of preparation of the consolidated financial statements and are reviewed annually to reflect new information as it becomes available. Measurement uncertainty exists in these consolidated financial statements. Actual results could differ from these estimates. (k) Contaminated sites A liability for contaminated sites is recognized when a site is not in productive use and the following criteria are met: i) an environmental standard exists; ii) contamination exceeds the environmental standard; iii) the Trust is directly responsible or accepts responsibility; iv) it is expected that future economic benefits will be given up; and v) a reasonable estimate of the amount can be made. The liability is recognized as management's estimate of the cost of post-remediation including operation, maintenance and monitoring that are an integral part of the remediation strategy for a contaminated site. 3. COMPARATIVE FIGURES Certain prior year figures have been reclassified to conform with the current year's presentation. 4. ACCRUED INTEREST AND OTHER ACCOUNTS RECEIVABLE Accrued interest and other accounts receivable consist of accrued interest on short-term investments, receivables and recoveries for management and information technology services. 5. SHORT-TERM INVESTMENTS Short-term investments consist of a portfolio of short-term deposits held at financial institutions and with the British Columbia Investment Management Corporation and are allocated as follows: Fair value
hierarchy level 2017
2016
Term securities: measured at amortized cost - $ 48,101 $ 35,999

NOTES TO THE CONSOLIDATED FINANCIAL STATEMENTS As at March 31, 2017 and March 31, 2016 (Tabular amounts in thousands)
2016/17 Annual Service Plan Report 30
6. MARKET SECURITIES The Trust has a diversified securities portfolio that includes short-term deposits, bond and equity funds, which is managed by the British Columbia Investment Management Corporation. The Trust's investment in market securities measured at fair value is as follows: Fair value
hierarchy level 2017
2016
Market value 1 $ 57,796 $ 51,685 Cost 50,487 48,549 Accumulated remeasurement gains $ 7,309 $ 3,136 During fiscal year 2017, the Trust recognized realized gains on market securities of $713,000 (2016 - $875,000). 7. LOAN RECEIVABLE The Trust provides funding through the Impact Investment Program to businesses challenged with obtaining financing from other sources. These loans are generally secured by assets and personal guarantees which bear interest from 4.0% to 6.7% and currently have terms extending no further than 20 years. 8. PRIVATE PLACEMENTS – COMMERCIAL LOANS The Trust provides commercial loans that are generally secured by real estate and currently have terms extending no further than 25 years. Commercial loans are as follows: 2017 2016 Commercial loans bearing interest from 3.60% to 7.5% $ 37,628 $ 39,849 Less: general impairment loss (263) (279) $ 37,365 $ 39,570 9. PRIVATE PLACEMENTS – COMMERCIAL INVESTMENT This commercial equity investment in a private company is accounted for as a portfolio investment and measured at cost. 10. PRIVATE PLACEMENTS – REAL ESTATE INVESTMENTS The Trust's real estate investments are comprised of 50% ownership interests in real estate investments throughout the Basin consisting of eight seniors housing facilities (see listing of joint ventures in Note 2). These investments are accounted for as investments in GBP's using the modified equity basis of accounting.
NOTES TO THE CONSOLIDATED FINANCIAL STATEMENTS As at March 31, 2017 and March 31, 2016 (Tabular amounts in thousands)
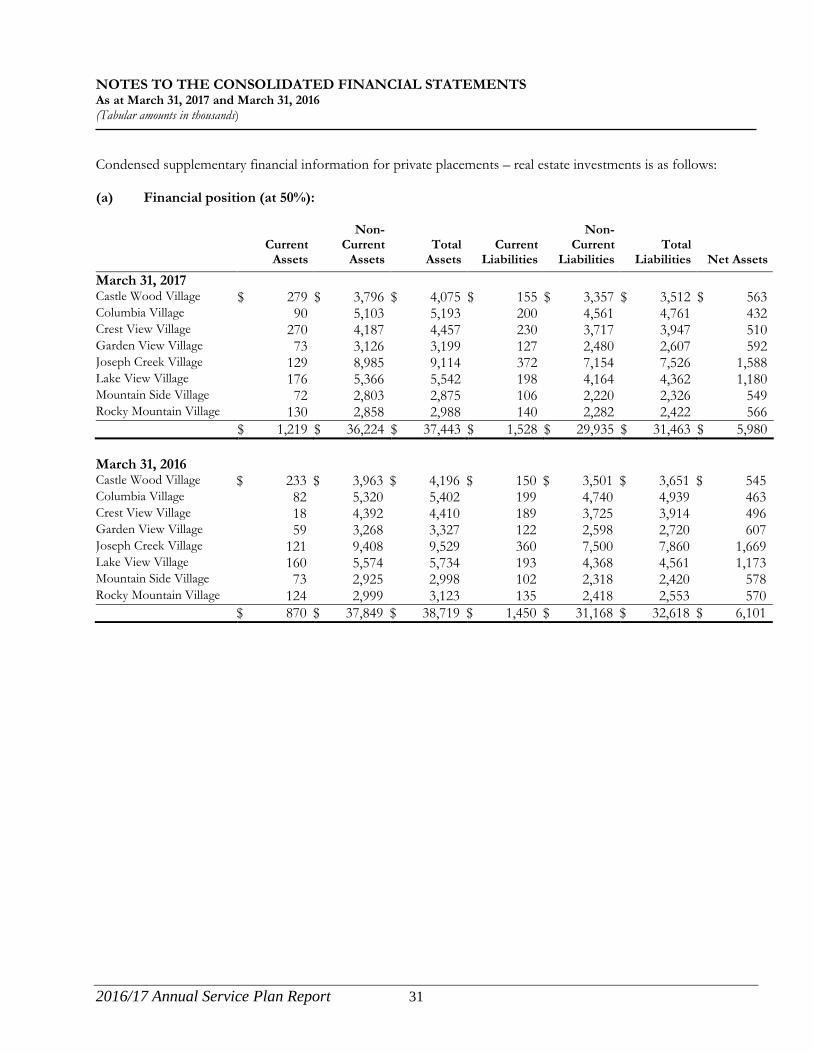
2016/17 Annual Service Plan Report 31
Condensed supplementary financial information for private placements – real estate investments is as follows: (a) Financial position (at 50%):
Current
Assets
Non- Current
Assets
Total
Assets
Current
Liabilities
Non- Current
Liabilities
Total
Liabilities
Net Assets
March 31, 2017 Castle Wood Village $ 279 $ 3,796 $ 4,075 $ 155 $ 3,357 $ 3,512 $ 563 Columbia Village 90 5,103 5,193 200 4,561 4,761 432 Crest View Village 270 4,187 4,457 230 3,717 3,947 510 Garden View Village 73 3,126 3,199 127 2,480 2,607 592 Joseph Creek Village 129 8,985 9,114 372 7,154 7,526 1,588 Lake View Village 176 5,366 5,542 198 4,164 4,362 1,180 Mountain Side Village 72 2,803 2,875 106 2,220 2,326 549 Rocky Mountain Village 130 2,858 2,988 140 2,282 2,422 566 $ 1,219 $ 36,224 $ 37,443 $ 1,528 $ 29,935 $ 31,463 $ 5,980 March 31, 2016 Castle Wood Village $ 233 $ 3,963 $ 4,196 $ 150 $ 3,501 $ 3,651 $ 545 Columbia Village 82 5,320 5,402 199 4,740 4,939 463 Crest View Village 18 4,392 4,410 189 3,725 3,914 496 Garden View Village 59 3,268 3,327 122 2,598 2,720 607 Joseph Creek Village 121 9,408 9,529 360 7,500 7,860 1,669 Lake View Village 160 5,574 5,734 193 4,368 4,561 1,173 Mountain Side Village 73 2,925 2,998 102 2,318 2,420 578 Rocky Mountain Village 124 2,999 3,123 135 2,418 2,553 570 $ 870 $ 37,849 $ 38,719 $ 1,450 $ 31,168 $ 32,618 $ 6,101

NOTES TO THE CONSOLIDATED FINANCIAL STATEMENTS As at March 31, 2017 and March 31, 2016 (Tabular amounts in thousands)
2016/17 Annual Service Plan Report 32
(b) Results of operations (at 50%):
Revenue
Finance Charges
Operations
Amortization
Total Expense
Surplus
March 31, 2017 Castle Wood Village $ 525 $ 133 $ 3 $ 199 $ 335 $ 190 Columbia Village 528 186 3 228 417 111 Crest View Village 559 141 3 211 355 204 Garden View Village 362 117 2 146 265 97 Joseph Creek Village 1,094 305 16 432 753 341 Lake View Village 546 135 - 208 343 203 Mountain Side Village 310 90 7 126 223 87 Rocky Mountain Village 374 98 4 141 243 131 $ 4,298 $ 1,205 $ 38 $ 1,691 $ 2,934 $ 1,364 March 31, 2016 Castle Wood Village $ 525 $ 138 $ 1 $ 194 $ 333 $ 192 Columbia Village 528 197 - 228 425 103 Crest View Village 559 187 5 210 402 157 Garden View Village 362 123 1 145 269 93 Joseph Creek Village 1,094 318 2 425 745 349 Lake View Village 545 192 1 208 401 144 Mountain Side Village 310 90 1 125 216 94 Rocky Mountain Village 374 103 - 141 244 130 $ 4,297 $ 1,348 $ 11 $ 1,676 $ 3,035 $ 1,262 (c) Investment in private placements – real estate (at 50%):
Castle Wood
Village
Columbia
Village
Crest View
Village
Garden View
Village
Joseph Creek
Village
Lake View
Village
MountainSide
Village
Rocky Mountain
Village
Total
March 31, 2017 Opening balance $ 545 $ 463 $ 496 $ 607 $ 1,669 $ 1,173 $ 578 $ 570 $ 6,101 Dividends paid (172) (142) (190) (112) (422) (196) (116) (135) (1,485) Surplus 190 111 204 97 341 203 87 131 1,364 $ 563 $ 432 $ 510 $ 592 $ 1,588 $ 1,180 $ 549 $ 566 $ 5,980 March 31, 2016 Opening balance $ 594 $ 503 $ 522 $ 627 $ 1,741 $ 1,205 $ 599 $ 573 $ 6,364 Dividends paid (241) (143) (183) (113) (421) (176) (115) (133) (1,525) Surplus 192 103 157 93 349 144 94 130 1,262 $ 545 $ 463 $ 496 $ 607 $ 1,669 $ 1,173 $ 578 $ 570 $ 6,101

NOTES TO THE CONSOLIDATED FINANCIAL STATEMENTS As at March 31, 2017 and March 31, 2016 (Tabular amounts in thousands)
2016/17 Annual Service Plan Report 33
(d) Non-current assets: The Trust's investment in real estate, comprised of seniors housing facilities, is as follows (at 50%): Land Building and
Equipment
2017
2016 Operating facilities $ 2,728 $ 49,209 $ 51,937 $ 51,878 Less: accumulated amortization - (15,713) (15,713) (14,029) $ 2,728 $ 33,496 $ 36,224 $ 37,849 (e) Current and non-current liabilities: i) Long-term debt Long-term debt consisting of mortgage loans are included in current and non-current liabilities of the real estate entities. The purpose of the mortgage loans was to provide financing for the acquisition of land and the construction of seniors housing facilities. These loans have interest rates varying between 3.26% and 4.44% and will mature on different dates between July 2018 and April 2023. The loans are repayable in equal monthly payments of principal and interest, were originally amortized over 25 years and are secured by first charges, both fixed and floating, over the assets of the seniors housing facilities to which they relate. ii) Indemnities by joint venturers The joint venturers of the eight real estate investments gave separate indemnities for 50% of the mortgage proceeds totaling $31.1 million (fiscal 2016 - $32.2 million). (f) Contingencies: In June 2010, the BC Housing Management Commission (BC Housing) provided Lake View Village, a seniors housing facility located in Nelson, BC, with a government grant to allow for subsidized suites. Under this agreement, Lake View Village received a forgivable loan in the amount of $855,000 (the Trust’s share is 50%), which was applied directly to the existing mortgage on the property. Under the terms and conditions of the agreement, if the loan is defaulted within the first 10 years, $855,000 is repayable to BC Housing. Thereafter, the forgivable loan amount is reduced by 1/15th per year. As at March 31, 2017, the balance of the forgivable loan was $855,000 (the Trust’s share is 50%). 11. INVESTMENT IN WANETA EXPANSION LIMITED PARTNERSHIP The Trust has an investment, recorded at cost, in the Waneta Expansion Limited Partnership (WELP). WELP is a partnership between the Trust, through a wholly owned subsidiary of the Trust, CBT Waneta Expansion Power Corp. (16.5% interest), CPC Waneta Holdings Ltd. (32.5% interest), and Fortis Inc. (51% interest). WELP was formed to own and develop the Waneta Expansion Project which is a $900-million hydroelectric development located downstream from the Waneta Dam in Trail, BC. Construction of this 335-megawatt facility commenced October 1, 2010, and was substantially completed on April 2, 2015. The Trust's total investment in the Waneta Expansion Project is $109.3 million (fiscal 2016 - $109.3 million). The Trust received dividends in the amount of $10.2 million in fiscal 2017 (fiscal 2016 - $5.7 million) from its investment in the Waneta Expansion Limited Partnership.

NOTES TO THE CONSOLIDATED FINANCIAL STATEMENTS As at March 31, 2017 and March 31, 2016 (Tabular amounts in thousands)
2016/17 Annual Service Plan Report 34
12. INVESTMENT IN POWER PROJECTS The Trust's investment in power projects comprises ownership interests in four entities that are jointly controlled with Columbia Power Corporation, a party related through common control by the Province. These investments are accounted for as GBP's. (a) Arrow Lakes Power Corporation The Trust's wholly owned subsidiary, CBT Arrow Lakes Power Development Corp., has a 50% ownership interest in Arrow Lakes Power Corporation (ALPC). The purpose of ALPC is to operate the 185-megawatt Arrow Lakes Generating Station adjacent to Hugh Keenleyside Dam at Castlegar, BC, and a 48-kilometre transmission line from the power plant to BC Hydro’s Selkirk substation and sell power generated from this facility. (b) Brilliant Power Corporation The Trust's wholly owned subsidiary, CBT Power Corp., has a 50% ownership interest in Brilliant Power Corporation (BPC). The purpose of BPC is to act as lessor of the Brilliant Dam and Generating Station (Brilliant Power Facility) and Brilliant Terminal Station assets. The Brilliant Power Facility and Brilliant Terminal Station are currently leased to FortisBC Inc., a regulated utility operating in British Columbia, according to the terms of finance leases. The Brilliant Power Facility is located on the Kootenay River, three kilometers upstream of the confluence with the Columbia River. (c) Brilliant Expansion Power Corporation The Trust's wholly owned subsidiary, CBT Brilliant Expansion Power Corp., has a 50% interest in Brilliant Expansion Power Corporation (BEPC). The purpose of BEPC is to operate Brilliant Expansion, a 120-megawatt power generation facility adjacent to the Brilliant Dam at Castlegar, BC, and sell power generated from this facility. (d) Waneta Expansion Power Corporation The Trust's wholly owned subsidiary, CBT Energy Inc., has a 42% interest in Waneta Expansion Power Corporation (WEPC). WEPC previously held legal title of assets related to the Waneta Expansion Project. In October 2010, all deferred development costs and expansion rights related to the Waneta Expansion Project were sold to the Waneta Expansion Limited Partnership in exchange for a $72-million non-interest bearing Promissory Note. Condensed supplementary financial information for investment in these four power projects is as follows: (e) Financial position:
Current Assets
Property,
Plant & Equipment
Lease Receivable
Other Non-
Current Assets
Total Assets
Current Liabilities
Non-
Current Liabilities
Total Liabilities
Net Assets March 31, 2017 ALPC - 50% $ 17,308 $ 110,451 $ - $ - $ 127,759 $ 8,759 $ 168,755 $ 177,514 $ (49,755) BPC - 50% 7,815 - 158,815 5,386 172,016 6,632 47,621 54,253 117,763 BEPC - 50% 5,923 105,304 - 776 112,003 595 - 595 111,408 WEPC - 42% - - - 33,361 33,361 - - - 33,361 $ 31,046 $ 215,755 $ 158,815 $ 39,523 $ 445,139 $ 15,986 $ 216,376 $ 232,362 $ 212,777

NOTES TO THE CONSOLIDATED FINANCIAL STATEMENTS As at March 31, 2017 and March 31, 2016 (Tabular amounts in thousands)
2016/17 Annual Service Plan Report 35
Current Assets
Property,
Plant & Equipment
Lease Receivable
Other Non-
Current Assets
Total Assets
Current Liabilities
Non-
Current Labilities
Total Liabilities
Net Assets March 31, 2016 ALPC - 50% $ 14,331 $ 112,710 $ - $ - $ 127,041 $ 6,962 $ 172,168 $ 179,130 $ (52,089) BPC - 50% 7,091 - 157,339 5,378 169,808 7,080 51,421 58,501 111,307 BEPC - 50% 4,768 107,725 - 770 113,263 468 - 468 112,795 WEPC - 42% - - - 31,694 31,694 - - - 31,694 $ 26,190 $ 220,435 $ 157,339 $ 37,842 $ 441,806 $ 14,510 $ 223,589 $ 238,099 $ 203,707 (f) Investment in power projects: ALPC
50% BPC 50%
BEPC 50%
WEPC 42%
Total
March 31, 2017 Opening balance $ (52,089) $ 111,307 $ 112,795 $ 31,694 $ 203,707 Dividends paid (13,250) (5,250) (13,200) - (31,700) Surplus 15,584 11,706 11,813 1,667 40,770 $ (49,755) $ 117,763 $ 111,408 $ 33,361 $ 212,777 March 31, 2016 Opening balance $ (47,412) $ 106,996 $ 114,955 $ 22,362 $ 196,901 Dividends paid (8,237) (6,790) (13,121) - (28,148) Surplus 3,560 11,101 10,961 9,332 34,954 $ (52,089) $ 111,307 $ 112,795 $ 31,694 $ 203,707 (g) ALPC negative equity: In fiscal 2012, ALPC issued $350 million in Series B bonds, due in April 2041. The proceeds of the Series B bond issue were used to pay for the $45.6 million owing on ALPC’s Series A bonds, and the net proceeds of $285.6 million were distributed by dividend to the shareholders. The dividend to the shareholders created a deficit in ALPC of $56.1 million. ALPC ended fiscal 2012 with a deficit of $60.3 million after incurring net losses of $4.2 million that year. Total cumulative dividends of $76.6 million and cumulative net surpluses of $37.4 million since fiscal 2012 have increased the deficit in ALPC to $99.5 million at the end of fiscal 2017. As ALPC’s negative equity position has been caused by the payment of dividends rather than by operating losses, the Trust continues to record its investment in ALPC as a long term financial asset that is recorded on a modified equity basis on the consolidated statement of financial position. The Trust’s future share of ALPC’s net income will reduce the negative equity balance and the Trust’s future share of any additional dividends will increase the negative equity balance. Contracts entered into for the delivery of electricity over the next 28 years are expected to generate sufficient revenue and cash flow to fund on-going operations for the foreseeable future.
NOTES TO THE CONSOLIDATED FINANCIAL STATEMENTS As at March 31, 2017 and March 31, 2016 (Tabular amounts in thousands)
2016/17 Annual Service Plan Report 36
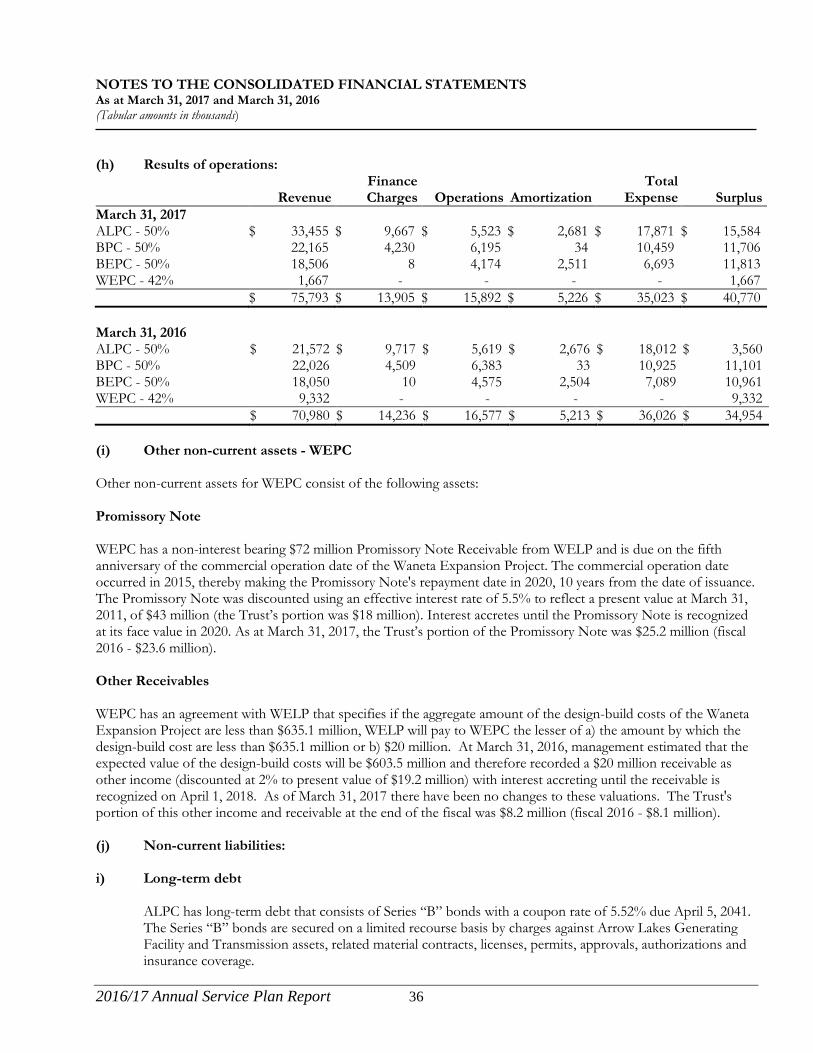
(h) Results of operations:
Revenue
Finance Charges
Operations
Amortization
Total Expense
Surplus
March 31, 2017 ALPC - 50% $ 33,455 $ 9,667 $ 5,523 $ 2,681 $ 17,871 $ 15,584 BPC - 50% 22,165 4,230 6,195 34 10,459 11,706 BEPC - 50% 18,506 8 4,174 2,511 6,693 11,813 WEPC - 42% 1,667 - - - - 1,667 $ 75,793 $ 13,905 $ 15,892 $ 5,226 $ 35,023 $ 40,770 March 31, 2016 ALPC - 50% $ 21,572 $ 9,717 $ 5,619 $ 2,676 $ 18,012 $ 3,560 BPC - 50% 22,026 4,509 6,383 33 10,925 11,101 BEPC - 50% 18,050 10 4,575 2,504 7,089 10,961 WEPC - 42% 9,332 - - - - 9,332 $ 70,980 $ 14,236 $ 16,577 $ 5,213 $ 36,026 $ 34,954 (i) Other non-current assets - WEPC Other non-current assets for WEPC consist of the following assets: Promissory Note WEPC has a non-interest bearing $72 million Promissory Note Receivable from WELP and is due on the fifth anniversary of the commercial operation date of the Waneta Expansion Project. The commercial operation date occurred in 2015, thereby making the Promissory Note's repayment date in 2020, 10 years from the date of issuance. The Promissory Note was discounted using an effective interest rate of 5.5% to reflect a present value at March 31, 2011, of $43 million (the Trust’s portion was $18 million). Interest accretes until the Promissory Note is recognized at its face value in 2020. As at March 31, 2017, the Trust’s portion of the Promissory Note was $25.2 million (fiscal 2016 - $23.6 million). Other Receivables WEPC has an agreement with WELP that specifies if the aggregate amount of the design-build costs of the Waneta Expansion Project are less than $635.1 million, WELP will pay to WEPC the lesser of a) the amount by which the design-build cost are less than $635.1 million or b) $20 million. At March 31, 2016, management estimated that the expected value of the design-build costs will be $603.5 million and therefore recorded a $20 million receivable as other income (discounted at 2% to present value of $19.2 million) with interest accreting until the receivable is recognized on April 1, 2018. As of March 31, 2017 there have been no changes to these valuations. The Trust's portion of this other income and receivable at the end of the fiscal was $8.2 million (fiscal 2016 - $8.1 million). (j) Non-current liabilities: i) Long-term debt
ALPC has long-term debt that consists of Series “B” bonds with a coupon rate of 5.52% due April 5, 2041. The Series “B” bonds are secured on a limited recourse basis by charges against Arrow Lakes Generating Facility and Transmission assets, related material contracts, licenses, permits, approvals, authorizations and insurance coverage.

NOTES TO THE CONSOLIDATED FINANCIAL STATEMENTS As at March 31, 2017 and March 31, 2016 (Tabular amounts in thousands)
2016/17 Annual Service Plan Report 37
BPC has long-term debt that consists of the following: • Series "A" bonds bearing interest at 8.93%; and • Series "B" bonds bearing interest at 6.86%; and • Series "C" bonds bearing interest at 5.67%.
The bonds are redeemable in whole or in part at any time before May 31, 2026, at a price equal to the greater of the principal amount then outstanding, or a price calculated to provide a yield to maturity based on the current yield of a matching-duration Government of Canada bond plus 0.30%, 0.31% and 0.23% respectively. The bonds are secured on a limited recourse basis by charges against Brilliant Dam assets and revenues. Power project bonds are as follows (at 50%): 2017 2016 ALPC bonds $ 173,334 $ 175,000 BPC bonds 52,158 55,786 225,492 230,786 Less: financing costs (1,737) (1,903) Less: current portion of long-term debt (7,379) (5,294) $ 216,376 $ 223,589
(k) Contingencies The Trust’s operating and development power project activities are affected by federal, provincial and local government laws and regulations. Under its agreements with its Bondholders, BPC and ALPC have agreed to comply or cause compliance in all material respects with such laws and regulations, as well as to maintain all material franchises. Under current regulations, the venturers are required to meet performance standards to minimize or mitigate the negative impacts of their proposed projects. The impact, if any, of future legislative or regulatory requirements on specific projects and their related deferred costs cannot currently be estimated. 13. LONG-TERM DEBT The Trust has a term loan secured by a collateral mortgage over real estate. The Trust also accepts investment funds from various Community Foundations for investment purposes which are classified as loans. The net debt shown on the consolidated statement of financial position is measured at amortized cost and is comprised of the following: 2017 2016 Demand loan, interest rate 3.27% per annum, maturing November 2017 $ 893 $ 925 Demand loan, interest rate 5.00% per annum, no specific repayment terms 2,802 - $ 3,695 $ 925

NOTES TO THE CONSOLIDATED FINANCIAL STATEMENTS As at March 31, 2017 and March 31, 2016 (Tabular amounts in thousands)
2016/17 Annual Service Plan Report 38
14. DEFERRED CONTRIBUTIONS Deferred revenue represents funding that has been received and relates to broadband projects scheduled to be completed in a subsequent year. Deferred revenue is recognized in revenue in the year of project completion. Deferred capital contributions represent the unamortized amount of grants received from various entites for the purchase of broadband tangible capital assets. Deferred capital contributions are recongized in revenue at the same rate that amortization of the tangible capital asset is recorded. Deferred contributions at March 31 are as follows:
2017 2016 Deferred revenue $ 1,191 $ 1,159 Deferred capital contributions 720 242 $ 1,911 $ 1,401
15. DELIVERY OF BENEFITS INITIATIVES Delivery of Benefits initiatives refers to activities that the Trust undertakes in the region as it seeks to support the efforts of the people of the Basin to create a legacy of social, economic and environmental well-being in the Basin. 2017 2016 Liabilities, beginning of year $ 31,456 $ 27,028 Funds authorized during the year 36,940 31,080 Funds recovered/rescinded (1,424) (1,187) Funds paid during the year (26,460) (25,465) Liabilities, end of year $ 40,512 $ 31,456 Delivery of Benefits initiatives liabilities are payable to various organizations in the fiscal years ending March 31 as follows: 2018 $ 26,341 2019 9,986 2020 4,019 2021 166 $ 40,512

NOTES TO THE CONSOLIDATED FINANCIAL STATEMENTS As at March 31, 2017 and March 31, 2016 (Tabular amounts in thousands)
2016/17 Annual Service Plan Report 39
16. TANGIBLE CAPITAL ASSETS The Trust's tangible capital assets are as follows:
Cost
Accumulated Amortization
2017
2016
Corporate Land $ 205 $ - $ 205 $ 205 Building 3,487 1,788 1,699 1,814 Leasehold improvements 710 537 173 24 Office furniture and equipment 537 468 69 58 Hardware and software 1,838 1,283 555 521 $ 6,777 $ 4,076 $ 2,701 $ 2,622 Delivery of Benefits Economic initiatives Land $ 188 $ - $ 188 $ - Building 1,348 45 1,303 - Deferred development costs 10 - 10 - 1,546 45 1,501 - Broadband initiatives Hardware 2,951 1,052 1,899 1,658 Fibre optics 2,363 330 2,033 1,755 5,314 1,382 3,932 3,413 $ 6,860 $ 1,427 $ 5,433 $ 3,413 Investments Land $ 926 $ - $ 926 $ 611 Building 3,221 239 2,982 1,191 $ 4,147 $ 239 $ 3,908 $ 1,802 Total tangible capital assets $ 17,784 $ 5,742 $ 12,042 $ 7,837 Refer to Schedule A for supplementary financial information. 17. GRANT REVENUES CBBC, a wholly owned subsidiary of the Trust, and various Internet Service Providers have entered into a Contribution Agreement with the Government of Canada for the Connecting Canadians Program. The Connecting Canadians Program aims to extend and/or enhance broadband networks for rural and remote Canadian communities and provide access to high quality broadband services for households to participate in the digital economy. 18. OTHER REVENUES Other revenues for the Trust consist of the following: Loan income The Trust receives loan income from the Impact Investment Program which provides capital to businesses challenged with obtaining financing from other sources.
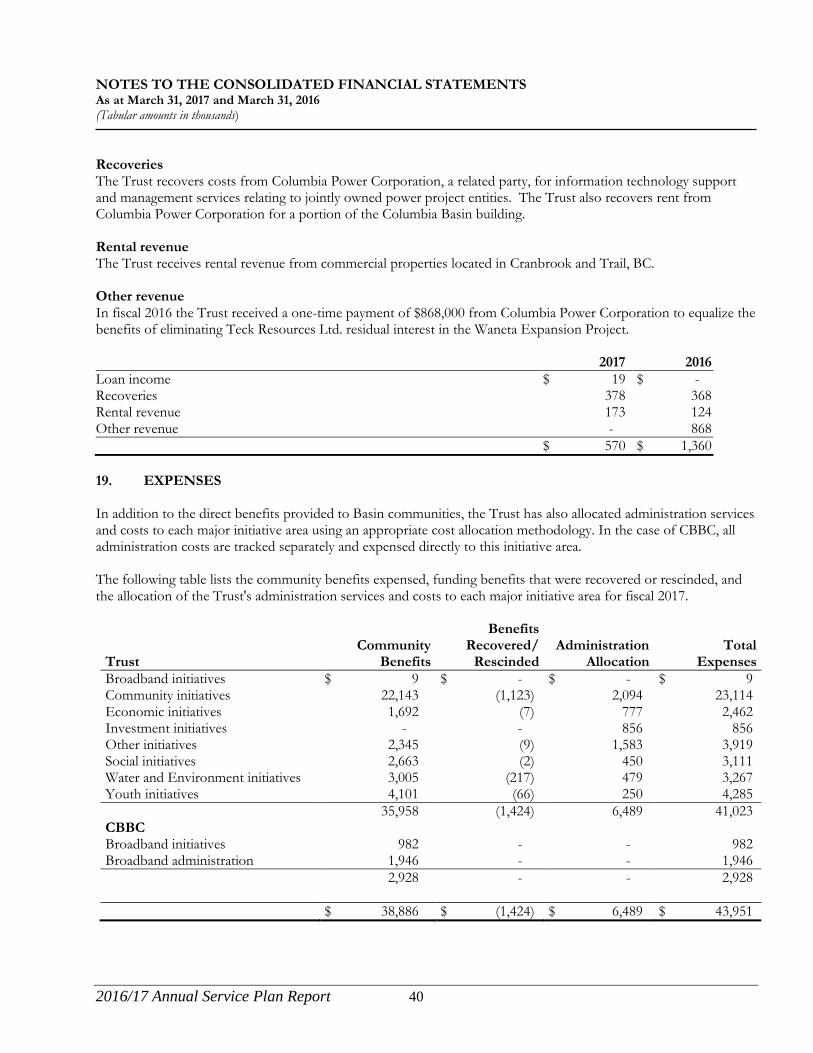
NOTES TO THE CONSOLIDATED FINANCIAL STATEMENTS As at March 31, 2017 and March 31, 2016 (Tabular amounts in thousands)
2016/17 Annual Service Plan Report 40
Recoveries The Trust recovers costs from Columbia Power Corporation, a related party, for information technology support and management services relating to jointly owned power project entities. The Trust also recovers rent from Columbia Power Corporation for a portion of the Columbia Basin building. Rental revenue The Trust receives rental revenue from commercial properties located in Cranbrook and Trail, BC. Other revenue In fiscal 2016 the Trust received a one-time payment of $868,000 from Columbia Power Corporation to equalize the benefits of eliminating Teck Resources Ltd. residual interest in the Waneta Expansion Project. 2017 2016 Loan income $ 19 $ - Recoveries 378 368 Rental revenue 173 124 Other revenue - 868 $ 570 $ 1,360 19. EXPENSES In addition to the direct benefits provided to Basin communities, the Trust has also allocated administration services and costs to each major initiative area using an appropriate cost allocation methodology. In the case of CBBC, all administration costs are tracked separately and expensed directly to this initiative area. The following table lists the community benefits expensed, funding benefits that were recovered or rescinded, and the allocation of the Trust's administration services and costs to each major initiative area for fiscal 2017.
Trust
Community
Benefits
Benefits Recovered/
Rescinded
Administration
Allocation
Total
Expenses Broadband initiatives $ 9 $ - $ - $ 9 Community initiatives 22,143 (1,123) 2,094 23,114 Economic initiatives 1,692 (7) 777 2,462 Investment initiatives - - 856 856 Other initiatives 2,345 (9) 1,583 3,919 Social initiatives 2,663 (2) 450 3,111 Water and Environment initiatives 3,005 (217) 479 3,267 Youth initiatives 4,101 (66) 250 4,285 35,958 (1,424) 6,489 41,023 CBBC Broadband initiatives 982 - - 982 Broadband administration 1,946 - - 1,946 2,928 - - 2,928 $ 38,886 $ (1,424) $ 6,489 $ 43,951

NOTES TO THE CONSOLIDATED FINANCIAL STATEMENTS As at March 31, 2017 and March 31, 2016 (Tabular amounts in thousands)
2016/17 Annual Service Plan Report 41
The following comprises the Trust’s and CBBC's expenses by object: Trust CBBC Total March 31, 2017 Amortization $ 509 $ 444 $ 953 Board and committee expenses 147 10 157 Communications 196 1 197 Corporate travel and meetings 221 26 247 Delivery of Benefits initiatives 34,534 982 35,516 Information technology 225 119 344 Network costs - 646 646 Office and general 620 5 625 Professional fees 184 202 386 Staff remuneration and development 4,387 493 4,880 $ 41,023 $ 2,928 $ 43,951 March 31, 2016 Amortization $ 389 $ 357 $ 746 Board and committee expenses 132 3 135 Communications 172 4 176 Corporate travel and meetings 192 29 221 Delivery of Benefits initiatives 26,488 3,405 29,893 Information technology 193 130 323 Network costs - 448 448 Office and general 667 9 676 Professional fees 260 200 460 Staff remuneration and development 4,242 490 4,732 $ 32,735 $ 5,075 $ 37,810 20. COMMITMENTS The Trust Office The Trust has entered into operating lease agreements for two office spaces with terms expiring August 31, 2017 and March 31, 2020. Annual lease commitments are as follows: 2018 $ 58 2019 36 2020 36 $ 130 21. RELATED PARTY TRANSACTIONS The Trust is indirectly related through common ownership to all Province of BC ministries, agencies, Crown corporations and public sector organizations that are included in the provincial government reporting entity. All related party transactions are considered to be conducted at arm's length and are consequently recorded at their exchange amounts.

NOTES TO THE CONSOLIDATED FINANCIAL STATEMENTS As at March 31, 2017 and March 31, 2016 (Tabular amounts in thousands)
2016/17 Annual Service Plan Report 42
The Trust’s portion of related party transactions is as follows: (a) Due from and sales to related parties: 2017 2016 Due from
related party Sales to
related party Due from
related party Sales to
related party Columbia Power Corporation $ 91 $ 562 $ 93 $ 666 Province of BC 2,033 86 1,701 110 BC Hydro 2,127 47,403 2,286 35,286 BEPC 92 733 434 713 $ 4,343 $ 48,784 $ 4,514 $ 36,775 (b) Due to and purchases from related parties: 2017 2016
Due to related party
Purchases from related
party
Due to
related party
Purchases from related
party Columbia Power Corporation $ - $ 1,515 $ 602 $ 1,986 Province of BC 48 5,813 48 6,573 BC Hydro - 1,569 55 804 BPC 96 733 84 713 Powerex - 45 - 45 $ 144 $ 9,675 $ 789 $ 10,121 22. PUBLIC SERVICE PENSION PLAN The Trust and its employees contribute to the Public Service Pension Plan (PSPP) in accordance with the Public Sector Pension Plans Act. The British Columbia Pension Corporation administers the plan, including payment of pension benefits to employees to whom the Act applies. The PSPP is a multi-employer defined benefit pension plan. Under joint trusteeship, the risks and rewards associated with the PSPP's unfunded liability or surplus is shared between the employers and the plan members and will be reflected in future contributions. The most recent actuarial valuation as at March 31, 2014 indicated that the PSPP is fully funded and is sufficient to pay the current and future lifetime pensions of all members. Contributions to the PSPP by the Trust in fiscal 2017 were $304,000 (fiscal 2016 - $292,000). No provision, other than the Trust's required employer pension contributions, has been made in the accounts of the Trust for this liability. The next valuation date for the PSPP is scheduled for December 31, 2017 with results expected in 2018. 23. RISK MANAGEMENT (a) Credit risk Credit risk refers to the risk that one party to a financial instrument will cause a financial loss for the other party by failing to discharge an obligation. The Trust extends credit within its commercial loans and investments. To mitigate the Trust’s exposure to credit risk, an assessment of the credit worthiness of a borrower is carried out prior to the placement of a commercial loan or investment. The Trust’s exposure to credit risk is as indicated by the carrying value of its commercial loans and investments.

NOTES TO THE CONSOLIDATED FINANCIAL STATEMENTS As at March 31, 2017 and March 31, 2016 (Tabular amounts in thousands)
2016/17 Annual Service Plan Report 43
The maximum exposure to credit risk at March 31 was: 2017 2016 Accrued interest and other assets $ 1,645 $ 2,142 Loan receivable $ 534 $ - Commercial loans $ 37,365 $ 39,570 Commercial investment $ 2,375 $ 2,375 (b) Liquidity risk Liquidity risk refers to the risk that the Trust will encounter difficulty in meeting obligations associated with financial liabilities. The Trust monitors and maintains its liquidity to ensure sufficient capacity to repay its financial liabilities when they become due. The Trust considers that it has sufficient liquidity to meet its financial obligations. The maximum exposure to liquidity risk at March 31 was: 2017 2016 Accounts payable and accrued liabilities $ 835 $ 663 Long-term debt $ 3,695 $ 925 Deferred contributions $ 1,911 $ 1,401 Delivery of Benefits liabilities $ 40,512 $ 31,456 (c) Market risk Market risk refers to the risk that the fair value or future cash flows of a financial instrument will fluctuate because of market prices. Market risk comprises three types of risk: currency risk, interest rate risk and price risk. i) Currency risk
Currency risk is the risk that the fair value or future cash flows of a financial instrument will fluctuate because of changes in foreign exchange rates. The Trust realizes all significant revenues and expenses in Canadian dollars and is therefore not significantly exposed to currency fluctuations.
ii) Interest rate risk
Interest rate risk refers to the risk that the fair value or future cash flows of a financial instrument will fluctuate because of changes in market interest rates. The Trust is not exposed to significant interest rate risk for current liabilities due to the short-term nature of its current liabilities. The Trust’s short-term investments and commercial loans are subject to variable interest rates. Sensitivity analyses: A change of 100 basis points in the interest rates in short-term investments would increase or decrease revenues by $481,000. A change of 100 basis points in the market rates of commercial loans would increase or decrease revenues by $376,000.
iii) Price risk
Price risk is the risk that the fair value or future cash flows of a financial instrument will fluctuate because of changes in market prices (other than interest rate risk or currency risk), whether those changes are caused by factors specific to the individual financial statement or its issuer, or factors affecting all similar financial instruments traded in the market.
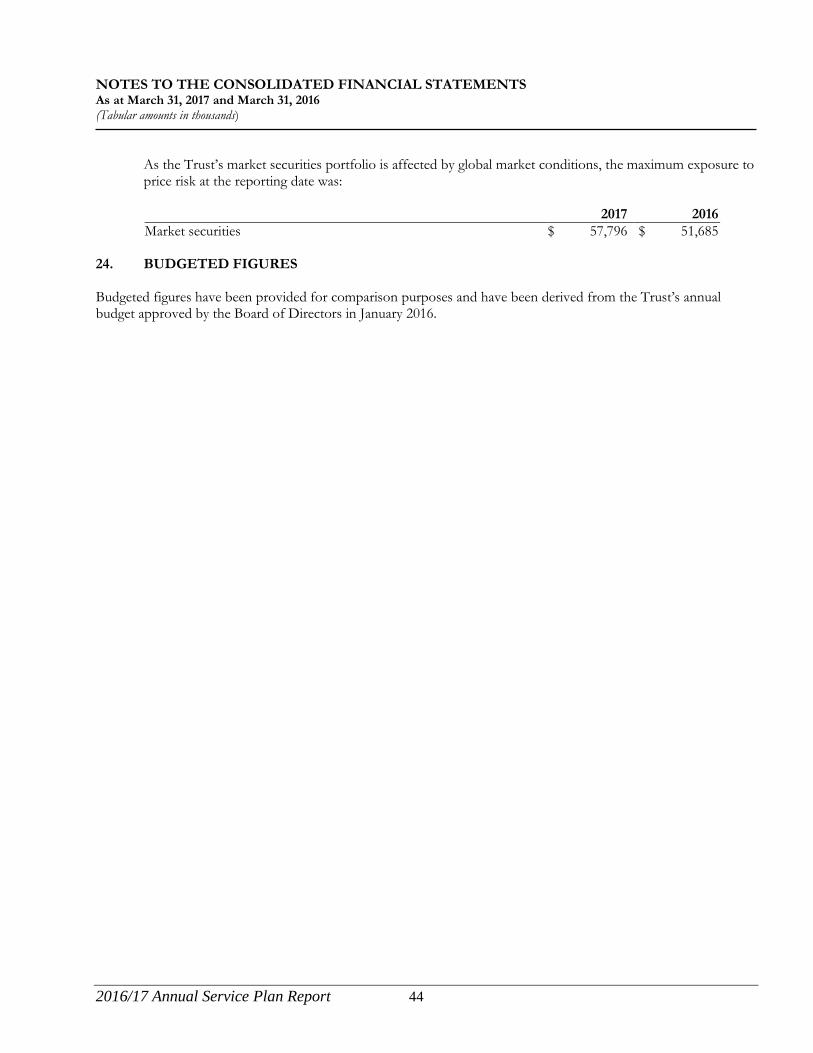
NOTES TO THE CONSOLIDATED FINANCIAL STATEMENTS As at March 31, 2017 and March 31, 2016 (Tabular amounts in thousands)
2016/17 Annual Service Plan Report 44
As the Trust’s market securities portfolio is affected by global market conditions, the maximum exposure to price risk at the reporting date was: 2017 2016 Market securities $ 57,796 $ 51,685
24. BUDGETED FIGURES Budgeted figures have been provided for comparison purposes and have been derived from the Trust’s annual budget approved by the Board of Directors in January 2016.
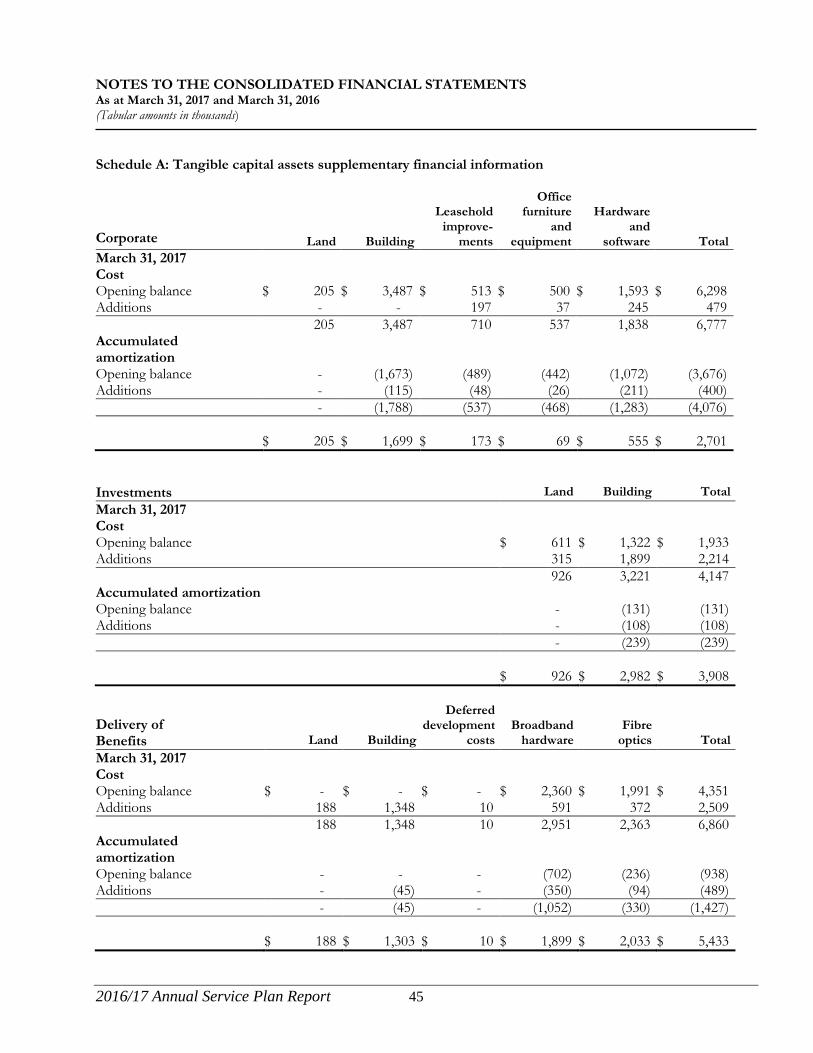
NOTES TO THE CONSOLIDATED FINANCIAL STATEMENTS As at March 31, 2017 and March 31, 2016 (Tabular amounts in thousands)
2016/17 Annual Service Plan Report 45
Schedule A: Tangible capital assets supplementary financial information Corporate
Land
Building
Leasehold
improve- ments
Office furniture
and equipment
Hardware
and software
Total March 31, 2017 Cost Opening balance $ 205 $ 3,487 $ 513 $ 500 $ 1,593 $ 6,298 Additions - - 197 37 245 479 205 3,487 710 537 1,838 6,777 Accumulated amortization
Opening balance - (1,673) (489) (442) (1,072) (3,676) Additions - (115) (48) (26) (211) (400) - (1,788) (537) (468) (1,283) (4,076) $ 205 $ 1,699 $ 173 $ 69 $ 555 $ 2,701 Investments Land Building Total March 31, 2017 Cost Opening balance $ 611 $ 1,322 $ 1,933 Additions 315 1,899 2,214 926 3,221 4,147 Accumulated amortization Opening balance - (131) (131) Additions - (108) (108) - (239) (239) $ 926 $ 2,982 $ 3,908 Delivery of Benefits
Land
Building
Deferred development
costs
Broadband
hardware
Fibre
optics
Total March 31, 2017 Cost Opening balance $ - $ - $ - $ 2,360 $ 1,991 $ 4,351 Additions 188 1,348 10 591 372 2,509 188 1,348 10 2,951 2,363 6,860 Accumulated amortization
Opening balance - - - (702) (236) (938) Additions - (45) - (350) (94) (489) - (45) - (1,052) (330) (1,427) $ 188 $ 1,303 $ 10 $ 1,899 $ 2,033 $ 5,433

NOTES TO THE CONSOLIDATED FINANCIAL STATEMENTS As at March 31, 2017 and March 31, 2016 (Tabular amounts in thousands)
2016/17 Annual Service Plan Report 46
Corporate
Land
Building
Leasehold
improve- ments
Office furniture
and equipment
Hardware
and software
Total March 31, 2016 Cost Opening balance $ 205 $ 3,470 $ 513 $ 474 $ 1,498 $ 6,160 Additions - 17 - 26 196 239 Disposals - - - - (101) (101) 205 3,487 513 500 1,593 6,298 Accumulated amortization
Opening balance - (1,558) (466) (420) (989) (3,433) Additions - (115) (23) (22) (182) (342) Disposals - - - - 99 99 - (1,673) (489) (442) (1,072) (3,676) $ 205 $ 1,814 $ 24 $ 58 $ 521 $ 2,622
Investments Land Building Total March 31, 2016 Cost Opening balance $ 485 $ 986 $ 1,471 Additions 193 336 529 Disposals (67) - (67) 611 1,322 1,933 Accumulated amortization Opening balance - (84) (84) Additions - (47) (47) - (131) (131) $ 611 $ 1,191 $ 1,802 Delivery of Benefits
Land
Building
Deferred development
costs
Broadband
hardware
Fibre
optics
Total March 31, 2016 Cost Opening balance $ - $ - $ - $ 1,608 $ 1,646 $ 3,254 Additions - - - 760 345 1,105 Disposals - - - (8) - (8) - - - 2,360 1,991 4,351 Accumulated amortization
Opening balance - - - (425) (156) (581) Additions - - - (277) (80) (357) - - - (702) (236) (938) $ - $ - $ - $ 1,658 $ 1,755 $ 3,413

Columbia Basin Trust
2016/17 Annual Service Plan Report 47
Appendix A - Subsidiaries and Operating Segments
Active Subsidiaries Columbia Basin Broadband Corporation Columbia Basin Broadband Corporation (CBBC) is a wholly owned subsidiary of the Trust formed in 2011. CBBC is working with Basin communities and rural areas to improve high-speed connectivity through a region-wide fibre optic cable network that will contribute to economic and social development in the Basin.
Financial Resource Summary Table ($thousands)
2014/15 Actual*
2015/16 Actual
2016/17 Budget
2016/17 Actual
Revenues $430 $1,496 $2,300 $1,948
Expenses $1,335 $5,053 $3,000 $2,928
Annual Surplus (Deficit) $(905) $(3,557) $(700) $(980)
*A transcribing error was noted in 2014/15 actuals and has been corrected to coincide with numbers from audited financial statements. Columbia Basin Development Corp. Columbia Basin Development Corporation (CBDC) is a wholly owned subsidiary of the Trust formed in 2016 to lead and support efforts to advance economic growth, job creation, innovation and entrepreneurial opportunity for a prosperous and sustainable Basin economy.
Financial Resource Summary Table ($thousands)
2016/17 Budget
2016/17 Actual
Revenues $- $-
Expenses $215 $266
Annual Surplus (Deficit) $(215) $(266)

Columbia Basin Trust
2016/17 Annual Service Plan Report 48
Holding Companies For commercial and legal reasons, the Trust has eight subsidiaries that hold our interests in investments. Management of these subsidiaries is performed by Trust staff with no additional remuneration.
• CBT Commercial Finance Corp. holds Trust interests in business loans and investments. • CBT Real Estate Investment Corp. holds Trust interests in real estate. • CBT Property Corp. is a subsidiary of the Trust and holds interests in corporate real estate. • CBT Energy Inc. (CBTE) is the main Trust subsidiary related to power projects. • CBT Arrow Lakes Power Development Corp. is a subsidiary of CBTE and holds interests in
the Arrow Lakes Generating Station joint venture with Columbia Power. • CBT Brilliant Expansion Power Corp. is a subsidiary of CBTE and holds interests in the
Brilliant Expansion joint venture with Columbia Power. • CBT Power Corp. is a subsidiary of CBTE and holds interests in the Brilliant Dam joint
venture with Columbia Power. • CBT Waneta Expansion Power Corp. is a subsidiary of the Trust that holds interests in the
limited partnership and in the general partnership formed to complete the Waneta Expansion Project.

Columbia Basin Trust
2016/17 Annual Service Plan Report 49
Appendix B - Additional Information
Organizational Overview Learn more at ourtrust.org/about.
Corporate Governance Learn more about our:
• Governance: ourtrust.org/governance • Board of Directors: ourtrust.org/board • President and CEO: ourtrust.org/ceo
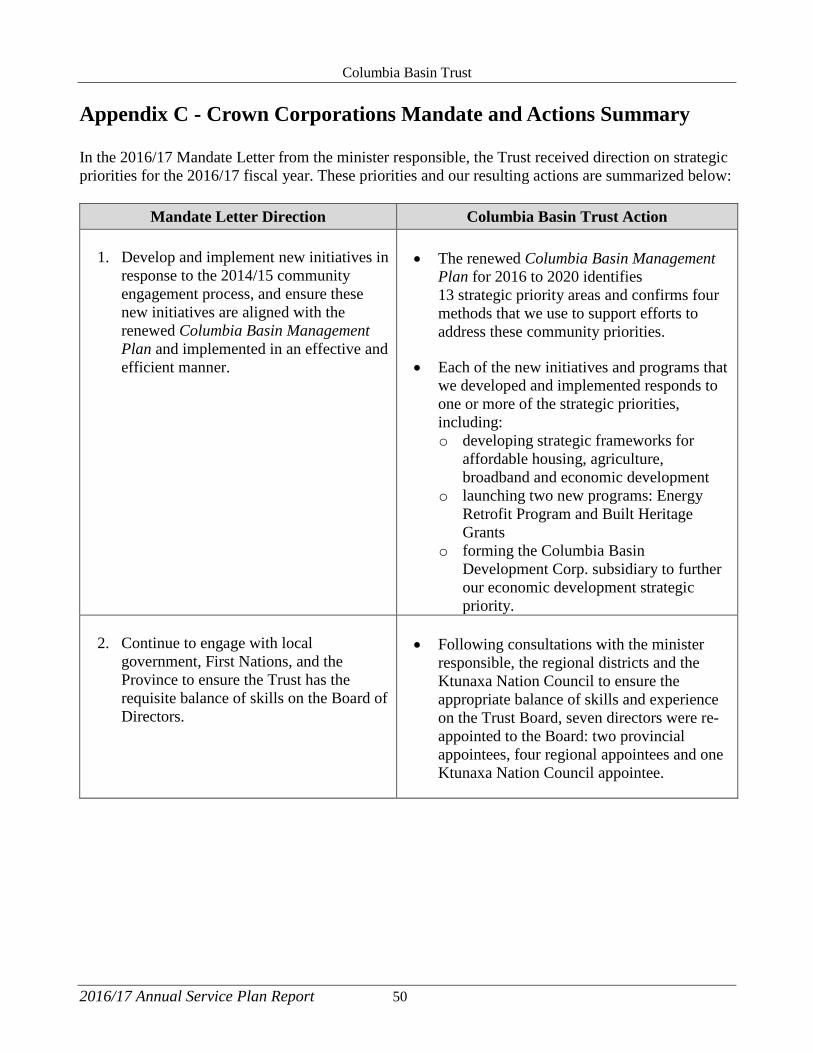
Columbia Basin Trust
2016/17 Annual Service Plan Report 50
Appendix C - Crown Corporations Mandate and Actions Summary In the 2016/17 Mandate Letter from the minister responsible, the Trust received direction on strategic priorities for the 2016/17 fiscal year. These priorities and our resulting actions are summarized below:
Mandate Letter Direction Columbia Basin Trust Action
1. Develop and implement new initiatives in response to the 2014/15 community engagement process, and ensure these new initiatives are aligned with the renewed Columbia Basin Management Plan and implemented in an effective and efficient manner.
• The renewed Columbia Basin Management
Plan for 2016 to 2020 identifies 13 strategic priority areas and confirms four methods that we use to support efforts to address these community priorities.
• Each of the new initiatives and programs that we developed and implemented responds to one or more of the strategic priorities, including: o developing strategic frameworks for
affordable housing, agriculture, broadband and economic development
o launching two new programs: Energy Retrofit Program and Built Heritage Grants
o forming the Columbia Basin Development Corp. subsidiary to further our economic development strategic priority.
2. Continue to engage with local
government, First Nations, and the Province to ensure the Trust has the requisite balance of skills on the Board of Directors.
• Following consultations with the minister
responsible, the regional districts and the Ktunaxa Nation Council to ensure the appropriate balance of skills and experience on the Trust Board, seven directors were re-appointed to the Board: two provincial appointees, four regional appointees and one Ktunaxa Nation Council appointee.