Embed Size (px)
Citation preview
325
Unbound issue
OT Does not circulate
n
V•R
1993COLUMBIACOLUMBIA
BASINAGRICULTURAL
RESEARCHANNUAL REPORT
Property ofOREGON STATE UNIVERSITY
Library SerialsCorvallis, OR 97331-4503
Special Report 909Agricultural Experiment Station • Oregon State Universityin cooperation with Agricultural Research Service • USDA
COLUMBIA BASINAGRICULTURAL RESEARCH
JUNE, 1993
EDITORIAL COMMITTEE
Dan Ball, ChairSteve AlbrechtCarol BrehautRon RickmanSue Waldman
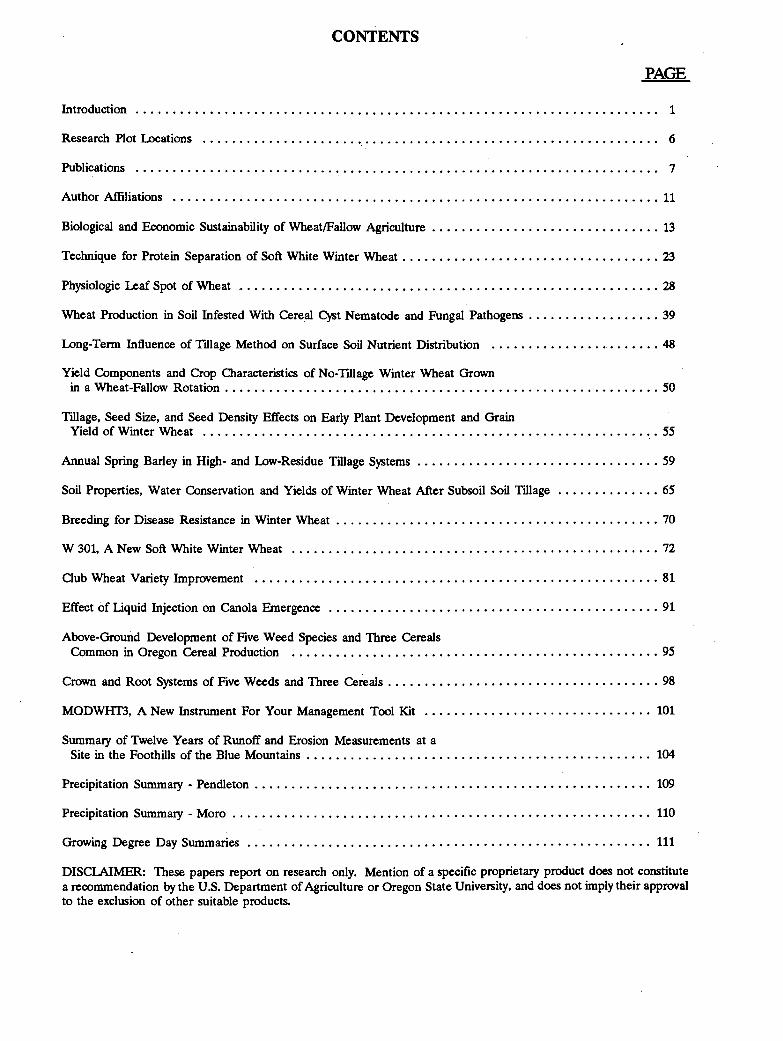
CONTENTS
PAGE
Introduction 1
Research Plot Locations 6
Publications 7
Author Affiliations 11
Biological and Economic Sustainability of Wheat/Fallow Agriculture 13
Technique for Protein Separation of Soft White Winter Wheat 23
Physiologic Leaf Spot of Wheat 28
Wheat Production in Soil Infested With Cereal Cyst Nematode and Fungal Pathogens 39
Long-Term Influence of Tillage Method on Surface Soil Nutrient Distribution 48
Yield Components and Crop Characteristics of No-Tillage Winter Wheat Grownin a Wheat-Fallow Rotation 50
Tillage, Seed Size, and Seed Density Effects on Early Plant Development and GrainYield of Winter Wheat 55
Annual Spring Barley in High- and Low-Residue Tillage Systems 59
Soil Properties, Water Conservation and Yields of Winter Wheat After Subsoil Soil Tillage 65
Breeding for Disease Resistance in Winter Wheat 70
W 301, A New Soft White Winter Wheat 72
Club Wheat Variety Improvement 81
Effect of Liquid Injection on Canola Emergence 91
Above-Ground Development of Five Weed Species and Three CerealsCommon in Oregon Cereal Production 95
Crown and Root Systems of Five Weeds and Three Cereals 98
MODWHT3, A New Instrument For Your Management Tool Kit 101
Summary of Twelve Years of Runoff and Erosion Measurements at aSite in the Foothills of the Blue Mountains 104
Precipitation Summary - Pendleton 109
Precipitation Summary - Moro 110
Growing Degree Day Summaries 111
DISCLAIMER: These papers report on research only. Mention of a specific proprietary product does not constitutea recommendation by the U.S. Department of Agriculture or Oregon State University, and does not imply their approvalto the exclusion of other suitable products.

INTRODUCTION
Staffs of the Columbia BasinAgricultural Research Center (CBARC-Oregon State University, Pendleton andSherman Stations) and the ColumbiaPlateau Conservation Research Center(USDA-Agricultural Research Service,Pendleton) are proud to present results oftheir research. This bulletin contains arepresentative sample of the work inprogress at these Centers. A collection ofbulletins over a three-year period will givea more complete assessment of theproductivity and applicability of researchconducted on behalf of producers in easternOregon and comparable agriculturalregions. Changes in staffing, programming,and facilities at these centers during thepast year are summarized below.
PROMOTIONS AND AWARDS
Within the USDA, Larry Baarstad waspromoted. Merit cash awards were given toDale Wilkins and Betty Klepper inrecognition of the consistently high qualityof their work.
STAFF CHANGES
Staff was saddened by the death ofRodney Rolfe, who maintained the OSUweather station records and landscape atthe Sherman Station. Sharon Rolfe wasappointed to succeed Rodney. A familymove to Condon caused Susan Gibbs toresign as Biological Research Technician inPamela Zwer's wheat breeding program.Susan was succeeded by the appointment ofTamera Simpson, a graduate of theUniversity of Southern California, to atemporary position in the plant breedingposition. Dan McCarty also held temporarypositions during 1992 and 1993 to assist inDon Wysocki's soil science program and
Pamela Zwer's plant breeding program.Darrin Walenta was hired as FacultyResearch Assistant in Dan Ball's weedscience program after completing a B.S.degree in agriculture from Oklahoma StateUniversity. Wakar Uddin resigned asFaculty Research Assistant in RichardSmiley's plant pathology program to begindoctoral studies and serve as leader for theUniversity of Georgia's Plant PathologyDiagnostic Laboratory. Lisa Patterson, anhonors graduate from the University ofWestern Australia, was hired to replaceWakar.
For the USDA staff, two temporaryemployees, Robin Straughan and JillHuntsman, worked for an 8-week periodlast summer on a special ARS program forResearch Apprentices in Agriculture.Brad Nuxoll worked for 12 weeks as aUSDA-ARS Summer Intern to develop aregional climatological information system.New funds were appropriated in 1992 anda permanent soil microbiology position wasfilled by Dr. Stephan Albrecht in Novemberof 1992. Through the USDA postdoctoralResearch Associate program, funds weremade available for a two-year position inhydrology; this position was filled by Dr.Deghyo Bae in October, 1992. Additionalfunds for STEEP II were also received anda permanent position for a Physical ScienceTechnician was supposed to be establishedto support the research program in erosion.However, a hiring freeze caused thepermanent position to be cancelled and atemporary position was then filled by CraigCameron in March. Ericka Miller joinedthe staff as a temporary Plant LaboratoryAssistant at the end of March, 1993.
NEW PROJECTS
OSU staff continued with existingresearch and initiated few new projects.
1

Richard Smiley de-emphasized studies onRhizoctonia root rot, physiologic leaf spot,and cereal cyst nematode. A five-yearinvestigation of the dryland foot rotcomplex was initiated to determine thespecies of fungi involved, their geographicdistribution, and the time during whichinfection occurs. This information will leadto development of a more accurate controlstrategy for a disease complex that damagesmany crops and is still poorly defined inOregon. Dan Ball is expanding effortstoward the development of productionsystems for red lentils, a new crop fordryland regions of the Pacific Northwest,and for reduced rate herbicide practices ingreen peas. A regional survey is beinginitiated to determine the presence anddistribution of herbicide resistant weeds innortheastern Oregon wheat. Pamela Zwerinitiated research to assess club andcommon varietial and elite line differencesfor green cover and residue production. Aprogram to evaluate promising elite clublines in replicated drill strips in cooperationwith growers was initiated. Yield trialsassessing wheat and barley varieties andelite lines were sown in Gilliam and UnionCounties. The variety testing program isorganized through Russ Karow; howeverthe club wheat breeding program plans,maintains, and harvests the plots.
OSU and ARS staffs initiatedcooperative studies to develop guidelinesfor application of methanol to increase cropproductivity, increase water-use efficiency,and shorten the time for crop maturation.Several crops are being evaluated atPendleton. The Center also coordinateswinter wheat trials conducted by field cropsextension agents throughout the region.
The USDA staff recently initiatederosion-related research under apostdoctoral program from the
Administrator for work on hydrology. Dr.Deghyo Bae is modifying existinghydrologic model components andparameters to reflect Pacific Northwestweather and soil conditions so that thesemodifications can be made available formodels being developed nationally by otherARS researchers. Dr. Bae is also workingwith Clyde Douglas and John Zuzel on anew project to define the probability ofwater moving below the root zone in thefive dryland agroclimatic zones of theinland Pacific Northwest. Karen King, agraduate student at Washington StateUniversity at Richland, initiated researchwith Clyde Douglas and John Zuzel toanalyze and interpret chemical data fromrunoff from the Kirk erosion site. RonRickman is beginning a new project usingacoustical techniques to define surfaceroughness and/or macropores. DaleWilkins, Clyde Douglas, and PaulRasmussen have developed a new project todetermine the impacts of use of stripper-header grain harvesting on residuemanagement, moisture conservation, anderosion control. Dale Wilkins and ClydeDouglas have discovered that a gravity tablecan be used to separate the soft whitewheat kernels in a bin of grain by proteincontent; they are developing further.information on how the process will workon wheat from different sources and onhow milling and baking properties of theseparated grain compare to the originalmixtures.
FACILITIES
Construction of the OSU greenhousewas completed and much progress wasachieved toward completing the interior ofthe new headhouse (potting shed).Underground gasoline and diesel tankswere replaced with aboveground tanks atOSU facilities at Pendleton and Moro.
2
Residential units at both locations wereimproved by replacing old siding, waterlines, and flooring.
The USDA shop building wasupgraded with new heating and a newoverhead crane. Automatic gate openerswere also installed for the equipment yard.New burners were purchased for theheating system in the main office building.New cabinets have been ordered for themicrobiology laboratory and for the erosionlaboratory. An autoclave for themicrobiology program was also purchased.
TRAINING
Gloria Eidam and Judy Elliottattended an OSU fiscal training workshopat Corvallis. Other OSU staff membersparticipated in pesticide and first aidtraining to maintain their certifications.
On the USDA staff, Daryl Haaschtook a week-long course in LaboratorySafety and Health Training at Albany,California. Larry Baarstad went to aProfessional Development Conference inReno, Nevada and also took a course inLegal and Ethical Issues in Business. PhilDailey attended a Financial ManagementSeminar and a short-course onmanagement. Betty Klepper took anintroductory course in MS-DOS. SharonWart attended courses in word processing,managing projects and deadlines. SharronWart and Carol Brehaut attendedCommunication Skills for Women. SeveralUSDA staff attended first aid, CPR, andpesticide training to maintain certifications.
VISITORS
Distinguished visitors hosted by staff atthe Center included Dick Amerman, USDANational Program Staff, Beltsville, MD;
Earl Rother, Public Relations Officer,Umatilla National Forest, Pendleton;Halina Siemaszko, Polish AgriculturalAcademy; Shigenori Morita, Tokyo, Japan;Michelle Thomlinson, Edmonton, Alberta,Canada; Gordon MacNish, WesternAustralia Dept. of Agriculture; KenStevens, Albany, CA; John Petty, Mattawa,WA; Derek Barnstable, Australia; JohnVan Dam, Idaho Falls, ID; Harold Collins,Hickory Corners, MI; Mike Troutman,Kennewick, WA; Heidi Dobson, WallaWalla, WA; Arthur Nonomura, Photon,Inc., Litchfield Park, AZ; Shelly Erford,Walla Walla, WA; Prasanta Kalita, AssamProvince, India; Vern Stewart, Kalispell,MT; Madame Zhuli, Deputy Director,Beijing Grain Bureau; Mr. Han Yuzeng,Deputy Director, Beijing Cereal IndustryCo.; Mr. Sun Cheng, Director, Beijing Sino-US Flour Mill; Ms. Zhang Li, EconomicRelations & Trade Officer, Beijing GrainBureau, Fred Schneiter, Regional VicePresident, US Wheat Associates, HongKong; Tom Winn, Administrator, OregonWheat Commission; Don Phillips,University of California at Davis.
Other visitors included numerousrepresentatives of equipment and supplycompanies, news media, wheat producers,extension agents, and faculty and staff fromresearch and extension programs inWashington, Idaho, and Oregon.
SEMINARS
The seminar series at the Center wascoordinated by Ron Rickman. Seminarsincluded the following speakers andsubjects: Ron Rickman, USDA-ARS,Pendleton (WEPP workshop for India),(soil and water conservation projects andpractices in India);and (Using MODWHT3to understand wheat growth), Pamela Zwer,OSU, Pendleton (root and shoot
3

development of Russian wheat aphid-infested wheat seedlings), Clyde Douglas,USDA-ARS, Pendleton (influence of tillageand seeds on wheat emergence anddevelopment), Betty Klepper, USDA-ARS,Pendleton (role of rhizotrons in rootresearch), Deghyo Bae, USDA-ARS,Pendleton (real-time flood forecasting forlarge hydrologic basins), Paul Rasmussen,USDA-ARS, (agriculture in Alaska), DanBall, OSU, Pendleton (jointed goatgrassdistribution, biology, and control), DonWysocki, OSU, Pendleton (update onconservation compliance), Dale Wilkins,USDA-ARS, Pendleton (seed size anddensity effects on seedling performance),Deghyo Bae and John Zuzel, USDA-ARS,Pendleton (research plan for the hydrologypost-doctoral research program), KathyWard, OSU, Pendleton (seed treatmenteffects on sprout damaged seed), StephanAlbrecht, USDA-ARS, (global climatechange), Roland Line, USDA-ARS,Pullman (computer-assisted wheat diseasecontrol), Arthur Nonomura (use ofmethanol to improve crop production), JeffJenkins, OSU, Corvallis (decision aids:using current technology), Earl Rother,U.S. Forest Service, Pendleton (NE Oregonforest health), Mike Stoltz, OSU, Pendleton(Poland today), Prasanta Kalita, AssamProvince, India (WEPP hillslope erosionmodel), David Mulla, WSU, Pullman(nonuniform water flow in field soils),Claudio Stockle, WSU, Pullman (interfacingmodels to a GIS system).
LIAISON COMMITTEES
Experiment Station, in cooperation with theDirector of the Pacific West Area, USDA-ARS. These committees provide a primarycommunication linkage among growers andindustry and the research staff and theirparent institutions. The CommitteeChairman and OSU and USDAadministrators encourage and welcome yourconcerns and suggestions for improvementsneeded in any aspect of the researchcenters or their staffs.
A principal activity for the PendletonStation Liaison Committee, led byChairman John Rea (Touchet, WA.:509-394-2430), involved revision of theCommittee Constitution and By-Laws, forimproving the focus and regionalrepresentation of the Committee. TheSherman Station Liaison Committee, led byChairman Steve Anderson (Arlington:503-454-2513), held several meetings as itmoved forward with development of TheSherman Station Endowment Fund. Thisfund was established to providesupplemental financial support foragricultural research in northcentralOregon. Ernie Moore (Moro; 503-565-3202) chaired the sub-committeeresponsible for establishing the endowmentfund. The Committee and OSU staff atMoro, Pendleton, and Corvallis weresaddened by the death of Bill Peters, anenthusiastic member of the ShermanStation Liaison Committee and TheSherman Station Endowment Fund Sub-Committee.
EXPRESSIONS OF APPRECIATIONThe Pendleton and Sherman Station
Liaison Committees have region-widerepresentation and provide guidance indecisions on staffing, programming andfacilities and equipment improvement at theStations. Membership is by appointment bythe Director of the Oregon Agricultural
The staff wishes to express theirappreciation to individuals, associations andcorporations who have given specialassistance for the operation of experimentalplots on or associated with the Centersduring 1992-1993. The Oregon Wheat
4
Richard SmileySuperintendentOSU-CBARC
Betty KlepperResearch LeaderUSDA-ARS-CPCRC
Commission continues to provide the criticalsupport upon which many of the Centers'projects are founded. Thanks are also givento those who donated equipment for long-term use by the Centers (Pat Davis, H andH International, Walla Walla, KayeMcAtee, Monsanto Co., Dick Skiles and JoeTemple), funds, seed, and/or chemicals (AgResearch Inc., American Cyanamid Co.,Eric and Marnie Anderson, BASF Corp.,Blue Mountain Seed (Walla Walla), Cargill,CIBA, E. I. du Pont de Nemours & Co.,Hill Brothers Chemical Co., Hoechst-Roussel Agri-Vet Co., International CanolaCo., Mid-Columbia Producers, Inc., Miles,Pendleton Grain Growers, Pendleton FlourMills, Polysorb, Clint Reeder, Rhone-Poulenc Ag Co., Rohm and Haas, SandozAgro, SeedTec International, Terry S.Simpson, Smith Frozen Foods, OregonDept. of Agriculture, The McGregor Co.,Valent Chemical Co., Wilbur-Ellis Co.), orloaned equipment or facilities (Doug Alley,John Correa, Pat Davis, Sherman CountySheriff's Dept., Frank Tubbs).
We also acknowledge those whodonated labor, supplies, equipment orfunding for the Pendleton Field Day:Umatilla County Ag Lender's Assoc. (U.S.Bank, Inland Empire Bank, First InterstateBank, Farm Credit Services), Mario'sCatering, Carroll Adams Tractor Co.,American Cyanamid Co., BASF Corp.,CIBA, E. I. du Pont de Nemours & Co.,Farm Equipment Headquarters, Hoechst-Roussel Agri-Vet Co., Huntington-Price,Inland Chemical Service, Maxi-GroFertilizer & Chemical Co., Pendleton FlourMills, Pendleton Grain Growers, PioneerImplement Corp., Rohm and Haas Co.,Sandoz Agro, Smith Frozen Foods, TheMcGregor Co., Tri-River Chemical, ValentChemical Co. Walla Walla Farmers Co-op,Western Farm Service, Wilbur-Ellis Co.,Wheatland Insurance, Pendleton SeniorCenter, Main Street Cowboys, UmatillaCounty Wheat Growers League, FrankTubbs, and Robert Hopper. We also thank
the Moro Field Day donors: Cargill Inc.,Cascade Ranchers, Condon Grain Growers,Kaseberg's Wheatacres Irrigation, M & SFarm Supply, Mid-Columbia Producers,Monsanto Co. Morrow County GrainGrowers (Lexington and Wasco), SeedTecInternational, Western Tillage EquipmentCo., Mid-Columbia Bus Co., ShermanCounty School District, and Branding IronRestaurant.
Cooperative research plots at theCenters were operated by Warren Kronstad,Patrick Hayes, Chris Mundt, Russ Karow,Keith Saxton, Floyd Bolton, and BrianTuck. We also thank the SCS DistrictConservationists in Oregon and Washingtonfor their assistance. Additionally, we arevery thankful for the ever-present assistancefrom the Extension Service personnel in allcounties of the region, and especially fromUmatilla, Union, Sherman, Morrow,Gilliam, and Wasco Counties and fromColumbia and Walla Walla Counties inWashington.
We also wish to thank the farmers whohave allowed us to work on their propertyduring the past year, and who have oftengone the extra mile by performing fieldoperations, loaning equipment, donatingchemicals, and adjusting their practices toaccommodate our plots. The locations ofthese outlying sites are shown on the mapthat follows.
We truly appreciate the support andencouragement of growers, organizations,and businesses with a mission common toours: to serve in the best manner possiblethe agricultural needs of our region. Wewelcome your suggestions on how we maycontinue to improve our attempts to reachthis goal.
5
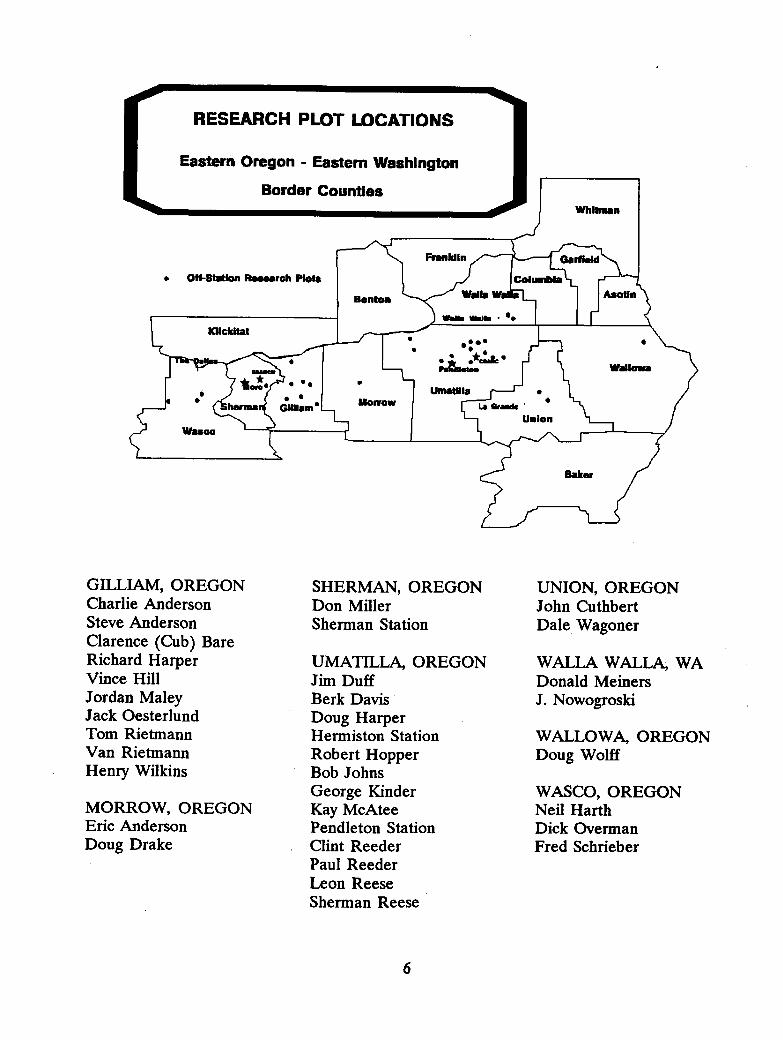
RESEARCH PLOT LOCATIONS
Eastern Oregon - Eastern Washington
Border CountiesINhlhaan
GILLIAM, OREGONCharlie AndersonSteve AndersonClarence (Cub) BareRichard HarperVince HillJordan MaleyJack OesterlundTom RietmannVan RietmannHenry Wilkins
MORROW, OREGONEric AndersonDoug Drake
SHERMAN, OREGONDon MillerSherman Station
UMATILLA, OREGONJim DuffBerk DavisDoug HarperHermiston StationRobert HopperBob JohnsGeorge KinderKay McAteePendleton StationClint ReederPaul ReederLeon ReeseSherman Reese
UNION, OREGONJohn CuthbertDale Wagoner
WALLA WALLA, WADonald MeinersJ. Nowogroski
WALLOWA, OREGONDoug Wolff
WASCO, OREGONNeil HarthDick OvermanFred Schrieber
6
PUBLICATIONS
Albrecht, S.L., J.T. Baker, L.H. Allen, Jr., and K.J. Boote. 1992. Rice photosynthesis andevapotranspiration responses to CO 2 and nitrogen. Agron. Abstr. p. 11.
Baarstad, L.L., R.W. Rickman, D. Wilkins, and S. Morita. 1993. A hydraulic soil samplerproviding minimum field plot disturbance. Agron. J. 85:178-181.
Ball, D. A. and S. A. Reinertsen 1993. Downy brome control in winter wheat withsequential treatments. West. Soc. Weed Sci. Res. Prog. Rpt. pg 155.
Ball, D. A. 1993. Wild oats control in winter wheat. West. Soc. Weed Sci. Res. Prog. Rpt.
pg 151.
Ball, D. A. and E. E. Jacobsen 1993. Influence of replanting regime on control of downybrome in winter wheat. West. Soc. Weed Sci. Res. Prog. Rpt. pg 153.
Ball, D. A. and G. Clough 1993. Weed control in irrigated green peas. West. Soc. WeedRes. Sci. Prog. Rpt. pg 111.
Ball, D. A. 1993. Weed control in red lentils. West. Soc. Weed Sci. Res. Prog. Rpt. pg
105.
Ball, D. A. 1993. Grass weed control in spring canola. West. Soc. Weed Sci. Res. Prog.
Rpt. pg 75.
Ball, D. A. 1993. Weed control and crop tolerance ,in white lupine. West. Soc. Weed Sci.Res. Prog. Rpt. pg 109.
Ball, D. A. and M. Stoltz. 1993. Metribuzin tolerance in tall fescue seed. West. Soc. WeedSci. Res. Prog. Rpt. pg 103.
Ball, D. A. 1992. Weed seed bank response to tillage, herbicides, and crop rotation
sequence. Weed Science 40:654-659.
Collins, H. P., P. E. Rasmussen, and C. L. Douglas, Jr. 1992. Crop rotation and residuemanagement effects on soil carbon and microbial dynamics. Soil Sci. Soc. Am. J.
56:783-788.
Douglas, C. L. Jr., P. E. Rasmussen, and R. R. Allmaras. 1992. Nutrient distributionfollowing wheat residue dispersal by combines. Soil Sci. Soc. Am. J. 56-1171-1177.
Douglas, C. L. Jr., and R. W. Rickman. 1992. Estimating crop residue decomposition fromair temperature, initial nitrogen content, and residue placement. Soil Sci. Soc. Am.
J. 56:272-278.
7

Douglas, C. L. Jr., R. W. Rickman, B. L. Klepper, J. F. Zuzel and D. J. Wysocki. 1992.Agroclimatic zones for dryland winter wheat producing areas of Idaho, Washington,and Oregon east of the Cascade Mountains. Northwest Science 66:26-34.
Douglas, C.L. Jr. and D.E. Wilkins. 1992. Influence of tillage and seeds on wheatemergence and development. Agron. Abstr. p. 323.
Kamuru, F., S.L. Albrecht, J.T. Baker, L.H. Allen, Jr., and K.T. Shanmugam. 1992. Anammonia-excreting, N2-fixing cyanobacteria as a nitrogen source for rice growth.Agron. Abstr. p. 261.
Klepper, B. Roots - Past, Present and Future. 1992. In (H.F. Reetz, Jr., Ed., Roots of PlantNutrition). p. 7-18. Proceedings of a Conference at Champaign, IL July 8-10, 1992.Potash and Phosphate Institute, Atlanta, GA 30329-2199.
McMaster, G.S., B. Klepper, R.W. Rickman, W.W. Wilhelm, and W.O. Willis. 1991.Simulation of shoot vegetative development and growth of unstressed winter wheat.Ecol. Model 53:189-204.
Milam, J.R., J.-S. So and S. L. Albrecht. 1992. Isolation and characterization of free-livingnitrogen-fixing bacteria from the roots of several forage grass species. Ninth Inter.Cong. on Nitrogen Fixation, (Cancun, Mexico) Abstr. p. 840.
Montfort, F., P. Lucas, and R.W. Smiley. 1992. Comparison of seed and foliar treatmentsfor controlling eyespot, 1991. Fungic. & Nematic. Tests 47:272.
Pikul, J.L.,Jr., J.F. Zuzel, and D.E. Wilkins. 1992. Infiltration into frozen soil as affectedby ripping. Trans. ASAE. 35(1):83-90.
Rasmussen, P.E. 1992. Cereal response to phoshorus and sulfur in NE Oregon. pp. 82-85.In Proc. Western Phosphate-Sulfur Workgroup. 6-8 August 1992, Anchorage, AK.
Rickman, R. W., S. E. Waldman, and B. L. Klepper. 1992. Calculating daily root lengthdensity profiles by applying elastic theory to agricultural soils. J. of Plant Nutrition15:661-675.
Rickman, R., D. Wilkins, C. Douglas, and R. Adleman. 1992. Residue management forerosion control. pp. 14-17. In 1992 Columbia Basin Agric. Res., Oreon Agric. Expt.Stn. Special Report 894.
Smiley, R.W. 1992. 'Dividend': A potential seed treatment fungicide. pp. 52-59. In 1992Columbia Basin Agric. Res., Oreon Agric. Expt. Stn. Special Report 894.
Smiley, R.W. 1992. APS Slide Collection for Turfgrass Diseases (with syllabus). Amer.Phytopathol. Soc., St. Paul, MN.
8
Smiley, R.W. 1992. Estimate of cultivated acres for agronomic zones in the PacificNorthwest. pp. 86-87. In 1992 Columbia Basin Agric. Res., Oreon Agric. Expt. Stn.Special Report 894.
Smiley, R.W. 1992. Summary of Rhizoctonia root rot research on wheat and barley. pp. 41-51. In 1992 Columbia Basin Agric. Res., Oreon Agric. Expt. Stn. Special Report 894.
Smiley, R.W., J.A. Biddle, S. Ott, and G.H. Cook. 1992. Control of cereal cyst nematodewith Temik, 1987. Fungic. & Nematic. Tests 47:168.
Smiley, R.W., H.P. Collins, and W. Uddin. 1992. Influence of long-term crop managementon wheat diseases in eastern Oregon. Phytopathology 82:1131 (abstract).
Smiley, R.W., R.E. Ingham, and G.H. Cook. 1992. Control of cereal cyst nematode within-furrow and seed treatments, 1988. Fungic. & Nematic. Tests 47:167.
Smiley, R.W., A.G. Ogg, Jr., and R.J. Cook. 1992. Influence of glyphosate on severity ofRhizoctonia root rot, growth, and yield of barley. Plant Dis. 76:937-942.
Smiley, R.W., and W. Uddin. 1992. Influence of seed treatments on root and foot rotcomplexes, 1991. Fungic. & Nematic. Tests 47:276.
Smiley, R.W., and W. Uddin. 1992. Control of take-all with seed- or banded-treatments,1991. Fungic. & Nematic. Tests 47:275.
Smiley, R.W., and W. Uddin. 1992. Control of flag smut with seed treatments, 1991.Fungic. & Nematic. Tests 47:277.
Smiley, R.W., and W. Uddin. 1992. Influence of tillage and nitrogen on crown rot (drylandfoot rot), 1991. Biological & Cultural Tests 7:76.
Smiley, R.W., W. Uddin, and M. Kolding. 1992. Control of dwarf bunt with seed and foliartreatments, 1991. Fungic. & Nematic. Tests 47:274.
Smiley, R.W., W. Uddin, P.K. Zwer, L.-M. Gillespie-Sasse, and M.A. Stoltz. 1992. Cropmanagement effects on physiologic leaf spot of wheat. Phytopathology 82:1113(abstract).
Smiley, R.W., P.K. Zwer, W. Uddin, and D. Sutherland. 1992. Incidence of crown rot(dryland foot rot) on cultivars and selections of winter wheat, 1991. Biological &Cultural Tests 7:77.
Wilkins, D., F. Bolton, and K. Saxton. 1992. Evaluating seeders for conservation tillageproduction of peas. Applied Engineering in Agriculture 8(2):165-170.
9
Wilkins, D.E., C.L. Douglas,Jr. and R.W. Smiley. 1992. Influence of tillage and seed onwheat disease. Amer. Soc. of Agric. Engr. paper #92-1591.
Wilkins, D.E., C.L. Douglas, Jr., and R.W. Smiley. 1992. Influence of tillage and seed onwheat disease. Annual Meeting of Amer. Soc. Agri. Eng., Nashville, TN. (abstract).
Wilkins, D.E., and D.A. Haasch. 1992. Opener modification for seeding canola. pp 38-40.In 1992 Columbia Basin Agric. Res., Oregon Agric. Expt. Stn. Special Report 894.
Wilkins, D.E., and J.L. Pikul, Jr. 1992. Soil physical properties. pp 180-186. In L.L.Singleton, J.D. Mihail and C.M. Rush (ed) Methods for Research on SoilbornePhytopathogenic Fungi.
Winzer, U., S.L. Albrecht and J.M. Bennett. 1992. Effect of water deficits on growth andnitrogen fixation of hairy indigo. Soil Crop Soc. Fla. Proc. 51:125-129.
Wysocki, D.J. 1992. An educational and research program on soil and crop managementstrategies for improved dryland farm profitability and sustained environmentalquality. Oregon Wheat Commission Annual Report.
Wysocki, D.J., S. Ott, M. Stoltz, and T.C. Chastain. 1992. Variety and planting date effectson dryland canola. pp. 32-37. In 1992 Columbia Basin Agric. Res., Oregon Agric.Expt. Stn. Special Report 894.
Zwer, P.K., Park, R.F., and McIntosh, R.A. 1992. Wheat stem rust in Australia--1969-1985.Aust. J. Agric. Res. 43:399-431.
Zwer, P.K. and Qualset, C.O. 1992. Genes for resistance to stripe rust in four spring wheatvarieties 1. Seedling responses. Euphytica 58:171-181.
Zwer, P.K., Mosaad, M. G., and Rickman, R.W. 1992. The effect of Russion wheat aphidon root and shoot development in tolerant and susceptible wheat genotypes. Amer.Soc. Agron. Abst. p.120.
Zwer, P.K., Sutherland, D.L., and Gibbs, S.D. 1992. Club wheat breeding program. pp. 67-75. In 1992 Columbia Basin Agric. Res., Oregon Agr. Expt. Stn Spec. Rpt. 894.
10
AUTHOR AFFILIATIONS
Allmaras, R. R., Soil Scientist, USDA-ARS, Soil and Water Management Research, St.Paul, Minnesota
Ball, D. A., Assistant Professor, Columbia Basin Agricultural Research Center, OregonState University, Pendleton, Oregon
Bolton, Floyd E., Emeritus Associate Professor, Department of Crop and Soil Science,Oregon State University, Corvallis, Oregon
Churchill, Donald B., Agricultural Engineer, USDA-ARS, National Forage SeedProduction Research Center, Corvallis, Oregon
Cook, Gordon, Union County Extension Agent, Oregon State University, La Grande,Oregon
Douglas, Clyde L. Jr., Soil Scientist, USDA-ARS, Columbia Plateau Conservation ResearchCenter, Pendleton, Oregon
Duff, Bart, Consulting Agricultural Economist, Pendleton, Oregon
Greenwalt, Richard N., Computer Specialist, USDA-ARS, Columbia Plateau ConservationResearch Center, Pendleton, Oregon
Haasch, Daryl A., Engineering Technician, USDA-ARS, Columbia Plateau ConservationResearch Center, Pendleton, Oregon
Ingham, Russell, Associate Professor, Botany and Plant Pathology, Oregon State University,Corvallis, Oregon
Klepper, Betty, Research Leader and Supervisory Plant Physiologist, USDA-ARS,Columbia Plateau Conservation Research Center, Pendleton, Oregon
Kolding, Mathias F., Senior Instructor, Hermiston Agricultural Research and ExtensionCenter, Hermiston, Oregon
Kronstad, W. E., Distinguished Professor, Department of Crop and Soil Science, OregonState University, Corvallis, Oregon
Love, C. S., Senior Faculty Research Assistant, Department of Crop and Soil Science,Oregon State University, Corvallis, Oregon
Metzger, R. J., Professor (courtesy), USDA-ARS, Department of Crop and Soil Science(retired), Oregon State University, Corvallis, Oregon
11
Nesse, Phil, Gilliam County Extension Agent, Oregon State University, Condon, Oregon
Ott, Sandra, Biological Science Research Technician, Columbia Basin AgriculturalResearch Center, Oregon State University, Pendleton, Oregon
Rasmussen, Paul E., Soil Scientist, USDA-ARS, Columbia Plateau Conservation ResearchCenter, Pendleton, Oregon
Rickman, Ronald W., Soil Scientist, USDA-ARS, Columbia Plateau Conservation ResearchCenter, Pendleton, Oregon
Rydrych, D. J., Emeritus Professor, Columbia Basin Agricultural Research Center, OregonState University, Pendleton, Oregon
Schillinger, William F., Adams County Extension Agent, Washington State University,Ritzville, Washington
Smiley, Richard W., Superintendent and Professor, Columbia Basin Agricultural ResearchCenter, Oregon State University, Pendleton, Oregon
Sutherland, D. L., Faculty Research Assistant, Columbia Basin Agricultural ResearchCenter, Oregon State University, Pendleton, Oregon
Waldman, Sue E., Mathematician, USDA-ARS, Columbia Plateau Conservation ResearchCenter, Pendleton, Oregon
Wilkins, Dale E., Agricultural Engineer, USDA-ARS, Columbia Plateau ConservationResearch Center, Pendleton, Oregon
Wysocki, Don, Associate Professor, Columbia Basin Agricultural Research Center, OregonState University, Pendleton, Oregon
Zuzel, John F., Hydrologist, USDA-ARS, Columbia Plateau Conservation Research Center,Pendleton, Oregon
Zwer, Pamela K., Assistant Professor, Columbia Basin Agricultural Research Center,Oregon State University, Pendleton, Oregon
12
BIOLOGICAL AND ECONOMICSUSTAINABILITY OF
WHEAT/FALLOW AGRICULTURE
Paul E. Rasmussen, Richard W. Smiley,and Bart Duff
There is a growing perception amongthe general populace that present farmingpractices are neither sustainable norenvironmentally sound. Sustainability isgenerally defined as the ability of soil tomaintain crop production withoutdegradation of the soil or contamination ofthe environment. Present agriculturalgrowth is attained by steadily increasingyield through greater input of non-renewable resources. Excessive soil erosionremains an ever-present threat to continuedproductivity. The sustainability of PacificNorthwest wheat production systems is alsorelated to economic viability because ofstrong international competition for exportmarkets, rising production costs, and ever-increasing off-farm costs for factors such assoil erosion, fertilizers, and pesticides.There is, therefore, a strong incentive todetermine if present practices are not onlysustainable, but also capable of enhancingwheat production in this region.
Long-term experiments provideinformation about the sustainability ofagricultural systems that can be obtained inno other way. Oregon State University andthe USDA maintain five long-termexperiments at the Columbia BasinAgricultural Research Center nearPendleton. These are among the oldestreplicated research experiments in thenation. We attempted to measure trends inlong-term agricultural sustainability for awheat/fallow experiment started in 1931.The wheat/fallow system is perhaps themost sensitive of all production systemsbecause, while it reduces the risk of crop
failure resulting from inadequate soilmoisture, it is subject to rapid soil organicmatter loss during the non-productive partof the rotation.
HISTORY OF THE RESIDUEMANAGEMENT EXPERIMENT
This study was initiated at theResearch Center in 1931 to evaluate thelong-term effects of fertilizer amendmentsand residue management on grain yield andsoil quality in a wheat/fallow productionsystem. The experiment has two identicalseries offset by one year so one is in cropwhile the other is in fallow. The soil is aWalla Walla silt loam. This trial has beenconducted relatively unaltered sinceinception, with changes introduced only toensure relevance with modern agriculture.Long-term supporting data from theCenter's variety breeding trials are alsoavailable to evaluate yield improvementsover time.
We selected four treatments in theresidue management experiment toinvestigate sustainability (Table 1). Winterwheat stubble is left undisturbed overwinter, except for the fall-burn treatment.The organic amendment (barnyard manure)is applied to the manure treatment in thespring. The entire experiment is moldboardplowed in April and smoothed with a fieldcultivator and harrow. The fallow isrodweeded three to four times annually.Inorganic-N fertilizer is applied to the 80-Ntreatment as granular material broadcastjust prior to planting. Grain yield isdetermined by combine harvesting a portionof each plot.
Two major changes in managementhave occurred since 1931. The initialexperiment utilized a medium-tall soft whitewinter wheat variety (Rex M-1) and a low
13
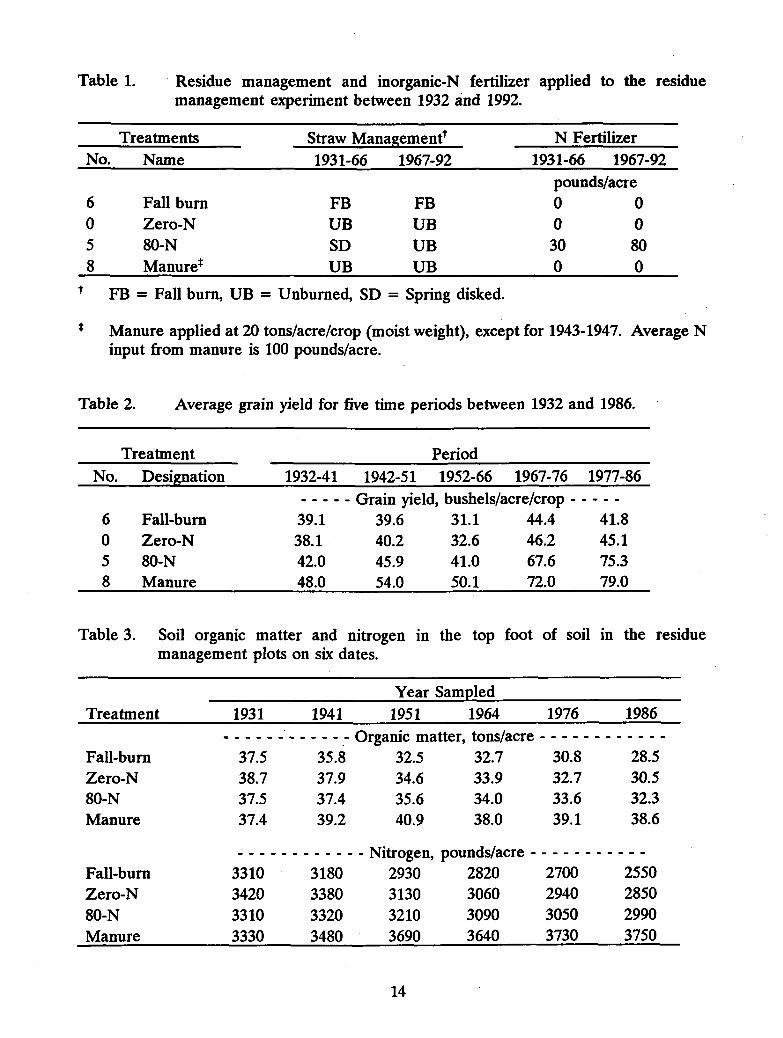
Table 1. Residue management and inorganic-N fertilizer applied to the residuemanagement experiment between 1932 and 1992.
Treatments Straw ManagementtN Fertilizer
No. Name 1931-66 1967-92 1931-66 1967-92
pounds/acre6 Fall bum FB FB 0 00 Zero-N UB UB 0 05 80-N SD UB 30 808 Manures UB UB 0 0t FB = Fall burn, UB = Unburned, SD = Spring disked.
Manure applied at 20 tons/acre/crop (moist weight), except for 1943-1947. Average Ninput from manure is 100 pounds/acre.
Table 2. Average grain yield for five time periods between 1932 and 1986.
Treatment PeriodNo. Designation 1932-41 1942-51 1952-66 1967-76 1977-86
Grain yield, bushels/acre/crop 6 Fall-burn 39.1 39.6 31.1 44.4 41.80 Zero-N 38.1 40.2 32.6 46.2 45.15 80-N 42.0 45.9 41.0 67.6 75.38 Manure 48.0 54.0 50.1 72.0 79.0
Table 3. Soil organic matter and nitrogen in the top foot of soil in the residuemanagement plots on six dates.
Year SampledTreatment 1931 1941 1951 1964 1976 1986
Organic matter, tons/acre Fall-burn 37.5 35.8 32.5 32.7 30.8 28.5Zero-N 38.7 37.9 34.6 33.9 32.7 30.580-N 37.5 37.4 35.6 34.0 33.6 32.3Manure 37.4 39.2 40.9 38.0 39.1 38.6
Nitrogen, pounds/acre Fall-burn 3310 3180 2930 2820 2700 2550Zero-N 3420 3380 3130 3060 2940 285080-N 3310 3320 3210 3090 3050 2990Manure 3330 3480 3690 3640 3730 3750
14
•• •
•
100 - n - RIPROVED VARIETIES (+N)
o - 'IMPROVED VAIKIT (+PO
•
rate of N application (30 lb/acre). Theexperiment was revised in 1967 to changethe wheat type from a medium-tall to asemi-dwarf variety, and to increase the Napplication rate from 30 to 80 lb/acre.Wheat cultivars since 1967 includeNugaines (1967-1973), Hyslop (1974-1978),and Stephens (1979-1992).
Soil samples to a depth of two feetwere taken in 1931, 1941, 1951, 1964, 1976,and 1986. Total N and organic C (ameasure of organic matter) weredetermined for the 0-12 and 12-24 inchincrements. Since less than 1 percent ofthe total N was inorganic, all N in soil isessentially organic-N.
WHEAT YIELD AND SOILCHEMICAL PROPERTIES
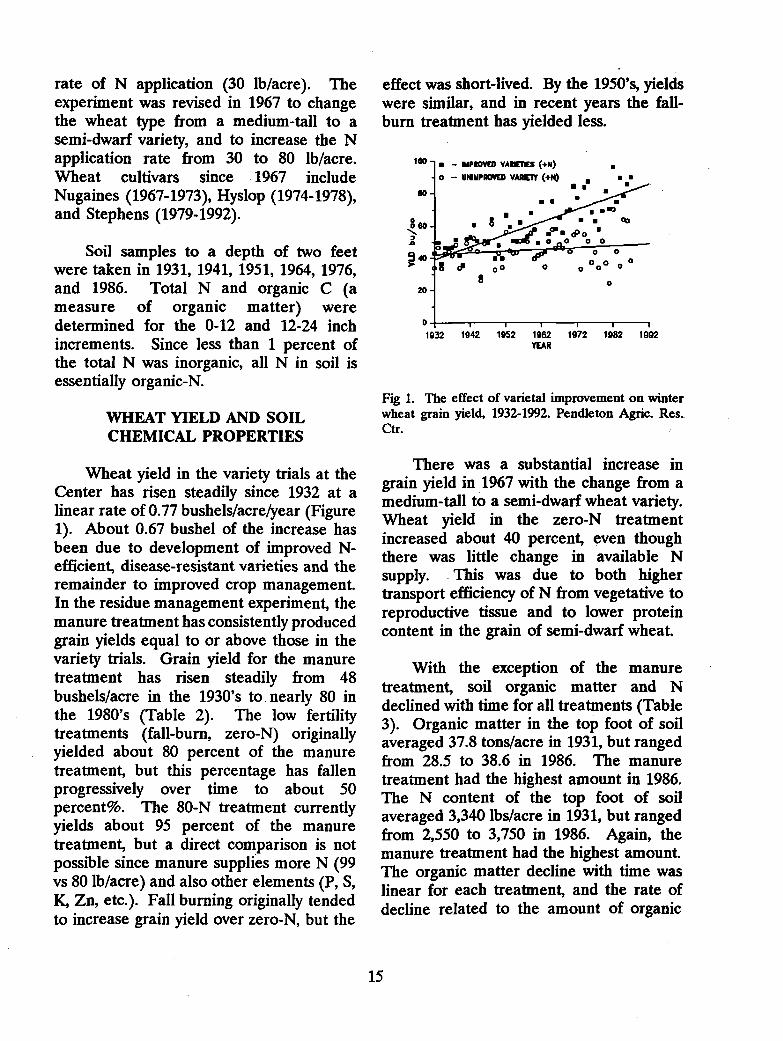
Wheat yield in the variety trials at theCenter has risen steadily since 1932 at alinear rate of 0.77 bushels/acre/year (Figure1). About 0.67 bushel of the increase hasbeen due to development of improved N-efficient, disease-resistant varieties and theremainder to improved crop management.In the residue management experiment, themanure treatment has consistently producedgrain yields equal to or above those in thevariety trials. Grain yield for the manuretreatment has risen steadily from 48bushels/acre in the 1930's to nearly 80 inthe 1980's (Table 2). The low fertilitytreatments (fall-burn, zero-N) originallyyielded about 80 percent of the manuretreatment, but this percentage has fallenprogressively over time to about 50percent%. The 80-N treatment currentlyyields about 95 percent of the manuretreatment, but a direct comparison is notpossible since manure supplies more N (99vs 80 lb/acre) and also other elements (P, S,K, Zn, etc.). Fall burning originally tendedto increase grain yield over zero-N, but the
effect was short-lived. By the 1950's, yieldswere similar, and in recent years the fall-burn treatment has yielded less.
0 1 I 1 i1932 1942 1952 1962 1972 1982 1992
YEAR
Fig 1. The effect of varietal improvement on winterwheat grain yield, 1932-1992. Pendleton Agric. Res.Ctr.
There was a substantial increase ingrain yield in 1967 with the change from amedium-tall to a semi-dwarf wheat variety.Wheat yield in the zero-N treatmentincreased about 40 percent, even thoughthere was little change in available Nsupply. This was due to both highertransport efficiency of N from vegetative toreproductive tissue and to lower proteincontent in the grain of semi-dwarf wheat.
With the exception of the manuretreatment, soil organic matter and Ndeclined with time for all treatments (Table3). Organic matter in the top foot of soilaveraged 37.8 tons/acre in 1931, but rangedfrom 28.5 to 38.6 in 1986. The manuretreatment had the highest amount in 1986.The N content of the top foot of soilaveraged 3,340 lbs/acre in 1931, but rangedfrom 2,550 to 3,750 in 1986. Again, themanure treatment had the highest amount.The organic matter decline with time waslinear for each treatment, and the rate ofdecline related to the amount of organic
15
residue being returned to the soil. None ofthe treatments presently produce enoughstraw residue to stop the decline in soilorganic matter.
ECONOMIC ANALYSIS
We developed an index of input costsand output prices between 1931 and 1992for each treatment based on USDAestimates of prices paid by farmers.Because the cost of experimental trials arehigher than actual farm costs, we used theoperational and fixed costs for arepresentative 2,500 acre farm in theColumbia Plateau (Table 4). Culturaloperations and costs were assumed identicalfor each treatment. Thus, treatment costsare distinguished only by differences in thecost of fertilizer and residue inputs, the costof yield-dependent operations such asharvesting and hauling, and external costsresulting from erosion. Individualtreatment costs were multiplied by the inputcost index to generate annual cost estimatesfor each treatment. We tested the validityof these estimates by comparing thecalculated indexed costs against a limitedsurvey of actual production costs for theyears 1974-1988. Cost estimates based onthe national index of prices paid by farmersclosely approximated wheat/fallowproduction costs reported by the survey.
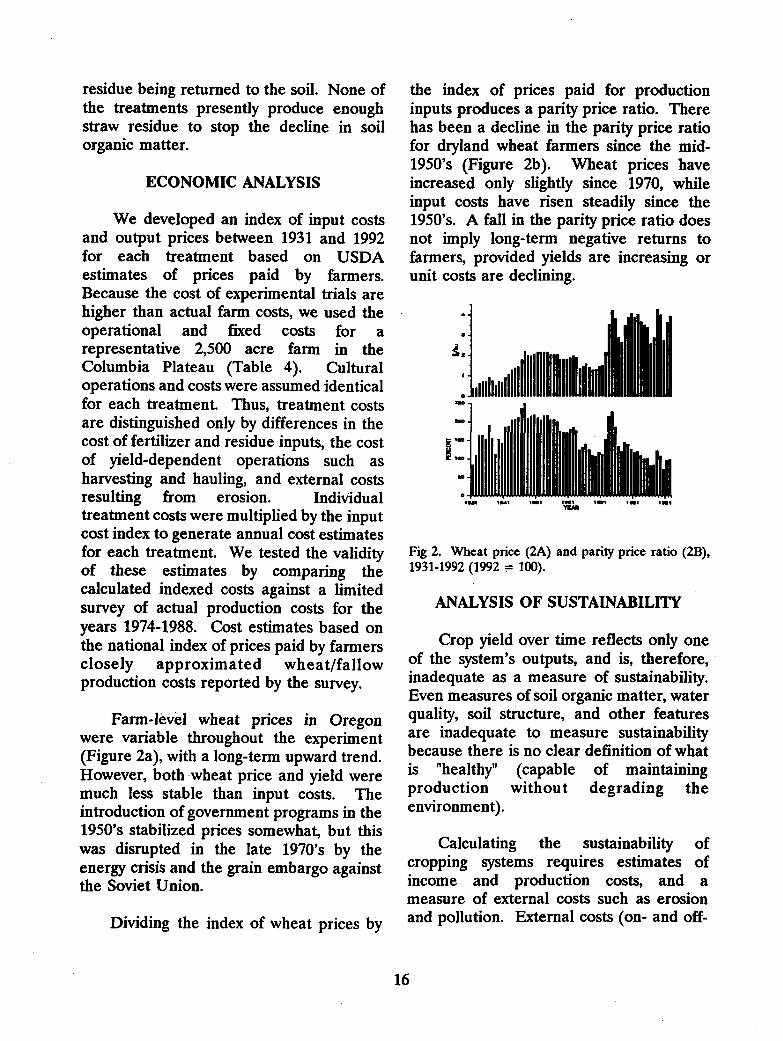
Farm-level wheat prices in Oregonwere variable throughout the experiment(Figure 2a), with a long-term upward trend.However, both wheat price and yield weremuch less stable than input costs. Theintroduction of government programs in the1950's stabilized prices somewhat, but thiswas disrupted in the late 1970's by theenergy crisis and the grain embargo againstthe Soviet Union.
Dividing the index of wheat prices by
the index of prices paid for productioninputs produces a parity price ratio. Therehas been a decline in the parity price ratiofor dryland wheat farmers since the mid-1950's (Figure 2b). Wheat prices haveincreased only slightly since 1970, whileinput costs have risen steadily since the1950's. A fall in the parity price ratio doesnot imply long-term negative returns tofarmers, provided yields are increasing orunit costs are declining.
-,,0111,01111111111111111111
_
-
IW 1 1141 WI
141 IA1YWI
Fig 2. Wheat price (2A) and parity price ratio (2B),1931-1992 (1992 = 100).
ANALYSIS OF SUSTAINABILITY
Crop yield over time reflects only oneof the system's outputs, and is, therefore,inadequate as a measure of sustainability.Even measures of soil organic matter, waterquality, soil structure, and other featuresare inadequate to measure sustainabilitybecause there is no clear definition of whatis "healthy" (capable of maintainingproduction without degrading theenvironment).
Calculating the sustainability ofcropping systems requires estimates ofincome and production costs, and ameasure of external costs such as erosionand pollution. External costs (on- and off-
O
16
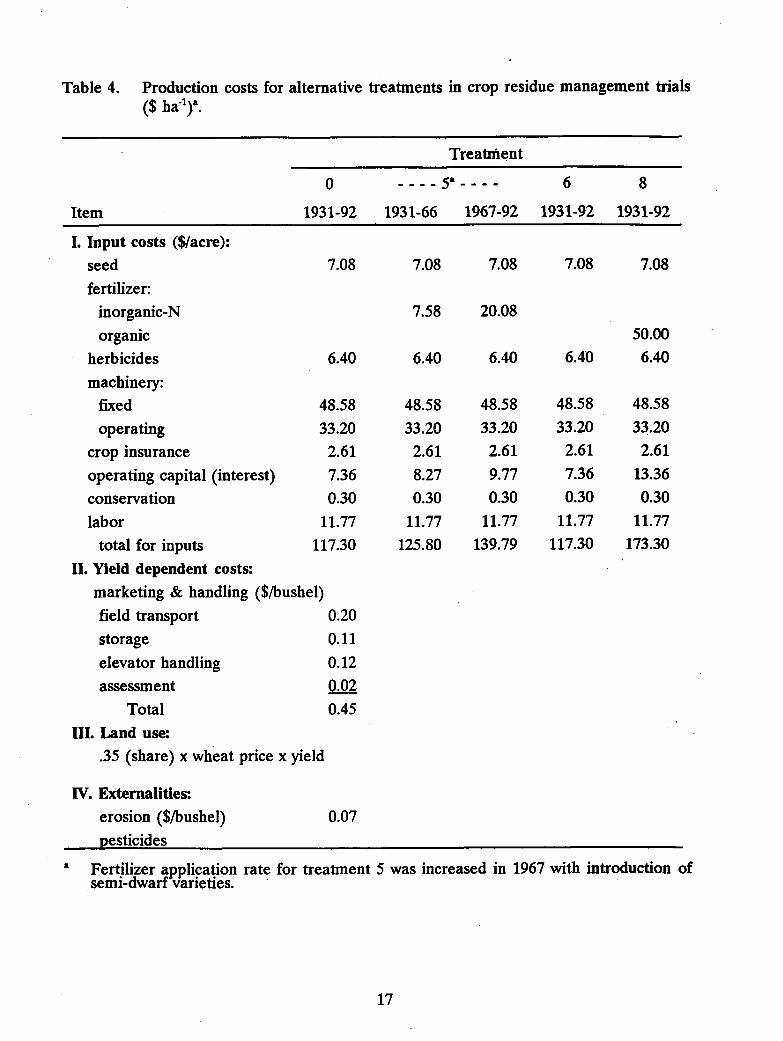
Table 4. Production costs for alternative treatments in crop residue management trials($ ha-1)a.
Treatment
0
Item 1931-92 1931-66 1967-92
6
1931-92
8
1931-92
I. Input costs ($/acre):
seed 7.08fertilizer:
7.08 7.08 7.08 7.08
inorganic-N 7.58 20.08
organic 50.00
herbicides 6.40machinery:
6.40 6.40 6.40 6.40
fixed 48.58 48.58 48.58 48.58 48.58
operating 33.20 33.20 33.20 33.20 33.20
crop insurance 2.61 2.61 2.61 2.61 2.61
operating capital (interest) 7.36 8.27 9.77 7.36 13.36
conservation 0.30 0.30 0.30 0.30 0.30
labor 11.77 11.77 11.77 11.77 11.77
total for inputs 117.30 125.80 139.79 117.30 173.30
II. Yield dependent costs:
marketing & handling ($/bushel)field transport 0.20storage 0.11elevator handling 0.12assessment 0.02
Total 0.45III. Land use:
.35 (share) x wheat price x yield
IV. Externalities:
erosion ($/bushel) 0.07pesticides
a Fertilizer application rate for treatment 5 was increased in 1967 with introduction ofsemi-dwarf varieties.
17
farm costs to society) resulting from soilerosion, and pesticide and fertilizer use arepart of the true cost of farming. Theanalysis of sustainability is achieved usingan index called Total Social FactorProductivity (TSFP). External costs due toon- and off-site effects resulting frompesticides and erosion are included in thecalculation of TSFP.
Off-site costs associated with fertilizersinclude regulatory costs, health effects ofnitrates in drinking water, andenvironmental effects of fertilizer use.Little evidence is available indicating theextent of nitrate movement into ground andsurface water in dryland wheat areas, andits potential cost. Nitrate in water from ashallow (280 ft) but not a deep (400 ft) wellat the Research Center currently exceedsthe EPA's maximum allowableconcentration of 10 ppm. The source(s)and historical trends for nitrates in this wellare not known, but an off-site source ismost likely.
There are numerous ways in whichpesticides can enter non-target portions ofthe environment. Both costs and benefitsare associated with this externality. Costsinclude regulatory and monitoring costs,health effects on humans, andenvironmental effects such as reducedefficiency of natural enemies of pests,secondary pest outbreaks, pest resistance,crop and tree loss, and poisonings of fish,wildlife, bees, and domestic animals.Positive effects of pesticide use includereduced cost of weed management innoncrop areas, lower highway maintenance(weeds clog culverts and contribute toroadbed deterioration), and less expense forcontrolling human allergies from windbornepollen, contamination of feed and food bymycotoxins produced by fungi, orintroduction of weeds, diseases, and pests
into previously uninfested areas. As withfertilizers, it is difficult to assign values toexternal costs for pesticides. No pesticideshave been detected in well water at theResearch Center. In the absence of furtherevidence, we simply flagged externalpesticide costs at $1.00/acre.
Soil erosion losses for each treatmentwere calculated using the Revised UniversalSoil Loss Equation (RUSLE) model.Because the experiment is located on gentlesloping topography, calculated erosionlosses are quite low and not representativeof losses that occur on steeper slopesthroughout the area. Soil losses werecalculated at 0.2 to 1.5 tons/acre/year. Incontrast, erosion rates of 2-14tons/acre/year are estimated on sloping landin the Columbia Plateau. Crop productivitylosses for erosion rates of 5, 10, and 15tons/acre were estimated using equationsdeveloped by Walker and Young (1986) forsimilar conditions in eastern Washington.The effect of continued soil erosion onsustainability was then computed.
DEFINING SUSTAINABILITY
To define long-term environmentaltrends, we need to determine biologicalsustainability. To find out if systems arefinancially sound, we have to determineeconomic sustainability. We can achieveboth by controlling TFSP over time. In thisreport, biological sustainability wasestimated by holding input/output priceindexes constant at 1992 levels. Thiseliminated price fluctuations and confinedchange to factors that affected productivity.Economic sustainability was estimated byallowing input and output prices to vary.Economic sustainability is thus a compositeof both biological change and income/costconsiderations. Long-term biologicalsustainability by itself is not a sufficient
18
1.5
condition for economic sustainability.Conversely, economic sustainability isneither necessary nor sufficient forbiological sustainability. The criticalidentifier of sustainability in this analysis isthe slope of the trend line rather than aspecific number. A sustainable system musthave a positive slope to the trend line overtime. To estimate the effect of varietyimprovement on sustainability, data weredivided into two periods for analysis: 1931-1966, when a single wheat variety wasgrown, and 1967-92, when improved semi-dwarf wheats were grown.
CHANGES IN SUSTAINABILITY INWHEAT/FALLOW SYSTEMS
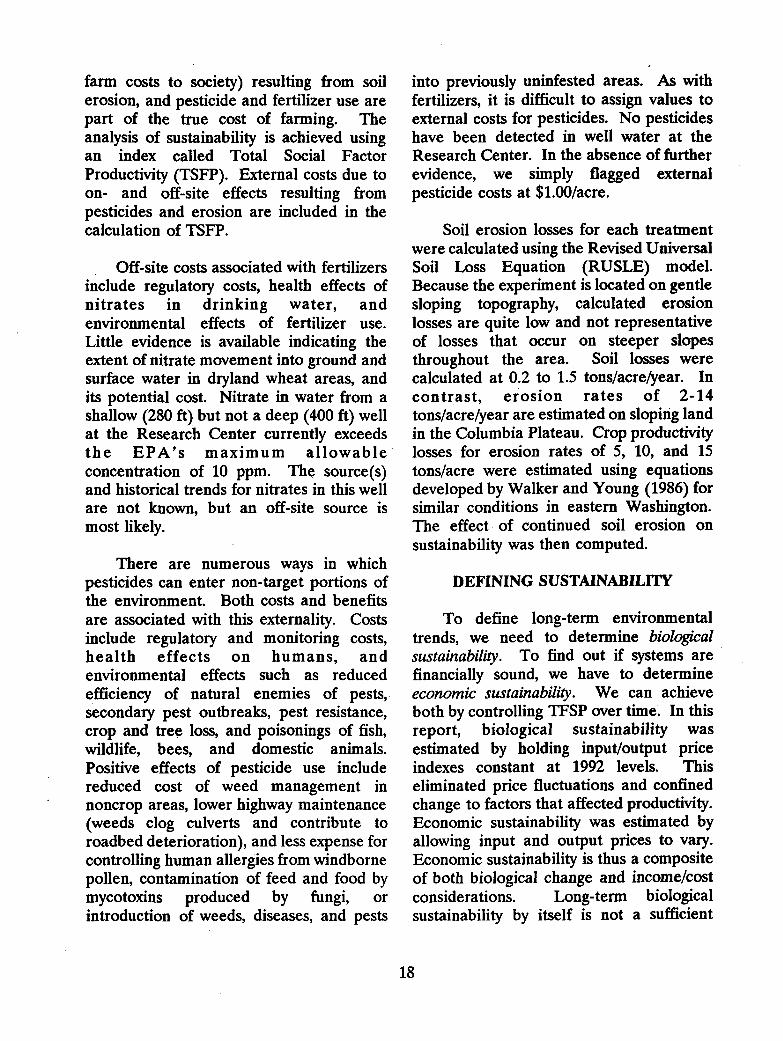
Trends in both biological and economicsustainability are illustrated in Figure 3 forthe 80-N treatment. Biologicalsustainability (constant price) declinedmoderately during the 1931-1966 period.This is generally due to declining yieldassociated with decreasing organic matter insoil. The trend for the 1967-1992 period,after introduction of semi-dwarf varieties,was positive. Improved yield due to varietalselection was able to offset the yield declinebrought about by deterioration of the soilresource base.
Economic sustainability (indexed price)shows much greater yearly variability thandoes biological sustainability. There was aslight trend towards increased economicsustainability for the 1931-1966 period, buta pronounced decline for the 1967-1992period. Economic sustainability declineddespite improved biological sustainabilitythrough improved wheat varieties. Apronounced decline in the parity price ratioduring this period overshadowed anyincrease in productivity.
2.0— INDEXED PRICE
1931-1986 T = 1.13 + 0.0014X1967-1992 T = 1.27 — 0.0092X
0.5O — CONSTANT PRICE
1931-1965 Y = 0.81 — 0.0017X1967-1992 Y = 1.01 + 0.0031X
0.0 1931
1941
1951 1961 1971
1981
1991YEAR
Fig 3. Trends in biological sustainability (constantprice) and economic sustainability (indexed price) forthe 80-N treatment over two time periods, 1931-66 (novariety improvement) and 1967-92 (varietyimprovement). Sustainability derived from TotalSocial Factor Productivity (TSFP) data.
TRCATIIIIIT • (manor.. no burn)
• TIICATVOIT 0 (0n11. MI Yana
06
TiO 1114T111111. • (10-N. no burn)
TKATIIDAT • (11.M. Nil burn)
0004.Oolono••••••••",-
pe..........metiOn.onobow000nosonroo•-
0.1
1131 19'41 1161 11111• I
1971 1961 11191YEAR
Fig 4. Summary of trends in biological sustainabilityfor four treatments (Manure, Zero-N, 80-N, and Fall-burn) over two time periods, 1931-66 (no varietyimprovement) and 1967-92 (variety improvement).
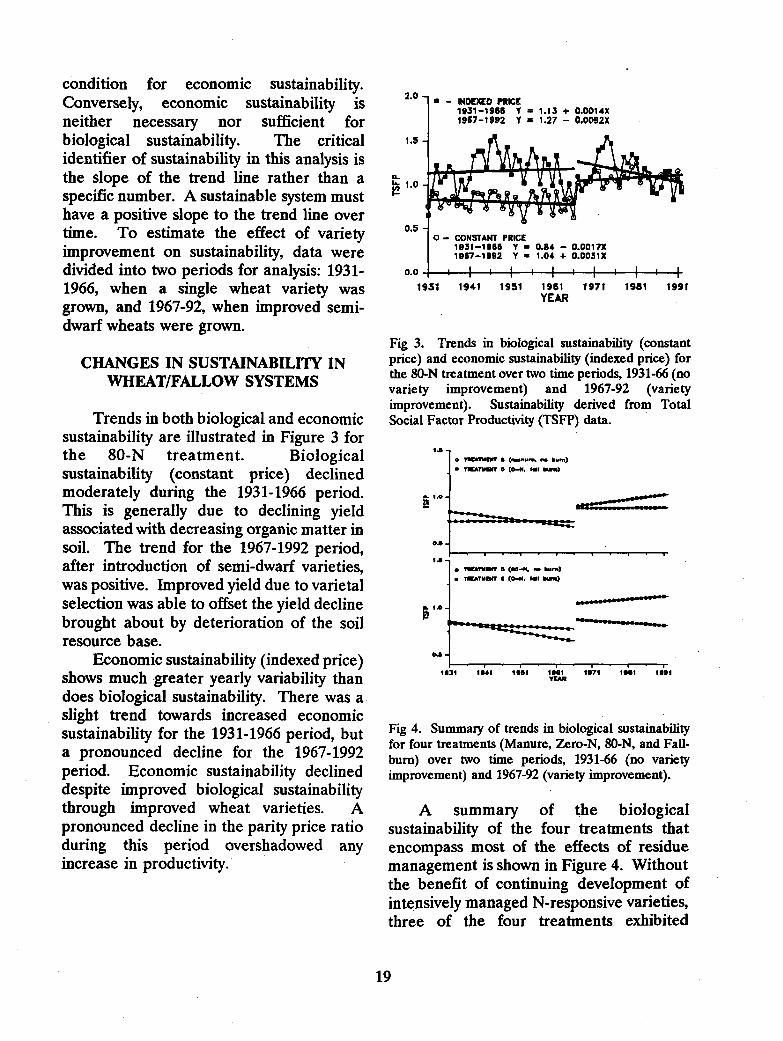
A summary of the biologicalsustainability of the four treatments thatencompass most of the effects of residuemanagement is shown in Figure 4. Withoutthe benefit of continuing development ofintensively managed N-responsive varieties,three of the four treatments exhibited
19
negative biological sustainability in the1931-1966 period. These treatments (fall-burn, zero-N, and 80-N) show declininglevels of soil organic matter from 1931 to1987. Degradation in the soil resource basewas sufficient to reduce sustainability. Thedecline was greatest in the stubble burntreatment where crop residues were burnedand no supplemental N added. Cropresidues are required to replenish theorganic matter base in semi-arid regions,and any removal of this resourceaccentuates the decline in sustainability.Removal of residues for fuel or livestockfeed should produce the same effect orgreater effect than burning. The 80-Ntreatment, which most closely approximatescurrent farm practices, had a lower rate oforganic matter decline than the zero-N orfall-burn treatments, primarily becauseresidue production was higher and lessorganic matter was lost.
Adoption of semi-dwarf varietiesimproved the biological sustainability of alltreatments, but had the greatest effect inthe 80-N treatment. With improvedtechnology, only the zero-N and fall-burntreatments continued to decline during the1967-1992 period. The manure treatmenthas the most favorable sustainability,reflecting adequate nutrient supply and noloss of the soil N resource base. The yield-augmenting effect of improved technologydoes mask some of the decline . in soilorganic matter. Because of the long-termdecline in the parity price ratio, only two ofthe treatments show economic sustainabilityprior to 1967, and none afterward.Economic sustainability increasedmoderately in the manure treatment duringthe early period, but declined in the second,reflecting the overriding impact of thefalling output/input price ratio.
We were particularly concerned about
the effects of erosion on sustainability sincethis experiment is located on nearly-levelland and has a very low rate of soil loss.Organic matter loss without erosion is dueto biological oxidation of existing organicmatter. It occurs in a wheat/fallow rotationbecause no residue is produced during thefallow year, but soil biological activitycontinues. Soil organic matter loss throughbiological oxidation is essentiallyindependent of soil erosion loss.
The biological oxidation loss of organicmatter for the zero-N treatment over 56years was equivalent to an erosion rate of6.8 tons/acre/year. Calculated average soilloss using RUSLE was less than 1ton/acre/year. Thus, if soils are eroding atthe presently acceptable T value (5tons/acre/year), the actual decline in soilquality is equivalent to an erosion rate ofnearly 12 tons/acre/year. Similarly, a 2Tloss equates to a productivity loss of 17tons/acre rather than 10.
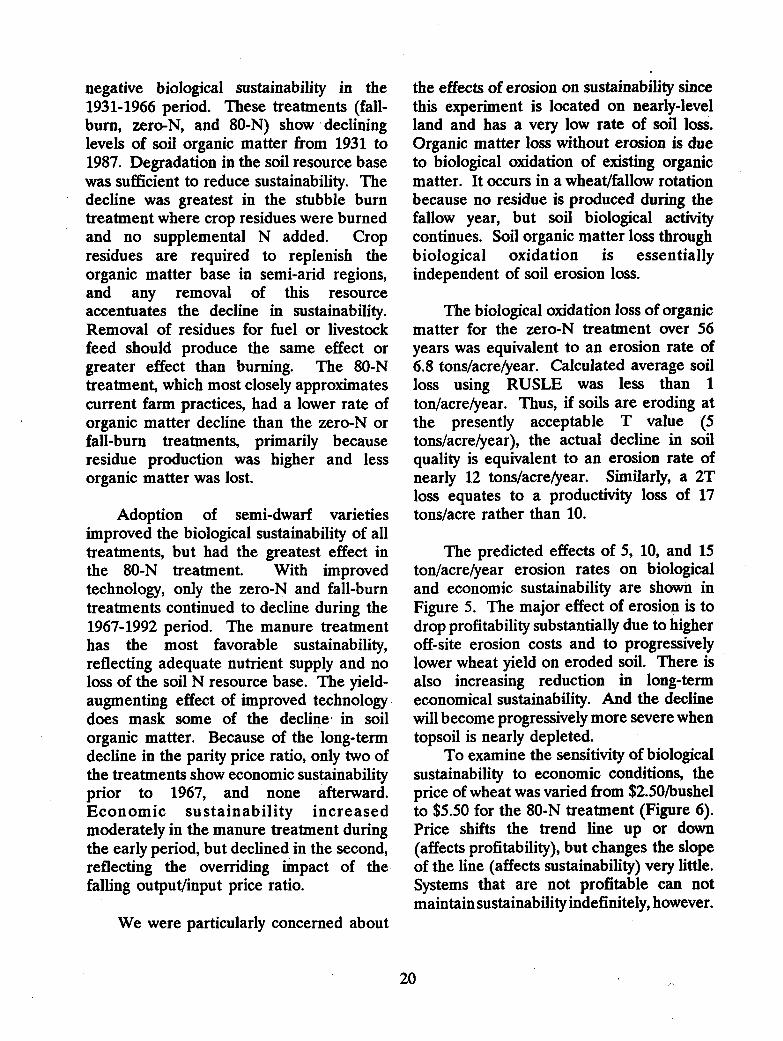
The predicted effects of 5, 10, and 15ton/acre/year erosion rates on biologicaland economic sustainability are shown inFigure 5. The major effect of erosion is todrop profitability substantially due to higheroff-site erosion costs and to progressivelylower wheat yield on eroded soil. There isalso increasing reduction in long-termeconomical sustainability. And the declinewill become progressively more severe whentopsoil is nearly depleted.
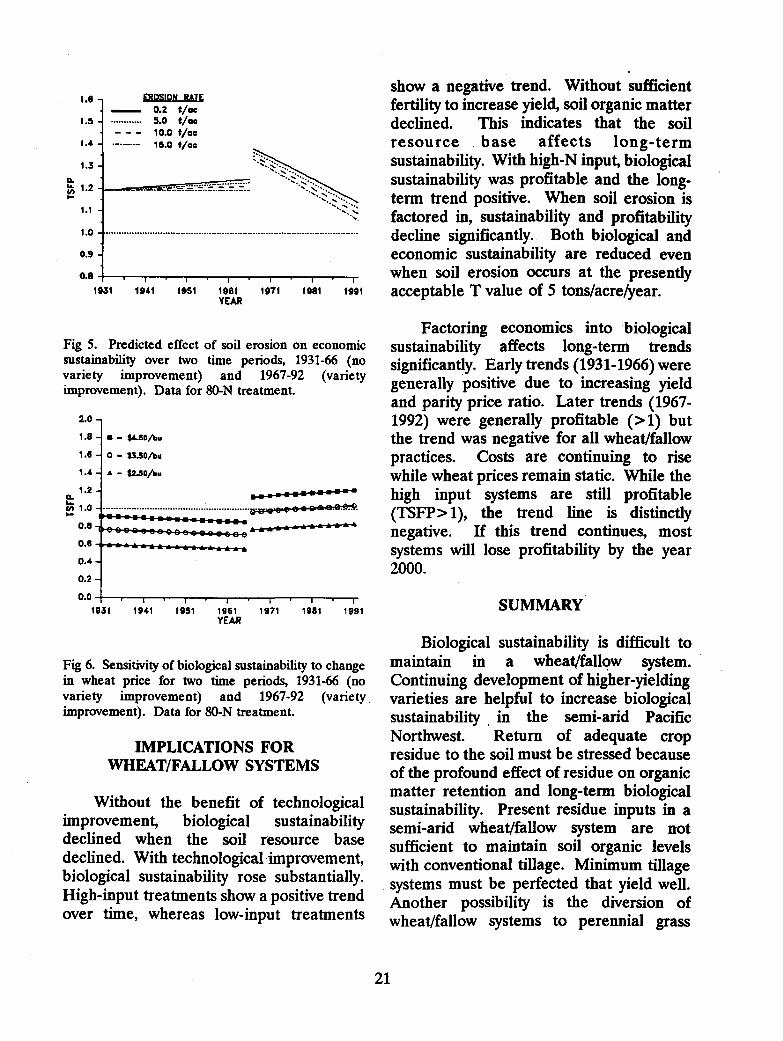
To examine the sensitivity of biologicalsustainability to economic conditions, theprice of wheat was varied from $2.50/bushelto $5.50 for the 80-N treatment (Figure 6).Price shifts the trend line up or down(affects profitability), but changes the slopeof the line (affects sustainability) very little.Systems that are not profitable can notmaintain sustainability indefinitely, however.
20
EROSION RATE0.2 t/oe 5.0 Voo- - - 10.0 t/aa
15.0 t/aa
CL
CA 1 .0
0.5
1.0
0.9 -
0.0
1031 1941 1951 1981 1071 1981 1991YEAR
Fig 5. Predicted effect of soil erosion on economicsustainability over two time periods, 1931-66 (novariety improvement) and 1967-92 (varietyimprovement). Data for 80-N treatment.
• - $4.50/bu
- $3.50/bu
• — $2.50/bu
0.6 ary-I-a-11
0.4 -
0.2 -
0.0
1931 1941 1951 1961 1971 1981 1991YEAR
Fig 6. Sensitivity of biological sustainability to changein wheat price for two time periods, 1931-66 (novariety improvement) and 1967-92 (varietyimprovement). Data for 80-N treatment.
IMPLICATIONS FORWHEAT/FALLOW SYSTEMS
Without the benefit of technologicalimprovement, biological sustainabilitydeclined when the soil resource basedeclined. With technological improvement,biological sustainability rose substantially.High-input treatments show a positive trendover time, whereas low-input treatments
show a negative trend. Without sufficientfertility to increase yield, soil organic matterdeclined. This indicates that the soilresource base affects long-termsustainability. With high-N input, biologicalsustainability was profitable and the long-term trend positive. When soil erosion isfactored in, sustainability and profitabilitydecline significantly. Both biological andeconomic sustainability are reduced evenwhen soil erosion occurs at the presentlyacceptable T value of 5 tons/acre/year.
Factoring economics into biologicalsustainability affects long-term trendssignificantly. Early trends (1931-1966) weregenerally positive due to increasing yieldand parity price ratio. Later trends (1967-1992) were generally profitable (>1) butthe trend was negative for all wheat/fallowpractices. Costs are continuing to risewhile wheat prices remain static. While thehigh input systems are still profitable(TSFP> 1), the trend line is distinctlynegative. If this trend continues, mostsystems will lose profitability by the year2000.
SUMMARY
Biological sustainability is difficult tomaintain in a wheat/fallow system.Continuing development of higher-yieldingvarieties are helpful to increase biologicalsustainability in the semi-arid PacificNorthwest. Return of adequate cropresidue to the soil must be stressed becauseof the profound effect of residue on organicmatter retention and long-term biologicalsustainability. Present residue inputs in asemi-arid wheat/fallow system are notsufficient to maintain soil organic levelswith conventional tillage. Minimum tillagesystems must be perfected that yield well.Another possibility is the diversion ofwheat/fallow systems to perennial grass
••••••-•".".-.4.111.-8
DIEPaPi"...-e.fibiazeTergt
21
periodically (perhaps for 5-10 of every 40years) to maintain the soil resource base.Strong emphasis should also be placed onadequate erosion control, since any soil lossincreases organic matter loss and decreasessustainability. Moderate erosion coupledwith oxidation loss produced neutralbiological and negative economicsustainability.
All present management practices shownegative trends in economic sustainability,mainly due to increasing production costsbut static wheat price. This suggests thatstrong efforts must be made to eitherstrengthen the price of wheat or to intensifyresearch to develop alternative crops tocereals. Crops with improved profitabilitywill be difficult to develop because growing-season precipitation is inadequate forproducing most warm-season crops.
ACKNOWLEDGEMENTS
We thank staff of the Columbia BasinAgricultural Research Center and USDAColumbia Plateau Conservation ResearchCenter for assistance, and Drs. ClintonReeder and Doug Young for reviewing thetechnical manuscript. We especially wish tothank Roger Goller for his invaluableassistance in developing the figures presentherein. This study was funded primarily bythe Rockefeller Foundation, withsupplemental funding by the USDA-Agricultural Research Service and OregonState University.
SELECTED REFERENCES
Busacca, A.J., D.K. McCool, R.I.Papendick, and D.L. Young. 1985. Dynamicimpacts of erosion processes on productivityof soils in the Palouse. In D.K. McCool(ed.) Erosion and soil productivity. ASAEPubl. 8-85. Am. Soc. Agric. Engr., St.Joseph, MI.
Duff, B., P.E. Rasmussen, and R.W.Smiley. 1993. Evaluating the sustainabilityof wheat/fallow systems in semi-arid regionsof the Pacific Northwest USW from long-term experiments. Report to theRockefeller Foundation, New York.
Lynam, J.K., and R.W. Herdt. 1989. Senseand sustainability: sustainability as anobjective in international agriculturalresearch. Agric. Econ. 3:381-398.
Rasmussen, P.E., H.P. Collins, and R.W.Smiley. 1989. Long-term managementeffects on soil productivity and crop yield insemi-arid regions of eastern Oregon.Oregon Agric. Exp. Stn. Bull. 675. OregonSt. Univ. and USDA-Agric. Res. Serv.
Steiner, R., and R.W. Herdt. 1993.Measuring sustainability at the farm level:A total social factor productivity approach.Unpublished report. The RockefellerFoundation, New York.
USDA 1931-1991. Agricultural prices.National Agric. Statistics Serv., USDA.Washington, DC.
Walker, D.J., and D.L. Young. 1986. Theeffect of technical progress on erosiondamage and economic incentives for soilconservation. Land Economics. Vol. 62. No.1.
22
TECHNIQUE FOR PROTEINSEPARATION OF SOFT WHITE
WINTER WHEAT
D.E. Wilkins, C.L. Douglas, Jr.,and D.B. Churchill
Soft white wheat grown in the PacificNorthwest is marketed to Pacific Rimcountries for making pocket breads, cakes,pastries, cookies and crackers. Wheat withprotein content below 10.5 percent isdesired for these uses because it makes thehighest quality products. Premiums havebeen paid by certain Pacific Rim countriesfor shipments of soft white wheat with lowprotein. Some of the Pacific Northwest softwhite wheat is marketed to Middle Eastcountries where high protein wheat isdesired for nutrient value. Protein contentof soft white wheat produced in the PacificNorthwest may range from 7 percent forclub wheats (Zwer et al., 1992) to 14percent for some common soft whitewheats (Zwer et al., 1991). Soil depth, fieldaspect, weather and fertility practicesinfluence grain protein content. Producerscould provide a consistent high qualityproduct and benefit from premium prices ifa technique for separating soft white wheatby protein content was available.
A gravity table was used by Wilkins etal. (1992) to separate soft white wheat intocategories of low and high density. Wilkinsand Douglas observed the gravity tablemakes seed separation according to density.Light seeds were high in protein and denseseeds were relatively low in protein. Thisresearch was undertaken to determine ifgravity tables could be used to separate softwhite wheat based on protein content.
MATERIALS AND METHODS
Seven lots of soft white wheat (6
winter, 1 spring) were obtained for testing.These wheats were selected to representdifferent agronomic zones and differentcultural practices including dryland andirrigated production. They ranged inproduction location from central Oregon tosouthern Idaho (Table 1) and representedAgronomic zones 2, 3, 5 and 6 (Douglas etal., 1990). Prior to gravity table separation,lots 1 and 2 had been processed for seedingand milling, respectively. Approximately 10and 17 percent small and broken kernelsand chaff had been removed by sieving.
Each seed lot was separated with aBoerner divider into four equal portions ofapproximately 5 lb each. One portion waskept as original material and the otherthree were designated as replicates 1, 2, and3. Lot 4 had only enough seed for tworeplications. From each replicate, about 1/3lb seed was kept non-separated and theremainder was separated with the gravitytable.
A Sutton, Steele and Steele Inc. modelV-135 laboratory gravity table with aperforated copper deck was used toseparate the seeds. Gravity tables have aperforated oscillating metal deck that slopesboth laterally and longitudinally (Harmondet al., 1968). Seed is uniformly meteredonto the deck. Air is forced through thedeck to stratify seeds into layers of differentdensities. The oscillating motion of thedeck moves seeds longitudinally andlaterally. As seeds progress longitudinallyalong the deck, dense seeds move laterallyup the incline and light seeds travel downthe deck. Seeds were separated into ninefractions as they were discharged over theedge of the two-ft-long deck. The firstfraction, starting with the low end, wherelight seeds were discharged, was 6 in wide.The next seven fractions were 2 in wide andthe last fraction was 4 in. wide.
23
Distribution of seeds discharged along theedge of the deck can be changed byadjusting deck incline angle, oscillationfrequency, air flow rate, feed rate, and deckmaterial. Initial adjustments to the gravitytable were made based on Lot 7.Adjustments were made to obtain a uniformflow of seed over the discharge edge.Settings then remained constant for allother seed lots. Feed rate wasapproximately 2 lb/min and oscillationfrequency was 550 cycles/min.
Approximately 2 oz of seed from eachseparated fraction were ground, dried at140°F and analyzed for nitrogen contentwith a LECO model CHN-600 carbon-hydrogen-nitrogen analyzer. Percentprotein was determined on oven drysamples, by multiplying percent nitrogen by5.7. All values were then adjusted to 12%moisture content. Linear least squaresregression equations for grain proteinpercent as a function of gravity tabledischarge position were determined foreach seed lot.
RESULTS AND DISCUSSION
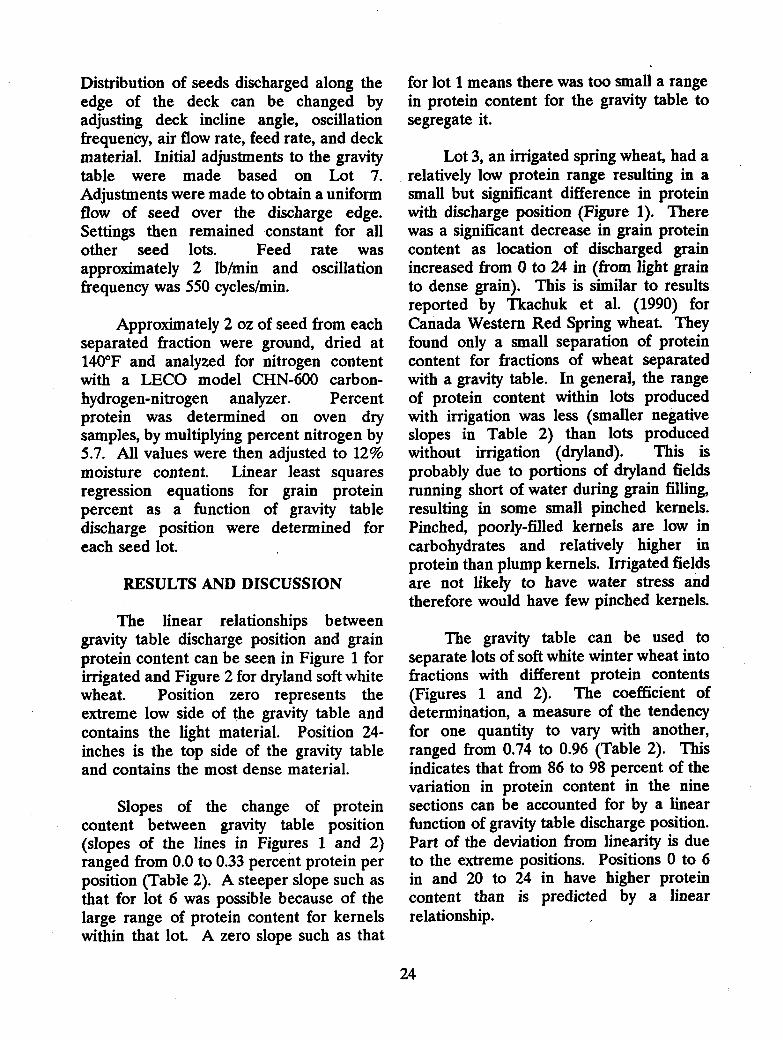
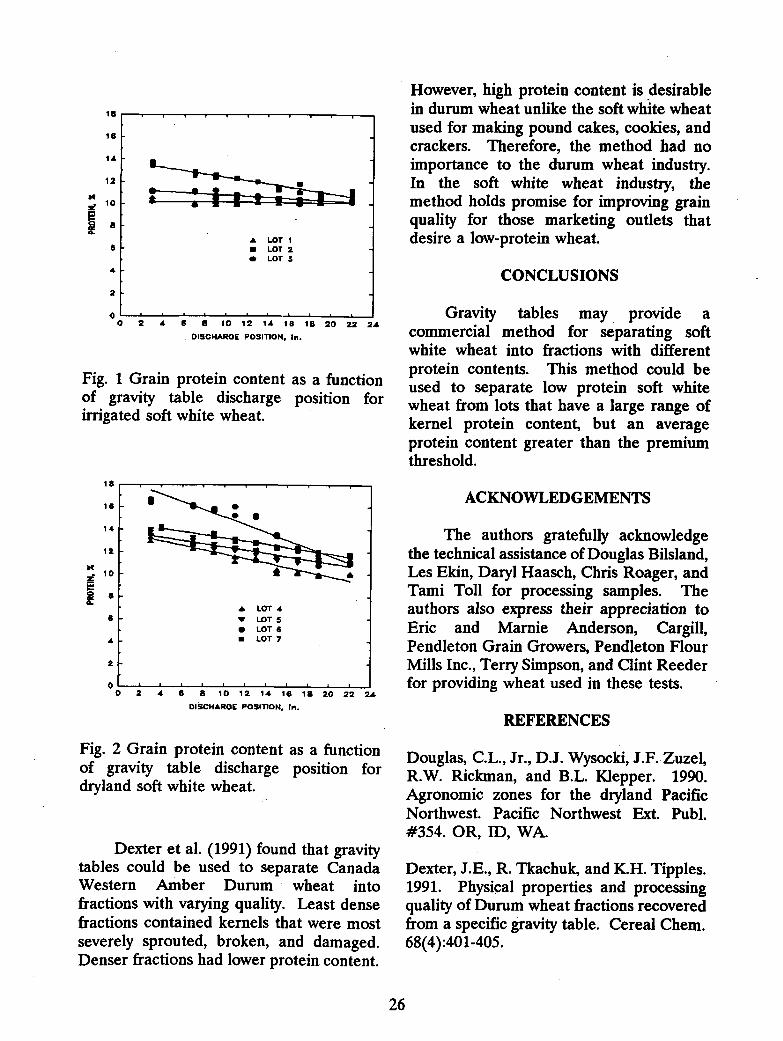
The linear relationships betweengravity table discharge position and grainprotein content can be seen in Figure 1 forirrigated and Figure 2 for dryland soft whitewheat. Position zero represents theextreme low side of the gravity table andcontains the light material. Position 24-inches is the top side of the gravity tableand contains the most dense material.
Slopes of the change of proteincontent between gravity table position(slopes of the lines in Figures 1 and 2)ranged from 0.0 to 0.33 percent protein perposition (Table 2). A steeper slope such asthat for lot 6 was possible because of thelarge range of protein content for kernelswithin that lot. A zero slope such as that
for lot 1 means there was too small a rangein protein content for the gravity table tosegregate it.
Lot 3, an irrigated spring wheat, had arelatively low protein range resulting in asmall but significant difference in proteinwith discharge position (Figure 1). Therewas a significant decrease in grain proteincontent as location of discharged grainincreased from 0 to 24 in (from light grainto dense grain). This is similar to resultsreported by Tkachuk et al. (1990) forCanada Western Red Spring wheat. Theyfound only a small separation of proteincontent for fractions of wheat separatedwith a gravity table. In general, the rangeof protein content within lots producedwith irrigation was less (smaller negativeslopes in Table 2) than lots producedwithout irrigation (dryland). This isprobably due to portions of dryland fieldsrunning short of water during grain filling,resulting in some small pinched kernels.Pinched, poorly-filled kernels are low incarbohydrates and relatively higher inprotein than plump kernels. Irrigated fieldsare not likely to have water stress andtherefore would have few pinched kernels.
The gravity table can be used toseparate lots of soft white winter wheat intofractions with different protein contents(Figures 1 and 2). The coefficient ofdetermination, a measure of the tendencyfor one quantity to vary with another,ranged from 0.74 to 0.96 (Table 2). Thisindicates that from 86 to 98 percent of thevariation in protein content in the ninesections can be accounted for by a linearfunction of gravity table discharge position.Part of the deviation from linearity is dueto the extreme positions. Positions 0 to 6in and 20 to 24 in have higher proteincontent than is predicted by a linearrelationship.
24
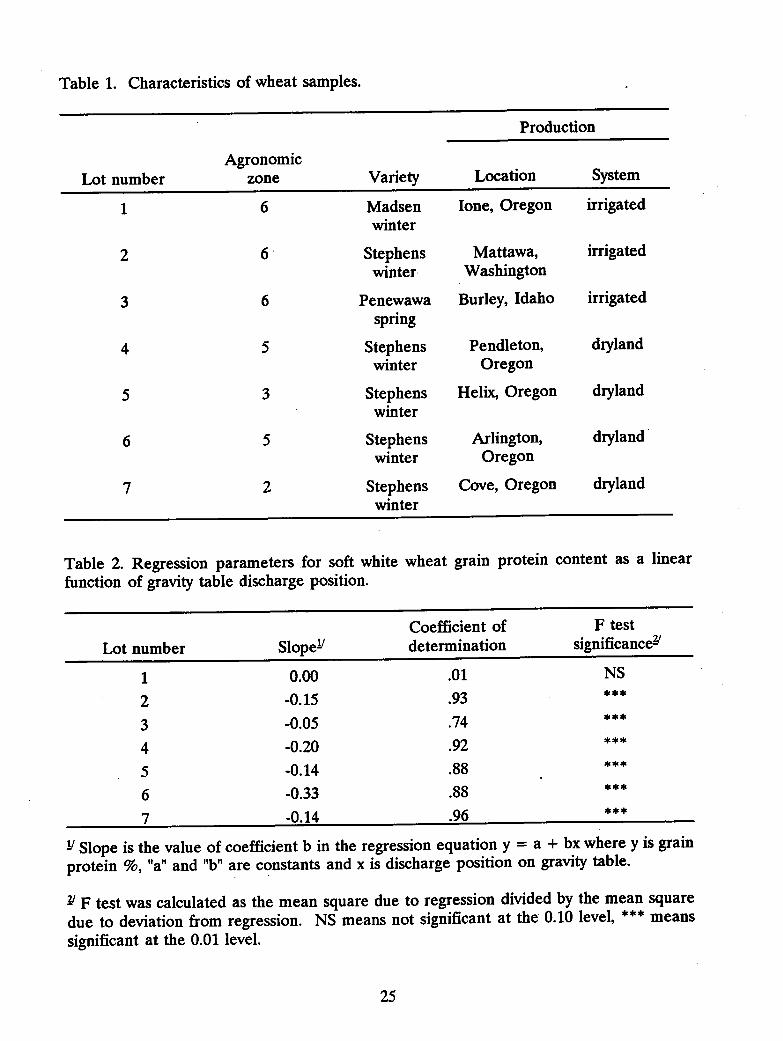
Table 1. Characteristics of wheat samples.
Lot numberAgronomic
zone Variety
Production
Location System
1 6 Madsenwinter
Ione, Oregon irrigated
2 6 Stephenswinter
Mattawa,Washington
irrigated
3 6 Penewawaspring
Burley, Idaho irrigated
4 5 Stephenswinter
Pendleton,Oregon
dryland
5 3 Stephenswinter
Helix, Oregon dryland
6 5 Stephenswinter
Arlington,Oregon
dryland
7 2 Stephenswinter
Cove, Oregon dryland
Table 2. Regression parameters for soft white wheat grain protein content as a linearfunction of gravity table discharge position.
Lot number SlopeCoefficient ofdetermination
F testsignificance
1 0.00 .01 NS
2 -0.15 .93 ***
3 -0.05 .74 ***
4 -0.20 .92 ***
5 -0.14 .88 ***
6 -0.33 .88 ***
7 -0.14 .96 * **
1/ Slope is the value of coefficient b in the regression equation y = a + bx where y is grainprotein %, "a" and "b" are constants and x is discharge position on gravity table.
F test was calculated as the mean square due to regression divided by the mean squaredue to deviation from regression. NS means not significant at the 0.10 level, *** meanssignificant at the 0.01 level.
25
24
la
16
14
12
10
8
6
4
2
00
An•
LOTLOTLOT
123
2 4 6 8 10 12 14 18 18 20 22 24
OISCI4AROE POSITION, In.
Fig. 1 Grain protein content as a functionof gravity table discharge position forirrigated soft white wheat.
DISCHARGE POSITION,
However, high protein content is desirablein durum wheat unlike the soft white wheatused for making pound cakes, cookies, andcrackers. Therefore, the method had noimportance to the durum wheat industry.In the soft white wheat industry, themethod holds promise for improving grainquality for those marketing outlets thatdesire a low-protein wheat.
CONCLUSIONS
Gravity tables may provide acommercial method for separating softwhite wheat into fractions with differentprotein contents. This method could beused to separate low protein soft whitewheat from lots that have a large range ofkernel protein content, but an averageprotein content greater than the premiumthreshold.
ACKNOWLEDGEMENTS
The authors gratefully acknowledgethe technical assistance of Douglas Bilsland,Les Ekin, Daryl Haasch, Chris Roager, andTami Toll for processing samples. Theauthors also express their appreciation toEric and Marnie Anderson, Cargill,Pendleton Grain Growers, Pendleton FlourMills Inc., Terry Simpson, and Clint Reederfor providing wheat used in these tests.
REFERENCES
Fig. 2 Grain protein content as a functionof gravity table discharge position fordryland soft white wheat.
Dexter et al. (1991) found that gravitytables could be used to separate CanadaWestern Amber Durum wheat intofractions with varying quality. Least densefractions contained kernels that were mostseverely sprouted, broken, and damaged.Denser fractions had lower protein content.
Douglas, C.L., Jr., D.J. Wysocki, J.F. Zuzel,R.W. Rickman, and B.L. Klepper. 1990.Agronomic zones for the dryland PacificNorthwest. Pacific Northwest Ext. Publ.#354. OR, ID, WA.
Dexter, J.E., R. Tkachuk, and K.H. Tipples.1991. Physical properties and processingquality of Durum wheat fractions recoveredfrom a specific gravity table. Cereal Chem.68(4):401-405.
26

Harmond, J.E., N.R. Brandenburg andL.M. Klein. 1968. Mechanical seedcleaning and handling. AgricultureHandbook 354. USDA-ARS and OregonAgric. Expt. Stn. pp. 56.
Tkachuk, R., J.E. Dexter and K.H. Tipples.1990. Wheat fractionation on a specificgravity table. J. of Cereal Sci. 11:213-223.
Wilkins, D.E., C.L. Douglas, Jr., and R.W.Smiley. 1992. Influence of tillage and seedon wheat disease. Amer. Soc. of Agric.Engr. paper # 92-1591.
Zwer, P.K., D.L. Sutherland, and K.J.Morrow. 1991. Club wheat breedingprogram. pp. 47-49. In 1991 ColumbiaBasin Agric. Res., Oregon Agric. Expt. Stn.Special Report 879.
Zwer, P.K., D.L. Sutherland, and S.D.Dunnagan. 1992. Club wheat breedingprogram. pp. 67-75. In 1992 ColumbiaBasin Agric. Res., Oregon Agric. Expt. Stn.Special Report 894.
27
PHYSIOLOGIC LEAF SPOT OF WHEAT
Richard Smiley
A disease called physiologic leaf spot(sometimes called "no-name" disease)occurs on wheat in the inland PacificNorthwest. This disease is similar inappearance to tan spot and Septoria leafblotch. However, tan spot apparently doesnot occur in Oregon, Washington, andnorthern Idaho, and Septoria leaf blotchoccurs but causes little damage to drylandwheat in the drier production areas.Septoria leaf blotch is often severe inwestern Oregon and Washington, and maydamage irrigated wheat in the ColumbiaBasin.
Physiologic leaf spot was particularlysevere in some fields during 1990, when asmuch as 60 percent of the flag leaf area onaffected plants was killed, and lower leaveson these plants died prematurely. In 1989and 1990 as many as 10,000 acres of wheatwere treated with fungicides becausephysiologic leaf spot was mistakenlyidentified as either tan spot or Septoria leafblotch.
Essentially nothing is known about theeffect of physiologic leaf spot on eithergrain yield or quality, nor is there muchinformation on the interaction of cropmanagement practices and the severity ofthe symptoms.
Objectives of this investigation were todescribe symptoms of physiologic leaf spotand determine if: 1) a microorganismcauses the disease, 2) fungicides reducedisease severity or increase grain yield, 3)wheat varieties differ in susceptibility, 4)tillage and fertilizer systems affect diseaseseverity, and 5) yields are affected.
METHODS AND RESULTS
Nearly 30 experiments on physiologicleaf spot were conducted in northcentraland northeastern Oregon, and southcentralWashington from 1989 to 1992. Mostexperiments were winter wheat/summerfallow rotations on Walla Walla, Ritzville,or Palouse silt loams. Primary tillage waswith either a moldboard or chisel plow.
Symptoms: Leaf spot symptomsincluded lesions that varied in color, size,and shape. Initial symptoms were small (1-3 mm diameter; 25 mm = 1 inch), oval,dark-brown spots or small necrotic (dead)lesions. These spots or lesions sometimesexpanded into spots with light-tan centersand/or narrow (<2 mm wide) yellow(chlorotic) halos. As leaf spots enlarged upto 5 x 10 mm they either remained oval orbecame irregularly shaped, with a light- ordark-brown center, and often with anarrow, chlorotic halo. Fungal fruitingstructures such as pycnidia or perithecia, orbacterial exudates, were not present.
Leaf spot typically became evident onthe oldest leaves of susceptible varietiesduring mid-spring (March). On somecultivars, in some fields, and during somegrowing seasons the leaf spot did notadvance from older into younger leaves. Ifleaf spot moved into the upper plantcanopy the field appeared to be droughtstressed. Affected areas of the fieldbecame dull and had a brownish tint. Thisoccurred during early to mid-spring, whensoils were not dry.
Search for the Cause: Samples ofaffected leaves were collected from severalhundred experimental plots and commercialfields in Oregon and Washington during1990, 1991, and 1992. Isolations of fungiand bacteria were attempted from several
28

thousand leaf spots and many commonfungi and bacteria were isolated. However,Septoria (leaf blotch), Pyrenophora (tanspot), Pseudomonas (leaf blight), andXanthomonas (black chaff), or othernotable wheat pathogens were not detected.Electron microscopy was used to determineif a mycoplasma or virus was present.Biochemical analysis was used to determinewhether bacteria or fungi had been presentin affected tissue even though they couldnot be detected by standard laboratoryprocedures. There was no indication thatany of these microbial agents wereassociated with physiologic leaf spot.
Attempts to Transmit the Disease:Fungi and bacteria from leaf spots wereinoculated into susceptible cultivars ofwheat in a controlled-environment chamber,a greenhouse, and a field. Inoculationprocedures included spraying, injecting, orrubbing spore and mycelial suspensionsonto symptomless wheat leaves. Plantswere subjected to various stress or non-stress conditions (drought, frost, dew, etc.)before or after inoculations. We were notable to cause this disease to occur onhealthy plants.
Fungicides: Fungi from leaf spots wereevaluated in the laboratory. Most were verysensitive to Prochloraz, Rubigan, and Tilt,and less sensitive to Benlate and Bravo.Replicated fungicide tests were conductedon commercial fields of Stephens wheatnear Pendleton and Helix during 1990 and1991. Fungicides included Benlate, Bravo,Dithane M-45, Tilt and TopCop (afungicide/bactericide). Only one applicationwas made, when the flag leaf was emerging.Leaf spot was not present on the uppermostthree leaves when plants were treated. Leafspot severity (percent necrotic area on eachleaf of 100 mainstems/plot) ratings weremade after head emergence. Grain yields
were measured with a plot combine.
Leaf spot on flag leaves during 1990ranged from 10 to 60 percent necrosis atPendleton and 0 to 40 percent necrosis atHelix. During 1991 the range of damagewas 0 to 25 percent necrosis. Fungicidesdid not reduce leaf spot or increase grainyields.
Two to five fungicide applications, fromDecember to May, were made on additionalreplicated plots of Stephens wheat nearHelix during 1991 and 1992. During 1991,leaf spot on the second leaf below the flag(F-2) was reduced by multiple applicationsof Benlate, Dithane, Tilt, and TopCop. Nopesticide reduced disease incidence on thethird leaf below the flag (F-3). Benomylwas the only fungicide that improved yield,but this was not correlated with a reductionin leaf spot severity. No fungicide reducedleaf spot or increased grain yield during1992 (Table 1).
Foliar Nutrients: Nutrients wereapplied to replicated plots of Stephenswheat near Helix during 1991 and 1992.Application rates and times are listed inTable 2. Treatments included Foliar 158(mostly urea + calcium chloride; 15 percentN, 8 percent Ca, 14 percent Cl; HillBrothers Chemical Co.) or urea plus Micro-Mix Foli-Gro (micronutrients; with 0.5percent magnesium, 1.0 percent manganese,1.5 percent zinc, 1.0 percent iron, 0.25percent copper, 0.025 percent boron, and0.0025 percent molybdenum; Wilbur-Ellis),each with or without Benlate or Tilt as atank mix. Leaf spot was never present onthe upper three leaves when applicationswere made (including May). Leaf spotratings (0-10 scale; 10 = severe) were madeafter head emergence in June. Grain yieldswere measured with a plot combine duringJuly.
29
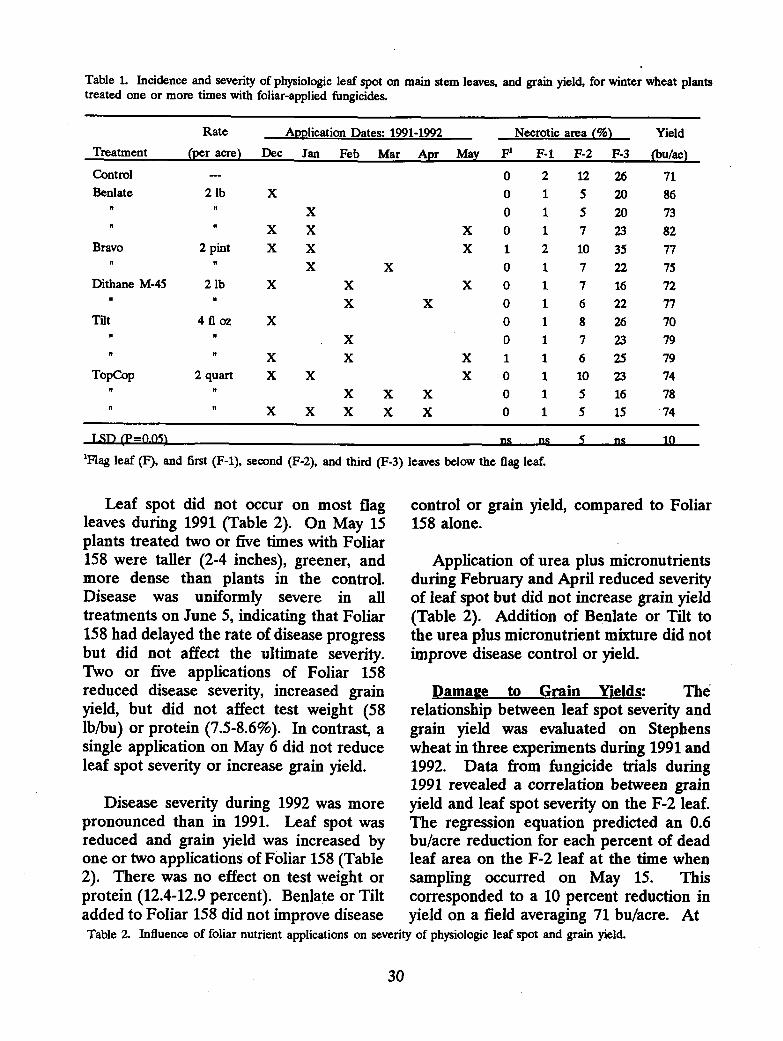
Table 1. Incidence and severity of physiologic leaf spot on main stem leaves, and grain yield, for winter wheat plantstreated one or more times with foliar-applied fungicides.
Treatment
Rate
(per acre)
Application Dates: 1991-1992 Necrotic area (%) Yield
(bu/ac)Dec Jan Feb Mar Apr May F' F-1 F-2 F-3
Control 0 2 12 26 71Benlate 21b X 0 1 5 20 86
" X 0 1 5 20 73" II X X X 0 1 7 23 82
Bravo 2 pint X X X 1 2 10 35 77" " X X 0 1 7 22 75
Dithane M-45 2 lb X X X 0 1 7 16 72" " X X 0 1 6 22 77
Tilt 4 fl oz X 0 1 8 26 70" " X 0 1 7 23 79
" " X X X 1 1 6 25 79TopCop 2 quart X X X 0 1 10 23 74
" " X X X 0 1 5 16 78
" . X X X X X 0 1 5 15 74
Tsn (P=0.05) ns ns 5 ns 10
'Flag leaf (F), and first (F-1), second (F-2), and third (F-3) leaves below the flag leaf.
Leaf spot did not occur on most flagleaves during 1991 (Table 2). On May 15plants treated two or five times with Foliar158 were taller (2-4 inches), greener, andmore dense than plants in the control.Disease was uniformly severe in alltreatments on June 5, indicating that Foliar158 had delayed the rate of disease progressbut did not affect the ultimate severity.Two or five applications of Foliar 158reduced disease severity, increased grainyield, but did not affect test weight (58lb/bu) or protein (7.5-8.6%). In contrast, asingle application on May 6 did not reduceleaf spot severity or increase grain yield.
Disease severity during 1992 was morepronounced than in 1991. Leaf spot wasreduced and grain yield was increased byone or two applications of Foliar 158 (Table2). There was no effect on test weight orprotein (12.4-12.9 percent). Benlate or Tiltadded to Foliar 158 did not improve diseaseTable 2. Influence of foliar nutrient applications on seve
control or grain yield, compared to Foliar158 alone.
Application of urea plus micronutrientsduring February and April reduced severityof leaf spot but did not increase grain yield(Table 2). Addition of Benlate or Tilt tothe urea plus micronutrient mixture did notimprove disease control or yield.
Damage to Grain Yields: Therelationship between leaf spot severity andgrain yield was evaluated on Stephenswheat in three experiments during 1991 and1992. Data from fungicide trials during1991 revealed a correlation between grainyield and leaf spot severity on the F-2 leaf.The regression equation predicted an 0.6bu/acre reduction for each percent of deadleaf area on the F-2 leaf at the time whensampling occurred on May 15. Thiscorresponded to a 10 percent reduction inyield on a field averaging 71 bu/acre. At
rity of physiologic leaf spot and grain yield.
30

Table 2. Influence of foliar nutrient applications on severity of physiologic leaf spot and grain yield.
Treatment'
Application Dates Necrotic area (%) 2 Yield
(]b/ac)Dec Feb Mar Apr May F3 F-1 F-2 F-3
1991
0 2 12 26 71control
F158 X X X X 0 1 4 9 81
F158 X X 1 0 3 8 81
F158 X 1 2 10 24 76
LSD (P=0.05) ns 1 6 13
1992
10 19 S4 S 79control
F158 X X 3 9 S S 87
F158 3 10 S S 87
F158 + Benlate X x' 4 11 S S 87
F158 + Tilt X X5 3 9 S S 87
UFG X X 8 16 S S 80
UFG X X 7 14 S S 82
UFG + Benlate X 10 21 S S 80
UFG + Benlate X 6 15 S S 80
UFG + Tilt X 7 16 S S 82
LSD (P=0.05) 2 5 5
'F158 = Foliar 158 (Hill Brothers Chemical Co.) at 5 gal/ac (8.0, 4.4, and 7.6 lb/ac for nitrogen, calcium, and chloride,respectively); UFG = urea (8 lb N/ac) plus Micro-Mix Foli-Gro (Wilbur-Ellis) at 3 pt/ac (0.5% magnesium, 1.0%manganese, 1.5% zinc, 1.0% iron, 0.25% copper, 0.025% boron, and 0.0025% molybdenum); Benlate (DuPont) at 2 lb/ac;and Tilt (Ciba-Geigy) at 4 fl oz/ac.
2Leaf spot severity ratings were on May 15, 1991 and June 2, 1992.
3Flag leaf (F), and first (F-1), second (F-2), and third (F-3) leaves below the flag leaf.
= Many or most leaves had died prematurely.
3Fungicide was applied during the first application of nutrients but not during the second application.
the time of evaluation on May 15 leaf spotwas mostly absent on the flag leaf (F), lessthan 2 percent on the next lower leaf (F-1),and intermediate (5-12 percent) on the F-2leaf. The F-3 leaf was severely affected(15-35 percent necrosis) and becomingchlorotic, and the F-4 leaf was fullychlorotic and often dead. Yield losspredictions were most precise when basedon damage to a leaf with an intermediatelevel of damage.
Disease was more severe in 1992 than in
1991. Regressions predicted yield losses of0.8 and 0.5 bu/acre for each percent ofdead leaf area on F and F-1 leaves,respectively. Necrotic leaf area in thecontrol treatment was 10 and 19 percent forthe F and F-1 leaves, respectively, on 2June. The grain yield was 79 bu/acre.Yield losses of 10 and 11 percent werepredicted, which was similar to lossespredicted during 1991. Regression analysisin the foliar nutrient experiment during1992 also indicated that this leaf spotsuppressed yields by about 10 percent.
31
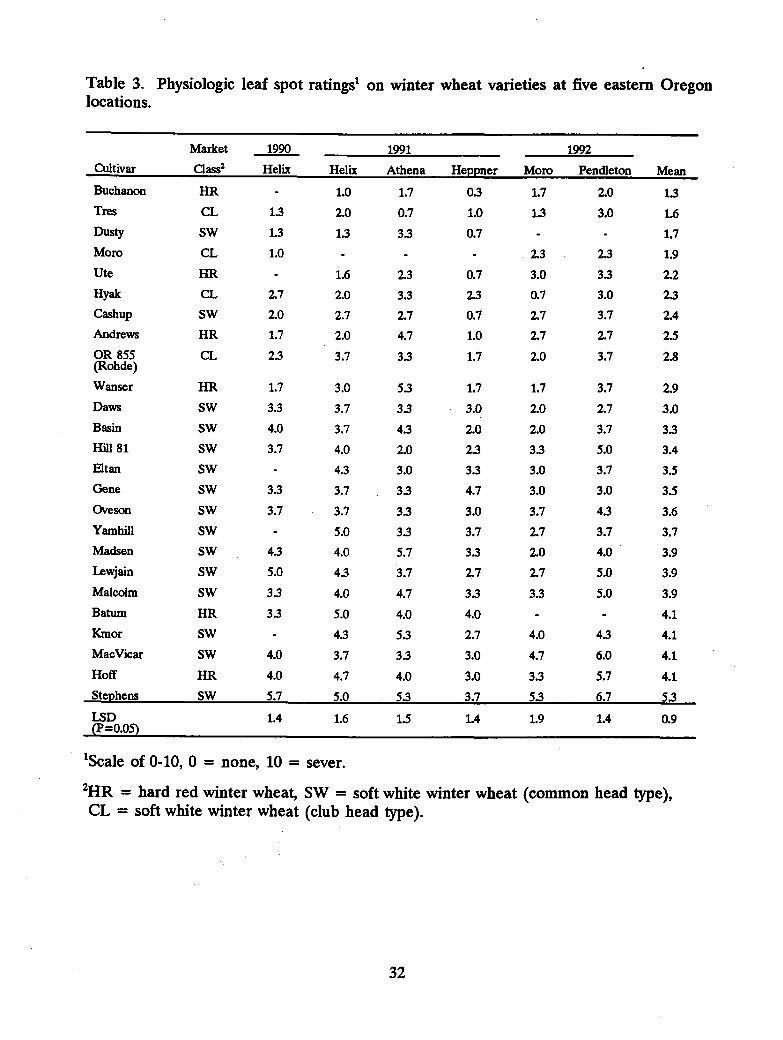
Table 3. Physiologic leaf spot ratings' on winter wheat varieties at five eastern Oregonlocations.
Cultivar
Market
Class'
1990 1991 1992
MeanHelix Helix Athena Heppner Mom Pendleton
Buchanon HR 1.0 1.7 0.3 1.7 2.0 1.3
Tres CL 1.3 2.0 0.7 1.0 1.3 3.0 1.6
Dusty SW 1.3 13 3.3 0.7 1.7
Mom CL 1.0 2.3 2.3 1.9
Ute HR 1.6 2.3 0.7 3.0 3.3 2.2
Hyak CL 2.7 2.0 3.3 2.3 0.7 3.0 2.3
Cashup SW 2.0 2.7 2.7 0.7 2.7 3.7 2.4
Andrews HR 1.7 2.0 4.7 1.0 2.7 2.7 2.5
OR 855 CL 2.3 3.7 3.3 1.7 2.0 3.7 2.8(Rohde)
Wanser HR 1.7 3.0 53 1.7 1.7 3.7 2.9
Daws SW 33 3.7 3.3 3.0 2.0 2.7 3.0
Basin SW 4.0 3.7 4.3 2.0 2.0 3.7 3.3
Hill 81 SW 3.7 4.0 2.0 2.3 3.3 5.0 3.4
Eltan SW 43 3.0 3.3 3.0 3.7 3.5
Gene SW 3.3 3.7 33 4.7 3.0 3.0 3.5
Oveson SW 3.7 3.7 3.3 3.0 3.7 4.3 3.6
Yamhill SW 5.0 3.3 3.7 2.7 3.7 3.7
Madsen SW 43 4.0 5.7 3.3 2.0 4.0 3.9
Lewjain SW 5.0 4.3 3.7 2.7 2.7 5.0 3.9
Malcolm SW 3.3 4.0 4.7 33 3.3 5.0 3.9
Batum HR 33 5.0 4.0 4.0 4.1
Kmor SW 43 53 2.7 4.0 4.3 4.1
MacVicar SW 4.0 3.7 33 3.0 4.7 6.0 4.1
Hoff HR 4.0 4.7 4.0 3.0 33 5.7 4.1
Stephens SW 5.7 5.0 53 3.7 5.3 6.7 53
LSD 1.4 1.6 1.5 1.4 1.9 1.4 0.9(P=0.05)
'Scale of 0-10, 0 = none, 10 = sever.
2HR = hard red winter wheat, SW = soft white winter wheat (common head type),CL = soft white winter wheat (club head type).
32
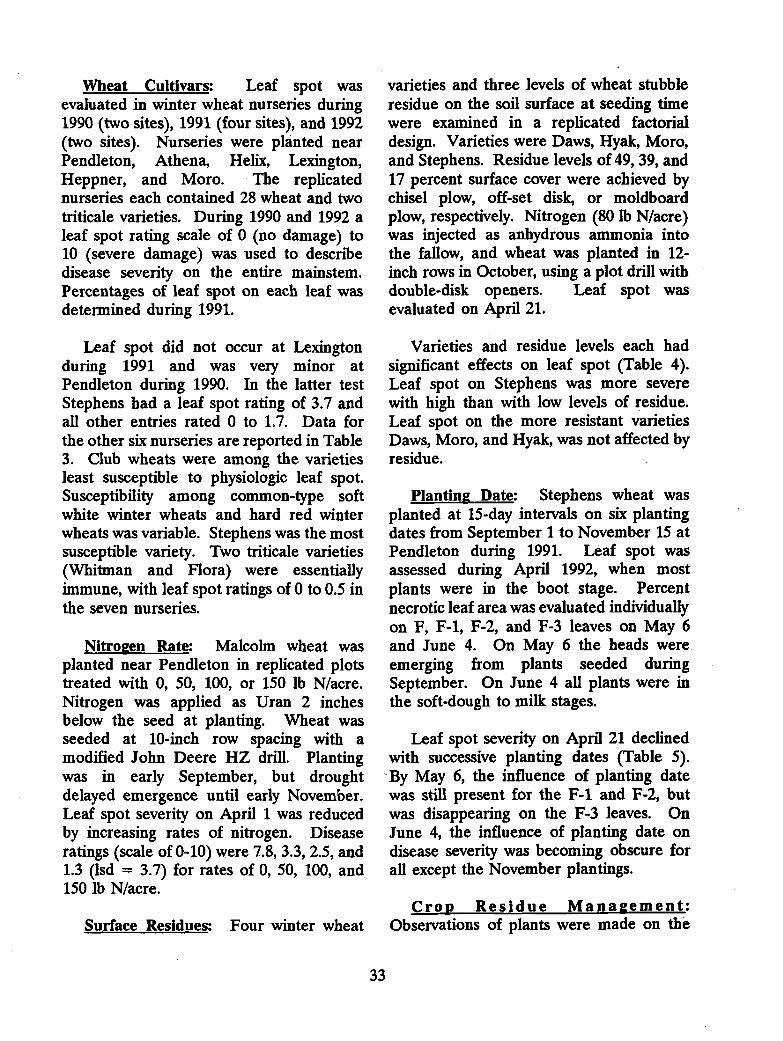
Wheat Cultivars: Leaf spot wasevaluated in winter wheat nurseries during1990 (two sites), 1991 (four sites), and 1992(two sites). Nurseries were planted nearPendleton, Athena, Helix, Lexington,Heppner, and Moro. The replicatednurseries each contained 28 wheat and twotriticale varieties. During 1990 and 1992 aleaf spot rating scale of 0 (no damage) to10 (severe damage) was used to describedisease severity on the entire mainstem.Percentages of leaf spot on each leaf wasdetermined during 1991.
Leaf spot did not occur at Lexingtonduring 1991 and was very minor atPendleton during 1990. In the latter testStephens had a leaf spot rating of 3.7 andall other entries rated 0 to 1.7. Data forthe other six nurseries are reported in Table3. Club wheats were among the varietiesleast susceptible to physiologic leaf spot.Susceptibility among common-type softwhite winter wheats and hard red winterwheats was variable. Stephens was the mostsusceptible variety. Two triticale varieties(Whitman and Flora) were essentiallyimmune, with leaf spot ratings of 0 to 0.5 inthe seven nurseries.
Nitrogen Rate: Malcolm wheat wasplanted near Pendleton in replicated plotstreated with 0, 50, 100, or 150 lb N/acre.Nitrogen was applied as Uran 2 inchesbelow the seed at planting. Wheat wasseeded at 10-inch row spacing with amodified John Deere HZ drill. Plantingwas in early September, but droughtdelayed emergence until early November.Leaf spot severity on April 1 was reducedby increasing rates of nitrogen. Diseaseratings (scale of 0-10) were 7.8, 3.3, 2.5, and1.3 (lsd = 3.7) for rates of 0, 50, 100, and150 lb N/acre.
Surface Residues: Four winter wheat
varieties and three levels of wheat stubbleresidue on the soil surface at seeding timewere examined in a replicated factorialdesign. Varieties were Daws, Hyak, Moro,and Stephens. Residue levels of 49, 39, and17 percent surface cover were achieved bychisel plow, off-set disk, or moldboardplow, respectively. Nitrogen (80 lb N/acre)was injected as anhydrous ammonia intothe fallow, and wheat was planted in 12-inch rows in October, using a plot drill withdouble-disk openers. Leaf spot wasevaluated on April 21.
Varieties and residue levels each hadsignificant effects on leaf spot (Table 4).Leaf spot on Stephens was more severewith high than with low levels of residue.Leaf spot on the more resistant varietiesDaws, Moro, and Hyak, was not affected byresidue.
Planting Date: Stephens wheat wasplanted at 15-day intervals on six plantingdates from September 1 to November 15 atPendleton during 1991. Leaf spot wasassessed during April 1992, when mostplants were in the boot stage. Percentnecrotic leaf area was evaluated individuallyon F, F-1, F-2, and F-3 leaves on May 6and June 4. On May 6 the heads wereemerging from plants seeded duringSeptember. On June 4 all plants were inthe soft-dough to milk stages.
Leaf spot severity on April 21 declinedwith successive planting dates (Table 5).By May 6, the influence of planting datewas still present for the F-1 and F-2, butwas disappearing on the F-3 leaves. OnJune 4, the influence of planting date ondisease severity was becoming obscure forall except the November plantings.
Cro p Residue Management:Observations of plants were made on the
33
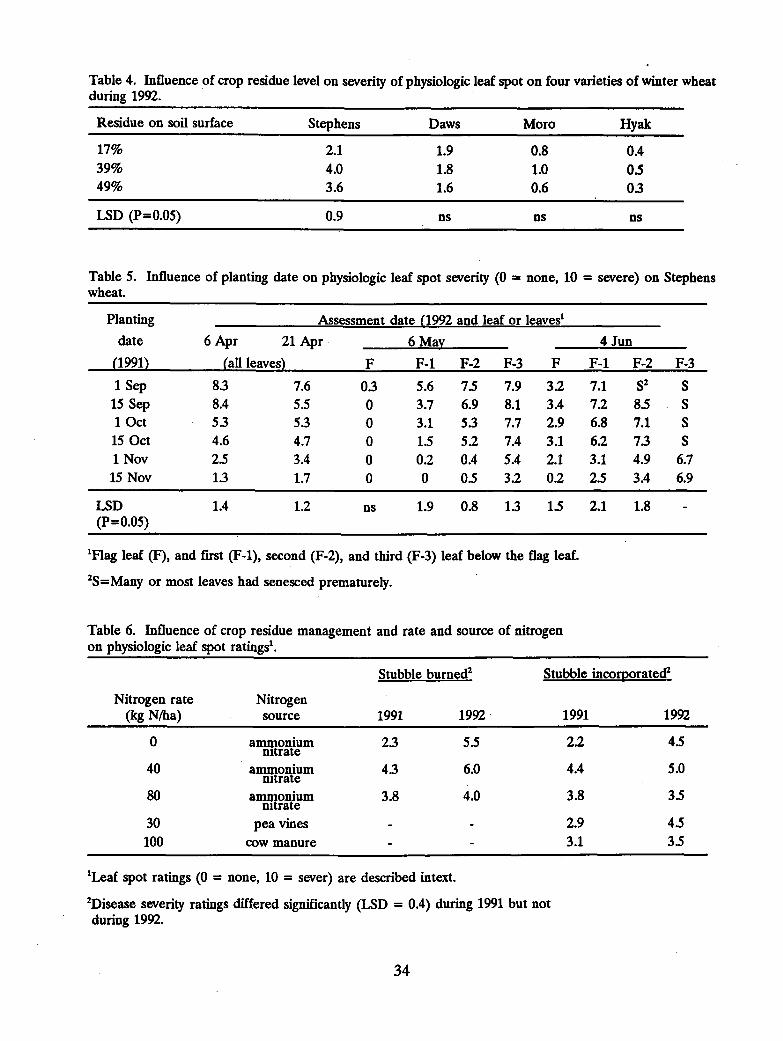
Table 4. Influence of crop residue level on severity of physiologic leaf spot on four varieties of winter wheatduring 1992.
Residue on soil surface Stephens Daws Moro Hyak
17% 2.1 1.9 0.8 0.439% 4.0 1.8 1.0 0.549% 3.6 1.6 0.6 03
LSD (P=0.05) 0.9 ns ns ns
Table 5. Influence of planting date on physiologic leaf spot severity (0 = none, 10 = severe) on Stephenswheat.
Planting
date
(1991)
Assessment date (1992 and leaf or leaves'
6 Apr 21 Apr
(all leaves)
6 May 4 Jun
F F-1 F-2 F-3 F F-1 F-2 F-3
1 Sep 8.3 7.6 0.3 5.6 7.5 7.9 3.2 7.1 S2 S15 Sep 8.4 5.5 0 3.7 6.9 8.1 3.4 7.2 83 S1 Oct 53 5.3 0 3.1 53 7.7 2.9 6.8 7.1 S15 Oct 4.6 4.7 0 1.5 5.2 7.4 3.1 6.2 73 S1 Nov 23 3.4 0 02 0.4 5.4 2.1 3.1 4.9 6.715 Nov 13 1.7 0 0 0.5 3.2 0.2 2.5 3.4 6.9
LSD 1.4 1.2 ns 1.9 0.8 13 1.5 2.1 1.8(P=0.05)
'Flag leaf (F), and first (F-1), second (F-2), and third (F-3) leaf below the flag leaf.
2S=Many or most leaves had senesced prematurely.
Table 6. Influence of crop residue management and rate and source of nitrogenon physiologic leaf spot ratings'.
Stubble burned' Stubble incorporated'
Nitrogen rate Nitrogen(kg N/ha) source 1991 1992 1991 1992
0 ammonium 23 5.5 2.2 4.5nitrate
40 ammonium 43 6.0 4.4 5.0nitrate
80 ammonium 3.8 4.0 3.8 3.5nitrate
30 pea vines 2.9 43100 cow manure 3.1 33
'Leaf spot ratings (0 = none, 10 = sever) are described intext.
'Disease severity ratings differed significantly (LSD = 0.4) during 1991 but notduring 1992.
34
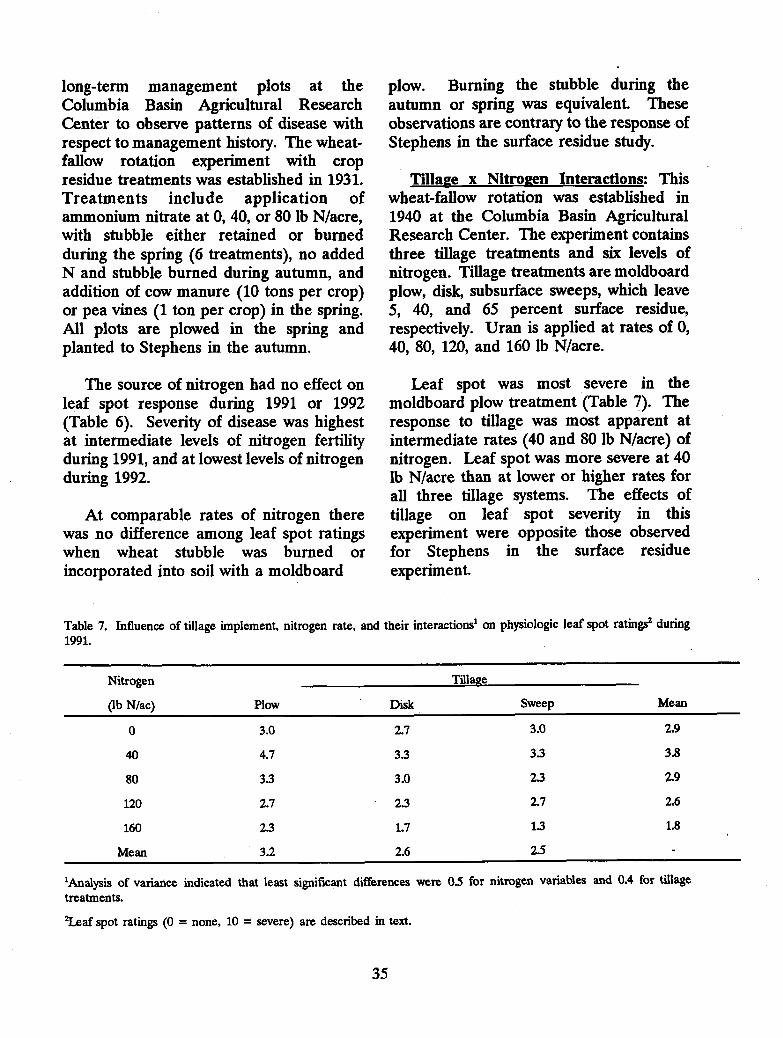
long-term management plots at theColumbia Basin Agricultural ResearchCenter to observe patterns of disease withrespect to management history. The wheat-fallow rotation experiment with cropresidue treatments was established in 1931.Treatments include application ofammonium nitrate at 0, 40, or 80 lb N/acre,with stubble either retained or burnedduring the spring (6 treatments), no addedN and stubble burned during autumn, andaddition of cow manure (10 tons per crop)or pea vines (1 ton per crop) in the spring.All plots are plowed in the spring andplanted to Stephens in the autumn.
The source of nitrogen had no effect onleaf spot response during 1991 or 1992(Table 6). Severity of disease was highestat intermediate levels of nitrogen fertilityduring 1991, and at lowest levels of nitrogenduring 1992.
At comparable rates of nitrogen therewas no difference among leaf spot ratingswhen wheat stubble was burned orincorporated into soil with a moldboard
plow. Burning the stubble during theautumn or spring was equivalent. Theseobservations are contrary to the response ofStephens in the surface residue study.
Tillage x Nitrogen Interactions: Thiswheat-fallow rotation was established in1940 at the Columbia Basin AgriculturalResearch Center. The experiment containsthree tillage treatments and six levels ofnitrogen. Tillage treatments are moldboardplow, disk, subsurface sweeps, which leave5, 40, and 65 percent surface residue,respectively. Uran is applied at rates of 0,40, 80, 120, and 160 lb N/acre.
Leaf spot was most severe in themoldboard plow treatment (Table 7). Theresponse to tillage was most apparent atintermediate rates (40 and 80 lb N/acre) ofnitrogen. Leaf spot was more severe at 40lb N/acre than at lower or higher rates forall three tillage systems. The effects oftillage on leaf spot severity in thisexperiment were opposite those observedfor Stephens in the surface residueexperiment.
Table 7. Influence of tillage implement, nitrogen rate, and their interactions' on physiologic leaf spot ratings' during1991.
Nitrogen
(lb N/ac)
Tillage
Plow Disk Sweep Mean
0 3.0 2.7 3.0 2.9
40 4.7 33 3.3 3.8
80 3.3 3.0 23 2.9
120 2.7 23 2.7 2.6
160 2.3 1.7 13 1.8
Mean 3.2 2.6 2.5
'Analysis of variance indicated that least significant differences were 03 for nitrogen variables and 0.4 for tillagetreatments.
'Leaf spot ratings (0 = none, 10 = severe) are described in text.
35
Annual Winter Wheat and Wheat/PeaRotation: The annual wheat experimentbegan in 1931 at the Columbia BasinAgricultural Research Center. Ammoniumnitrate and ammonium phosphate sulfate(80 lb N/acre) are broadcast before the plotis plowed and planted to Stephens.
Winter wheat/pea rotations under fourtillage systems were initiated in 1963. Eachyear four replicates of each tillagetreatment are planted to dry seed peas andfour to Stephens wheat. The treatmentsare: 1) rototill in autumn before plantingspring peas and Noble sweep and chiselplow in autumn before planting wheat, 2)moldboard plow in autumn before peas andNoble sweep before wheat, 3) moldboardplow in spring before peas and Noble sweepand moldboard plow in autumn beforewheat, and 4) conduct no tillage beforeplanting peas and Noble sweep beforeplanting wheat.
Leaf spot severity did not differ amongtillage treatments in the wheat/pea rotation.Disease severity ratings on April 3, 1992were 0.5 for all treatments. Ratings in theannual winter wheat averaged 7.1. Ratingsof 3.5 were present in a comparabletreatment (80 lb N/acre) of the nearbywheat/fallow rotation. Later in the growingseason the ratings became more uniform;leaf spot ratings on June 5 were 4.6, 7.3,and 5.1 in the wheat/pea, annual wheat, andwheat/fallow plots, respectively.
DISCUSSION
There was no evidence that a microbialagent caused physiologic leaf spot. Thecause of the disease remains unknown, andthe reason for the increase in severityduring recent years also remains unknown.This trend does not appear to be related tochanges in dominance of wheat varieties,
tillage procedures, crop rotations, orfertilizer application rates or procedures. Itis unlikely that the prolonged drought isdirectly responsible for the increase in leafspot because this disease also occurs onirrigated wheat. If the cause is of geneticorigin (e.g., a physiologic dysfunction) theremust be a strong environmental effectgoverning expression of symptoms.
This research provided the first evidencethat physiologic leaf spot can reduce grainyield by 10 percent and is not controlled byfungicides. Moreover, this is the firstreport of crop management procedures forreducing damage to winter wheat byphysiologic leaf spot. Leaf spot incidenceand severity were reduced by varietyselection, delaying the planting date,increasing the rate of nitrogen fertilizer,applying a Foliar 158 to foliage, andreducing the frequency of wheat in the cropsequence. These control measures arelikely to result in a yield response duringyears when this disease becomes severe.
Management practices that had noapparent affect on leaf spot severityincluded different application timings orsources of nitrogen, or burning the stubbleof previous wheat crops. Tillage practicesthat left different amounts of straw residueon or near the soil surface providedinconclusive results.
Winter wheat varieties varied insusceptibility to physiologic leaf spot andwere relatively consistent in response overseasons and locations. Heritability studiesare needed to determine if higher levels ofresistance to physiologic leaf spot can beselected. This has apparently beenaccomplished in Canada.
Physiologic leaf spot is difficult todistinguish from tan spot or Septoria leaf
36
blotch. It is therefore important to identifycrop management practices that minimizethe risk of making an error in diseaseidentification. All three diseases areminimized by crop rotation, resistantvarieties, and delayed seeding. Tan spotand Septoria leaf blotch, but not physiologicleaf spot, can also be controlled withfungicides, destroying (burning or burial)residues of infected wheat stubble, reducingthe rate of nitrogen fertilizer, and avoidingdense seedling canopies.
Application of Foliar 158 suppressedphysiologic leaf spot, prolonged juvenility ofleaves, and increased grain yield during1991 and 1992. Urea plus a mixture ofmicronutrients provided an intermediatelevel of disease control but no increase ingrain yield. We have not yet determinedwhether there is some unique property ofthe Foliar 158 formulation, or whetherphysiologic leaf spot and yield responded tothe calcium chloride. This is beinginvestigated.
Calcium protects roots from effects oflow pH, toxic ions, salinity, and ionimbalance. Calcium reduces cellularmembrane damage and leakiness. Calciumdeficiency has been associated with reducedcold hardiness, increased risk of magnesiumtoxicity, and reduced growth ofmeristematic tissues. Calcium improvesplant resistance to diseases caused bysoilborne plant pathogens but there is littleevidence it has an important role in foliardiseases. Although soil acidification isoccurring throughout the Pacific Northwestthere is no evidence that calciumconcentrations have already gone below acritical level for wheat growth andmetabolism.
Chloride is necessary for photosynthesisand osmotic relations in leaves. Chloride
deficiency causes wilting, chlorosis, andreduced leaf growth. Application ofchloride salts to soil or foliage can suppressrust and Septoria leaf blotch of wheat, andcan increase yield, even when soil andtissue tests did not indicate that chloridewas in low supply. Chloride application towheat in the Netherlands caused flag leavesto remain green for a longer period, andgrain yield to increase. Research inMontana indicated that chloride affectedthe rate of spikelet formation andmaturation, and volume and weight ofkernels. The relationship between chloride,crop yield, and diseases is not understood.It is also unclear whether the response ofphysiologic leaf spot to application of Foliar158 is dependent on the chloride or someother component of this product.
Four management strategies may provebeneficial on fields where physiologic leafspot has damaged wheat during recentyears. Select a wheat variety resistant tothis disease. Plant as late as possible,without compromising yield by planting toolate for your region. Rotate crops whereverpossible. Applications of Foliar 158 havebeen cost effective in experimental plotsconducted thus far. However, theapplication had to be made before,symptoms of physiologic leaf spot becamefully apparent. Application of Foliar 158 ,or equivalent, in May, after the diseasebecame well established in the upper plantcanopy, was not effective.
ACKNOWLEDGEMENTS
Assistance from colleagues at theColumbia Basin Agricultural ResearchCenter, USDA Columbia PlateauConservation Research Center, and OSUExtension Service was truly appreciated.Clinton Reeder, Calvin Spratling, andStanley Timmerman graciously donated
37
land for these experiments. Additionalassistance was provided by Pendleton GrainGrowers, Walla Walla Grain Growers,McGregor Co., Hill Brothers Chemical Co.,Brogoitti Elevator, Wilbur-Ellis, Pure-Gro,Ciba-Geigy, Farm Chemical Service, andothers. Funds were provided by theOregon Wheat Commission and USDA-CSRS-Pacific Northwest STEEPCompetitive Grants Program.
SELECTED REFERENCES
Engle, R.E., Woodard, H., and Sanders,J.L. 1992. A summary of chloride researchin the Great Plains. Proceedings of theGreat Plains Soil Fertilizer Conference4:232-241.
Fixen, P.E., Buchenau, G.W., Gelderman,R.H., Schumacher, T.E., Gerwing, J.R.,Cholick, F.A., and Farber, B.G. 1986.Influence of soil and applied chloride onseveral wheat parameters. AgronomyJournal 78:736-740.
Smiley, R. W., Gillespie-Sasse, L.-M.,Uddin, W., Collins, H.P., and Stoltz, M.A.1993. Physiologic leaf spot of winter wheat.Plant Disease 77:(in press).
Smiley, R.W., Uddin, W., Zwer, P.K,Wysocki, D.J., Ball, D.A., Chastain, T.G.,and Rasmussen, P.E. 1993. Influence ofcrop management practices on physiologicleaf spot of winter wheat. Plant Disease77:(in press).
38

WHEAT PRODUCTION IN SOILINFESTED WITH CEREAL
CYST NEMATODE ANDFUNGAL PATHOGENS
Richard Smiley, Russell Ingham,and Gordon Cook
Cereal cyst nematode (CNN)(Heterodera avenae) infests agricultural soilsthroughout the world. The nematode isspread when contaminated soil moves on orin vehicles, equipment, plants, shoes,animals, dust, water, or other means. CCNwas first reported in the United States (inwestern Oregon) during 1974. Since 1983CCN has been identified in a small numberof fields in all major wheat productionareas of the Pacific Northwest (PNW).Infested areas include, but may not belimited to, the following counties: Union,Morrow, Washington, and Umatilla inOregon; Whitman County in Washington;and Caribou, Fremont, Jefferson, Madison,and Teton Counties in Idaho. Hosts ofCCN in the PNW include wheat, barley,oats, corn, and grass seed crops. Thesecrops are valued at $1.2 billion annually,and are produced on 70 million acres. Asurvey of fields in the Grande Ronde Valleyduring 1987 indicated that 67 percent of thefields surveyed were infested with CCN.
Management strategies for CCN havenot been developed in semi-arid regions ofthe PNW. Yields of winter and springwheat in eastern Oregon have beenimproved from 0 to 29 percent with oneapplication of Temik, but this is not aregistered use. No local information wasavailable regarding management practicesinvolving resistant varieties, crop rotations,or tillage.
Crop rotations are particularly useful forreducing damage caused by CCN in other
regions. In eastern Canada, three-yearrotations including one or two years ofwinter wheat and soybean, corn, barley,and/or alfalfa produced wheat yields 20percent higher than annual winter wheat inplots managed with moldboard plowing,minimum tillage, or no tillage. It was notknown whether crop rotations would reduceCCN damage in eastern Oregon.Amplifying this uncertainty are the complexroot diseases resulting from combinedactions of CCN and pathogenic fungi thathave been described, and the suite ofpathogens in eastern Oregon which differsfrom areas where rotations have beenstudied in other parts of the world. Rootand crown diseases in the PNW includeCephalosporium stripe, common root rot,strawbreaker foot rot, Pythium root rot,Rhizoctonia root rot, and take-all. Effectsof CCN and Rhizoctonia root rot on wheatin Australia were less damaging individuallythan when combined. Another studyrevealed that Rhizoctonia root rot andtake-all both reduced formation of CCNcysts by rotting the roots and competing forroot sites, causing the CCN population todecline.
The primary objective of this researchwas to examine winter wheat growth,diseases, CCN damage, and yield in variouscrop sequences. Other objectives were todetermine effects of tillage and grass weedson damage from CCN.
METHODS
The study was conducted on the JohnCuthbert farm five miles northeast of LaGrande. The field had been managed as awinter wheat/summer fallow rotation for sixyears. The area has 20 inches annualprecipitation, and a deep, poorly drainedConley silty clay loam. Eleven treatments(Table 1) were established on 16 x 100 ft
39
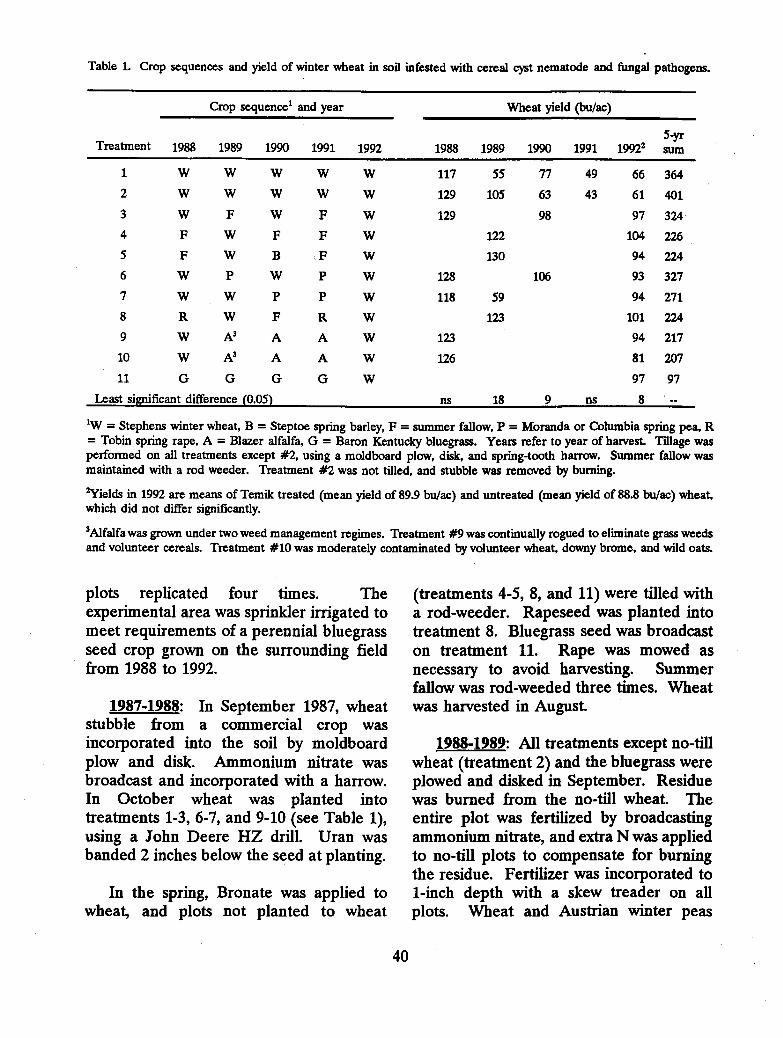
Table 1. Crop sequences and yield of winter wheat in soil infested with cereal cyst nematode and fungal pathogens.
Treatment
Crop sequence' and year Wheat yield (bu/ac)
1988 1989 1990 1991 1992 1988 1989 1990 1991 199225-yrsum
1 W W W W W 117 55 77 49 66 364
2 W W W W W 129 105 63 43 61 401
3 W F W F W 129 98 97 324
4 F W F F W 122 104 226
5 F W B F W 130 94 224
6 W P W P W 128 106 93 327
7 W W P P W 118 59 94 271
8 R W F R W 123 101 224
9 W A' A A W 123 94 217
10 W A' A A W 126 81 207
11 G G G G W 97 97
Least significant difference (0.05) ns 18 9 ns 8
= Stephens winter wheat, B = Steptoe spring barley, F = summer fallow, P = Moranda or Columbia spring pea, R= Tobin spring rape, A = Blazer alfalfa, G = Baron Kentucky bluegrass. Years refer to year of harvest. Tillage wasperformed on all treatments except #2, using a moldboard plow, disk, and spring-tooth harrow. Summer fallow wasmaintained with a rod weeder. Treatment #2 was not tilled, and stubble was removed by burning.
2Yields in 1992 are means of Temik treated (mean yield of 89.9 bu/ac) and untreated (mean yield of 88.8 bu/ac) wheat,which did not differ significantly.
'Alfalfa was grown under two weed management regimes. Treatment #9 was continually rogued to eliminate grass weedsand volunteer cereals. Treatment #10 was moderately contaminated by volunteer wheat, downy biome, and wild oats.
plots replicated four times. Theexperimental area was sprinkler irrigated tomeet requirements of a perennial bluegrassseed crop grown on the surrounding fieldfrom 1988 to 1992.
1987-1988: In September 1987, wheatstubble from a commercial crop wasincorporated into the soil by moldboardplow and disk. Ammonium nitrate wasbroadcast and incorporated with a harrow.In October wheat was planted intotreatments 1-3, 6-7, and 9-10 (see Table 1),using a John Deere HZ drill. Uran wasbanded 2 inches below the seed at planting.
In the spring, Bronate was applied towheat, and plots not planted to wheat
(treatments 4-5, 8, and 11) were tilled witha rod-weeder. Rapeseed was planted intotreatment 8. Bluegrass seed was broadcaston treatment 11. Rape was mowed asnecessary to avoid harvesting. Summerfallow was rod-weeded three times. Wheatwas harvested in August.
1988-1989: All treatments except no-tillwheat (treatment 2) and the bluegrass wereplowed and disked in September. Residuewas burned from the no-till wheat. Theentire plot was fertilized by broadcastingammonium nitrate, and extra N was appliedto no-till plots to compensate for burningthe residue. Fertilizer was incorporated to1-inch depth with a skew treader on allplots. Wheat and Austrian winter peas
40

(treatment 6) were planted in earlyOctober.
Treatments 9 and 10 were harrowed andalfalfa was planted in March 1989. Longperiods of water-saturated soil caused poorsurvival of winter peas and emergence ofalfalfa. Treatments 6, 9, and 10 wereharrowed and reseeded in May. Treatment6 was treated with Treflan and Sencorbefore planting to Moranda dry pea.Wheat was treated with Bronate, and thesummer fallow was harrowed and rod-weeded. Bluegrass was treated with Buctril.Peas were mowed in July to prevent seedmaturation. Wheat was harvested in July.Manual weeding of "weed-free" alfalfa(treatment 9) was performed repeatedlyduring the summer and autumn of 1989.
1989-1990: Alfalfa and bluegrass weremowed in September. All plots to befallowed or planted to wheat (except no-till), barley, or pea were plowed and disked,and bluegrass and no-till wheat plots wereburned. The entire experimental area wasfertilized with ammonium nitrate.Roundup was applied to treatment 2 (no-tillwheat). Treatments 4-5 and 7-8 (for springcrops or summer fallow) were rod-weeded.Wheat was planted in late September.
"Weed-free" alfalfa was manually roguedas needed during the season. In March allplots for summer fallow or spring cropswere harrowed, and wheat plots weretreated with Bronate. Tilled plots wereharrowed again in May, and summer fallow(treatment 4 and 8) was rod-weeded. Peaplots (treatment 7) were treated withTreflan, harrowed, planted to Columbiagreen pea, and treated with Sencor. MCPPwas applied to bluegrass. Barley wasplanted in treatment 5. The summer fallowwas disked and rod-weeded, Bronate wasapplied to barley, Thistrol was applied to
peas, and Di-Syston was applied to wheatand barley. Fallow was rod-weeded andalfalfa and bluegrass were mowed asneeded through the summer. Peas weremowed, and wheat was harvested in August.
1990-1991: No-till wheat stubble wasburned in September. In October alltreatments except alfalfa and bluegrass weretreated with Roundup, and all plots exceptalfalfa, bluegrass, and no-till wheat wereplowed and disked. All plots except thefallow (treatments 3-5) were fertilized withammonium nitrate. All plots, including theno-till wheat plots, were tilled shallowlywith a skew treader, and wheat was planted.The summer fallow was rod-weeded and"weed-free" alfalfa was rogued as neededthrough the season.
In April, wheat was treated withBronate. Landmaster and Bronate wereapplied to fallow, pea, and rape treatmentsin June. Bluegrass was also treated withBuctril. In June, rape and Columbia peawere planted, and alfalfa and bluegrasswere mowed. Summer fallow was rod-weeded three times during the summer.Thiodan was applied to peas in July, andwheat was harvested in August.
1991-1992: In September, soil sampleswere collected from all 44 plots (4replicates of 11 treatments) to analyze theresidual nitrogen in each plot. Alfalfa,rape, bluegrass, and peas were mowed andstubble of no-till wheat was burned. Alltreatments except no-till wheat wereplowed, and all treatments were diskedtwice (only to 2-in depth on no-till wheatplots). Each of the 44 plots was fertilizedindividually with ammonium nitrate. Ratesranged from 0 to 110 lb N/acre, based onsoil test results plus estimates of N to bereleased during mineralization of straw. Auniform target rate for each plot was 150 lb
41
total N/acre. Hoelon was applied andincorporated with a skew treader. All plotswere rod-weeded and planted to wheat inearly October. Wheat was planted with aGreat Plains double-disk no-till drill with10-in row spacings. The planting directionwas crosswise to the length of each 16 x 100ft plot. Temik 15G (3.6 lb a.i./acre) wasbanded with the wheat seed on half theentire block, providing 88 rotation x Temikplots of 16 x 50 ft (11 rotation treatments;4 replicates; +/- Temik). Roundup wasapplied as a pre-emergence spray.
In March, Harmony Extra and Lexonewere applied to control downy brome,foxtail, pigweed, tumble mustard, andvolunteer peas. Temik (2.5 lb a.i./acre) wasre-applied as a broadcast to the previouslyTemik-treated portion of the block. Wheatwas harvested in August. All grain fromthe Temik-treated area was destroyed afterharvest.
Every year: Wheat plants were collectedone to three times every year forquantitative evaluations of growth,development, all diseases, and damage fromCCN. Non-hosts of CCN (alfalfa, pea, andrape) and bluegrass were not monitored fordiseases, growth, or yield. Soil sampleswere collected each year to extract andcount cysts and larvae of CCN in each ofthe 44 plots (88 plots in 1992).
CCN damage to roots was rated on ascale of 0 to 5; 0=no damage, and 5=rootsvery knotted and shortened, and shootsstunted by 50 percent. Strawbreaker footrot was quantified as the percentage oftillers containing lesions that penetratedinto the can beneath the leaf sheath.Common root rot was quantified aspercentage of subcrown internodes affectedby characteristic dark lesions. Take-all wasrated as the percentage of roots affected by
characteristic blackening of the root cortexor vascular system. Pythium root rot wasquantified as percentage of roots with light-brown, water-soaked lesions. Rhizoctoniaroot rot was identified by brown lesionsthat often severed the root in acharacteristic "spear point". Rhizoctoniaroot rot was evaluated separately for theseminal (0-5 scale) and crown (0-4 scale)roots; 0=no disease in each scale.
Plant growth and development weremeasured on plants evaluated for diseases.Measurements included development stage(Haun system), plant height, tillers perplant, oven dry weight of shoots, andnumber of roots intersecting horizontalplanes 1- or 2-in below the seed.Percentages of plants with the coleoptilartiller (T0) and tillers from axils of first (T1),second (T2), or higher numbered leaveswere also quantified. Grain yields and testweights were measured by threshing 5 x 100ft strips from each plot. Two 5 x 50 ftstrips were harvested from 88 plots in 1992.
RESULTS
1987-1988. As expected for the firstyear, no treatment differences weremeasured for foliar growth or development,or root numbers, during the spring andsummer. Incidence and severity of damagefrom CCN, take-all, Rhizoctonia root rot,Pythium root rot, and common root rotwere minimal. Grain yields also did notdiffer (Table 1).
1988-1989. Damage ratings for CCNwere significantly higher in, the threesecond-season crops of annual wheat (1.7-1.8) than in wheat following fallow (1.1)and rape (0.9). Damage to bluegrass rootswas minimal (0.3). Rhizoctonia root rotwas moderate (indices of 2.5-3.1) onseminal roots of the second consecutive
42

crops of wheat, intermediate on wheatfollowing rape (2.1), and least on wheatfollowing fallow (1.0). Rhizoctonia root rotdamage to crown roots was low to moderate(0.8-1.2) in all treatments. Take-all,Pythium root rot, and common root rotwere minimal and did not differ amongtreatments. Yield of wheat following wheatin tilled soil was 55-62 percent less thanwheat following fallow or rape (Table 1).In contrast, yield of wheat following wheatin non-tilled soil was only 14-21 percent lessthan for wheat following fallow or rape.Wheat in no-till yielded more than wheat intilled soil.
1989-1990. CCN damage ratings toseedlings in November were higher forannual wheat (1.0) than wheat followingfallow or peas (0.2-0.3). Pythium root rotwas also higher on annual wheat (1-3percent roots) than wheat in rotations(trace). In contrast, Rhizoctonia root rotratings on seminal roots were higher in therotations (1.8-1.9) than in annual wheat(1.1-1.4). Plants were 1 inch taller inrotations than in annual wheat, and werephenologically more developed in rotations(Haun 3.2-3.3) than in annual wheat (Haun2.6-3.0). Plants had higher percentages oftillers in rotation treatments than in annualwheat treatments; respectively, 3-28 percentvs 0-1 percent for To, 77-92 percent vs 6-34percent for T1, and 16-17 percent vs 0percent for T2.
Incidence and severity ratings fordiseases in April 1990 did not differsignificantly among treatments. Diseasespresent in minor amounts includedRhizoctonia root rot, Pythium root rot,common root rot, and take-all. CCNdamage ratings were 0.7-0.8 for annualwheat and 0.1 for wheat following fallow orpeas. Rhizoctonia root rot and Pythiumroot rot each became less damaging as
take-all and CCN became more damaging.
Grain yields were significantly lower inannual wheat than in wheat-fallow orwheat-pea rotations. In contrast to yieldsin 1989, wheat in tilled soil yielded morethan in no-till during 1990. Yield of wheatwas directly correlated with numbers ofroots on plants during the spring, and wasnegatively correlated with CCN populationsin soil before wheat was planted (Fig. 1),and with CCN damage ratings during thespring. Backwards multiple regressionanalysis indicated that the strongestdeterminant of yield was combined damagefrom CCN and take-all. Rotation effectson yield of spring barley could not becompared because barley was present inonly one treatment (5,249 lb/acre).
120
100co
80
60
400 1000 2000 3000 4000 5000 6000 7000 8000 9000
EGGS AND JUVENILES FROM CYSTS/100 G SOIL
Figure 1. Relationship of pre-plant nematode populations(August, 1989) to yield of winter wheat in 1990.
1990-1991. None of the diseaseparameters differed among the two annualwheat treatments during March. However,wheat in tilled soil was 1 inch taller than innon-tilled soil, and was phenologically moreadvanced (Haun 3.5 vs 3.2). Numbers ofroots did not differ among treatments.
In May the damage from CCN was verylight on seminal roots (ratings 0.1-0.2), and
43
moderately severe on crown roots; 3.6 intilled and 2.3 in untilled soil. In contrast,Rhizoctonia root rot of seminal roots wasmore severe in non-tilled (1.3) than tilled(0.4) soil, and was not present on crownroots. Pythium root rot also affected moreroots in non-tilled (12 percent) than tilled(5 percent) soil. Take-all (2 percent roots),strawbreaker foot rot (23-25 percentplants), and common root rot (41-46percent plants) did not differ amongtreatments.
Numbers of roots below the seedrevealed that plants in tilled soil had 20percent more roots than plants in non-tilledsoil. There was a corresponding differencein plant height; 14 inches in tilled soil and9 inches in non-tilled soil. Tillering wasvariable for plants in tilled and non-tilledsoils; 18 vs 31 percent for To, 90 vs 85percent for T1, 73 vs 53 percent for 1'2, 21vs 0 percent for T3, and 6 vs 0 percent for1'4. Grain yields did not differ amongtreatments.
1991-1992. Temik banded with thewheat seed did not reduce numbers ofCCN-affected plants or root damageseverity ratings in March 1992. Thenematicide also did not affect the incidenceor severity of Rhizoctonia root rot, Pythiumroot rot, or take-all. However, when re-applied as a surface broadcast duringMarch, Temik significantly reduced theCCN damage assessed during May. Thebeneficial effect of Temik was leastapparent in treatments where hosts of CCNhad not been present for two or more years.Percentages of plants affected by fungaldiseases were higher in Temik-treated thanuntreated soil. Compared to untreated soil,Rhizoctonia root rot in the Temiktreatment was increased by 75 percent and31 percent on crown and seminal roots,respectively, and Pythium root rot and take-
all were increased by 23 percent and 10percent, respectively.
Root damage from CCN was low duringearly spring (March) and in Temik-treatedsoil during late spring (May). Damageratings were high in untreated annual wheatduring late spring, and were intermediate inthe wheat/fallow, wheat/pea, andwheat/barley/fallow rotations. Damageratings were lowest in treatments wherehosts had not been present for two or moreyears. Incidence or severity of CCNdamage did not differ among tillagetreatments for annual wheat. Grass weedsin alfalfa led to an increase in CCN damageto the following wheat crop.
Rotations did not have a significanteffect on incidence or severity ofRhizoctonia root rot or take-all during earlyspring. Pythium root rot was most frequentand damaging in wheat/pea rotations orwheat following two years of fallow, andleast frequent and damaging followingbluegrass or annual wheat in tilled soil.Common root rot occurred on 10-30percent plants in all treatments exceptannual no-till wheat (2 percent) and bothtreatments containing alfalfa (2-6 percent).
As plants matured into the late springmost of the earlier patterns weremaintained. Take-all became moreimportant (15-20 percent plants) in annualno-till wheat and in wheat following weedyalfalfa than in other treatments (0-5 percentplants). Fewer plants were diagnosed withcommon root rot during late spring thanearly spring, which may have been anartifact caused when symptoms becameobscured by prolific root growth. Althoughtreatment differences for strawbreaker footrot became significant (23-67 percentplants) during late spring no patternsrelative to crop sequences were apparent.
44

Nearly all growth and developmentparameters examined were affected by cropsequences. Fewest roots occurred in annualwheat, wheat following bluegrass, and wheatin rotation with barley and fallow. Plantheight, development, and tillering were alsoless for annual wheat and wheat followingbluegrass than for other treatments.
Wheat in all rotations yielded more thanwheat produced annually (Table 1). Grainyield was not improved by application ofTemik. Tilling or not tilling soil prior toplanting annual wheat also had no effect onyield. Yield of wheat following three yearsof alfalfa was higher when alfalfa was weed-free rather than contaminated by grasses.Wheat following fallow, peas, rape, orbluegrass provided the highest yields. Yieldwas negatively correlated with percentage ofplants affected by CCN and take-all, andpositively correlated with all plant growthparameters. Backwards multiple regressionanalysis indicated that the strongestdeterminant of yield was combined damagefrom CCN and take-all. Numbers of roots1 inch below the seed during seedlinggrowth and number of tillers on matureplants were the most important plantgrowth and development parametersaffecting yield. Numbers of roots werenegatively correlated with combineddamage from CCN and Pythium root rot.Numbers of tillers were negativelycorrelated with combined damage fromCCN and take-all.
Total wheat production for the five-yearperiod was also calculated (Table 1). Yieldwas higher in no-till than tilled annualwheat, but only because the yield of tilledwheat declined one year earlier than in theno-till. Yields of wheat for the wheat/fallowand wheat/pea rotations were nearly thesame as for annual wheat. Depending onpea prices and costs of production, the
wheat/pea rotation is likely to have beenthe most profitable of these crop sequences.Likewise, comparable amounts of wheatwere produced by two crops of wheat in thefollowing sequences: wheat/2-yrfallow/wheat, wheat/barley/fallow/wheat,wheat/fallow/rape/wheat, and wheat/3-yralfalfa/wheat. Sequences with barley, rape,or alfalfa were likely the most profitable,compared to the double fallow.
DISCUSSION
Crop rotations of any type, includingsummer fallow, provided higher yields thanannual winter wheat. Rotations that couldgenerate additional income from othercrops would have produced the highestprofitability as well as the highest level ofplant health. Barley and Kentuckybluegrass did not seem to aggravate theamount of damage caused by CCN. In anearlier test, also located in the GrandeRonde Valley, Temik did not affect yieldsof winter or spring barley, but improvedyield of winter and spring wheat by 25-29percent. It appears that barley andbluegrass may be poor hosts for the biotype(race) of CCN present in the valley.Evaluations of CCN populations in alltreatments (in progress) may clarify thisobservation.
Temik did not increase yield of winterwheat during 1992. Temik reduced theamount of CCN damage, but there was anincrease in damage from Rhizoctonia rootrot, Pythium root rot, and take-all. The neteffect was simply to trade damage from onepathogen to others, resulting in equivalentgrain yield.
Wheat yields in CCN-infested soil inAustralia have been improved by directdrilling (no-till) compared to seedbedtillage. In our study there was no
45
consistent effect of tillage for annual wheat,although the yield decline with re-croppingoccurred one year earlier with tillage thanwith no tillage. However, our study did notallow for a second observation of thesetillage effects during continuous cropping.Nevertheless, the difference between ourobservation and that in Australia appears todepend on the complexity of the diseasesituation present in each field. As in theAustralian study, damage from CCN waslower with no-till than with tillage.However, in our study the opposite was truefor Pythium and Rhizoctonia root rotsduring 1991, and take-all and Pythium rootrot during 1992. As exemplified by theTemik treatment during 1992, a trading ofdamage caused by various pathogens in aroot disease complex caused yields to becomparable in the tilled and untilled annualwheat.
Alfalfa with grass weeds perpetuated thepotential for damage by CCN, whereasweed-free alfalfa allowed production of ahealthier wheat crop during 1992.However, the 13 bushel advantage forwheat during 1992 may not have beensufficient to offset the multiple herbicideapplications required to maintain weed-freealfalfa for three years.
Wheat yields during 1990 and 1992 weremost highly correlated (negatively) withdamage caused by CCN and take-all.When faced with the challenge of two ormore major root pathogens in the samefield, the best way to increase yield is torotate crops. This reduces the survival ofmost pathogens that attack wheat.Additionally, other control strategies shouldalso be used in an integrated approach tofurther reduce the potential damage fromone or more pathogens. For instance, it ispossible to develop wheat varieties that areresistant to CCN, and seed treatments or
biological agents may be developed.
Results of this study suggest that CCNis likely to cause significant damage towheat only when continuous annual wheatis produced. This practice is neitherrecommended nor common in the PNW.As such, CCN is likely to be mostimportant in irrigated fields and areas thatreceive enough rainfall for annual wheat tobe produced. Spring wheat can bedamaged even more than winter wheat, andmust also be considered in the croprotation sequence.
ACKNOWLEDGEMENTS
We appreciate technical assistance bystaff members at the OSU Columbia BasinAgricultural Research Center, USDAColumbia Plateau Conservation ResearchCenter, OSU Department of Botany andPlant Pathology, and Oregon Departmentof Agriculture. Land donation by JohnCuthbert and funding by the Oregon WheatCommission and Pacific Northwest STEEPProgram were appreciated.
SELECTED REFERENCES
Brown, R.H. 1985. The selection ofmanagement strategies for controllingnematodes in cereals. Agric. Ecosyt.Environ. 12:31-388.
Christen, 0., Sieling, K., and Hanus, H.1992. The effect of different precedingcrops on the development, growth and yieldof winter wheat. Eur. J. Agron. 1:21-28.
Gair, R., Mathias, P.L., and Harvey, P.N.1969. Studies of cereal nematodepopulations and cereal yields undercontinuous or intensive culture. Ann. Appl.Biol. 63:503-512.
46
Jensen, H.J., Eshtiaghi, H., Koepsell, P.A.,and Goetze, N. 1975. The oat cystnematode, Heterodera avenae, occurs in oatsin Oregon. Plant Dis. Rep. 59:1-3.
Meagher, J.W. 1977. World disseminationof the cereal cyst nematode (Heteroderaavenae) and its potential as a pathogen ofwheat. J. Nematol. 9:9-15.
Meagher, J.W., and Chambers, S.C. 1971.Pathogenic effects of Heterodera avenae andRhizoctonia solani and their interaction onwheat. Aust. J. Agric. Res. 22:189-194.
Meagher, J.W., Brown, R.H., and Rovira,A.D. 1978. The effects of cereal cystnematode Heterodera avenae andRhizoctonia solani on the growth and yieldof wheat. Aust. J. Agric. Res. 29:1127-1137.
O'Brien, P.C., and Fisher, J.M. 1974.Resistance within wheat, barley and oatcultivars to Heterodera avenae in SouthAustralia. Aust. J. Exp. Agric. Anim. Husb.14:399-404.
Rovira, A.D., and Simon, A. 1982.Integrated control of Heterodera avenae.EPPO Bull. 12:517-523.
Simon, A., and Rovira, A.D. 1982. Therelation between wheat yield and earlydamage of roots by cereal cyst nematode.Aust. J. Exp. Agric. Anim. Husb. 22:201-208.
Smiley, R.W., and Ingham, R.E. 1993. Croprotations for producing winter wheat in soilinfested with cereal cyst nematode andfungal pathogens. Phytopathology83:(submitted).
47
LONG-TERM INFLUENCE OFTILLAGE METHOD ON SURFACESOIL NUTRIENT DISTRIBUTION
William F. Schillingerand Floyd E. Bolton
Soil organic matter (OM) in surfacesoils is of fundamental importance inmaintaining soil productivity. Method oftillage has a significant impact on the OMlevel in the surface soil. Organic nitrogen(N) containing compounds, the product ofmicrobial decomposition of crop residue,account for over 90 percent of the N inmost agricultural soils (Haynes, 1986).During decomposition, some of the carbon(C) and N is immobilized into microbialtissue, and part is microbially converted intoresistant humic substances, which constitutethe bulk of soil OM. Tillage accelerates netmineralization of soil organic N byincreasing soil porosity and aeration, andexposing surface residue to the soilmicrobial biomass. In contrast, no-tillageresults in the accumulation of OM in thesurface soil.
The long-term tillage effects on OM ina wheat-fallow cropping system have beenmeasured at Pendleton. After 45 years ofcontinuous management, the soil OMcontent in the surface 3 inches understubble mulch tillage (either disk or sweeps)was 2.8 percent compared to 2.1 percentwith moldboard plowing (Rasmussen et al.1989). Little information is available on theeffects of no-tillage management onmaintenance of OM in wheat-fallowproduction systems in the PacificNorthwest.
MATERIALS AND METHODS
Data reported in this study wereobtained from soil samples taken from the
long-term tillage plots at the ShermanExperiment Station at Moro, OR. Thetillage treatments, established in 1981, were:1) moldboard plow tillage in late March tocreate a bare soil surface, followed by 3 to4 rodweedings; 2) sweep plow tillage in lateMarch to create a stubble mulch withapproximately 70 percent of the residueremaining on the soil surface, followed by3 to 4 rodweedings, and; 3) no-tillage,where weeds were controlled withherbicides and the soil was disturbed onlyat planting. Twelve soil samples were takenfrom the surface 1 ft from each of thefallowed treatments one day before seedingon October 7, 1989. The 12 samples weredivided into 0 to 3, 3 to 6, and 6 to 12 inchincrements. One composite sample foreach treatment from each sampling depthwas then made. Samples were air-driedand subsequently analyzed by the OregonState University Soil Testing Lab inCorvallis.
RESULTS AND DISCUSSION
After eight years of continuousmanagement, the no-tillage treatment hadhigher levels of surface soil extractablephosphorous (P), mineralizable N,exchangeable potassium (K), and OM thanthe other tillage treatments (Figure 1).Accumulation of OM on the soil surfacewould likely account for differences inextractable soil nutrients between no-tillageand the other treatments. With no-tillage,much of the P and K brought up by theroots and recycled into crop residue tendsto become concentrated in the soil surface.In general, no-tillage resulted in increasednutrient concentrations in the surface 3inches and a rapid decrease with depth.Long-term moldboard plow and stubblemulch tillage systems resulted in morehomogeneous fertility in the surface 1 ft ofsoil. These findings are consistent with
48
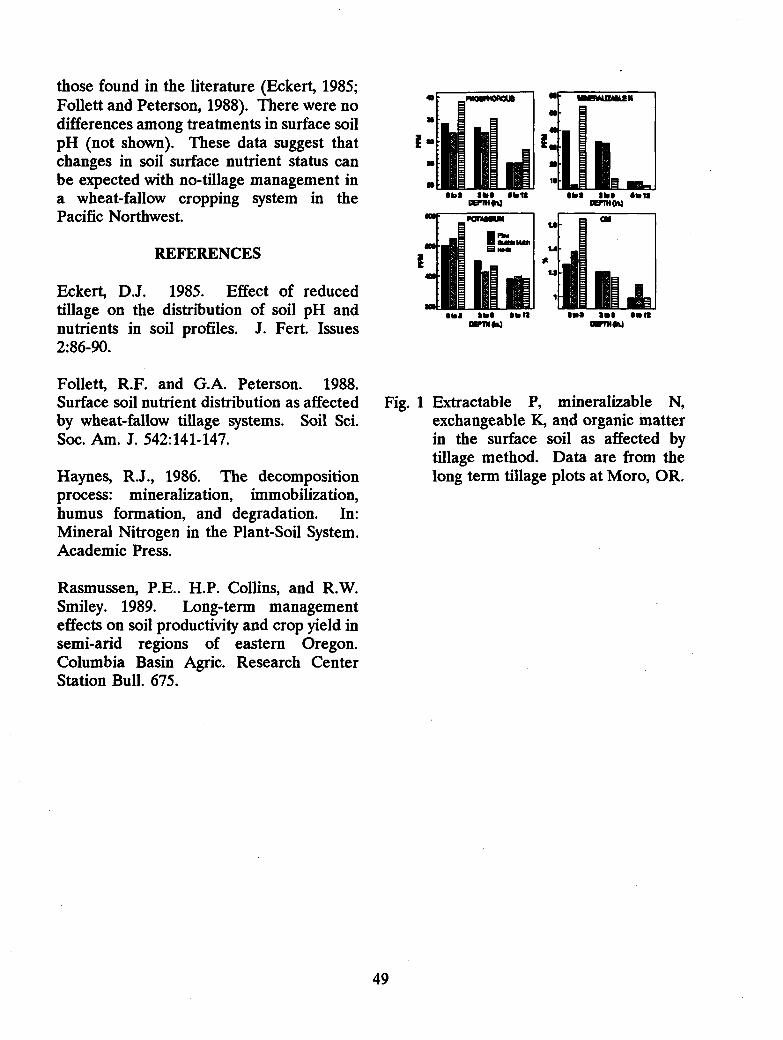
those found in the literature (Eckert, 1985;Follett and Peterson, 1988). There were nodifferences among treatments in surface soilpH (not shown). These data suggest thatchanges in soil surface nutrient status canbe expected with no-tillage management ina wheat-fallow cropping system in thePacific Northwest.
REFERENCES
Eckert, D.J. 1985. Effect of reducedtillage on the distribution of soil pH andnutrients in soil profiles. J. Fert. Issues2:86-90.
Follett, R.F. and G.A. Peterson. 1988.Surface soil nutrient distribution as affectedby wheat-fallow tillage systems. Soil Sci.Soc. Am. J. 542:141-147.
Haynes, R.J., 1986. The decompositionprocess: mineralization, immobilization,humus formation, and degradation. In:Mineral Nitrogen in the Plant-Soil System.Academic Press.
Fig. 1 Extractable P, mineralizable N,exchangeable K, and organic matterin the surface soil as affected bytillage method. Data are from thelong term tillage plots at Moro, OR.
Rasmussen, P.E.. H.P. Collins, and R.W.Smiley. 1989. Long-term managementeffects on soil productivity and crop yield insemi-arid regions of eastern Oregon.Columbia Basin Agric. Research CenterStation Bull. 675.
49
YIELD COMPONENTS AND CROPCHARACTERISTICS OF NO-TILLAGE
WINTER WHEAT GROWN IN AWHEAT-FALLOW ROTATION
William F. Schillingerand Floyd E. Bolton
No-tillage winter wheat (Triticumaestivum L.) grown under a wheat-fallowrotation has consistently produced lowergrain yields than conventionally tilled soilsin a long-term tillage trial at Moro, OR(Table 1). In a 4-year study conducted nearPendleton, OR, Oveson and Appleby (1971)reported that grain yields from no-tillageplots were significantly reduced comparedto yields from tilled plots. The objective ofthis study was to determine factorsresponsible for differences in wheat growthand yield in north-central Oregon asaffected by moldboard plow tillage, stubblemulch tillage, and no-tillage.
MATERIALS AND METHODS
Data were collected during the 1990-91 crop season from the long-term tillagetrial at Oregon State University's ShermanExperiment Station at Moro, OR. Fallowmanagement treatments were: 1) moldboardplow tillage in late March to create a baresoil surface, followed by 3 to 4 rodweedings;2) sweep plow tillage in late March tocreate a stubble mulch with approximately70 percent of the residue remaining on thesoil surface, followed by 3 to 4 rodweedings,and; 3) no-tillage, where weeds werecontrolled with herbicides and the soil wasdisturbed only at planting. Average annualprecipitation at this site is 11.4 inches.Each treatment was replicated four times inrandomized block design with individualplots measuring 135 ft x 8 ft.
On 19 September 1990, 70 lb/acrenitrogen (N), as Solution 32, mixed with 0.5lb/acre atrazine herbicide for downy bromecontrol was surface applied to alltreatments. Winter wheat (Malcolm) wasseeded in 16-inch rows at 50 lb/acre on 20September 1990. The conventional tillageand stubble mulch systems were seededwith a John Deere HZ deep furrow drill,and the no-tillage system was seeded with astrip-till drill. Soil water to a depth of 5 ftwas measured at time of planting, and atFeekes Growth Stages (FGS) 4(lengthening of leaf sheath); 5 (leaf sheathsstrongly erected); 7 (second node visible);10 (boot); 10.5 (flowering), and; 11.4 (ripefor cutting). Three access tubes wereinstalled in each plot where soil volumetricwater content of the 2 to 5 ft depth wasmeasured in 1 ft increments with a neutronprobe. Volumetric water content of thesurface 1 ft was measured gravimetrically intwo 6-inch core samples.
Plant samples from randomly selected3 ft row sections were collected from eachtreatment at FGS 4, 5, 7, 10, 10.5, and 11.4for above-ground dry matter and plant Nuptake determination. Whole plantsamples were oven dried at 60°C for 48hours, weighed, and then ground to passthrough a 0.02 inch mesh screen. A LECOCHN-600 carbon-hydrogen-nitrogenanalyzer was used for determination of totalN (percent). Early spring soil temperaturewas measured by inserting thermistors 2inches below the furrow of all tillagetreatments at FGS 4. Soil temperature wasrecorded daily at 3:00 PM as it wasassumed that this time would approximatedaily maximum air temperature. Otherclimatic data were acquired from therecords of a standard U.S. Weather Bureaushelter located less than 1 mile from theexperimental site.
50
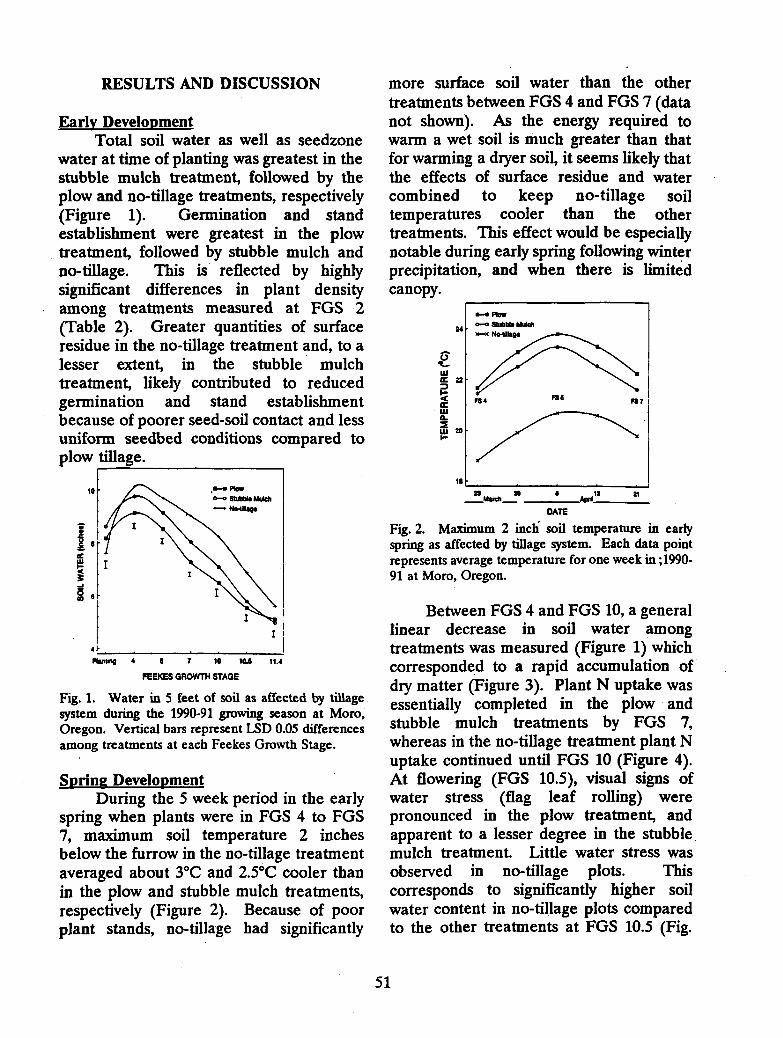
n—• Pte.
0-0 BMW Mulch
140.01a0.
10
•
I
4 6 7 10 10.6 11.4
RESULTS AND DISCUSSION
Early DevelopmentTotal soil water as well as seedzone
water at time of planting was greatest in thestubble mulch treatment, followed by theplow and no-tillage treatments, respectively(Figure 1). Germination and standestablishment were greatest in the plowtreatment, followed by stubble mulch andno-tillage. This is reflected by highlysignificant differences in plant densityamong treatments measured at FGS 2(Table 2). Greater quantities of surfaceresidue in the no-tillage treatment and, to alesser extent, in the stubble mulchtreatment, likely contributed to reducedgermination and stand establishmentbecause of poorer seed-soil contact and lessuniform seedbed conditions compared toplow tillage.
FEEKES GROWTH STAGE
Fig. 1. Water in 5 feet of soil as affected by tillage.system during the 1990-91 growing season at Moro,Oregon. Vertical bars represent LSD 0.05 differencesamong treatments at each Feekes Growth Stage.
Spring DevelopmentDuring the 5 week period in the early
spring when plants were in FGS 4 to FGS7, maximum soil temperature 2 inchesbelow the furrow in the no-tillage treatmentaveraged about 3°C and 2.5°C cooler thanin the plow and stubble mulch treatments,respectively (Figure 2). Because of poorplant stands, no-tillage had significantly
more surface soil water than the othertreatments between FGS 4 and FGS 7 (datanot shown). As the energy required towarm a wet soil is much greater than thatfor warming a dryer soil, it seems likely thatthe effects of surface residue and watercombined to keep no-tillage soiltemperatures cooler than the othertreatments. This effect would be especiallynotable during early spring following winterprecipitation, and when there is limitedcanopy.
10—March -AM
DATE
Fig. 2. Maximum 2 inch soil temperature in earlyspring as affected by tillage system. Each data pointrepresents average temperature for one week in ;1990-91 at Moro, Oregon.
Between FGS 4 and FGS 10, a generallinear decrease in soil water amongtreatments was measured (Figure 1) whichcorresponded to a rapid accumulation ofdry matter (Figure 3). Plant N uptake wasessentially completed in the plow andstubble mulch treatments by FGS 7,whereas in the no-tillage treatment plant Nuptake continued until FGS 10 (Figure 4).At flowering (FGS 10.5), visual signs ofwater stress (flag leaf rolling) werepronounced in the plow treatment, andapparent to a lesser degree in the stubblemulch treatment. Little water stress wasobserved in no-tillage plots. Thiscorresponds to significantly higher soilwater content in no-tillage plots comparedto the other treatments at FGS 10.5 (Fig.
51
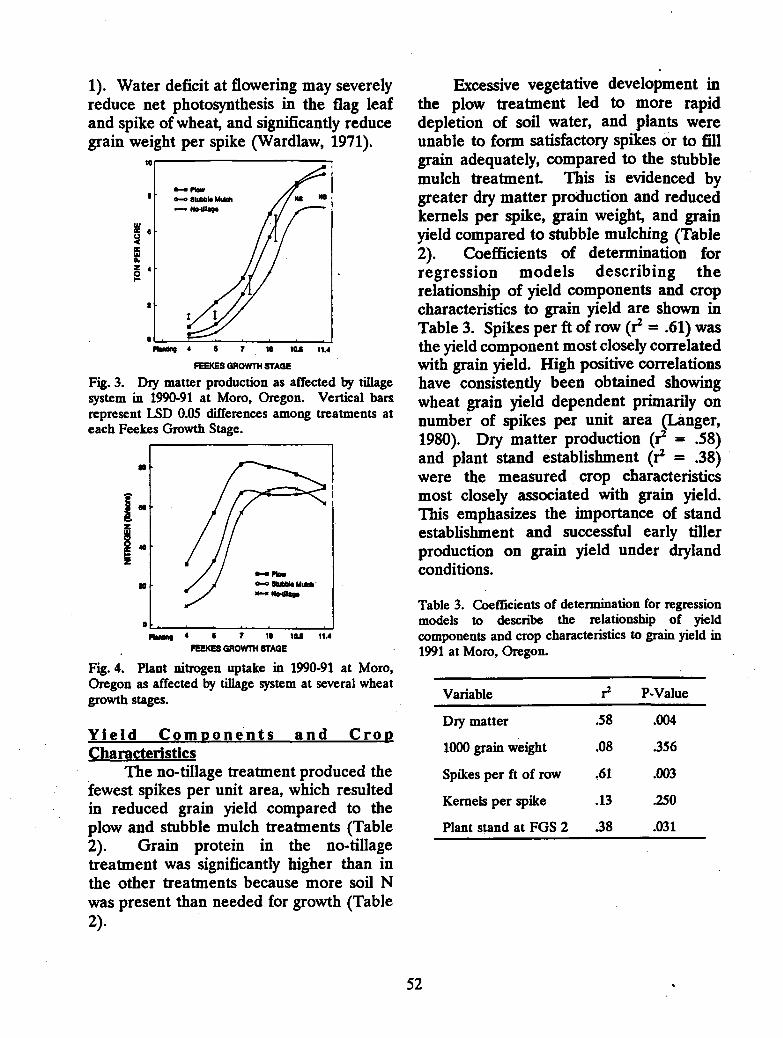
to
•
1). Water deficit at flowering may severelyreduce net photosynthesis in the flag leafand spike of wheat, and significantly reducegrain weight per spike (Wardlaw, 1971).
10
5 °cc
0.Z0
2
0Mins 4 5 7 10 10.0 11.4
FEEKES GROWTH STAGE
Fig. 3. Dry matter production as affected by tillagesystem in 1990-91 at Moro, Oregon. Vertical barsrepresent LSD 0.05 differences among treatments ateach Feekes Growth Stage.
Fig. 4. Plant nitrogen uptake in 1990-91 at Moro,Oregon as affected by tillage system at several wheatgrowth stages.
Yield Components and CropCharacteristics
The no-tillage treatment produced thefewest spikes per unit area, which resultedin reduced grain yield compared to theplow and stubble mulch treatments (Table2). Grain protein in the no-tillagetreatment was significantly higher than inthe other treatments because more soil Nwas present than needed for growth (Table2).
Excessive vegetative development inthe plow treatment led to more rapiddepletion of soil water, and plants wereunable to form satisfactory spikes or to fillgrain adequately, compared to the stubblemulch treatment. This is evidenced bygreater dry matter production and reducedkernels per spike, grain weight, and grainyield compared to stubble mulching (Table2). Coefficients of determination forregression models describing therelationship of yield components and cropcharacteristics to grain yield are shown inTable 3. Spikes per ft of row (r2 = .61) wasthe yield component most closely correlatedwith grain yield. High positive correlationshave consistently been obtained showingwheat grain yield dependent primarily onnumber of spikes per unit area (Langer,1980). Dry matter production (r2 = .58)and plant stand establishment (r 2 = .38)were the measured crop characteristicsmost closely associated with grain yield.This emphasizes the importance of standestablishment and successful early tillerproduction on grain yield under drylandconditions.
Table 3. Coefficients of determination for regressionmodels to describe the relationship of yieldcomponents and crop characteristics to grain yield in1991 at Moro, Oregon.
Variable r2 P-Value
My matter .58 .004
1000 grain weight .08 .356
Spikes per ft of row .61 .003
Kernels per spike .13 .250
Plant stand at FGS 2 .38 .031
52
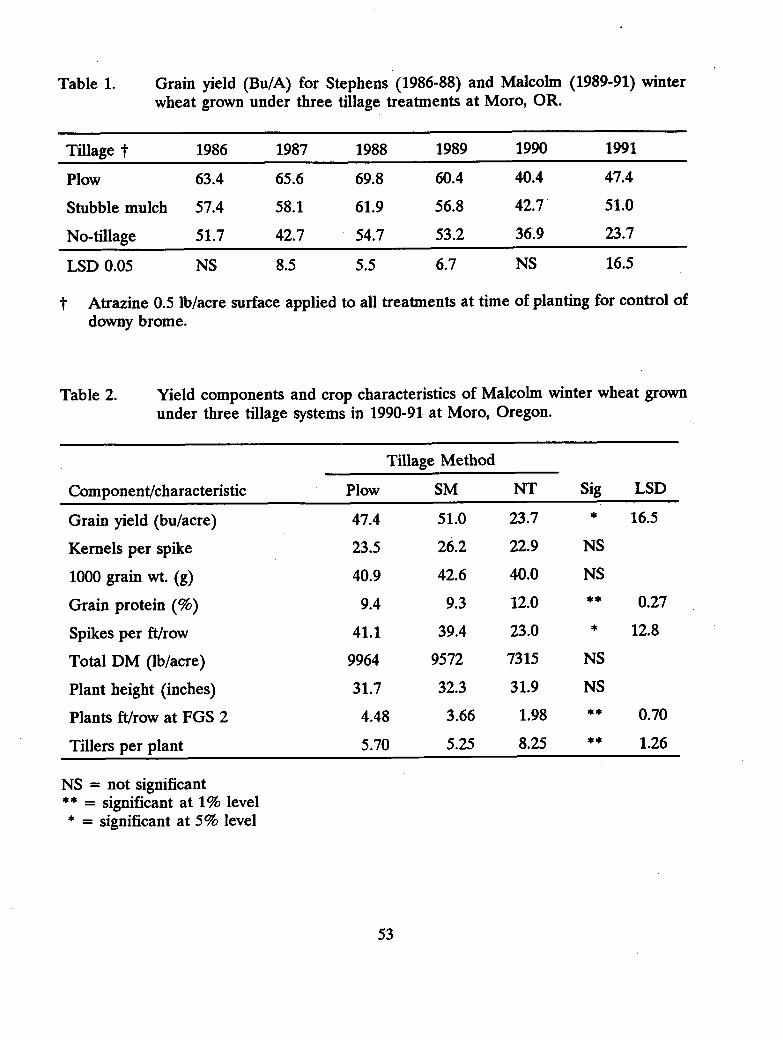
Table 1. Grain yield (Bu/A) for Stephens (1986-88) and Malcolm (1989-91) winterwheat grown under three tillage treatments at Moro, OR.
Tillage t 1986 1987 1988 1989 1990 1991
Plow 63.4 65.6 69.8 60.4 40.4 47.4
Stubble mulch 57.4 58.1 61.9 56.8 42.7 51.0
No-tillage 51.7 42.7 54.7 53.2 36.9 23.7
LSD 0.05 NS 8.5 5.5 6.7 NS 16.5
t Atrazine 0.5 lb/acre surface applied to all treatments at time of planting for control ofdowny brome.
Table 2. Yield components and crop characteristics of Malcolm winter wheat grownunder three tillage systems in 1990-91 at Moro, Oregon.
Tillage Method
Component/characteristic Plow SM NT Sig LSD
Grain yield (bu/acre) 47.4 51.0 23.7 * 16.5
Kernels per spike 23.5 26.2 22.9 NS
1000 grain wt. (g) 40.9 42.6 40.0 NS
Grain protein (%) 9.4 9.3 12.0 ** 0.27
Spikes per ft/row 41.1 39.4 23.0 * 12.8
Total DM (lb/acre) 9964 9572 7315 NS
Plant height (inches) 31.7 32.3 31.9 NS
Plants ft/row at FGS 2 4.48 3.66 1.98 ** 0.70
Tillers per plant 5.70 5.25 8.25 ** 1.26
NS = not significant** = significant at 1% level* = significant at 5% level
53
CONCLUSIONS
No-tillage winter wheat has producedlower grain yields than winter wheat grownin either plow or stubble mulch tillage plotsfor six consecutive years at Moro. Themain limitations to no-tillage soilmanagement compared to other tillagetreatments during the 1990-91 season were:1) diminished seedzone water at time ofplanting that resulted in reducedgermination and stand establishment; 2)cooler spring soil temperatures that slowedcrop development and dry matteraccumulation, and; 3) production of fewerspikes per unit area.
No-tillage management is optimum forsoil erosion control, and is being acceptedas an alternative system of crop productionin many parts of the world. Grain yieldreductions associated with no-tillage,however, may limit its potential for thewheat-fallow cropping system in the PacificNorthwest.
REFERENCES
Langer, R.H.M. 1980. Growth of the grassplant in relation to seed production. Proc.New Zealand Grassland Association Conf.Canterbury, New Zealand. Nov. 13-15.
Oveson, M.M. and A.P. Appleby. 1971.Influence of tillage management in astubble mulch fallow-winter wheat rotation with herbicide weed control. Agron. J.63:19-20.
Wardlaw, I.F. 1971. The early stages ofgrain development in wheat: response towater stress in a single variety. Aust. J.Biol. Sci. 24:1047-1055.
54
TILLAGE, SEED SIZE, AND SEEDDENSITY EFFECTS ON EARLY
PLANT DEVELOPMENT AND GRAINYIELD OF WINTER WHEAT
C. L. Douglas, Jr, D. E. Wilkins,R. W. Smiley, and D. B. Churchill
INTRODUCTION
Cereal residues left on or near the soilsurface are often blamed for poor winterwheat seedling emergence and early growth.This has been attributed to moistmicroenvironments with decreased soiltemperatures (Barlow et al., 1977),increased disease incidence, such as take-all,Pythium root rot and Rhizoctonia root rot(Cook and Veseth, 1991), phytotoxicsubstances derived from plant residues(Cochran et al., 1977), "hair pinning" ofresidue by seeders resulting in poor seed-soil contact (Hyde et al., 1987), and slowuptake of water by seeds because of theaqueous substances from plant residues(Krogmeier and Bremner, 1989).
Mian and Nafziger (1992) found nodifferences in emergence or production offertile tillers between small seeds and largeseeds of soft red winter wheat. Peterson etal., (1989) found seed size had nosignificant influence on emergence whenintact seeds of soft white winter wheat wereused. Chastain and Ward (1992) foundlarge seed emerged faster than small seeds,but there were no yield differences.However, other published reports suggestlarger seeds increase yields (Bulisani andWarner, 1980; Ries and Everson, 1973)
Objectives of this study were todetermine if early development and grainyield of soft white winter wheat wererelated to tillage and seed size, and density.
MATERIALS AND METHODS
Commercially processed Stephenswinter wheat grains were subdivided withslotted sieves (Table 1) into three sizes(large, medium, small). Each size was thensubdivided on a gravity table(Kamas/Westrap model LALS) at theNational Forage Seed Production ResearchCenter in Corvallis, OR., intoapproximately three equal portions (dense,medium, light). Seeds selected from sizeand density categories, large dense, largelight, small dense, small light and normalmix (non-separated) were field tested.
Table 1. Minimum sieve sizes used forseed separation.
Minimum sieveSeedsize size
(inches)
Large 8/64 by 3/4
Medium 7/64 by 3/4
Small
5.5/64 by 3/4
Normal
Not sieved
Seed size treatments were planted in aWalla Walla silt loam soil in a split-plotexperimental design with moldboardplowing and no-tillage as main plots, andseed size and density as subplots. In 1990,the plots were irrigated on Aug. 29 andSept. 10 because the previous wheat crophad depleted the soil moisture. Tillage plotswere moldboard plowed and disc harrowedon Sept. 18, 1990. In 1991, there was nopre-irrigation as plots were placed in a fieldthat had been chemical-fallowed for oneyear following winter wheat. Tillage plotswere moldboard plowed in Sept. 1991, and
55
disc harrowed prior to seeding. Wheat wasseeded in both 1990 and 1991 on Sept. 24,with a John Deere model HZ deep furrowdrill, calibrated to plant 23 seeds per foot ofrow, in rows spaced 16 in. apart (17seeds/fe) for each seed treatment. Starterfertilizer (12 lbs. N as Solution 32, 7.6 lbs Pas Polyphosphate, and 13 lbs. S as Thiosul)was applied at seeding in the fall of 1991.Nitrogen fertilizer (80 lbs N as ammoniumnitrate) was broadcast on the surface afterthe 5 to 6 leaf stage samples were taken inthe spring in both 1991 and 1992. Soilsamples were taken both years at seeding todetermine gravimetric soil water content.
At the 5 to 6 leaf developmental stage,whole plants, including roots, from 3.3 ft. ofrow were collected, washed, total number ofplants were determined, and 20 plants wererandomly selected from each sample forshoot and root observations. Above grounddry weights, plant heights, and crown andseed depths were evaluated, as well asHaun value and number of tillers asdescribed by Klepper et al. (1982). Numberof seminal roots, total number of rootsbisecting lines 1.2 inches and 2 inches belowthe seed, and number of disease-prunedroots were determined.
Thirteen ft of row from each plot werehand harvested to determine number ofheads per unit area, and grain yield.
RESULTS AND DISCUSSION
In 1991, when soil moisture wasadequate, there was no significantdifference between plow and no-till for anymeasured parameter, except number ofroots at the five to six leaf stage ofdevelopment (Table 2). This was not true in1992 when seed zone moisture wasmarginal. Even though there was less seedzone moisture in tilled plots, plantsemerged faster, had more first tillers, better
seminal root systems, and significantlyhigher grain yield (Table 2).
There were no significant differences inany measured parameters in 1991 as aresult of seed size and density. In 1992,small light seed emerged faster 11 daysafter seeding (data not shown). Small lightseed may germinate and emerge quicklybecause the small amount of materialpresent would reach the threshold watercontent required for initiation ofgermination more quickly than large seed.However, there were no differences innumber of plants emerged 21 days afterseeding (Table 3). Even though there wereno significant grain yield differences in1992, small light seed had more seminalroot axes and branches at 1.2 and 2 inchesbelow the seed, and fewer disease prunedroots than any other treatment at the 5 to6 leaf development stage. This may be theresult of the rapid early growth in the first11 days after seeding, which helped the rootsystems resist diseases.
CONCLUSIONS
Tillage, seed size, and seed density hadno significant effect on early growth anddevelopment, or grain yield in 1991 whensoil moisture was adequate. When soilmoisture was marginal in all treatments in1992, tillage significantly affectedemergence, leaf numbers, early tillerdevelopment, number and branching ofseminal roots, disease pruned roots, andgrain yield. Seed size and densitysignificantly affected only number of leavesabove ground and root branching belowground. Light seed, specifically small lightseed, emerged faster and had more seminalroots and greater branching of seminalroots than other seed treatments. However,there were no yield differences as a resultof seed size and density.
56
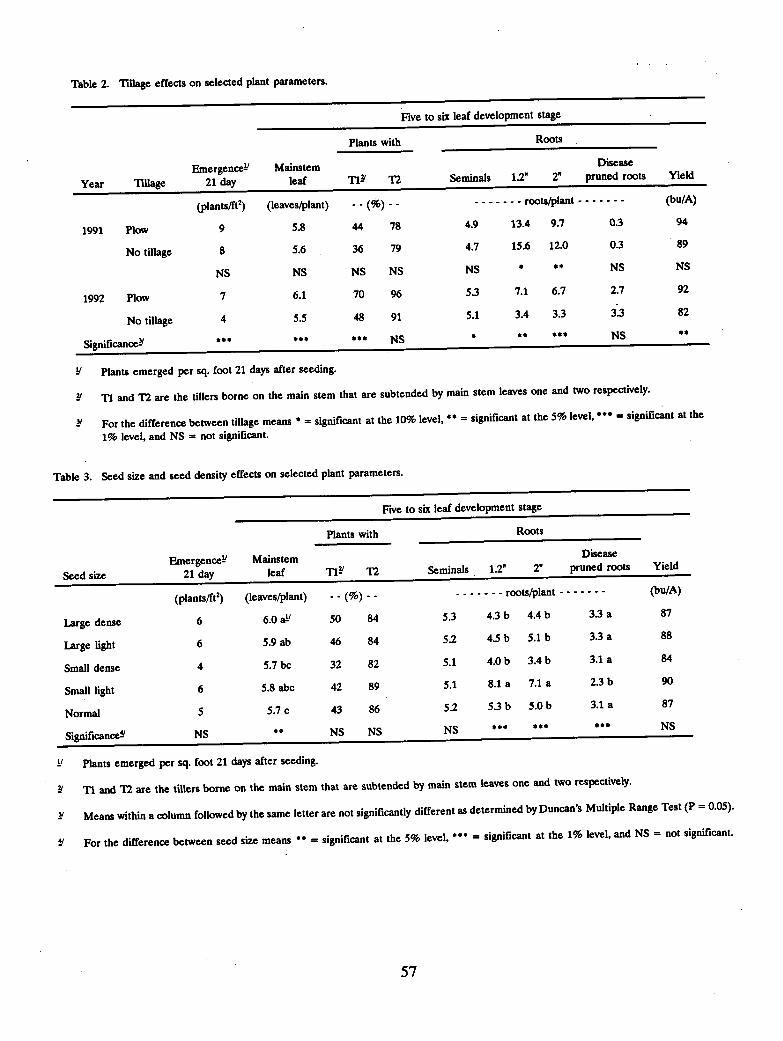
Table 2. Tillage effects on selected plant parameters.
Five to six leaf development stage
Plants with Roots
Emergence' Mainstem Disease
Year Tillage 21 day leaf Tle T2 Seminals 1.2" 2" pruned roots Yield
(plants/ft2) (leaves/plant) - - (%) - - roots/plant (bu/A)
1991 Plow 9 5.8 44 78 4.9 13.4 9.7 0.3 94
No tillage 8 5.6 36 79 4.7 15.6 12.0 0.3 89
NS NS NS NS NS • •• NS NS
1992 Plow 7 6.1 70 96 5.3 7.1 6.7 2.7 92
No tillage 4 5.5 48 91 5.1 3.4 3.3 3.3 82
Significance- ••• ••• ••• NS • •• ••• NS ••
Plants emerged per sq. foot 21 days after seeding.
T1 and T2 are the tillers borne on the main stem that are subtended by main stem leaves one and two respectively.
For the difference between tillage means • = significant at the 10% level, = significant at the 5% level, ••• = significant at the1% level, and NS = not significant.
Table 3. Seed size and seed density effects on selected plant parameters.
Five to six leaf development stage
Plants with Roots
Seed sizeEmergence' Mainstem Disease
21 day leaf T13/ 12 Seminals 1.2" 2" pruned roots Yield
(plants/ft2) (leaves/plant) - - (%) - - roots/plant (bu/A)
Large dense 6 6.0 aLl50 84 5.3 4.3 b 4.4 b 3.3 a 87
Large light 6 5.9 ab 46 84 52 4.5 b 5.1 b 3.3 a 88
Small dense 4 5.7 be 32 82 5.1 4.0 b 3.4 b 3.1 a 84
Small light 6 5.8 abc 42 89 5.1 8.1 a 7.1 a 2.3 b 90
Normal 5 5.7 c 43 86 5.2 5.3 b 5.0 b 3.1 a 87
Significance' NS •• NS NS NS ••• ••• ••• NS
Plants emerged per sq. foot 21 days after seeding.
T1 and 12 are the tillers borne on the main stem that are subtended by main stem leaves one and two respectively.
Means within a column followed by the same letter are not significantly different as determined by Duncan's Multiple Range Test (P = 0.05).
For the difference between seed size means •• = significant at the 5% level, ••• = significant at the 1% level, and NS = not significant.
57
REFERENCES
Barlow, E.W.R., L. Boersma, and J.L.Young. 1977. Photosynthesis,transpiration, and leaf elongation in cornseedlings at suboptimal soil temperatures.Agron. J. 69:95-100.
Bulisani, E.A. and R.L. Warner. 1980.Seed protein and nitrogen effects uponseedling vigor in wheat. Agron. J. 72:657-662.
Chastain, T.G. and K.J. Ward. 1992.Cereal emergence and establishment inconservation tillage systems. pp. 18-23. In(ed, T.G. Chastain, chair) Columbia BasinAgricultural Research, Special Report 894.OSU, USDA-ARS.
Cochran, V.L., L.F. Elliott, and R.I.Papendick. 1977. The production ofphytotoxins from surface crop residues.Soil Sci. Soc. Amer. J. 41:903-908.
Cook, J.R. and R.J. Veseth. 1991. Wheathealth management. APS Press, The Amer.Phytopath. Soc.
Hyde, G.D., D. Wilkins, K.E. Saxton, J.E.Hammel, G. Swanson, R. Hermanson, E.Dowking, J. Simpson, and C. Peterson.1987. Reduced tillage seeding equipmentdevelopment. pp. 41-56. In: L.L. Elliott(ed.) STEEP-Conservation concepts andaccomplishments. Washington State Univ.Publications, Pullman, WA.
Klepper, B., R.W. Rickman, and C.M.Peterson. 1982. Quantativecharacterization of vegetative developmentin small cereal grains. Agron. J. 74:789-792.
Krogmeier, M.J. and J.M. Bremner. 1989.Effects of water-soluble constituents ofplant residues on water uptake by seeds.Commun. in Soil Sci. Plant Anal. 20:1321-1333.
Mian, A.R. and E.D. Nafziger. 1992. Seedsize effects on emergence, head number,and grain yield of winter wheat. J. Prod.Agric. 5:265-268.
Peterson C.M., B. Klepper, and R.W.Rickman. 1989. Seed reserves andseedling development in winter wheat.Agron. J. 81:245-251.
Ries, S.K. and E.H. Everson. 1973. Proteincontent and seed size relationships withseedling vigor of wheat cultivars. Agron J.65:884-886.
ACKNOWLEDGEMENT
The authors gratefully acknowledge thetechnical assistance of Tami Toll, DarylHaasch, Les Ekin, and Douglas Bilsland.
58
ANNUAL SPRING BARLEY INHIGH- AND LOW-RESIDUE
TILLAGE SYSTEMS
Richard Smiley and Dale Wilkins
Annual spring barley may reduce soilerosion on highly erodible fields withoutsignificantly compromising the income fromtraditional winter wheat/summer fallowrotations (Young and van Kooten, 1989).During the first one or two years of annualcropping, barley yields are typicallycomparable for conventional tillage(autumn or spring plow with springdisking), minimum tillage (autumn chiselwith a spring disking), and no-tillage (directdrilling in standing or flailed stubble)systems (Reinertsen et al., 1983).Unfortunately recropped spring barleyyields tend to decline after two or moreyears due to damage from root diseases.Yield decline is more pronounced in fieldsthat are most protected from erosion withhigh amounts of surface residue.
Rhizoctonia root rot, common root rot,and take-all are of particular importance onannual barley in regions with low rainfall (9to 15 inches annual precipitation).Rhizoctonia root rot is notable for causingthe greatest root damage in the absence oftillage (Pumphrey et al., 1987; Weller et al.,1986). However, it has been our experiencewith winter wheat that yield is not alwaysdirectly related to the severity ofRhizoctonia root rot. Highest wheat yieldshave been measured with some cropmanagement systems that also had the mostsevere root rot.
The objective of this study was todetermine the effects of tillage history onroot diseases, crop growth anddevelopment, and grain yield during fouryears of annual spring barley production at
two locations. A full-length technicalversion of this work is being published(Smiley and Wilkins, 1993).
METHODS
Plots were located on two farms inUmatilla County. The Wolfe farm has a30-inch deep Condon silt loam in a 12-inch/year precipitation zone eight milessouthwest of Pendleton. The field hadbeen used for no-till annual spring orwinter barley for four years before ourexperiment began. The Thompson farmhad a deep (>5 feet) Walla Walla silt loamin a 14-inch/year precipitation zone 15miles north of Pendleton. The field had along history of wheat/fallow rotation, usinga chisel plow for primary tillage. •
An experiment was designed in 1987 torespond to needs created by the UnitedStates Food Security Act of 1985. TheUSDA-Soil Conservation Service neededinformation on frequency of plowingrequired to suppress Rhizoctonia root rot inotherwise no-till management systems.Annual spring barley was used to answerthis question because barley is moresusceptible than wheat to Rhizoctonia rootrot.
Randomized complete blocks (32 x 150ft) with four replicates were established.Treatments included four years of no-till,four years of conventional tillage, andplowing one, two, three, or one and twoyears before a final crop of barley wasproduced without tillage during 1990 (seeTable 1).
Plowing was done in the autumn anddisking was done immediately beforeplanting, in March. Roundup was appliedtwo to 15 days before planting Steptoebarley in mid-March. Planting was done
59
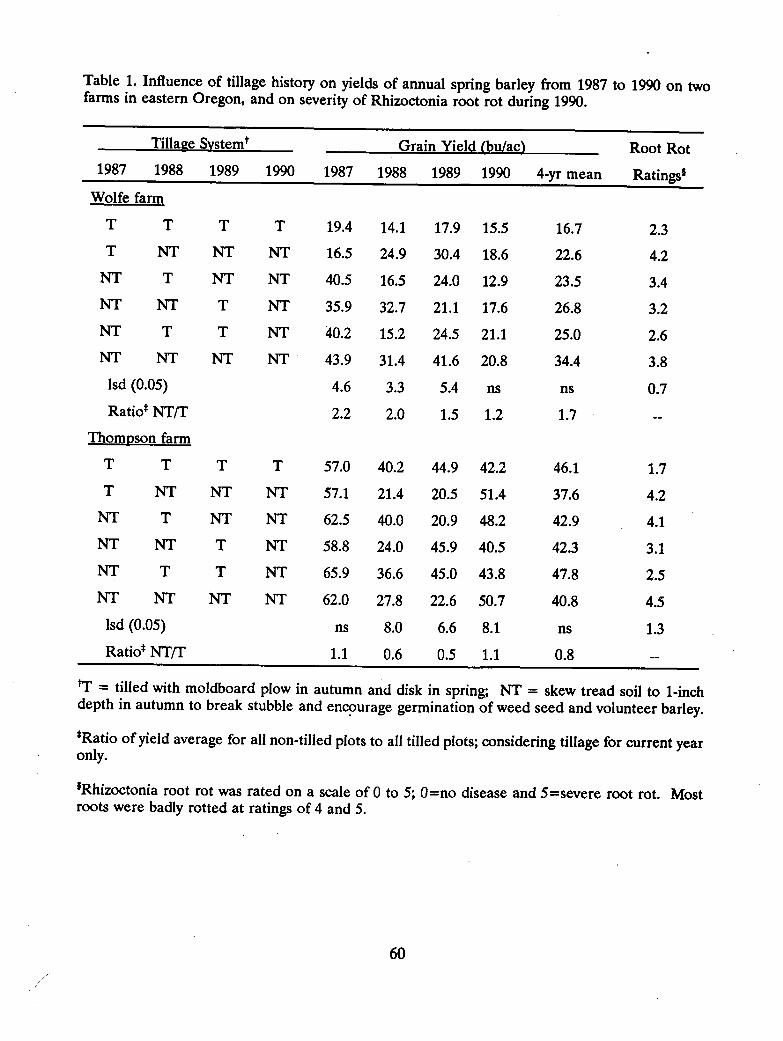
Table 1. Influence of tillage history on yields of annual spring barley from 1987 to 1990 on twofarms in eastern Oregon, and on severity of Rhizoctonia root rot during 1990.
Tillage System* Grain Yield (bu/ac) Root Rot
Ratingsi1987 1988 1989 1990 1987 1988 1989 1990 4-yr mean
Wolfe farm
T T T T 19.4 14.1 17.9 15.5 16.7 2.3T NT NT NT 16.5 24.9 30.4 18.6 22.6 4.2
NT T NT NT 40.5 16.5 24.0 12.9 23.5 3.4
NT NT T NT 35.9 32.7 21.1 17.6 26.8 3.2NT T T NT 40.2 15.2 24.5 21.1 25.0 2.6NT NT NT NT 43.9 31.4 41.6 20.8 34.4 3.8
lsd (0.05) 4.6 3.3 5.4 ns ns 0.7
Ratios NT/T 2.2 2.0 1.5 1.2 1.7
Thompson farm
T T T T 57.0 40.2 44.9 42.2 46.1 1.7T NT NT NT 57.1 21.4 20.5 51.4 37.6 4.2
NT T NT NT 62.5 40.0 20.9 48.2 42.9 4.1NT NT T NT 58.8 24.0 45.9 40.5 42.3 3.1
NT T T NT 65.9 36.6 45.0 43.8 47.8 2.5
NT NT NT NT 62.0 27.8 22.6 50.7 40.8 4.5
lsd (0.05) ns 8.0 6.6 8.1 ns 1.3
Ratio* NT/T 1.1 0.6 0.5 1.1 0.8
sT = tilled with moldboard plow in autumn and disk in spring; NT = skew tread soil to 1-inchdepth in autumn to break stubble and encourage germination of weed seed and volunteer barley.
*Ratio of yield average for all non-tilled plots to all tilled plots; considering tillage for current yearonly.
1Rhizoctonia root rot was rated on a scale of 0 to 5; 0=no disease and 5=severe root rot. Mostroots were badly rotted at ratings of 4 and 5.
60
with a John Deere model HZ drillequipped with Wilkins slit openers. Rowspacing was 16 inches, with liquid Uran(urea-ammonium nitrate; at 50 lb N/acre)plus Thiosol (10 lb S/acre) placed twoinches below the seed. A rain gauge andthermograph were used to monitorprecipitation and temperature at each site.Soil samples at one-foot increments fromthe surface to basalt were collectedimmediately after planting fordetermination of soil water.
The entire plot area was treatedannually, during May, with Bronate tocontrol broadleaf weeds. Benlate PNW wasapplied during May 1989 to suppress asevere epidemic of scald. Di-Syston wasapplied by air during May 1989 to suppressdamage from the Russian wheat aphid.
Seedlings were removed from each plotfor growth and disease assessments duringmid-spring. Growth parameters includedplant height, shoot weight, main-stem leafnumber, tillers per plant, and numbers ofseminal and coronal root axes crossing aplane one inch below the seed. Diseaseassessments included Rhizoctonia root rot,take-all, common root rot, and Pythiumroot rot. Percentages of stunted plantswere measured after head emergence, anda plot combine was used to measure grainyield.
RESULTS
Rhizoctonia root rot was always moresevere when barley was produced withouttillage than with tillage. Rhizoctonia rootrot was most severe in treatments with twoor more years of continuous no-till, leastsevere where soil was plowed every year,and intermediate where soil was plowedone year prior to the no-till spring barleycrop. Root rot was less when soil was
plowed during two consecutive years ratherthan only one year before a no-till crop.Pythium root rot and common root rotaffected more plants in continuously plowedsoil than in no-till soil at the Wolfe farm.Common root rot was essentially absent atthe Thompson farm, and the incidence ofPythium root rot did not appear to beaffected by tillage treatments. Take-all wasmost severe in the continuously plowedtreatment at the Wolfe farm, but did notoccur in the same treatment at theThompson farm. Overall, the barley plantsin the continuously plowed treatment at theWolfe farm had a broader and more severeroot disease complex than plants producedwithout tillage. Differences were reversedat the Thompson farm.
Shoot weight and height, plant growthstage, tiller development, and numbers ofroots were not affected by tillagetreatments at the Wolfe farm, but all werestrongly increased by tillage, compared tono tillage, at the Thompson farm. Stuntingof plants in the mature crop was moresevere with no-till than with tillage at bothsites. No-till barley usually matured two tothree weeks later than barley produced withconventional tillage.
Grain yields for barley were nearlyalways higher in no-till than tilled plots atthe Wolfe farm (Table 1). The yield in thecontinuous no-till plot always exceeded thatin the continuously tilled plot. Theserelationships also occurred during two offour years at the Thompson farm. Thefour-year mean grain yields for theseexperiments did not differ significantly, butthere appeared to be a yield advantage forthe no-till treatment at the Wolfe farm.Yields of no-till barley at both locationsincreased with cumulative number of yearsin no-till (Fig. 1).
61
The Thompson farm had moreprecipitation than the Wolfe farm during1987 (2.7 inches), 1988 (1.5 inches), and1990 (1.5 inches). The Wolfe farm had 2inches more precipitation than theThompson farm during 1989, which was thewettest year at both farms.
Quantity of water in the soil profilewhen each treatment was planted had noconsistent relationship with grain yield ateither experimental site during three yearsof evaluation. There was no significantdifference in amount of stored waterbetween tilled and non-tilled treatmentsduring 1988, 1989, and 1990 at the Wolfefarm, but non-tilled treatments at theThompson farm had more stored water in1989 and 1990. Yields per unit of storedwater in tilled plots were higher at theThompson farm than at the Wolfe farm,but were comparable in no-till plots at bothlocations.
Growing degree days did not differbetween farms, and was not correlated withdisease severity or yield parameters.
DISCUSSION
Rhizoctonia root rot was always moresevere in barley grown without tillage thanwith tillage, but grain yield was not relatedto the severity of this disease. Take-all,Pythium root rot, and common root rotwere each relatively minor in all six tillagesystems, but each disease was moreprevalent in tilled than non-tilled soil at theWolfe site, where tillage clearly suppressedyield of annual spring barley. Thecombined root disease complex in tilled soilappears to have had a more negative impacton yield than the singular effect ofRhizoctonia root rot in non-tilled soil.
Other management practices for our
experiment were also partially responsiblefor the absence of a direct associationbetween grain yield and Rhizoctonia rootrot. Disking soil shortly before plantingsometimes caused a larger loss of soil waterfrom tilled than non-tilled soil. At theThompson farm more stored water wasmeasured in non-tilled than tilled plotsduring 1989 and 1990, but not 1988. It isof interest that 1988 was the year in whichgrain yields in tilled plots were almostdouble the yields in the non-tilled soil atthe Thompson site. Increased amounts ofstored water in the non-tilled soil during1989 and 1990 appeared to havecompensated for the higher damage byRhizoctonia root rot in that treatment.
Roundup was used to kill volunteerbarley and weeds before planting. Theherbicide was applied two or 16 days beforeplanting during 1989 or 1990, respectively.In other experiments (Smiley et al., 1992)root rot of barley was dramaticallyincreased when Roundup was applied toRhizoctonia-infected volunteer plantsseveral days before planting. Diseaseseverity decreased as the timing wasincreased between herbicide application andplanting barley. This process was namedthe green-bridge relationship. The timinginterval affected the efficiency by which thepathogen moved from roots of dying plantsto roots of newly emerging plants. Thegreen bridge was not caused by herbicideresidue or phytotoxicity to the barley crop.We also reported that the green-bridgeeffect could be reduced or eliminated atsome sites by tilling soil after applyingRoundup, but before planting spring barley.It is probable, therefore, that disking soilsshortly before planting created off-settingeffects on barley growth and productivity.Disking negated the herbicide-relatedincrease in root rot but also reduced theamount of soil water available for seed
62
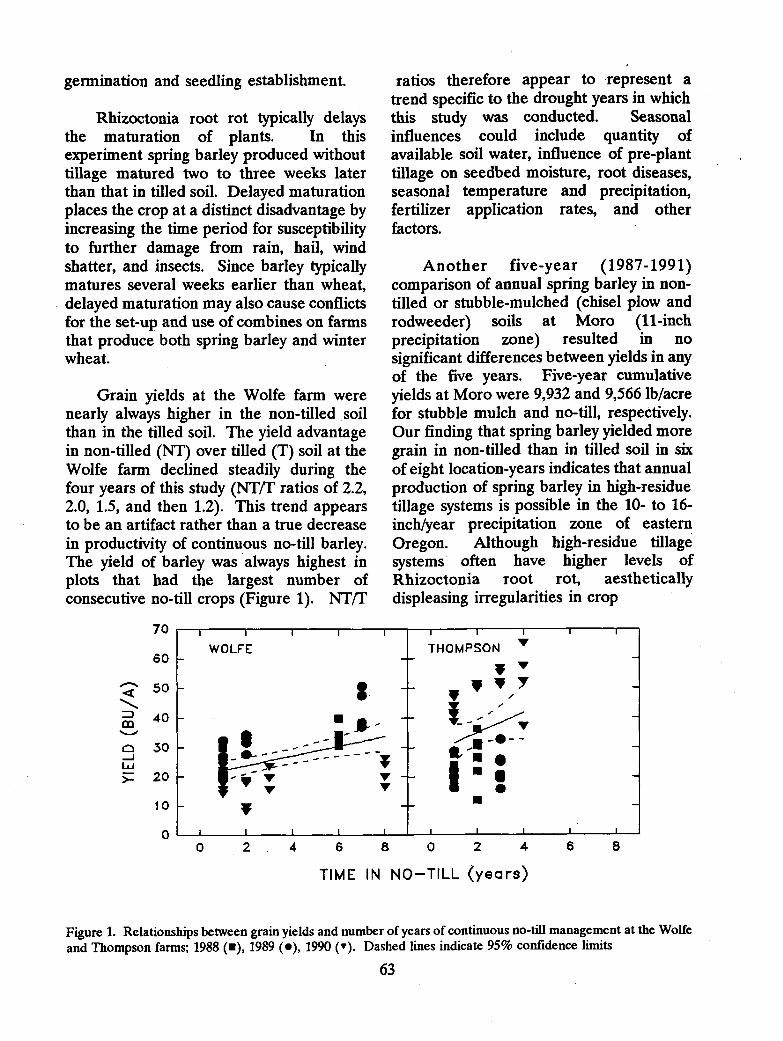
germination and seedling establishment.
Rhizoctonia root rot typically delaysthe maturation of plants. In thisexperiment spring barley produced withouttillage matured two to three weeks laterthan that in tilled soil. Delayed maturationplaces the crop at a distinct disadvantage byincreasing the time period for susceptibilityto further damage from rain, hail, windshatter, and insects. Since barley typicallymatures several weeks earlier than wheat,delayed maturation may also cause conflictsfor the set-up and use of combines on farmsthat produce both spring barley and winterwheat.
Grain yields at the Wolfe farm werenearly always higher in the non-tilled soilthan in the tilled soil. The yield advantagein non-tilled (NT) over tilled (T) soil at theWolfe farm declined steadily during thefour years of this study (NT/T ratios of 2.2,2.0, 1.5, and then 1.2). This trend appearsto be an artifact rather than a true decreasein productivity of continuous no-till barley.The yield of barley was always highest inplots that had the largest number ofconsecutive no-till crops (Figure 1). NT/T
ratios therefore appear to represent atrend specific to the drought years in whichthis study was conducted. Seasonalinfluences could include quantity ofavailable soil water, influence of pre-planttillage on seedbed moisture, root diseases,seasonal temperature and precipitation,fertilizer application rates, and otherfactors.
Another five-year (1987-1991)comparison of annual spring barley in non-tilled or stubble-mulched (chisel plow androdweeder) soils at Moro (11-inchprecipitation zone) resulted in nosignificant differences between yields in anyof the five years. Five-year cumulativeyields at Moro were 9,932 and 9,566 lb/acrefor stubble mulch and no-till, respectively.Our finding that spring barley yielded moregrain in non-tilled than in tilled soil in sixof eight location-years indicates that annualproduction of spring barley in high-residuetillage systems is possible in the 10- to 16-inch/year precipitation zone of easternOregon. Although high-residue tillagesystems often have higher levels ofRhizoctonia root rot, aestheticallydispleasing irregularities in crop
0
4 6 8 0 2
4
6
8
TIME IN NO—TILL (years)
Figure 1. Relationships between grain yields and number of years of continuous no-till management at the Wolfeand Thompson farms; 1988 ( n), 1989 (•), 1990 (•). Dashed lines indicate 95% confidence limits
63
appearance, and a delay in crop maturation,we conclude that annual spring barleyproduction systems are likely to be moreaffected by weed management than bydisease.
ACKNOWLEDGEMENTS
We wish to acknowledge technicalassistance by many staff members at theOSU Columbia Basin Agricultural ResearchCenter (Pendleton and Moro) and theUSDA Columbia Plateau ConservationResearch Center. Land donations by KenThompson and Dwight Wolfe and financialassistance by the Oregon WheatCommission, Western Regional CompetitiveIPM Project 161, and Pacific NorthwestSTEEP Program were appreciated.
REFERENCES ANDFURTHER READING
Lucas, P., Smiley, R. W., and Collins, H. P.1993. Decline of Rhizoctonia root rot onwheat in soils infested with Rhizoctoniasolani AG-8. Phytopathology 83:(in press).
Pumphrey, F. V., Wilkins, D. E., Hane, D.C., and Smiley, R. W. 1987. Influence oftillage and nitrogen fertilizer onRhizoctonia root rot (bare patch) of winterwheat. Plant Disease 71:125-127.
Reinertsen, S. A., Cilia, A. J., and Engle, C.1983. Yields of four spring barley varietiesin conventional, minimum, and no-tillagesystems. Washington State UniversityExtension Bulletin 1093.
Smiley, R. W., and Wilkins, D. E. 1992.Impact of sulfonylurea herbicides onRhizoctonia root rot, growth, and yield ofwinter wheat. Plant Disease 76:399-404.
Smiley, R. W., and Wilkins, D. E. 1993.Annual spring barley growth, yield, androot rot in high- and low-residue tillagesystems. Journal of Production Agriculture6:(in press).
Smiley, R. W., Ogg, A. G., Jr., and Cook,R. J. 1992 Influence of glyphosate onRhizoctonia root rot, growth, and yield ofbarley. Plant Disease 76:937-942.
Weller, D. M., Cook, R. J., MacNish, G.,Bassett, E. N., Powelson, R. L., andPeterson, R. R. 1986. Rhizoctonia root rotof small grains favored by reduced tillage inthe Pacific Northwest. Plant Disease70:70-73.
Young, D. L., and van Kooten, G. C. 1989.Economics of flexible spring cropping in asummer fallow region. Journal ofProduction Agriculture 2:173-178.
•
64
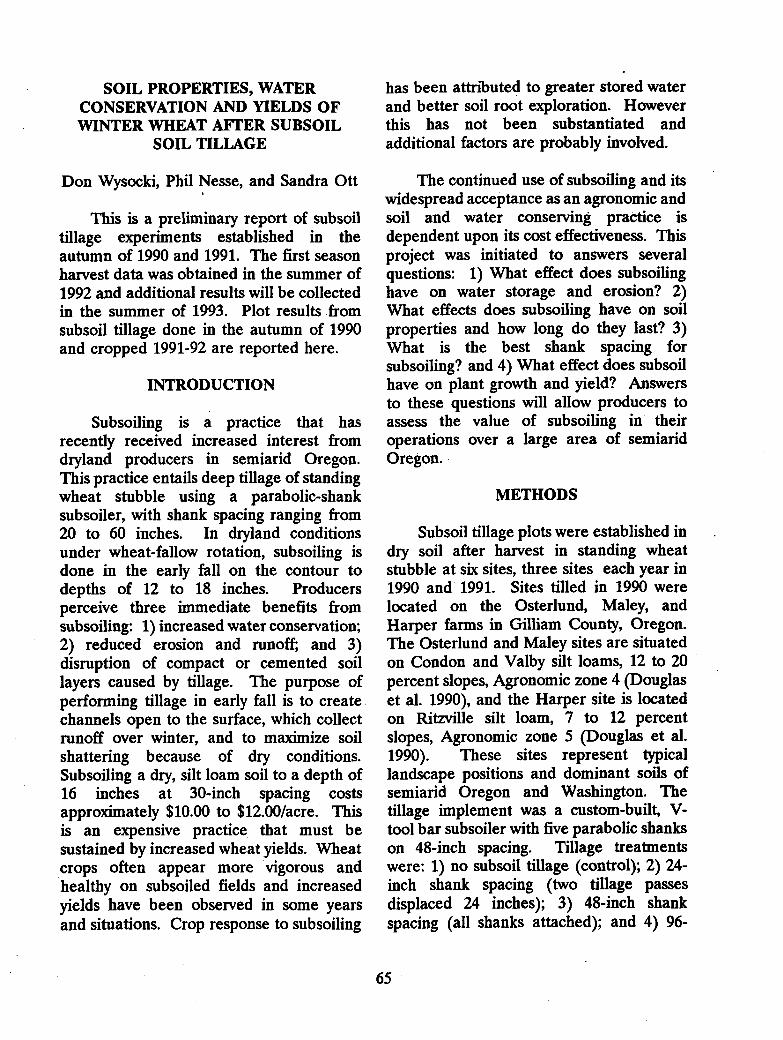
SOIL PROPERTIES, WATERCONSERVATION AND YIELDS OFWINTER WHEAT AFTER SUBSOIL
SOIL TILLAGE
Don Wysocki, Phil Nesse, and Sandra Ott
This is a preliminary report of subsoiltillage experiments established in theautumn of 1990 and 1991. The first seasonharvest data was obtained in the summer of1992 and additional results will be collectedin the summer of 1993. Plot results fromsubsoil tillage done in the autumn of 1990and cropped 1991-92 are reported here.
INTRODUCTION
Subsoiling is a practice that hasrecently received increased interest fromdryland producers in semiarid Oregon.This practice entails deep tillage of standingwheat stubble using a parabolic-shanksubsoiler, with shank spacing ranging from20 to 60 inches. In dryland conditionsunder wheat-fallow rotation, subsoiling isdone in the early fall on the contour todepths of 12 to 18 inches. Producersperceive three immediate benefits fromsubsoiling: 1) increased water conservation;2) reduced erosion and runoff; and 3)disruption of compact or cemented soillayers caused by tillage. The purpose ofperforming tillage in early fall is to createchannels open to the surface, which collectrunoff over winter, and to maximize soilshattering because of dry conditions.Subsoiling a dry, silt loam soil to a depth of16 inches at 30-inch spacing costsapproximately $10.00 to $12.00/acre. Thisis an expensive practice that must besustained by increased wheat yields. Wheatcrops often appear more vigorous andhealthy on subsoiled fields and increasedyields have been observed in some yearsand situations. Crop response to subsoiling
has been attributed to greater stored waterand better soil root exploration. Howeverthis has not been substantiated andadditional factors are probably involved.
The continued use of subsoiling and itswidespread acceptance as an agronomic andsoil and water conserving practice isdependent upon its cost effectiveness. Thisproject was initiated to answers severalquestions: 1) What effect does subsoilinghave on water storage and erosion? 2)What effects does subsoiling have on soilproperties and how long do they last? 3)What is the best shank spacing forsubsoiling? and 4) What effect does subsoilhave on plant growth and yield? Answersto these, questions will allow producers toassess the value of subsoiling in theiroperations over a large area of semiaridOregon.
METHODS
Subsoil tillage plots were established indry soil after harvest in standing wheatstubble at six sites, three sites each year in1990 and 1991. Sites tilled in 1990 werelocated on the Osterlund, Maley, andHarper farms in Gilliam County, Oregon.The Osterlund and Maley sites are situatedon Condon and Valby silt loams, 12 to 20percent slopes, Agronomic zone 4 (Douglaset al. 1990), and the Harper site is locatedon Ritzville silt loam, 7 to 12 percentslopes, Agronomic zone 5 (Douglas et al.1990). These sites represent typicallandscape positions and dominant soils ofsemiarid Oregon and Washington. Thetillage implement was a custom-built, V-tool bar subsoiler with five parabolic shankson 48-inch spacing. Tillage treatmentswere: 1) no subsoil tillage (control); 2) 24-inch shank spacing (two tillage passesdisplaced 24 inches); 3) 48-inch shankspacing (all shanks attached); and 4) 96-
65

inch shank spacing (2nd and 4th shanksremoved). The experimental design was acomplete randomized block with each sitebeing a replication. Nominal plot size is 80x 100 ft placed on the contour. Tillagedepth and speed were 16 inches and 4 mi/hrrespectively. During tillage, nylon balertwine was buried in the shank grooves.This was accomplished by 1) attaching aball of twine to the implement, 2) weldinga chain link behind the shank tip, 3)looping the end of the twine through thelink, and 4) anchoring the end in the soil,thus feeding twine into the shank grooveduring tillage.
Plant growth samples were taken inMarch of the crop year and at harvest.Three 1-ft sections of row were thesampling units. Plant (Haun system) stage,plants/ft of row, heads/ft of row,kernel/head and 300 seed weight wererecorded. Plots were harvested usinggrower combines and a weigh wagon.Borders and alley ways were harvestedaround the plots and precise dimensions ofplot areas obtained. Test weights weredetermined from samples removed from theweigh wagon after harvest weights wereobtained.
RESULTS AND DISCUSSIONDuring April and May of 1991 soil bulk
density, soil water content, soil impedanceand shank groove macroporosity data wereobtained from sites tilled in autumn of1990. This was after primary tillage and thefirst rod weeding. Soil samples andimpedance measurements were taken at 0,6, 12, 24, and 48-inch intervalsperpendicular from the tillage groove, usingthe nylon baler twine as the zero reference.Bulk density and water content sampleswere taken in 3-inch intervals from a depthof 3 to 18 inches. The 0 to 3 inchincrement was not used because of its loosefluffy condition after rodweeding. Soilbelow 18 inches was sampled for watercontent at 12-inch intervals to a depth of 72inches, or root-restricting layer, whicheverwas less. Soil impedance values wererecorded using a Bush recordingpenetrometer at 1.5-inch intervals to adepth of 24 inches. Intact bulk soil volumeswere taken by driving 8-inch square x 12-inch deep sheet metal frames into the soildirectly over the shank groove. Thesemeasurements were repeated in standingcrop in May of 1992. Data were collected6 months and 18 months after subsoiltillage.
Weather has had a major affect onwater storage and crop response thus far inthis study. A brief explanation ofprecipitation since this study began isnecessary to understand and interpret theresults. Precipitation for the winters of1990-1991 and 1991-1992 is shown in Table1. These are periods during which waterrecharge and erosion typically occur. Thesetwo seasons had below averageprecipitation and frequent light rainfall asindicated by the amount received in eventsof < 0.2 inches. Consequently, runoff anderosion did not occur. Subsoil tillage leavesshank grooves open over the first winter toact as channels for water to infiltrate.However, the lack of runoff over winterresulted in no difference in water storagebetween treatments (Table 2). In additionto dry, open winters, the 1991-1992 cropyear was dry during the fall and spring.This resulted in poor control of downybrome in the fall and severe drought stressin the late spring and summer. Plots didnot show yield response to subsoil tillage(Table 3). Yields were reducedsubstantially because of droughtyconditions. In addition subsoiling had noeffect on plant height or head density
66
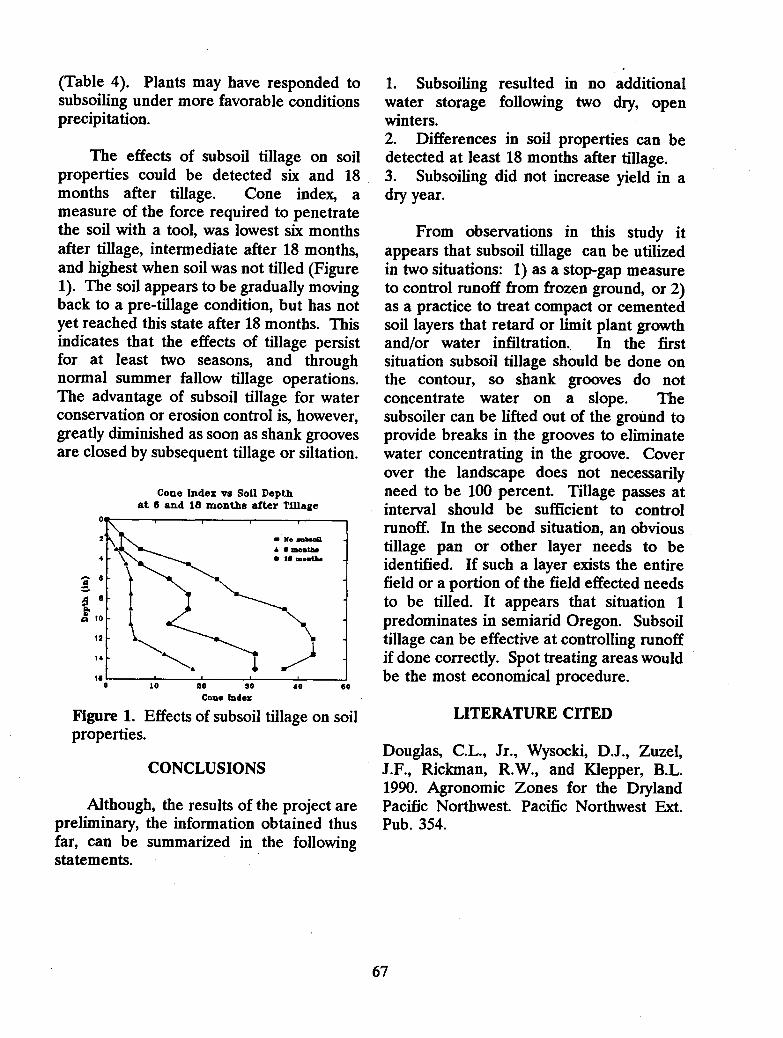
40 60
, Wysocki, D.J., Zuzel,.W., and Klepper, B.L.Zones for the DrylandPacific Northwest Ext.
Douglas, C.L., Jr.J.F., Rickman, R1990. AgronomicPacific Northwest.Pub. 354.
(Table 4). Plants may have responded tosubsoiling under more favorable conditionsprecipitation.
The effects of subsoil tillage on soilproperties could be detected six and 18months after tillage. Cone index, ameasure of the force required to penetratethe soil with a tool, was lowest six monthsafter tillage, intermediate after 18 months,and highest when soil was not tilled (Figure1). The soil appears to be gradually movingback to a pre-tillage condition, but has notyet reached this state after 18 months. Thisindicates that the effects of tillage persistfor at least two seasons, and throughnormal summer fallow tillage operations.The advantage of subsoil tillage for waterconservation or erosion control is, however,greatly diminished as soon as shank groovesare closed by subsequent tillage or siltation.
Cone Index vs Son Depthat 8 and la months after Tillage
Figure 1. Effects of subsoil tillage on soilproperties.
CONCLUSIONS
Although, the results of the project arepreliminary, the information obtained thusfar, can be summarized in the followingstatements.
1. Subsoiling resulted in no additionalwater storage following two dry, openwinters.2. Differences in soil properties can bedetected at least 18 months after tillage.3. Subsoiling did not increase yield in adry year.
From observations in this study itappears that subsoil tillage can be utilizedin two situations: 1) as a stop-gap measureto control runoff from frozen ground, or 2)as a practice to treat compact or cementedsoil layers that retard or limit plant growthand/or water infiltration. In the firstsituation subsoil tillage should be done onthe contour, so shank grooves do notconcentrate water on a slope. Thesubsoiler can be lifted out of the ground toprovide breaks in the grooves to eliminatewater concentrating in the groove. Coverover the landscape does not necessarilyneed to be 100 percent. Tillage passes atinterval should be sufficient to controlrunoff. In the second situation, an obvioustillage pan or other layer needs to beidentified. If such a layer exists the entirefield or a portion of the field effected needsto be tilled. It appears that situation 1predominates in semiarid Oregon. Subsoiltillage can be effective at controlling runoffif done correctly. Spot treating areas wouldbe the most economical procedure.
LITERATURE CITED
67
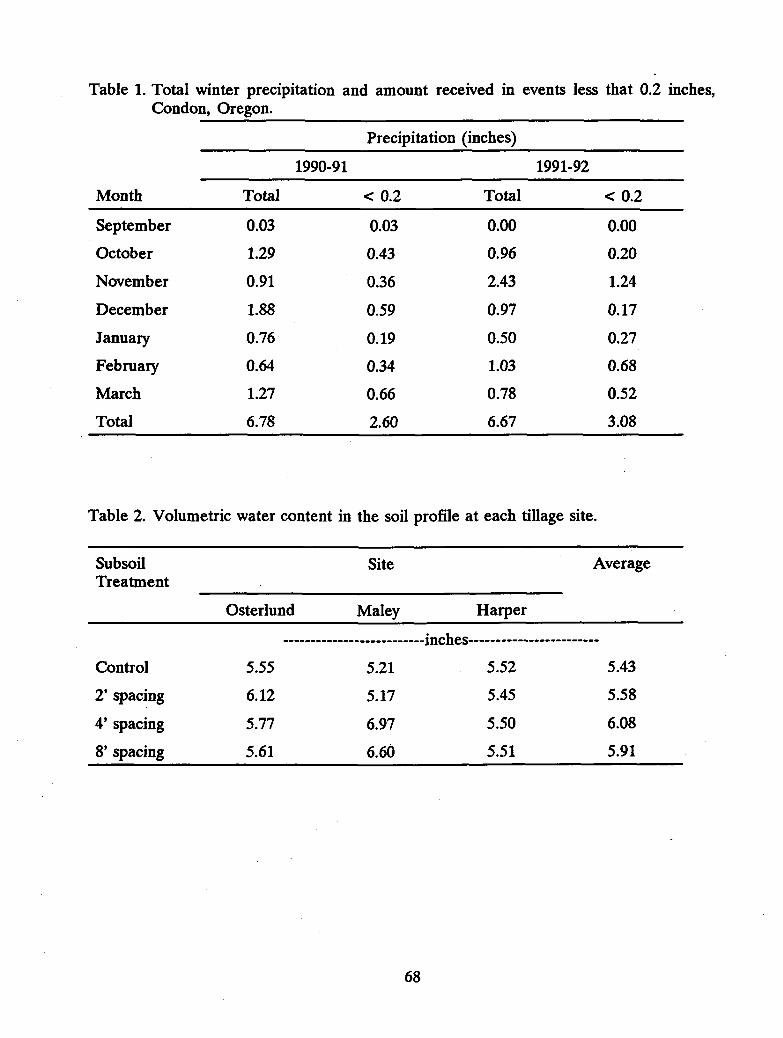
Table 1. Total winter precipitation and amount received in events less that 0.2 inches,Condon, Oregon.
Precipitation (inches)
1990-91 1991-92
Month Total < 0.2 Total < 0.2
September 0.03 0.03 0.00 0.00
October 1.29 0.43 0.96 0.20
November 0.91 0.36 2.43 1.24
December 1.88 0.59 0.97 0.17
January 0.76 0.19 0.50 0.27
February 0.64 0.34 1.03 0.68
March 1.27 0.66 0.78 0.52
Total 6.78 2.60 6.67 3.08
Table 2. Volumetric water content in the soil profile at each tillage site.
Subsoil Site AverageTreatment
Osterlund
Maley Harper
inches
Control 5.55 5.21 5.52 5.43
2' spacing 6.12 5.17 5.45 5.58
4' spacing 5.77 6.97 5.50 6.08
8' spacing 5.61 6.60 5.51 5.91
68
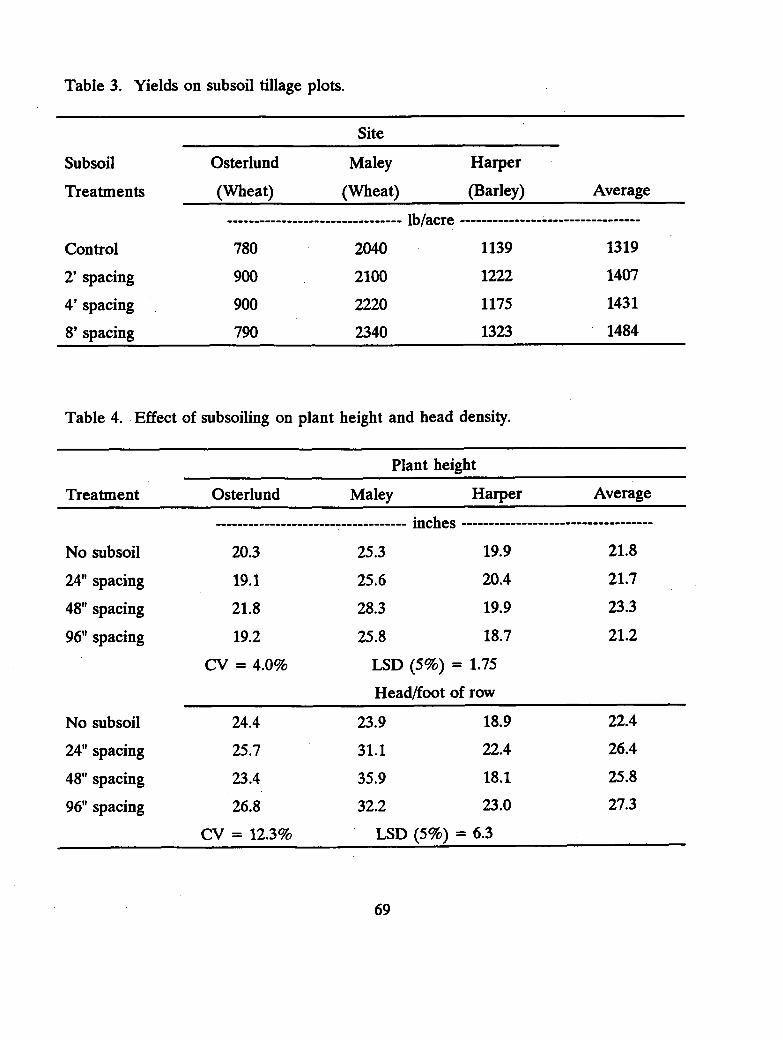
Table 3. Yields on subsoil tillage plots.
Site
Subsoil Osterlund Maley Harper
Treatments (Wheat) (Wheat) (Barley) Average
lb/acre
Control 780 2040 1139 1319
2' spacing 900 2100 1222 1407
4' spacing 900 2220 1175 1431
8' spacing 790 2340 1323 1484
Table 4. Effect of subsoiling on plant height and head density.
Plant height
Treatment
Osterlund Maley Harper Average
inches
No subsoil 20.3 25.3 19.9 21.8
24" spacing 19.1 25.6 20.4 21.7
48" spacing 21.8 28.3 19.9 23.3
96" spacing 19.2 25.8 18.7 21.2
CV = 4.0% LSD (5%) = 1.75
Head/foot of row
No subsoil 24.4 23.9 18.9 22.4
24" spacing 25.7 31.1 22.4 26.4
48" spacing 23.4 35.9 18.1 25.8
96" spacing 26.8 32.2 23.0 27.3
CV = 12.3% LSD (5%) = 6.3
69
BREEDING FOR DISEASERESISTANCE IN WINTER WHEAT
C. S. Love, R. J. Metzger,and W. E. Kronstad
The wheat breeding program atOregon State University has focused onproducing high-yielding winter wheats withsuperior end-product uses. Cultivarsdeveloped for eastern Oregon environmentsideally are fall sown, with high stable yields,adequate winter hardiness, and acceptablemilling and baking characteristics forspecific end use products quality. Inaddition, resistance to strawbreaker foot rotand common bunt is desirable. In areasnear Flora where snow cover persists forlonger than 3 months, adapted cultivarsmust be resistant to dwarf bunt.
Strawbreaker foot rot is caused byPseudocercosporella herpotrichoides.Infection of winter wheat occurs in late fallor early spring, as conidia on host debrisare splashed by water onto seedlings. Theygerminate and penetrate the stem justabove the soil line. The elliptical lesions or"eyespots", which are diagnostic of thisdisease, enlarge and penetrate the stem,weakening or eventually killing individualtillers or possibly entire plants. Delayedseeding, 3-year rotations, and reducedtillage can reduce disease.
Tolerant cultivars such as Rendezvousand Cappelle-Desprez are used widely inEurope where strawbreaker foot rot is aserious constraint to wheat production, andfungicide-resistant strains of the fungus arecommon. Efforts are currently underway totransfer resistance genes from thesecultivars into winter wheats with acceptableagronomic characteristics. We have usedRendezvous and Cappelle-Desprezextensively in our breeding program, and
are currently screening a number ofsegregating populations in inoculated trialsin both the greenhouse and the field inCorvallis.
The 1993 foot rot screening nurseryconsists of 160 F4 populations planted assix-row plots. The material was seeded atHyslop Farm near Corvallis on September30, 1992, about 14 days before the optimumseeding date in the Willamette Valley.Early seeding favors disease developmentbecause larger plants create higher humiditynear the soil line, which increasesgermination of conidia and leads to higherinfection levels. The individual rows wereinoculated November 7, 1992 astemperatures decreased and conditions forinfection became favorable. At maturity,lodging and disease development, asevidenced by lesion score, will be assessedfor each head row. Lines exhibiting lowdisease severity will be advanced into yieldtrials and also tested for quality traits.These same 160 F4 populations are alsocurrently being screened in the greenhouseas seedlings.
Breeding efforts have also focused ondeveloping soft white wheats with commonbunt (Tilletia caries) and dwarf bunt (T.controversa) resistance. Although bunt doesnot, in most cases, cause major yield lossesin the state, marketing considerationsrequire that seed be free of spores.Growing resistant cultivars reducesinoculum levels in both the soil, and on theseed. Genes conferring resistance tocommon bunt also provide resistance todwarf bunt, and we utilize this relationshipto screen breeding material. Dwarf bunthas strict environmental requirements forinfection, and "escapes" during screeningare common. Since the same genescondition resistance to both diseases, wecan inoculate with the less environmentally-
70
dependent fungus T. caries, and use thisinformation to predict the dwarf buntresistance of a given line before yield trialtesting in a dwarf bunt area.
The common bunt screening nurseriesare planted at Corvallis and at theColumbia Basin Agricultural ResearchCenter in Pendleton. We screensegregating populations beginning in the F2
generation by inoculating from 250 to 500seeds with a mixture of common buntspores from races R-39 and R-55. Thespores are suspended in a methyl cellulosesolution and applied to the seed. Theinoculated seed is air-dried and then spaceplanted into deep furrows once the soiltemperature reaches 10°C. Advancedbreeding lines are inoculated with thecommon bunt races T-16, T-30, R-39, andR-43, and solid seeded in a three replicatetrial in both locations. These combinationsof common bunt races allow us to detectthe presence of several resistance genesincluding Bt5, Bt8, Bt9 and Bt10. Thesegenes have been the most effective in thisregion for reducing disease incidence.
Initial screening with common buntraces allows us to advance only the mostresistant lines to yield • testing.Experimental lines with fewer than 2percent infected tillers in the common buntscreening trial are advanced into a non-inoculated replicated yield trial establishedin a dwarf bunt area near Flora. The 1993trial, seeded September 22, 1992 consists ofnine entries and six replications. Thisscreening sequence has allowed us toidentify several lines which perform wellunder severe dwarf bunt pressure. Twosiblings, OR880494 and OR880510, ranked1 and 3, respectively, are in the 10-entrydwarf bunt yield trial planted in 1992, andare again included in the 1993 trial. Theselines show promise and will continue to beevaluated for disease resistance, yield, andquality.
The bunt resistance breeding programis currently utilizing dwarf bunt resistantparents obtained from breeding programsin Utah and Idaho, as well as linesidentified in the breeding programs atHermiston and Corvallis.
71
W 301, A NEW SOFT WHITEWINTER WHEAT
Mathias F. Kolding
INTRODUCTION
A new soft white winter wheat, W 301,PI 559718, Triticum aestivum, L., wasdeveloped as a cooperative effort betweenthe Oregon Agricultural Experiment Stationand Wulff Farms, Flora, Oregon to providean early maturing soft white winter wheatthat will survive at the elevations greaterthan 3,000 feet in Wallowa County.
Soft white winter varieties such asStephens, Malcolm, and Dusty have poorwinter survival rates under snow-cover nearFlora, Oregon. John, Luke, Lewjain, andMadsen winter wheats survive the winters,but have weak straw and tend to lodge.They are slow to ripen, and consequentlyare vulnerable to late August rains thatcause sprout damage.
HISTORY
W 301, PI 559718, Triticum aestivum L.,is derived from a cross of Sm-4/Daws andSm-11/McDennid, which were selectionsfrom Dr. Robert Metzger's common buntproject. The cross was made in 1980. TheF-1 was grown in row 454 in 1981. F-3head-rows were planted in the annualevaluation and selection trials on the WulffRanch near Flora. Several head-rows wereharvested and bulked. Three of these bulkswere planted in drill plots on the WulffRanch. Bulk -301 was the most favored byKenneth and Doug Wulff. Their evaluationswere based on relative earliness, plantheight, lodging resistance, ease of threshing,clean grain in the truck-box, estimate ofrelative yield, and grain appearance.
Heads were selected from the bulk in1985. During the ensuing years, lines werediscarded for dwarf bunt susceptibility viathe common smut trials: Unfortunately thelines having the best resistance did not havethe desired kernel color, i.e. not pure white.
The Wulff Ranch continued evaluatingthe line in field plantings. (The fields inthe Flora-Paradise area are bordered bytrees. Soil depths range from zero to 6 feetdepending on the undulation of theunderlying lava flow and soil deposition.)
Field observations led to the followingconclusions. W 301 is earlier maturing thanDusty, and matures a week earlier thanLewjain. W 301 yields better than Lewjainand survives like Lewjain. Head size isgood. W 301 yielded 65 bushels per acreversus 50 bushels per acre for Lewjain in1990. In 1991 W 301 yielded nearly 70bushels per acre versus 50 to 60 bushels peracre for other fields.
Head-rows selected from plant plotswere planted at the Hermiston AgriculturalResearch and Extension Center (HAREC)in the fall of 1990. During 1991 'off-type'head-rows were destroyed prior to anthesis.A number of head-rows were selected,threshed separately, seed type wasexamined, and the "keepers" planted in longfour row plots at HAREC. During 1992 off-type long plots were destroyed and theremaining were threshed into indivivalsacks.
DISCUSSION
Table 1, and Table 2, summarize grainyields for the Eastern Oregon White WinterWheat trials (EOWW). The EOWW trialsare planted in diverse locations. Theycompare new selections from Project 0396with recent releases from other programs.
72
The locations provide different times ofplanting and adverse soil or diseasepressures. The EOWW trials are evaluatedin growers' fields, so they are subjected tothe whims of producers as well as nature.Entries are discarded when they fail in oneof the trials, or their ranking for the year isin the bottom third to one-half of theentries tested. During the past 20-plusyears, the check varieties such as Gaines,Nugaines, McDermid, Luke, Hyslop, andYamhill were replaced by the present checkvarieties Stephens, Hill Malcolm, Dusty andLewjain. The ranking system evaluates W-301's yield stability across environments andyears in eastern Oregon, as well asproviding reactions from growers. W 301survived the EOWW trials, and was enteredfor testing in the regional trials.
Table 1 contains 1990 data as anexample of one year for the EOWW trials.W-301 ranked first for grain yield. Its testweight was as good as Stephens.
Grain yields in Table 2 illustrate theconfusion that can occur whenaccumulating data in various environments.W-301 yields ranked near the bottom in1986, 1989, and 1991, but were on the topfor 1987, 1988, and 1990.
Agronomic data from Oregon test sitesand the Western Regional White WinterWheat Nursery are summarized in Tables 3and 4.
W-301 had the top yields at Pullman(high-fertility), Pomeroy, Ritzville, Lind-dry,Lind-irrigated, Ontario, Pendleton, Moro,Moscow, and Kalispell in 1986. It was thetop yielder at Pullman-high fertility, Lind-irrigated, Hermiston, Ontario, and Moscowin 1987.
It was the top yielder at Cunningham,
Hermiston, and Kalispell in 1988. In 1989it was top at Moscow. During 1990 it wastop at Yreka, Bonners Ferry, Moscow, andLind.
W-301 did poorly at Aberdeen in 1986,1987, 1988, 1989, and 1990. W-301 also didpoorly at Pullman for the medium andcheck fertility in 1987, and in thestrawbreaker and Benlate treatments in1988, and at Bonners Ferry in 1988.
QUALITY
Table 5 has nutrient informationconcerning W-301 and several checks.Grain nutrients are similar to the checkvarieties. W-301 ranks highest for grainyield. Its protein is high at 12.03, but 1.80percent less than Madsen. Data in Table 5is from a trial where 24 entries wereplanted in 24 replications to evaluatevariety by herbicide interactions. The trialwas planted October 26. Twenty-fivepounds of nitrogen were broadcast on thetrial area in early March. Nitrogen in theamount of 100 ± 10 pounds was applied viathe sprinkler system near late boot. Thetrial area had considerable winter damageso that tender lines had very low yields.
Baking and milling results of TheWestern Regional White Winter WheatNursery reported in Table 6 are averages ofcomposite samples from each of four years.Wheat and flour protein for W-301 waslower than Stephens and Madsen, buthigher than Nugaines and Hyak. Flouryield is not as high as Madsen and Hyak.Cookie diameter, cake volume, sponge cakescore, and noodle weight increase arewithin the range of the check's.
Baking and milling results in Table 7,and the agronomic observations in Table 8are from a club wheat trial planted in late
73
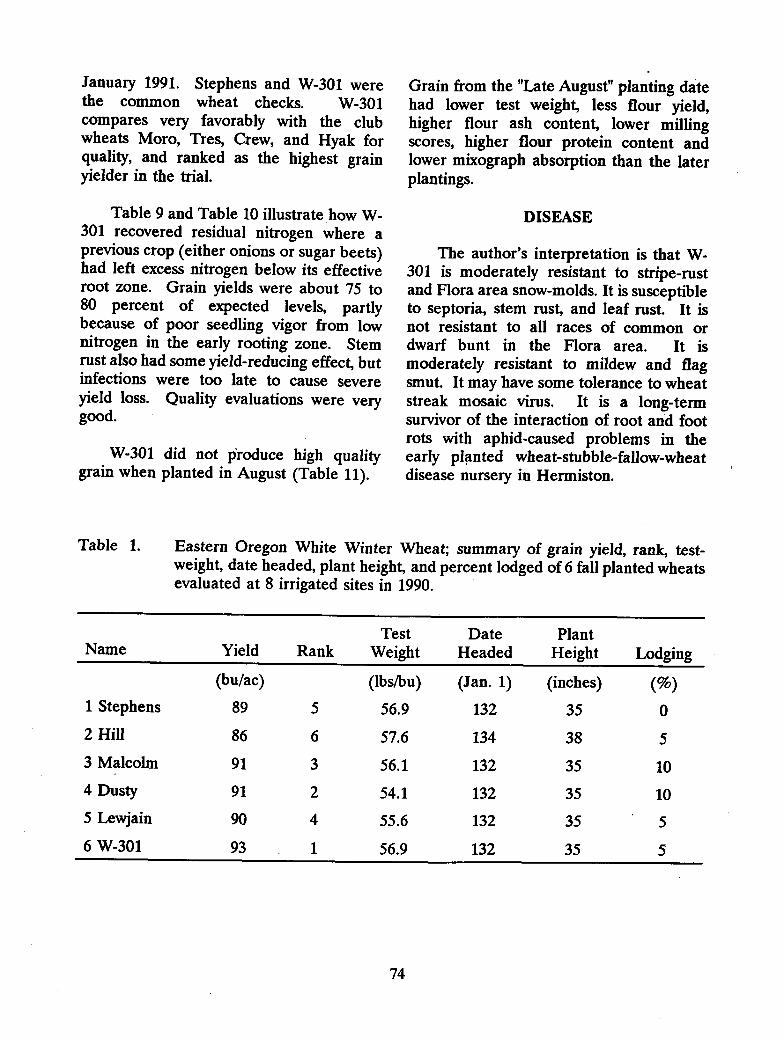
January 1991. Stephens and W-301 werethe common wheat checks. W-301compares very favorably with the clubwheats Moro, Tres, Crew, and Hyak forquality, and ranked as the highest grainyielder in the trial.
Table 9 and Table 10 illustrate how W-301 recovered residual nitrogen where aprevious crop (either onions or sugar beets)had left excess nitrogen below its effectiveroot zone. Grain yields were about 75 to80 percent of expected levels, partlybecause of poor seedling vigor from lownitrogen in the early rooting zone. Stemrust also had some yield-reducing effect, butinfections were too late to cause severeyield loss. Quality evaluations were verygood.
W-301 did not produce high qualitygrain when planted in August (Table 11).
Grain from the "Late August" planting datehad lower test weight, less flour yield,higher flour ash content, lower millingscores, higher flour protein content andlower mixograph absorption than the laterplantings.
DISEASE
The author's interpretation is that W-301 is moderately resistant to stripe-rustand Flora area snow-molds. It is susceptibleto septoria, stem rust, and leaf rust. It isnot resistant to all races of common ordwarf bunt in the Flora area. It ismoderately resistant to mildew and flagsmut. It may have some tolerance to wheatstreak mosaic virus. It is a long-termsurvivor of the interaction of root and footrots with aphid-caused problems in theearly planted wheat-stubble-fallow-wheatdisease nursery in Hermiston.
Table 1. Eastern Oregon White Winter Wheat; summary of grain yield, rank, test-weight, date headed, plant height, and percent lodged of 6 fall planted wheatsevaluated at 8 irrigated sites in 1990.
Name Yield RankTest
WeightDate
HeadedPlant
Height Lodging
(bu/ac) (lbs/bu) (Jan. 1) (inches) (%)1 Stephens 89 5 56.9 132 35 02 Hill 86 6 57.6 134 38 53 Malcolm 91 3 56.1 132 35 104 Dusty 91 2 54.1 132 35 105 Lewjain 90 4 55.6 132 35 5
6 W-301 93 1 56.9 132 35 5
74
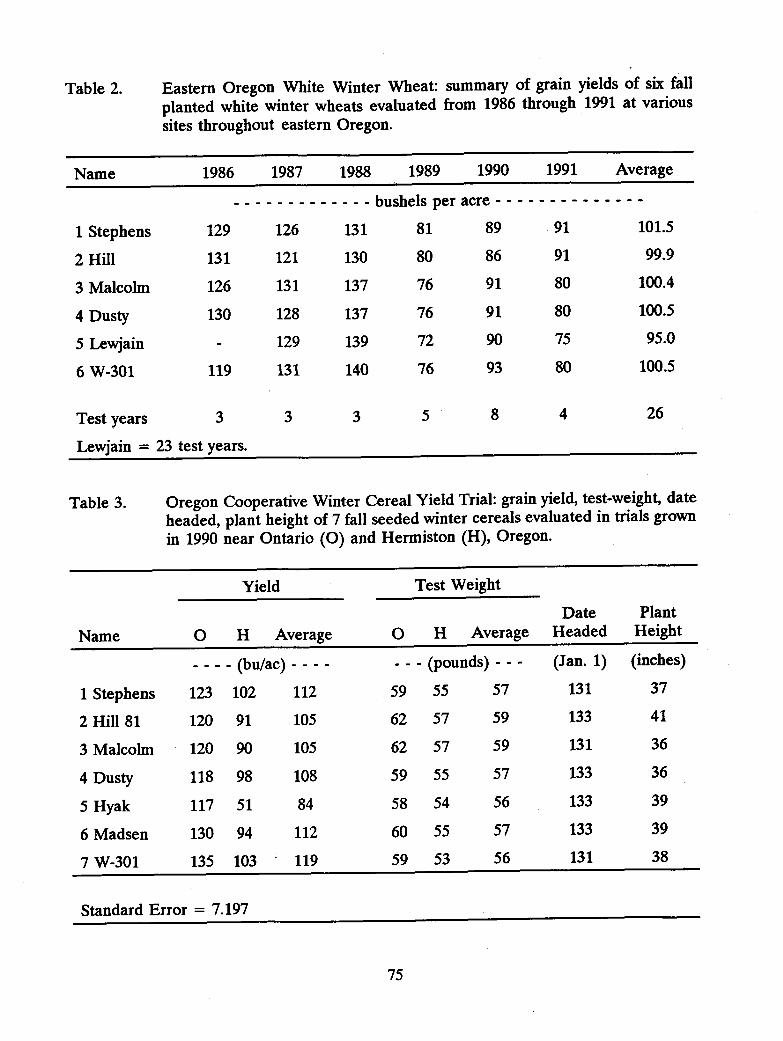
Table 2. Eastern Oregon White Winter Wheat: summary of grain yields of six fallplanted white winter wheats evaluated from 1986 through 1991 at varioussites throughout eastern Oregon.
Name 1986 1987 1988 1989 1990 1991 Average
bushels per acre
1 Stephens 129 126 131 81 89 91 101.5
2 Hill 131 121 130 80 86 91 99.9
3 Malcolm 126 131 137 76 91 80 100.4
4 Dusty 130 128 137 76 91 80 100.5
5 Lewjain 129 139 72 90 75 95.0
6 W-301 119 131 140 76 93 80 100.5
Test years 3 3 3 5 8 4 26
Lewjain = 23 test years.
Table 3. Oregon Cooperative Winter Cereal Yield Trial: grain yield, test-weight, dateheaded, plant height of 7 fall seeded winter cereals evaluated in trials grownin 1990 near Ontario (0) and Hermiston (H), Oregon.
Name
Yield Test Weight
DateHeaded
PlantHeight0 H Average 0 H Average
- - - - (bu/ac) - - - - - - - (pounds) - - - (Jan. 1) (inches)
1 Stephens 123 102 112 59 55 57 131 37
2 Hill 81 120 91 105 62 57 59 133 41
3 Malcolm 120 90 105 62 57 59 131 36
4 Dusty 118 98 108 59 55 57 133 36
5 Hyak 117 51 84 58 54 56 133 39
6 Madsen 130 94 112 60 55 57 133 39
7 W-301 135 103 119 59 53 56 131 38
Standard Error = 7.197
75
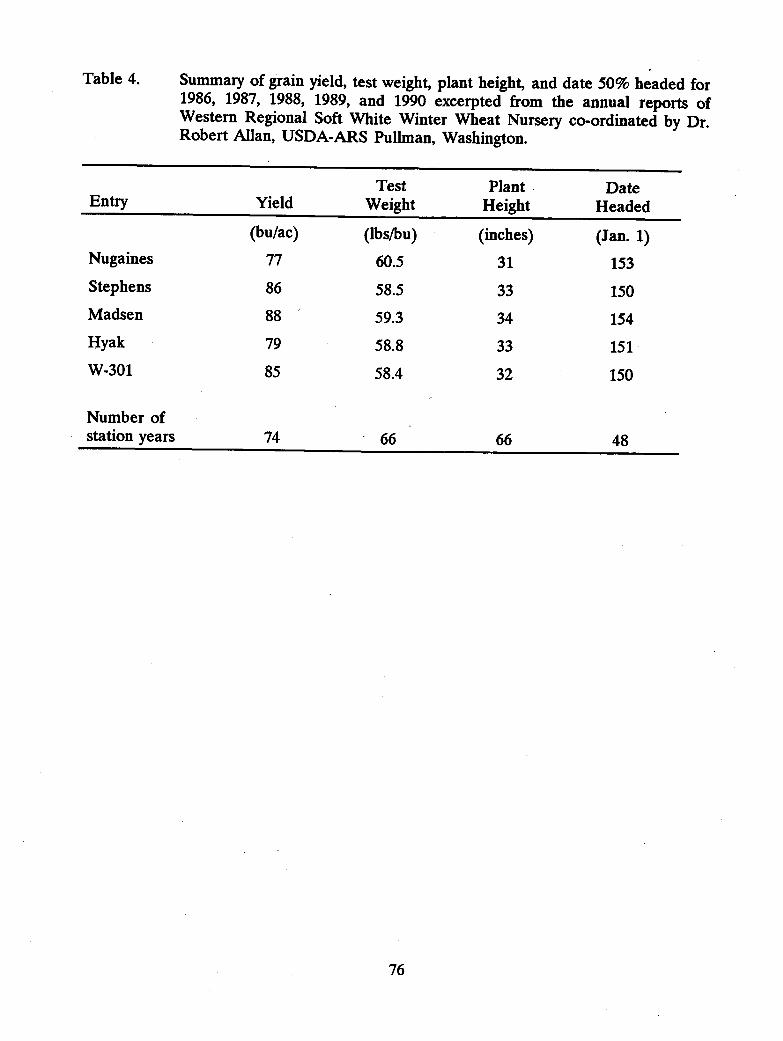
Table 4. Summary of grain yield, test weight, plant height, and date 50% headed for1986, 1987, 1988, 1989, and 1990 excerpted from the annual reports ofWestern Regional Soft White Winter Wheat Nursery co-ordinated by Dr.Robert Allan, USDA-ARS Pullman, Washington.
Entry YieldTest
WeightPlant
HeightDate
Headed
(bu/ac) (lbs/bu) (inches) (Jan. 1)Nugaines 77 60.5 31 153Stephens 86 58.5 33 150Madsen 88 59.3 34 154Hyak 79 58.8 33 151W-301 85 58.4 32 150
Number ofstation years 74 66 66 48
76
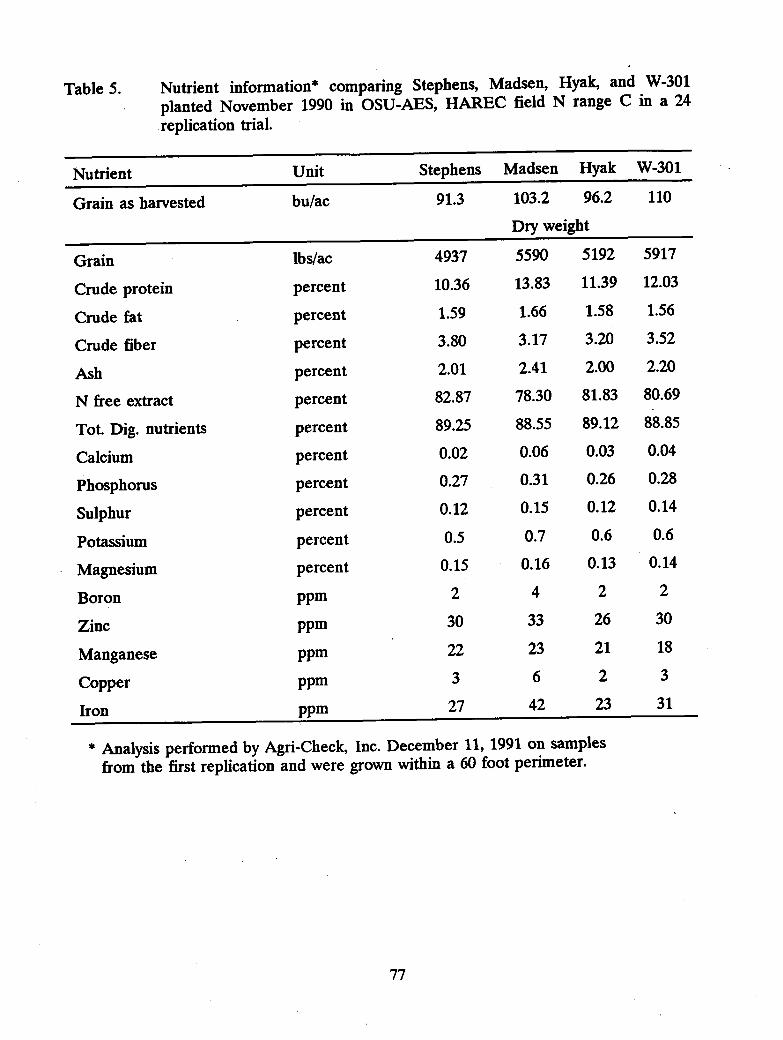
Table 5. Nutrient information* comparing Stephens, Madsen, Hyak, and W-301planted November 1990 in OSU-AES, HAREC field N range C in a 24replication trial.
Nutrient Unit Stephens Madsen Hyak W-301
Grain as harvested bu/ac 91.3 103.2 96.2 110
Dry weight
Grain lbs/ac 4937 5590 5192 5917
Crude protein percent 10.36 13.83 11.39 12.03
Crude fat percent 1.59 1.66 1.58 1.56
Crude fiber percent 3.80 3.17 3.20 3.52
Ash percent 2.01 2.41 2.00 2.20
N free extract percent 82.87 78.30 81.83 80.69
Tot. Dig. nutrients percent 89.25 88.55 89.12 88.85
Calcium percent 0.02 0.06 0.03 0.04
Phosphorus percent 0.27 0.31 0.26 0.28
Sulphur percent 0.12 0.15 0.12 0.14
Potassium percent 0.5 0.7 0.6 0.6
Magnesium percent 0.15 0.16 0.13 0.14
Boron ppm 2 4 2 2
Zinc ppm 30 33 26 30
Manganese ppm 22 23 21 18
Copper ppm 3 6 2 3
Iron ppm 27 42 23 31
* Analysis performed by Agri-Check, Inc. December 11, 1991 on samplesfrom the first replication and were grown within a 60 foot perimeter.
77
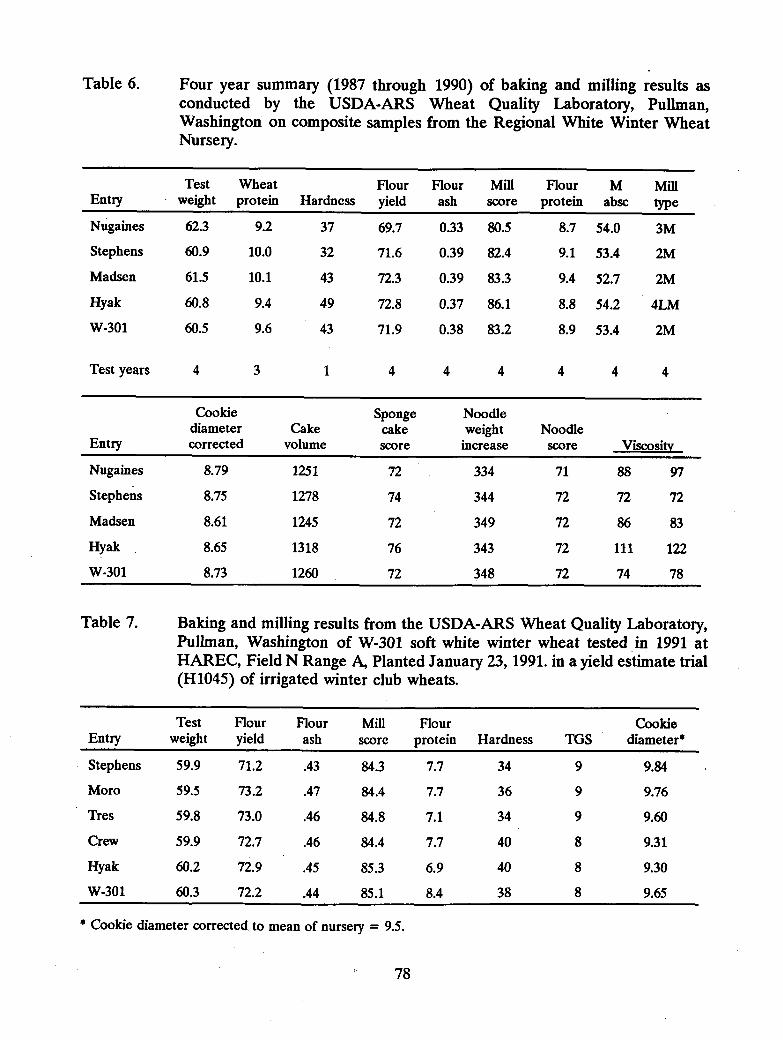
Table 6. Four year summary (1987 through 1990) of baking and milling results asconducted by the USDA-ARS Wheat Quality Laboratory, Pullman,Washington on composite samples from the Regional White Winter WheatNursery.
Test Wheat Flour Flour Mill Flour M MillEntry weight protein Hardness yield ash score protein absc type
Nugaines 62.3 9.2 37 69.7 0.33 80.5 8.7 54.0 3M
Stephens 60.9 10.0 32 71.6 0.39 82.4 9.1 53.4 2M
Madsen 61.5 10.1 43 72.3 0.39 83.3 9.4 52.7 2M
Hyak 60.8 9.4 49 72.8 0.37 86.1 8.8 54.2 4LM
W-301 60.5 9.6 43 71.9 0.38 83.2 8.9 53.4 2M
Test years 4 3 1 4 4 4 4 4 4
Cookie Sponge Noodlediameter Cake cake weight Noodle
Entry corrected volume score increase score Viscosity
Nugaines 8.79 1251 72 334 71 88 97
Stephens 8.75 1278 74 344 72 72 72
Madsen 8.61 1245 72 349 72 86 83
Hyak 8.65 1318 76 343 72 111 122
W-301 8.73 1260 72 348 72 74 78
Table 7. Baking and milling results from the USDA-ARS Wheat Quality Laboratory,Pullman, Washington of W-301 soft white winter wheat tested in 1991 atHAREC, Field N Range A, Planted January 23, 1991. in a yield estimate trial(H1045) of irrigated winter club wheats.
EntryTest
weightFlouryield
Flourash
Millscore
Flourprotein Hardness TGS
Cookiediameter*
Stephens 59.9 71.2 .43 84.3 7.7 34 9 9.84
Moro 59.5 73.2 .47 84.4 7.7 36 9 9.76
Tres 59.8 73.0 .46 84.8 7.1 34 9 9.60
Crew 59.9 72.7 .46 84.4 7.7 40 8 9.31
Hyak 60.2 72.9 .45 85.3 6.9 40 8 9.30
W-301 60.3 72.2 .44 85.1 8.4 38 8 9.65
* Cookie diameter corrected to mean of nursery = 9.5.
78
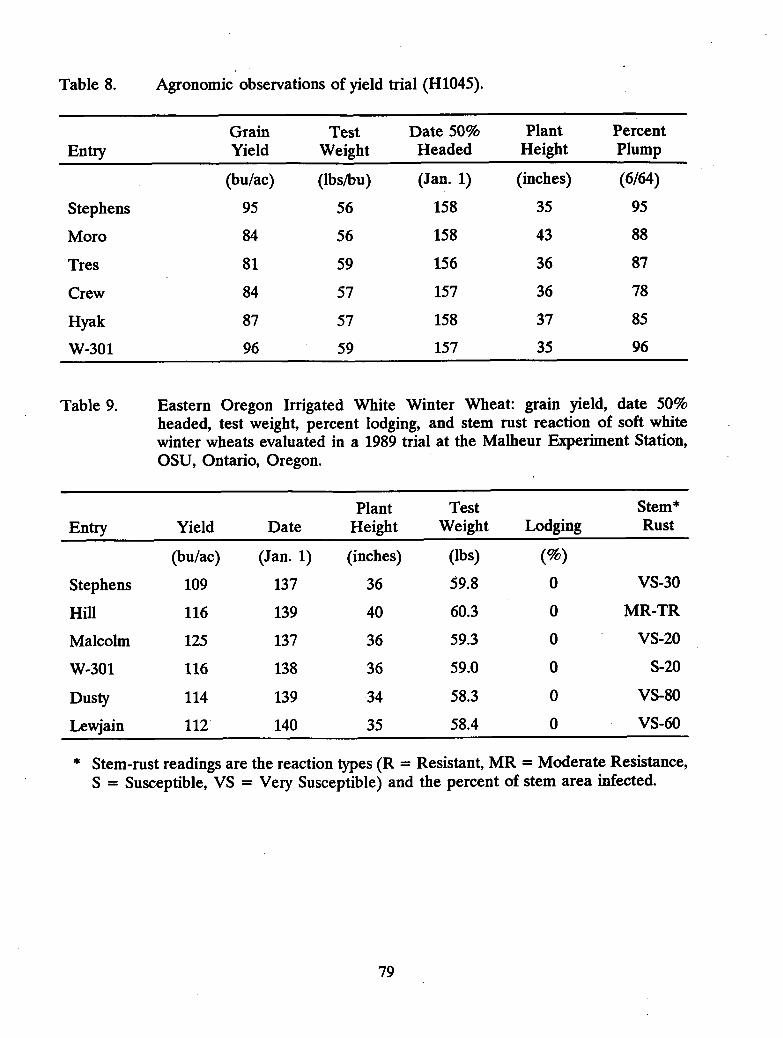
Table 8. Agronomic observations of yield trial (H1045).
EntryGrainYield
TestWeight
Date 50%Headed
PlantHeight
PercentPlump
(bu/ac) (lbs/bu) (Jan. 1) (inches) (6/64)
Stephens 95 56 158 35 95
Moro 84 56 158 43 88
Tres 81 59 156 36 87
Crew 84 57 157 36 78
Hyak 87 57 158 37 85
W-301 96 59 157 35 96
Table 9. Eastern Oregon Irrigated White Winter Wheat: grain yield, date 50%headed, test weight, percent lodging, and stem rust reaction of soft whitewinter wheats evaluated in a 1989 trial at the Malheur Experiment Station,OSU, Ontario, Oregon.
Entry Yield DatePlant
HeightTest
Weight LodgingStem*Rust
(bu/ac) (Jan. 1) (inches) (lbs) (%)
Stephens 109 137 36 59.8 0 VS-30
Hill 116 139 40 60.3 0 MR-TR
Malcolm 125 137 36 59.3 0 VS-20
W-301 116 138 36 59.0 0 S-20
Dusty 114 139 34 58.3 0 VS-80
Lewjain 112 140 35 58.4 0 VS-60
* Stem-rust readings are the reaction types (R = Resistant, MR = Moderate Resistance,S = Susceptible, VS = Very Susceptible) and the percent of stem area infected.
79

Table 10. Eastern Oregon Irrigated Soft White Winter Wheat: 1989 milling and bakingresults* of three white wheats produced from residual nitrogen at theMalheur Experiment Station.
Mixograph CookieTest Flour Flour Milling Flour Absorption Diameter
Variety Weight Yield Ash Score Protein Corrected Corrected
(lbs/bu) (%) (%) (%) (%) (cm)
Malcolm 62.3 71.6 0.42 85.3 8.9 53.4 8.90
Dusty 60.6 70.0 0.42 83.4 8.8 55.2 8.83
W-301 62.6 72.2 0.38 88.7 8.9 53.5 9.49
* Milling and baking test results were supplied by the USDA ARS, Western WheatQuality Laboratory, Pullman, Washington.
Table 11. HAREC Date of Planting milling and baking results of white winter wheatsas determined by the Western Wheat Quality Lab, Pullman, Washington.
Variety Date PlantedTest
WeightFlourYield
FlourAsh
MillScore
FlourProtein
Cookie*Diameter
Tres Late August 58.4 70.5 .52 77.6 12.0 9.14
Tres Mid-September 59.9 72.1 .49 81.6 10.5 9.23
Tres Early October 60.6 73.1 .46 84.8 9.8 8.86
Hill Late August 59.6 69.8 .51 77.4 12.3 8.81
Hill Mid-September 59.8 70.9 .48 80.6 11.4 9.43
Hill Early October 60.6 72.2 .47 82.9 10.2 9.01
W-301 Late August 51.7 66.7 .50 74.1 11.5 9.30
W-301 Mid-September 59.5 68.4 .49 76.9 10.8 8.80
W-301 Early October 60.3 69.6 .45 81.0 10.4 9.27
* Cookie diameter corrected to mean of nursery flour protein 10.8.
80
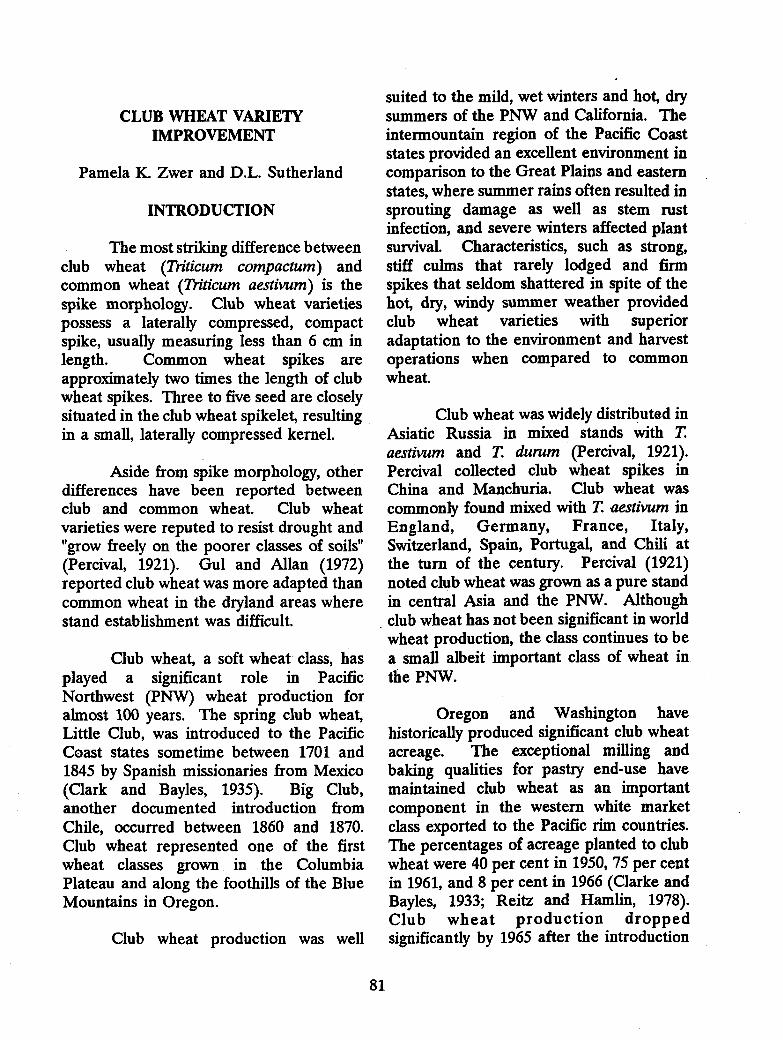
CLUB WHEAT VARIETYIMPROVEMENT
Pamela K. Zwer and D.L. Sutherland
INTRODUCTION
The most striking difference betweenclub wheat (Triticum compactum) andcommon wheat (Triticum aestivum) is thespike morphology. Club wheat varietiespossess a laterally compressed, compactspike, usually measuring less than 6 cm inlength. Common wheat spikes areapproximately two times the length of clubwheat spikes. Three to five seed are closelysituated in the club wheat spikelet, resultingin a small, laterally compressed kernel.
Aside from spike morphology, otherdifferences have been reported betweenclub and common wheat. Club wheatvarieties were reputed to resist drought and"grow freely on the poorer classes of soils"(Percival, 1921). Gul and Allan (1972)reported club wheat was more adapted thancommon wheat in the dryland areas wherestand establishment was difficult.
Club wheat, a soft wheat class, hasplayed a significant role in PacificNorthwest (PNW) wheat production foralmost 100 years. The spring club wheat,Little Club, was introduced to the PacificCoast states sometime between 1701 and1845 by Spanish missionaries from Mexico(Clark and Bayles, 1935). Big Club,another documented introduction fromChile, occurred between 1860 and 1870.Club wheat represented one of the firstwheat classes grown in the ColumbiaPlateau and along the foothills of the BlueMountains in Oregon.
Club wheat production was well
suited to the mild, wet winters and hot, drysummers of the PNW and California. Theintermountain region of the Pacific Coaststates provided an excellent environment incomparison to the Great Plains and easternstates, where summer rains often resulted insprouting damage as well as stem rustinfection, and severe winters affected plantsurvival. Characteristics, such as strong,stiff culms that rarely lodged and firmspikes that seldom shattered in spite of thehot, dry, windy summer weather providedclub wheat varieties with superioradaptation to the environment and harvestoperations when compared to commonwheat.
Club wheat was widely distributed inAsiatic Russia in mixed stands with T.aestivum and T. durum (Percival, 1921).Percival collected club wheat spikes inChina and Manchuria. Club wheat wascommonly found mixed with T. aestivum inEngland, Germany, France, Italy,Switzerland, Spain, Portugal, and Chili atthe turn of the century. Percival (1921)noted club wheat was grown as a pure standin central Asia and the PNW. Althoughclub wheat has not been significant in worldwheat production, the class continues to bea small albeit important class of wheat inthe PNW.
Oregon and Washington havehistorically produced significant club wheatacreage. The exceptional milling andbaking qualities for pastry end-use havemaintained club wheat as an importantcomponent in the western white marketclass exported to the Pacific rim countries.The percentages of acreage planted to clubwheat were 40 per cent in 1950, 75 per centin 1961, and 8 per cent in 1966 (Clarke andBayles, 1933; Reitz and Hamlin, 1978).Club wheat production droppedsignificantly by 1965 after the introduction
81
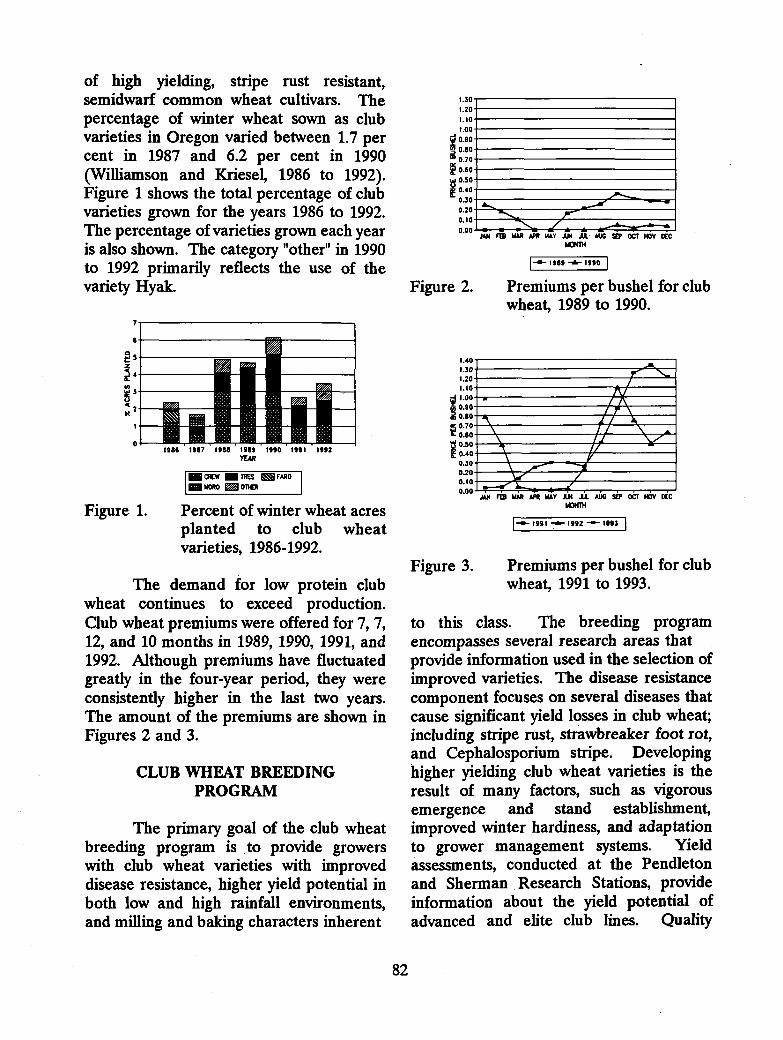
MINOR° '// OT1ER
of high yielding, stripe rust resistant,semidwarf common wheat cultivars. Thepercentage of winter wheat sown as clubvarieties in Oregon varied between 1.7 percent in 1987 and 6.2 per cent in 1990(Williamson and Kriesel, 1986 to 1992).Figure 1 shows the total percentage of clubvarieties grown for the years 1986 to 1992.The percentage of varieties grown each yearis also shown. The category "other" in 1990to 1992 primarily reflects the use of thevariety Hyak.
.3U
20100090R0706050403020
----m
10_ _ _
nm WA APR NAY AN AL . MA UP OCT NOV MC
AMIN
I -0- 1989 1990 I
Figure 2. Premiums per bushel for clubwheat, 1989 to 1990.
o.
MN
7
6
e 5
tuq 3
K2
0
Figure 1. Percent of winter wheat acresplanted to club wheatvarieties, 1986-1992.
The demand for low protein clubwheat continues to exceed production.Club wheat premiums were offered for 7, 7,12, and 10 months in 1989, 1990, 1991, and1992. Although premiums have fluctuatedgreatly in the four-year period, they wereconsistently higher in the last two years.The amount of the premiums are shown inFigures 2 and 3.
CLUB WHEAT BREEDINGPROGRAM
The primary goal of the club wheatbreeding program is to provide growerswith club wheat varieties with improveddisease resistance, higher yield potential inboth low and high rainfall environments,and milling and baking characters inherent
0.0.0.
r 0.Y
ET. 0.0.000
JAN FEB MAR APR MAY AM All. AUG SEP OCT NOV OCC104171
I1991 711992 --1993
Figure 3. Premiums per bushel for clubwheat, 1991 to 1993.
to this class. The breeding programencompasses several research areas thatprovide information used in the selection ofimproved varieties. The disease resistancecomponent focuses on several diseases thatcause significant yield losses in club wheat;including stripe rust, strawbreaker foot rot,and Cephalosporium stripe. Developinghigher yielding club wheat varieties is theresult of many factors, such as vigorousemergence and stand establishment,improved winter hardiness, and adaptationto grower management systems. Yieldassessments, conducted at the Pendletonand Sherman Research Stations, provideinformation about the yield potential ofadvanced and elite club lines. Quality
AU
30201000 .
A90& irM1-1.170 NIL NArk11
6°50340
NW I / n111n11%1 11 1111 El rii I .111 I II020I °A A
r_21111111111r- n _M I I I I 1=11.1r
82
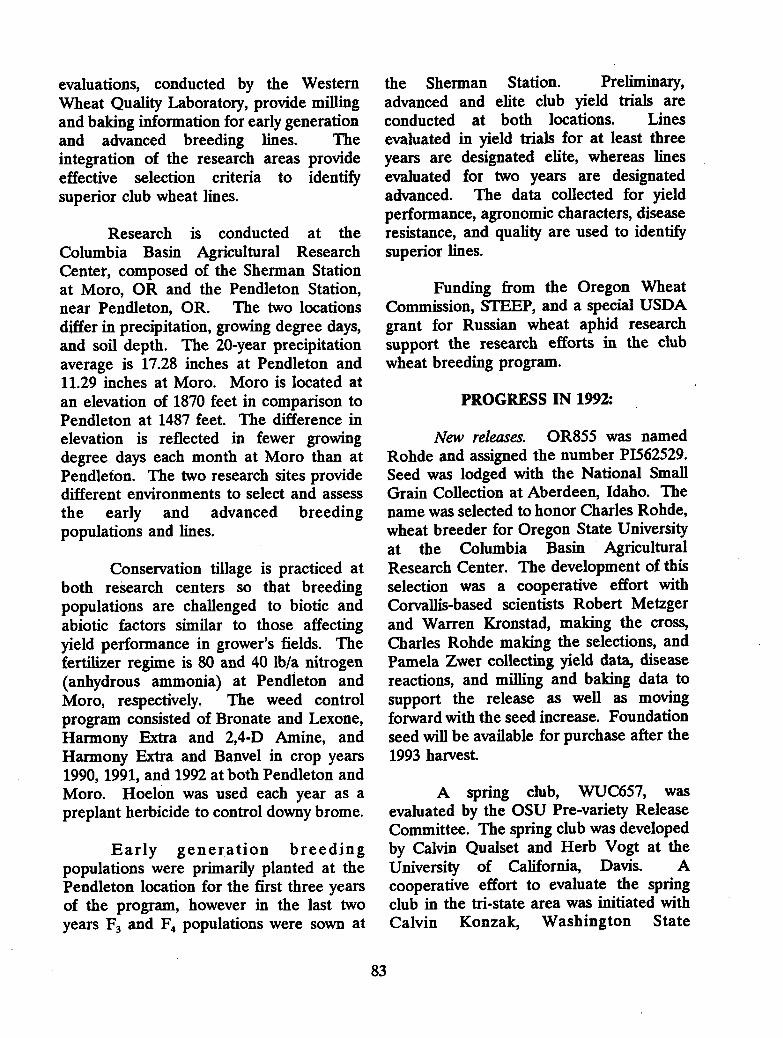
evaluations, conducted by the WesternWheat Quality Laboratory, provide millingand baking information for early generationand advanced breeding lines. Theintegration of the research areas provideeffective selection criteria to identifysuperior club wheat lines.
Research is conducted at theColumbia Basin Agricultural ResearchCenter, composed of the Sherman Stationat Moro, OR and the Pendleton Station,near Pendleton, OR. The two locationsdiffer in precipitation, growing degree days,and soil depth. The 20-year precipitationaverage is 17.28 inches at Pendleton and11.29 inches at Moro. Moro is located atan elevation of 1870 feet in comparison toPendleton at 1487 feet. The difference inelevation is reflected in fewer growingdegree days each month at Moro than atPendleton. The two research sites providedifferent environments to select and assessthe early and advanced breedingpopulations and lines.
Conservation tillage is practiced atboth research centers so that breedingpopulations are challenged to biotic andabiotic factors similar to those affectingyield performance in grower's fields. Thefertilizer regime is 80 and 40 lb/a nitrogen(anhydrous ammonia) at Pendleton andMoro, respectively. The weed controlprogram consisted of Bronate and Lexone,Harmony Extra and 2,4-D Amine, andHarmony Extra and Banvel in crop years1990, 1991, and 1992 at both Pendleton andMoro. Hoelon was used each year as apreplant herbicide to control downy brome.
Early generation breedingpopulations were primarily planted at thePendleton location for the first three yearsof the program, however in the last twoyears F3 and F4 populations were sown at
the Sherman Station. Preliminary,advanced and elite club yield trials areconducted at both locations. Linesevaluated in yield trials for at least threeyears are designated elite, whereas linesevaluated for two years are designatedadvanced. The data collected for yieldperformance, agronomic characters, diseaseresistance, and quality are used to identifysuperior lines.
Funding from the Oregon WheatCommission, STEEP, and a special USDAgrant for Russian wheat aphid researchsupport the research efforts in the clubwheat breeding program.
PROGRESS IN 1992:
New releases. OR855 was namedRohde and assigned the number PI562529.Seed was lodged with the National SmallGrain Collection at Aberdeen, Idaho. Thename was selected to honor Charles Rohde,wheat breeder for Oregon State Universityat the Columbia Basin AgriculturalResearch Center. The development of thisselection was a cooperative effort withCorvallis-based scientists Robert Metzgerand Warren Kronstad, making the cross,Charles Rohde making the selections, and,Pamela Zwer collecting yield data, diseasereactions, and milling and baking data tosupport the release as well as movingforward with the seed increase. Foundationseed will be available for purchase after the1993 harvest.
A spring club, WUC657, wasevaluated by the OSU Pre-variety ReleaseCommittee. The spring club was developedby Calvin Qualset and Herb Vogt at theUniversity of California, Davis. Acooperative effort to evaluate the springclub in the tri-state area was initiated withCalvin Konzak, Washington State
83
University, Edward Souza, University ofIdaho, and Pamela Zwer, Oregon StateUniversity. The pre-variety releasecommittee agreed, the advanced line shouldbe sent on to the Variety ReleaseCommittee for final consideration.
Quality. Promising advanced clublines were selected from yield trials formilling and baking assessment at theUSDA-ARS Western Wheat QualityLaboratory, Pullman. A Buhler mill wasused to produce flour samples for 21promising advanced club lines grown in the1992 elite club yield trials at Pendleton andMoro. Grain hardness, grain protein, flouryield, break flour yield, flour ash, millingscore, flour protein, mixograph absorption,mixograph type, cookie diameter, cookietop grain score, sponge cake volume, andsponge cake score were assessed for theelite lines. Approximately 190 elite andadvanced club lines were milled on a quadmill and analyzed for all characteristicsexcept sponge cake volume and score.Two elite club lines, 90C172 and 90C155,possessed milling and baking charactersequal to or better than the club checkvarieties Omar and Tres. An additional 45advanced and preliminary club lines lookpromising for both milling and bakingcharacters. Seed harvested from 1720 F6headrows was sent for grain protein andgrain hardness values.
Stripe Rust. Puccinia striifonnis, thecausal agent of stripe rust, was inoculatedonto F2, F3, F4, and F6 populations andheadrows in the field at the PendletonResearch Station. Due to unfavorableclimatic conditions, the inoculation was notsuccessful. Therefore, stripe rust reactiondata were not taken for the breedingpopulations. Stripe and leaf rust inoculumwas collected from Tres club whear at JoeTemple's farm. The inoculum has been
increased in the growth chamber fordistribution in the 1993 field season atPendleton.
Strawbreaker foot rot. Astrawbreaker foot rot screening nurserycomposed of 117 entries, three rows perentry and two replications, was planted atthe Pendleton Research Center. Advancedclub wheat lines, released varieties, andgermplasm from France and Australia wereevaluated in the nursery. Several clubselections from this program withparentages containing tolerant parents wereevaluated for a second year. Inoculum ofPseudocercosporella herpotrichoides, thecausal agent of strawbreaker foot rot, wasdispersed onto the rows in December 1991and January 1992. Evaluations were basedon a sample of 25 random tillers perreplication. The assessment scale was basedon the percent of necrosis in a culm crosssection, where 0 to 2.5 had less than 50 percent culm necrosis (resistant to tolerantclass) and 2.6 to 4.0 had more than 50 percent can necrosis (susceptible class). Floratriticale was the most tolerant entry in thetwo test years. Ten advanced club lines hadmean scores between 1.4 and 2.4 for the 2-year period. Madsen and Hyak, twotolerant wheat variety checks, had scores of2.0 and 3.0, respectively. The French andAustralian lines (mean scores between 1.0and 2.0) will provide new germplasm in thecrossing program for strawbreaker foot rottolerance.
Russian Wheat Aphid. The geneticsof resistance in P1294994 to Russian wheataphid (RWA) was evaluated in the fieldand greenhouse using F2 seedlings, F2 adultplants, and F3 seedling families from thecrosses Moro/PI294994 and Hyak/PI294994.Resistance in PI294994 was conferred bytwo genes, one dominant and one recessive.Data collected from the greenhouse and
84
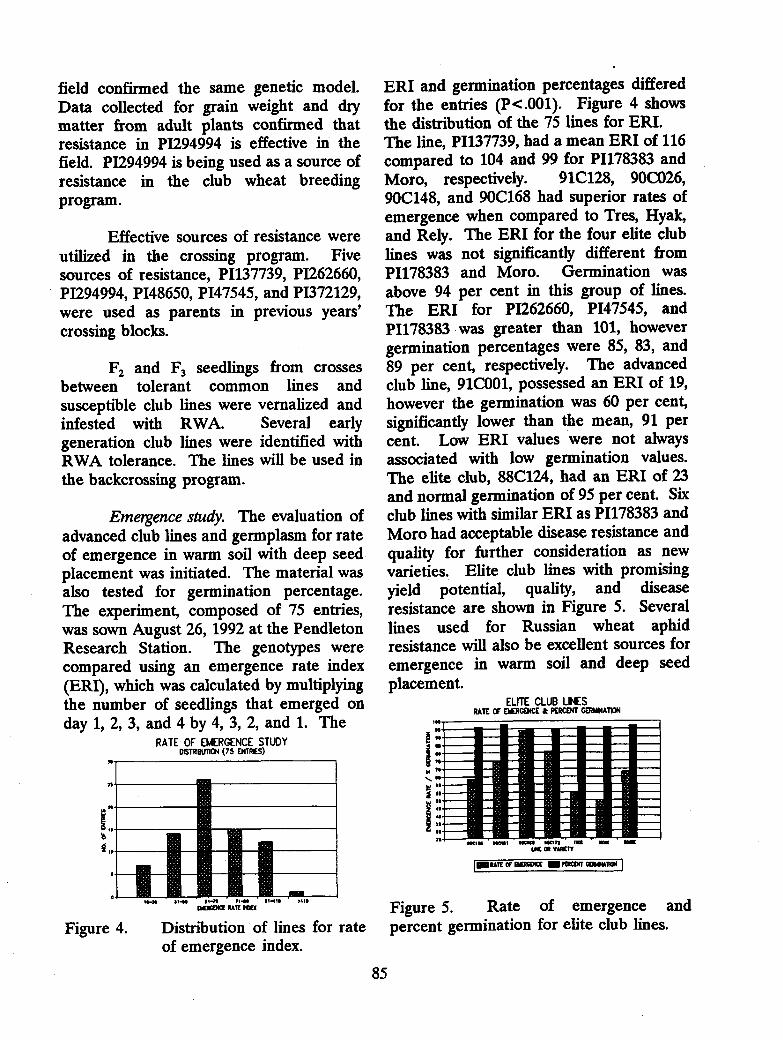
field confirmed the same genetic model.Data collected for grain weight and drymatter from adult plants confirmed thatresistance in PI294994 is effective in thefield. PI294994 is being used as a source ofresistance in the club wheat breedingprogram.
Effective sources of resistance wereutilized in the crossing program. Fivesources of resistance, PI137739, PI262660,PI294994, PI48650, PI47545, and PI372129,were used as parents in previous years'crossing blocks.
F2 and F3 seedlings from crossesbetween tolerant common lines andsusceptible club lines were vernalized andinfested with RWA. Several earlygeneration club lines were identified withRWA tolerance. The lines will be used inthe backcrossing program.
Emergence study. The evaluation ofadvanced club lines and germplasm for rateof emergence in warm soil with deep seedplacement was initiated. The material wasalso tested for germination percentage.The experiment, composed of 75 entries,was sown August 26, 1992 at the PendletonResearch Station. The genotypes werecompared using an emergence rate index(ERI), which was calculated by multiplyingthe number of seedlings that emerged onday 1, 2, 3, and 4 by 4, 3, 2, and 1. The
RATE OF EMERGENCE STUDYDISTRIBUTION (75 ENVIES)
Figure 4. Distribution of lines for rateof emergence index.
ERI and germination percentages differedfor the entries (P<.001). Figure 4 showsthe distribution of the 75 lines for ERI.The line, PI137739, had a mean ERI of 116compared to 104 and 99 for PI178383 andMoro, respectively. 91C128, 900026,90C148, and 90C168 had superior rates ofemergence when compared to Tres, Hyak,and Rely. The ERI for the four elite clublines was not significantly different fromPI178383 and Moro. Germination wasabove 94 per cent in this group of lines.The ERI for PI262660, PI47545, andPI178383 was greater than 101, howevergermination percentages were 85, 83, and89 per cent, respectively. The advancedclub line, 91C001, possessed an ERI of 19,however the germination was 60 per cent,significantly lower than the mean, 91 percent. Low ERI values were not alwaysassociated with low germination values.The elite club, 88C124, had an ERI of 23and normal germination of 95 per cent. Sixclub lines with similar ERI as PI178383 andMoro had acceptable disease resistance andquality for further consideration as newvarieties. Elite club lines with promisingyield potential, quality, and diseaseresistance are shown in Figure 5. Severallines used for Russian wheat aphidresistance will also be excellent sources foremergence in warm soil and deep seedplacement.
ELITE CLUB LINESRATE OF EMERGENCE & PERCENT GEMINATION
— =I —Millli....111.1•1111111111n1NMI IMm 1•11 III•1 MIN
MUM NM -- IN.:1111-1=11•11111M1
MU- - -INN
NV' MI IN .ME.- M.', NC- - NEM
: : MI :
NMI III NV ON IN -. NMI
IMMO •"-
- IN • l• -IIPLIM WWI NCO won I err
LAC OR VAWY
im mu Of Elf IN rot= moans
Figure 5. Rate of emergence andpercent germination for elite club lines.
85

100
IS
$0
g1:
S.
MIMININIMI
IM
n I In n
In n nII n nI II II I I
1 1 In n II IIn n In n1 I II
Breeding program. The greenhousecrossing program generated 418 single andthree-way crosses. Crossing strategiesemphasized improved milling and bakingquality, stripe rust resistance, strawbreakerfoot rot tolerance, Russian wheat aphidresistance, and enhanced yield potential.
Early generation winter club materialplanted at the Pendleton Research Stationconsisted of approximately 400 F2
populations, and 12,200 F4, 11,500 F5, and4,000 elite club headrows. Approximately6,600 selected F3 bulks were planted at theSherman Research Station.
Yield trials were conducted at theSherman and Pendleton Research Stations.The elite and advanced club trials consistedof 36 and 30 entries, respectively. A clubmix yield trial compared 30 entries, whichconsisted of three-way mixtures of advancedclub lines. Seven preliminary club yieldtrials compared 315 club lines at thePendleton Research Station. Promisingclub lines have been identified in the eliteand advanced yield trials. Quality and yielddata shown in the graphs represent averagesfrom five years and several locations. Theyield data were collected from locationswith less than 14 inches average annualprecipitation (Arlington, Lexington,Heppner, and Moro) and locations withmore than 16 inches average annualprecipitation (Athena, Helix, LaGrande,and Pendleton). Disease resistance noteswere taken for at least two years.
Drill strips of five promising eliteclub lines were sown at Don Miller's farm,Sherman County, in September 1992. Thefive lines, 90C122, 90C131, 90C133, 90C155,and 90C171, show promising yield potential,quality, and disease resistance.
Figures 6 to 9 show the milling and
baking quality of the five elite lines incomparison to three checks, Tres, Hyak,and Rohde (OR855).
ELITE CLUB LINESGRAIN AND FLOUR PROTEN
Figure 6. Flour and grain protein forelite club lines.
ELITE CLUB LINESMILLING SCORE
000122 110001 1CK123 SOCKS 011CI71 1113 MINX 101:4LIE OR VARIETY
Figure 7. Milling score for elite clublines.
ELITE CLUB LINESCOOKE DIAAETER
1 0
9.5
NI n I n I n n n
3 7:
ElMINI
nnn
n n n InI I
n I n n nn I I II I I
5: ElIN
nn
I n II I I In n n n n I
58:MI
nn
I n
I n -I I I III
wan 000131 000133 IOCISS 000171 NIS MIX KKKLIE OR VARETY
Figure 8. Cookie diameter for elite clublines
86
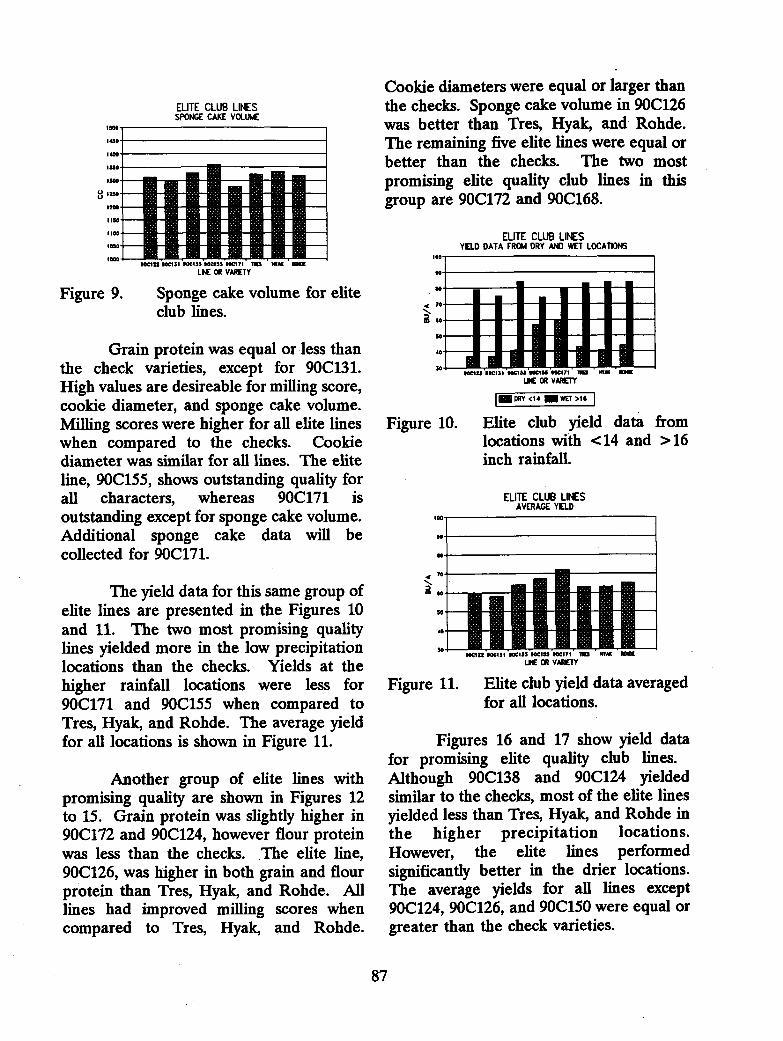
111111WITEAUT:14 1 1MA11:111
ELITE CLUB LINESSPONGE CAKE VOLUME
InIIMnn
000172 104131 000133 905155 104171 1110 NUE OM
LNE OR VARETY
Figure 9. Sponge cake volume for eliteclub lines.
Grain protein was equal or less thanthe check varieties, except for 90C131.High values are desireable for milling score,cookie diameter, and sponge cake volume.Milling scores were higher for all elite lineswhen compared to the checks. Cookiediameter was similar for all lines. The eliteline, 90C155, shows outstanding quality forall characters, whereas 90C171 isoutstanding except for sponge cake volume.Additional sponge cake data will becollected for 90C171.
The yield data for this same group ofelite lines are presented in the Figures 10and 11. The two most promising qualitylines yielded more in the low precipitationlocations than the checks. Yields at thehigher rainfall locations were less for90C171 and 90C155 when compared toTres, Hyak, and Rohde. The average yieldfor all locations is shown in Figure 11.
Another group of elite lines withpromising quality are shown in Figures 12to 15. Grain protein was slightly higher in90C172 and 90C124, however flour proteinwas less than the checks. The elite line,90C126, was higher in both grain and flourprotein than Tres, Hyak, and Rohde. Alllines had improved milling scores whencompared to Tres, Hyak, and Rohde.
Cookie diameters were equal or larger thanthe checks. Sponge cake volume in 90C126was better than Tres, Hyak, and Rohde.The remaining five elite lines were equal orbetter than the checks. The two mostpromising elite quality club lines in thisgroup are 90C172 and 90C168.
ELITE CLUB LINESVELD DATA FROM DRY AND WET LOCATIONS
NUM••1111nnnnnnnnnnnn 1- 1 nnnnFormWT111111111
005123 005131 1105133 110C111 005171 MEI WM 5030
LIE OR VARETY
1E1 DRY <14 NM WET >16
Figure 10. Elite club yield data fromlocations with <14 and >16inch rainfall.
Figure 11. Elite club yield data averagedfor all locations.
Figures 16 and 17 show yield datafor promising elite quality club lines.Although 90C138 and 90C124 yieldedsimilar to the checks, most of the elite linesyielded less than Tres, Hyak, and Rohde inthe higher precipitation locations.However, the elite lines performedsignificantly better in the drier locations.The average yields for all lines except90C124, 90C126, and 90C150 were equal orgreater than the check varieties.
1500
1430
1400
1350
1300
1150
1000
1000 100
00
10
70
00
SO
30
100
N
se
30
87

1-1 r11-11NI 1 1 1 1 1NI 1 1 1 1.11111 1 1 1 1 1NI 1 1 1 1 1NI 1 1 1 1 1OM 1 1 1 1;<1
1 11 11 11:'11 1
90C17290C1111190C1341103143110012490312$ IRS MIRK umLINE OR VARETY
1500
1430
1400
1300
8 12130
1250
1130
1100
1030
1000
IOW
ELITE CLUB QUALITY LINES
ELITE CLUB QUALITY LINESGRAIN AND FLOUR PROTEIN
SPONGE CAKE VOLUME
Figure 12. Grain and flour protein forpromising elite club qualitylines.
Figure 15. Sponge cake volume forpromising elite club qualitylines.
ELITE CLUB QUALITY LINESMILLING SCORE
100 ELITE CLUB LINESYIELD DATA FROM DRY AND WET LOCATIONS
93
$0
1 1 1 1 1843 56
2ng
SO
111111
111111
111111
111111
111111
111111
111111
11 MI1111 1M
1W11 nnn 1111=1111M• I 111111FFI11111111111• I Fill I mutt11111111P111111•1
90C17390C1011110C1349004390312410C124 ISIS 14101 MCC sin NOM NO• “IftY MIN
Lit at VARETY LIE OR VARETY
MI DRY <14 1.1 WET >16
Figure 13. Milling score for promisingelite club quality lines.
ELITE CLUB QUALITY LINESCOOKIE DIAMETER
10
9.6
9.5.1 11 :_1
11
1 11 1
1 1 1 1 1 VIAM1<1 1 1<:11:<::1 1 11 1 1 11 1 1 1 VIVIEN1 1 1 1
90C173110C14490C13090C1431103124904121 WI RCM
LIE OR VARETY
Figure 16. Yield data for promising elitequality lines at locations with<14 and >16 inch rainfall.
Figure 14. Cookie diameter for Figure 17. Yield data for promising elitepromising elite club quality club lines averaged for alllines. locations.
88
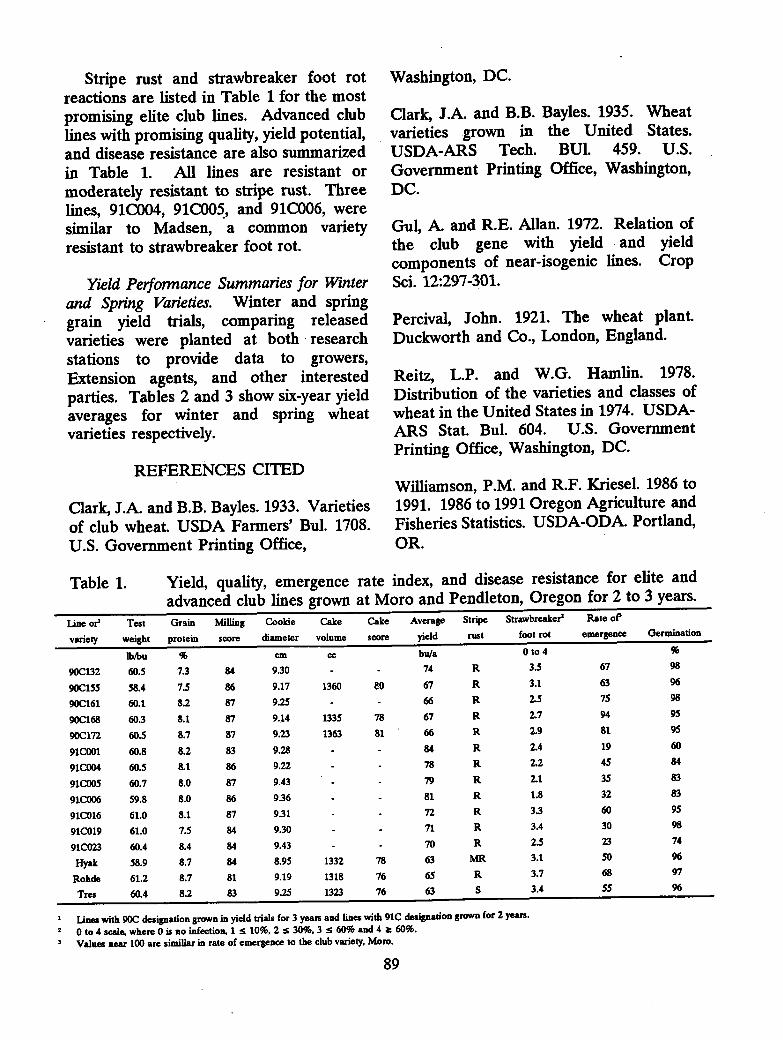
Stripe rust and strawbreaker foot rotreactions are listed in Table 1 for the mostpromising elite club lines. Advanced clublines with promising quality, yield potential,and disease resistance are also summarizedin Table 1. All lines are resistant ormoderately resistant to stripe rust. Threelines, 91C004, 91C005, and 91C006, weresimilar to Madsen, a common varietyresistant to strawbreaker foot rot.
Yield Performance Summaries for Winterand Spring Varieties. Winter and springgrain yield trials, comparing releasedvarieties were planted at both researchstations to provide data to growers,Extension agents, and other interestedparties. Tables 2 and 3 show six-year yieldaverages for winter and spring wheatvarieties respectively.
REFERENCES CITED
Clark, J.A. and B.B. Bayles. 1933. Varietiesof club wheat. USDA Farmers' Bul. 1708.U.S. Government Printing Office,
Washington, DC.
Clark, J.A. and B.B. Bayles. 1935. Wheatvarieties grown in the United States.USDA-ARS Tech. BU1. 459. U.S.Government Printing Office, Washington,DC.
Gul, A. and R.E. Allan. 1972. Relation ofthe club gene with yield and yieldcomponents of near-isogenic lines. CropSci. 12:297-301.
Percival, John. 1921. The wheat plant.Duckworth and Co., London, England.
Reitz, L.P. and W.G. Hamlin. 1978.Distribution of the varieties and classes ofwheat in the United States in 1974. USDA-ARS Stat. Bul. 604. U.S. GovernmentPrinting Office, Washington, DC.
Williamson, P.M. and R.F. Kriesel. 1986 to1991. 1986 to 1991 Oregon Agriculture andFisheries Statistics. USDA-ODA. Portland,OR.
Table 1. Yield, quality, emergence rate index, and disease resistance for elite andadvanced club lines grown at Moro and Pendleton, Oregon for 2 to 3 years.
Line or'
variety
Test
weight
Grain
protein
Milling
score
Cookie
diameter
Cake
volume
Cake
score
Average
yield
Stripe
rust
Strawbreaker'
foot rot
Rate of
emergence Germination
Ibibu % cm cc bu/a 0 to 4
90C132 60.5 7.3 84 9.30 - 74 R 3.5 67 98
90C155
90C161
58.4
60.1
7.5
8.2
86
87
9.17
9.25
1360 80 67
66
R 3.1
2.5
63
75
96
98
60.3
-
90C168 8.1 87 9.14 1335 78 67 2.7 94 95
90C172 60.5 8.7 87 9.23 1363 81 66 2.9 81 95
91C001 60.8 8.2 83 9.28 84 2.4 19 60
91C004 60.5 8.1 86 9.22 78 2.2 45 84
91C005 60.7 8.0 87 9.43 79 2.1 35 83
91C006 59.8 8.0 86 9.36 81 1.8 32 83
91C016 61.0 8.1 87 9.31 72 3.3 60 95
91C019 61.0 7.5 84 930 71 3.4 30 98
91CO23 60.4 8.4 84 9.43 70 2.5 23 74
Hyak 58.9 8.7 84 8.95 1332 78 63 MR 3.1 50 96
Rohde 61.2 8.7 81 9.19 1318 76 65 3.7 68 97
Tres 60.4 8.2 83 9.25 1323 76 63 3.4 55 96
Lines with 90C designation grown in yield trials for 3 years and lines with 91C designation grown for 2 years.
0 to 4 scale, where 0 is no infection, 1 5 10%, 2 5 30%, 3 5 60% and 4 Z 60%.3 Values near 100 are similiar in rate of emergence to the club variety, Moro.
89
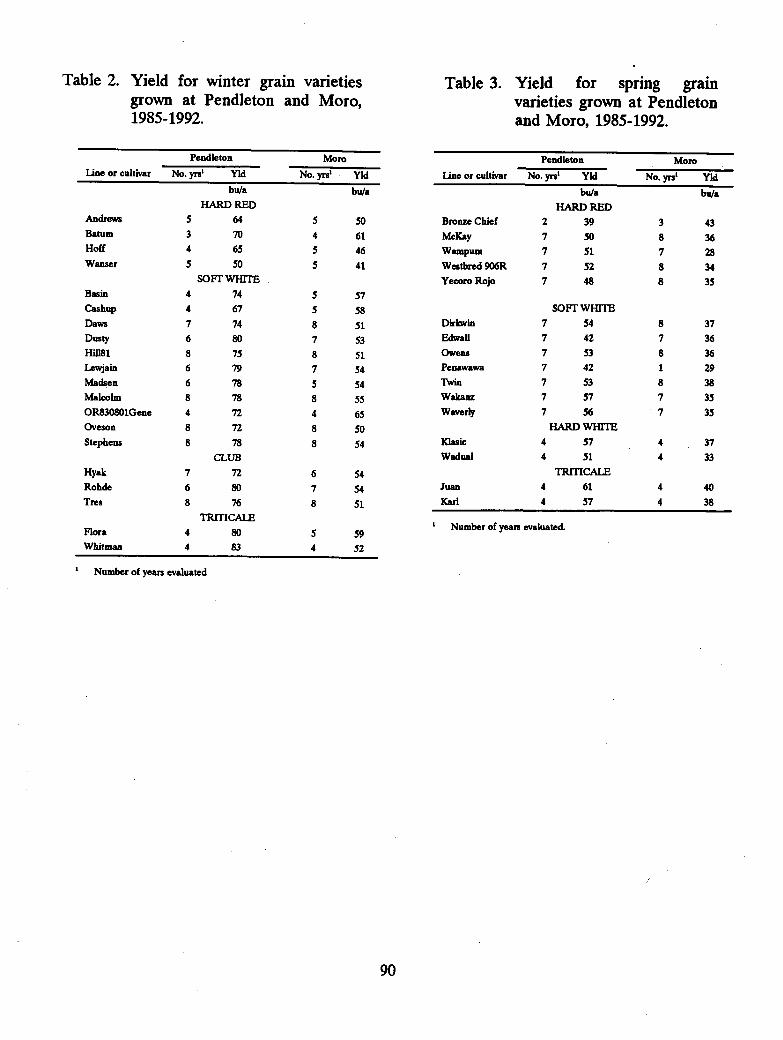
Table 2. Yield for winter grain varieties Table 3. Yield for spring grain
grown at Pendleton and Moro, varieties grown at Pendleton1985-1992.
Line or cultivar
Pendleton Moro
No. yrs' Yld No. yrs' Yldbu/a bu/a
HARD REDAndrews 5 64 5 50Batum 3 70 4 61Hoff 4 65 5 46Wanser 5 50 5 41
SOFT WHITEBasin 4 74 5 57Cashup 4 67 5 58Daws 7 74 8 51Dusty 6 80 7 53Hi1181 8 75 8 51Lewjain 6 79 7 54Madsen 6 78 5 54Malcolm 8 78 8 55OR830801Gene 4 72 4 65Oveson 8 72 8 50Stephens 8 78 8 54
CLUBHyak 7 72 6 54Rohde 6 80 7 54Tres 8 76 8 51
TRTTICALEFlora 4 80 5 59Whitman 4 83 4 52
' Number of years evaluated
and Moro, 1985-1992.
Line or cultivar
Pendleton Moro
No. yrs' Yld No. yrs' Yld
bu/a bu/aHARD RED
Bronze Chief 2 39 3 43McKay 7 50 8 36Wampum 7 51 7 28Westbred 906R 7 52 8 34Yecoro Rojo 7 48 8 35
SOFT WHITEDirkwin 7 54 8 37Eciwall 7 42 7 36Owens 7 53 8 36Penawawa 7 42 1 29Twin 7 53 8 38Wakanz 7 57 7 35Waverly 7 56 7 35
HARD WHITEKlasic 4 57 4 37Wadual 4 51 4 33
TRITICALEJuan 4 61 4 40
Karl 4 57 4 38
Number of years evaluated.
90
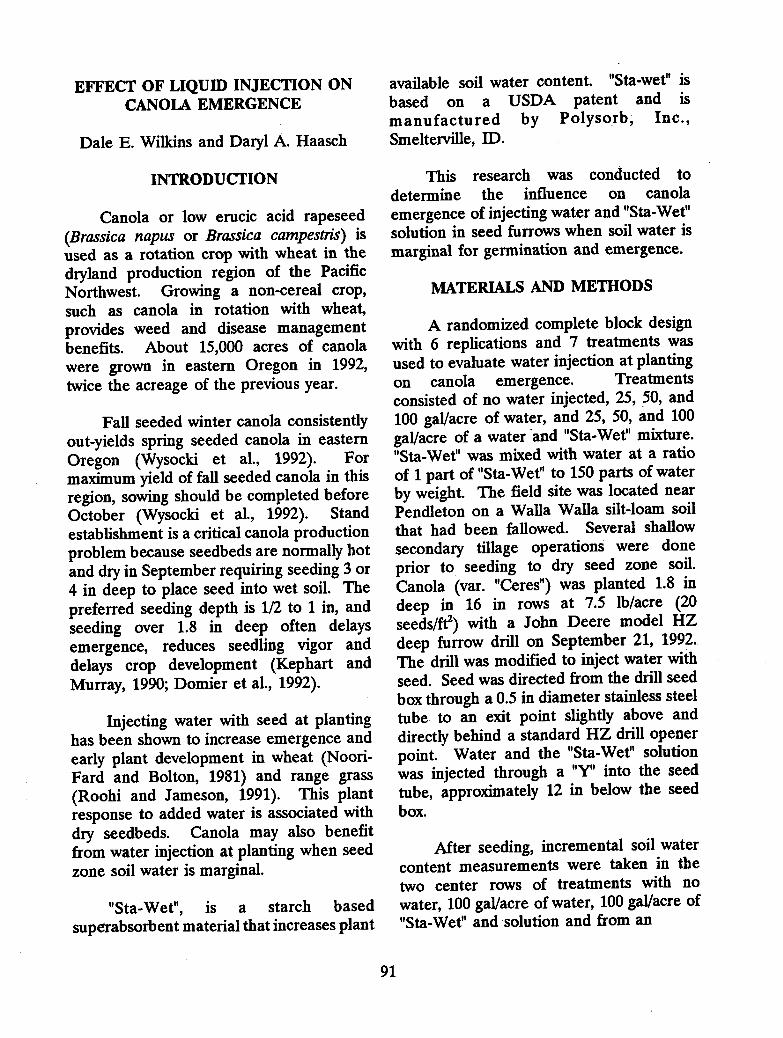
EFFECT OF LIQUID INJECTION ONCANOLA EMERGENCE
Dale E. Wilkins and Daryl A. Haasch
INTRODUCTION
Canola or low erucic acid rapeseed(Brassica napus or Brassica campestris) isused as a rotation crop with wheat in thedryland production region of the PacificNorthwest. Growing a non-cereal crop,such as canola in rotation with wheat,provides weed and disease managementbenefits. About 15,000 acres of canolawere grown in eastern Oregon in 1992,twice the acreage of the previous year.
Fall seeded winter canola consistentlyout-yields spring seeded canola in easternOregon (Wysocki et al., 1992). Formaximum yield of fall seeded canola in thisregion, sowing should be completed beforeOctober (Wysocki et al., 1992). Standestablishment is a critical canola productionproblem because seedbeds are normally hotand dry in September requiring seeding 3 or4 in deep to place seed into wet soil. Thepreferred seeding depth is 1/2 to 1 in, andseeding over 1.8 in deep often delaysemergence, reduces seedling vigor anddelays crop development (Kephart andMurray, 1990; Domier et al., 1992).
Injecting water with seed at plantinghas been shown to increase emergence andearly plant development in wheat (Noori-Fard and Bolton, 1981) and range grass(Roohi and Jameson, 1991). This plantresponse to added water is associated withdry seedbeds. Canola may also benefitfrom water injection at planting when seedzone soil water is marginal.
"Sta-Wet", is a starch basedsuperabsorbent material that increases plant
available soil water content. "Sta-wet" isbased on a USDA patent and ismanufactured by Polysorb, Inc.,Smelterville, ID.
This research was conducted todetermine the influence on canolaemergence of injecting water and "Sta-Wet"solution in seed furrows when soil water ismarginal for germination and emergence.
MATERIALS AND METHODS
A randomized complete block designwith 6 replications and 7 treatments wasused to evaluate water injection at plantingon canola emergence. Treatmentsconsisted of no water injected, 25, 50, and100 gal/acre of water, and 25, 50, and 100gal/acre of a water and "Sta-Wet" mixture."Sta-Wet" was mixed with water at a ratioof 1 part of "Sta-Wet" to 150 parts of waterby weight. The field site was located nearPendleton on a Walla Walla silt-loam soilthat had been fallowed. Several shallowsecondary tillage operations were doneprior to seeding to dry seed zone soil.Canola (var. "Ceres") was planted 1.8 indeep in 16 in rows at 7.5 lb/acre (20seeds/ft') with a John Deere model HZdeep furrow drill on September 21, 1992.The drill was modified to inject water withseed. Seed was directed from the drill seedbox through a 0.5 in diameter stainless steeltube to an exit point slightly above anddirectly behind a standard HZ drill openerpoint. Water and the "Sta-Wet" solutionwas injected through a "Y" into the seedtube, approximately 12 in below the seedbox.
After seeding, incremental soil watercontent measurements were taken in thetwo center rows of treatments with nowater, 100 gal/acre of water, 100 gal/acre of"Sta-Wet" and solution and from an
91
20
• UNDISTRUBED♦ NO LIQUIDn WATER 100 gal/ac• Sta—Woe 100 gal/co
0
undisturbed area between the center tworows. Four-inch-deep soil cores were takenwith a 2 in square sampler. These soilcores were sectioned into 3/8 in increments.Corresponding increments from the twocenter rows were composited and ovendried for 24 hours at 105°C. Theseincremental soil samples were examined forcanola seed to determine planting depth.
Emergence observations were madedaily for one meter of row in each of thecenter two rows. Daily maximum andminimum air temperatures observed at theResearch Center's official weather stationwere used to calculated growing degreedays accumulated from date of seeding.Accumulated growing degree days (AGDD)were calculated from the following:
AGDD=i Tma Tmi xi nekbase temp)2
where T was the maximum airtemperature in °F for the ith day; Tiume wasthe minimum air temperature in °F for theith day: and base temperature was 32 °F."TableCurve" a computer curve fittingprogram by Jandel Scientific was used todetermine the best fit of the equation:
y = a + (b/x) + (c/x2) + (d/ex)
where y is the percent of plants emerged, xis the accumulated growing degree days anda, b, c and d are fitted constants.Equations were fitted for each plot. Fromthese equations the accumulated growingdegree days to 1 and 10 percent emergencewere calculated.
RESULTS
Figure 1 shows the seed zone soilwater profile immediately after planting.The bottom curve represents soil that wasundisturbed by drill openers, and the topthree curves represent soil within rows fromtreatments with no liquid, from rowstreated with 100 gal/acre of water fromrows treated with and 100 gal/acre of "Sta-wet" solution injected with the seed. "Sta-Wet" solution applied at 100 gal/acrecreated a slightly wetter soil condition inthe top 2 in of soil than either the 100gal/acre of water or the no liquid injectedtreatment, but this difference was notsignificant (P = 0.05).
Figure 1. Seed zone soil water content.
92
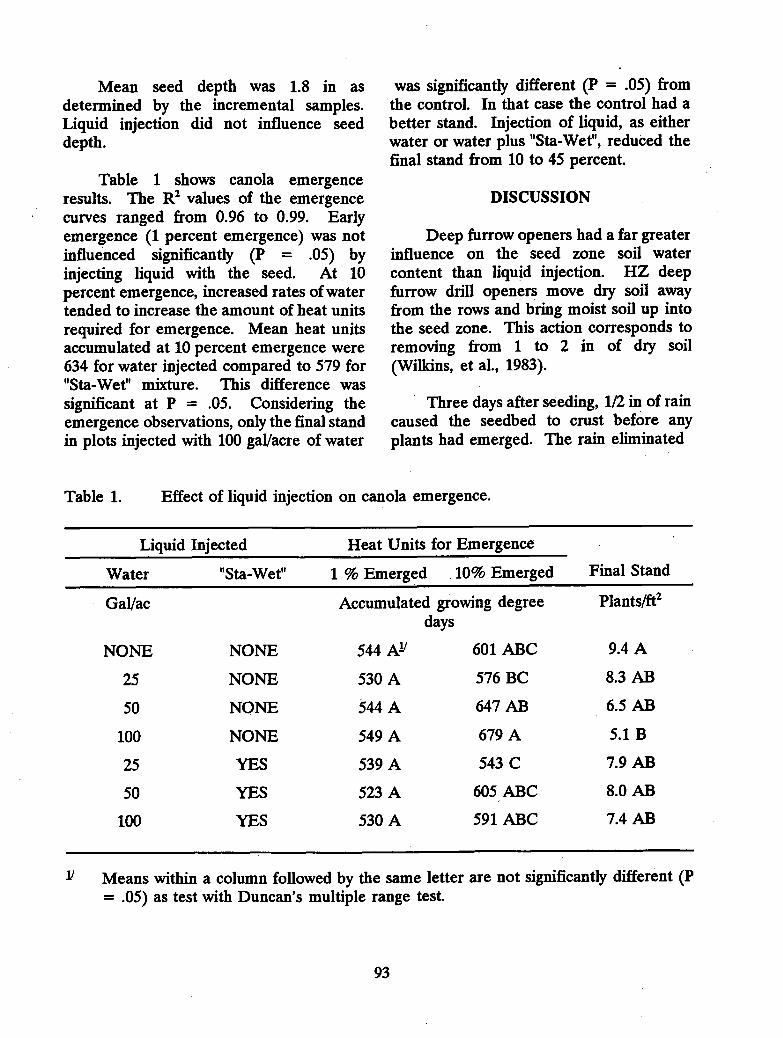
Mean seed depth was 1.8 in asdetermined by the incremental samples.Liquid injection did not influence seeddepth.
Table 1 shows canola emergenceresults. The R2 values of the emergencecurves ranged from 0.96 to 0.99. Earlyemergence (1 percent emergence) was notinfluenced significantly (P = .05) byinjecting liquid with the seed. At 10percent emergence, increased rates of watertended to increase the amount of heat unitsrequired for emergence. Mean heat unitsaccumulated at 10 percent emergence were634 for water injected compared to 579 for"Sta-Wet" mixture. This difference wassignificant at P = .05. Considering theemergence observations, only the final standin plots injected with 100 gal/acre of water
was significantly different (P = .05) fromthe control. In that case the control had abetter stand. Injection of liquid, as eitherwater or water plus "Sta-Wet", reduced thefinal stand from 10 to 45 percent.
DISCUSSION
Deep furrow openers had a far greaterinfluence on the seed zone soil watercontent than liquid injection. HZ deepfurrow drill openers move dry soil awayfrom the rows and bring moist soil up intothe seed zone. This action corresponds toremoving from 1 to 2 in of dry soil(Wilkins, et al., 1983).
Three days after seeding, 1/2 in of raincaused the seedbed to crust before anyplants had emerged. The rain eliminated
Table 1. Effect of liquid injection on canola emergence.
Liquid Injected Heat Units for Emergence
Final StandWater "Sta-Wet" 1 % Emerged 10% Emerged
Gal/ac Accumulated growing degreedays
Plants/ft2
NONE NONE 544 Ali 601 ABC 9.4 A
25 NONE 530 A 576 BC 8.3 AB
50 NONE 544 A 647 AB 6.5 AB
100 NONE 549 A 679 A 5.1 B
25 YES 539A 543C 7.9 AB
50 YES 523 A 605 ABC 8.0 AB
100 YES 530 A 591 ABC 7.4 AB
1/ Means within a column followed by the same letter are not significantly different (P= .05) as test with Duncan's multiple range test.
93
the dry, stressful condition and providedsufficient soil water for germination andemergence. Although the original objectiveof the experiment was to study the effect ofliquid injection on canola plant emergencefrom a dry seedbed, the study wascontinued to evaluate the effect of liquidinjection on canola emergence from acrusted seedbed. A crusting conditionoccasionally is encountered with Septemberseedings in the Pendleton area, and it wasthought this experiment might providevaluable information about canolaemergence in a crusted seedbed.
The first canola plants began toemerge eight days after seeding whenapproximately 550 growing degree days hadaccumulated. Liquid injection at seeding didnot speed canola emergence (feweraccumulated growing degree days required)as compared to no liquid injection. Thehighest rate of water injection, 100 gal/acre,required the most heat units to reach 1 and10 percent emergence and resulted in thelowest final stand. "Sta-Wet" added towater reduced the detrimental effect ofliquid injection at 50 and 100 gal/acre rates.
Largest final stand was in the controlplots where no liquid was injected. Therewere 9.4 plants/acre in these plots, whichrepresented less than half of the seeds thatwere planted per square foot. Injecting 100gal/acre of water produced the lowest finalstand. It is possible that the liquid injectedat seeding contributed to crusting.
CONCLUSIONS
Injecting water, or water plus "Sta-Wet", with canola seed did not improveplant emergence in a crusted seedbed."Sta-Wet" added to water at a ratio of 1:150tended to reduce the negative influence ofliquid injection.
REFERENCES
Domier, K.W., W.M. Wasylciw, D.S.Chanasyk and J.A. Robertson. 1992.Response of canola and flax to seedbedmanagement practices. Paper no. 92-1561.Amer. Soc. of Agric. Engr., St. Joseph, MI.
Kephart, Kenneth D. and Glen A. Murray.1990. Dryland winter rapeseed productionguide. Cooperative Extension SystemBulletin 715. Univ. of Idaho, Moscow,Idaho.
Noori-Fard, F. and F.E. Bolton. 1981. Theeffect of water injection and starterfertilizer on stand establishment andcomponents of yield. pp. 60-62. In 1981Columbia Basin Agric. Res., Oregon Agric.Expt. Stn. Special Report 623.
Roohi, R. and D.A. Jameson. 1991. Theeffect of hormone, dehulling and seedbedtreatments on germination and adventitiousroot formation in blue grama. J. RangeManagement 44(3):237-241.
Wilkins, D.E., G.A. Muilenburg, R.R.Alimaras, and C.E. Johnson. 1983. Grain-drill opener effects on wheat emergence.Trans. of the Amer. Soc. Agric. Engr.26(3):651-655 and 660.
Wysocki, Don, Sandra Ott, Michael Stoltzand Thomas Chastain. 1992. Variety andplanting date effects on dryland canola. In1992 Columbia Basin Agric. Res., OregonAgric. Expt. Stn. Special Report. 894.
94

ABOVE-GROUND DEVELOPMENT OFFIVE WEED SPECIES AND THREECEREALS COMMON IN OREGON
CEREAL PRODUCTION
D. A. Ball, Betty Klepper,and D. J. Rydrych
INTRODUCTION
Winter annual grass weeds are aserious problem in current cerealproduction systems in the PacificNorthwest. Control of grass weeds incereals with crop protection chemicalsrequires proper application timing formaximum effectiveness. Further, in somesituations, grass weeds compete severelywith cereals, while at other times weedcompetition may be slight depending on theprevailing conditions for cereal and weedgrowth.
Seedling development rates of fivecommon annual weedy grasses werecompared with development rates of wheat(Triticum aestivum L. "Stephens"), barley(Hordeum vulgare L. "Hesk"), and triticale(X Triticosecale "Breaker"). The weedsincluded bulbous bluegrass (Poa bulbosaL.), downy brome (Bromus tectorum L.),jointed goatgrass (Aegilops cylindrica Host.),Italian ryegrass (Lolium multiflorum Lam.),and wild oat (Avena fatua L.).Approximately 2 million acres of smallgrains in Washington, and 1 million acres inOregon and Idaho are infested with one ora combination of these annual grass species(Rydrych, 1974). Successful methods ofcontrol for these weeds could increasewinter cereal yield by 35 percent in Oregon(Rydrych, 1974). Cultural and chemicalsystems provide varying degrees of controlfor downy brome, bulbous bluegrass, Italianryegrass, and wild oat. Only culturalcontrol methods are effective on jointed
goatgrass.
This study emphasized observationsduring the seedling stage of developmentsince current weed control practices are themost effective at that stage. Comparisonswere made between a) main stem leafdevelopment rates between species basedon accumulated growing degree days(GDD) from time of planting, b)measurements of time of tiller appearancerelative to main stem leaf appearance, andc) plant height for each species at variousgrowth stages. A better understanding ofthe growth of grassy weeds in comparisonto the growth of cereal grains can lead toimproved weed control through moreeffective herbicide application timings, andthrough a better understanding of howweeds compete with cereal crops.
MATERIALS AND METHODS
The experimental work was conductedduring the 1990-91 and 1991-92 fieldseasons at the Columbia Basin AgriculturalResearch Center, Pendleton, OR. Datafrom a weather station at the site were usedfor calculating GDD with a basetemperature of 0°C. Grass seedling partswere identified using a system developed byUSDA-ARS researchers at Pendleton(Klepper et al., 1982, 1984).
Each fall, small replicated plots wereplanted to pure stands of each weed andcereal. For each grass, periodic sampleswere taken during the seedling growthperiod to evaluate the main stem leafnumber, tiller number and position, andplant height. At each sampling time, GDDfrom planting were calculated. Thepercentage of sampled plants having tillersTO through T4 were determined. Seed bedconditions were considerably differentbetween 1991 and 1992, so observations for
95
each year were evaluated separately, andpooled if year differences were insignificant.In 1991, dry, rough seed bed conditionsexisted, while in 1992, pre-irrigation of theseed bed produced more desirableconditions for seedling emergence anddevelopment.
RESULTS AND DISCUSSION
Individual seed weight averaged lessthan 4 mg for bulbous bluegrass, downybrome, and Italian ryegrass, between 10 and15 mg for jointed goatgrass and wild oat,and over 30 mg for the three cereals.These weights were determined afterremoval of extraneous parts down to thefruit coat. Thus potential resources forseedlings are very much larger in cerealsthan in weeds and better for jointedgoatgrass and wild oat than for the otherweeds studied. Species in order ofincreasing seed weight were bulbousbluegrass < downy brome < Italianryegrass < jointed goatgrass < wild oat <barley < wheat < triticale. The larger-seeded species (cereals and jointedgoatgrass) had a distinct growth advantageprior to the 5-leaf stage that would tend togive them an early competitive advantage.
The rate at which each speciesproduced leaves was measured by plottingmain stem leaf number of plants vs. GDDaccumulated since planting. All eightspecies exhibited a linear fit for thisrelationship. Thus, like wheat, other cerealsand weedy grasses could be modelled usingGDD as the primary predictor. The slopeof this linear relationship between mainstem leaf number and cumulative GDD isan indication of the rate at which eachspecies produces leaves and tillers. Of thespecies evaluated, downy brome producedleaves at a significantly faster rate than allof the other species except wild oat.
Environmental factors play a role indetermining the leaf development rate.However, the rank between species on leafdevelopment rate was fairly consistent fromyear to year. In 1992 better seed bedconditions permitted more convincingcomparisons. In 1992 the rate of leafdevelopment from most rapid to slowestwas bulbous bluegrass > downy brome >barley > wild oat > Italian ryegrass >wheat > triticale > jointed goatgrass.
Wheat and the larger seeded weedspecies usually produced coleoptiler (TO)tillers. In general, beginning with Tiller 1(T1), the tillers of all species appeared atapproximately the same leaf developmentstage (Haun stage) as seen in wheat.Further, in the weedy grasses main stemleaf number, when individual tillersappeared, was not significantly differentwhen compared across the two years of thestudy with the exception of jointedgoatgrass. Tiller appearance in the cereals,however, was slowed by the less desirableconditions in 1991 compared to 1992 plotswhere seed bed conditions were muchbetter. Because of less ideal seed bedconditions in 1991, T1 tillers were delayedby 0.25 phyllocrons in wheat, barley,triticale, and jointed goatgrass. T2 tillerswere delayed an average of 0.15 phyllocronsfor wheat and jointed goatgrass. Theseresults are consistent with previous researchshowing that early tillers in wheat aredelayed with respect to their normalappearance time under poor seed bedconditions (Wilkins et al., 1989; Rickmanand Klepper, 1991). The weeds weregenerally less responsive to environmentwith respect to the timing of tillerappearance than were the cereals. Thismay indicate that these grassy weeds wouldtend to be more competitive with cerealsunder poor growing conditions.
96
Wild oat and bulbous bluegrassproduced T3 tillers significantly later inmain stem development that did the otherspecies in both years. However, the generalpattern for tiller production was remarkablylike wheat for all of the species.
Plant height also increased betweenthe full emergence and 6-leaf sample for allspecies in each year except for wild oat in1991, wheat in 1992, and triticale in 1992.At the seedling stages of these grasses,plant height is actually a measure of leaflength. Generally, heavier seed producedtaller seedlings at all three sampling times.The cereals and the large-seeded weedspecies tended to have leaf lengths thatincreased very little from emergence to the6-leaf stage, whereas the smaller-seededweeds show distinct increases in height overtime. Thus, by the 5 to 6 leaf stage, thesmaller-seeded weed species generallyimproved their competitive situation withrespect to canopy stature and presumablylight capture.
Information derived from this studyhelps explain why grass weeds vary in theircompetitive ability with cereal grains fromyear to year and between geographiclocations. Comparing development ratesbetween weeds and wheat also providesinformation needed to develop growthmodels of important weeds. Growthmodels can be used to help predict theemergence of grass weeds in wheat, andimprove herbicide application timing. In
the future, models could be used todetermine the competitiveness of weedsgrowing in wheat, and perhaps limitherbicide applications to only thosenecessary for control of economicallydamaging weed infestations. This in turnwould increase farm profitability due tomore effective use of weed control.
LITERATURE CITED
Klepper, Betty, R. K. Belford, and R. W.Rickman. 1984. Root and shootdevelopment in winter wheat. Agron. J.76:117-122.
Klepper, B., R. W. Rickman, and C. M.Peterson. 1982. Quantitativecharacterization of vegetative developmentin small cereal grains. Agron. J. 74:781-784.
Rickman, R. W. and B. Klepper. 1991.Tillering in wheat. pp. 73-84. In (T.Hodges, Ed.) Physiological Aspects ofPredicting Crop Phenology. CRC Press.Boca Raton, Fla.
Rydrych, D. J. 1974. Competition betweenwinter wheat and downy brome. Weed Sci.22:211-214.
Wilkins, D. E., B. Klepper, and R. W.Rickman. 1989. Measurement of wheatseedling response to tillage. Trans. ASAE32:795-799.
97
CROWN AND ROOT SYSTEMS OFFIVE WEEDS AND THREE CEREALS
Betty Klepper, D. J. Rydrych,and D. A. Ball
Weeds in the grass family causeserious problems in cereal crops. Grassyweeds are very difficult to control withherbicides because they are so similar tocereals in their life-cycle and environmentalrequirements. It is difficult to obtainsufficient selectivity to control weedswithout injuring the crop. We studiedcrown and root systems of five weedygrasses and three cereals from 1990 to 1992to examine below ground differences forexploitation in weed-control programs.
Root systems and crowns of grassescan take several forms. For example, wheathas a coleoptile produced from the level ofthe seed. This coleoptile elongates toprovide the emergence thrust of theseedling. In wheat crops seeded deeperthan one inch or so, the sub-crowninternode elongates to set the depth of thecrown. The crown in wheat consists of theleaf bases, nodes and stems of the lower 4to 6 leaves on the plant (Figure 1). Somegrasses, such as downy brome, have adifferent anatomy and a different sequenceof early internode elongation. Theyelongate the mesocotyl, the internodebetween the seed and the coleoptile.Therefore, these grasses have a crown thatconsists of the coleoptile, lower leaf bases,nodes, and their associated stems. Thisdifference is important because of thedifference in timing of crown rootappearance that results from the twopatterns. The downy brome type producescrown roots sooner than the wheat type.
The crops we studied included winterwheat, barley, and triticale. The weed
species were bulbous bluegrass, downybrome, Italian rye grass, jointed goatgrass,and wild oat. The objective of the studywas to determine the number and time ofappearance of the seminal and crown rootsystems of each species.
MATERIALS AND METHODS
Seed of the cereals were obtained fromcommercial sources. Weed seed werecollected from fields in eastern Oregon.Plots of each of the eight species wereplanted on the Pendleton Station in the fallof 1990 and 1991. Sample plants werecollected for measurement at fullemergence, the 3-leaf stage, and a laterstage when plants had 5 to 6 leaves andseveral tillers. We usually measured seeddepth, crown depth, mesocotyl length,coleoptile length, and numbers and order ofbranching of seminal and crown roots.
RESULTS AND DISCUSSION
Techniques developed to characterizewheat root systems worked very well for theother grasses (Klepper et al., 1982, 1984).Seminal root systems of the eight speciesdecreased in relative vigor (size, branchproduction) in the following order: triticale> wheat > jointed goatgrass > barley >wild oat > downy brome > Italian rye grass> bulbous bluegrass. Generally this orderof size of the seminal root system wassimilar to the order of seed size, withsmaller seminal root systems from small-seeded species (Table 1).
Two of the weeds, bulbous bluegrassand goatgrass, and all of the cerealsdeveloped crowns like wheat; the coleoptileremained at the seed level (Figure 1).However, Italian rye grass and downybrome both had short mesocotyls and wildoat had a long mesocotyl (Table 2).
98

Table 1. For 8 species, mean seed weight (mg), average seminal root number for each year of thestudy, and average nodal root number for each of 3 destructive samples for each year of thestudy.
Crown axis number
Meanseedwt.'
(mg)
Seminal axes
1991 1992
1991 1992
Fullemergence
3 Lf 5 Lf FullEmergence
3 Lf 6 Lf
Bulbous 1 3 3 0 4 7 0 1 6Bluegrass
Downy 2 2 2 1 4 8 1 4 10Brome
Italian 3 2 2 5 9 13 1 4 13Ryegrass
Jointed 10 4 4 0 2 4 2 2 8Goatgrass
Wild Oat 13 3 3 2 (3)• 2 0 1 7
Barley 31 4 4 0 2 6 1 3 5
Wheat 50 5 5 0 1 3 0 2 6
Triticale 61 6 6 0 3 8 1 6 11
• ( ) indicates n < 3.
* Mean seed weights were determined from approximately 10 randomly-selected seeds from the 1991 seedlots.
Table 2. Mean seed depth, coleoptilar length, and mesocotyl length (cm) at full emergence for 8 grassspecies in each crop year.
1991 1992
Seed
Depth
Coleoptilar
Length
Mesocotyl
Length
Seed
Depth
Coleoptilar
Length
Mesocotyl
Length
Bulbous Bluegrass 0.6 0.6 NONE 0.5 0.7 NONE
Downy Brome 2.7 2.4 0.3 1.9 2.0 0.3
Italian Ryegrass 2.7 1.3 1.4 2.2 1.3 1.3
Jointed Goatgrass 3.2 3.6 NONE 3.2 3.5 NONE
Wild Oat 3.7 2.3 2.4 1.9 1.8 0.9
Barley 5.5 4.6 NONE 2.8 3.3 NONE
Wheat 5.2 5.2 NONE 3.0 3.5 NONE
Triticale 4.9 5.7 NONE 3.0 3.4 NONE
99

Leaf 1
Node 0
Leaf 1-/7
SuberownInternode—)
Node 0 .,„1
Wheat
Barley
Triticale
Bulbous bluegrass
Goatgrass
Downy brome
Wild oat
Italian ryegrass
Figure 1. Diagram showing the placement of the coleoptilar node with respect to the seed and the crownin the two types of grass morphology found in the study.
Three weed species had a crown thatincluded the coleoptiler node and its roots.In theory, they should have shown crownroots sooner than the other species. Table1 shows that these three species tended tohave fewer seminal axes relative to seedweight than other species and to have morecrown axes than the others early indevelopment.
CONCLUSIONS
The three weed species that producecrown roots early relative to the cerealsmay be vulnerable to certain herbicides orother weed control practices. Theinformation obtained in this study may alsoimprove understanding of the relativecompetitiveness among these eight species,especially in the Pacific Northwestwheat/fallow rotations where soil moistureis a limiting resource.
REFERENCESThe five grass species studied
developed seminal roots and crown roots ina pattern determined by their crownmorphology. Bulbous bluegrass and jointedgoatgrass set their crowns by the elongationof the intemode between the coleoptile andthe first foliar leaf. They did not showmuch crown root development by the 3-leafstage. On the other hand, downy brome,Italian lye, and wild oat had crown rootssomewhat sooner than the others and setcrowns by the elongation of the internodebetween the seed and the coleoptile (Figure1).
Klepper, B., R. K. Belford, and R. W.Rickman. 1984. Root and shootdevelopment in winter wheat. Agron. J.76:117-122.
Klepper, B., R. W. Rickman, and C. M.Peterson. 1982. Quantitativecharacterization of vegetative developmentin small cereal grains. Agron. J. 74:780-792.
100
MODVVHT3,A NEW INSTRUMENT FOR
YOUR MANAGEMENT TOOL KIT
R.W. Rickman, S.E. Waldmanand B.L. Klepper
Today's farmers seek to maintainprofitable production while controlling lossof productive field soil to erosion by windor water. Unfortunately, achieving botherosion control and profitable productioncan become conflicting goals. The balanceof one against the other, or in the mostdesirable situation, achieving both with thesame management practices, requires highknowledge and management skill - and alittle luck. Increased knowledge about anyfarming system provides greatermanagement flexibility and less reliance onluck. Knowledge is often condensed froma large amount of information. One wayto condense information, and to distillrequired knowledge from it about cropresponse to farming practices, is to use cropgrowth models.
A model for winter wheat, MODWht3,was created at the USDA Columbia PlateauConservation Research Center in PendletonOregon. The model utilizes daily weatherand basic soil and planting information asinput, and provides daily wheat growth anddevelopment predictions as output.MODWht3 can provide daily estimates ofplant development in either Haun, Feekes,or Zadoks scales. It computes a daily waterbudget, keeping track of water lost torunoff, percolation below the root zone,evaporation, and transpiration. Nitrogenuptake and whole plant nitrogen contentare calculated daily. The size, weight, andtime of formation of each plant part isspecified. The fraction of plants in a fieldthat form specific tillers, and the number oftillers that survive to produce heads is
estimated. The beginning date of eachphenological growth stage (tillering, doubleridge, jointing, boot, anthesis, heading) isspecified. The relative weight of leaves,stems, heads, or roots to total plant weight,or relative to one another may be estimatedfor any day of the growing season.
Any one item or all of the aboveinformation may be obtained as data outputas frequently as daily. Usually it is only forresearch or validation purposes that all ofthe information is needed. The operatormay create customized output files fromany combination of the 100 or so variablesin the program. Either English or metricunits may be chosen for the variables withthe exception of the degree-day. Thecentigrade temperature scale is used for allcomputations and output of degree-days.Fahrenheit temperatures may be used fromoriginal weather input files, but they will beconverted internally and stored in workingweather files in centigrade.
Weather data (daily maximum andminimum temperature, precipitation, andsolar radiation - if available) from almostany tabular file, such as an output file froma spreadsheet, can be used for input.Weather files for most of the PacificNorthwest are available for calculating theranges of production for any site. Specificsite, soil, and management information areobtained by the program from aninteractive session with the programoperator.
The program automatically keeps arecord of the names of all files used eachtime it is run. This record providescomplete documentation of inputinformation for comparison of outputs fromvarious runs.
The following tables and figures provide
101
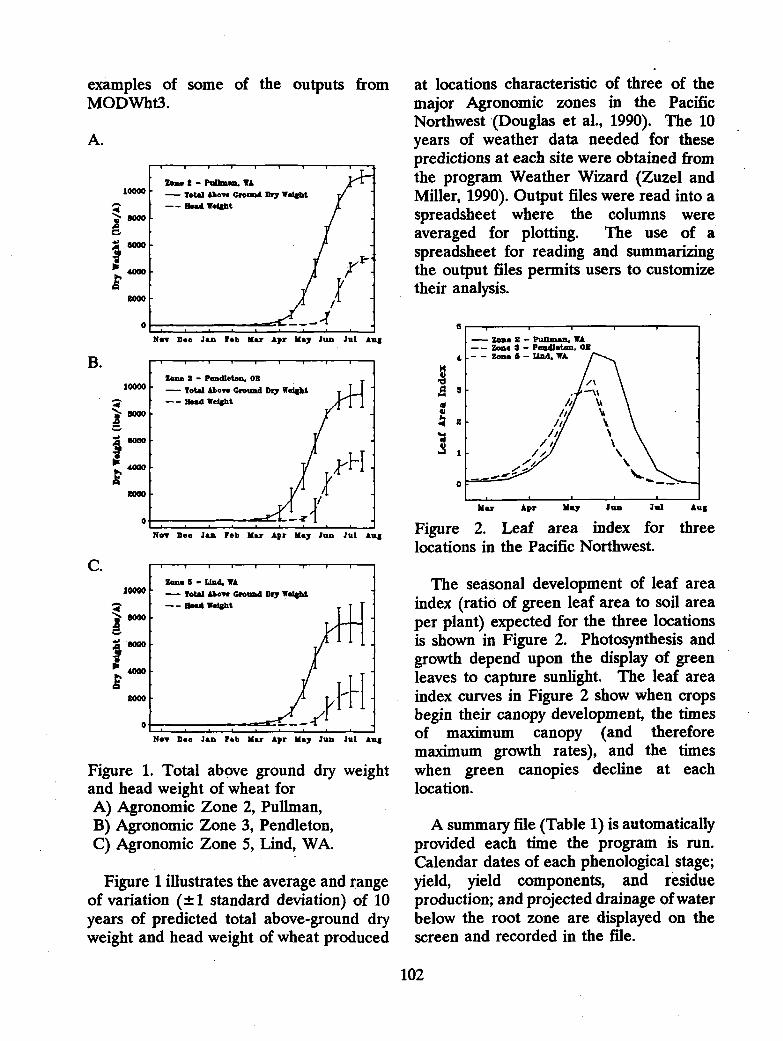
examples of some of the outputs fromMODWht3.
A.
B.
C.
Figure 1. Total above ground dry weightand head weight of wheat forA) Agronomic Zone 2, Pullman,B) Agronomic Zone 3, Pendleton,C) Agronomic Zone 5, Lind, WA.
Figure 1 illustrates the average and rangeof variation (1-1 standard deviation) of 10years of predicted total above-ground dryweight and head weight of wheat produced
at locations characteristic of three of themajor Agronomic zones in the PacificNorthwest (Douglas et al., 1990). The 10years of weather data needed for thesepredictions at each site were obtained fromthe program Weather Wizard (Zuzel andMiller, 1990). Output files were read into aspreadsheet where the columns wereaveraged for plotting. The use of aspreadsheet for reading and summarizingthe output files permits users to customizetheir analysis.
Mar Apr May Jun Jul Aug
Figure 2. Leaf area index for threelocations in the Pacific Northwest.
The seasonal development of leaf areaindex (ratio of green leaf area to soil areaper plant) expected for the three locationsis shown in Figure 2. Photosynthesis andgrowth depend upon the display of greenleaves to capture sunlight. The leaf areaindex curves in Figure 2 show when cropsbegin their canopy development, the timesof maximum canopy (and thereforemaximum growth rates), and the timeswhen green canopies decline at eachlocation.
A summary file (Table 1) is automaticallyprovided each time the program is run.Calendar dates of each phenological stage;yield, yield components, and residueproduction; and projected drainage of waterbelow the root zone are displayed on thescreen and recorded in the file.
Aug
5
4
2
t
D
102
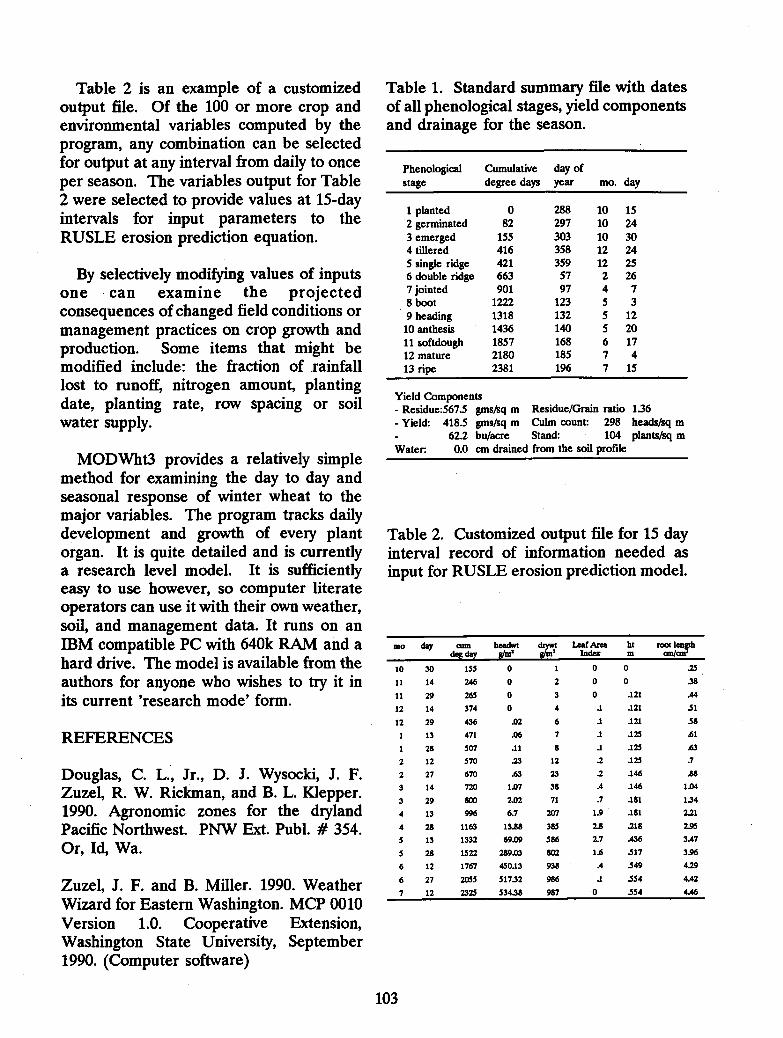
Table 2 is an example of a customizedoutput file. Of the 100 or more crop andenvironmental variables computed by theprogram, any combination can be selectedfor output at any interval from daily to onceper season. The variables output for Table2 were selected to provide values at 15-dayintervals for input parameters to theRUSLE erosion prediction equation.
By selectively modifying values of inputsone can examine the projectedconsequences of changed field conditions ormanagement practices on crop growth andproduction. Some items that might bemodified include: the fraction of rainfalllost to runoff, nitrogen amount, plantingdate, planting rate, row spacing or soilwater supply.
MODWht3 provides a relatively simplemethod for examining the day to day andseasonal response of winter wheat to themajor variables. The program tracks dailydevelopment and growth of every plantorgan. It is quite detailed and is currentlya research level model. It is sufficientlyeasy to use however, so computer literateoperators can use it with their own weather,soil, and management data. It runs on anIBM compatible PC with 640k RAM and ahard drive. The model is available from theauthors for anyone who wishes to try it inits current 'research mode' form.
REFERENCES
Douglas, C. L., Jr., D. J. Wysocki, J. F.Zuzel, R. W. Rickman, and B. L. Klepper.1990. Agronomic zones for the drylandPacific Northwest. PNW Ext. Publ. # 354.Or, Id, Wa.
Zuzel, J. F. and B. Miller. 1990. WeatherWizard for Eastern Washington. MCP 0010Version 1.0. Cooperative Extension,Washington State University, September1990. (Computer software)
Table 1. Standard summary file with datesof all phenological stages, yield componentsand drainage for the season.
Phenologicalstage
Cumulativedegree days
day ofyear mo. day
1 planted 0 288 10 152 germinated 82 297 10 24
3 emerged 155 303 10 304 tittered 416 358 12 245 single ridge 421 359 12 256 double ridge 663 57 2 267 jointed 901 97 4 78 boot 1222 123 5 39 heading 1318 132 5 12
10 anthesis 1436 140 5 2011 softdough 1857 168 6 1712 mature 2180 185 7 413 ripe 2381 196 7 15
Yield Components- Residue:567.5 gms/sq m Residue/Grain ratio 1.36- Yield: 418.5 gms/sq m Culm count: 298 heads/sq m
62.2 bu/acre Stand: 104 plants/sq mWater: 0.0 cm drained from the soil profile
Table 2. Customized output file for 15 dayinterval record of information needed asinput for RUSLE erosion prediction model.
1110 daydeg day
headset chywtShe
Leaf AreaIndex
htm
rootinIV
10 30 155 0 1 0 0 .25
11 14 246 0 2 0 0 .38
11 29 265 0 3 0 .121 .44
12 14 374 0 4 .1 .121 31
12 29 436 .02 6 .1 .121 38
1 13 471 .06 7 .1 .125 .61
1 28 507 .11 8 .1 125 .63
2 12 570 .23 12 .2 .12.5 .7
2 27 670 .63 23 .2 .146 .88
3 14 720 1.07 38 .4 146 1.04
3 29 800 2.02 71 .7 .181 1.34
4 13 996 6.7 207 1.9 .181 2.21
4 28 1163 13.88 385 2.8 .218 2.95
5 13 1332 69.09 586 2.7 .436 3.47
5 28 1522 289.03 802 1.6 .517 3.96
6 12 1767 450.13 938 .4 .549 4.29
6 27 2055 517.32 986 .1 .554 4.42
7 12 2325 53438 987 354 4.46
103
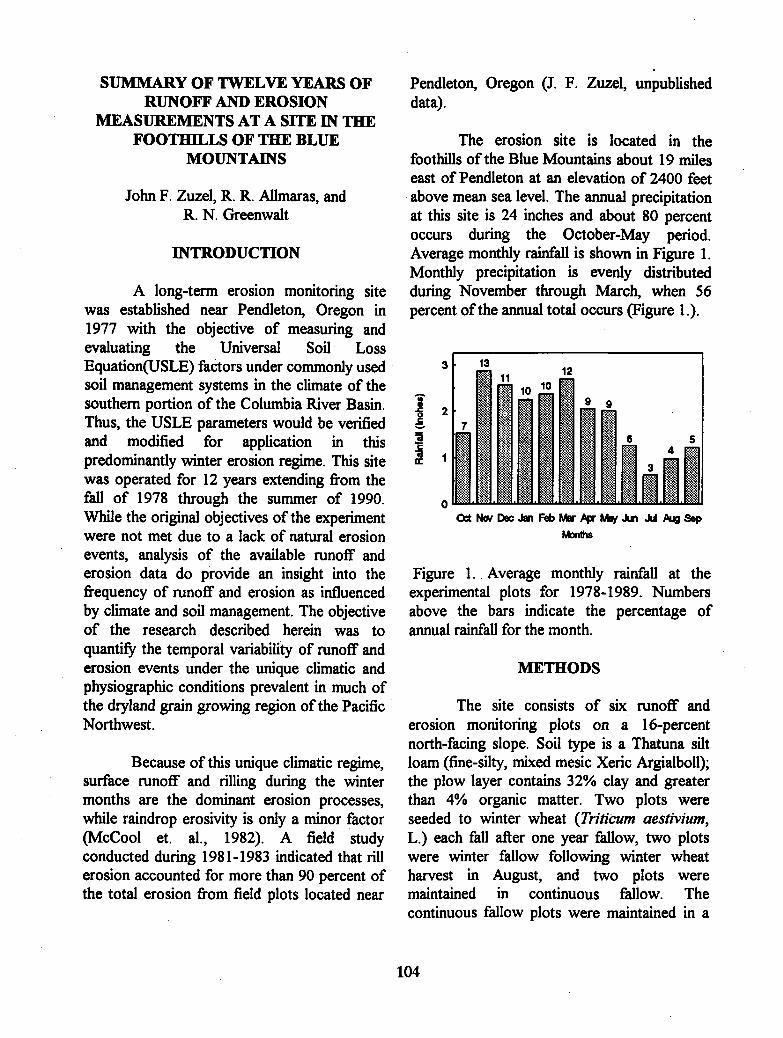
SUMMARY OF TWELVE YEARS OFRUNOFF AND EROSION
MEASUREMENTS AT A SITE IN THEFOOTHILLS OF THE BLUE
MOUNTAINS
John F. Zuzel, R. R. Allmaras, andR. N. Greenwalt
INTRODUCTION
A long-term erosion monitoring sitewas established near Pendleton, Oregon in1977 with the objective of measuring andevaluating the Universal Soil LossEquation(USLE) factors under commonly usedsoil management systems in the climate of thesouthern portion of the Columbia River Basin.Thus, the USLE parameters would be verifiedand modified for application in thispredominantly winter erosion regime. This sitewas operated for 12 years extending from thefall of 1978 through the summer of 1990.While the original objectives of the experimentwere not met due to a lack of natural erosionevents, analysis of the available runoff anderosion data do provide an insight into thefrequency of runoff and erosion as influencedby climate and soil management. The objectiveof the research described herein was toquantify the temporal variability of runoff anderosion events under the unique climatic andphysiographic conditions prevalent in much ofthe dryland grain growing region of the PacificNorthwest.
Because of this unique climatic regime,surface runoff and rilling during the wintermonths are the dominant erosion processes,while raindrop erosivity is only a minor factor(McCool et. al., 1982). A field studyconducted during 1981-1983 indicated that rillerosion accounted for more than 90 percent ofthe total erosion from field plots located near
Pendleton, Oregon (J. F. Zuzel, unpublisheddata).
The erosion site is located in thefoothills of the Blue Mountains about 19 mileseast of Pendleton at an elevation of 2400 feetabove mean sea level. The annual precipitationat this site is 24 inches and about 80 percentoccurs during the October-May period.Average monthly rainfall is shown in Figure 1.Monthly precipitation is evenly distributedduring November through March, when 56percent of the annual total occurs (Figure 1.).
3
2
cc I
001 No/ Dec Jan Feb Mar Apr Ms/ Jt1 Aug Sep
Months
Figure 1. Average monthly rainfall at theexperimental plots for 1978-1989. Numbersabove the bars indicate the percentage ofannual rainfall for the month.
METHODS
The site consists of six runoff anderosion monitoring plots on a 16-percentnorth-facing slope. Soil type is a Thatuna siltloam (fine-silty, mixed mesic Xeric Argialboll);the plow layer contains 32% clay and greaterthan 4% organic matter. Two plots wereseeded to winter wheat (Triticum aestivium,L.) each fall after one year fallow, two plotswere winter fallow following winter wheatharvest in August, and two plots weremaintained in continuous fallow. Thecontinuous fallow plots were maintained in a
104
weed free condition with applications ofherbicide as required. This sequence ofoperations has been maintained since the fall of1984. Prior to 1984, the two winter fallowplots were seeded to peas each spring and peaswere harvested in July. All plots, includingthose in permanent fallow, were moldboardplowed cross slope in late summer. Tillageoperations on all of the plots were done inearly fall and consist of a disking, spring toothand/or harrow operation in an up-and-downslope direction. Seeding on the wheat plotswas also done in an up-and-down slopedirection using a double disk drill. Thepermanent fallow plots were prepared with asimulated seeding in the same manner as thewheat plots. This procedure produces asurface similar in roughness to the plots seededto wheat. Up-and-down slope tillage is a poorsoil management practice, but was doneexperimentally to give the practice (P) factorof the USLE a value of 1.
We measured runoff and erosion fromthe continuous fallow (CF), fall seeded winterwheat (WW), and fall plowed stubble afterwinter wheat (FP) each year from Octoberthrough June for 12 years. The bordered plotswere 110 by 13.3 feet and each treatment wasreplicated twice. Borders were generallyinstalled in early October and removed in May.Plot borders were initially hand installed,galvanized sheet metal, but in later years weremachine installed plastic coated cloth using theequipment and materials described by Warn etal. (1981). Each of the six plots was equippedwith a system for the collection of a 24 houraccumulation of runoff and sediment. Eachsystem consisted of a collector located at theextreme downslope position connected to apipe that transported the runoff and sedimentto a large holding tank. Runoff volumes weremeasured and sediment samples collected fromthe holding tanks as soon as possible after theevent; usually within 24 hours. Water in the
tanks was vigorously agitated and a sample ofabout 1 pint was removed for sedimentanalysis. In most cases, a duplicate sample wasobtained for data quality estimation. Collectorsand tanks were cleaned and rinsed aftersampling was completed. Sedimentconcentrations were calculated from thedifferences in wet and dry weights after ovendrying the sample for 24 hours at 221° F.Runoff and sediment data for each treatmentwere analyzed using standard hydrologictechniques. Events that produced sedimentvolumes of less than 225 pounds/acre were notconsidered to be significant erosion and werenot included in the analysis. At the conclusionof the 12 year period measurements of coarseorganic matter (>0.1 inches), soil bulk density,and soil biomass were made for the top 3inches of soil on the WW and CF treatments.Coarse organic matter and bulk density werereplicated five times at three slope positionsfor each treatment. Soil biomass measurementsusing the chloroform fumigation-incubationmethod of Jenkinson and Powlson (1976) werereplicated six times at three slope positions foreach treatment. Infiltration measurements weremade on each treatment using the Palouserainfall simulator at various times during thestudy (Bubenzer et al., 1985). Replicationsvaried from two on the cropped plots to fiveon the continuous fallow. Simulated rainfallrates varied from 1.06 to 1.18 inches/hour witha mean replication rate of 1.14 inches/hour.
RESULTS AND DISCUSSION
In 12 years of operation, the CFproduced only 86 runoff events with erosiongreater than 225 pounds/acre; the WW 31, andFP 16. The largest single erosion event was 24tons/acre while the largest runoff volume was1.55 inches, and both were recorded from theCF treatment. A summary of erosion andrunoff for 1977-1989 is given in table 1. Notethat the CF treatment had over 4 times the
105
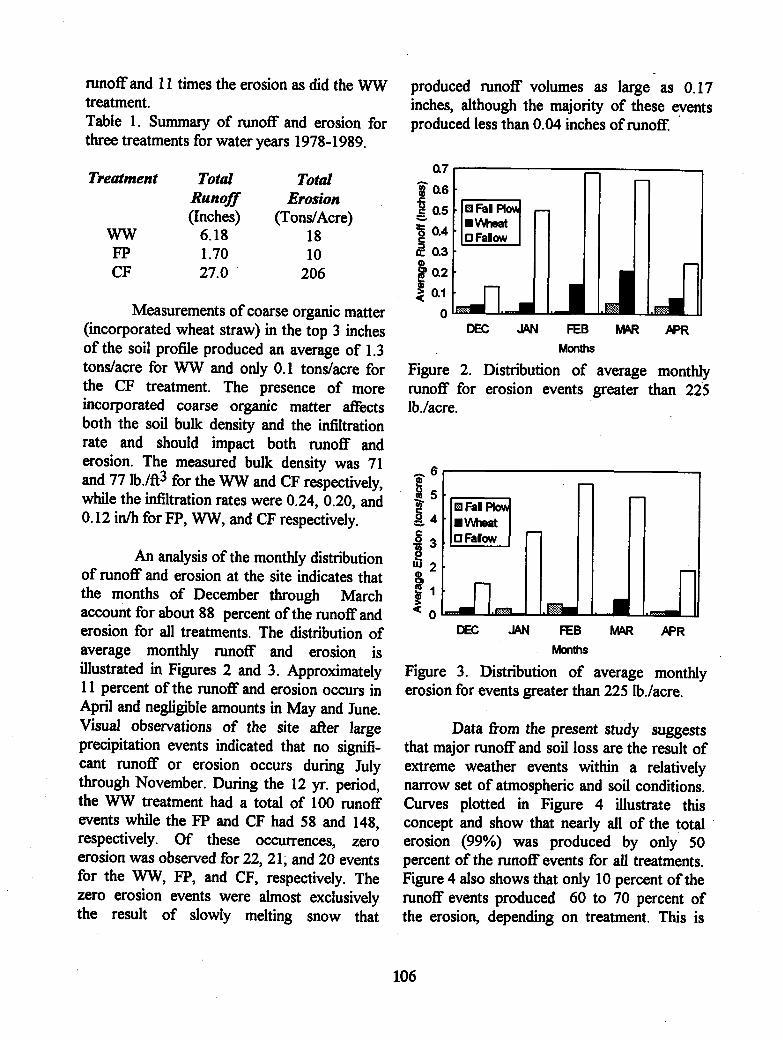
runoff and 11 times the erosion as did the WWtreatment.Table 1. Summary of runoff and erosion forthree treatments for water years 1978-1989.
Treatment Total TotalRunoff Erosion(Inches) (Tons/Acre)
WW 6.18 18FP 1.70 10CF 27.0 206
Measurements of coarse organic matter(incorporated wheat straw) in the top 3 inchesof the soil profile produced an average of 1.3tons/acre for WW and only 0.1 tons/acre forthe CF treatment. The presence of moreincorporated coarse organic matter affectsboth the soil bulk density and the infiltrationrate and should impact both runoff anderosion. The measured bulk density was 71and 77 lb./ft3 for the WW and CF respectively,while the infiltration rates were 0.24, 0.20, and0.12 in/h for FP, WW, and CF respectively.
An analysis of the monthly distributionof runoff and erosion at the site indicates thatthe months of December through Marchaccount for about 88 percent of the runoff anderosion for all treatments. The distribution ofaverage monthly runoff and erosion isillustrated in Figures 2 and 3. Approximately11 percent of the runoff and erosion occurs inApril and negligible amounts in May and June.Visual observations of the site after largeprecipitation events indicated that no signifi-cant runoff or erosion occurs during Julythrough November. During the 12 yr. period,the WW treatment had a total of 100 runoffevents while the FP and CF had 58 and 148,respectively. Of these occurrences, zeroerosion was observed for 22, 21; and 20 eventsfor the WW, FP, and CF, respectively. Thezero erosion events were almost exclusivelythe result of slowly melting snow that
produced runoff volumes as large as 0.17inches, although the majority of these eventsproduced less than 0.04 inches of runoff.
▪ Falwhea
o Falow
.1 JJAN FEB MAR APR
Months
Figure 2. Distribution of average monthlyrunoff for erosion events greater than 225lb./acre.
OFaln wheat°1O Falow
DEC JAN FEB MAR APR
Months
Figure 3. Distribution of average monthlyerosion for events greater than 225 lb./acre.
Data from the present study suggeststhat major runoff and soil loss are the result ofextreme weather events within a relativelynarrow set of atmospheric and soil conditions.Curves plotted in Figure 4 illustrate thisconcept and show that nearly all of the totalerosion (99%) was produced by only 50percent of the runoff events for all treatments.Figure 4 also shows that only 10 percent of therunoff events produced 60 to 70 percent ofthe erosion, depending on treatment. This is
0.7
1 0.6
t 0.5
0.4
12 0.3
ae7 0.2> o.1.
0 =OD
DEC
.6M 5
4
5 3
w 2
1< 0
106
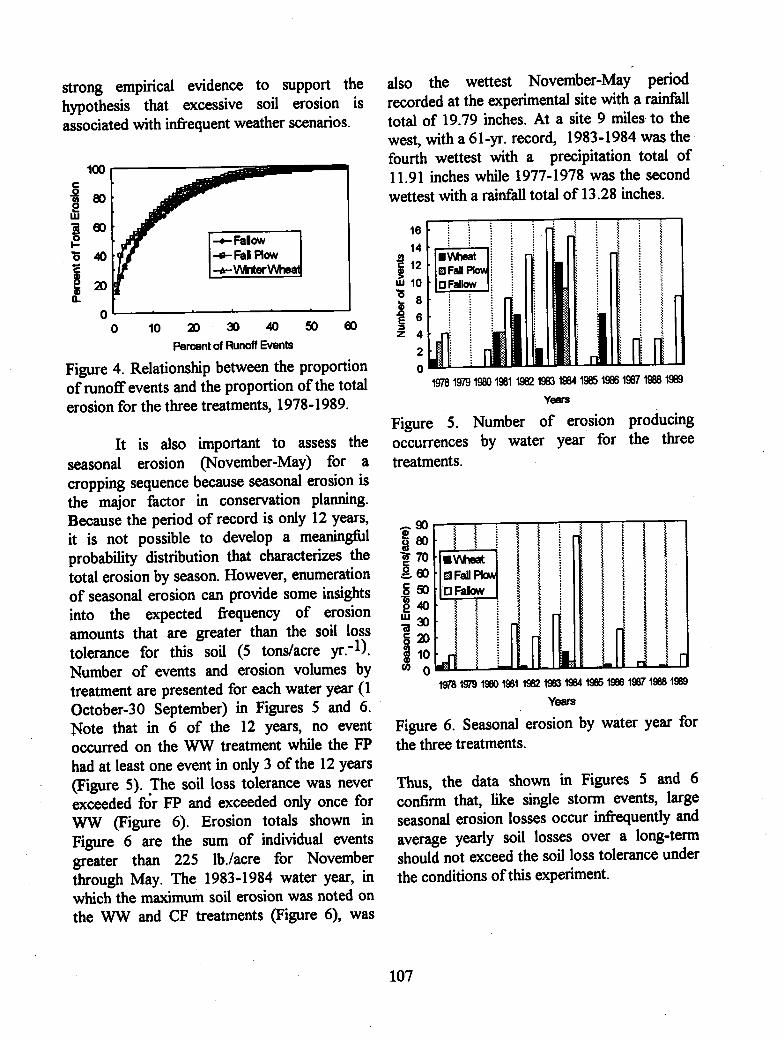
16
14
E 125
100
2Ez
8
6
4
— 90
8 8°70
5c. 608 50
7A2 40w 30
5 23
10
o1982 1983 1984 1986 1966 1987 1988 1989
Years
Figure 6. Seasonal erosion by water year forthe three treatments.
strong empirical evidence to support thehypothesis that excessive soil erosion isassociated with infrequent weather scenarios.
0 10 20 30 40 50
60
Percent of Runoff Events
Figure 4. Relationship between the proportionof runoff events and the proportion of the totalerosion for the three treatments, 1978-1989.
It is also important to assess theseasonal erosion (November-May) for acropping sequence because seasonal erosion isthe major factor in conservation planning.Because the period of record is only 12 years,it is not possible to develop a meaningfulprobability distribution that characterizes thetotal erosion by season. However, enumerationof seasonal erosion can provide some insightsinto the expected frequency of erosionamounts that are greater than the soil losstolerance for this soil (5 tons/acre yr.-1).Number of events and erosion volumes bytreatment are presented for each water year (1October-30 September) in Figures 5 and 6.Note that in 6 of the 12 years, no eventoccurred on the WW treatment while the FPhad at least one event in only 3 of the 12 years(Figure 5). The soil loss tolerance was neverexceeded for FP and exceeded only once forWW (Figure 6). Erosion totals shown inFigure 6 are the sum of individual eventsgreater than 225 lb./acre for Novemberthrough May. The 1983-1984 water year, inwhich the maximum soil erosion was noted onthe WW and CF treatments (Figure 6), was
also the wettest November-May periodrecorded at the experimental site with a rainfalltotal of 19.79 inches. At a site 9 miles to thewest, with a 61-yr. record, 1983-1984 was thefourth wettest with a precipitation total of11.91 inches while 1977-1978 was the secondwettest with a rainfall total of 13.28 inches.
2
01978 1979 1980 1981 1982 1983 1984 1985 1986 1987 1988 1989
Years
Figure 5. Number of erosion producingoccurrences by water year for the threetreatments.
Thus, the data shown in Figures 5 and 6confirm that, like single storm events, largeseasonal erosion losses occur infrequently andaverage yearly soil losses over a long-termshould not exceed the soil loss tolerance underthe conditions of this experiment.
1
107
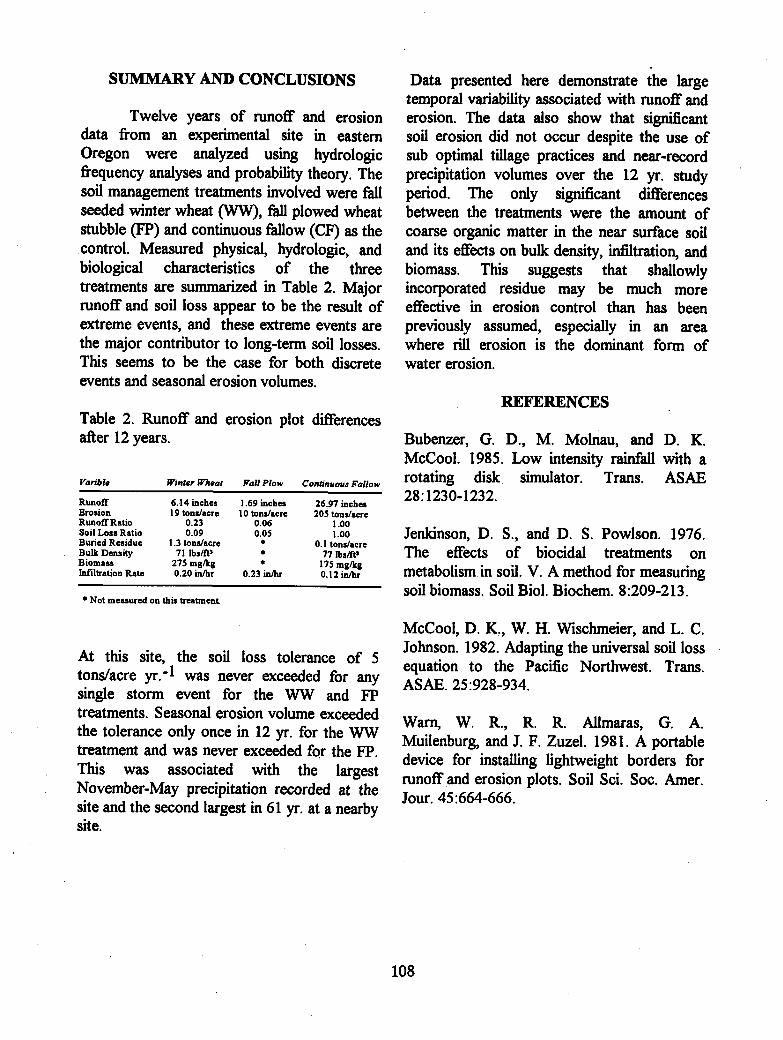
SUMMARY AND CONCLUSIONS
Twelve years of runoff and erosiondata from an experimental site in easternOregon were analyzed using hydrologicfrequency analyses and probability theory. Thesoil management treatments involved were fallseeded winter wheat (WW), fall plowed wheatstubble (FP) and continuous fallow (CF) as thecontrol. Measured physical, hydrologic, andbiological characteristics of the threetreatments are summarized in Table 2. Majorrunoff and soil loss appear to be the result ofextreme events, and these extreme events arethe major contributor to long-term soil losses.This seems to be the case for both discreteevents and seasonal erosion volumes.
Data presented here demonstrate the largetemporal variability associated with runoff anderosion. The data also show that significantsoil erosion did not occur despite the use ofsub optimal tillage practices and near-recordprecipitation volumes over the 12 yr. studyperiod. The only significant differencesbetween the treatments were the amount ofcoarse organic matter in the near surface soiland its effects on bulk density, infiltration, andbiomass. This suggests that shallowlyincorporated residue may be much moreeffective in erosion control than has beenpreviously assumed, especially in an areawhere rill erosion is the dominant form ofwater erosion.
REFERENCESTable 2. Runoff and erosion plot differencesafter 12 years.
Varible Winter Wheat Fall Plow Continuous Fallow
Runoff 6.14 inches 1.69 inches 26.97 inchesErosion 19 tons/acre 10 tons/acre 205 tons/acreRunoff Ratio 0.23 0.06 1.00Soil Loss Ratio 0.09 0.05 1.00Buried Residue 1.3 tons/acre • 0.1 tons/acreBulk Density 71 lbs/ft' • 77 lbs/ftaBiomass 275 mg/kg • 175 mg/kgInfiltration Rate 0.20 in/hr 0.23 in/hr 0.12 in/hr
• Not measured on this treatment
At this site, the soil loss tolerance of 5tons/acre yr.- 1 was never exceeded for anysingle storm event for the WW and FPtreatments. Seasonal erosion volume exceededthe tolerance only once in 12 yr. for the WWtreatment and was never exceeded for the FP.This was associated with the largestNovember-May precipitation recorded at thesite and the second largest in 61 yr. at a nearbysite.
Bubenzer, G. D., M. Molnau, and D. K.McCool. 1985. Low intensity rainfall with arotating disk simulator. Trans. ASAE28:1230-1232.
Jenkinson, D. S., and D. S. Powlson. 1976.The effects of biocidal treatments onmetabolism in soil. V. A method for measuringsoil biomass. Soil Biol. Biochem. 8:209-213.
McCool, D. K., W. H. Wischmeier, and L. C.Johnson. 1982. Adapting the universal soil lossequation to the Pacific Northwest. Trans.ASAE. 25:928-934.
Warn, W. R., R. R. Allmaras, G. A.Muilenburg, and J. F. Zuzel. 1981. A portabledevice for installing lightweight borders forrunoff and erosion plots. Soil Sci. Soc. Amer.Jour. 45:664-666.
108
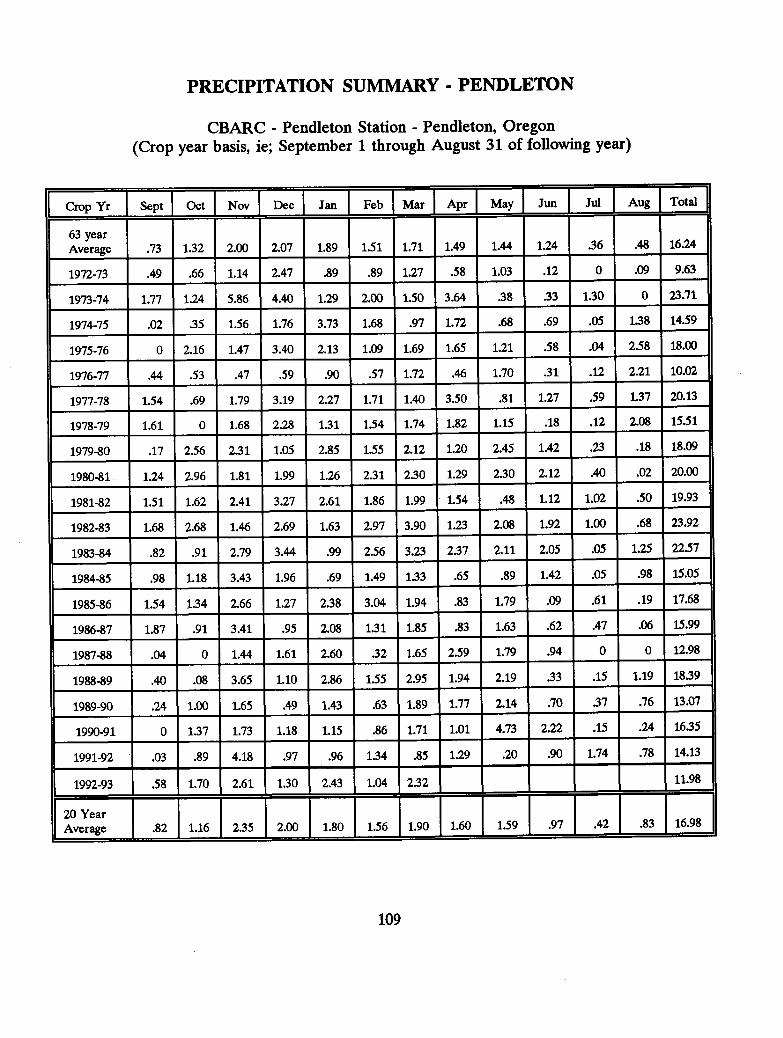
PRECIPITATION SUMMARY - PENDLETON
CBARC - Pendleton Station - Pendleton, Oregon(Crop year basis, ie; September 1 through August 31 of following year)
Aug 'Total ICrop Yr I Sept Oct I Nov I Dec I Jan I Feb I Mar I Apr I May I Jun I Jul I
63 yearAverage .73 1.32 2.00 2.07 1.89 1.51 1.71 1.49 1.44 1.24 .36 .48 16.24
1972-73 .49 .66 1.14 2.47 .89 .89 1.27 .58 1.03 .12 0 .09 9.63
1973-74 1.77 1.24 5.86 4.40 1.29 2.00 1.50 3.64 .38 .33 1.30 0 23.71
1974-75 .02 .35 1.56 1.76 3.73 1.68 .97 1.72 .68 .69 .05 1.38 14.59
1975-76 0 2.16 1.47 3.40 2.13 1.09 1.69 1.65 1.21 .58 .04 2.58 18.00
1976-77 .44 .53 .47 .59 .90 .57 1.72 .46 1.70 .31 .12 2.21 10.02
1977-78 1.54 .69 1.79 3.19 2.27 1.71 1.40 3.50 .81 1.27 .59 1.37 20.13
1978-79 1.61 0 1.68 2.28 1.31 1.54 1.74 1.82 1.15 .18 .12 2.08 15.51
1979-80 .17 2.56 2.31 1.05 2.85 1.55 2.12 1.20 2.45 1.42 .23 .18 18.09
1980-81 1.24 2.96 1.81 1.99 1.26 2.31 230 1.29 2.30 2.12 .40 .02 20.00
1981-82 1.51 1.62 2.41 3.27 2.61 1.86 1.99 1.54 .48 1.12 1.02 .50 19.93
1982-83 1.68 2.68 1.46 2.69 1.63 2.97 3.90 1.23 2.08 1.92 1.00 .68 23.92
1983-84 .82 .91 2.79 3.44 .99 2.56 3.23 2.37 2.11 2.05 .05 1.25 22.57
1984-85 .98 1.18 3.43 1.96 .69 1.49 1.33 .65 .89 1.42 .05 .98 15.05
1985-86 1.54 1.34 2.66 1.27 2.38 3.04 1.94 .83 1.79 .09 .61 .19 17.68
1986-87 1.87 .91 3.41 .95 2.08 1.31 1.85 .83 1.63 .62 .47 .06 15.99
1987-88 .04 0 1.44 1.61 2.60 32 1.65 2.59 1.79 .94 0 0 12.98
1988-89 .40 .08 3.65 1.10 2.86 1.55 2.95 1.94 2.19 .33 .15 1.19 18.39
1989-90 .24 1.00 1.65 .49 1.43 .63 1.89 1.77 2.14 .70 .37 .76 13.07
1990-91 0 137 1.73 1.18 1.15 .86 1.71 1.01 4.73 2.22 .15 .24 16.35
1991-92 .03 .89 4.18 .97 .96 134 .85 1.29 .20-.90 1.74 .78 14.13
1992-93 .58 1.70 2.61 1.30 2.43 1.04 232 11.98
20 YearAverage .82 1.16 235 2.00 1.80 1.56 1.90 1.60 1.59 .97 .42 .83 16.98
109
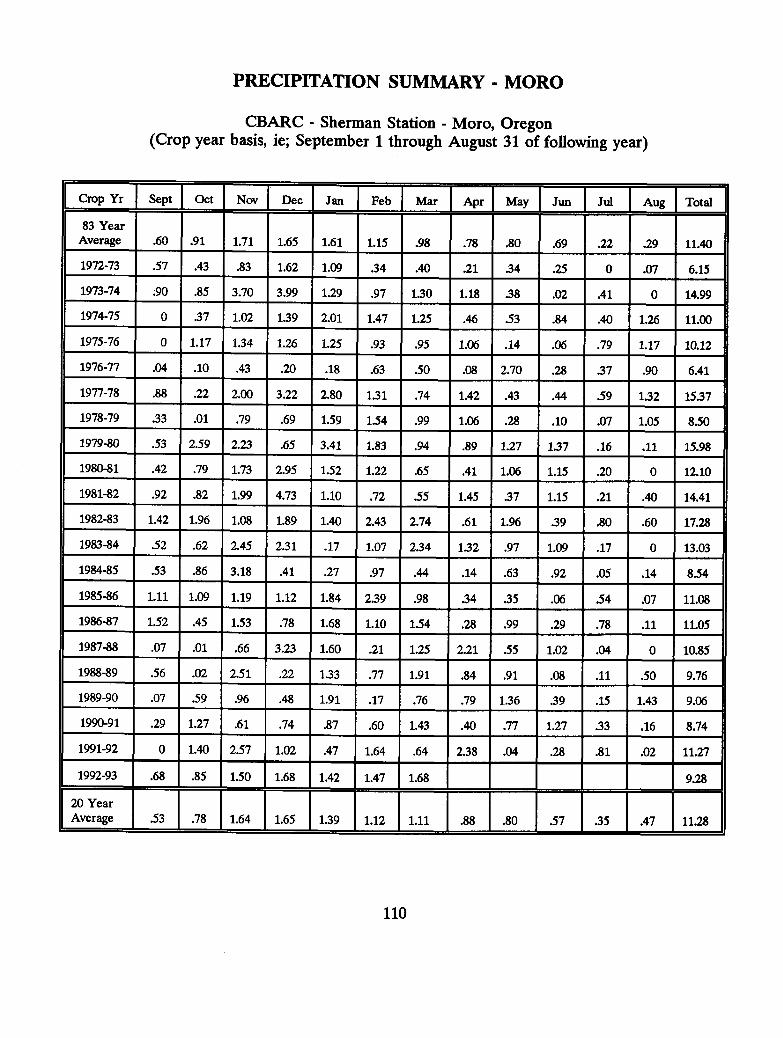
PRECIPITATION SUMMARY - MORO
CBARC - Sherman Station - Moro, Oregon(Crop year basis, ie; September 1 through August 31 of following year)
Crop Yr 1Sept IOct INov IDec I Jan I Feb Mar JApr TMay I Jun I Jul I Aug ITotal
I83 Year
Average .60 .91 1.71 1.65 1.61 1.15 .98 .78 .80 .69 .22 .29 11.401972-73 .57 .43 .83 1.62 1.09 .34 .40 .21 .34 .25 0 .07 6.15
1973-74 .90 .85 3.70 3.99 1.29 .97 1.30 1.18 .38 .02 .41 0 14.991974-75 0 .37 1.02 1.39 2.01 1.47 1.25 .46 53 .84 .40 1.26 11.001975-76 0 1.17 1.34 1.26 1.25 .93 .95 1.06 .14 .06 .79 1.17 10.121976-77 .04 .10 .43 .20 .18 .63 .50 .08 2.70 .28 .37 .90 6.411977-78 .88 .22 2.00 3.22 2.80 131 .74 1.42 .43 .44 .59 1.32 15.371978-79 .33 .01 .79 .69 1.59 134 .99 1.06 .28 .10 .07 1.05 8.501979-80 .53 2.59 2.23 .65 3.41 1.83 .94 .89 1.27 137 .16 .11 15.981980-81 .42 .79 1.73 2.95 1.52 1.22 .65 .41 1.06 1.15 .20 0 12.101981-82 .92 .82 1.99 4.73 1.10 .72 .55 1.45
_
.37 1.15 .21 .40 14.411982-83 1.42 1.96 1.08 1.89 1.40 2.43 2.74 .61 1.96 .39 .80 .60 17.281983-84 .52 .62 2.45 2.31 .17 1.07 2.34 1.32 .97 1.09 .17 0 13.031984-85 .53 .86 3.18 .41 .27 .97 .44 .14 .63 .92 .05 .14 8i4
1985-86 1.11 1.09 1.19 1.12 1.84 239 .98 34 35 .06 .54 .07 11.081986-87 152 .45 153 .78 1.68 1.10 1.54 .28 .99 .29 .78 .11 11.051987-88 .07 .01 .66 3.23 1.60 .21 1.25 2.21 .55 1.02 .04 0 10.851988-89 .56 .02 2.51 .22 133 .77 1.91 .84 .91 .08 .11 .50 9.761989-90 .07 .59 .96 .48 1.91 .17 .76 .79 136 .39 .15 1.43 9.061990-91 .29 1.27 .61 .74 .87 .60
_
1.43 .40 .77 1.27 .33 .16 8.74
1991-92 0 1.40 2.57 1.02 .47 1.64 .64 238 .04 .28 .81 .02 11.27
1992-93 .68 .85 150 1.68 1.42 1.47 1.68 9.28
20 YearAverage .53 .78 1.64 1.65 1.39 1.12 1.11 .88 .80 .57 .35 .47 11.28
110
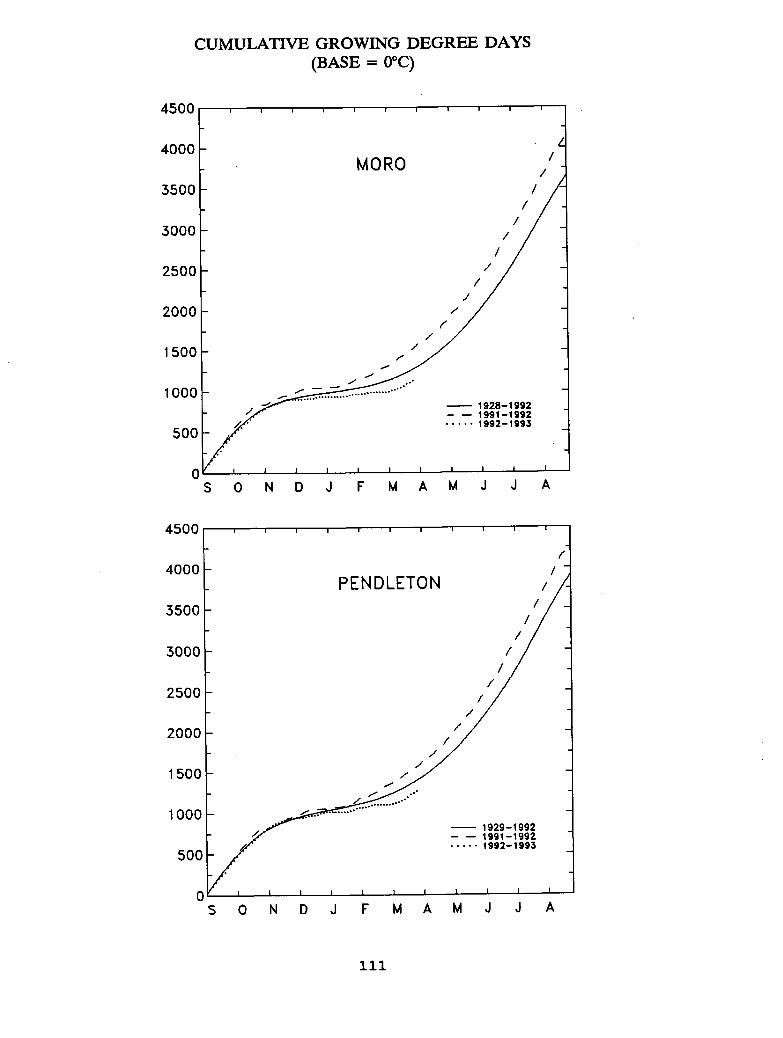
- 1929-1992- - 1991-1992 , 1992-1993
CUMULATIVE GROWING DEGREE DAYS(BASE = 0°C)
1 11