Embed Size (px)
Citation preview

RESEARCH HIGHLIGHTS: Columbia Basin Ground Water Management Area
HYDROLOGIC GROUNDWATER MODELING PROJECT
Interim Report December, 2010
City of Warden Wells

“Our preliminary analysis suggests there was probably about 50 to 60 million acre- feet of water stored in the useable parts of the aquifer system prior to the advent of deep well irrigation in the 1960s. Assuming an annual withdrawal of approximately 1.0 million acre feet since that time, it’s likely that a large portion of the useable aquifer system has already been withdrawn, with less than 20% to 25% remaining.”
-- Dr. Kevin Lindsey,
GSI Water Solutions, Inc.
General Concepts:
· Granite structures rise high enough on the
south side of Lake Roosevelt to block any
recharge to the basalts.
· Static water levels in basalt wells south of
Lake Roosevelt are significantly higher than the
lake’s surface. It is unlikely these basalt layers
could be recharged from Lake Roosevelt.
RESEARCH HIGHLIGHTS: Reduction in Groundwater Storage
Figure 1. This three-dimensional portrayal of the layered basalt interflow zones indicates the extent of locations where an estimated 60 million acre-feet of water were present prior to human development.
Figure 2. The progression of pumping and well installation over time steadily lowers groundwater levels.. The percentage of retrievable groundwater remaining in the aquifer at various times is shown.
Pre- Development (No Pumping)
100% 90% 50% 20%
No Pumping
Initial Pumping
Continued Pumping Plus One New Neighboring Well
Continued Pumping Plus Two New Neighboring Wells
Percentage of Original Water Volume
Remaining
Later Water Level
Initial Water Level
Pumping

Groundwater use in the Columbia Basin Ground Water Management Area (GWMA) totals approximately 1 million acre feet per year. Rainfall, surface water bodies, and streams within GWMA do not contain enough water to provide sustainable recharge in this groundwater area. The only surface water body with sufficient capacity to provide significant recharge would be the Columbia River as confined by Lake Roosevelt. Stratigraphic studies indicate no recharge occurs from Lake Roosevelt. Therefore, it is likely the basalt interflow zones do not have significant recharge. General Concepts: · Granite structures rise high enough on the
south side of Lake Roosevelt to block any
recharge to the basalts.
· Static water levels in basalt wells south of
Lake Roosevelt are significantly higher than the
lake’s surface. It is unlikely these basalt layers
could be recharged from Lake Roosevelt.
Data Acquisition and Evaluation:
· Documentation from well logs and research
geochemical wells indicate the location of the
basalt layers and the granite substructure.
· Using well construction and open interval
evaluation, wells were selected to be likely
candidates for Lake Roosevelt recharge. These
wells contained static water levels that were well
above the Lake Roosevelt static water level.
Figure 1. Cross view of the basalt layer-Lake Roosevelt interface depicting the vertical discontinuity between groundwater levels and Lake Roosevelt to the North.
RESEARCH HIGHLIGHTS: No Recharge From Lake Roosevelt
Figure 2. The figure to the right displays the relationship of the granite geologic sub-structure to the surface of Lake Roosevelt. Note the granite runs consistently along the entire south side of Lake Roosevelt providing no access to the basalt layers above.

Using well logs and the static water levels recorded at the time wells were drilled, we find an increasing well depth as the years go by. The deeper the wells go, the older the water is. General Concepts:
· To obtain sufficient amounts of useable water,
well drillers and operators appear to drill deeper
each year.
· Geochemical analysis of water samples
depict older water from deeper interflow zones.
Data Acquisition and Evaluation:
· GWMA employs a “multiple lines of
evidence” approach to assess and characterize
the state of the aquifers.
· Drawing from various resources to obtain
static water level data (Eastern Regional Office,
Department of Ecology, and USGS Water
Resources Program), and geochemical
evaluation of over 500 wells, we systematically
evaluate the sustainability of groundwater
throughout the CRBG aquifers.
· GWMA combines efforts with locally-based
hydrogeologic experts and external ground
water modeling specialists.
Figure 1. Water levels recorded when wells are drilled reflect the static water level in the interflow zones on that date (A). There are 2 distinct vertical zones (Wanapum and Grande Ronde) illustrating the extent of vertical discontinuity. Although static water levels observed on driller logs appear to be stable over time, we postulate that even though some wells encounter greater pressure when they are installed or deepened, individual wells eventually experience water level declines as pumping progresses over time (See Fig 2). As a result, deepening continues, with drillers targeting deeper interflow zones over time (B) and, in doing so, tapping into older water.
RESEARCH HIGHLIGHTS: The Chase to the Bottom
Figure 1A
Figure 1B
Figure 1C
Deepening
Figure 2. A comparison of 2 Grande Ronde wells; one that has been deepened, and one that has not. Arguably, deepening wells temporarily increases static water level as drillers target higher pressure gradients deeper in the Grande Ronde.
2000 4000 6000 8000 10000 12000 14000 16000 18000 20000 22000 24000 26000 28000
200
400
600
800
1000
1200
1400
Legend
Well Depth
Well Casing
Geologic Layers
ppl
Qf Sediment
Trf Sediment
Tem Saddle Mountain
Tpr Wanapum
Teqc Interbed
Tr Wanapum
Tesc Interbed
Tfsg Wanapum
Tfsh Wanapum
Tfg Wanapum
Tev Interbed
Tgsb Grande Ronde
Tgo Grande Ronde
Tgu Grande Ronde
Tgg Grande Ronde
Tgwr Grande Ronde
Basement

Only 2 of the 25 GWMA city wells shown contain a high percentage of young water. General Concepts: · Groundwater is the only source of potable
water for nearly 100% of the municipal and
private well owners in the four-county area of the
GWMA.
· Most cities have reported declining water
levels, consistent with production-based wells.
Even wells where the presence of relatively
younger water implies recharge, the amount of
recharge is not enough to sustain increasing
population levels.
Data Acquisition and Evaluation: · In an effort to characterize groundwater from
all major cities within the GWMA, we have taken
a systematic and comparative approach to
assess groundwater age and static water levels.
· GWMA has sampled most major municipal
wells within city limits for geochemistry. By using
a radiometric and multiple tracer approach and
scientifically peer reviewed models, we have
undertaken the most comprehensive effort to
date at producing a region wide assessment of
groundwater in cities.
· GWMA uses multiple lines of evidence to
assess municipal water sources, including
geochemistry, in depth static water level
analysis, and personal interviews.
Figure 1. Estimated age of water from city wells located within the GWMA.
Figure 2. Results from 3D modeling effort to characterize wells and groundwater pumping from cities depicting basalt surfaces. The 2 shallow wells on the left are recharging from shallow flow zones but are currently not in use, and the deeper wells on the right are cased and sealed to the deeper basalts receiving little to no recharge.
City Well # Carbon 14 Age
(Years)
Moses Lake 10 13,420
Almira 4 9,350
Connell 8 3,730
Creston - 2,460
Ephrata 4 7,320
Davenport 7 23,070
George 2 1,980
Harrington1 3 New
Hatton - Old
Kahlotus - Old
Lind 8 24,760
Mattawa 2 7,020
Mesa1 2 New
Odessa 4 26,250
Othello 8 24,400
Quincy 5 1,580
Ritzville 8 15,520
Royal City 3 22,320
Reardon 2 14,970
Soap Lake 1 12,590
Sprague 3 18,370
Warden 7 3,500
Washtucna 3 11,240
Wilbur 4 5,100
Wilson Creek - Old
Figure 3. Moses Lake city well no. 3. Example water level analysis which depicts a downward trend of pumping water levels, static water levels, and over all summer and winter trends.
RESEARCH HIGHLIGHTS: Status of Municipal Ground Water Age of Water in Municipal Wells City of Warden Wells

Geologic structures such as folds, faults and dikes may create ground water sub-basin boundaries. These geologic structures will create the initial sub-basin boundaries for the proposed hydrologic model. General Concepts: · Folds, faults and dikes may create
impediments to groundwater movement,
resulting in some compartmentalization of
aquifers. Folding of the earth’s crust bends
basalt layers and may be accompanied by
significant faulting. Faults break layers, creating
hydraulic barriers. Dikes are vertical basalt layers
that have erupted and essentially frozen in place,
creating a nearly solid, and often impermeable
wall.
Data Acquisition and Evaluation: · The GWMA works with a regionally-based
team and has worked extensively to document
and map important geologic structures.
· In addition to mapping structures, the GWMA
is systematically evaluating and testing the
impermeability of dominant regional with
geochemical and water level analysis.
· The ground water modeling team is calibrating
regional and sub-regional groundwater flow
models to account for the impact of barriers.
Figure 1. Major geologic features are suspected of impeding sub-surface water movement. Major features depicted are a combination of folds, faults, and dikes establishing the framework for compartmentalization throughout the region. The color of the lines, representing the geologic features, indicates the current observation of how significantly water tight that feature may be.
Figure 2. The above cross-sectional view of the Frenchman Hills fault depicts the vertical off set in basalt layers. The Frenchman Hills fault and the Saddle Mountain fault shown above are significantly water tight creating a substantial sub-basin boundary.
RESEARCH HIGHLIGHTS: Folds, Faults and Dikes
Folds, Faults and Dikes
Figure 3. Many geologic structures, as indicated by the map to the left, have been mapped but most do not appear to have significant hydrologic impact.
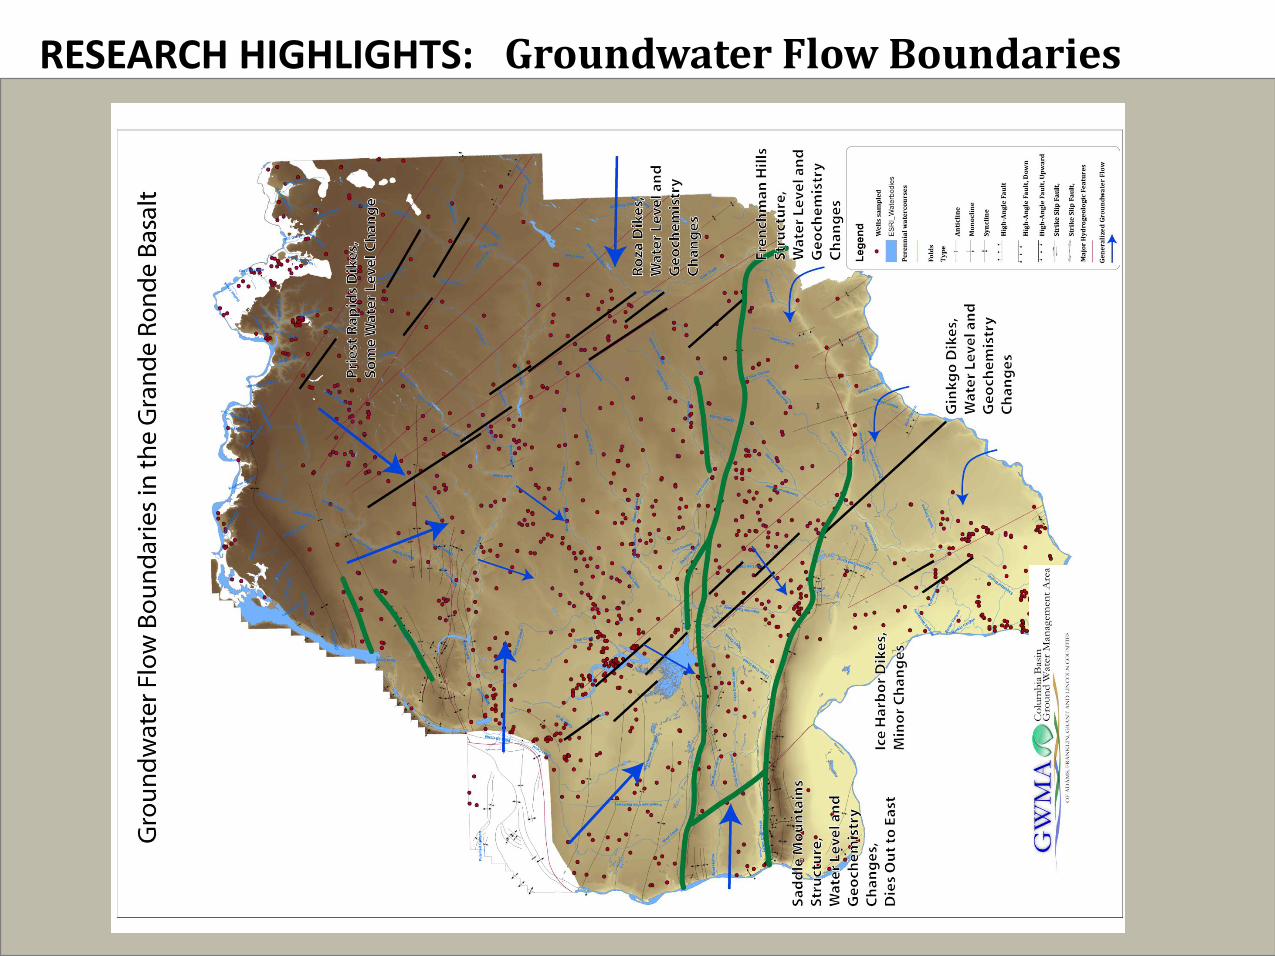
RESEARCH HIGHLIGHTS: Groundwater Flow Boundaries

The geologic structure identified as the Frenchman Hills Fault has been tested and found to be a significant hydrologic barrier. Subsequently, the Frenchman Hills Fault is likely a major boundary between existing sub-basins.
General Concepts:
· The barrier effect of the geologic structure
was tested.
· Data were examined to look for significant
differences (if any) in groundwater development
patterns (well depths and pumping volumes),
and natural system attributes (static water
levels and geochemical signatures) on each
side of the fault.
Data Acquisition and Evaluation:
· Static water level and geochemical
signatures were compared along the fault line
pathway.
· Significant well depth, history of pumping
static water levels, and rates of decline were
compared as characteristics of each
groundwater sub-basin.
Figures 2 - 3. Ground water pumping in the Quincy sub-basin has consistently increased (above), while well depth has not increased significantly (below). Comparatively, ground water pumping has not been nearly as intensive on the Royal City side (above) but wells depth has increased by over 15 feet per year.
Figure 1. The well construction map shows agricultural and municipal wells in the Quincy Basin and Royal city areas. The solid blue line represents the Frenchman Hills Fault line. To the south, there are very few sediment wells and a proportionate number of Wanapum and Grande Ronde Wells. Water level analysis, geochemical analysis, and extensive interviews with local stakeholders suggests that wells on either side of the fault are not hydrologically connected.
Frenchman Hills Fault Line
RESEARCH HIGHLIGHTS: Frenchman Hills Fold and Fault Structure

A methodical, step-wise approach to model construction and calibration leads to greater understanding of the aquifer system’s behavior once the model is ready for use as a predictive water-budget evaluation tool. General Concepts:
· Construct a grid with high spatial resolution
and multiple layers that represent each basalt
aquifer or groups of aquifers.
· Establish principal hydrologic processes both
inside the model domain and along its outer
boundary.
· Simulate conditions without pumping (i.e.,
pre-development conditions) to ensure that the
natural flow system is reasonably well
simulated.
· Calibrate the model to a historical record of
pumping and water level changes over time, by
adjusting the values of aquifer hydraulic
parameters that affect the model’s ability to
simulate changes in water levels and
groundwater flow rates that have been
observed historically.
· Use the calibrated model to understand
patterns and rates of groundwater recharge and
discharge throughout GWMA as a whole, as
well as in individual sub-basins.. This includes
evaluating groundwater flow paths and
timescales, aquifer interconnections, and links
between surface water and groundwater within
the stratiform aquifer system underlying the
region.
Figure 4. Values for model parameters are adjusted during calibration to result in a model that can simulate historical trends in groundwater elevations. This map shows the approximately 250 water supply wells and 10 nested piezometers (non-pumping wells) for which sufficient and reliable water level data are available to guide the calibration process.
RESEARCH HIGHLIGHTS: GWMA Numerical Modeling Process Step 1: Cross-Section Showing Model Grid, Layering,
Structures
Figure 1. Each color shows a different model layer. Faulting and folding are represented through changes in the elevations of the contacts between adjoining layers moving from place to place in the model grid.
Model View
Model View
Step 3: Natural Flow System, Without Pumping
Figure 3. Natural systems include seepage from spring lines on coulee sidewalls and water exchanges between surface water and groundwater in coulee floors.
Step 4: Calibrating the Model
Legend
GWMA
CRBG Province
Heads - Grand Ronde
0 250,000 500,000125,000
Feet
Some Inflow Beneath Columbia River Some
Inflow Beneath Snake River
Figure 2. A watershed-scale model simulates where groundwater may flow into the 4-county GWMA model under natural conditions, based on the watershed’s hydrology and geologic structure.
Step 2: Establishing Hydrologic Processes in the Model Grid

Recharge into GWMA from the rest of the watershed is occurring in some areas in deep basalt aquifers, though likely at low rates. Shallow basalt aquifers receive little if any groundwater recharge from adjoining areas, and only localized recharge inside GWMA where the climate is arid to semi-arid.
General Concepts:
· A model of the Columbia Plateau watershed
informs us about where groundwater in different
basalt zones moves into GWMA.
· The regional geology controls where basalt
aquifers can be recharged inside and outside of
GWMA.
Data Acquisition and Evaluation:
· Geologic mapping tell us how the basalt inside
GWMA is connected to surface water and basalt
elsewhere in the watershed.
· Topography defines the extent of the watershed
that can potentially contribute water to recharge
basalt aquifers..
· Groundwater elevation data from wells helps
further refine the model’s calibration and its
representation of groundwater flow patterns and
recharge locations.
Figure 3. Model-simulated flow arrows from the watershed-scale model tell us where groundwater moves into GWMA. Flow arrows in the Wanapum Basalt are not directed into GWMA, indicating little to no groundwater inflow. In the deep (Grande Ronde) basalt aquifers, the arrows indicate some groundwater does move into the central portion of GWMA from the east and the west.
RESEARCH HIGHLIGHTS: Is Groundwater Moving Into The GWMA? Columbia Plateau Watershed
Figure 2. This snapshot from the model shows how the model represents the presence of basalt in potential recharge areas. Lake Roosevelt rests on granitic bedrock (black cells) and is not in contact with basalt rock (gray cells). This means that the basalt aquifers are not being recharged by seepage from the lake bed.
Yakima
Grant
Chelan
Kittitas
Lincoln
King
AdamsWhitman
Klickitat
Benton
DouglasSpokane
Franklin
SnohomishFerry
Stevens
Lewis
Okanogan
Walla Walla
Pierce
Skamania
Asotin
Columbia
Garfield
Pend Oreille
BakerGrant
Umatilla Wallowa
Wasco
Union
Morrow
Wheeler
Gilliam
Jefferson
Sherman
Hood River
LinnCrook
Marion
Legend
GWMA
Principal Rivers
State Boundary
WA Counties
OR Counties
CRBG Province
Recharge ...?
Wanapum
Land Surface
-291 - 100
100.1 - 200
200.1 - 400
400.1 - 600
600.1 - 800
800.1 - 1,000
1,000.1 - 1,200
1,200.1 - 1,400
1,400.1 - 1,600
1,600.1 - 1,800
1,800.1 - 2,000
2,000.1 - 3,000
Shallow Wanapum Basalt At Surface
Deep Grande Ronde Basalt
At Surface
Figure 1. Recharge can occur where a basalt unit outcrops at or near the ground surface. These areas are shown in gray for the shallow (Wanapum) basalt aquifers and in blue and green for the deep (Grande Ronde) basalt. aquifers.
Model View
750
1500
1250
1000
1750
2000
500
25
00
2500
2000
2000
25
0
0
17 50
17 50
2 500
2000
500
17
5
02500
25
00
Legend
GWMA
CRBG Province
Heads - Saddle Mountain0 120,000 240,00060,000
Feet
1500
1250
1750
2000
1000
750
250
0
25002000
2 500
2000
2500
1500
2000
17
5
02500
2500
Legend
GWMA
CRBG Province
Heads - Grand Ronde0 120,000 240,00060,000
Feet
M O D E L
R E S U L T S
Shallow Basalt (Wanapum)
Deep Basalt (Grande Ronde)

Young water is generally found in a well receiving shallow groundwater recharge from a nearby surface water body. General Concepts: · The “Groundwater Flow Pathways” diagram
illustrates how water levels in Columbia River
basalt wells are explained by the geology.
· Young water is found in shallow basalt
aquifers and where pathways exist to allow
young water to quickly move deeper to a well.
Data Acquisition and Evaluation:
· Isolating areas within the CRBG that
evidence infiltration of younger water has
emerged as a research priority.
· Since 2008, the GWMA has undertaken a
massive effort to isolate areas where new water
is found, and characterize the GWMA in general
by studying the chemical and isotopic
composition of groundwater.
· GWMA has sampled over 550 wells and
over 20 different surface water locations,
obtaining a suite of geochemical analysis,
resulting in almost 20,000 individual data points.
Figure 3. Young water in wells occurs where pathways exist to recharge wells from nearby surface bodies. Thirty-two wells from a sampling of 213 wells distributed throughout the GWMA show evidence of new water (Tritium levels > 1.0, and percent modern carbon > 65). The GWMA is currently developing a complex mixing model using multiple tracers that will further clarify groundwater age throughout the region.
Figure 1. Interflow Zone “A” displays a shallow groundwater pathway that may be recharged from a local surface water body.
RESEARCH HIGHLIGHTS: Where Is Young Water Found? Groundwater Flow Pathways
Interflow Zones
Wells With Young Water
Figure 2. This graph represents all the geochemistry samples taken by GWMA. The blue dot wells show an appropriate tritium to percent modern carbon relationship indicating young water. The blue dots on the graph are the same wells represented on the map in figure 3.
Wells with Young Water
Percent Modern Carbon
Trit
ium
(TU
)

In the Quincy Basin “Sand Wells” are defined as wells not entering the basalt lava interflow zones for recharge. “Rock Wells” receive some or all of their recharge from basalt interflow zones. Many Rock Wells reflect declining static water levels and significant amounts of old water. General Concepts: · Isolating the source of water has emerged
as one of the single most important factors in
assessing and characterizing regional ground
water. The dense interior of each basalt layer or
flow generally creates an impenetrable water
barrier.
· The Black Sands area within the GWMA
exhibits a combination of water sources,
suggesting separation of Rock and Sand wells
and the presence of old water.
· Sand Wells generally recharge from sediment
layers above the basalts, and these wells within
the Black Sands area have shown steady static
water levels since the 1960’s. Rock Wells
receive water from older basalt surfaces below
the sediments, and these wells in this area have
steadily declined.
Data Acquisition and Evaluation:
· The GWMA has employed a “multiple lines of
evidence approach” to characterize hydro-
geology in the Black Sands area. By using
geochemical analysis, in concert with static water
level data and personal interviews with
stakeholders based in the Black Sands area, we
have begun to formalize a comprehensive picture
of a water budget in this portion of the GWMA
study area.
Figure 4. The figure to the left displays a typical Sand Well being recharged from the sand and clay layers above the basalts. The Rock Well displays a sealed well casing through the sand and clay into the deeper basalt layers.
Figure 3. Relative age plot of Black Sands groundwater. Basalt aquifer ground water appears to be exclusively old water while sedimentary aquifer groundwater is either exclusively modern recharge or a mixture of young and old water.
Ele
vat
ion
(fe
et a
bo
ve
sea
lev
el
Figure 1. Simplified 3D model of the entire GWMA area, depicting major units; surface sand and sediment layer, Wanapum Basalts, and Grande Ronde Basalts, and the vicinity of the Black Sands area.
Layers
Sand-Clay Suprabasalt
Wanapum Basalts
Grande Ronde Basalts
RESEARCH HIGHLIGHTS: Black Sands: Rock vs Sand Wells
Sand Well
Rock Well
Total Wells 665
100%
Sediment only (Sand Well)
372
56%
Basalt only or mixed (Rock Well)
293
44%
Figure 2. The red dots on the map represent municipal and irrigation wells with 10” or larger casings in the Quincy Basin.

Some high production basalt wells near the East Low Canal indicate significant amounts of young water and substantially higher static water levels than similar near by wells. General Concepts: · Large wells near the East Low Canal show
indications of recharge from surface water
sources such as the canal. However, the
recharge affect deteriorates as the distance from
the canal increases.
· Many of these wells appear to have enough
significant recharge to sustain a relatively
constant static water level through the years.
Data Acquisition and Evaluation:
· Given the importance of the East Low Canal
to the region, the GWMA has taken a series of
samples along the water course, targeting
different interflow zones to assess and evaluate
potential for recharge.
· Wells near (proximal) the East Low Canal are
more likely to receive significant amounts of
young water recharge than wells farther away
(distal) from the canal.
· Geochemical signature tests indicate young
water recharge levels approximate the
geochemical values of the East Low Canal.
Geochemical signatures of deeper basalt wells,
distal from the East Low Canal, are similar to
water conditions sampled from deeper basalt
flow zones.
· Most wells with significant amounts of young
recharge water appear to have significantly
higher static water levels than those wells being
recharged from much deeper basalt layers.
Figure 4. The red colored well markers are all less than 1.8 miles from the canal and contain significant amounts of young water. The purple triangles represent basalt wells, 1.8 – 3.5 miles away from the East Low Canal, with very little young water recharge. Not all wells within 1.8 miles of the canal contain significant young water recharge.
-1.00
0.00
1.00
2.00
3.00
4.00
5.00
6.00
7.00
8.00
0.00 10.00 20.00 30.00 40.00 50.00 60.00 70.00 80.00 90.00 100.00
Tri
tiu
m (T
U)
Carbon-14 (pmc)
East Low Canal Vicinity
Proximal
Distal
Modern Recharge
(<60 yrs)
Figure 1. Three dimensional view of GWMA basalt layers.
Legend
Wells < 1.8 miles away
Wells 1.8 - 3.5 miles away
!( Proximal wells
#* Distal wells
RESEARCH HIGHLIGHTS: East Low Canal Groundwater Recharge GWMA Location of East Low Canal
Figures 2 - 3. Multiple tracer approach using radio-metric dating (above) and Hydrogen isotopes (below) yields preliminary findings consistent with the concept that wells closer to the East Low Canal, are generally exposed to younger water.
Young Water Near the East Low Canal

The Ritzville area appears to have an active shallow groundwater system with significant amounts of young rechargeable water. Young water has not been detected
below 309 feet. General Concepts:
· “Old water” is defined as recharge water in
the interflow from the last ice age (10,000 years
ago). Most young water indicates recharge from
atmospheric precipitation (i.e., rain or snow).
· Vertical hydraulic discontinuity separates
deeper wells that are drawing from older
sources from shallow wells that are drawing
from younger sources.
Data Acquisition and Evaluation:
· While the idea that deeper wells are
generally drawing from older sources of water
has been proposed, a systematic science –
based approach to testing this theory is lacking.
· The GWMA has selected wells that capture a
stratified gradient of open intervals, as well as a
wide range of well depths, such that we could
test the relationship between well depth and
groundwater age.
Figure 3. Groundwater wells in the Ritzville vicinity depicted as either deep (> 309 feet) or shallow (< 309 feet). The Ritzville area contains many wells recording recharge sources as young water. However, no water is recorded from wells deeper than ~ 309 feet. Consistent with groundwater age, the shallow wells usually have higher static water levels, while deeper wells have much lower static water levels. This layer of water appears to be impeded by the Roza dike system as it travels northwest to southeast approximately 10 miles east of Ritzville.
Figure 1. The dark black lines, indicating sealed well casings, restrict wells to specific interflow zones. Those wells open to shallow layers may receive younger surface water recharge. Wells cased and sealed deep into the basalt are not as likely to indicate any recharge from surface water sources.
Figure 2. The above geochemistry graph depicts positive tritium values for wells found in the Ritzville area and indicates the presence of modern recharge (<50 years old) down to a depth of 309 feet. Wells cased and sealed below 309 feet have no geochemistry indication of significant young water recharge.
RESEARCH HIGHLIGHTS: Young Water in the Ritzville Area
Ritzville Area Basalt Wells