Embed Size (px)
Citation preview

Fachhochschule Köln
Cologne University of Applied Sciences
Fakultät für Wirtschaftswissenschaften
Faculty for Economics and Business Administration
v.2011-02-14
Abstract
Country rankings with respect to a country’s business environment draw strong
international attention. Methods of business environment assessment differ, two
competing methods will be described and compared with respect to their results
for Rwanda in the years 2008-2010. They do not come to the same results
regarding regulatory deficits and hence the demand for regulatory reform. When
regulatory cost is considered, demand and supply of reforms are more in line than
without cost considerations. The effectiveness of reforms undertaken in Rwanda
varies. Based on interviews in late 2010, not all reforms were having the expected
impact “on the ground”.
JEL: K2,L5,R5
Fachhochschule Köln
Cologne University of Applied Sciences
Faculty of Economics and Business
Administration
Wolfgang Veit
Competing approaches to measuring business regulation.
Reducing Red Tape in Rwanda
Cologne Business Working Papers
CCoollooggnnee BBuussiinneessss DDiissccuussssiioonn PPaappeerrss NNoo.. DDPP 1111//11
Cologne Business Studies IB
2
Die Fakultät für Wirtschaftswissenschaften der Fachhochschule Köln trägt mit den Reihen
Cologne Business Studies, Cologne Business Discussion Papers und Cologne Business Working
Papers zum Diskurs mit Wissenschaft und Praxis bei.
Die Cologne Business Studies leisten einen Beitrag zum Wissenstransfer zwischen
Wissenschaft und Praxis. Sie beinhalten die Bearbeitung von wirtschaftlichen
Praxisproblemen mit wissenschaftlichen Methoden.
Die Cologne Business Discussion Papers sind die Plattform der Fakultät für den
internen wissenschaftlichen Gedankenaustausch. Die Beiträge zu den internen
Vortragsreihen werden in dieser Form veröffentlicht.
In den Cologne Business Working Papers werden die Ergebnisse
wirtschaftswissenschaftlicher Forschung an der Fachhochschule Köln einer breiteren
Öffentlichkeit zur Verfügung gestellt.
------------------------------------------
Cologne University of Applied Sciences / Department of Economics and Business
Administration contributes to academic exchange by means of three paper series: Cologne
Business Studies, Cologne Business Discussion Papers and Cologne Business Working Papers
Cologne Business Studies are a medium of the university’s outreach activities. Here,
research with particular relevance for business practice is being published.
Cologne Business Discussion Papers are the department’s platform for internal
academic exchange. Also, contributions to the internal conference series are being
published here.
Cologne Business Working Papers represent the department’s contributions to the
wider scientific community.
------------------------------------------
Kontaktadresse / Contact:
Steffen Wolfer, M.A.
Fachhochschule Köln / Cologne University of Applied Sciences
Gustav Heinemann-Ufer 54, 50968 Köln
Email: [email protected]
3
List of abbreviations
BMZ Bundesministerium für Wirtschaftiche Zusammenarbeit und Entwicklung
DB World Bank/IFC Doing Business Project
FDI Foreign Direct Investment
GTZ Gesellschaft für Technische Zusammenarbeit
IFC International Finance Corporation
IFS International Financial Statistics
IMF International Monetary Fund
MINICOM Ministry for Commerce, Government of Rwanda
OECD Organization for Economic Cooperation and Development
PSF Private Sector Federation of Rwanda
RDB Rwanda Development Board
RRA Rwanda Revenue Authority
RTR Cutting the cost of Red Tape main report
UNCTAD United Nations Conference on Trade and Development
WTO World Trade Organization

4
Introduction
1.1. Overview
“„Red Tape‟ is a short hand for unnecessary or excessively complicated
regulations and inefficient administrative processes” (SBP,2008,9).
“The expression „red tape‟ refers to any unnecessary or redundant
regulation that hinders productivity. (CFIB,2010,2)
Reduction of Red Tape is supposed to reduce business cost and therefore
contribute to the level and growth GDP. It is a part of Good Governance1. The
degree of Red Tape existing in a country‟s business environment is measured by
a variety of measures and rankings. If positive, they are used by governments in
their internal and external PR strategies.
The goal of this paper is to assess whether methods for evaluation of business
regulatory environments paint a true picture of the regulatory regimes and thus
contribute to Good Governance. The case analyzed here is Rwanda.
The first chapter briefly outlines the different methods of business environment
analysis and the empirical evidence on the relevance of business environment
reform for growth. The second chapter explores two competing concepts of
business environment assessment in more depth: first, the SBP approach which
is based on surveys of subjective perceptions of businesses, and second the
World Bank‟s Doing Business (DB) Indicators which measure regulations as
decreed by authorities. Both approaches will be compared with regard to
Goals
Method of gathering information
Types of businesses considered
Regional and sectoral scope
Estimation of regulatory cost
Ability to measure correctly supply of reforms be the government (DB) and
demand for reforms by businesses (SBP)
Effects on the government‟s reform agenda
The third chapter focuses on the results of both the DB and the SBP approach
with regard to Rwanda. First, economic reforms as decreed by the Rwandan
government will be described. This constitutes the supply side of business
environment reforms. DB will then be analyzed regarding its accuracy of
1 The World bank conceives business environment regulation as one of 16 criteria for good
governance. (World Bank, 2005,15)

5
measuring the supply side. The results of the SBP exercise of 2008 represent the
demand side 2 for reforms. Demand and supply of reforms will then be compared
in order to establish whether the Rwandan government by its policy met the
demands of the business sector. Finally, the third chapter will compare the results
of a survey of business environment conducted in 2010 with the assessment of
the business environment by DB in the same year. This comparison is then used
to evaluate whether the reforms undertaken in Rwanda between 2008 and 2010
have actually been effective and thus have contributed to the overall goal of Good
Governance.
1.2. Measures of Business Environment Quality
The analysis of a country‟s business environment as performed by the World
Bank‟s Doing Business (DB) Project has gained both increasing public and private
attention. Latest results of this annual exercise have been widely published and
commented (e.g. Economist, 2010,71-73); governments see the results as a
measure of their reform efforts or use it as vehicle to initiate such reforms. Firms
and investors in particular see it as a measure of the ease of doing business in a
country. As a matter of fact, the DB‟s overall ranking of countries is called the
“Ease of Doing Business Indicator”.
Ever since its inception, the DB project has been receiving critical reviews. The
World Bank Doing Business Webpage3 provides for a section listing major
analytical work done with respect to the DB methodology. On top of that, Google
Scholar lists over 1.5 million entries that relate to the DB project.
The methodology underlying DB is not undisputed and has led to internal
evaluation of the project (IEG, 2008). Also, DB is not the only approach to
measuring business environment. The World Bank undertakes two more projects
(Investment Climate Index and Business Enterprise Surveys); outside the World
Bank there are assessments provided by the World Economic Forum (Global
Competitiveness Report), the UNCTAD (World Investment Report) and private
sources like the Economist Intelligence Unit, to name a few. 45
2 For demand for institutional change: (Streeck/Thelen, 2005, pp2).
3 http://www.doingbusiness.org/
4 Comparative analyses of measures of business environment are numerous. Most of them focus on
the different methods of calculating the cost of regulation to businesses. Also, most of them start from
the factual regulation as determined by government decrees. Few, however, include in their analysis
the subjective perception of business regulation within a wider framework of general market
conditions. An exception is (FIAS,2009).
5 For a comparison of the World Bank’s Doing Business approach and the Business Enterprise Survey approach see http://www.enterprisesurveys.org/Methodology/Compare.aspx

6
These approaches complement the DB project; however, in 2008 an alternative to
DB was initiated for Rwanda by the country‟s Private Sector Federation (PSF), the
major Rwandan association of private firms 6. The resulting report “Cutting the
cost of Red Tape” (short: Red Tape Report, RTR) analyses areas of business
environment similar to those of DB, but employs a different methodological
approach (SBP, 2008). In view of the remarkable improvement of Rwanda‟s
position in the DB rankings after publication of this report, the question arises
whether the reforms are attributable to DB, RTR, or both. The underlying
methodologies and their results will be compared.
Generally speaking, the RTR method of information gathering is perception-
based, relying on a large number of respondents, whereas the DB method is
mainly fact based, relying on a comparatively small number of respondents.
RTR allows for the determination of regulatory cost by sector, firm size and
region, whereas DB assumes a standard business case
RTR is part of a comprehensive Public Private Dialogue, whereas DB is
selectively including administration representatives.
The differences in quality and quantity of results of the competing approaches will
be analyzed in this paper.
Table 1: Assessing the business environment 7
1.3. The regulation – growth connex
6 This report is one of the results of the project “Promotion of the economy and employment” commissioned by the German Federal Ministry for Economic Cooperation and Development (BMZ) and co-funded by the Royal Netherlands Embassy to Rwanda; the project duration is from 2004 to 2013. GTZ on behalf of BMZ implements this project, which, apart from the so-called Red Tape analysis consists of further instruments (e.g. business and investment climate surveys, Regulatory Impact Assessment) to strengthen the private sector and improve the business environment in Rwanda.
7 For a more detailed description of the types of analysis see (SBP,2008,15)
8 Ex ante evaluation / RIA is part of the GTZ project, but not subject of discussion here
Type of analysis Information provided by Application
Fact based analysis Expert informants DB
Evidence/perception based Firms, management Regulatory Review (RTR)
Procedural audit, based on time and motion study
Government agencies and their clients
Ex post evaluation of regulations / DB / RTR
Regulatory Impact Analysis (RIA)
Affected stakeholder groups Ex ante evaluation of regulations
8

7
In order to assess the relevance of business environment studies, the role of the
business environment for growth and investment has to be analyzed.
For both, RTR and DB, the term “business environment” is defined as the set of
regulations governing private sector activity. The rationale behind business
environment analysis is that less cumbersome regulation will enhance growth of
firms and employment (IEG, 2008,3). In other words, regulation, directly, though
not solely, affects investment climate and investment activity and therefore
growth9 (Figure 1). While most analyzes find a positive correlation between the
quality of regulation and growth, the direction of causality is not clear. Also, it is
not quite clear whether business regulation as measured by the DB indicators is
strongly correlated with both factual regulation as it affects businesses and
economic outcomes (Commander, Svejnar, 2007).
Figure 1: The Regulation – Growth connex
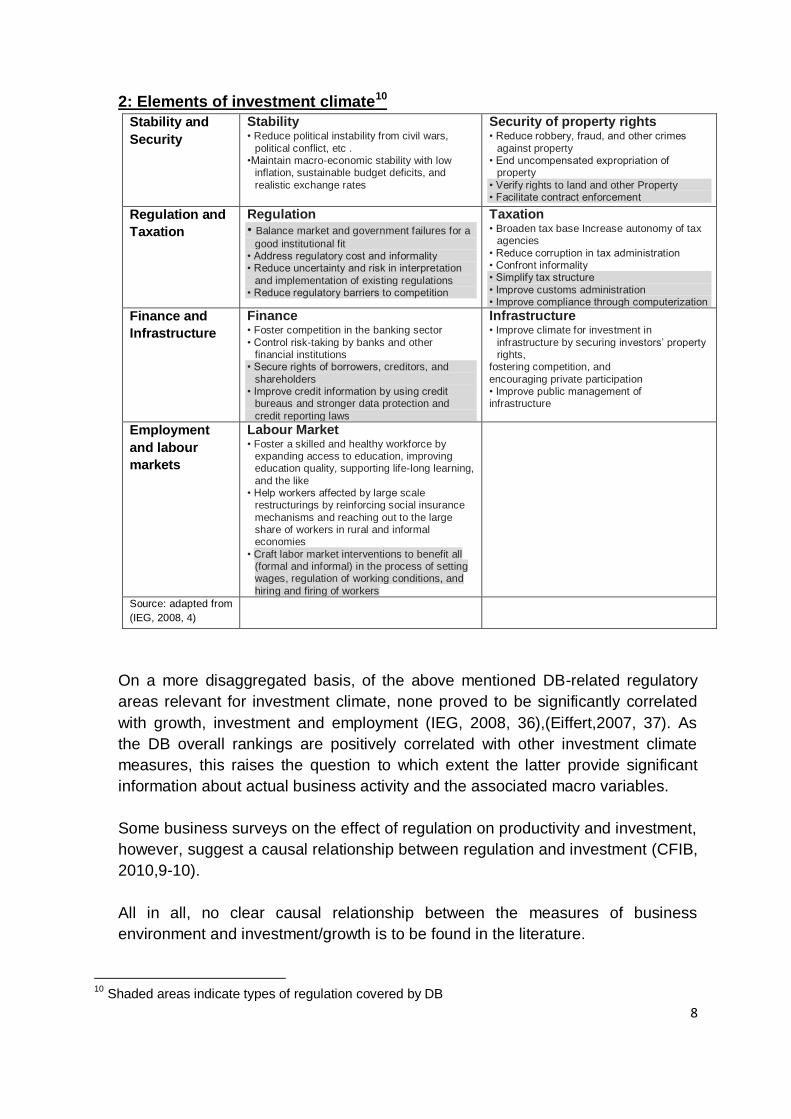
Investment climate can be differenciated into the following areas: Stability and
Security, Regulation and Taxation, Finance and Infrastructure, and Employment
and Labour markets (IEG,2008,4). Table 2 further differentiates these areas and
highlights the subareas covered by DB in the shaded areas. The RTR approach is
potentially open to all of the below mentioned areas.
Research on the DB methodology shows that there the fact based and the (few)
perception based indicators are highly correlated with other measures of
investment climate like the Global Competitiveness Index (World Development
Forum) and the Business Environment Rankings (Economist Intelligence Unit).
However, there is a weaker correlation of perception-based indicators with the DB
indicators in middle and lower income countries (IEG,2008,81, FN 4; DB11,
2010,13)). This is of interest in the Rwandan case.
9 a fundamental paper on the issue is: Djankov, et al, 2000; Djankov et al, 2006; for an analysis based
on firm data in Bangladesh, India, China and Pakistan see: Dollar et al, 2003, 29; for a larger set of
industrialized and developing countries, see Ciccone, 2007, 17; for OECD countries see Alesina et al.,
2005, 21
8
2: Elements of investment climate10
1. Stability and
Security
Stability • Reduce political instability from civil wars,
political conflict, etc . •Maintain macro-economic stability with low
inflation, sustainable budget deficits, and
realistic exchange rates
Security of property rights • Reduce robbery, fraud, and other crimes
against property • End uncompensated expropriation of
property
• Verify rights to land and other Property • Facilitate contract enforcement
2. Regulation and
Taxation
Regulation • Balance market and government failures for a
good institutional fit • Address regulatory cost and informality • Reduce uncertainty and risk in interpretation
and implementation of existing regulations • Reduce regulatory barriers to competition
Taxation • Broaden tax base Increase autonomy of tax
agencies
• Reduce corruption in tax administration • Confront informality • Simplify tax structure
• Improve customs administration • Improve compliance through computerization
3. Finance and
Infrastructure
4.
Finance • Foster competition in the banking sector
• Control risk-taking by banks and other financial institutions
• Secure rights of borrowers, creditors, and
shareholders • Improve credit information by using credit
bureaus and stronger data protection and
credit reporting laws
Infrastructure • Improve climate for investment in
infrastructure by securing investors‟ property rights,
fostering competition, and
encouraging private participation • Improve public management of infrastructure
5. Employment
and labour
markets
Labour Market • Foster a skilled and healthy workforce by
expanding access to education, improving education quality, supporting life-long learning,
and the like • Help workers affected by large scale
restructurings by reinforcing social insurance
mechanisms and reaching out to the large share of workers in rural and informal economies
• Craft labor market interventions to benefit all (formal and informal) in the process of setting wages, regulation of working conditions, and
hiring and firing of workers
6.
7. Source: adapted from
(IEG, 2008, 4) 8.
On a more disaggregated basis, of the above mentioned DB-related regulatory
areas relevant for investment climate, none proved to be significantly correlated
with growth, investment and employment (IEG, 2008, 36),(Eiffert,2007, 37). As
the DB overall rankings are positively correlated with other investment climate
measures, this raises the question to which extent the latter provide significant
information about actual business activity and the associated macro variables.
Some business surveys on the effect of regulation on productivity and investment,
however, suggest a causal relationship between regulation and investment (CFIB,
2010,9-10).
All in all, no clear causal relationship between the measures of business
environment and investment/growth is to be found in the literature.
10
Shaded areas indicate types of regulation covered by DB

9
2. Methodological underpinnings of SBP and DB
The approaches to business environment measurement adopted by SBP and DB
are part of a larger set of methods that are used to assess regulation either ex
ante or ex post. In the following sections both approaches will be introduced, and
their distinguishing features with regard to their results will be highlighted.
2.1. The SBP Approach 11
SBP‟s RTR is based on the “regulatory review methodology”, which
“encompasses the assessment of regulatory costs, and the identification of key
administrative blockages and delays that contribute to these cost” (SBP,2008,14).
RTR is based on a survey of businesses, and is therefore of a perception based
type12. However, as the methodology gathers data on the real cost of compliance
(cash flow, management time, and other internal resources) with existing
regulations, it provides factual information, too. Over and above this, the aim of
the RTR methodology is to provide information to governments on the specific
hurdles faced by firms, allowing a government to fine tune further reform.
The RTR design of a survey is country specific. The companies surveyed are
selected to create a representative sample of the formal business sector, with
respect to industry, size, and regional distribution13. However, SBP cooperates
closely with national business organizations. It is not clear whether membership in
these organizations and cooperation with the survey team are voluntary, and
whether this may result in a bias.
The areas covered by RTR were not pre-defined by a questionnaire or by SBP.
Instead, RTR aims to cover a range of relevant regulatory hurdles as wide as
possible. As these hurdles – and their perceptions - differ from country to country,
this approach is not a priori open to international comparisons. Rather, an
economy specific regulatory landscape is being created. In the case of Rwanda,
only three significant areas of regulatory burdens emerged from the open
questions asked: taxation, trade and labor regulations. Thus, the actual coverage
of RTR may seem to be more narrow, and as a matter of fact is more narrow in
11
Based on the below described SBP approach, an analysis of the Rwandan business environment
was performed and published in a report titled “Cutting the Cost of Red Tape” (in short:RTR). As the
methodology is country specific, all descriptions of the SBP approach will refer to RTR 12
Perception based surveys are subjective by nature. Few surveys of business regulation include the
subjective assessment of business regulation; a comparison of cost measurement methods used
internationally, compiled by Bertelsmann Stiftung, identified two out of seven methods to include
subjective assessments (Riedel,2009,29) 13
In the Rwandan case, 276 large/medium and 127 small enterprises in all provinces and from all
sectors of the economy were selected for the sample (SBP,2008,124).

10
the case of Rwanda, than that of DB, but it reflects the relative weight managers
put on the different regulatory areas, and the relative weight of regulation vis-à-vis
other policy areas (e.g. education, infrastructure, etc). RTR also allows to
distinguish between government regulations and other hurdles faced by firms,
putting into perspective the role of government 14 15.
RTR does not use a standardized business case to define a typical firm. Instead,
it allows for differentiation by geographical area, firm size, industry and other
dimensions. This of course puts additional weight on the selection process in
order to avoid bias with respect to one of the above dimensions 16.
The sequence of questions raised runs from most general to most specific. First,
factors generally discouraging business growth, employment, investment or any
other area of concern are asked and ranked, yielding a distinction between
regulatory and non-regulatory factors (such as competitive situation, business
cycle, infrastructure etc (SBP,2008,21,42). This is followed by questions about
specific regulatory hurdles which allow to distinguish among the government
agencies involved in the respective areas of concern.
In a further step, the cost of regulations identified as major hurdles is assessed.
RTR distinguishes between compliance cost, administrative cost, efficiency cost,
and non-compliance cost (RTR, 2008,28):
Table 3: Regulatory cost categories
Of these cost categories, compliance cost is analyzed within the RTR framework.
Other cost categories, and efficiency cost in particular, can be assessed indirectly
by asking about the ways businesses try to avoid regulatory cost (e.g. outsourcing
14
SBP, 2008, 21 15
In other words, the wide scope suggested by the DB method may overemphasize areas that are not
actually seen as problematic by actors on the ground. 16
For the sample design of RTR, see section 3.4
Category of regulatory cost Examples of Activities involved
Burden on…
Compliance Cost Time; fees to service providers
Firms; economy
Efficiency and opportunity cost
Reduced business activity or size
Economy
Non-compliance cost Paying fines, bribes Non-complying firms, economy
Administrative cost Government agency activities
Economy
Source: adapted from (SBP,2008,28)

11
or limiting the firms size in order not to cross certain thresholds may increase
inefficiency cost (SBP,2008,51)) 17.
2.2. The Doing Business Approach
The World Bank‟s Doing Business approach goes back to the year 2004 when the
first annual report was published. It attempts to gather information on nine
indicators that are supposed to describe regulations governing the typical life
cycle of a firm, from starting to closing a firm. Annex 1 lists these indicators and
the associated sub-indicators18. It should be noted that this list reflects the
assessment of regulations as performed in the 2011 annual report. Prior to that
date, an indicator set covering labor relations was included; this, together with
information on electricity supply, is now presented in an annex to the annual
report (from the 2011 on), but not included in the overall DB rankings.
Data on the sub-indicators are provided by selected experts in the field, so called
informants. These, in the case of the DB 11 report, consist of “more than 8,200
local experts, including lawyers, business consultants, accountants, freight
forwarders, government officials and other professionals routinely administering or
advising on legal and regulatory requirements” (DB11,2010,109). However, as DB
counts each completed questionnaire as one informant (IEG;2008,13), the actual
number of experts may be considerably smaller. During the 2008 evaluation
exercise the actual average number of questionnaire informants per indicator set
ranged from 1 to 3.5. In other words, the average number of informants per
country, looking at all nine indicator sets, was 9.5 persons in 2008. This number
included lawyers (70%), government officials (18%), Accountants (8%), and other
experts (4%), but no managers of firms conforming with the standard business
case (see below) 19.
DB data contain two types of information: first, factual information about existing
laws and regulations, and second, time and motion information about the cost of
obtaining clearances from authorities. However, the latter type of data are not
recorded at the firm level, but at the agent/informant level and they reflect official
fee schedules (DB11,2010,12), not necessarily the actual cost of obtaining
clearances .
17
For the underlying methodology of cost calculation see (SBP,2008,62). 18
The set of indicators has been changing over time. Therefore, a comparison of data over time has
limitations. For a definition of the indicators valid in a particular year, see the respective annual reports
of the DB project. The database provided online does include adjusted values for indicators, but still
does not calculate rankings reaching back more than two years. 19
DB 2009 lists 22 persons for Rwanda, of which two were positively identified as belonging to a (the
same) business (freight service) (World Bank,2009,184)

12
Informants are assuming a standard business case when evaluating the relevant
regulations. These assumptions are listed in Annex 3.
A special feature of DB is the ranking of countries along their performance with
respect to individual indicator sets and, on this basis, along an overall “Ease of
Dong Business” performance. The method raises a number of important issues
which deserve attention. However, as they are beyond the scope of this paper
they will not be dealt with here.
2.3. Comparison of the two approaches
Both, the SBP and the DB approach to measuring business environment
regulation will be compared with regard to the criteria mentioned in section 1.1.
Goals: Both the RTR and the DB approach take measure of a country‟s
business environment. Their stated goals are similar: to provide governments
with a regulatory profile that allows the identification of hurdles and bottlenecks
and to initiate reform efforts.
Method of gathering information: DB applies a so called “fact based” method,
i.e. firms agents and officials dealing with regulation as it is written down in
laws and decrees is evaluated; also, DB relies on a small number of
informants (on average less than 10 per country). SBP follows a so called
perception based method, i.e. it surveys firms directly with regard to how
regulation – whether decreed or not - affects businesses on the ground. The
number of firms is large and structured enough to allow a sample
representative of the country‟s economic structure. Also, RTR focuses strongly
on the cost of regulatory burdens; DB does not allow the calculation of
aggregated regulatory cost. DB only counts the cost that is based on official
fee schedules; the cost of compliance with the regulation is only partially
covered where time is used as a measure of regulatory compliance. However,
as noted above, compliance in DB is seen as activities performed by agents
acting on behalf of firms, not as actions of firm staff themselves. It is not clear,
whether this, apart from the type of firm definition of the standard business
case, creates a further bias towards larger firms which can afford to hire these
agents. Small firms, and those in transition from the informal sector into the
formal sector in particular, are less likely to hire agents. The effect of
regulation on this class of firms therefore is likely not to be covered by the DB
analysis; this being in contradiction to the original DB goals which emphasize
the transition of informal businesses into the formal sphere as a major driver of
(official) employment, growth and investment. Data obtained through either
method are subject to cleaning and validation processes. These are not fully
13
transparent; they tend to allow for biases especially where a high share of
questions are open, as is the case with the RTR.
Types of businesses considered: DB assumes a standard business case for
all countries, whereas SBP surveys a sample of firms typical for the country
concerned. DB allows a cross country comparison of results. SBP‟s results
are country specific.
Regional and sectoral scope: DB generally focuses on a country‟s capital city,
but allows for separate studies of other regions or industry clusters within a
country; sectors are not specified. SBP considers a country‟s regions and
sectors as they are representative of the country‟s economic structure.
Estimation of regulatory cost: DB lists cost as listed in official fee schedules.
SPB estimates the total cost of compliance with regulations at the firm,
regional, sectoral, and macro level.
Ability to measure correctly supply of regulatory reforms by the government
(DB) and demand for reforms by businesses (SBP): DB measures reforms as
they are decreed. This should allow for a correct description of a governments
reform efforts when communication with the authorities is working. SBP cannot
measure supply of reforms, but rather forms a basis for demand of reforms as
firms are listing the major hurdles to doing business. The adequacy of the
demand estimation relies heavily on the quality of data generation.
Effects on government reform agenda: The approaches differ in their effects:
whereas the SBP approach – due to its country specific nature - is not easily
open to cross country comparisons, the DB approach is best known for its
country rankings. On the other hand, the RTR approach allows governments
to target regulatory reform in such a way as to relieve firms from the most
cumbersome and costly regulators burdens. DB is less well suited to yield this
result, because the measured business environment reflects laws as they are
written rather than their enforcement and effect on businesses “on the ground”
(see for this distinction: La Porta et al, 2008, 293).
3. Case study Rwanda
This chapter focuses on the results of both the DB and the SBP approach with
regard to Rwanda. First, economic reforms as decreed by the Rwandan
government will be described. This constitutes the supply side of business
environment reforms. DB will then be analyzed regarding its accuracy of
measuring the supply side. The results of the SBP approach of 2008 are
interpreted as a measure of the demand side. Demand and supply of reforms will
then be compared in order to establish whether the Rwandan government by its
policy met the demands of the business sector. Finally, the third chapter will
compare the results of a survey of business environment conducted in 2010 with
14
the assessment of the business environment by DB in the same year. This
comparison is then used to evaluate whether the reforms undertaken in Rwanda
between 2008 and 2010 have actually been effective and thus have contributed to
the overall goal of Good Governance.
3.1. Economic environment and economic reforms in Rwanda
First, the major sources of information on the business environment in Rwanda
will be sketched. This is followed by an overview of reforms in Rwanda since 2007
as stated by the Rwandan government.
Major sources of information about the Rwandan regulatory environment are the
Rwanda government and the World Bank. The World Bank mostly lists reforms
documented in its DB Database. Other sources of information on the reform
efforts of the Rwandan government are scarce and scattered, sometimes only
indicative of reforms. The latest WTO Trade Policy Review dates from 2004 and
therefore does not include the period of reforms. The IMF commends Rwanda‟s
successful macroeconomic adjustment. In June 2010, Rwanda adopted the IMF‟s
PSI program (Policy Support Instrument) which is open to countries that do not
depend on financial assistance from the IMF anymore (Gershenson,2010). IMF
International Financial Statistics (IFS) at the time of writing do not offer relevant
data beyond 2008. UNCTAD data show that between 2007 and 2009 Rwanda
recorded an annual increase in FDI inflows of 20% (UNCTAD, 2010, 168); its FDI
stock rose fivefold in each of the decades 1990-2000 and 2000-2010
(UNCTAD,2010,173). 20
Reforms of the business environment regulation undertaken in Rwanda as stated
by the government are summarized in table 4b. Over the period 2007 to 2010 a
total of 21 reforms were implemented. In terms of the DB indicator categories, the
largest number of them focused on taxes, trade, and property registration. Most
of the reforms occurred in the year 2009/2010.
20
It is interesting to note that although within an international country ranking of FDI inflows Rwanda
jumped from rank 105 to rank 65 in only two years, the FDI inward potential index for Rwanda barely
changed between 2007 and 2008 (UNCTAD, 20102,2). It would be interesting to see whether
economic reforms after 2008 will have an impact on this outcome-oriented indicator.
15
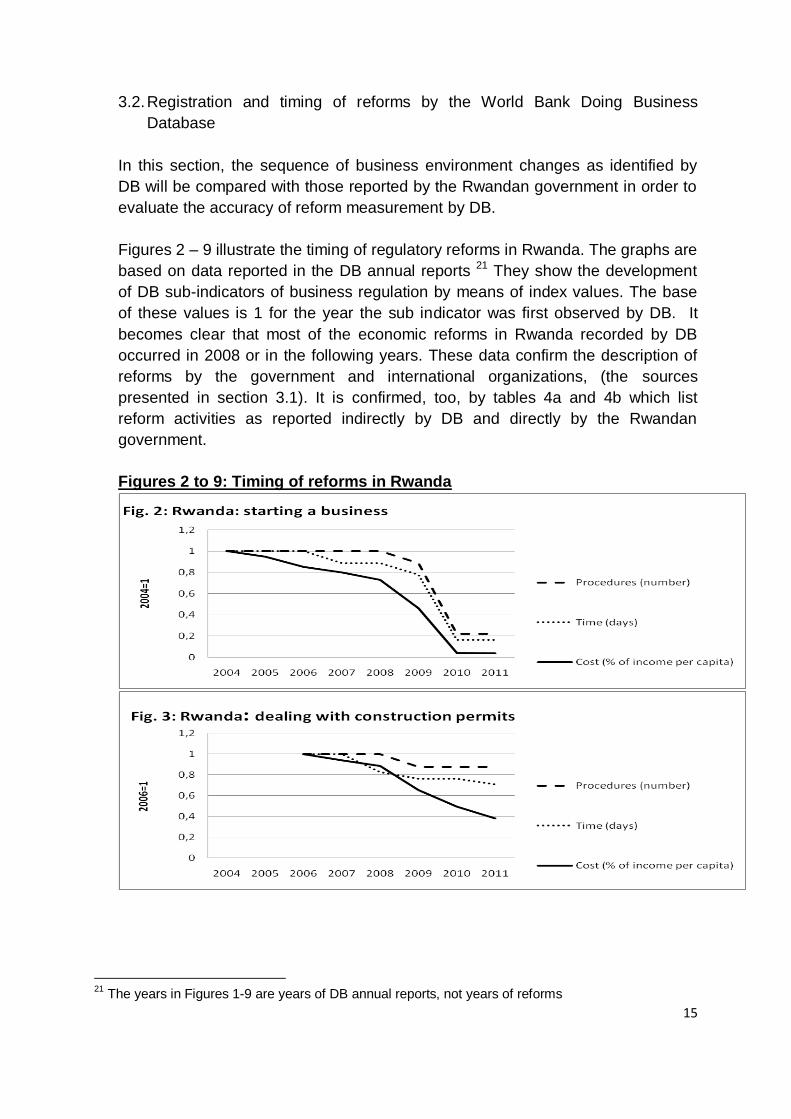
3.2. Registration and timing of reforms by the World Bank Doing Business
Database
In this section, the sequence of business environment changes as identified by
DB will be compared with those reported by the Rwandan government in order to
evaluate the accuracy of reform measurement by DB.
Figures 2 – 9 illustrate the timing of regulatory reforms in Rwanda. The graphs are
based on data reported in the DB annual reports 21 They show the development
of DB sub-indicators of business regulation by means of index values. The base
of these values is 1 for the year the sub indicator was first observed by DB. It
becomes clear that most of the economic reforms in Rwanda recorded by DB
occurred in 2008 or in the following years. These data confirm the description of
reforms by the government and international organizations, (the sources
presented in section 3.1). It is confirmed, too, by tables 4a and 4b which list
reform activities as reported indirectly by DB and directly by the Rwandan
government.
Figures 2 to 9: Timing of reforms in Rwanda
21
The years in Figures 1-9 are years of DB annual reports, not years of reforms

16

17
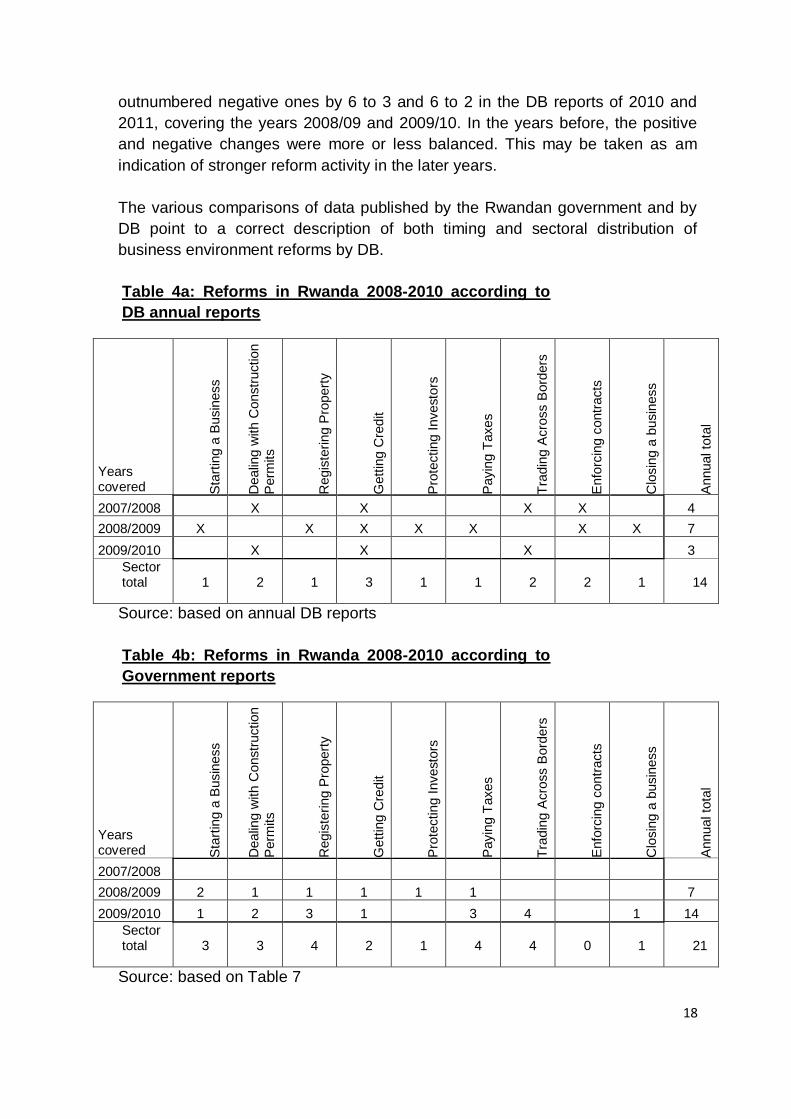
Tables 4a and 4b list the areas of economic reform between 2008 and 2010,
based on the Doing Business annual reports 2009 – 2011, and on reports of the
Ministry of Trade and Industry, for comparison. According to DB reports, the
largest number of reforms (7) occurred in the year 2008/2009, most of the reform
activities over the period (3) focused on the financial sector, and here on the
credit availability to firms. This table differs considerably from official information
provided by the Ministry of Trade and Industry, Government of Rwanda (see
Table 7 and Annex 2). There, for 2008/2009 six areas of reform including seven
measures are listed, and for 2009/2010 seven areas of reform including 14
measures are listed. The differences in the number of affected areas may be
explained by different definitions of dates when regulations become effective. Still,
the fact that DB includes government officials among its informers should warrant
a single timeline of reforms.
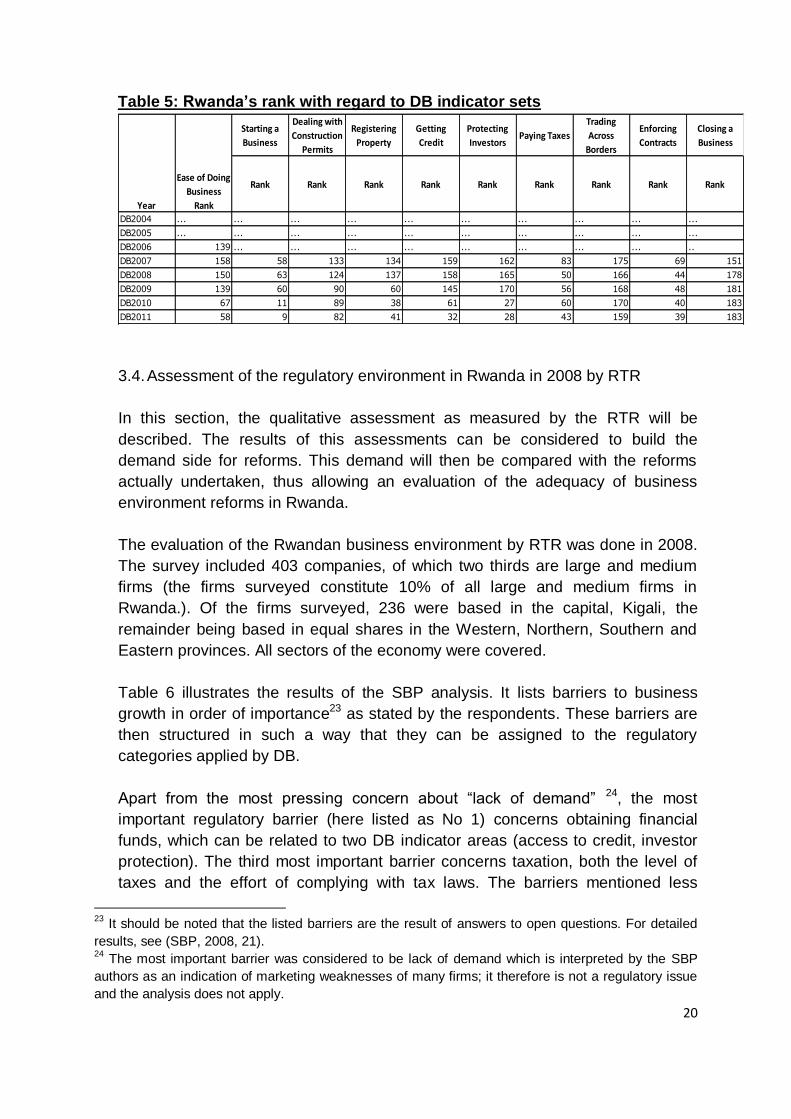
As a supporting illustration only, Table 5 may be used. It shows Rwanda‟s
international rankings with respect to the nine DB indicator sets. However, due to
the relative nature of rankings, they do not necessarily show factual
improvements. Still, as a worsened regulatory environment has seldom been
identified in the DB annual reports, a general and global trend towards
improvement may be assumed. In this case. positive changes in rankings point to
improvements in the business environment that exceed those of other countries in
the same quantile. For Rwanda, positive changes in rankings clearly
18
outnumbered negative ones by 6 to 3 and 6 to 2 in the DB reports of 2010 and
2011, covering the years 2008/09 and 2009/10. In the years before, the positive
and negative changes were more or less balanced. This may be taken as am
indication of stronger reform activity in the later years.
The various comparisons of data published by the Rwandan government and by
DB point to a correct description of both timing and sectoral distribution of
business environment reforms by DB.
Table 4a: Reforms in Rwanda 2008-2010 according to
DB annual reports
Years covered S
tart
ing a
Busin
ess
Dealin
g w
ith C
onstr
uction
Perm
its
Regis
tering P
ropert
y
Gett
ing C
redit
Pro
tecting I
nvesto
rs
Payin
g T
axes
Tra
din
g A
cro
ss B
ord
ers
Enfo
rcin
g c
ontr
acts
Clo
sin
g a
busin
ess
Annual to
tal
2007/2008
X
X
X X
4
2008/2009 X
X X X X
X X 7
2009/2010
X
X
X
3
Sector total 1 2 1 3 1 1 2 2 1 14
Source: based on annual DB reports
Table 4b: Reforms in Rwanda 2008-2010 according to
Government reports
Years covered S
tart
ing a
Busin
ess
Dealin
g w
ith C
onstr
uction
Perm
its
Regis
tering P
ropert
y
Gett
ing C
redit
Pro
tecting I
nvesto
rs
Payin
g T
axes
Tra
din
g A
cro
ss B
ord
ers
Enfo
rcin
g c
ontr
acts
Clo
sin
g a
busin
ess
Annual to
tal
2007/2008 2008/2009 2 1 1 1 1 1
7
2009/2010 1 2 3 1
3 4
1 14
Sector total 3 3 4 2 1 4 4 0 1 21
Source: based on Table 7
19
3.3. Assessment of the regulatory environment in Rwanda in 2008 by DB
In this section a qualitative assessment of the Rwandan business environment as
measured by the DB indicator is attempted. In a later section this will then be
compared with the assessment by SBP.
DB does not directly provide information on strengths and weaknesses of a
country‟s regulatory environment. This can only be concluded from a country‟s
relative position in the international ranking. However, an international ranking
does not necessarily reflect the valuation of the regulatory environment from a
domestic business‟ perspective; rather, these rankings are indicative of an
outsider‟s perception of Rwanda. This view is taken seriously by the Rwandan
government as it cites the international rankings of Rwanda in frequently in its
documents (Ministry of Trade and Industry, 2009,24; Ministry of Trade and
Industry, 2010,20). Table 5 shows the rankings for Rwanda as published in the
respective annual reports. They can be considered to reflect the international
perception of the strengths and weaknesses of Rwanda‟s regulatory environment.
For both DB 2007 and DB 2008 regulation of the financial sector (both investor
protection and credit markets) and of foreign trade appear to be relatively
unfavorable. Table 4a showed that these areas were attracting above average
reform activities during the years 2008 and 2009. On the other hand, enforcing
contracts and starting a business were also reformed in two years, despite the
fact that rankings in these areas were relatively benign from the beginning.
Therefore, it cannot be concluded from the data that the government targeted
reforms to those areas that were attracting negative international attention, neither
does it prove that these badly ranked areas were in fact areas of major concern to
the government, or businesses in Rwanda22. However, the government‟s
accelerated reform activities coincided with a drop in the total ranking in DB 2007
from 139 to 158. In other words, the DB data do not provide a conclusive
indication of relative strengths or weaknesses of individual regulatory areas in
Rwanda as perceived by the local businesses.
22 Still, the government points out: “The reforms were led by the Investment Climate Department in MINICOM and the Doing Business Unit at RDB, co-ordinated by the national Doing Business Taskforce. This team has ensured the carrying through of a number of reforms that have led to the indicator improvements in the Doing Business Report.” (Ministry of Trade and Industry, 2009,24)
20
Table 5: Rwanda’s rank with regard to DB indicator sets
Starting a
Business
Dealing with
Construction
Permits
Registering
Property
Getting
Credit
Protecting
InvestorsPaying Taxes
Trading
Across
Borders
Enforcing
Contracts
Closing a
Business
Rank Rank Rank Rank Rank Rank Rank Rank Rank
DB2004 ... ... ... ... ... ... ... ... ... ...
DB2005 ... ... ... ... ... ... ... ... ... ...
DB2006 139 ... ... ... ... ... ... ... ... ..
DB2007 158 58 133 134 159 162 83 175 69 151
DB2008 150 63 124 137 158 165 50 166 44 178
DB2009 139 60 90 60 145 170 56 168 48 181
DB2010 67 11 89 38 61 27 60 170 40 183
DB2011 58 9 82 41 32 28 43 159 39 183
Year
Ease of Doing
Business
Rank
3.4. Assessment of the regulatory environment in Rwanda in 2008 by RTR
In this section, the qualitative assessment as measured by the RTR will be
described. The results of this assessments can be considered to build the
demand side for reforms. This demand will then be compared with the reforms
actually undertaken, thus allowing an evaluation of the adequacy of business
environment reforms in Rwanda.
The evaluation of the Rwandan business environment by RTR was done in 2008.
The survey included 403 companies, of which two thirds are large and medium
firms (the firms surveyed constitute 10% of all large and medium firms in
Rwanda.). Of the firms surveyed, 236 were based in the capital, Kigali, the
remainder being based in equal shares in the Western, Northern, Southern and
Eastern provinces. All sectors of the economy were covered.
Table 6 illustrates the results of the SBP analysis. It lists barriers to business
growth in order of importance23 as stated by the respondents. These barriers are
then structured in such a way that they can be assigned to the regulatory
categories applied by DB.
Apart from the most pressing concern about “lack of demand” 24, the most
important regulatory barrier (here listed as No 1) concerns obtaining financial
funds, which can be related to two DB indicator areas (access to credit, investor
protection). The third most important barrier concerns taxation, both the level of
taxes and the effort of complying with tax laws. The barriers mentioned less
23
It should be noted that the listed barriers are the result of answers to open questions. For detailed
results, see (SBP, 2008, 21). 24
The most important barrier was considered to be lack of demand which is interpreted by the SBP
authors as an indication of marketing weaknesses of many firms; it therefore is not a regulatory issue
and the analysis does not apply.

21
frequently are either not of a regulatory nature (“high costs”) or are too general
(“regulation”) or were mentioned by only a small number of respondents.
Regulation, according to RTR, is an issue for at least 25% of respondents.
Taxation, labor regulation and skills emerged as the most important item when
respondents were asked to name regulatory issues, constraints on employment,
interaction with the government, and “time consuming and troublesome”
regulations in more detail (SBP,2008,pp42). In the latter category, business
registration and closure were mentioned.
For Rwanda, the order of importance to businesses of these areas proves to be
valid across business sectors, firm size and geographical area. Not surprisingly,
two of the areas of concern (taxation, Import/Export regimes) were mentioned as
priority areas for regulatory reform 25.
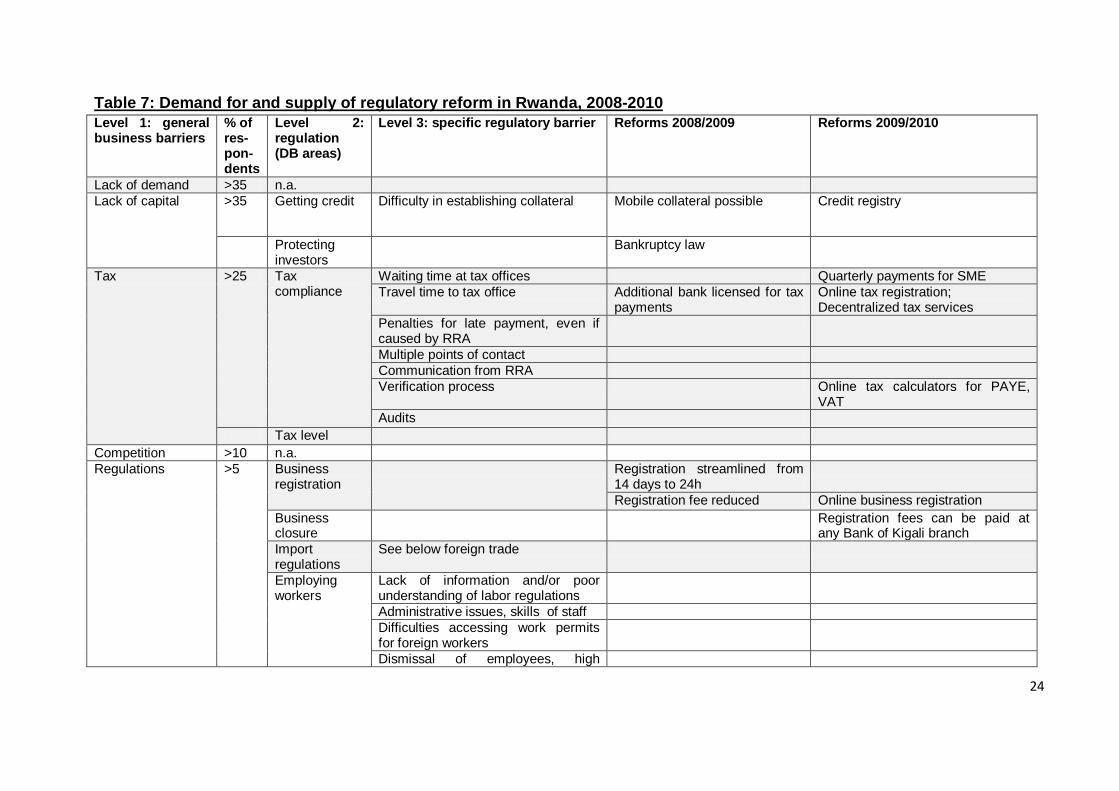
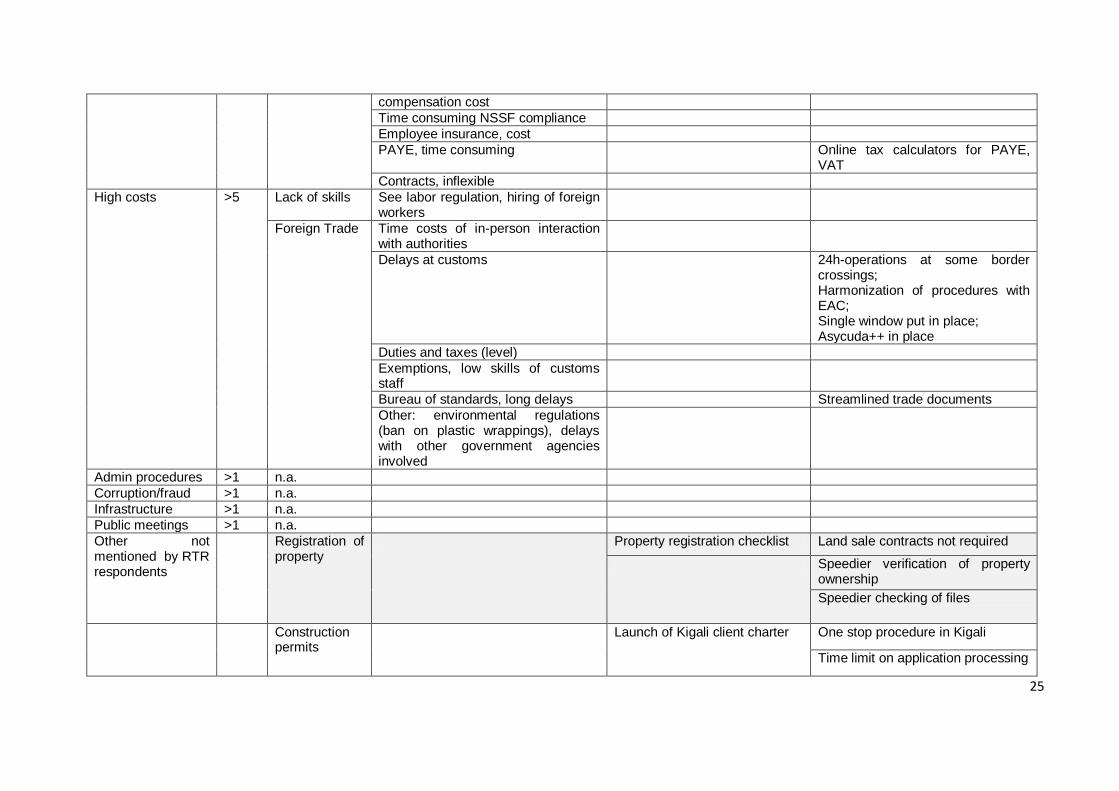
Table 7 disaggregates the concerns of businesses. They are listed from a more
general (level 1) to a very specific level (3). These specific concerns are then
compared with reform activities of the Rwandan government since 2008. Thus,
they can be interpreted as demand for and supply of reforms in Rwanda.
Summarizing demand for and supply of reforms as defined above, reforms were
covering all but one indicator set of the DB database. With respect to the 20 more
specific concerns of businesses as described by the RTR report, 7 were covered
by reforms, and 13 areas were not covered. Did the reforms address the needs of
RTR respondents, i.e. of Rwandan businesses? They did with respect to
availability of capital, they were partly consistent with RTR revealed need in
registration/closure of businesses, and were more or less beside the point
(reforming where RTR did not detect demand) in three areas. This points to a bias
of reform design towards the DB indicators.
25
It would be interesting to see whether this order of importance appears in other countries, too. SBP
has not published any other comparable studies, though. Alternatively, a cross country analysis of the
World Bank‟s enterprise survey data (which are also perception based) could be attempted.

22
Table 6: Areas and adequacy of Rwandan regulatory reform
Area of reform Demand mostly met?
Detailed description
1. Access to capital
Yes The most important area of concern, lack of capital, was tackled by two reforms in 2008/09 and one further reform in the following year. These reforms provide for regulations that deal with the most pressing needs of borrowers and lenders, i.e. pledging mobile collateral and establishment of a credit registry. The latter is confirmed by data in Figure 5.
2. Taxation partly The second most important area of concern, taxation, was covered by one reform in 2008/09 and another three measures in 2009/10. The reforms make the process of declaring tax easier, but they fail to deal with the issue of communication with RRA, which can be rooted to lack of skills and inefficient organizational structures within RRA. Also, the decision on and level of penalties were not tackled.
3. Registration/ closure of business
Supply > demand
Registration and closure of businesses constitutes another area of concern. Neither of these areas was specified by respondents; nonetheless, the first was the subject of reforms: opening a business has been made more easy through two reforms in each year , business closure issues were not dealt with.
4. Labor no The area of labor regulations was not specified as a high ranking area of concern by respondents. However, the RTR spelled out the weaknesses under the heading “regulation” in detail. Still, no reforms were undertaken in the two years, with the exception of online income and value added tax payments. The liberalization of work permits for foreigners preceded that time.
5. Trade Partly Weaknesses in the area of foreign trade regulation, presumed to be included in concerns about regulation in general, was described in more detail in the RTR, too. Here, of five weaknesses listed in RTR, two were covered by reforms in the second year. They mostly dealt with speedier processing of documents, whereas complaints about ineffective and insufficiently skilled staff where not covered.
6. Other Supply > demand
Areas not mentioned by businesses in the RTR like registration of property issuing of construction permits where covered by one reform each in 2008/09 and two reforms each in 2009/10. Incidentally, those areas (like opening and closing a business, see above), feature prominently on the Doing Business list of indicators.
The demand/supply approach to reforms may provide a political economy type of
explanation. A different tack would be taken if the government is assumed to
behave as a benevolent dictator. In this case its goal would be to reduce the cost
of regulation26.
The RTR offers insights into the cost of regulation to businesses (SBP,2008,
ch.7). A hypothesis for how the government prioritizes reforms is to assume that
most costly regulations would be tackled either first or most intensively.
26
Gross cost, as regulation benefits are not addressed
23
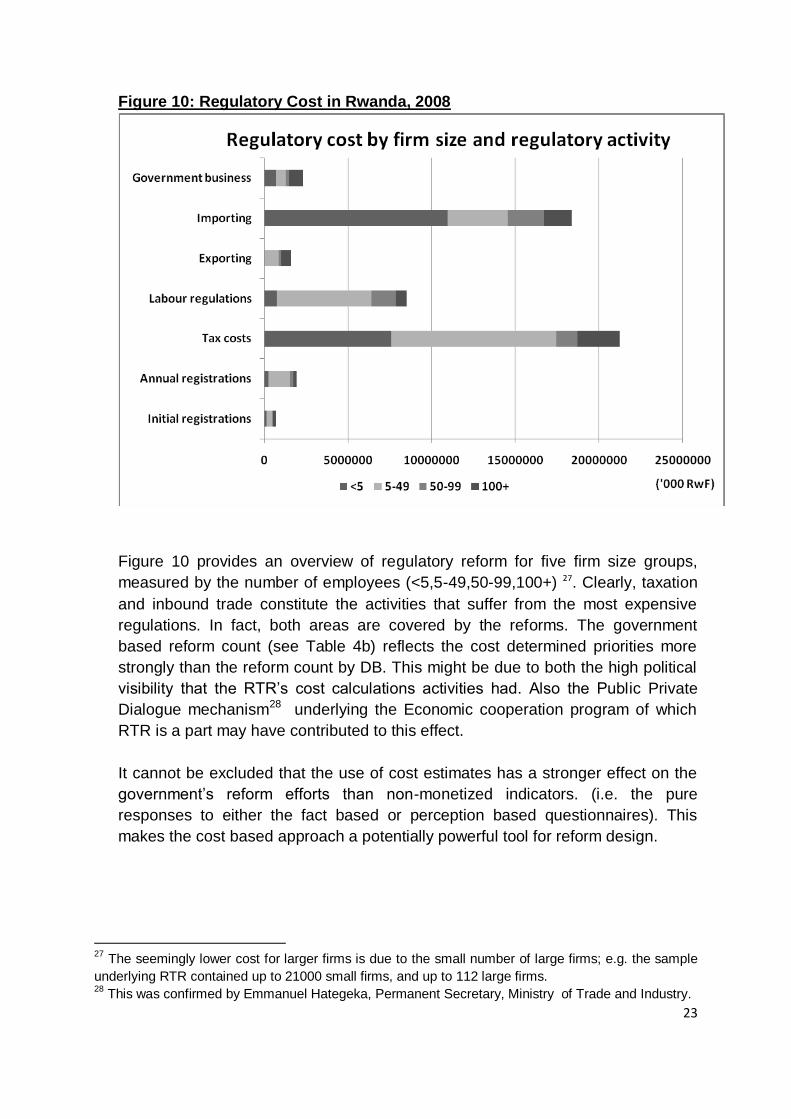
Figure 10: Regulatory Cost in Rwanda, 2008
Figure 10 provides an overview of regulatory reform for five firm size groups,
measured by the number of employees (<5,5-49,50-99,100+) 27. Clearly, taxation
and inbound trade constitute the activities that suffer from the most expensive
regulations. In fact, both areas are covered by the reforms. The government
based reform count (see Table 4b) reflects the cost determined priorities more
strongly than the reform count by DB. This might be due to both the high political
visibility that the RTR‟s cost calculations activities had. Also the Public Private
Dialogue mechanism28 underlying the Economic cooperation program of which
RTR is a part may have contributed to this effect.
It cannot be excluded that the use of cost estimates has a stronger effect on the
government‟s reform efforts than non-monetized indicators. (i.e. the pure
responses to either the fact based or perception based questionnaires). This
makes the cost based approach a potentially powerful tool for reform design.
27
The seemingly lower cost for larger firms is due to the small number of large firms; e.g. the sample
underlying RTR contained up to 21000 small firms, and up to 112 large firms. 28
This was confirmed by Emmanuel Hategeka, Permanent Secretary, Ministry of Trade and Industry.
24
Table 7: Demand for and supply of regulatory reform in Rwanda, 2008-2010
Level 1: general business barriers
% of res-pon-dents
Level 2: regulation (DB areas)
Level 3: specific regulatory barrier Reforms 2008/2009 Reforms 2009/2010
Lack of demand >35 n.a.
Lack of capital >35 Getting credit Difficulty in establishing collateral Mobile collateral possible Credit registry
Protecting investors
Bankruptcy law
Tax >25 Tax compliance
Waiting time at tax offices Quarterly payments for SME
Travel time to tax office Additional bank licensed for tax payments
Online tax registration; Decentralized tax services
Penalties for late payment, even if caused by RRA
Multiple points of contact
Communication from RRA
Verification process Online tax calculators for PAYE, VAT
Audits
Tax level
Competition >10 n.a.
Regulations >5 Business registration
Registration streamlined from 14 days to 24h
Registration fee reduced Online business registration
Business closure
Registration fees can be paid at any Bank of Kigali branch
Import regulations
See below foreign trade
Employing workers
Lack of information and/or poor understanding of labor regulations
Administrative issues, skills of staff
Difficulties accessing work permits for foreign workers
Dismissal of employees, high
25
compensation cost
Time consuming NSSF compliance
Employee insurance, cost
PAYE, time consuming Online tax calculators for PAYE, VAT
Contracts, inflexible
High costs >5 Lack of skills See labor regulation, hiring of foreign workers
Foreign Trade Time costs of in-person interaction with authorities
Delays at customs 24h-operations at some border crossings; Harmonization of procedures with EAC; Single window put in place; Asycuda++ in place
Duties and taxes (level)
Exemptions, low skills of customs staff
Bureau of standards, long delays Streamlined trade documents
Other: environmental regulations (ban on plastic wrappings), delays with other government agencies involved
Admin procedures >1 n.a.
Corruption/fraud >1 n.a.
Infrastructure >1 n.a.
Public meetings >1 n.a.
Other not mentioned by RTR respondents
Registration of property
Property registration checklist Land sale contracts not required
Speedier verification of property ownership
Speedier checking of files
Construction permits
Launch of Kigali client charter One stop procedure in Kigali
Time limit on application processing
3.5. Results of the sample survey in 2010 29
In this section, the assessment of regulatory reform in Rwanda since 2008 is
contrasted with the results obtained during a survey mission in November 2010.
Following the method applied in section 3.4, the survey asked respondents about
regulatory hurdles in the areas defined by the DB indicators. The goal is to find
out whether the reforms decreed by the government and measured by DB were
effective “on the ground”, i.e. whether businesses actually felt a clear
improvement in these areas. Hence, the 2010 survey combined elements of the
SBP approach (perception based survey) with elements of DB (pre-defined
criteria) and thus allows an evaluation of the DB results.
In November 2010, managers from 12 private sector businesses, two banks, two
government agencies, two universities and one business association were
interviewed. Of the businesses, five belong to the service sector, one to the
agricultural sector, and six to the manufacturing sector. Turnover ranged from
FRW 35m to FRW 5500, fixed employment ranged from 15 to 700 persons, and
nine firms directly or indirectly30 were involved in cross border transactions.
Businesses were located in the urban area of the capital, Kigali (9), in the
provincial center area of Butare (2), and one in rural areas. All the firms had been
subject to the SBP exercise in 2008.
The goal of the interviews was to evaluate the effects of latest regulatory reforms
“on the ground”, i.e. whether these reforms have effectively solved businesses‟
problems that were either mentioned by the SBP report 31or that showed a below-
average ranking in the DB indicators.
The interviews were of a semi-open question type; the managers were asked to
describe the situation regarding the nine DB indicator sets, plus the issue of
labour legislation (“Employing workers” in earlier DB rankings). The (open)
answers were then coded regarding their degree of meeting the goals of the
regulatory reform listed by DB, ranging from +1 (100% effectiveness of reform) to
-1 (no effectiveness at all).
In table 8 below, the responses for the results for the indicators are listed in their
order of evaluation, with a high positive mean indicating that the regulatory
burdens in the concerned DB indicator group were felt on the ground; conversely,
a high negative mean would indicate that no relief from regulatory burdens was
felt in the indicator group.
29
The field survey was commissioned by GTZ, Rwanda. 30
Indirectly is defined as using imported materials or products and having to comply with regulations
concerning usage of foreign goods or their maintenance. 31
All firms were involved in the survey underlying the RTR of 2008.

Reforms with regard to indicators starting a business and registering property
were perceived as being most successful, whereas getting credit and closing a
business were seen as the least successful areas of regulatory reform.
Table 8: Perception of regulatory reforms by business managers
DB Indicator Mean Description
Starting a
business
+0,8 Most managers evaluated the process of opening a business very
positively. However, two of them also reported that the situation was
as easy before 2008. Most of them reported that apart from the
registration process, other difficulties which were not tackled by
reforms remain
Registering
Property
+0.3 Experiences of managers diverged strongly. In some cases, recent
registration took 21 months, in other cases it was considered to be
very easy. One stop agencies were established at locations outside
Kigali, too, but still the required documents to get a title have to be
obtained from lower level agencies which have not been reformed
and which contribute to the cumbersome nature of procedures.
Employing
Workers
0 The existing laws were seen as less problematic than the lack of
skills. In this respect, the laws governing employment of foreigners
were seen as restrictive; this pertains to related areas , like payments
to NSSF for expats, too. Another complaint referred to high and
unpredictable compensation payments once employees have to be
laid off. Generally, the hiring of workers was not seen as a problem if
lawyers are setting up the contracts.
Enforcing
contracts
-0.2 Managers know about the reforms (establishment of business case
courts), but still do not see the legal system as a viable option to
enforce contracts. The reasons given are long time for decisions,
dependent courts and corruption, as well as a large share of cash
based transactions that are not reported to the authorities, and hence
not enforceable.
Construction
permits
-0.3 MeanRespondents stressed that severe regulatory hurdles exist at
lower levels of decision-making. Fast track construction permissions
require the submission of documents that have to be issued at
district or local levels, where long delays still are common. Also,
complaints about unskilled officials and the necessity to obtain
permissions for minor changes of existing buildings were mentioned.
Furthermore, heavy handed regulation in other related areas (e.g.
the Kigali masterplan for inner city development requires owners of
property to increase covered area by 400%) make construction per
se more difficult.
Paying taxes -0.3 Most managers complained that online payments were not possible;
online registration was appreciated, though. A major problem
appears to be tax audits, due to unskilled staff and harsh payment
conditions. Also, the skills of tax officials regarding tax assessment
were often questioned. VAT payments were seen as a strain on cash
flow, as payments have to be made when the bill is issued, not when
payment is received. This pushes many firms into cash payments,
which in turn reduces efficiency of the financial system as a whole
and reduces the transparency for the tax authorities. In fact,
respondents, when asked about the opportunities to enforce
contracts (see below), mentioned that courts are not a viable option
because many transactions were cash based and not reported to the
tax authorities.
Trading across
borders
-0.4 Generally, processes were sped up, but lacking skills of customs
officials lead to disputes over customs valuation in many cases.
These problems lead to a delay outside the activities covered by the
reforms.
Closing a
business
-0.5 Generally the law is seen as good, but ineffective because
bankruptcy is not an option for other reasons: most managers
responded that a defaulter would be denied access to credit in the
future, and that claims could not be effectively recovered through the
courts. Therefore, the reform seems not have been effective yet
Getting credit -0.5 Most managers complained about the inability to secure loans with
mobile (working) capital. One respondent mentioned a credit window
against mobile collateral at a Kenyan bank. Here clearly the reforms
have not been effective on the ground; based on interviews with
bank managers, this seems to be due to the banks which are
particularly risk averse at the time of the financial crisis and therefore
do not adopt the latest changes in regulation
Protecting
investors
n.a. no statements were made regarding this indicator
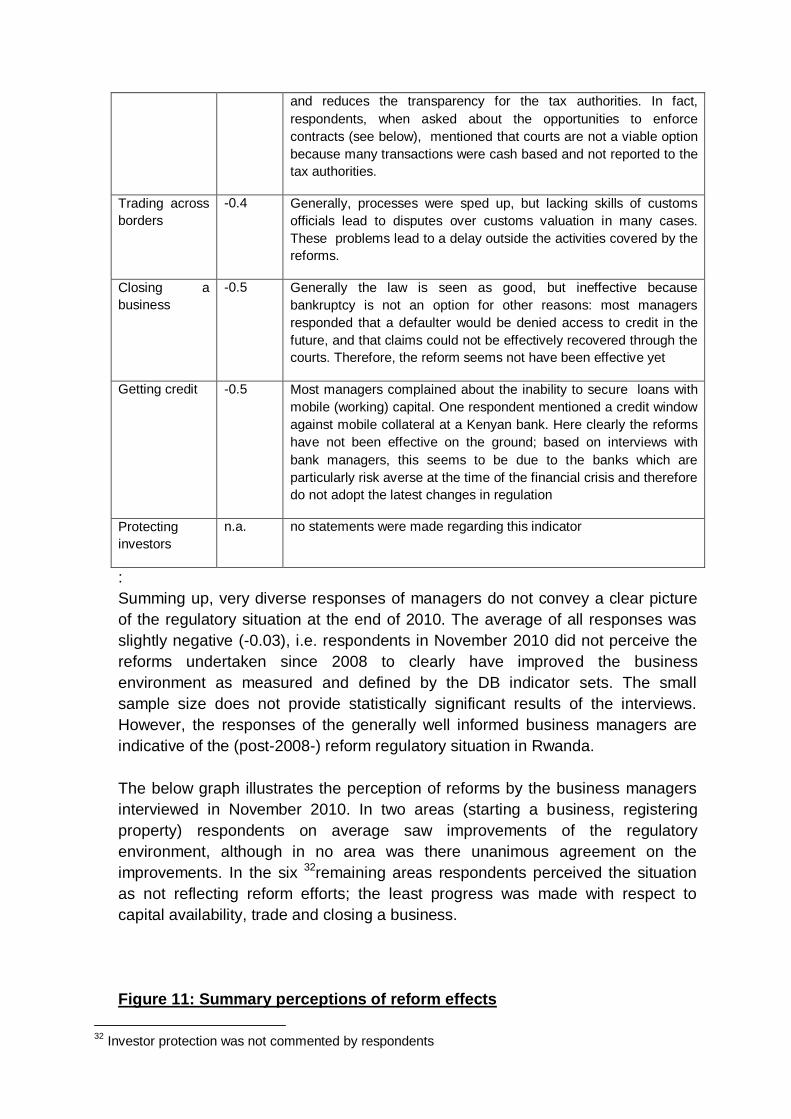
:
Summing up, very diverse responses of managers do not convey a clear picture
of the regulatory situation at the end of 2010. The average of all responses was
slightly negative (-0.03), i.e. respondents in November 2010 did not perceive the
reforms undertaken since 2008 to clearly have improved the business
environment as measured and defined by the DB indicator sets. The small
sample size does not provide statistically significant results of the interviews.
However, the responses of the generally well informed business managers are
indicative of the (post-2008-) reform regulatory situation in Rwanda.
The below graph illustrates the perception of reforms by the business managers
interviewed in November 2010. In two areas (starting a business, registering
property) respondents on average saw improvements of the regulatory
environment, although in no area was there unanimous agreement on the
improvements. In the six 32remaining areas respondents perceived the situation
as not reflecting reform efforts; the least progress was made with respect to
capital availability, trade and closing a business.
Figure 11: Summary perceptions of reform effects
32
Investor protection was not commented by respondents

-1,0 -0,8 -0,6 -0,4 -0,2 0,0 0,2 0,4 0,6 0,8 1,0
1)starting a business
2)dealing with construction permits
3)employing workers
4)registering property5)getting credit
6)protecting investors
7)paying taxes
8)trading across borders
9)enforcing contracts
10) closing a business
average
Perception of reforms on the ground
These results compare with the reform measures listed in table 7 (level1). There,
cumbersome trade regulation was mentioned as a severe problem, a view
confirmed by the interviews of 2010. However, reforms addressed only a few of
the specific regulatory problems (processing time), but did not tackle the issue of
skills in the RRA. Regulation of credit markets did not address the problems
sufficiently either, as the reforms were not taking into consideration the reluctance
of banks to make use of the new regulation. Perception of the tax regime has only
partly been perceived as improved, because valuation issues (in tax assessment
and in audits) and cash flow issues were not addressed by the reforms. However,
the time savings allowed by the new regulations was appreciated by most
businesses33. Finally, respondents on average were neutral towards labor
regulations, although these were listed specifically in the SBP report.
The general conclusion that reforms did not target the most pressing needs of
businesses is supported when the results of the 2010 survey are compared with
the timeline and strength of reforms as measured by DB and illustrated in graphs
2 to 9. Only in the indicator groups “starting a business” and “registering property”
did respondents in 2010 confirm that the strong reforms suggested by DB actually
had had an effect “on the ground”, i.e. were felt by business managers. For four
indicator groups that showed strong improvement in DB (enforcing contracts,
trade, paying taxes, getting credit) business managers did on average not report
an improvement of their situation. This, too, points to a low reliability of DB
indicators to describe the actual regulatory situation of local businesses in
Rwanda.
3.6. Conclusion
The reforms undertaken by the Rwandan government addressed areas of
concern of Rwandan businesses. However, they did not fully reflect the priorities
33 Interestingly, construction permits, enforcement of contracts and procedures for closing a business,
areas not highlighted in 2008, were now identified as areas of concern

set by respondents of the RTR and they did not always prove to be effective on
the ground even in areas that were of major concern to local businesses.
Generally, the reforms seem to be geared toward covering areas that are listed in
the DB indicator sets. Other criteria for an effective and efficient regulatory
environment, like those mentioned by respondents of the RTR in 2008, seem to
have been of lower priority to the government.
In can therefore be concluded, that the (perception based) method underlying the
RTR more clearly spells out the problems businesses have with existing
regulation than the (fact based) method of DB does. This is particularly true when
a cost based assessment of the regulator environment is considered. Whether
and how a regulatory analysis that spells out the cost of mis-regulation affects
government decision making is not subject of this analysis. Therefore a
generalization of this result should not be made.
DB seems to overstate the actual improvement in the regulation of local
businesses. This result is confined to the situation in Rwanda. Therefore, a cross
country analysis of DB results may produce a braoder based conclusion
regarding the suitability of DB for measuring a country‟s business environment.
4. Summary Conclusion
1. Existing research shows that the link between business environment and
economic growth is not yet fully clear.
2. The methods of business environment assessment differ. The most
prominent method is fact based and applied by the World Bank‟s Doing
business project. An alternative is the evidence/perception based approach
used in Rwanda in the broader context of a development cooperation
project.
3. For Rwanda, perception based (SBP) and fact based (DB) approaches do
not yield the same results regarding the demand for regulatory reform.
4. The supply of reforms appears to be geared to the reform deficiencies as
defined by DB. However, when regulatory cost is considered, the
perception based approach also seems to be in line with the reform
activities of the Rwandan government.
5. The effectiveness of reforms undertaken in Rwanda varies. Based on
interviews in late 2010, of the eight areas defined by the DB indicators,
reforms on average were rather not effective in five areas, rather effective
in two areas, and neutral in one. This rather neutral perception of the
Rwandan business environment quality after two years of intensive reforms
contrasts with the strong improvement of Rwanda in the DB international
country rankings (from rank 150 in the DB 2008 report to rank 58 in the DB

2011 report). Due to the small sample size of the 2010 survey, the results
of this survey have to be interpreted with great care, though.
There is need for further research on the subject of assessment and effectiveness
of regulatory reform. Problems arising from rankings (the density per quantile
determines changes in rankings), effects of perception based vis-à-vis fact based
assessment methods on a broader base, and the political economy framework of
a country as determinant of reform orientation deserve more empirical research.
Last not least, the effect of business environment on growth is not yet established
and requires further attention. This issue, when discussed together with political
economy criteria, may yield interesting results regarding what “good governance”
constitutes in general and the mechanics of regulatory reform in particular.
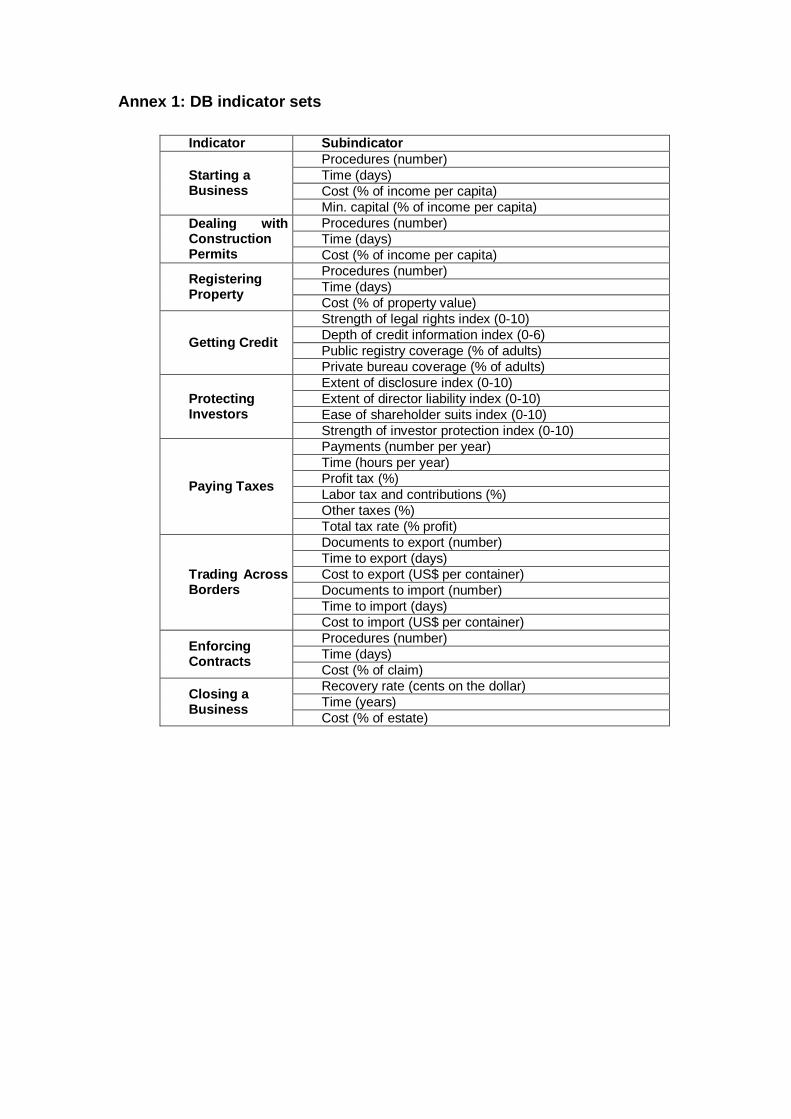
Annex 1: DB indicator sets
Indicator Subindicator
Starting a Business
Procedures (number)
Time (days)
Cost (% of income per capita)
Min. capital (% of income per capita)
Dealing with Construction Permits
Procedures (number)
Time (days)
Cost (% of income per capita)
Registering Property
Procedures (number)
Time (days)
Cost (% of property value)
Getting Credit
Strength of legal rights index (0-10)
Depth of credit information index (0-6)
Public registry coverage (% of adults)
Private bureau coverage (% of adults)
Protecting Investors
Extent of disclosure index (0-10)
Extent of director liability index (0-10)
Ease of shareholder suits index (0-10)
Strength of investor protection index (0-10)
Paying Taxes
Payments (number per year)
Time (hours per year)
Profit tax (%)
Labor tax and contributions (%)
Other taxes (%)
Total tax rate (% profit)
Trading Across Borders
Documents to export (number)
Time to export (days)
Cost to export (US$ per container)
Documents to import (number)
Time to import (days)
Cost to import (US$ per container)
Enforcing Contracts
Procedures (number)
Time (days)
Cost (% of claim)
Closing a Business
Recovery rate (cents on the dollar)
Time (years)
Cost (% of estate)

Annex 2: Reforms undertaken 2008 - 2010
Indicator 2008/2009 2009/2010
Starting a Business
Company registration streamlined from 9 procedures in 14 days (World Bank standardestimate) to 2 procedures in 24 hours, all to be done at the One Stop Centre.
Online business registration is now operational. This means that a company may be incorporated remotely or abroad without necessarily coming to RDB. For details, visit www.rdb.rw
Company registration costs reduced from the Rwf 12, 000 - Frw100, 000 ranges to flat fee of Rwf 25,000 irrespective of type and number of activities.
Payment of registration fees may be done in cash or with a Bank of Kigali point of sale (POS) that accepts international cards.
Dealing with Construction Permits
The launch of Kigali MVK client charter outlining the procedures of acquiring construction permits: the issuing agencies and the time limits within which a business/individual should have all the construction paper work done. In addition an Electrogaz delegate was placed at the one stop centre to facilitate connections to utilities for investors
A Prime Ministerial order legalizing/enforcing time limits for the delivery of construction permits according to the client charter and instituting sanctions for failure to deliver has been gazette and is being enforced. An appeal mechanism for applicants has also been established. Average time has reduced from 210 days to less than 30 days to obtain a construction permit.
A one stop construction permit centre has been established and housed in the Nyarugenge district offices to ease construction and ensure the time prescribed by the client charter is respected. The results already speak for themselves. For details please visit: www.kigalicityconstructionosc.gov.rw
Procedures have been reduced with a merger of all inspections done into one procedure (inspections of land, electricity and water). A public notice has been issued by the Mayor of Kigali city and published in the official gazette.
Registering Property
Improvements in the process of property registration with the introduction of a checklist list of all documentary requirements by RRA together with land registry when carrying out property transfers.
The National Land Centre has abolished the requirement to formulate a sale contract cutting back on time to formalize title deeds.
Reduction in time to verify property ownership to less than 10 days instead of 60
Streamlining of file checking with introduction of checklists
Getting Credit
The Secured Transaction law will make it easier for businesses to obtain credit by allowing them to use almost any type of movable asset as collateral in loan transactions
Improvements to the public credit registry have been implemented widening the data to cover 2 years of credit information and incorporate information on utilities.
A private bureau has gone online by CRB Africa widening its scope to cover banking, insurance, and utilities‟ (electricity, water and

telecommunications) operations.
Protecting Investors
The new Insolvency Law will for the first time establish a legal regime for bankruptcy and creditor protection in the country
Paying Taxes
Simplification of paying taxes: indicator with the spreading out of tax payment points to one more additional bank and launching the online facility for applying for the tax clearance certificate
RRA has established online tax calculators for PAYE, VAT and profit taxes to help especially SMEs to compute their taxes thus reducing the time to file a tax declaration.
Quarterly filing of VAT and PAYE has been enabled facilitating SMEs with an annual turnover of RWF 0-200 million. The VAT law amendment has been passed and gazetted. This covers more than 90% of all tax payers in the country.
An online tax registration system that enables tax payers to register rather than physically going to RRA offices has been established.
RRA has decentralized tax services to get closer to tax payers.
Trading Across Borders
24 hour border operations have commenced at Gatuna (Uganda-Rwanda) border and La Corniche (Rwanda DRC).
Trade documents have been streamlined with the removal of the cargo release order and replacing it with a stamp.
Customs procedures have been harmonized with the EAC region while non-tariff barriers such as issuance of simplified certificates of origin and allowing final clearance of goods at the border posts have been addressed.
A semi-automated single window at Customs has been put in place (already done at SDV) and to be implemented at Gikondo, Airport, Gatsata and Kabuye oil depots this year. A fully automated system including outer stations and all border posts is slated for May 2011.
Asycuda ++ (Automated system for Customs Data) has been installed and is operational now to all main borders of the country and was extended to NEMBA boarder and the Post office
Enforcing Contracts
Closing a Business
Commercial courts have registered a number of insolvency cases (6 decided and 9 in the pipeline) indicating that the practice is growing in Rwanda.
Source: (Ministry of Trade and Industry, 2009,25); (Ministry of Trade and Industry,
2010, 20)

Annex 3: DB assumptions for the standardized business case
The business…
Is a limited liability company. If there is more than one type of limited liability company in
the economy, the limited liability form most popular among domestic firms is chosen.
Information on the most popular form is obtained from incorporation lawyers or the
statistical office.
Operates in the economy‟s largest business city. It is 100% domestically owned and has 5
owners, none of whom is a legal entity.
Has start-up capital of 10 times income per capita at the end of 2009, paid in cash.
Performs general industrial or commercial activities, such as the production or sale to the
public of products or services. The business does not perform foreign trade activities and
does not handle products subject to a special tax regime, for example, liquor or tobacco. It
is not using heavily polluting production processes.
Leases the commercial plant and offices and is not a proprietor of real estate.
Does not qualify for investment incentives or any special benefits.
Has at least 10 and up to 50 employees 1 month after the commencement of operations,
all of them nationals.
Has a turnover of at least 100 times income per capita.
Has a company deed 10 pages long.
Source: (World Bank,2010,113-114)

Bibliography
Alesina, Alberto, Silvia Ardagna, Giuseppe Nicoletti, and Fabio Schiantarelli (2005): Regulation and Investment Journal of the European Economic Association June 2005 3(4):791–825
Bougignon, F. and P. Blescovic (2006): Growth and Integration. Annual World Bank Conference on Development Economics, 2006
CFIB (2010): Prosperity Restricted by Red Tape. Canadian Federation of Independent Businesses, 2nd edition, Toronto
Ciccone, Antonio and Elias Papaioannou (2007): Red Tape and Delayed Entry, ECB Working paper 758,
Commander; Simon and Jan Svejnar (2008): Do Institutions, Ownership,
Djankov S., R. La Porta, F. Lopez-De-Silanes, and A. Shleifer (2000) “The Regulation of Entry”, NBER Working Paper 7892
Djankov, Simeon, Caralee McLiesh, Rita Ramalho (2006): Regulation and Growth, The World Bank, March 17
Dollar, David; Mary Hallward-Driemeier, and Taye Mengistae (2003): Investment Climate and Firm Performance in Developing Economies Development Research Group, World Bank November 2003
Economist (2010): The Economist, Vol. 397, No 8707
Eiffert, Benn (2007): The economic Response to Regulatory Reform 2003-2006. Paper commissioned by the Center for Global Development, Washington, University of California
Eiffert, Benn, Alan Gelb, Vijaya Ramachandran: Business Environment and Comparative Advantage in Africa: Evidence from the Investment Climate Data; in: Bougignon, F. and P. Blescovic, 2006, p.195-233)): Growth and Integration. Annual World Bank Conference on Development Economics, 2006
Exporting and Competition Explain Firm Performance? IPC Working Paper Series No 65, University of Michigan
FIAS (2009): Rat‟s Nest: How big is a rat‟s nest? The challenge of M&E for Business Operations – a comparison of survey data and the “standard cost model” to measure the burden of licenses and permits for businesses. FIAS. The Investment Climate Advisory Service,World Bank/ IFC/MIGA
Gershenson, Dmitry (2010): Rwanda's Priority: Mobilize Resources for Massive Investment, IMF Survey, 21 December 2010

IEG (2008): Doing Business:An Independent Evaluation. Taking the Measure of the World Bank-IFC Doing Business Indicators, Independent Evaluation Group, The World Bank Group, Washington
ICAS (2010): Here is your money. Using the standard cost model to measure regulatory compliance costs in developing countries. ICAS Investment Climate Advisory Service, The World Bank Group, Washington
La Porta, Rafael, Florencio Lopez-de-Silanes, and Andrei Shleifer (2008): Economic Consequences of Legal Origins, Journal of Economic Literature 2008, 46:2, 285–332
Ministry of Trade and Industry (2009): Private Sector Cluster, Joint Sector Review Report, January – June 2009, Kigali, October 2009
Ministry of Trade and Industry (2010): Private Sector Development 2009/ 2010 Joint Sector Review Report, September 2010
Riedel, Henrik (2009): International Methods for measuring regulatory cost v1.1, Bertelsmann Stiftung, Gütersloh
SBP (2008): Cutting the Cost of Red Tape, Main Report, SBP Johannesburg
Streeck, Wolfgang and Kathleen Thelen (2005): Beyond Continuity. Institutional change in advanced political economies. OUP, Oxford
UNCTAD (20101): World Investment Report, Geneva 2010
UNCTAD (20102): Country Fact Sheet Rwanda, World Investment Report, Geneva 2010
World Bank (2005): Country Policy and Institutional Assessments. 2005 Assessment Questionnaire, Washington
World Bank (2009): Doing Business Annual Report, Washington 2009
World Bank (2010): Doing Business Annual Report, Washington 2010
World Bank (2011): Doing Business Annual Report, Washington 2010