Embed Size (px)
Citation preview
Colgate-Palmolive: Precision Toothbrush
Assessment
By: Jordan Michael Smith
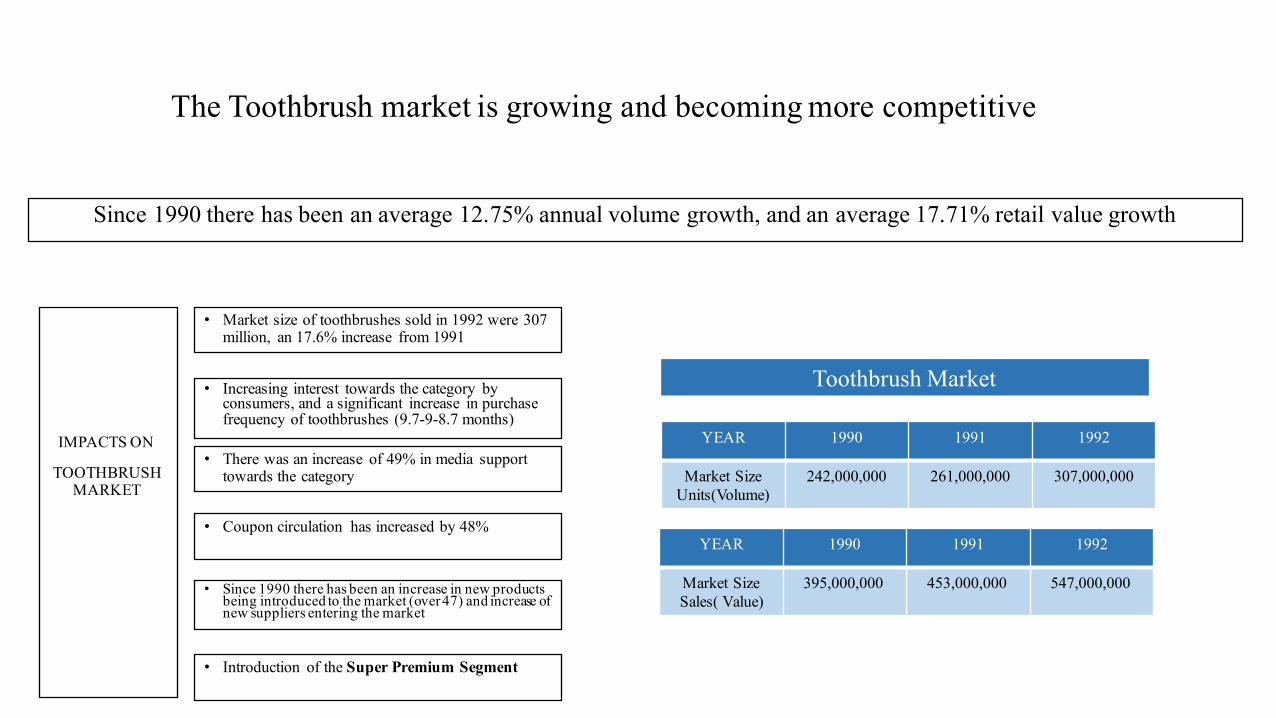
• Increasing interest towards the category by consumers, and a significant increase in purchase frequency of toothbrushes (9.7-9-8.7 months)
Since 1990 there has been an average 12.75% annual volume growth, and an average 17.71% retail value growth
YEAR 1990 1991 1992
Market Size Units(Volume)
242,000,000 261,000,000 307,000,000
YEAR 1990 1991 1992
Market Size Sales( Value)
395,000,000 453,000,000 547,000,000
Toothbrush Market
The Toothbrush market is growing and becoming more competitive
• Market size of toothbrushes sold in 1992 were 307 million, an 17.6% increase from 1991
• There was an increase of 49% in media support towards the category
• Coupon circulation has increased by 48%
• Since 1990 there has been an increase in new products being introduced to the market (over 47) and increase of new suppliers entering the market
• Introduction of the Super Premium Segment
IMPACTS ON
TOOTHBRUSH MARKET
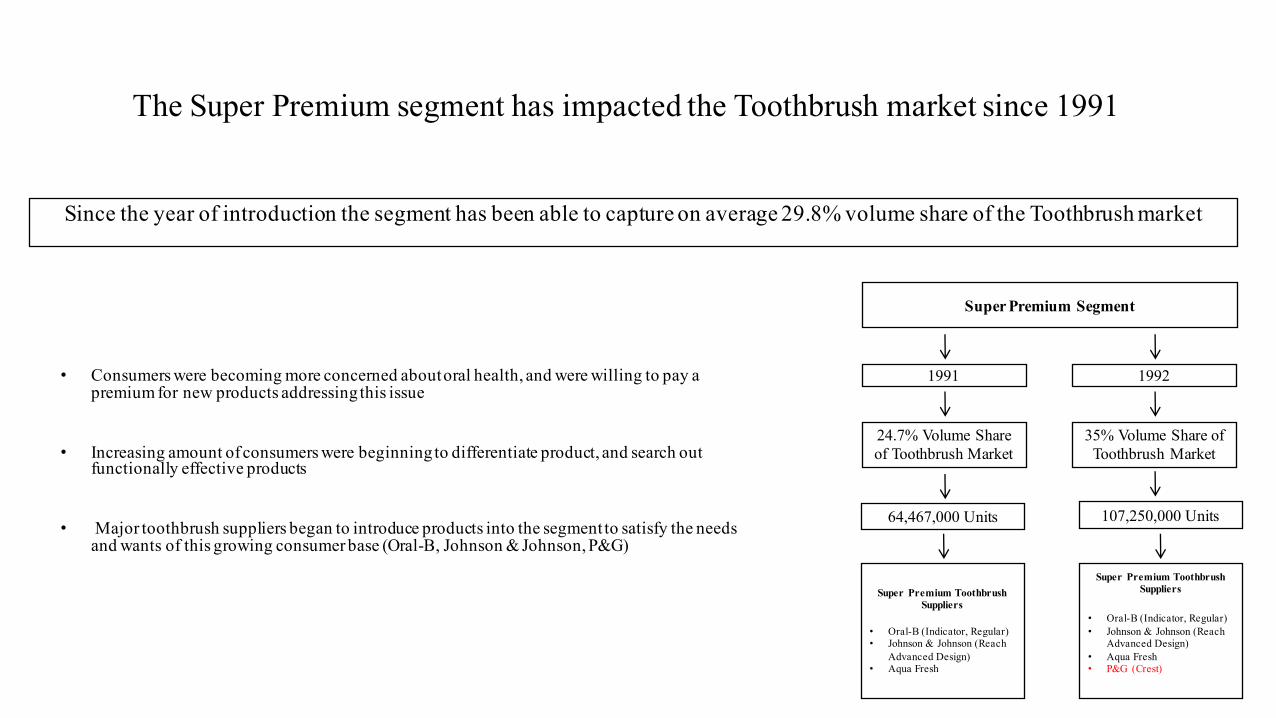
The Super Premium segment has impacted the Toothbrush market since 1991
Since the year of introduction the segment has been able to capture on average 29.8% volume share of the Toothbrush market
• Consumers were becoming more concerned about oral health, and were willing to pay a premium for new products addressing this issue
• Increasing amount of consumers were beginning to differentiate product, and search out functionally effective products
• Major toothbrush suppliers began to introduce products into the segment to satisfy the needs and wants of this growing consumer base (Oral-B, Johnson & Johnson, P&G)
Super Premium Segment
24.7% Volume Share of Toothbrush Market
35% Volume Share of Toothbrush Market
1991 1992
64,467,000 Units 107,250,000 Units
Super Premium Toothbrush Suppliers
• Oral-B (Indicator, Regular)• Johnson & Johnson (Reach
Advanced Design)• Aqua Fresh
Super Premium Toothbrush Suppliers
• Oral-B (Indicator, Regular)• Johnson & Johnson (Reach
Advanced Design)• Aqua Fresh• P&G (Crest)
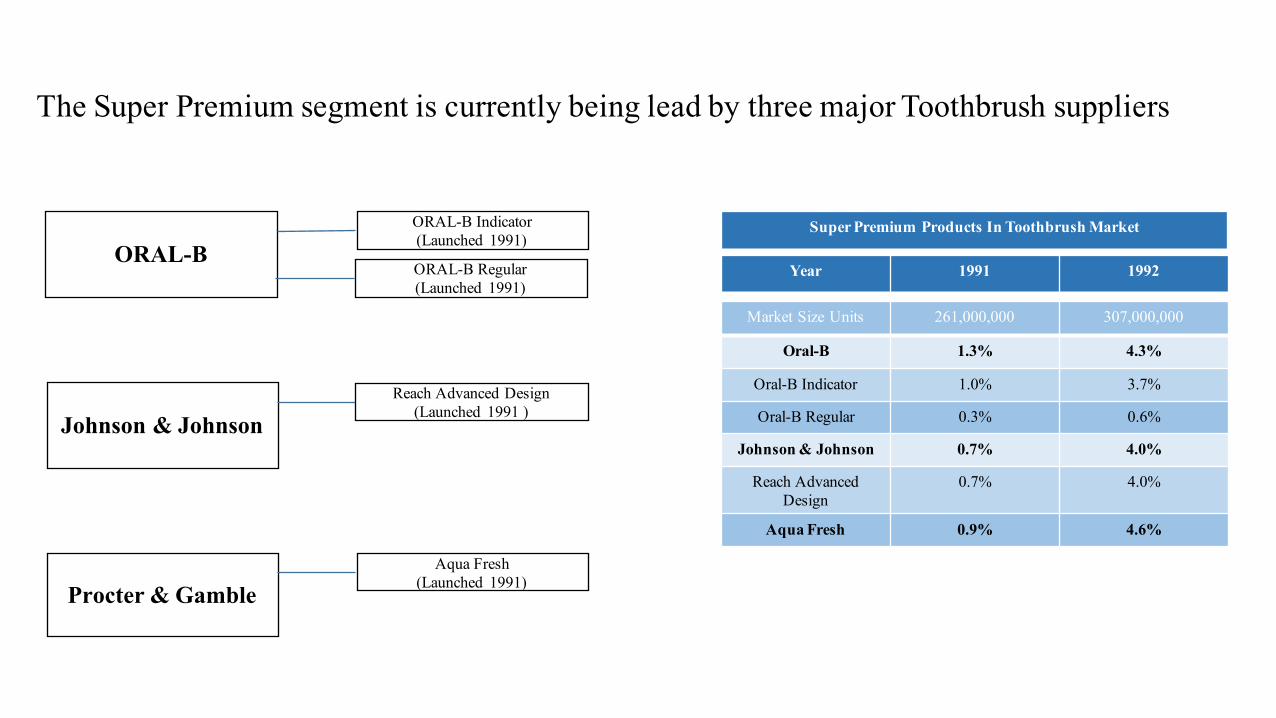
The Super Premium segment is currently being lead by three major Toothbrush suppliers
ORAL-BORAL-B Indicator(Launched 1991)
ORAL-B Regular(Launched 1991)
Johnson & JohnsonReach Advanced Design
(Launched 1991 )
Procter & GambleAqua Fresh
(Launched 1991)
Market Size Units 261,000,000 307,000,000
Oral-B 1.3% 4.3%
Oral-B Indicator 1.0% 3.7%
Oral-B Regular 0.3% 0.6%
Johnson & Johnson 0.7% 4.0%
Reach Advanced Design
0.7% 4.0%
Aqua Fresh 0.9% 4.6%
Year 1991 1992
Super Premium Products In Toothbrush Market
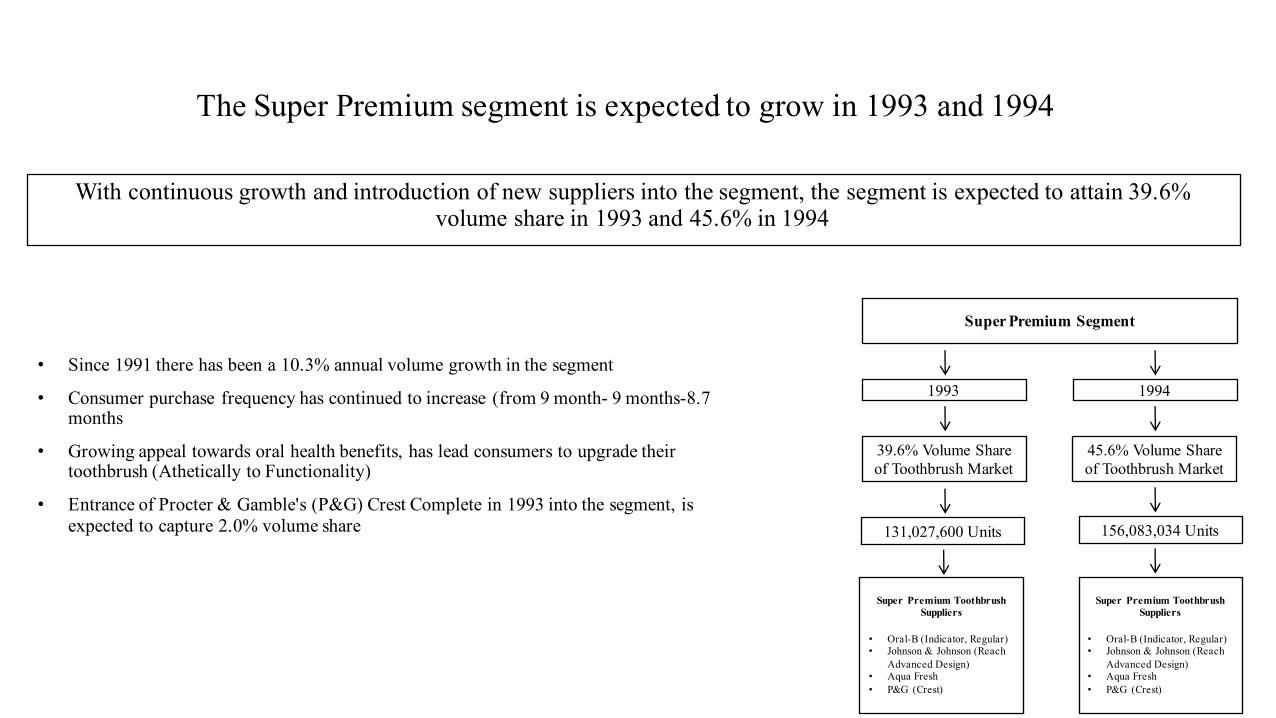
The Super Premium segment is expected to grow in 1993 and 1994
With continuous growth and introduction of new suppliers into the segment, the segment is expected to attain 39.6% volume share in 1993 and 45.6% in 1994
• Since 1991 there has been a 10.3% annual volume growth in the segment
• Consumer purchase frequency has continued to increase (from 9 month- 9 months-8.7 months
• Growing appeal towards oral health benefits, has lead consumers to upgrade their toothbrush (Athetically to Functionality)
• Entrance of Procter & Gamble's (P&G) Crest Complete in 1993 into the segment, is expected to capture 2.0% volume share
Super Premium Segment
39.6% Volume Share of Toothbrush Market
45.6% Volume Share of Toothbrush Market
1993 1994
131,027,600 Units 156,083,034 Units
Super Premium Toothbrush Suppliers
• Oral-B (Indicator, Regular)• Johnson & Johnson (Reach
Advanced Design)• Aqua Fresh• P&G (Crest)
Super Premium Toothbrush Suppliers
• Oral-B (Indicator, Regular)• Johnson & Johnson (Reach
Advanced Design)• Aqua Fresh• P&G (Crest)
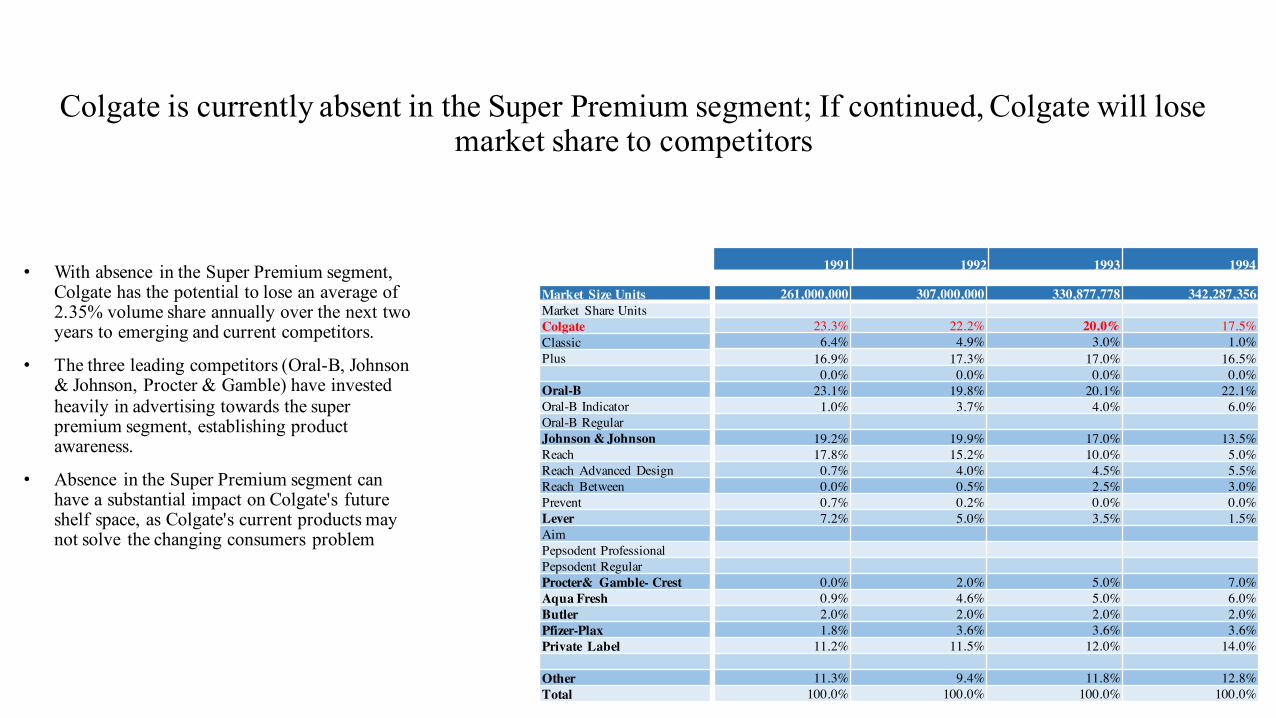
Colgate is currently absent in the Super Premium segment; If continued, Colgate will lose market share to competitors
Market Size UnitsMarket Share UnitsColgateClassicPlus
Oral-BOral-B IndicatorOral-B RegularJohnson & JohnsonReachReach Advanced DesignReach BetweenPreventLeverAimPepsodent ProfessionalPepsodent RegularProcter& Gamble- CrestAqua FreshButlerPfizer-PlaxPrivate Label
OtherTotal
261,000,000 307,000,000 330,877,778 342,287,356
23.3% 22.2% 20.0% 17.5%6.4% 4.9% 3.0% 1.0%
16.9% 17.3% 17.0% 16.5%0.0% 0.0% 0.0% 0.0%
23.1% 19.8% 20.1% 22.1%1.0% 3.7% 4.0% 6.0%
19.2% 19.9% 17.0% 13.5%17.8% 15.2% 10.0% 5.0%0.7% 4.0% 4.5% 5.5%0.0% 0.5% 2.5% 3.0%0.7% 0.2% 0.0% 0.0%7.2% 5.0% 3.5% 1.5%
0.0% 2.0% 5.0% 7.0%0.9% 4.6% 5.0% 6.0%2.0% 2.0% 2.0% 2.0%1.8% 3.6% 3.6% 3.6%
11.2% 11.5% 12.0% 14.0%
11.3% 9.4% 11.8% 12.8%100.0% 100.0% 100.0% 100.0%
1991 1992 1993 1994• With absence in the Super Premium segment, Colgate has the potential to lose an average of 2.35% volume share annually over the next two years to emerging and current competitors.
• The three leading competitors (Oral-B, Johnson & Johnson, Procter & Gamble) have invested heavily in advertising towards the super premium segment, establishing product awareness.
• Absence in the Super Premium segment can have a substantial impact on Colgate's future shelf space, as Colgate's current products may not solve the changing consumers problem
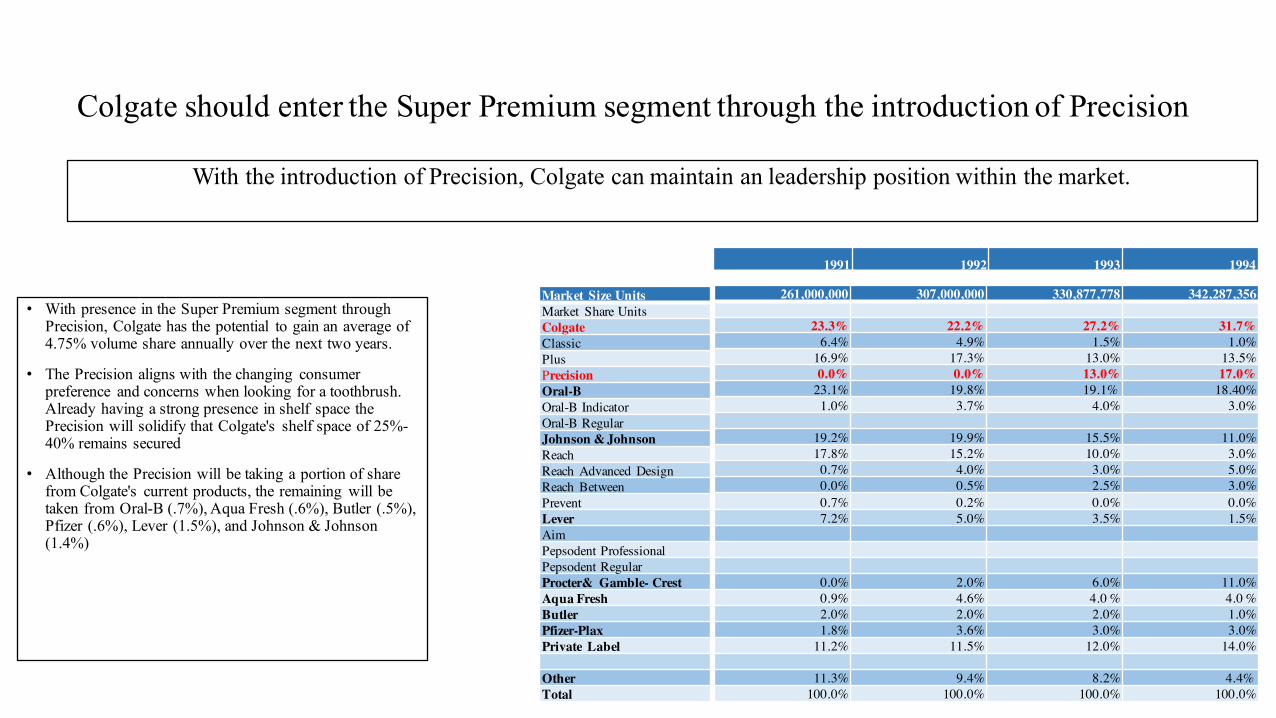
Colgate should enter the Super Premium segment through the introduction of Precision
Market Size UnitsMarket Share UnitsColgateClassicPlusPrecisionOral-BOral-B IndicatorOral-B RegularJohnson & JohnsonReachReach Advanced DesignReach BetweenPreventLeverAimPepsodent ProfessionalPepsodent RegularProcter& Gamble- CrestAqua FreshButlerPfizer-PlaxPrivate Label
OtherTotal
261,000,000 307,000,000 330,877,778 342,287,356
23.3% 22.2% 27.2% 31.7%6.4% 4.9% 1.5% 1.0%
16.9% 17.3% 13.0% 13.5%0.0% 0.0% 13.0% 17.0%
23.1% 19.8% 19.1% 18.40%1.0% 3.7% 4.0% 3.0%
19.2% 19.9% 15.5% 11.0%17.8% 15.2% 10.0% 3.0%0.7% 4.0% 3.0% 5.0%0.0% 0.5% 2.5% 3.0%0.7% 0.2% 0.0% 0.0%7.2% 5.0% 3.5% 1.5%
0.0% 2.0% 6.0% 11.0%0.9% 4.6% 4.0 % 4.0 %2.0% 2.0% 2.0% 1.0%1.8% 3.6% 3.0% 3.0%
11.2% 11.5% 12.0% 14.0%
11.3% 9.4% 8.2% 4.4%100.0% 100.0% 100.0% 100.0%
1991 1992 1993 1994
With the introduction of Precision, Colgate can maintain an leadership position within the market.
• With presence in the Super Premium segment through Precision, Colgate has the potential to gain an average of 4.75% volume share annually over the next two years.
• The Precision aligns with the changing consumer preference and concerns when looking for a toothbrush. Already having a strong presence in shelf space the Precision will solidify that Colgate's shelf space of 25%-40% remains secured
• Although the Precision will be taking a portion of share from Colgate's current products, the remaining will be taken from Oral-B (.7%), Aqua Fresh (.6%), Butler (.5%), Pfizer (.6%), Lever (1.5%), and Johnson & Johnson (1.4%)
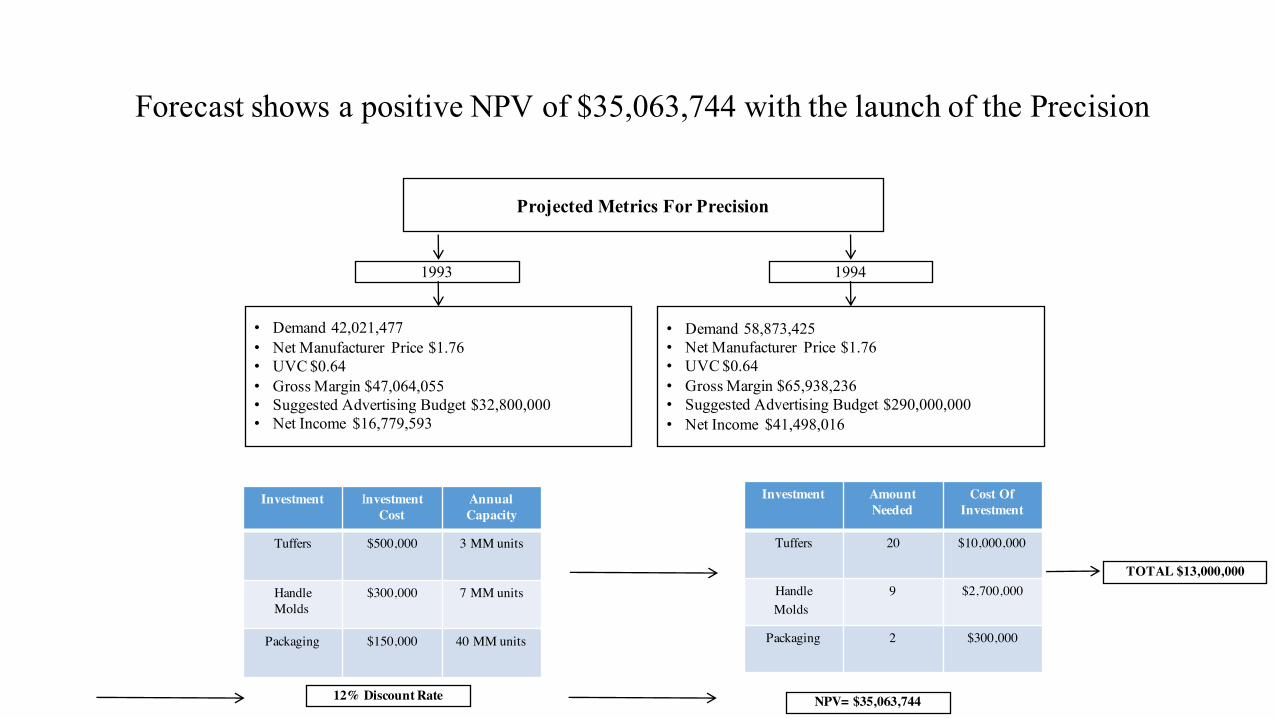
Forecast shows a positive NPV of $35,063,744 with the launch of the Precision
Projected Metrics For Precision
1993 1994
• Demand 42,021,477• Net Manufacturer Price $1.76• UVC $0.64• Gross Margin $47,064,055• Suggested Advertising Budget $32,800,000• Net Income $16,779,593
• Demand 58,873,425• Net Manufacturer Price $1.76• UVC $0.64• Gross Margin $65,938,236• Suggested Advertising Budget $290,000,000• Net Income $41,498,016
Investment Investment Cost
Annual Capacity
Tuffers $500,000 3 MM units
HandleMolds
$300,000 7 MM units
Packaging $150,000 40 MM units
Investment Amount Needed
Cost Of Investment
Tuffers 20 $10,000,000
HandleMolds
9 $2,700,000
Packaging 2 $300,000
12% Discount Rate NPV= $35,063,744
TOTAL $13,000,000
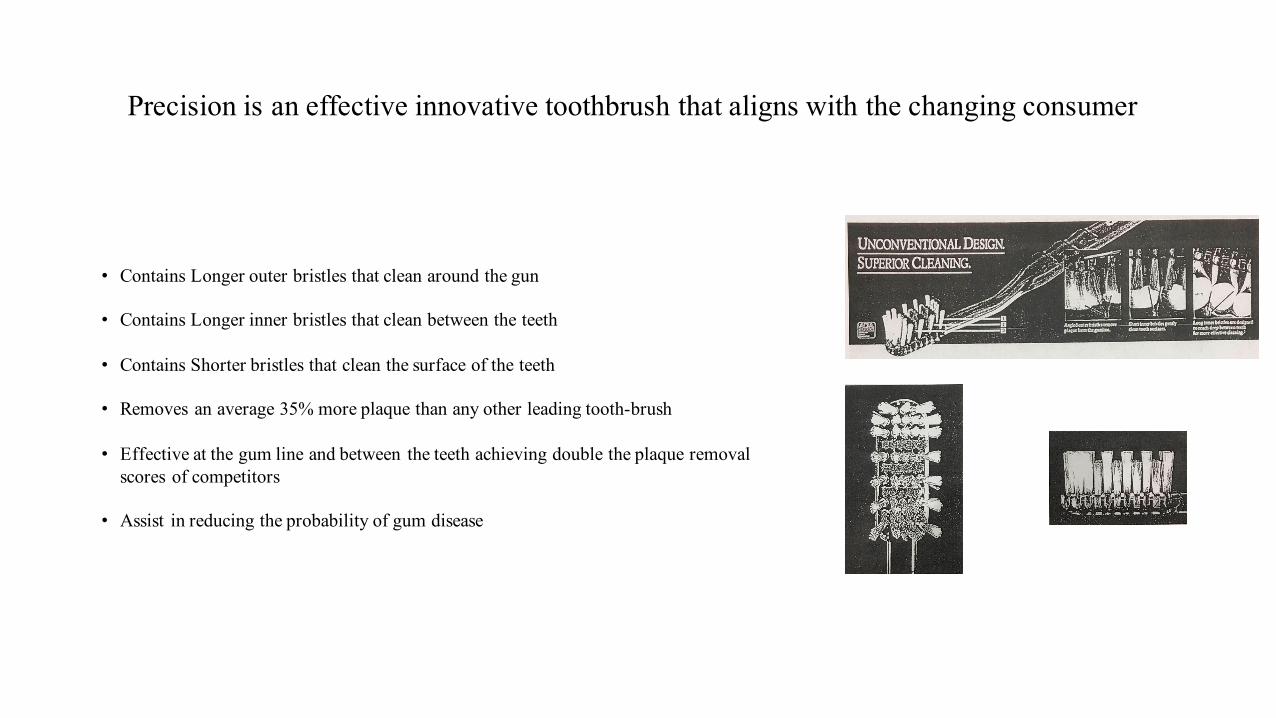
Precision is an effective innovative toothbrush that aligns with the changing consumer
• Contains Longer outer bristles that clean around the gun
• Contains Longer inner bristles that clean between the teeth
• Contains Shorter bristles that clean the surface of the teeth
• Removes an average 35% more plaque than any other leading tooth-brush
• Effective at the gum line and between the teeth achieving double the plaque removal scores of competitors
• Assist in reducing the probability of gum disease
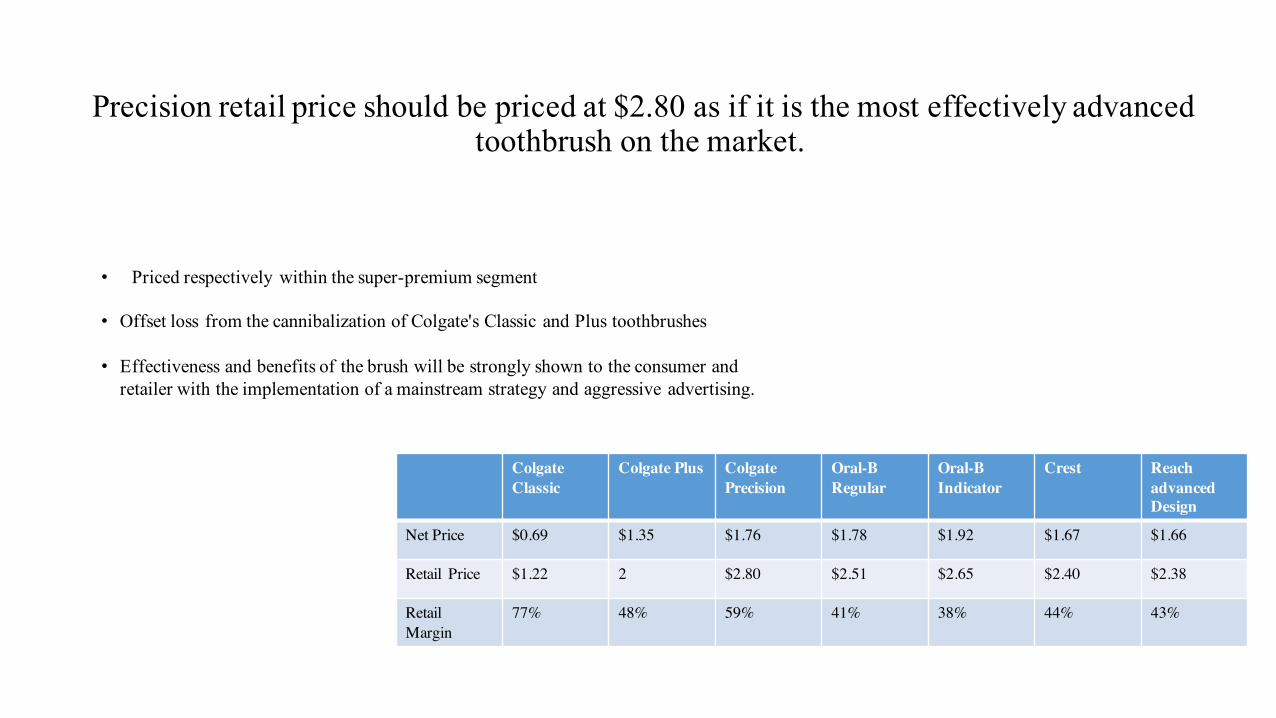
Precision retail price should be priced at $2.80 as if it is the most effectively advanced toothbrush on the market.
• Priced respectively within the super-premium segment
• Offset loss from the cannibalization of Colgate's Classic and Plus toothbrushes
• Effectiveness and benefits of the brush will be strongly shown to the consumer and retailer with the implementation of a mainstream strategy and aggressive advertising.
Colgate Classic
Colgate Plus Colgate Precision
Oral-B Regular
Oral-B Indicator
Crest Reach advanced Design
Net Price $0.69 $1.35 $1.76 $1.78 $1.92 $1.67 $1.66
Retail Price $1.22 2 $2.80 $2.51 $2.65 $2.40 $2.38
Retail Margin
77% 48% 59% 41% 38% 44% 43%
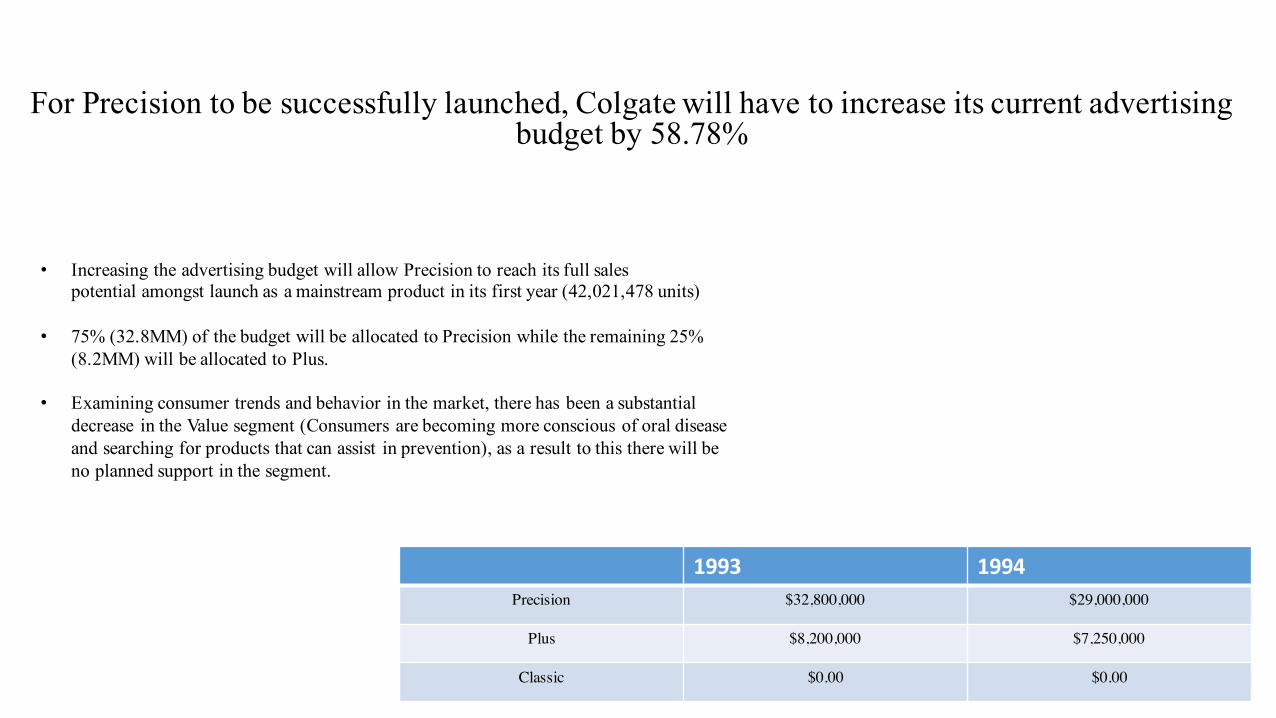
For Precision to be successfully launched, Colgate will have to increase its current advertising budget by 58.78%
1993 1994Precision $32,800,000 $29,000,000
Plus $8,200,000 $7,250,000
Classic $0.00 $0.00
• Increasing the advertising budget will allow Precision to reach its full sales potential amongst launch as a mainstream product in its first year (42,021,478 units)
• 75% (32.8MM) of the budget will be allocated to Precision while the remaining 25% (8.2MM) will be allocated to Plus.
• Examining consumer trends and behavior in the market, there has been a substantial decrease in the Value segment (Consumers are becoming more conscious of oral disease and searching for products that can assist in prevention), as a result to this there will be no planned support in the segment.
Appendix 1- Base
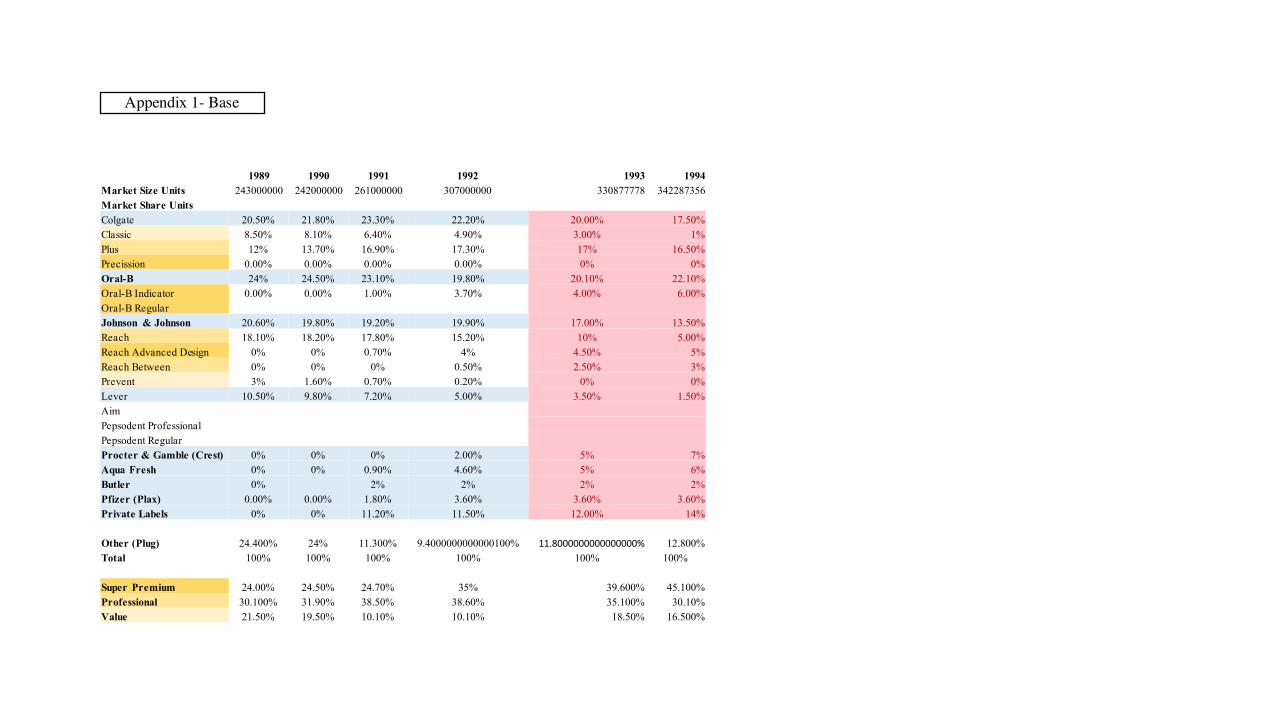
1989 1990 1991 1992 1993 1994Market Size Units 243000000 242000000 261000000 307000000 330877778 342287356Market Share UnitsColgate 20.50% 21.80% 23.30% 22.20% 20.00% 17.50%Classic 8.50% 8.10% 6.40% 4.90% 3.00% 1%Plus 12% 13.70% 16.90% 17.30% 17% 16.50%Precission 0.00% 0.00% 0.00% 0.00% 0% 0%Oral-B 24% 24.50% 23.10% 19.80% 20.10% 22.10%Oral-B Indicator 0.00% 0.00% 1.00% 3.70% 4.00% 6.00%Oral-B RegularJohnson & Johnson 20.60% 19.80% 19.20% 19.90% 17.00% 13.50%Reach 18.10% 18.20% 17.80% 15.20% 10% 5.00%Reach Advanced Design 0% 0% 0.70% 4% 4.50% 5%Reach Between 0% 0% 0% 0.50% 2.50% 3%Prevent 3% 1.60% 0.70% 0.20% 0% 0%Lever 10.50% 9.80% 7.20% 5.00% 3.50% 1.50%AimPepsodent ProfessionalPepsodent RegularProcter & Gamble (Crest) 0% 0% 0% 2.00% 5% 7%Aqua Fresh 0% 0% 0.90% 4.60% 5% 6%Butler 0% 2% 2% 2% 2%Pfizer (Plax) 0.00% 0.00% 1.80% 3.60% 3.60% 3.60%Private Labels 0% 0% 11.20% 11.50% 12.00% 14%
Other (Plug) 24.400% 24% 11.300% 9.4000000000000100% 11.8000000000000000% 12.800%Total 100% 100% 100% 100% 100% 100%
Super Premium 24.00% 24.50% 24.70% 35% 39.600% 45.100%Professional 30.100% 31.90% 38.50% 38.60% 35.100% 30.10%Value 21.50% 19.50% 10.10% 10.10% 18.50% 16.500%
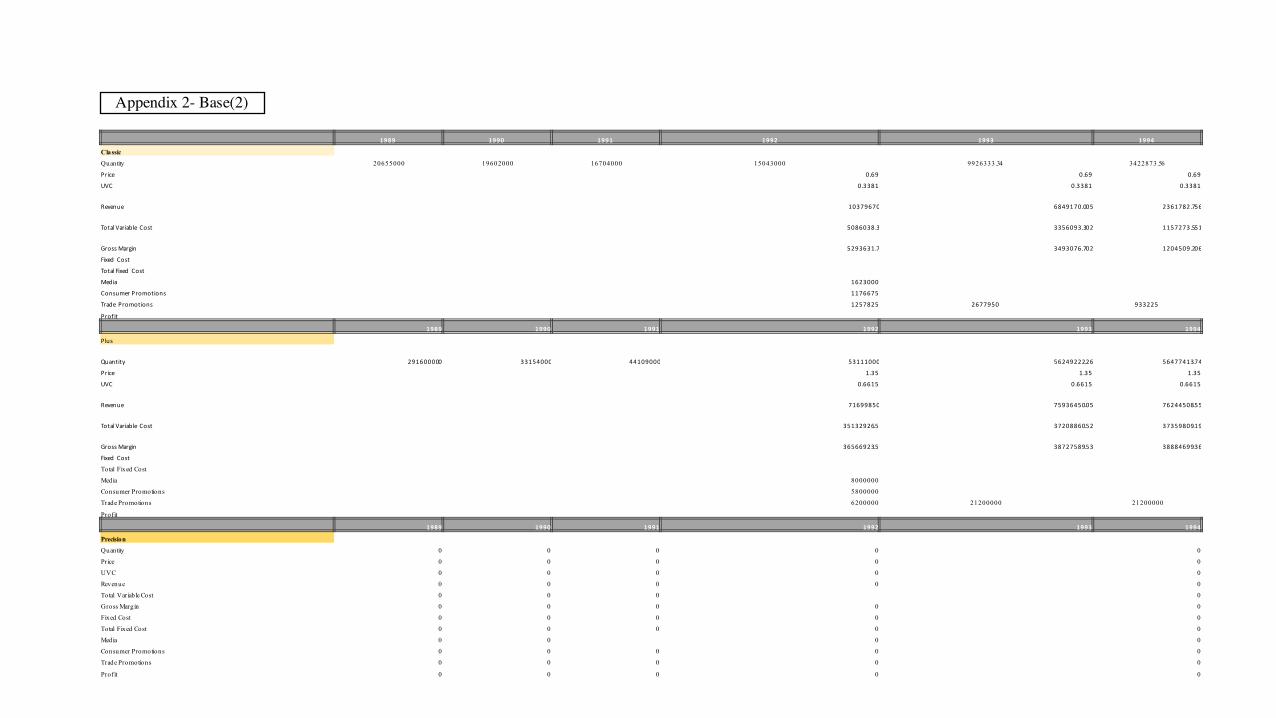
Appendix 2- Base(2)
1989 1990 1991 1992 1993 1994
Classic
Quantity 20655000 19602000 16704000 15043000 9926333.34 3422873.56
Price 0.69 0.69 0.69
UVC 0.3381 0.3381 0.3381
Revenue 10379670 6849170.005 2361782.756
TotalVariable Cost 5086038.3 3356093.302 1157273.551
GrossMargin 5293631.7 3493076.702 1204509.206
Fixed Cost
TotalFixed Cost
Media 1623000
2677950 933225
ConsumerPromotions 1176675
Trade Promotions 1257825
Prof it
1989 1990 1991 1992 1993 1994
Plus
Quantity 291600000 33154000 44109000 53111000 56249222.26 56477413.74
Price 1.35 1.35 1.35
UVC 0.6615 0.6615 0.6615
Revenue 71699850 75936450.05 76244508.55
TotalVariable Cost 35132926.5 37208860.52 37359809.19
GrossMargin 36566923.5 38727589.53 38884699.36
Fixed Cost
Total Fixed Cost
Media 8000000
21200000 21200000
Consumer Promotions 5800000
Trade Promotions 6200000
Profit
1989 1990 1991 1992 1993 1994
Precision
Quantity 0 0 0 0 0
Price 0 0 0 0 0
UVC 0 0 0 0 0
Revenue 0 0 0 0 0
Total Variable Cost 0 0 0 0
Gross Margin 0 0 0 0 0
Fixed Cost 0 0 0 0 0
Total Fixed Cost 0 0 0 0 0
Media 0 0 0 0
Consumer Promotions 0 0 0 0 0
Trade Promotions 0 0 0 0 0
Profit 0 0 0 0 0
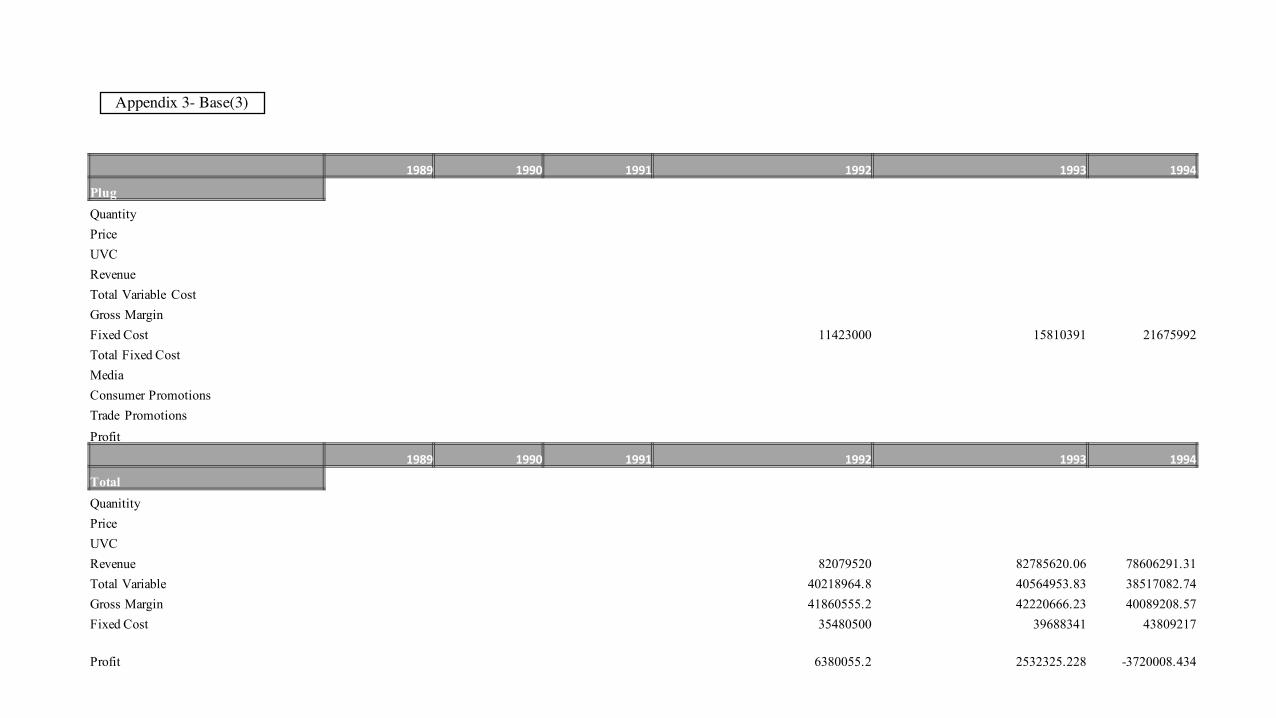
Appendix 3- Base(3)
1989 1990 1991 1992 1993 1994
PlugQuantityPriceUVCRevenueTotal Variable CostGross MarginFixed Cost 11423000 15810391 21675992Total Fixed CostMediaConsumer PromotionsTrade PromotionsProfit
1989 1990 1991 1992 1993 1994
TotalQuanitityPriceUVCRevenue 82079520 82785620.06 78606291.31Total Variable 40218964.8 40564953.83 38517082.74Gross Margin 41860555.2 42220666.23 40089208.57Fixed Cost 35480500 39688341 43809217
Profit 6380055.2 2532325.228 -3720008.434
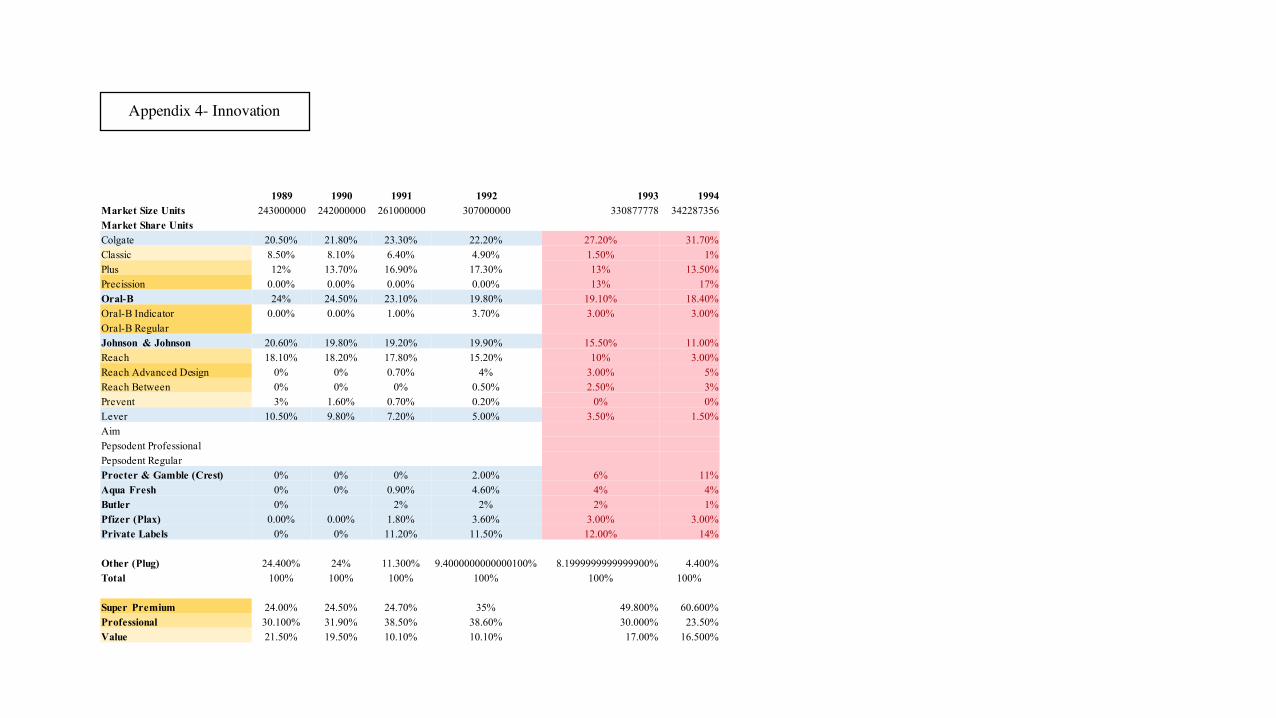
Appendix 4- Innovation
1989 1990 1991 1992 1993 1994Market Size Units 243000000 242000000 261000000 307000000 330877778 342287356Market Share UnitsColgate 20.50% 21.80% 23.30% 22.20% 27.20% 31.70%Classic 8.50% 8.10% 6.40% 4.90% 1.50% 1%Plus 12% 13.70% 16.90% 17.30% 13% 13.50%Precission 0.00% 0.00% 0.00% 0.00% 13% 17%Oral-B 24% 24.50% 23.10% 19.80% 19.10% 18.40%Oral-B Indicator 0.00% 0.00% 1.00% 3.70% 3.00% 3.00%Oral-B RegularJohnson & Johnson 20.60% 19.80% 19.20% 19.90% 15.50% 11.00%Reach 18.10% 18.20% 17.80% 15.20% 10% 3.00%Reach Advanced Design 0% 0% 0.70% 4% 3.00% 5%Reach Between 0% 0% 0% 0.50% 2.50% 3%Prevent 3% 1.60% 0.70% 0.20% 0% 0%Lever 10.50% 9.80% 7.20% 5.00% 3.50% 1.50%AimPepsodent ProfessionalPepsodent RegularProcter & Gamble (Crest) 0% 0% 0% 2.00% 6% 11%Aqua Fresh 0% 0% 0.90% 4.60% 4% 4%Butler 0% 2% 2% 2% 1%Pfizer (Plax) 0.00% 0.00% 1.80% 3.60% 3.00% 3.00%Private Labels 0% 0% 11.20% 11.50% 12.00% 14%
Other (Plug) 24.400% 24% 11.300% 9.4000000000000100% 8.1999999999999900% 4.400%Total 100% 100% 100% 100% 100% 100%
Super Premium 24.00% 24.50% 24.70% 35% 49.800% 60.600%Professional 30.100% 31.90% 38.50% 38.60% 30.000% 23.50%Value 21.50% 19.50% 10.10% 10.10% 17.00% 16.500%
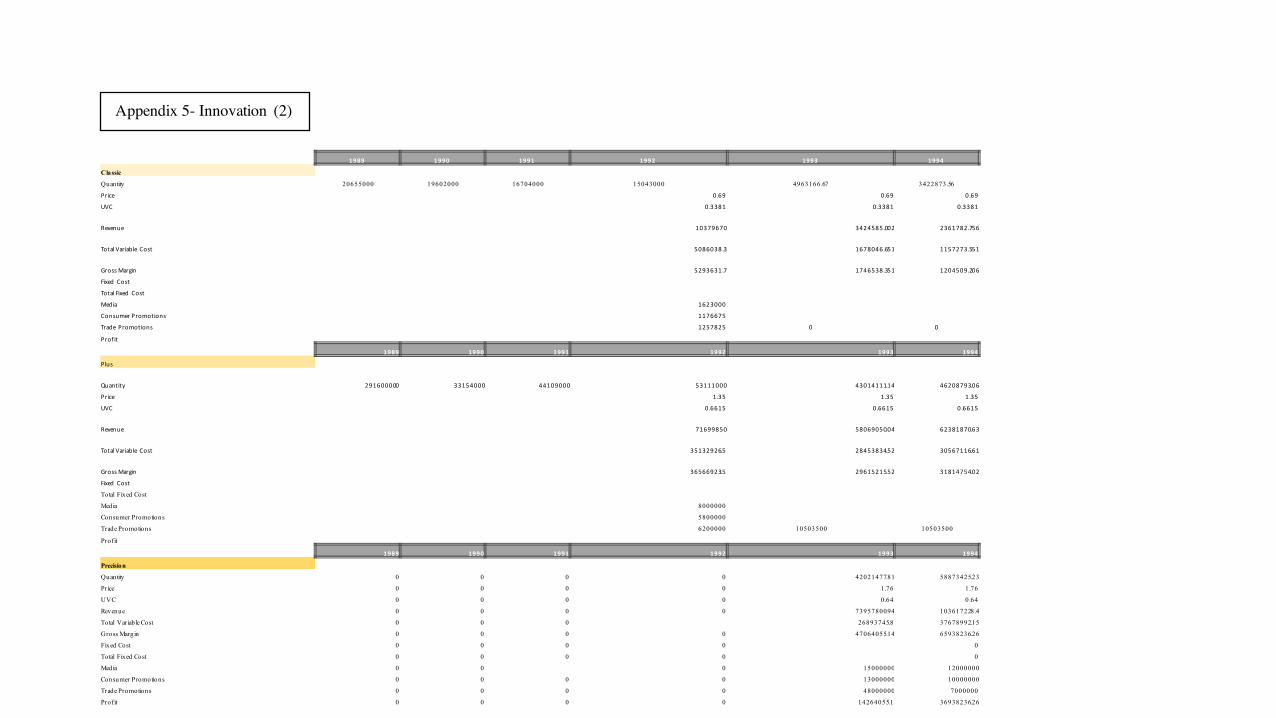
Appendix 5- Innovation (2)
1989 1990 1991 1992 1993 1994
Classic
Quantity 20655000 19602000 16704000 15043000 4963166.67 3422873.56
Price 0.69 0.69 0.69
UVC 0.3381 0.3381 0.3381
Revenue 10379670 3424585.002 2361782.756
TotalVariable Cost 5086038.3 1678046.651 1157273.551
GrossMargin 5293631.7 1746538.351 1204509.206
Fixed Cost
TotalFixed Cost
Media 1623000
0 0
ConsumerPromotions 1176675
Trade Promotions 1257825
Prof it
1989 1990 1991 1992 1993 1994
Plus
Quantity 291600000 33154000 44109000 53111000 43014111.14 46208793.06
Price 1.35 1.35 1.35
UVC 0.6615 0.6615 0.6615
Revenue 71699850 58069050.04 62381870.63
TotalVariable Cost 35132926.5 28453834.52 30567116.61
GrossMargin 36566923.5 29615215.52 31814754.02
Fixed Cost
Total Fixed Cost
Media 8000000
10503500 10503500
Consumer Promotions 5800000
Trade Promotions 6200000
Profit
1989 1990 1991 1992 1993 1994
Precision
Quantity 0 0 0 0 42021477.81 58873425.23
Price 0 0 0 0 1.76 1.76
UVC 0 0 0 0 0.64 0.64
Revenue 0 0 0 0 73957800.94 103617228.4
Total Variable Cost 0 0 0 26893745.8 37678992.15
Gross Margin 0 0 0 0 47064055.14 65938236.26
Fixed Cost 0 0 0 0 0
Total Fixed Cost 0 0 0 0 0
Media 0 0 0 15000000 12000000
Consumer Promotions 0 0 0 0 13000000 10000000
Trade Promotions 0 0 0 0 48000000 7000000
Profit 0 0 0 0 14264055.1 36938236.26
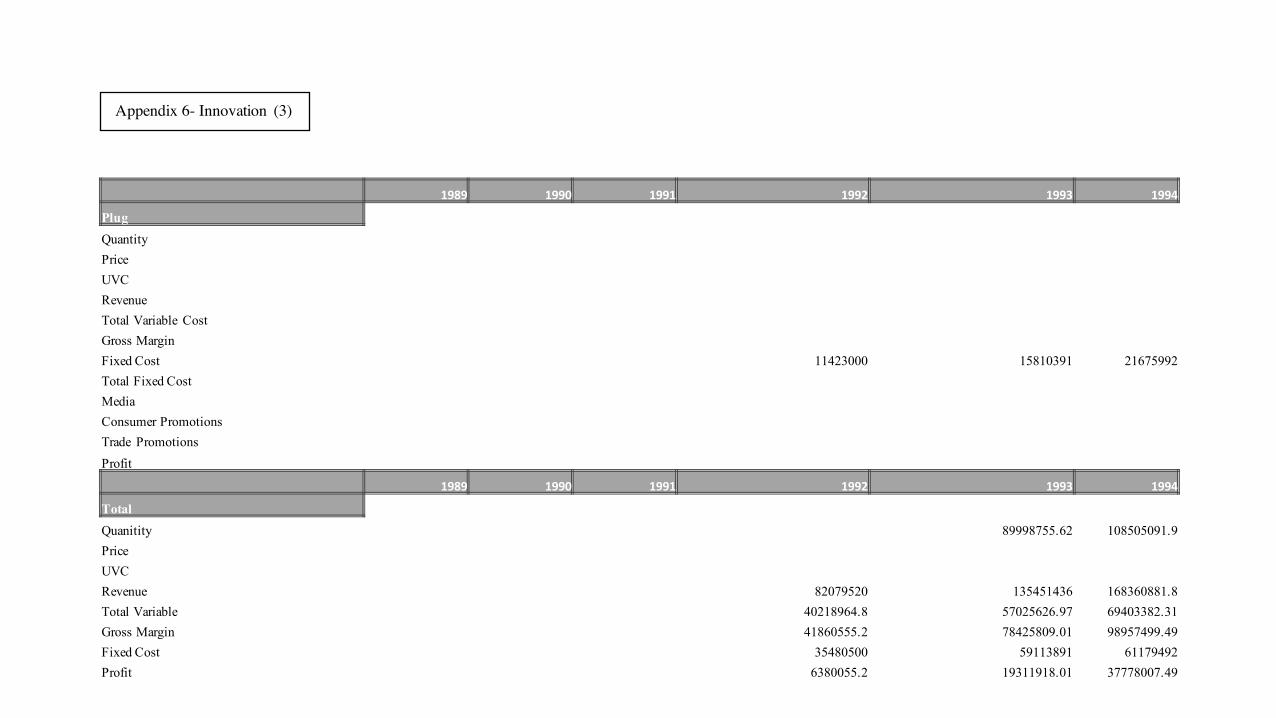
1989 1990 1991 1992 1993 1994
PlugQuantityPriceUVCRevenueTotal Variable CostGross MarginFixed Cost 11423000 15810391 21675992Total Fixed CostMediaConsumer PromotionsTrade PromotionsProfit
1989 1990 1991 1992 1993 1994
TotalQuanitity 89998755.62 108505091.9PriceUVCRevenue 82079520 135451436 168360881.8Total Variable 40218964.8 57025626.97 69403382.31Gross Margin 41860555.2 78425809.01 98957499.49Fixed Cost 35480500 59113891 61179492Profit 6380055.2 19311918.01 37778007.49
Appendix 6- Innovation (3)
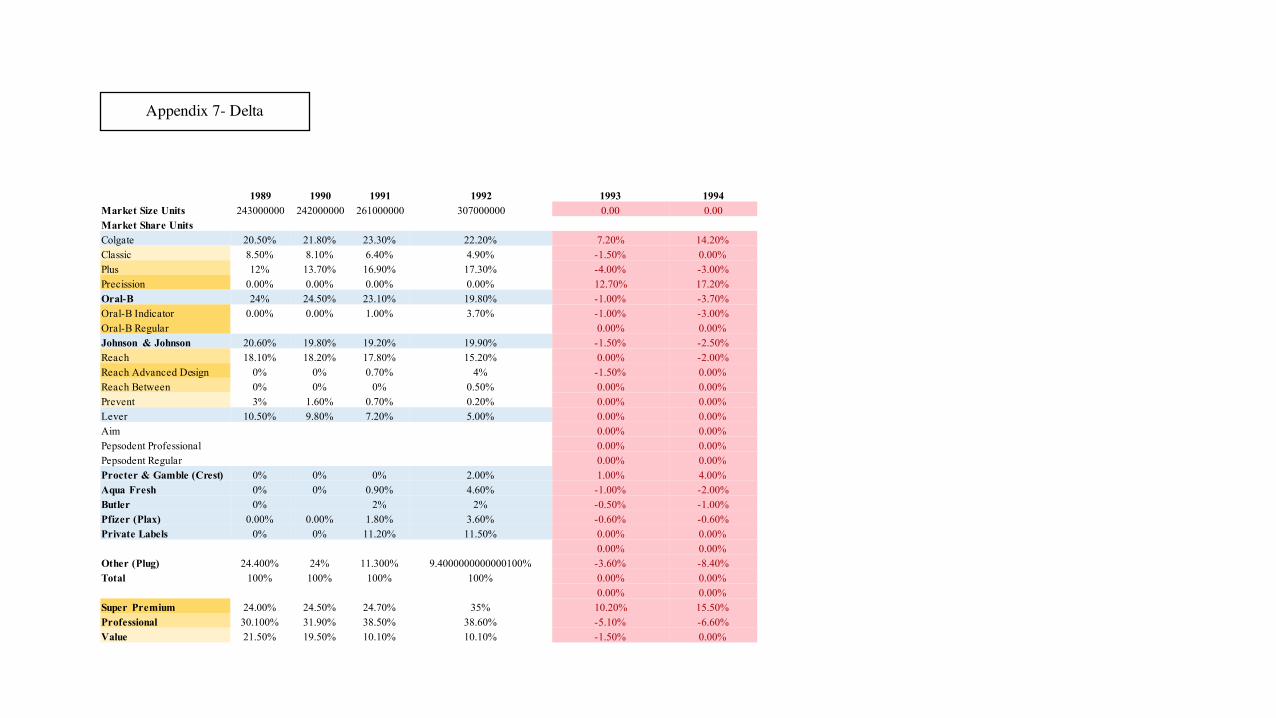
1989 1990 1991 1992 1993 1994Market Size Units 243000000 242000000 261000000 307000000 0.00 0.00Market Share UnitsColgate 20.50% 21.80% 23.30% 22.20% 7.20% 14.20%Classic 8.50% 8.10% 6.40% 4.90% -1.50% 0.00%Plus 12% 13.70% 16.90% 17.30% -4.00% -3.00%Precission 0.00% 0.00% 0.00% 0.00% 12.70% 17.20%Oral-B 24% 24.50% 23.10% 19.80% -1.00% -3.70%Oral-B Indicator 0.00% 0.00% 1.00% 3.70% -1.00% -3.00%Oral-B Regular 0.00% 0.00%Johnson & Johnson 20.60% 19.80% 19.20% 19.90% -1.50% -2.50%Reach 18.10% 18.20% 17.80% 15.20% 0.00% -2.00%Reach Advanced Design 0% 0% 0.70% 4% -1.50% 0.00%Reach Between 0% 0% 0% 0.50% 0.00% 0.00%Prevent 3% 1.60% 0.70% 0.20% 0.00% 0.00%Lever 10.50% 9.80% 7.20% 5.00% 0.00% 0.00%Aim 0.00% 0.00%Pepsodent Professional 0.00% 0.00%Pepsodent Regular 0.00% 0.00%Procter & Gamble (Crest) 0% 0% 0% 2.00% 1.00% 4.00%Aqua Fresh 0% 0% 0.90% 4.60% -1.00% -2.00%Butler 0% 2% 2% -0.50% -1.00%Pfizer (Plax) 0.00% 0.00% 1.80% 3.60% -0.60% -0.60%Private Labels 0% 0% 11.20% 11.50% 0.00% 0.00%
0.00% 0.00%Other (Plug) 24.400% 24% 11.300% 9.4000000000000100% -3.60% -8.40%Total 100% 100% 100% 100% 0.00% 0.00%
0.00% 0.00%Super Premium 24.00% 24.50% 24.70% 35% 10.20% 15.50%Professional 30.100% 31.90% 38.50% 38.60% -5.10% -6.60%Value 21.50% 19.50% 10.10% 10.10% -1.50% 0.00%
Appendix 7- Delta
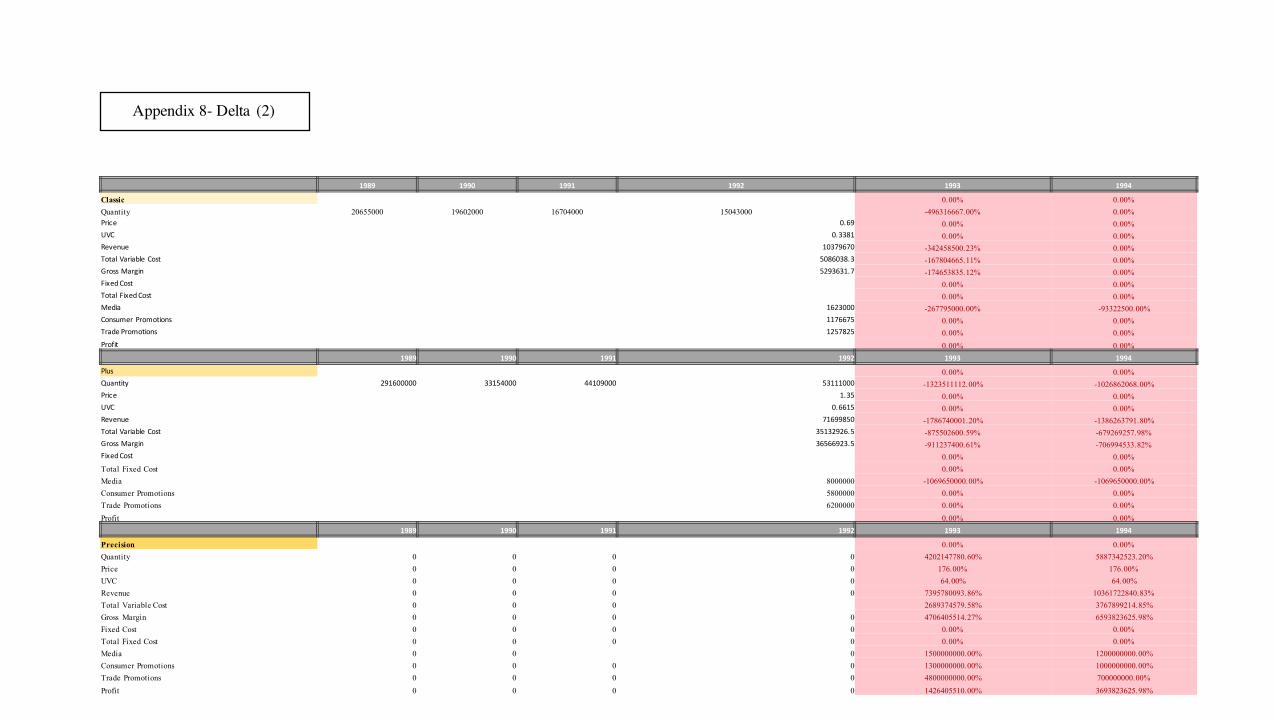
Appendix 8- Delta (2)
1989 1990 1991 1992 1993 1994
Classic 0.00% 0.00%Quantity 20655000 19602000 16704000 15043000 -496316667.00% 0.00%Price 0.69 0.00% 0.00%UVC 0.3381 0.00% 0.00%Revenue 10379670 -342458500.23% 0.00%TotalVariableCost 5086038.3 -167804665.11% 0.00%GrossMargin 5293631.7 -174653835.12% 0.00%FixedCost 0.00% 0.00%TotalFixedCost 0.00% 0.00%Media 1623000 -267795000.00% -93322500.00%ConsumerPromotions 1176675 0.00% 0.00%TradePromotions 1257825 0.00% 0.00%Profit 0.00% 0.00%
1989 1990 1991 1992 1993 1994Plus 0.00% 0.00%Quantity 291600000 33154000 44109000 53111000 -1323511112.00% -1026862068.00%Price 1.35 0.00% 0.00%UVC 0.6615 0.00% 0.00%Revenue 71699850 -1786740001.20% -1386263791.80%TotalVariableCost 35132926.5 -875502600.59% -679269257.98%GrossMargin 36566923.5 -911237400.61% -706994533.82%FixedCost 0.00% 0.00%Total Fixed Cost 0.00% 0.00%Media 8000000 -1069650000.00% -1069650000.00%Consumer Promotions 5800000 0.00% 0.00%Trade Promotions 6200000 0.00% 0.00%Profit 0.00% 0.00%
1989 1990 1991 1992 1993 1994
Precision 0.00% 0.00%Quantity 0 0 0 0 4202147780.60% 5887342523.20%Price 0 0 0 0 176.00% 176.00%UVC 0 0 0 0 64.00% 64.00%Revenue 0 0 0 0 7395780093.86% 10361722840.83%Total Variable Cost 0 0 0 2689374579.58% 3767899214.85%Gross Margin 0 0 0 0 4706405514.27% 6593823625.98%Fixed Cost 0 0 0 0 0.00% 0.00%Total Fixed Cost 0 0 0 0 0.00% 0.00%Media 0 0 0 1500000000.00% 1200000000.00%Consumer Promotions 0 0 0 0 1300000000.00% 1000000000.00%Trade Promotions 0 0 0 0 4800000000.00% 700000000.00%Profit 0 0 0 0 1426405510.00% 3693823625.98%
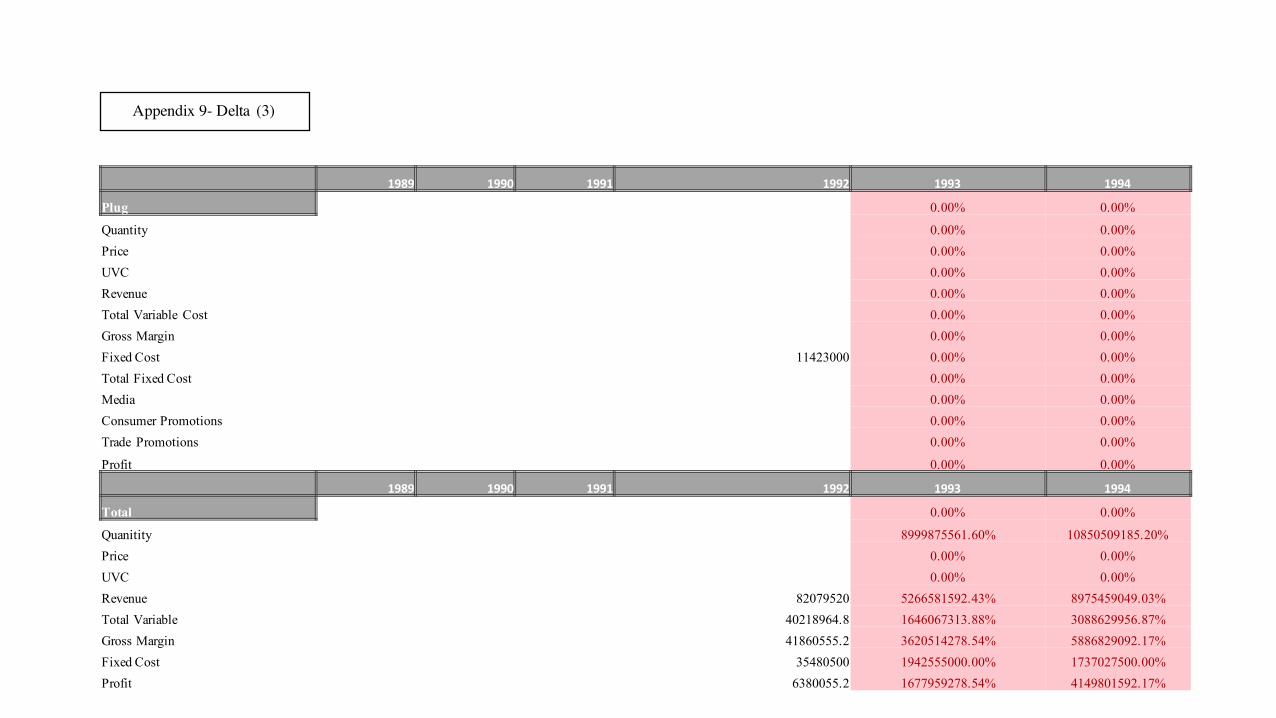
Appendix 9- Delta (3)
1989 1990 1991 1992 1993 1994
Plug 0.00% 0.00%
Quantity 0.00% 0.00%Price 0.00% 0.00%UVC 0.00% 0.00%Revenue 0.00% 0.00%Total Variable Cost 0.00% 0.00%Gross Margin 0.00% 0.00%Fixed Cost 11423000 0.00% 0.00%Total Fixed Cost 0.00% 0.00%Media 0.00% 0.00%Consumer Promotions 0.00% 0.00%Trade Promotions 0.00% 0.00%
Profit 0.00% 0.00%
1989 1990 1991 1992 1993 1994
Total 0.00% 0.00%
Quanitity 8999875561.60% 10850509185.20%Price 0.00% 0.00%UVC 0.00% 0.00%Revenue 82079520 5266581592.43% 8975459049.03%Total Variable 40218964.8 1646067313.88% 3088629956.87%Gross Margin 41860555.2 3620514278.54% 5886829092.17%Fixed Cost 35480500 1942555000.00% 1737027500.00%Profit 6380055.2 1677959278.54% 4149801592.17%
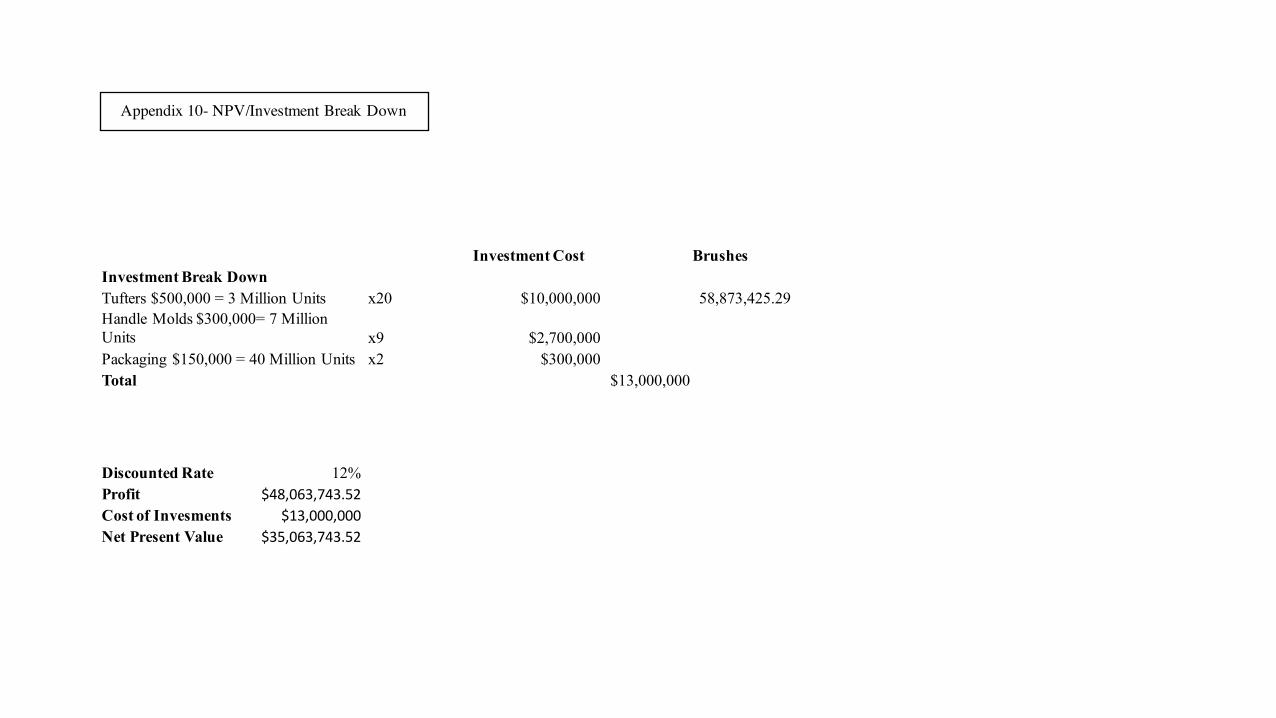
Appendix 10- NPV/Investment Break Down
Investment Cost BrushesInvestment Break DownTufters $500,000 = 3 Million Units x20 $10,000,000 58,873,425.29Handle Molds $300,000= 7 Million Units x9 $2,700,000Packaging $150,000 = 40 Million Units x2 $300,000Total $13,000,000
Discounted Rate 12%Profit $48,063,743.52Cost of Invesments $13,000,000Net Present Value $35,063,743.52