Embed Size (px)
Citation preview

WORLD HEADQUARTERS
Glenpointe Centre West500 Frank W. Burr Blvd.Teaneck, NJ 07666
PHONE: 201.801.0233TOLL FREE: 888.937.3277www.cognizant.com
CO
GN
IZA
NT
2011 A
NN
UA
L R
EP
OR
T
ANNUAL REPORT 2011
Helping companies RETHINK, REINVENT & REWIRE
their businesses for the future

$6,121,15611
$4,592,38910
$3,278,66309
$2,816,30408
$2,135,57707
RE
VE
NU
ES
(In
Th
ou
san
ds)
$1,136,46811
$861,85210
$618,49009
$516,67008
$381,52207
OP
ER
AT
ING
IN
CO
ME
(In
Th
ou
san
ds)
$3,952,88611
$3,584,43110
$2,653,17709
$1,965,57808
$1,468,21007
ST
OC
KH
OL
DE
RS
’ E
QU
ITY
(I
n T
ho
usa
nd
s)
137,70011
104,00010
78,42209
61,69708
55,40507
EM
PL
OY
EE
S
Revenues have increased
33% over 2010 & increased
187% SINCE 2007
Companies cannot master 21st century challenges with 20th century
strategies and methods. Organizations need to rethink their business
models to change the ways they interact with consumers, employees,
partners and others. We can help them rethink their value chain
to increase productivity and gain competitive advantage. Businesses
must also reinvent the workforce to reflect the millennial mindset
and its flexible, open and inclusive way of working. We can help them
adopt new tools to enable knowledge sharing and drive productivity
and innovation. And companies must rewire operations that are
being transformed by mobile devices, cloud computing, predictive
analytics, social networks and global commerce. We can help them
use these technologies to find new ways to increase flexibility, lower
costs and decrease time to market. As we help companies reimagine
their businesses for the future, the result will be greater value-creation
for clients —and continued industry-leading growth for Cognizant.
DIRECTORS
John E. Klein (1) (2) (3)
Chairman of the Board
Cognizant,
President and
Chief Executive Officer
Polarex, Inc.
Lakshmi Narayanan
Vice Chairman
Cognizant
John N. Fox, Jr. (1) (3)
Former Vice Chairman
Deloitte & Touche LLP
Robert W. Howe (1) (3)
Chairman
ADS
Robert E. Weissman (1) (3)
Chairman
Shelburne Investments
Thomas M. Wendel (2) (3)
Former Chief Executive Officer
Bridge Information Systems
Maureen Breakiron-Evans (2) (3)
Former Chief Financial Officer
Towers Perrin
Francisco D’Souza
Chief Executive Officer
Cognizant
BOARD COMMITTEES:
(1) Compensation Committee
(2) Audit Committee
(3) Nominating and Corporate Governance Committee
EXECUTIVE OFFICERS
Lakshmi Narayanan
Vice Chairman
Francisco D’Souza
Chief Executive Officer
Gordon J. Coburn
President
Karen McLoughlin
Chief Financial Officer
Ramakrishnan Chandrasekaran
Group Chief Executive–
Technology and Operations
Rajeev Mehta
Group Chief Executive –
Industries and Markets
Malcolm Frank
Executive Vice President,
Strategy and Marketing
Steven Schwartz
Senior Vice President,
General Counsel
and Secretary
EXECUTIVE OFFICES
Glenpointe Centre West
500 Frank W. Burr Blvd.
Teaneck, NJ 07666
Phone: 201.801.0233
FORM 10-K
A copy of the Company’s Form 10-K is
available without charge upon request
by contacting Investor Relations at the
address or phone number listed.
COMMON STOCK INFORMATION
The Company’s Class A common stock
(CTSH) is listed on the NASDAQ Global
Select Market.
ANNUAL MEETING
The Company’s annual meeting
of stockholders will be held at
9:30 am on Tuesday, June 5, 2012
at the Company’s headquarters:
Glenpointe Centre West
500 Frank W. Burr Blvd.
Teaneck, NJ 07666
LEGAL COUNSEL
DLA Piper LLP (US)
300 Campus Drive
Florham Park, NJ 07932
INDEPENDENT REGISTERED
PUBLIC ACCOUNTING FIRM
PricewaterhouseCoopers LLP
300 Madison Avenue
New York, NY 10017
TRANSFER AGENT
American Stock Transfer
& Trust Company, LLC
6201 15th Avenue
Brooklyn, NY 11219
INTERNET
Additional company information is
available on the World Wide Web:
www.cognizant.com
INVESTOR RELATIONS
Requests for financial information
should be sent to:
David Nelson
Cognizant Technology Solutions
Glenpointe Centre West
500 Frank W. Burr Blvd.
Teaneck, NJ 07666
Phone: 201.801.0233
CORPORATE INFORMATION

TO OUR STOCKHOLDERS:
In 2011, Cognizant once again delivered industry-leading
growth while making solid progress in positioning our
business for the future. I am especially proud of the way
our team worked together to drive increased revenue
and solid profi tability in a tough economy. Among other
achievements, we further strengthened our client relation-
ships, while attracting and retaining the talented people
we need to sustain our momentum. Most importantly, we
continued our strategy of reinvesting in our services and
global delivery network to ensure that we can lead our
clients—and our own business—toward new horizons
of productivity, growth and value.
Cognizant’s success in the past year stems from the fact that we have positioned
our business to help solve a critical problem facing our clients: the need to build
agility into both the cost and revenue sides of their models. Companies are under
intense pressure today to reduce costs in response to the continued volatility
of the economy, rising input prices and global competition. In this context, they
increasingly view the global sourcing model as a key to their efforts to operate
more cost-effectively and productively. At the same time, they must invest in new
technologies that hold the promise of innovation and the potential for top-line
growth, such as cloud computing, social networks, mobile devices and advanced
analytics. These technologies represent a new IT stack that will profoundly change
the way companies relate to their customers, engage with employees, and bring
innovative products and services to market.
Clients choose to partner with Cognizant because we can provide solutions to both
critical mandates— cost-effi ciency and technology-based innovation and growth—
in a comprehensive, integrated manner. Our solutions are built on a global network
of delivery centers, deep domain expertise and a robust portfolio of services.
In addition to providing the means to help companies face these twin challenges,
our people bring a passionate commitment to each client’s success. As companies
rethink, reinvent and rewire for a 21st century business environment, we are
positioned to be the IT services partner of choice. We are prepared to help clients
embrace changes brought on by new technologies, along with trends toward
globalization, virtualization, and the emergence of millennials as customers
and employees, which we view as the Future of Work.
COGNIZANT ANNUAL REPORT 2011
RETHINK
REINVENT
REWIRE

02 Cognizant Technology Solutions ANNUAL REPORT 2011
INDUSTRY-LEADING GROWTH
Our strong value proposition for clients translated into continued industry-
leading revenue growth and rising profi tability over the past year, despite a
global economy that remained unsettled. Revenue for 2011 increased to
$6.1 billion, up 33% from 2010. GAAP net income increased to $883.6 million,
or $2.85 per diluted share, compared to $733.5 million, or $2.37 per diluted
share, for 2010. Diluted earnings per share on a non-GAAP basis, excluding
stock-based compensation costs, rose to $3.07, from $2.51 in 2010. Non-GAAP
operating margin was 20.0%, within our targeted range of 19-20%. We ended
the year with a solid balance sheet, with cash and short-term investments
totaling over $2.4 billion.
Overall, we gained more than 73 new clients in 2011, including a record number
of strategic accounts, which we defi ne as clients that have the potential to spend
at least $5 million to well over $50 million with us annually. More important than
the quantity of new relationships, however, is the fact that clients continued to
cite Cognizant’s high quality of service in our most recent annual customer
satisfaction survey.
EXPANDING REGIONS, INDUSTRY SECTORS AND SERVICES
Our performance was strong across our geographic base. North American revenues
rose 34% over the prior year. Despite macroeconomic issues in Europe, which
restrained spending by some clients, European revenue grew 28% for the year
and we increased our penetration in many of our service areas. The UK Financial
Services Authority (FSA) chose Cognizant to help the fi nancial regulator upgrade the
IT systems and solutions that support its market surveillance, supervisory analysis
and risk management functions. We also were tapped by Volvo Car Corporation to
optimize a wide array of Finance and Accounting (F&A) services.
Emerging markets such as Asia-Pacifi c, Middle East and Latin America are a smaller
but growing part of our business, with revenues up 43% over the prior year.
In a recent engagement, we developed a merchandise planning platform for the
REDTAG Group, a Dubai-based chain of value fashion and home stores, that will
help REDTAG respond more quickly and effi ciently to the dynamic fashion retailing
market by making better-informed purchasing and pricing decisions.
We continued our strategy of reinvesting in our services and global delivery network to ensure that we can lead our clients —and our own business—toward new horizons of productivity, growth and value.
13.5%
Information, Media & Entertainment / Communications / High Technology
Financial Services
12.8%
Manufacturing/Retail/Logistics
Healthcare
19.6%
26.5%
41.1%
2011 TOTAL REVENUE
BY INDUSTRY

ANNUAL REPORT 2011 Cognizant Technology Solutions 03
More important than the quantity of new relationships, is the fact that clients continued to cite Cognizant’s high quality of service.
Cognizant’s domain expertise in a broad range of industries also contributed to our
growth. Financial services revenues were up 29% versus the prior year. The Hanover
Insurance Group, a major property and casualty insurer, expanded its relationship
with us to include remote infrastructure management services that will support
regional expansion, new and enhanced insurance products, and enhanced functionality
for insurance agents. Healthcare revenues grew nearly 38%. AstraZeneca turned to
Cognizant to develop a comprehensive biostatistics and medical reporting service
to drive innovation and productivity in managing clinical studies. Revenues from
manufacturing, retail and logistics clients rose by 41%. Other industries, including
information, media & entertainment, communications and high technology, grew
26% over the prior year.
We continued to benefi t from our investment in new services, leading to dynamic
growth in areas such as Cognizant Business Consulting, IT Infrastructure Services
(ITIS), Business Process Outsourcing (BPO), and Business Process as a Service
(BPaaS). There are now over 2,900 members of our Consulting practice, who are
increasingly working with members of the C-suite to deliver large-scale, end-to-end
transformational programs. In BPO, we have executed on our strategy of focusing
on vertical processes that require deep domain and functional knowledge and that
benefi t from the integration with Consulting and ITIS services. Within ITIS, we have
continued to win and manage a growing pipeline of large engagements. We also
have seen rapid growth in our Testing practice, which has reached signifi cant scale.
REIMAGINING BUSINESS — INVESTING ACROSS NEW HORIZONS
Cognizant’s ability to help clients rethink, reinvent and rewire their businesses will power
the next cycle of opportunity in our business. To assist clients in reimagining their
businesses for the future, while continuing to drive our own industry-leading growth, we
must continually invest in our business. Our strategy calls for investing simultaneously
across three “horizons of growth”— to deepen the penetration and increase the scale
of our existing services, while introducing the new services that will be essential to
clients in the future.
We continue to see great potential to expand our current core business, which we
think of as our fi rst growth horizon. This includes offerings such as application
development and maintenance, testing and packaged application services, which are
especially relevant to our clients’ needs for greater cost-effi ciency and effectiveness.
Our emphasis in this category is driving ever-greater levels of productivity for clients
through best-in-class methodologies and a more aggressive move to variable pricing
models, or managed services. Cognizant’s growth in Horizon 1 will come from driving
acceptance of the global sourcing model by new clients, including clients in under-
penetrated regions such as Europe, as well as deeper relationships with existing clients.

04 Cognizant Technology Solutions ANNUAL REPORT 2011
Our second growth horizon includes newer offerings in which we have achieved
critical mass, but which still have enormous potential, such as Consulting, BPO and
ITIS. These services help clients respond to economic and competitive pressures
by re-examining which activities should remain core to their businesses, and which
can be optimized by an external provider. We also see clients globally sourcing additional
components of business process and IT infrastructure processes, previously
performed internally. Our investment priority for Horizon 2 is to scale these services
across additional industries and clients.
Emerging capabilities, such as mobile, cloud, enterprise analytics and social
computing, represent our third growth horizon. These services will enable clients
to address changes brought on by the Future of Work by adopting new distributed
and virtualized business models, optimizing cloud and mobile technologies, and
relating to an emerging generation of millennial workers and consumers. In short,
clients are moving from business-driven technology to technology-driven business
— viewing the new IT stack as a pathway to better performance and value. Although
these practices remain in their infancy, we view our investments in Horizon 3 as
being vital to our clients’ future needs and our long-term growth.
Together, these three horizons illustrate the breadth and depth of market demand,
and highlight the benefi ts of our diversifi ed business mix and reinvestment strategy.
BUILDING OUR ORGANIZATION AND INFRASTRUCTURE
Our success—today and tomorrow—requires that we make investments, build
capabilities and execute successfully across all three horizons simultaneously.
For this reason, we named several key executives to expanded duties in early 2012.
Gordon Coburn, our long-time Chief Financial and Operating Offi cer, has been
promoted to President. Rajeev Mehta has been promoted to Group Chief Executive
of Industries and Markets, responsible for our industry vertical teams. Chandra
Sekaran has been promoted to Group Chief Executive of Technology and Operations,
responsible for service lines that span industry groups. Gordon, Raj and Chandra will
work together to oversee all aspects of our current business operations. Additionally,
Karen McLoughlin has been promoted to Chief Financial Offi cer, where she will
focus on ensuring our continued strong fi nancial performance. Malcolm Frank has
been promoted to Executive Vice President of Strategy and Marketing, where he will
further the initiatives that have made Cognizant’s brand a symbol of industry
leadership. I retain the role of Chief Executive Offi cer and continue to lead
Cognizant’s strategic direction. These organizational changes will permit me to
focus on our long-term growth agenda, and especially on our efforts to develop
new Horizon 3 solutions that are profi table, sustainable and scalable.
Fortune
WORLD’S MOST ADMIRED COMPANIES
For the fourth year running, Cognizant was named to Fortune Magazine’s World’s Most Admired Companies, and was #4 in Information Technology Services. This defi nitive report card on corporate reputation is based on a survey of global business executives.
Financial Times
FT GLOBAL 500
Making its fi rst appearance on the Financial Times Global 500, an annual list of the world’s largest companies based on market capitalization, Cognizant ranked #370.
Vault.com
25 BEST PLACES TO WORK
In October 2011, Vault.com ranked Cognizant #6 among the 25 Best Places to Work in IT Consulting, based on 16 quality of life indicators such as compensation, fi rm culture, training initiatives, promotion policies and hours spent in the offi ce.
ANNUAL REPORT 2011 Cognizant Technology Solutions 05
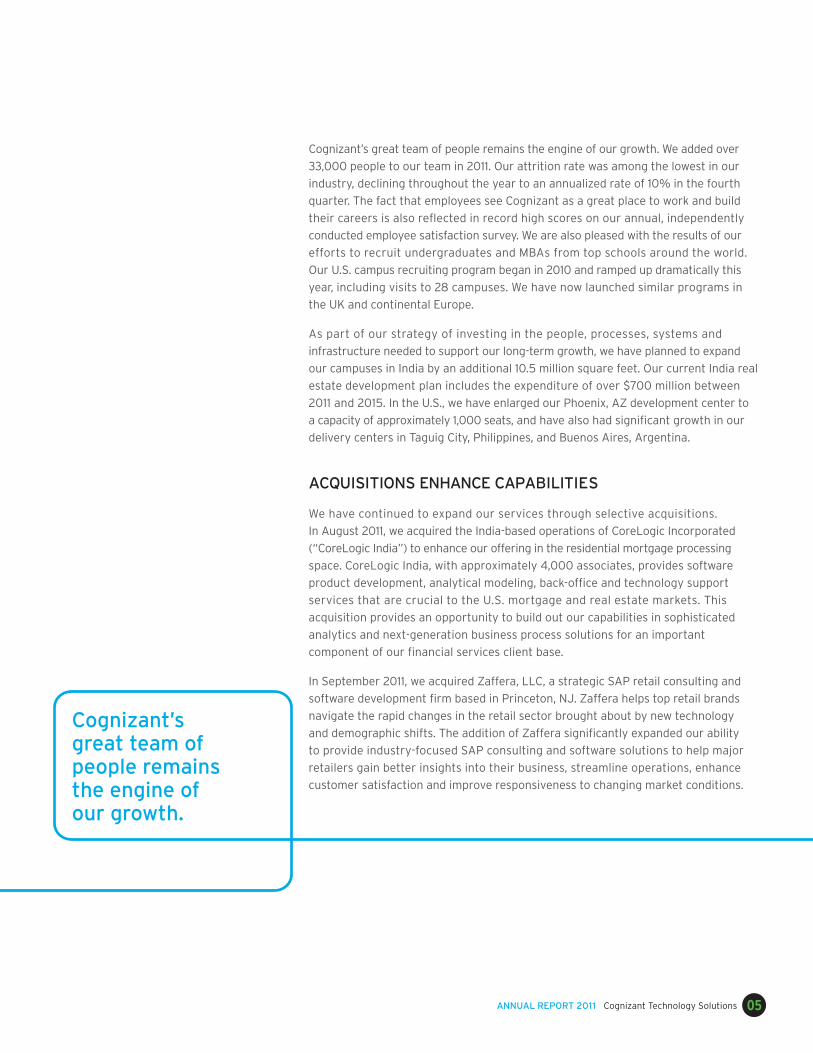
Cognizant’s great team of people remains the engine of our growth. We added over
33,000 people to our team in 2011. Our attrition rate was among the lowest in our
industry, declining throughout the year to an annualized rate of 10% in the fourth
quarter. The fact that employees see Cognizant as a great place to work and build
their careers is also refl ected in record high scores on our annual, independently
conducted employee satisfaction survey. We are also pleased with the results of our
efforts to recruit undergraduates and MBAs from top schools around the world.
Our U.S. campus recruiting program began in 2010 and ramped up dramatically this
year, including visits to 28 campuses. We have now launched similar programs in
the UK and continental Europe.
As part of our strategy of investing in the people, processes, systems and
infrastructure needed to support our long-term growth, we have planned to expand
our campuses in India by an additional 10.5 million square feet. Our current India real
estate development plan includes the expenditure of over $700 million between
2011 and 2015. In the U.S., we have enlarged our Phoenix, AZ development center to
a capacity of approximately 1,000 seats, and have also had signifi cant growth in our
delivery centers in Taguig City, Philippines, and Buenos Aires, Argentina.
ACQUISITIONS ENHANCE CAPABILITIES
We have continued to expand our services through selective acquisitions.
In August 2011, we acquired the India-based operations of CoreLogic Incorporated
(“CoreLogic India”) to enhance our offering in the residential mortgage processing
space. CoreLogic India, with approximately 4,000 associates, provides software
product development, analytical modeling, back-offi ce and technology support
services that are crucial to the U.S. mortgage and real estate markets. This
acquisition provides an opportunity to build out our capabilities in sophisticated
analytics and next-generation business process solutions for an important
component of our fi nancial services client base.
In September 2011, we acquired Zaffera, LLC, a strategic SAP retail consulting and
software development fi rm based in Princeton, NJ. Zaffera helps top retail brands
navigate the rapid changes in the retail sector brought about by new technology
and demographic shifts. The addition of Zaffera signifi cantly expanded our ability
to provide industry-focused SAP consulting and software solutions to help major
retailers gain better insights into their business, streamline operations, enhance
customer satisfaction and improve responsiveness to changing market conditions.
Cognizant’s great team of people remains the engine of our growth.

EDUCATION, ENVIRONMENT AND SUSTAINABILITY
As a responsible global citizen, Cognizant seeks to play a positive role in the
communities where we live and work. Given our commitment to helping clients
address the challenges and opportunities of emerging technologies, a major focus
is ensuring a supply of talented and motivated IT professionals suffi cient to meet
future demand.
We actively support programs to encourage science, technology, engineering and
mathematics (STEM) education. In the U.S., we launched a series of initiatives under
the banner Making the Future. For example, we funded the Cognizant Maker Space
at the New York Hall of Science, where children can experience the joy of imagining
and making their own creations. We are partnering with programs such as Citizen
Schools, to bring technology professionals to teach in low-income neighborhoods,
and Engineering is Elementary, a program of the Museum of Science, Boston, that
has developed a basic engineering curriculum for grades K-5. In 2012, we launched
a community-based, after-school and summer program in which children will create
projects ranging from electronic gadgets, robots and software programs to crafts,
music and technology-enhanced clothing.
Our Outreach program provides a platform for associates to volunteer for causes
dear to them. In 2011, some 20,000 associates volunteered in various schools and
orphanages, registering over 100,000 volunteer hours. More than 66,000 children
began their academic year with free school supplies donated by Outreach volunteers.
Outreach supports afterschool study centers in 29 villages and works with hundreds
of homeless children. Cognizant volunteers provided career guidance to 16,000
children in 130 schools in partnership with Junior Achievement.
Go Green is our company-wide effort to achieve measurable reductions in our
environmental impact. We exceeded our 25% per capita emissions reduction target
with energy effi ciency programs using Six Sigma techniques. We completed the
planting of 100,000 trees across the globe to mitigate carbon emissions. We
improved our Newsweek Green Ranking, moving up to No. 16 from No. 138 in the
U.S. 500 and achieving the No. 1 environmental impact score within the IT industry
in the Global 500.
I encourage you to read our Sustainability Report for an in-depth discussion of
our commitment to these and other efforts.
PERFORMANCE AND POTENTIAL
We are extremely proud that Cognizant joined the “Fortune 500,” Fortune Magazine’s
ranking of America’s largest companies in May 2011, based on our revenue for the
prior year. The fact that we reached this milestone only 17 years after launching the
company, and just three years after joining the “Fortune 1000,” is a credit to the
talent, commitment and hard work of our team. In addition, we were ranked among
Fortune’s “World’s Most Admired Companies” for the fourth year in a row.
06 Cognizant Technology Solutions ANNUAL REPORT 2011
We are extremely proud to have joined the “Fortune 500” only 17 years after launching the company.

In May 2011, we appeared for the fi rst time on the “Barron’s 500” list of companies
with the strongest sales growth and cash fl ow return on investment.
As I look ahead, I am very confi dent that Cognizant will continue delivering high-value
service to our clients and industry-leading growth for our stockholders. Despite
a clouded outlook for the global economy, and Europe in particular, the forces driving
companies toward a global delivery model are more powerful than ever. Current and
potential clients are intensely focused on cost-optimization and actively seeking
opportunities to expand the scale and scope of global sourcing. In this regard, it is
worth noting that economic downturns tend to increase our addressable market by
prompting companies to examine how they can use global services both to manage
costs and enhance their agility.
At the same time, the Future of Work is challenging businesses to move beyond 20th
century structures, systems and processes and to embrace an environment that is
being aggressively reshaped by globalization, virtualization, technology and the rise
of millennials as customers and employees. Companies need to rethink their business
models, reinvent their workforce and rewire their operations— or risk missing out on
long-term prospects for innovation and growth.
Cognizant is well positioned to help clients navigate these dual challenges. Our global
delivery network, broad portfolio of services and extensive domain expertise enable
us to serve a wide range of clients and industries around the world. We have a strong
investment discipline focused across our three horizons of opportunity, deepening
today’s offerings while developing the services that will be relevant to clients tomorrow.
Most importantly, Cognizant’s culture is uniquely aligned with the opportunities
ahead. The company was “born global,” values knowledge-sharing, and is populated
by millennials who embrace new modes of collaboration and communication. Our
people are motivated by a passion to help companies thrive. And we are committed
to partnering with clients in reimagining their businesses for the future. These
strengths will be the source of increasing value for our clients, employees,
stockholders and communities in the years to come. Thank you.
Sincerely,
Francisco D’Souza
Chief Executive Offi cer

8 ANNUAL REPORT 2011
Lowe’s is the second-largest home-improvement retailer in the world, operating
over 1,700 stores throughout the U.S., Canada and Mexico. As consumers have
changed the way they shop in a multi-channel world, Lowe’s has rethought its
business model to stay relevant to the customer’s home improvement process
and to deliver a simple and seamless experience across all channels.
To make it convenient and productive wherever and whenever the customer
chooses to engage, Cognizant worked with Lowe’s to integrate its order capture
and fulfi llment systems — and facilitate product installation and delivery as
well as product repair — across all customer touch points. This allows Lowe’s
to ship items directly to customers from select stores and regional distribution
centers, as well as its Internet warehouse. With an increase in the items
available for parcel shipment, Lowe’s can achieve a higher order fulfi llment rate,
faster customer delivery and reduced cost of order fulfi llment.
RETHINKING BUSINESS MODELS
Helping Lowe’s Improve The Customer Experience
For Telefónica UK, a leading communications company serving consumers and
businesses in the United Kingdom, online applications are vital to driving sales
and enhancing customer service. In December 2011, Telefónica UK selected
Cognizant as its strategic partner to develop and manage online applications,
which perform a wide array of business-critical functions, from promoting and
providing access to products and services, to delivering end-user functionality.
The innovative multi-year managed services agreement with Cognizant will
allow Telefónica UK to deliver the next generation of differentiated digital
experience. The result will be more agile and fl exible online systems that can
evolve and scale to accommodate changing products, business objectives,
and customer needs in an extremely competitive mobile market. Shifting its
online applications to a managed services model also will enhance Telefónica
UK’s capacity to promote customer loyalty, expand its customer base, drive
innovation and maximize returns on IT investments — while balancing cost,
complexity and capacity.
REINVENTING CUSTOMER EXPERIENCE
Innovation calling:Telefónica UK

ANNUAL REPORT 2011 9 ANNUAL REPORT 2011 Cognizant Technology Solutions 09
REWIRING OPERATIONS
Transforming IHS LegacySystems and Processes
IHS is the leading source of information, insight and analytics in critical areas
that shape today’s business landscape. Businesses and governments in more
than 165 countries rely on the comprehensive content, expert independent
analysis and fl exible delivery methods of IHS to make high-impact decisions
and develop strategies with speed and confi dence. Having grown via more
than 40 strategic acquisitions since 2007, the company sought to rationalize
disparate systems and consolidate fi nancial business processes through an
enterprise-wide rollout of SAP Financials. IHS looked to Cognizant to provide
guidance and support in building a standardized solution across all acquired
companies and business entities to ensure consistency, scalability, better
customer service and more effective data governance. In 2011, IHS announced
the fi rst phase of a multiyear enterprise platform rollout to replace the
company’s legacy systems and harmonize business processes. The project
required the Cognizant team to collaborate closely with IHS executive
management, business and IT, and to draw upon our deep functional and
technical expertise in SAP to assist in this transformative initiative. The
resulting integrated system will support IHS’ growth strategy and allow
the company to deliver the best customer experience worldwide.
FUTURE OF WORK CASE STUDIES
REWIRING OPERATIONS
Ace Hardware: Mobility Brings Purchasing IntoThe 21th Century
Ace Hardware Corporation, the largest retailer-owned hardware cooperative
in the industry, with over 4,600 hardware stores locally owned and operated
across the globe, sought to modernize and streamline the way its retailers
purchase merchandise at its bi-annual convention. The company recognized
that mobile technology offered the key to a faster, more responsive and more
fl exible order management process. Ace turned to Cognizant to develop
a pilot app to enable retailers to place and capture new items for multiple
stores via their iPhones and Android smartphones. The app eliminates
the manually-intensive and time-consuming process of writing notes on
standard forms and then placing orders via computers at a later time.
The objective: free up time for retailers to think more strategically about
inventory management. The pilot app received extremely positive feedback
from retailers who tested it at a company meeting in late 2011, fueling their
appetite for even greater smartphone and tablet computing functionality.
10 Cognizant Technology Solutions ANNUAL REPORT 2011
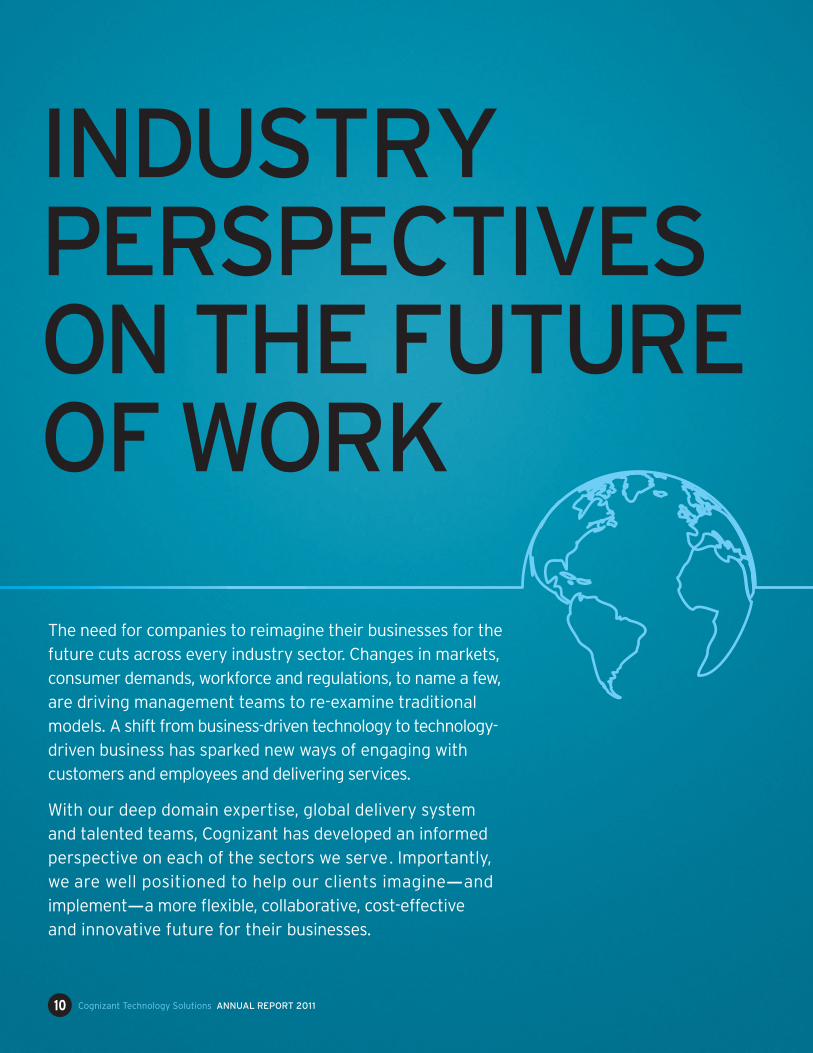
INDUSTRY PERSPECTIVES ON THE FUTURE OF WORK
The need for companies to reimagine their businesses for the
future cuts across every industry sector. Changes in markets,
consumer demands, workforce and regulations, to name a few,
are driving management teams to re-examine traditional
models. A shift from business-driven technology to technology-
driven business has sparked new ways of engaging with
customers and employees and delivering services.
With our deep domain expertise, global delivery system
and talented teams, Cognizant has developed an informed
perspective on each of the sectors we serve . Importantly,
we are well positioned to help our clients imagine—and
implement—a more fl exible, collaborative, cost-effective
and innovative future for their businesses.

ANNUAL REPORT 2011 Cognizant Technology Solutions 11
FINANCIAL SERVICESBanks, insurers and investment fi rms have
been hard hit by the economic downturn
and resulting regulatory actions, which have
altered their capital structures and business
models. They must navigate more volatile
markets, develop new revenue sources and
manage costs. New technologies such as
cloud computing, mobile devices and predictive
analytics will help, by creating virtualized
processes and infrastructure, allowing for
the global fl ow of capital and ideas, enabling
collaboration across the workforce and
shaping products and services in a way that
is relevant to millennial customers.
HEALTHCARE The healthcare industry must grapple with
prohibitively high costs, unwieldy models
of sharing patient information and consumers
who demand ever higher levels of service.
In many parts of the world, quality and
access to care also are critical issues. Amid
these challenges, signifi cant progress will
come in the areas of healthcare information
technology, health information exchange,
personalized care strategies and easier
access to care. New technology, globalization
and virtualization also will help life sciences
companies reinvent the R&D process to speed the
delivery of new therapies to the marketplace.
Thirty-nine percent of fi nancial services CIOs worldwide believe that
CLOUD-BASED SERVICES will increase to over
50%
of their transactions by 2015SOURCE: GARTNER
Downloads of mobile health apps are predicted to reach
44 MILLIONin 2012, and could hit
142MILLION
SO
UR
CE
: JU
NIP
ER
RE
SE
AR
CH
by 2016

MANUFACTURING /RETAIL/LOGISTICSOpportunities are emerging for manufacturers
to drive productivity and growth through mobile
applications that map to the roles of their
customers, partners and employees. Retailers
will use predictive analytics, as well as the ability
to connect with consumers through mobility and
social networks, to strengthen the relationship
between customers and brands. And logistics
providers can employ mobile and cloud-based
technologies to enhance productivity and respon-
siveness across the supply chain. The end result
will be a seamless experience, from the point of
manufacture, through distribution, shopping and
ordering, to delivery to the customer.
INFORMATION, MEDIA & ENTERTAINMENT/COMMUNICATIONS/HIGH TECHNOLOGY
The business models of companies in these
sectors are being challenged by digital media,
as well as technologies such as mobile devices,
social media and the cloud, all of which are
changing the relationship between users and
the information they consume. Companies must
develop new business models that deliver services
and information to a variety of devices. They
will explore new revenue opportunities by
personalizing content in response to customer
preferences. And, they must learn to manage
digital rights and payment for content in a
cloud-enabled environment.
12 Cognizant Technology Solutions ANNUAL REPORT 2011
SOCIAL NETWORKINGSITES NOW REACH
82OF THE WORLD’S
ONLINE POPULATION
%
SOURCE: COMSCORE
Mobile commerce revenues are expected to hit
$31 BILLIONIN THE US BY 2016, MORE THAN A
5XBUY NOWINCREASE
OVER THE 2011 ESTIMATE S
OU
RC
E: F
OR
RE
ST
ER
RE
SE
AR
CH

UNITED STATESSECURITIES AND EXCHANGE COMMISSION
Washington, DC 20549
FORM 10-K
FOR ANNUAL AND TRANSITION REPORTSPURSUANT TO SECTIONS 13 OR 15(d) OF THE
SECURITIES EXCHANGE ACT OF 1934(Mark One)
È ANNUAL REPORT PURSUANT TO SECTION 13 OR 15(d) OF THE SECURITIES EXCHANGEACT OF 1934For the fiscal year ended December 31, 2011
OR‘ TRANSITION REPORT PURSUANT TO SECTION 13 OR 15(d) OF THE SECURITIES
EXCHANGE ACT OF 1934For the transition period from to
Commission File Number 0-24429
COGNIZANT TECHNOLOGY SOLUTIONS CORPORATION(Exact Name of Registrant as Specified in Its Charter)
Delaware 13-3728359(State or Other Jurisdiction ofIncorporation or Organization)
(I.R.S. EmployerIdentification No.)
Glenpointe Centre West, 500 Frank W. Burr Blvd.,Teaneck, New Jersey 07666
(Address of Principal Offices) (Zip Code)
Registrant’s telephone number, including area code: (201) 801-0233Securities registered pursuant to Section 12(b) of the Act:
Title of each class Name of each exchange on which registered
Class A Common Stock, $0.01 par value per share The NASDAQ Stock Market LLCSecurities registered pursuant to Section 12(g) of the Act:
Preferred Share Purchase Rights(Title of Class)
Indicate by check mark if the registrant is a well-known seasoned issuer, as defined in Rule 405 of the Securities Act. È Yes ‘ NoIndicate by check mark if the registrant is not required to file reports pursuant to Section 13 or Section 15(d) of the
Act. ‘ Yes È NoIndicate by check mark whether the registrant (1) has filed all reports required to be filed by Section 13 or 15(d) of the Securities
Exchange Act of 1934 during the preceding 12 months (or for such shorter period that the registrant was required to file such reports), and(2) has been subject to such filing requirements for the past 90 days. È Yes ‘ No
Indicate by check mark whether the registrant has submitted electronically and posted on its corporate Website, if any, every InteractiveData File required to be submitted and posted pursuant to Rule 405 of Regulation S-T during the preceding 12 months (or for such shorterperiod that the registrant was required to submit and post such files). È Yes ‘ No
Indicate by check mark if disclosure of delinquent filers pursuant to Item 405 of Regulation S-K (§229.405 of this chapter) is notcontained herein, and will not be contained, to the best of registrant’s knowledge, in definitive proxy or information statements incorporatedby reference in Part III of this Form 10-K or any amendment to this Form 10-K. È
Indicate by check mark whether the registrant is a large accelerated filer, an accelerated filer, a non-accelerated filer, or a smallerreporting company. See definitions of “large accelerated filer,” “accelerated filer” and “smaller reporting company” in Rule 12b-2 of theExchange Act. (Check one):Large accelerated filer È Accelerated filer ‘
Non-accelerated filer ‘ (Do not check if a smaller reporting company) Smaller reporting company ‘
Indicate by check mark whether the registrant is a shell company (as defined in Rule 12b-2 of the Act). ‘ Yes È NoThe aggregate market value of the registrant’s voting shares of common stock held by non-affiliates of the registrant on June 30, 2011,
based on $73.34 per share, the last reported sale price on the NASDAQ Global Select Market of the NASDAQ Stock Market LLC on thatdate, was $22,176,120,528.
The number of shares of Class A common stock, $0.01 par value, of the registrant outstanding as of February 17, 2012 was 303,376,134shares.
DOCUMENTS INCORPORATED BY REFERENCEThe following documents are incorporated by reference into the Annual Report on Form 10-K: Portions of the registrant’s definitive
Proxy Statement for its 2012 Annual Meeting of Stockholders are incorporated by reference into Part III of this Report.

TABLE OF CONTENTS
Item Page
PART I . . . . . . . . . . . . . . . . . . . . . . . . . . . . . . . . . . . . . . . . . . . . . . . . . . . . . . . . . . . . . . . . . . . . . . . . . . . . . . . 11. Business . . . . . . . . . . . . . . . . . . . . . . . . . . . . . . . . . . . . . . . . . . . . . . . . . . . . . . . . . . . . . . . . . 11A. Risk Factors . . . . . . . . . . . . . . . . . . . . . . . . . . . . . . . . . . . . . . . . . . . . . . . . . . . . . . . . . . . . . . 191B. Unresolved Staff Comments . . . . . . . . . . . . . . . . . . . . . . . . . . . . . . . . . . . . . . . . . . . . . . . . . . 392. Properties . . . . . . . . . . . . . . . . . . . . . . . . . . . . . . . . . . . . . . . . . . . . . . . . . . . . . . . . . . . . . . . . 403. Legal Proceedings . . . . . . . . . . . . . . . . . . . . . . . . . . . . . . . . . . . . . . . . . . . . . . . . . . . . . . . . . 404. Mine Safety Disclosures . . . . . . . . . . . . . . . . . . . . . . . . . . . . . . . . . . . . . . . . . . . . . . . . . . . . . 40
PART II . . . . . . . . . . . . . . . . . . . . . . . . . . . . . . . . . . . . . . . . . . . . . . . . . . . . . . . . . . . . . . . . . . . . . . . . . . . . . . 415. Market for Registrant’s Common Equity, Related Stockholder Matters and Issuer
Purchases of Equity Securities . . . . . . . . . . . . . . . . . . . . . . . . . . . . . . . . . . . . . . . . . . . . . . 416. Selected Financial Data . . . . . . . . . . . . . . . . . . . . . . . . . . . . . . . . . . . . . . . . . . . . . . . . . . . . . 457. Management’s Discussion and Analysis of Financial Condition and Results of
Operations . . . . . . . . . . . . . . . . . . . . . . . . . . . . . . . . . . . . . . . . . . . . . . . . . . . . . . . . . . . . . . 467A. Quantitative and Qualitative Disclosures About Market Risk . . . . . . . . . . . . . . . . . . . . . . . . 658. Financial Statements and Supplementary Data . . . . . . . . . . . . . . . . . . . . . . . . . . . . . . . . . . . 669. Changes in and Disagreements with Accountants on Accounting and Financial
Disclosure . . . . . . . . . . . . . . . . . . . . . . . . . . . . . . . . . . . . . . . . . . . . . . . . . . . . . . . . . . . . . . 669A. Controls and Procedures . . . . . . . . . . . . . . . . . . . . . . . . . . . . . . . . . . . . . . . . . . . . . . . . . . . . . 669B. Other Information . . . . . . . . . . . . . . . . . . . . . . . . . . . . . . . . . . . . . . . . . . . . . . . . . . . . . . . . . . 67
PART III . . . . . . . . . . . . . . . . . . . . . . . . . . . . . . . . . . . . . . . . . . . . . . . . . . . . . . . . . . . . . . . . . . . . . . . . . . . . . . 6810. Directors, Executive Officers and Corporate Governance . . . . . . . . . . . . . . . . . . . . . . . . . . . 6811. Executive Compensation . . . . . . . . . . . . . . . . . . . . . . . . . . . . . . . . . . . . . . . . . . . . . . . . . . . . 6812. Security Ownership of Certain Beneficial Owners and Management and Related
Stockholder Matters . . . . . . . . . . . . . . . . . . . . . . . . . . . . . . . . . . . . . . . . . . . . . . . . . . . . . . 6813. Certain Relationships and Related Transactions, and Director Independence . . . . . . . . . . . . 6814. Principal Accountant Fees and Services . . . . . . . . . . . . . . . . . . . . . . . . . . . . . . . . . . . . . . . . 68
PART IV . . . . . . . . . . . . . . . . . . . . . . . . . . . . . . . . . . . . . . . . . . . . . . . . . . . . . . . . . . . . . . . . . . . . . . . . . . . . . . 6915. Exhibits, Financial Statement Schedules 69
SIGNATURES . . . . . . . . . . . . . . . . . . . . . . . . . . . . . . . . . . . . . . . . . . . . . . . . . . . . . . . . . . . . . . . . . . . . . . . . . 70EXHIBIT INDEX . . . . . . . . . . . . . . . . . . . . . . . . . . . . . . . . . . . . . . . . . . . . . . . . . . . . . . . . . . . . . . . . . . . . . . . 71INDEX TO CONSOLIDATED FINANCIAL STATEMENTS AND FINANCIAL STATEMENTSCHEDULE . . . . . . . . . . . . . . . . . . . . . . . . . . . . . . . . . . . . . . . . . . . . . . . . . . . . . . . . . . . . . . . . . . . . . . . . . F-1
i

PART I
Item 1. Business
Overview
We are a leading provider of custom information technology, consulting and business process outsourcingservices. Our customers are primarily Global 2000 companies. Our core competencies include TechnologyStrategy Consulting, Complex Systems Development and Integration, Enterprise Software PackageImplementation and Maintenance, Data Warehousing, Business Intelligence and Analytics, Application Testing,Application Maintenance, Infrastructure Management, and Business and Knowledge Process Outsourcing, orBPO and KPO. We tailor our services to specific industries, and utilize an integrated global delivery model. Thisseamless global sourcing model combines technical and account management teams located on-site at thecustomer location and at dedicated near-shore and offshore development and delivery centers located primarily inIndia, China, the United States, Canada, Argentina, Hungary and the Philippines.
Industry Background
Many companies today face intense competitive pressure and rapidly changing market dynamics, driven bysuch factors as changes in the economy, government regulations, globalization, virtualization and othertechnology innovations. In response to these challenges, many companies are focused on improving efficiencies,enhancing effectiveness and driving innovation to favorably impact both the bottom-line and the top-line. Inorder to achieve these goals, companies are focusing on a number of services, such as:
• Business and Information Technology, or IT, alignment;
• IT application and infrastructure optimization;
• Business and Knowledge Process effectiveness and efficiency;
• Complex custom systems development;
• Data Warehousing, Business Intelligence, or BI and Analytics;
• Enterprise Resource Planning, or ERP;
• Customer Relationship Management, or CRM;
• Supply Chain Management;
• Enterprise 2.0 business models and technology solutions;
• Service-Oriented Architectures, Web 2.0 and Cloud Computing; and
• Engineering and Manufacturing solutions.
These solutions facilitate faster, more responsive and lower-cost business operations. However, theirdevelopment, integration and on-going maintenance present major challenges and require a large number ofhighly-skilled professionals trained in many diverse technologies and specialized industries. In addition,companies also require additional technical resources to maintain, enhance and re-engineer their core legacy ITsystems and to address application maintenance projects. Increasingly, companies are relying on custom ITsolutions providers, such as us, to provide these services.
Additionally, in order to respond effectively to a changing and challenging business environment, ITdepartments of many companies have focused increasingly on improving returns on IT investments, loweringcosts and accelerating the delivery of new systems and solutions. To accomplish these objectives, many ITdepartments have shifted all or a portion of their IT development, integration and maintenance requirements tooutside service providers operating with global delivery models.
1

Global demand for high quality, lower cost IT services from outside providers has created a significantopportunity for IT service providers that can successfully leverage the benefits of, and address the challenges inusing, a global talent pool. The effective use of personnel from across the globe can offer a variety of benefits,including lower costs, faster delivery of new IT solutions and innovations in vertical solutions, processes andtechnologies. Certain countries, particularly India, the Philippines, Singapore and China, have large talent poolsof highly qualified technical professionals who can provide high quality IT and business and knowledge processoutsourcing services at a lower cost. India is a leader in IT services, and is regarded as having one of the largestand highest quality pools of talent in the world. Historically, IT service providers have used offshore labor poolsprimarily to supplement the internal staffing needs of customers. However, evolving customer demands have ledto the increasing acceptance and use of offshore resources for higher value-added services. These servicesinclude application design, development, testing, integration and maintenance, as well as technology consultingand infrastructure management. India’s services and software exports continue to see significant growth.NASSCOM (India’s National Association of Software and Service Companies) reports indicate that India’s ITsoftware and services and business process outsourcing sectors are expected to exceed $87 billion at the end ofNASSCOM’s fiscal year 2012. This is an expected growth rate of approximately 15% over the prior fiscal year.According to the latest NASSCOM “Perspective 2020: Transform Business, Transform India” report, globalchanges and new megatrends within economic, demographic, business, social and environmental areas are set toexpand the outsourcing industry by creating new dynamics and opportunities, and are expected to result in exportrevenues of approximately $175 billion by 2020.
Using a globally distributed workforce to provide value-added services presents a number of challenges toIT services and BPO/KPO providers. The offshore implementation of value-added IT services requires that ITservice providers continually and effectively attract, train and retain highly-skilled software developmentprofessionals with advanced technical and industry skills necessary to keep pace with continuing changes ininformation technology, evolving industry standards and changing customer preferences. These skills arenecessary to design, develop and deploy high-quality technology solutions in a cost-effective and timely manner.In addition, IT service providers must have the methodologies, processes and communications capabilities toenable offshore workforces to be successfully integrated with on-site personnel. Service providers must also havestrong research and development capabilities, technology competency centers and relationship management skillsin order to compete effectively.
The Cognizant Approach
Our business is organized and managed primarily around our four vertically-oriented business segments:
• Financial Services;
• Healthcare;
• Manufacturing, Retail and Logistics; and
• Other, which includes Communications, Information, Media and Entertainment, and High Technology.
This vertical focus has been central to our revenue growth and high customer satisfaction. As the IT servicesindustry continues to mature, clients are looking for service providers who understand their businesses, industryinitiatives, cultures and have solutions tailored to meet their individual business needs. We continue to hireexperts out of industry, establish a broad base of business analysts and consultants, invest in industry training forour staff, and build out industry-specific services and solutions. This approach is central to our high-levels ofon-time delivery and customer satisfaction, as we understand the full context of our clients’ challenges and havedeep experience in addressing them.
2

Our key service areas, IT Consulting and Technology Services and Outsourcing Services are delivered toour clients across our four business segments in a standardized, high-quality manner through a global deliverymodel. These service areas include:
• IT Consulting and Technology Services
• Business and Knowledge Process Consulting;
• IT Strategy Consulting;
• Program Management Consulting;
• Technology Consulting;
• Application Design, Development, Integration and Re-engineering, such as:
• Complex Custom Systems Development;
• Data Warehousing / Business Intelligence, or BI;
• Customer Relationship Management, or CRM, System implementation; and
• Enterprise Resource Planning, or ERP, System implementation; and
• Software Testing Services.
• Outsourcing Services
• Application Maintenance, such as:
• Custom Application Maintenance; and
• CRM and ERP Maintenance;
• IT Infrastructure Outsourcing; and
• Business and Knowledge Process Outsourcing, or BPO and KPO.
Business Segments
We are organized around our four vertically–oriented business segments, and we report the operations ofour business as follows:
Financial Services Healthcare Manufacturing/Retail/Logistics Other
BankingInsurance
HealthcareLife Sciences
Manufacturing and LogisticsRetail, Travel and HospitalityConsumer Goods
CommunicationsInformation, Media andEntertainmentHigh Technology
Financial Services
In 2011, our Financial Services business segment represented approximately 41.1% of our total revenues.Revenues from our Financial Services business segment were $2,518.4 million, $1,944.5 million, and $1,406.6million for the years ended December 31, 2011, 2010, and 2009, respectively. This business segment providesservices to our customers operating in the following industries:
• Banking. We focus on traditional retail and commercial banks, and diversified financial enterprises. Weassist these clients in such areas as: Consumer Lending, Cards and Payments, Wholesale Banking, RiskManagement, Investment Banking and Brokerage, Asset and Wealth Management, Corporate Servicesand Retail Banking. We also focus on the needs of broker / dealers, asset management firms,depositories, clearing organizations and exchanges. Key areas where we help these clients in bothdriving efficiencies and establishing new capabilities include: Front Office, Middle Office, BackOffice, Sales and Brokerage, Research, Exchange Operations and Prime Brokerage solutions.
3

• Insurance. We assist with the needs of property and casualty insurers, life insurers, reinsurance firmsand insurance brokers. We focus on such areas as: Business Acquisition, Policy Administration, ClaimsProcessing, Management Reporting, Regulatory Compliance and Reinsurance.
Healthcare
In 2011, our Healthcare business segment represented approximately 26.5% of our total revenues. Revenuesfrom our Healthcare business segment were $1,622.2 million, $1,177.1 million, and $860.4 million for the yearsended December 31, 2011, 2010, and 2009, respectively. This business segment provides services to ourcustomers operating in the following industries:
• Healthcare. We work with many leading healthcare organizations, including leading healthcareorganizations in the United States. Our Healthcare service teams focus on the following key industrysolutions: Broker Compensation, Sales and Underwriting Systems, Provider Management, PlanSponsor Administration, Electronic Enrollment, Membership, Billing, Claims Processing, MedicalManagement and Pharmacy Benefit Management. We are also partnering with our customers to enabletheir IT systems to deal with initiatives such as self service portals (member / provider / broker),consumer-driven healthcare, behavioral health, regulatory compliance, Medicare Modernization Act, orMMA, and healthcare data warehousing and analytics.
• Life Sciences. We partner with the leading organizations in the Life Sciences industry to assist themwith the opportunities and challenges of their rapidly evolving market. We work with many of theworld’s leading pharmaceutical and biotechnology companies and medical device companies. We areassisting these companies in dealing with such challenges as: Consolidation, Data Integration, Time toMarket, Safety, Globalization and Regulations. Some of our Life Sciences solutions include: PrescriberBehavior Analysis and Insight, Longitudinal Prescription Data Management Systems, Sales ForceCompensation Systems, Sales Data and Claims Data Management Systems, Clinical Trial Solutions,21CFR11 Assessment and Computer Systems Validation, Data Mining and Business IntelligenceSolutions, e-Business and Data Portals, and ERP implementation, upgrade, and maintenance services.
Manufacturing/Retail/Logistics
In 2011, our Manufacturing, Retail and Logistics business segment represented approximately 19.6% of ourtotal revenues. Revenues from our Manufacturing/Retail/Logistics business segment were $1,197.5 million,$849.6 million, and $564.9 million for the years ended December 31, 2011, 2010, and 2009, respectively. Thisbusiness segment services customers in the following industry groups:
• Manufacturing and Logistics. We help organizations improve operational efficiencies, enhanceresponsiveness and collaborate with trading partners to better serve their end customers. We leverage acomprehensive understanding of the business and technology drivers of the industry. Some of ourManufacturing and Logistics solutions include: Supply Chain Management, Warehouse and YardManagement, Waste Management, Transportation Management, Optimization, Portals and ERPsolutions.
• Retail, Travel and Hospitality. We serve a wide spectrum of retailers and distributors, includingsupermarkets, specialty premium retailers, department stores and large mass-merchandise discounters.We deliver the best of both worlds: in-depth experience with retailing applications and a strongenterprise architecture foundation. We also serve the entire travel and hospitality industry includingairlines, hotels and restaurants, as well as online and retail travel, global distribution systems andintermediaries and real estate companies. Several of the services we provide for retail and hospitalitycustomers are as follows:
• Upgrade supply chain systems, ranging from order management to category and spacemanagement, warehouse management, logistics management, pricing and promotions, andmerchandising management;
4

• Implement new point of sale solutions that embrace new international standards and provide newflexibility for supporting new merchandising initiatives;
• Implement point solutions developed by our Retail Center of Excellence. The Center ofExcellence has built solution accelerators and defined implementation methodologies for multi-channel integration, and for Point of Sale systems migration;
• Accelerate the implementation of enterprise and customer relationship management;
• Improve business intelligence effectiveness;
• We leverage our experience in a number of key functional areas such as loyalty programs,technical operations, and inventory distribution, channel management, brand portal development,outlet service desk and store accounting;
• Our technical and functional consultants provide in-depth knowledge of industry applications andstandards; and
• We also provide BPO services to restaurants, hotels and airlines.
• Consumer Goods.We work with the world’s premier consumer goods manufacturers, creatinginnovative solutions and strategies that keep them price-competitive, category-leading and consumer-savvy. Our expertise spans a wide gamut, from demand-driven supply chains, to revenue-creating tradepromotion management systems, to analytics systems and mobility solutions that anticipate and serveever-changing customer needs.
Other
In 2011, our Other business segment represented approximately 12.8% of our total revenues. Revenues fromour Other business segment were $783.1 million, $621.2 million, and $446.7 million for the years endedDecember 31, 2011, 2010, and 2009, respectively. The Other business segment is an aggregation of operatingsegments which, individually, are less than 10.0% of consolidated revenues and segment operating profit. TheOther business segment includes Communications, Information, Media and Entertainment, and High Technologyoperating segments. A description of operating segments included in Other is as follows:
• Communications. Our Communications industry practice serves some of the world’s leadingcommunications service providers, equipment vendors and software vendors. We have severalindustry-specific solutions, including: Operational Support Systems/Business Support Systems, orOSS/BSS, Implementation, Network Management Services, Mobile Applications, ConformanceTesting, Product Lifecycle Management, Product Implementation, Portals, Business ActivityMonitoring, Mobile Systems Integration, Broadband Evolution Services and Billing Quality Assurance.
• Information, Media and Entertainment. We have an extensive track record of working with some of theworld’s largest media and entertainment companies. With the emergence of digital technologiespromising to revolutionize the business, we offer consulting and outsourcing services to help media andentertainment companies concentrate on their end product. Some of our solutions include:
• Supply chain management solutions, from pre-press to material procurement, circulation,logistics, and vendor management;
• Business solutions covering advertising management, online media, and e-business;
• Workflow automation covering the product development process for broadcasters;
• Spot ad buying systems covering agency of record, traffic management, post-buy analysis, andfinancial management;
• Digital Asset Management, or DAM and Digital Rights Management, or DRM; and
• Operational systems including ad sales, studio management, outsourcing billing and payments,along with content management and delivery.
5

• High Technology. We serve some of the world’s leading Independent Software Vendors, or ISVs, andOnline Service Providers. We believe that the needs of technology companies are different—moretechnically complex, challenging and advanced than what is typically found in other industries.Catering to these needs, our High Technology practice assists with the unique needs of these clients inareas such as: Product Development, Product Sustenance, Compatibility Testing, Internationalization,Product Re-engineering, Multiple Channel Extension, Security Testing and Content Management.
Our Solution and Services
We believe that we have developed an effective integrated global delivery business model and this businessmodel is expected to be a critical element of our continued growth. To support this business model, atDecember 31, 2011, we employed approximately 137,700 professionals and support staff globally. We also haveestablished facilities and technology and communication infrastructures to support our business model.
Across each of our business segments, we provide a broad and expanding range of consulting, informationtechnology and outsourcing services, including:
Consulting and Technology Services
• IT Consulting. Our consulting division, Cognizant Business Consulting, focuses on helping clientsderive greater value at the intersection of their business initiatives and IT requirements. Our consultingofferings are based on rigorous and proven methodologies and scientifically driven frameworks. In theareas of business processes, technologies and offshoring, we analyze the existing environment, identifyopportunities for optimization and provide a robust roadmap for significant cost savings andproductivity improvement. The broad areas of coverage include: offshoring strategy, IT strategy,technology rationalization, business process rationalization, change management and IT solutionstrategy.
• Program Management Consulting. We provide a broad range of project delivery services, includingpost-acquisition integration, business and IT integration, business transformation, product/servicelaunch and organization relocation services.
• Application Design, Development, Integration and Re-engineering. We define customer requirements,write specifications and design, develop, test and integrate software across multiple platforms includingInternet technologies. We modify and test applications to enable systems to function in new operatingenvironments. In addition, these services include Data Warehousing / Business Intelligence, ERP andCRM implementation services. We follow either one of two alternative approaches to applicationdevelopment and integration:
• full life-cycle application development, in which we assume start-to-finish responsibility foranalysis, design, implementation, testing and integration of systems; or
• cooperative development, in which our employees work with a customer’s in-house IT personnelto jointly analyze, design, implement, test and integrate new systems.
In both of these approaches, our on-site team members work closely and collaboratively with ourclients. Detailed design, implementation and testing are generally performed at dedicated near-shoreand offshore development and delivery centers located primarily in India, China, the United States,Canada, Argentina, Hungary and the Philippines. In addition, we maintain an on-site presence at eachcustomer location in order to address evolving customer needs and resulting changes to the project.
A key part of our application development and integration offering is a suite of services to helporganizations build and integrate business applications with the rest of their operations. In this suite ofservices, we leverage our skills in business application development and enterprise applicationintegration to build sophisticated business applications and to integrate these new applications and
6
websites with client server and legacy systems. We build and deploy robust, scalable and extensiblearchitectures for use in a wide range of industries. We maintain competency centers specializing invarious areas such as: Microsoft solutions; IBM, SAP, Oracle and JAVA applications; and CloudComputing and Mobile solutions. These competency centers enable us to provide applicationdevelopment and integration services to a broad spectrum of customers.
Our re-engineering service offerings assist customers migrating from systems based on legacycomputing environments to newer standards-based distribution architectures, often in response to themore stringent demands of business. Our re-engineering tools automate many of the processes requiredto implement advanced technology platforms. We believe that this automation substantially reduces thetime and cost to perform re-engineering services, savings that benefit both our customers and us. Thesetools also enable us to perform source code analysis and to re-design target databases and convertcertain programming languages. If necessary, our programmers also help customers re-design andconvert user interfaces.
• Software Testing. Our Software Testing service offering has experienced significant growth in the pastseveral years. Through this practice, we provide an independent verification and validation servicefocused exclusively on supporting the software testing needs of our clients. Our testing service has fourkey offerings: 1) Independent Functional Testing; 2) Test Automation; 3) Test Process Consulting; and4) Performance Testing. We utilize our own Managed Test Center process model to ensure our clientsreceive the highest quality code possible after it has been tested by us. We focus our Managed TestCenters on specific domains (e.g., specific industries and software solutions), ensuring we tailor ourtesting solutions to the particular needs of our clients.
Outsourcing Services
• Application Maintenance. Our Application Maintenance Service offering supports some or all of acustomer’s applications ensuring that systems remain operational and responsive to changing userrequirements and provide on-going enhancements as required by the customer.
We provide services to help ensure that a customer’s core operational systems are free of defects andresponsive to the customer’s changing needs. As part of this process, we are often able to introduceproduct and process enhancements and improve service levels to customers requesting modificationsand on-going support.
Our global delivery business model enables us to provide a range of rapid response and cost-effectivesupport services to our customers. Our on-site team members often provide help-desk services at thecustomer’s facility. These team members typically are available in the event of an emergency servicerequest and are able to quickly resolve customer problems from remote locations. In the case of morecomplex maintenance services, including modifications, enhancements and documentation, whichtypically have longer turnaround times, we take full advantage of our offshore resources to developsolutions more cost-effectively than would be possible relying on higher cost local professionals. Theservices provided by our offshore team members are delivered to customers using satellite and fiber-optic communications.
As part of our Application Maintenance services, we assist customers in renovating their core systemsto meet the requirements imposed by new regulations, new standards or other external events. Theseservices include, or have previously included, Year 2000 compliance, Eurocurrency compliance,decimalization within the securities industry and compliance with the Health Insurance Portability andAccountability Act for the healthcare industry.
We seek to anticipate the operational environment of our customers’ IT systems as we design anddevelop such systems. We also offer diagnostic services to customers to assist them in identifyingshortcomings in their IT systems and optimizing the performance of their systems.
7
• IT Infrastructure Services. We provide IT Infrastructure Management Outsourcing services and weanticipate growing demand for these services in the coming years. We provide service capability inredundant Network Operating Centers, or NOCs, in North America and India through which we areable to provide significant scale, quality and cost savings to our clients in IT Infrastructure Services.We focus on a number of key areas of infrastructure management such as: Networks, Servers,Middleware, Security, Vendors, Storage, Messaging, Databases, and Desktops. We can provide thesethrough an IT Service Desk model, focusing on such areas as IT Operations and IT Help Desk.
• Business and Knowledge Process Outsourcing, or BPO and KPO.We provide BPO and KPO servicesto our clients across industries of our specialization. At Cognizant, we are primarily focused on value-added processes that are specific to clients in our key industry segments (particularly in FinancialServices, Healthcare and Manufacturing / Retail / Logistics and Communications). Our BPO/KPOpractice focuses on core back office services covering: Transaction Processing, Accounting Operations,Voice Processes, Data Administration, Data Management and Data Analytics.
In addition to our industry-specific expertise and focus, our strengths, which we believe differentiate us fromother IT service providers, include the following:
Established and Scalable Proprietary Processes: We have a comprehensive process framework thataddresses the entire software engineering life cycle and support activities which are scalable for projects ofdifferent sizes and complexities. This proprietary framework, which we refer to as “Process Space” (part ofCognizant 2.0), is supported by in-house project management, metrics management and workflow tools and isavailable to all of our programmers globally. Process Space has evolved since its original release in 1996 inbreadth, depth and maturity, based on the implementation feedback from projects and findings of internal qualityaudits and external assessments. Process capabilities are monitored at the sub-process level and performancetargets are monitored at the process level, which are aligned with the overall business objectives. Statisticalprocess controls are used extensively to continuously monitor, predict and improve performance. Our DeliveryAssurance group facilitates process implementation from the project inception and audits the projectsperiodically to ensure that the implementation is effective and the risks are being managed.
Our process framework complies with the requirements of ISO 9001, TL 9000 for Telecom projects, andISO 20000 for Infrastructure projects. Our delivery processes, support processes and their implementation areformally certified by Det Norske Veritas, or DNV, in the above mentioned standards. KPMG appraises ourenterprise-wide operations to be at Capability Maturity Model Integration, or CMMI, at a Level 5, which is thehighest possible maturity level rating, of the CMMI v1.2, of the Software Engineering Institute at CarnegieMellon University. Our BPO service offering is assessed at eSCM Maturity Level 4 which is the highest possiblerating for the first attempt of the e-Sourcing Capability Model of IT Services Qualification Center at CarnegieMellon University. Finally, all of our principal development centers have been certified by the STQC DirectorateMinistry of Communications and Information Technology, Government of India (the accreditation authority forcompanies in India) under the internationally recognized ISO 27001 (previously BS 7799-2) InformationSecurity Standards, a comprehensive set of controls comprising best practices in information security andbusiness continuity planning. We have implemented the above process framework enterprise-wide to ensure thatwe consistently deliver high quality of products and services to our clients from all global operations. We haveinvested considerably in automation to improve process institutionalization across the organization. For example,we have created and rolled out “Cognizant 2.0” an intelligent delivery ecosystem which orchestrates processes,methodologies, best practices driving effective usage of knowledge as well as providing a collaborativeframework for our world-wide associates. Cognizant 2.0 offers a unique blend of collaboration, processmanagement and just-in-time management.
Our process framework has been extensively adapted to cater to different types of projects managed by theorganization across different service lines, such as Application Development, Managed Services, ApplicationTesting, BPO and IT Infrastructure Management. In our goal of achieving the highest level of DeliveryExcellence, we are also driving an initiative called Best-In-Class framework throughout the organization.
8

Highly-Skilled Workforce. Our managers and senior technical personnel provide in-depth projectmanagement expertise to customers. To maintain this level of expertise, we place significant emphasis onrecruiting and training our workforce of highly-skilled professionals. We have approximately 16,200 projectmanagers and senior technical personnel around the world, many of whom have significant work experience inNorth America, Europe and Asia. We also maintain programs and personnel to hire and train the best availabletechnical professionals in both legacy systems and emerging technologies. We provide extensive combinedclassroom and on-the-job training to newly hired technical staff, as well as additional annual training programsdesigned to enhance the business practices, tools, technology and consulting skills of our professional staff. Wewere assessed by KPMG at Level 5 (the highest possible rating) of the People Capability Maturity Model, orP-CMM, of the Software Engineering Institute at Carnegie Mellon University. This widely recognized means ofimplementing current best practices in fields such as human resources, knowledge management andorganizational development help improve our processes for managing and developing our workforce andaddressing critical people issues.
Research and Development and Competency Centers. We have project experience and expertise acrossmultiple architectures and technologies, and have made significant investments in our competency centers and inresearch and development to keep abreast of the latest technology developments. Most of our technical staff aretrained in multiple technologies and architectures. As a result, we are able to react to customers’ needs quicklyand efficiently redeploy our technical staff to different technologies. Also, to develop and maintain thisflexibility, we have made a substantial investment in our competency centers so that the experience gained fromparticular projects and research and development efforts is leveraged across our entire organization. In addition,through our investment in research and development activities and the continuing education of our technicalpersonnel, we enlarge our knowledge base and develop the necessary skills to keep pace with emergingtechnologies. We believe that our ability to work in new technologies allows us to foster long-term relationshipsby having the capacity to continually address the needs of both existing and new customers.
Well-Developed Infrastructure. Our extensive facilities, technology and communications infrastructurefacilitate the seamless integration of our global workforces. This is accomplished by permitting team members indifferent locations to access common project information and to work directly on customer projects. Thisinfrastructure allows for:
• rapid completion of projects;
• highest level of quality;
• off-peak use of customers’ technological resources; and
• real-time access to project information by the on-site account manager or the customer.
International time differences enable our offshore teams to access a customer’s computing facilities located inNorth America, Europe, the Asia Pacific region and other countries in which we provide services during off-peakhours. This ability to perform services during off-peak hours enables us to complete projects more rapidly and doesnot require our customers to invest in duplicative hardware and software. In addition, for large projects with shorttime frames, our offshore facilities allow for parallel processing of various development phases to acceleratedelivery time. In addition, we can deliver services more rapidly than some competitors without an offshore laborpool because our lower labor costs enable us to cost-effectively assign more professionals to a project.
Business Strategies
Our objectives are to maximize stockholder value and enhance our position as a leading provider of custominformation technology, consulting and business process outsourcing services. We implement the following corestrategies to achieve these objectives:
Expand Service Offerings and Solutions. We have several teams dedicated to creating technology-basedinnovative solutions and developing new, high value services. The teams collaborate with customers to develop
9

these services. For example, we are currently developing new offerings in Business and IT Consulting andvertically-oriented IT solutions atop innovative technologies such as: Service Oriented Architectures, or SOA,and Web 2.0. We invest in internal research and development and promote knowledge building and sharingacross the organization to advance the development of new services and solutions. Furthermore, we continue toenhance our capabilities and service offerings in the areas of:
• Customer Relationship Management, or CRM;
• Enterprise Resource Planning, or ERP;
• Data Warehousing / Business Intelligence, or BI;
• Software Testing;
• Infrastructure Management; and
• Vertically-Oriented Business and Knowledge Process Outsourcing, or BPO and KPO.
We believe that the continued expansion of our service offerings will reduce our reliance on any onetechnology initiative and may help foster long-term relationships with our customers by allowing us to betterserve their needs. Among service offerings, Infrastructure Management and Vertically-Oriented Business andKnowledge Process Outsourcing have been among the key drivers of growth.
As part of our vision to preserve our growth and to stay ahead of our clients’ and the markets’ rapidlychanging demands in the near-term, mid-term and long-term, we are investing in emerging opportunities whichseek to transform client and user platforms to internet, cloud and mobile based experiences.
Further Develop Long-Term Customer Relationships. We have strong long-term strategic relationships withour customers and business partners. We seek to establish long-term relationships that present recurring revenueopportunities, frequently trying to establish relationships with our customers’ chief information officers, or otherIT and business decision makers, by offering a wide array of cost-effective high quality services. Approximately97% of our revenues for the year ended December 31, 2011 were derived from customers who had been usingour services at the end of 2010. We also seek to leverage our experience with a customer’s IT systems into newbusiness opportunities. Knowledge of a customer’s processes and IT systems gained during the performance ofapplication maintenance services, for example, may provide us with a competitive advantage in securingadditional maintenance, development and other projects from that customer.
Enhance Processes, Methodologies and Productivity Toolsets. With the globalization of business, we arecommitted to improving and enhancing our proprietary Process Space software engineering process and othermethodologies and toolsets. In light of the rapid evolution of technology, we believe that continued investment inresearch and development is critical to our continued success. We are constantly designing and developingadditional productivity software tools to automate testing processes and improve project estimation and riskassessment techniques. For example, we have created and rolled out “Cognizant 2.0” which uses groupwaretechnology based on Web 2.0 technologies, enabling Cognizant associates to share project experiences and bestpractice methodologies across the organization with the objective of improving productivity.
Expand Domestic and International Geographic Presence. As we expand our customer base, we plan toopen additional sales and marketing offices in North America, Europe, Latin America, Asia, and the Middle East.This expansion is expected to facilitate sales and services to existing and new customers. We have establishedsales and marketing offices in various metropolitan areas both in the United States and internationally.
Continue to be an Employer of Choice in the Industry. As a rapidly growing professional services firm, akey attribute of our continued success is the ability to continually hire, assimilate, motivate and retain the besttalent possible in the industry. We have developed strong relationships with key universities around the world,particularly in India, to provide a continual funnel of talented staff from Tier One schools. In addition, we
10

continue to expand our presence and brand in our key supply markets, further enhancing our ability to hireexperienced professionals from competing IT services firms and industry to support our client needs and growth.We invest heavily in training programs (centered around Cognizant Academy), motivational programs and careerdevelopment to ensure personal professional growth for each of our associates.
Pursue Selective Strategic Acquisitions, Joint Ventures and Strategic Alliances. We believe thatopportunities exist in the fragmented market in which we operate to expand our business through selectivestrategic acquisitions, joint ventures and strategic alliances. We believe that acquisition and joint venturecandidates may enable us to expand our geographic presence and our capabilities more rapidly, especially ingeographic markets and key industries. For example, in 2011, we completed two acquisitions to strengthen ourbusiness process and analytics solution offerings and enhance our retail SAP capabilities. In addition, throughour working relationships with independent software vendors we obtain projects using the detailed knowledge wegain in connection with a joint development process. Finally, we expect to continue to form strategic allianceswith select IT service firms that offer complementary services to best meet the requirements of our customers.
Sales and Marketing
We market and sell our services directly through our professional staff, senior management and direct salespersonnel operating out of our Teaneck, New Jersey headquarters and our business development offices whichare strategically located in various metropolitan areas around the world. The sales and marketing group workswith our technical team as the sales process moves closer to the customer’s selection of a services provider. Theduration of the sales process varies depending on the type of service, ranging from approximately two months toover one year. The account manager or sales executive works with the technical team to:
• define the scope, deliverables, assumptions and execution strategies for a proposed project;
• develop project estimates;
• prepare pricing and margin analyses; and
• finalize sales proposals.
Management reviews and approves proposals, which are then presented to the prospective customer. Oursales and account management personnel remain actively involved in the project through the execution phase.We focus our marketing efforts on businesses with intensive information processing needs. We maintain aprospect/customer database that is continuously updated and used throughout the sales cycle from prospectqualification to close. As a result of this marketing system, we pre-qualify sales opportunities, and direct salesrepresentatives are able to minimize the time spent on prospect qualification. In addition, substantial emphasis isplaced on customer retention and expansion of services provided to existing customers. In this regard, ouraccount managers play an important marketing role by leveraging their ongoing relationship with the customer toidentify opportunities to expand and diversify the type of services provided to that customer.
Customers
The number of customers served by us has increased significantly in recent years. As of December 31, 2011,we were providing services to approximately 785 customers, as compared to approximately 712 customers as ofDecember 31, 2010, and approximately 589 customers as of December 31, 2009. As of December 31, 2011, weincreased the number of strategic clients to 191. We define a strategic client as one offering the potential togenerate at least $5 million to $50 million or more in annual revenues at maturity. Accordingly, we provide asignificant volume of services to many customers in each of our business segments. Therefore, a loss of asignificant customer or a few significant customers in a particular segment could materially reduce revenues forsuch segment. However, no individual customer exceeded 10.0% of our consolidated revenues for the yearsended December 31, 2011, 2010, and 2009. In addition, the services we provide to our larger customers are oftencritical to the operations of such customers and a termination of our services generally would require an extendedtransition period with gradual declining revenues. For the years ended December 31, 2011, 2010, and 2009,78.5%, 78.0%, and 79.1% of our revenue, respectively, was from North American customers.
11

For the year ended December 31, 2011, we derived our revenues from the following business segments:41.1% from Financial Services, 26.5% from Healthcare, 19.6% from Manufacturing/Retail/Logistics and 12.8%from Other.
We provide services either on a time-and-material basis or on a fixed price basis. The volume of workperformed for specific customers is likely to vary from year to year, and a significant customer in one year maynot use our services in a subsequent year. Presented in the table below is additional information about ourcustomers.
Year Ended December 31,
2011 2010 2009
Revenues from top five customers as a percentage of total revenues . . . . . . . . 16.3% 17.9% 17.4%Revenues from top ten customers as a percentage of total revenues . . . . . . . . 27.7% 30.3% 29.4%Revenues under fixed-bid contracts as a percentage of total revenues . . . . . . . 31.7% 31.5% 30.3%
Competition
The intensely competitive IT services and outsourcing market includes a large number of participants and issubject to rapid change. This market includes participants from a variety of market segments, including:
• systems integration firms;
• contract programming companies;
• application software companies;
• traditional large consulting firms;
• the professional services groups of computer equipment companies; and
• facilities management and outsourcing companies.
Our direct competitors include, among others, Accenture, Capgemini, Computer Sciences Corporation, HCLTechnologies, HP Enterprise (formerly Electronic Data Systems), IBM Global Services, Infosys Technologies,Perot Systems (acquired by Dell Inc.), Tata Consultancy Services and Wipro. In addition, we compete withnumerous smaller local companies in the various geographic markets in which we operate.
Many of our competitors have significantly greater financial, technical and marketing resources and greatername recognition. The principal competitive factors affecting the markets for our services include:
• performance and reliability;
• quality of technical support, training and services;
• responsiveness to customer needs;
• reputation and experience;
• financial stability and strong corporate governance; and
• competitive pricing of services.
We rely on the following to compete effectively:
• a well-developed recruiting, training and retention model;
• a successful service delivery model;
12
• a broad referral base;
• continual investment in process improvement and knowledge capture;
• investment in infrastructure and research and development;
• financial stability and strong corporate governance;
• continued focus on responsiveness to customer needs, quality of services, competitive prices; and
• project management capabilities and technical expertise.
Intellectual Property
Our intellectual property rights are important to our business. We presently hold no patents or registeredcopyrights. Instead, we rely on a combination of intellectual property laws, trade secrets, confidentialityprocedures and contractual provisions to protect our intellectual property. We require our employees,independent contractors, vendors and customers to enter into written confidentiality agreements upon thecommencement of their relationships with us. These agreements generally provide that any confidential orproprietary information disclosed or otherwise made available by us be kept confidential. In addition, wegenerally require third parties to sign confidentiality agreements before we disclose our confidential orproprietary information to them.
A portion of our business involves the development for customers of highly complex informationtechnology applications and other technology deliverables. This intellectual property includes writtenspecifications and documentation created in connection with specific customer engagements. Our customersusually own the intellectual property rights in the software and other technology deliverables we create for themon a custom development basis.
On July 1,1998, Nielsen Media Research, Inc., the successor in interest to Cognizant Corporation, assignedall of its right, title and interest in and to the marks COGNIZANT and C & Design to Cognizant TechnologySolutions Corporation. On February 6, 2003, Cognizant Technology Solutions Corporation assigned certain of itsassets, including all of its intangible assets, to Cognizant Technology Solutions U.S. Corporation. As ofDecember 31, 2011, Cognizant Technology Solutions U.S. Corporation or its predecessors is the record ownerof:
(a) two registrations for COGNIZANT, one registration for C & Design, one registration for MANAGEDTEST CENTER, one registration for TWO-IN-A-BOX, one registration for MDM EXPRESS, oneregistration for MDM-IN-A-BOX, one registration for GOVERNANCE-IN-A-BOX, one registrationfor GOVERNANCE-IN-A-BOX & DESIGN, one registration for STRATEGIC VISIONCONSULTING, one registration for SV (Stylized), one registration for ICOMP, one registration forIPLEX, one registration for MARKETRX, one registration for IOPTIMA, one registration forIDETAILING, one registration for IFOLIO, one registration for IFORCE, one registration forSURVEYRX, one registration for TRANSFORMINGWHILE PERFORMING and two registrationsfor TRANSFORMWHILE PERFORM; as well as four pending applications for, PLANFORCE,INTELLISTORE, THE INTELLIGENT STORE and CLOUD360 in the United States;
(b) two registrations for COGNIZANT, two registrations for C & Design, one registration forTWO-IN-A-BOX, one registration for THREE-IN-A-BOX, one application for COGNIZANT, oneapplication for C & Design, one application for INTELLISTORE and one application for THEINTELLIGENT STORE in India;
(c) a registration for COGNIZANT in Spain;
(d) one registration for each COGNIZANT and C & Design, one registration for MDM EXPRESS and oneregistration for MDM-IN-A-BOX, one registration for GOVERNANCE-IN-A-BOX & DESIGN, oneregistration for THREE-IN-A-BOX, one registration for TWO-IN-A-BOX, one registration for
13

INTEGRATED REPORTING IN THE CLOUD, one registration for THE FUTURE OF WORK, oneregistration for CLOUD360, one registration for MARKETRX, one registration for SURVEYRX, oneregistration for ICOMP, and one registration for IPLEX in the European Union; and
(e) six registrations and one application for COGNIZANT and three registrations and one applications forC & Design in Malaysia. In addition, as of December 31, 2011, Cognizant Technology Solutions U.S.Corporation, or its predecessors, is the record owner of a total of 294 trademark registrations in60 countries.
In addition, as of December 31, 2011, Cognizant Technology Solutions U.S. Corporation, or itspredecessors, is the record owner of a total of 294 trademark registrations in 60 countries.
Employees
We finished the year 2011 with headcount of approximately 137,700. We employed approximately111,600 persons in the Asia Pacific region, approximately 21,800 persons in various locations throughout NorthAmerica and Latin America and over 4,300 persons in various locations throughout Europe, principally in theUnited Kingdom. We are not party to any significant collective bargaining agreements. We consider our relationswith our employees to be good.
Our future success depends to a significant extent on our ability to attract, train and retain highly-skilled ITdevelopment and other professionals. In particular, we need to attract, train and retain project managers,programmers and other senior technical personnel. We believe there is a shortage of, and significant competitionfor, IT development professionals in the United States, Europe and in India with the advanced technologicalskills necessary to perform the services we offer. We have an active recruitment program in India, and havedeveloped a recruiting system and database that facilitates the rapid identification of skilled candidates. Duringthe course of the year, we conduct extensive recruiting efforts at premier colleges and technical schools in India.We evaluate candidates based on academic performance, the results of a written aptitude test measuring problem-solving skills and a technical interview. In addition, we have an active lateral recruiting program in NorthAmerica, Europe and India and have established an on-campus recruiting program in North America. Asubstantial majority of the personnel on most on-site teams and virtually all the personnel staffed on offshoreteams is comprised of Indian nationals.
Our senior project managers are hired from leading consulting firms in the United States, Europe and India.Our senior management and most of our project managers have experience working in the United States andEurope. This enhances our ability to attract and retain other professionals with experience in the United Statesand Europe. We have also adopted a career and education management program to define our employees’objectives and career plans. We have implemented an intensive orientation and training program to introducenew employees to the Process Space software engineering process, our other technologies and our services.
14

Our Executive Officers
The following table identifies our current executive officers:
Name Age Capacities in Which ServedIn Current
Position Since
Lakshmi Narayanan(1) . . . . . . . . . . . . . . . . . . . 58 Vice Chairman of the Board of Directors 2007Francisco D’Souza(2) . . . . . . . . . . . . . . . . . . . . 43 Chief Executive Officer 2007Gordon Coburn(3) . . . . . . . . . . . . . . . . . . . . . . . 48 President 2012Karen McLoughlin(4) . . . . . . . . . . . . . . . . . . . . 47 Chief Financial Officer 2012Ramakrishnan Chandrasekaran(5) . . . . . . . . . . 54 Group Chief Executive – Technology and
Operations 2012Rajeev Mehta(6) . . . . . . . . . . . . . . . . . . . . . . . . 45 Group Chief Executive – Industries and
Markets 2012Malcolm Frank(7) . . . . . . . . . . . . . . . . . . . . . . . 45 Executive Vice President, Strategy and
Marketing 2012Steven Schwartz(8) . . . . . . . . . . . . . . . . . . . . . . 44 Senior Vice President, General Counsel and
Secretary 2007
(1) Lakshmi Narayanan was appointed Vice Chairman of the Board of Directors, effective January 1, 2007.Mr. Narayanan served as our Chief Executive Officer from December 2003 through December 2006 and asour President from March 1998 through December 2006. Mr. Narayanan joined our Indian subsidiary asChief Technology Officer in 1994 and was elected President of such subsidiary on January 1, 1996. Prior tojoining us, from 1975 to 1994, Mr. Narayanan was the regional head of Tata Consultancy Services, a largeconsulting and software services company located in India. Mr. Narayanan serves on the board of directorsand as the Chairman of the Governance Committee of TVS Capital Funds Limited. Mr. Narayanan holds aBachelor of Science degree, a Master of Science degree and a Management degree from the Indian Instituteof Science.
(2) Francisco D’Souza was appointed President and Chief Executive Officer and became a member of theBoard of Directors, effective January 1, 2007. Effective February 6, 2012, Mr. D’Souza ceased serving asour President, at which time Mr. Coburn was appointed to such position. Mr. D’Souza served as our ChiefOperating Officer from December 2003 through December 2006. Prior to that, from November 1999 toDecember 2003, he served as our Senior Vice President, North American Operations and BusinessDevelopment. From March 1998 to November 1999, he served as our Vice President, North AmericanOperations and Business Development and as our Director-North American Operations and BusinessDevelopment from June 1997 to March 1998. From January 1996 to June 1997, Mr. D’Souza was engagedas our consultant. From February 1995 to December 1995, Mr. D’Souza was employed as Product Managerat Pilot Software. Between 1992 and 1995, Mr. D’Souza held various marketing, business development andtechnology management positions as a Management Associate at The Dun & Bradstreet Corporation. Whileworking at The Dun & Bradstreet Corporation, Mr. D’Souza was part of the team that established thesoftware development and maintenance business conducted by us. Mr. D’Souza serves on the Board ofTrustees of Carnegie Mellon University, the Board of Trustees of The New York Hall of Science and theBoard of Directors of the U.S.-India Business Council. Mr. D’Souza holds a Bachelor of BusinessAdministration degree from the University of East Asia and a Master of Business Administration degreefrom Carnegie Mellon University.
(3) Gordon Coburn was appointed President of the Company, effective February 6, 2012. From March 1998until February 6, 2012, Mr. Coburn served as the Company’s Chief Financial Officer and Treasurer andfrom January 2007 until February 6, 2012, Mr. Coburn also held the position of Chief Operating Officer.Mr. Coburn also served as the Company’s Executive Vice President from December 2003 throughDecember 2006. From November 1999 to December 2003, he served as our Senior Vice President. Hepreviously was our Vice President from 1996 to November 1999. Mr. Coburn served as Senior Director—Group Finance and Operations for Cognizant Corporation from November 1996 to December 1997. From1990 to October 1996, Mr. Coburn held key financial positions with The Dun & Bradstreet Corporation.
15
Mr. Coburn serves on the board of directors of The Corporate Executive Board Company and TechAmerica.He also served on the board of directors of ICT Group, Inc. until its acquisition on February 2, 2010.Mr. Coburn holds a Bachelor of Arts degree from Wesleyan University and a Master of BusinessAdministration degree from the Amos Tuck School at Dartmouth College.
(4) Karen McLoughlin was appointed Chief Financial Officer of the Company, effective February 6, 2012. Shepreviously served as the Company’s Senior Vice President of Finance and Enterprise Transformation, a roleshe held since January 2010. In such role, Ms. McLoughlin was responsible for the Company’s worldwidefinancial planning and analysis, enterprise risk management and enterprise transformation functions,including the facilitation and execution of various internal reengineering and transformation initiativesdesigned to enable the Company’s strategic vision. From August 2008 to January 2010, Ms. McLoughlinserved as the Company’s Senior Vice President of Finance, responsible for overseeing the Company’sglobal financial planning and analysis team and enterprise risk management, and from October 2003 untilAugust 2008, Ms. McLoughlin served as the Company’s Vice President of Global Financial Planning andAnalysis. Prior to joining Cognizant in October 2003, Ms. McLoughlin held various positions at SpherionCorporation (“Spherion”) from August 1997 to October 2003 and at Ryder System Inc. (“Ryder”) from July1994 to August 1997. At both Spherion and Ryder, Ms. McLoughlin held key financial managementpositions and was involved in strategic planning, the integration of several mergers and acquisitions,financial systems implementations and corporate reorganizations. Prior to joining Ryder, she spent six yearsin the South Florida Practice of Price Waterhouse (now PricewaterhouseCoopers). Ms. McLoughlin has aBachelor of Arts degree in Economics from Wellesley College and a Master of Business Administrationdegree from Columbia University.
(5) Ramakrishnan Chandrasekaran was appointed Group Chief Executive – Technology and Operations,effective February 6, 2012. In this role, Mr. Chandrasekaran is responsible for leading our solutions anddelivery teams world-wide. From August 2006 to February 2012, he served as our President and ManagingDirector, Global Delivery, responsible for leading our global delivery organization, spearheading newsolutions, and championing process improvements. Mr. Chandrasekaran served as our Executive VicePresident and Managing Director from January 2004 through July 2006. Prior to that, from November 1999to January 2004, he served as our Senior Vice President responsible for Independent Software Vendor, orISV, relationships, key alliances, capacity growth, process initiatives, business development and offshoredelivery. Mr. Chandrasekaran joined us as Assistant Vice President in December 1994, before beingpromoted to Vice President in January 1997. Mr. Chandrasekaran has more than 20 years of experienceworking in the IT services industry. Prior to joining us, Mr. Chandrasekaran worked with Tata ConsultancyServices. Mr. Chandrasekaran holds a Mechanical Engineering degree and Master of BusinessAdministration degree from the Indian Institute of Management.
(6) Rajeev Mehta was appointed Group Chief Executive – Industries and Markets, effective February 6, 2012.In this role, Mr. Mehta is responsible for leading our industry vertical and geographic market operations ona global basis. From August 2006 to February 2012, he served as our Chief Operating Officer, Global ClientServices, responsible for our sales, business development and client relationship management organizations.Mr. Mehta, who joined Cognizant in 1997, most recently served as Senior Vice President and GeneralManager of our Financial Services Business Unit, a position he held from June 2005 to August 2006. FromNovember 2001 to June 2005, he served as our Vice President and General Manager of our FinancialServices Business Unit. From January 1998 to November 2001, Mr. Mehta served as our Director of theU.S. Central Region. Mr. Mehta served as our Senior Manager of Business Development from January 1997to January 1998. Prior to joining Cognizant in 1997, Mr. Mehta was involved in implementing GEInformation Services offshore outsourcing program and also held consulting positions at Deloitte & Toucheand Andersen Consulting. Mr. Mehta holds a Bachelor of Science degree from the University of Marylandand a Master of Business Administration degree from Carnegie Mellon University.
(7) Malcolm Frank was appointed Executive Vice President, Strategy and Marketing, effective February 6,2012. In this role, Mr. Frank is responsible for shaping our corporate strategy and global brand in order tomaintain our track record of rapidly growing market and mind share. Mr. Frank served as our Senior VicePresident of Strategy and Marketing from August 2005 to February 2012. In both these roles, Mr. Frank’sresponsibilities have included, and continue to include, directing all aspects of our corporate marketing
16

function, including strategy and branding, industry and media relations, corporate communications andcorporate marketing. In developing strategy, he works closely with our leadership team to formulate andimplement strategies with respect to our services portfolio, vertical industry focus, geographic expansionand competitive differentiation. In addition, Mr. Frank and his team focus on strategies on platforms,capabilities and business models necessary to drive our non-linear growth. From August 2005 until June2009, Mr. Frank was also responsible for leading our field marketing function. Prior to joining Cognizant inAugust 2005, Mr. Frank was co-founder, President and Chief Executive Officer of CXO Systems, Inc., anindependent software vendor providing dashboard solutions for senior managers, from March 2002 to July2005. From June 1999 to September 2002, Mr. Frank was the founder, President, Chief Executive Officerand Chairman of Nervewire Inc. (“Nervewire”), a leading management consulting and systems integrationfirm. Prior to founding Nervewire, Mr. Frank was a co-founder, executive officer, and Senior Vice Presidentat Cambridge Technology Partners, where he ran Worldwide Marketing, Business Development, and severalbusiness units, from January 1990 to June 1999. Mr. Frank graduated from Yale University with a degree inEconomics.
(8) Steven Schwartz was named Senior Vice President, General Counsel and Secretary in July 2007, havingglobal responsibility for managing Cognizant’s legal function. Mr. Schwartz, who joined Cognizant in 2001,most recently served as Vice President and General Counsel, a position he held from March 2003 to July2007. From April 2002 to March 2003, he served as our Vice President and Chief Corporate Counsel. FromOctober 2001 to December 2002, he served as our Chief Corporate Counsel. Mr. Schwartz also serves as ourChief Legal Officer. Mr. Schwartz serves on the board of directors of Information Technology IndustryCouncil and Citizen Schools. Mr. Schwartz holds a Bachelor of Business Administration degree from theUniversity of Miami, a Juris Doctor degree from Fordham University School of Law and a Master of Law(in Taxation) degree from the New York University School of Law.
None of our executive officers are related to any other executive officer or to any of our Directors. Ourexecutive officers are elected annually by the Board of Directors and serve until their successors are duly electedand qualified.
Corporate History
We began our IT development and maintenance services business in early 1994, as an in-house technologydevelopment center for The Dun & Bradstreet Corporation and its operating units. In 1996, we, along withcertain other entities, were spun-off from The Dun & Bradstreet Corporation to form a new company, CognizantCorporation. On June 24, 1998, we completed an initial public offering of our Class A common stock. OnJune 30, 1998, a majority interest in us, and certain other entities were spun-off from Cognizant Corporation toform IMS Health. Subsequently, Cognizant Corporation was renamed Nielsen Media Research, Incorporated.
On January 30, 2003, we filed a tender offer in which IMS Health stockholders could exchange IMS Healthshares held by them for our Class B common stock held by IMS Health. On February 13, 2003, IMS Healthdistributed all of our Class B common stock that IMS Health owned in an exchange offer to its stockholders. OnFebruary 21, 2003, pursuant to the terms of our Restated Certificate of Incorporation, all of the shares of Class Bcommon stock automatically converted into shares of Class A common stock. Since February 21, 2003, therehave been no outstanding shares of Class B common stock. Effective May 26, 2004, pursuant to our Certificateof Incorporation, there are no authorized shares of Class B common stock.
Available Information
We make available the following public filings with the Securities and Exchange Commission, or the SEC,free of charge through our website at www.cognizant.com as soon as reasonably practicable after weelectronically file such material with, or furnish such material to, the SEC:
• our Annual Reports on Form 10-K and any amendments thereto;
17

• our Quarterly Reports on Form 10-Q and any amendments thereto; and
• our Current Reports on Form 8-K and any amendments thereto.
In addition, we make available our code of business conduct and ethics entitled “Cognizant’s Core Valuesand Standards of Business Conduct” free of charge through our website. We intend to disclose any amendmentsto, or waivers from, our code of business conduct and ethics that are required to be publicly disclosed pursuant torules of the SEC and the NASDAQ Global Select Market by filing such amendment or waiver with the SEC andposting it on our website.
No information on our Internet website is incorporated by reference into this Form 10-K or any other publicfiling made by us with the SEC.
18

Item 1A. Risk Factors
In addition to the risks and uncertainties detailed elsewhere in this Annual Report on Form 10-K, if anyof the following risks occur, our business, results of operations and financial condition or prospects could bematerially adversely affected. In such case, the trading price of our common stock could decline.
Our global operations are subject to complex risks, some of which might be beyond our control.
We have offices and operations in various countries around the world and provide services to clientsglobally. In 2011, approximately 78.5% of our revenues were attributable to the North American region, 17.9%were attributable to the European region, and 3.6% were attributable to the rest of the world, primarily the AsiaPacific region. If we are unable to manage the risks of our global operations, including regulatory, economic,political and other uncertainties in India, fluctuations in foreign exchange and inflation rates, internationalhostilities, terrorism, natural disasters, and multiple legal and regulatory systems, our results of operations couldbe adversely affected.
A substantial portion of our assets and operations are located in India and we are subject toregulatory, economic, political and other uncertainties in India.
We intend to continue to develop and expand our offshore facilities in India where a majority of ourtechnical professionals are located. While wage costs are lower in India than in the United States and otherdeveloped countries for comparably skilled professionals, wages in India have historically increased at a fasterrate than in the United States and other countries in which we operate. If this trend continues in the future, itwould result in increased costs for our skilled professionals and thereby potentially reduce our operating margins.Also, there is no assurance that, in future periods, competition for skilled professionals will not drive salarieshigher in India, thereby resulting in increased costs for our technical professionals and reduced operatingmargins.
India has also recently experienced civil unrest and terrorism and has been involved in conflicts withneighboring countries. In recent years, there have been military confrontations between India and Pakistan thathave occurred in the region of Kashmir and along the India-Pakistan border. The potential for hostilities betweenthe two countries has been high in light of tensions related to recent terrorist incidents in India and the unsettlednature of the regional geopolitical environment, including events in and related to Afghanistan and Iraq. If Indiabecomes engaged in armed hostilities, particularly if these hostilities are protracted or involve the threat of or useof weapons of mass destruction, it is likely that our operations would be materially adversely affected. Inaddition, companies may decline to contract with us for services in light of international terrorist incidents orarmed hostilities, even where India is not involved, because of more generalized concerns about relying on aservice provider utilizing international resources that may be viewed as less stable than those provideddomestically.
In the past, the Indian economy has experienced many of the problems that commonly confront theeconomies of developing countries, including high inflation, erratic gross domestic product growth and shortagesof foreign exchange. The Indian government has exercised, and continues to exercise, significant influence overmany aspects of the Indian economy and Indian government actions concerning the economy could have amaterial adverse effect on private sector entities like us. In the past, the Indian government has providedsignificant tax incentives and relaxed certain regulatory restrictions in order to encourage foreign investment inspecified sectors of the economy, including the software development services industry. Programs that havebenefited us include, among others, tax holidays, liberalized import and export duties and preferential rules onforeign investment and repatriation. Notwithstanding these benefits, as noted above, India’s central and stategovernments remain significantly involved in the Indian economy as regulators. In recent years, the Indiangovernment has introduced non-income related taxes, including new service taxes, and income-related taxes,including the Minimum Alternative Tax, or MAT. In addition, a change in government leadership in India or
19

change in policies of the existing government in India that results in the elimination of any of the benefitsrealized by us from our Indian operations or the imposition of new taxes applicable to such operations could havea material adverse effect on our business, results of operations and financial condition.
In addition, the emergence of a widespread health emergency or pandemic, which may be more difficult toprevent or contain in a country like India as compared to more developed countries, could create economic orfinancial disruption that could negatively affect our revenue and operations or impair our ability to manage ourbusiness in certain parts of the world.
Our international sales and operations are subject to many uncertainties.
Revenues from customers outside North America represented approximately 21.5% of our revenues for theyear ended December 31, 2011. We anticipate that revenues from customers outside North America will continue toaccount for a material portion of our revenues in the foreseeable future and may increase as we expand ourinternational presence, particularly in Europe, the Asia Pacific region and the Latin America region. In addition, themajority of our employees, along with our development and delivery centers, are located in India. As a result, wemay be subject to risks inherently associated with international operations, including risks associated with foreigncurrency exchange rate fluctuations, which may cause volatility in our reported income, and risks associated withthe application and imposition of protective legislation and regulations relating to import or export or otherwiseresulting from foreign policy or the variability of foreign economic conditions. From time to time, we may engagein hedging transactions to mitigate our risks relating to exchange rate fluctuations. The use of hedging contracts isintended to mitigate or reduce transactional level volatility in the results of our foreign operations, but does notcompletely eliminate volatility and risk. In addition, use of hedging contracts includes the risk of non-performanceby the counterparty. Additional risks associated with international operations include difficulties in enforcingintellectual property and/or contractual rights, the burdens of complying with a wide variety of foreign laws,potentially adverse tax consequences, tariffs, quotas and other barriers and potential difficulties in collectingaccounts receivable. In addition, we may face competition in other countries from companies that may have moreexperience with operations in such countries or with international operations. Additionally, such companies mayhave long-standing or well-established relationships with local officials and/or desired clients, which may put us at acompetitive disadvantage. We may also face difficulties integrating new facilities in different countries into ourexisting operations, as well as integrating employees that we hire in different countries into our existing corporateculture. Our international expansion plans may not be successful and we may not be able to compete effectively inother countries. There can be no assurance that these and other factors will not impede the success of ourinternational expansion plans, limit our ability to compete effectively in other countries or otherwise have a materialadverse effect on our business, results of operations and financial condition.
Our operating results may be adversely affected by fluctuations in the Indian rupee and other foreigncurrency exchange rates and restrictions on the deployment of cash across our global operations.
Although we report our operating results in U.S. dollars, a portion of our revenues and expenses aredenominated in currencies other than the U.S. dollar. Fluctuations in foreign currency exchange rates can have anumber of adverse effects on us. Because our consolidated financial statements are presented in U.S. dollars, wemust translate revenues, expenses and income, as well as assets and liabilities, into U.S. dollars at exchange ratesin effect during or at the end of each reporting period. Therefore, changes in the value of the U.S. dollar againstother currencies will affect our revenues, income from operations, other income (expense), net and the value ofbalance sheet items originally denominated in other currencies. There is no guarantee that our financial resultswill not be adversely affected by currency exchange rate fluctuations or that any efforts by us to engage incurrency hedging activities will be effective. In addition, in some countries we could be subject to strictrestrictions on the movement of cash and the exchange of foreign currencies, which could limit our ability to usethese funds across our global operations. Finally, as we continue to leverage our global delivery model, more ofour expenses are incurred in currencies other than those in which we bill for the related services. An increase inthe value of certain currencies, such as the Indian rupee, against the U.S. dollar could increase costs for deliveryof services at offshore sites by increasing labor and other costs that are denominated in local currency.
20

Our operating results may be adversely affected by our use of derivative financial instruments.
We have entered into a series of foreign exchange forward contracts that are designated as cash flow hedgesof certain salary payments in India. These contracts are intended to partially offset the impact of the movement ofthe exchange rates on future operating costs. In addition, we also entered into foreign exchange forward contractsin order to mitigate foreign currency risk on Indian rupee denominated net monetary assets. The hedgingstrategies that we have implemented, or may in the future implement, to mitigate foreign currency exchange raterisks may not reduce or completely offset our exposure to foreign exchange rate fluctuations and may expose ourbusiness to unexpected market, operational and counterparty credit risks. Accordingly, we may incur losses fromour use of derivative financial instruments that could have a material adverse effect on our business, results ofoperations and financial condition.
Our global operations expose us to numerous and sometimes conflicting legal and regulatoryrequirements, and violations of these regulations could harm our business.
Because we provide services to clients throughout the world, we are subject to numerous, and sometimesconflicting, legal rules on matters as diverse as import/export controls, content requirements, trade restrictions,tariffs, taxation, sanctions, government affairs, internal and disclosure control obligations, data privacy and laborrelations. Violations of these laws or regulations in the conduct of our business could result in fines, criminalsanctions against us or our officers, prohibitions on doing business, damage to our reputation and otherunintended consequences such as liability for monetary damages, fines and/or criminal prosecution, unfavorablepublicity, restrictions on our ability to process information and allegations by our clients that we have notperformed our contractual obligations. Due to the varying degrees of development of the legal systems of thecountries in which we operate, local laws might be insufficient to protect our rights. Our failure to comply withapplicable legal and regulatory requirements could have a material adverse effect on our business, results ofoperations and financial condition.
In many parts of the world, including countries in which we operate, practices in the local businesscommunity might not conform to international business standards and could violate anti-corruption laws orregulations, including the U.S. Foreign Corrupt Practices Act or U.K. Bribery Act, among others. Although wehave policies and procedures in place that are designed to promote legal and regulatory compliance, ouremployees, subcontractors and agents could take actions that violate these policies or procedures or applicableanti-corruption laws or regulations. Violations of these laws or regulations could subject us to criminal or civilenforcement actions, including fines and suspension or disqualification from government contracting orcontracting with private entities in certain highly regulated industries, any of which could have a material adverseeffect on our business.
International hostilities, terrorist activities, other violence or war, natural disasters, pandemics andinfrastructure disruptions, could delay or reduce the number of new service orders we receive and impairour ability to service our customers, thereby adversely affecting our business, financial condition andresults of operations.
Hostilities involving the United States and acts of terrorism, violence or war, such as the attacks ofSeptember 11, 2001 in the United States, the attacks of July 7, 2005 in the United Kingdom, the attacks ofNovember 26, 2008 and July 13, 2011 in Mumbai, India, and the continuing conflict in Iraq and Afghanistan,natural disasters, global health risks or pandemics or the threat or perceived potential for these events couldmaterially adversely affect our operations and our ability to provide services to our customers. Such events maycause customers to delay their decisions on spending for information technology, consulting, and business andknowledge process outsourcing services and give rise to sudden significant changes in regional and global economicconditions and cycles. These events also pose significant risks to our people and to physical facilities and operationsaround the world, whether the facilities are ours or those of our clients, which could affect our financial results. Bydisrupting communications and travel, giving rise to travel restrictions, and increasing the difficulty of obtaining
21

and retaining highly-skilled and qualified personnel, these events could make it difficult or impossible for us todeliver services to some or all of our clients. As noted above, the majority of our technical professionals are locatedin India, and the vast majority of our technical professionals in the United States and Europe are Indian nationalswho are able to work in the United States and Europe only because they hold current visas and work permits. Travelrestrictions could cause us to incur additional unexpected labor costs and expenses or could restrain our ability toretain the skilled professionals we need for our operations. In addition, any extended disruptions of electricity, otherpublic utilities or network services at our facilities, as well as system failures at, or security breaches in, ourfacilities or systems, could also adversely affect our ability to serve our clients.
Although we continue to believe that we have a strong competitive position in the United States, wecontinue to increase our efforts to geographically diversify our clients and revenue. Despite our efforts todiversify, hostilities involving the United States, the United Kingdom, India and other countries in which weprovide services to our clients, and other acts of terrorism, violence or war, natural disasters, global health risksor pandemics may reduce the demand for our services and negatively affect our revenues and profitability. Whilewe plan and prepare to defend against each of these occurrences, we might be unable to protect our people,facilities and systems against all such occurrences. If these disruptions prevent us from effectively serving ourclients, our operating results could be adversely affected.
Anti-outsourcing legislation, if adopted, and negative perceptions associated with offshoreoutsourcing could adversely affect our business, financial condition and results of operations and impairour ability to service our customers.
The issue of companies outsourcing services to organizations operating in other countries is a topic ofpolitical discussion in many countries, including the United States, which is our largest market. For example,measures aimed at limiting or restricting outsourcing by United States companies are periodically considered inthe U.S. Congress and in numerous state legislatures to address concerns over the perceived association betweenoffshore outsourcing and the loss of jobs domestically. On August 13, 2010, President Barack Obama signedlegislation which imposed additional fees of $2,000 for certain H-1B petitions and $2,250 for certain L-1A andL-1B petitions beginning in August 2010 through September 20, 2014. These fees have now been extendedthrough September 20, 2015. Given the ongoing debate over outsourcing, the introduction and consideration ofother restrictive legislation is possible. If enacted, such measures may: broaden existing restrictions onoutsourcing by federal and state government agencies and on government contracts with firms that outsourceservices directly or indirectly, or impact private industry with measures that include, but are not limited to, taxdisincentives, fees or penalties, intellectual property transfer restrictions, and new standards that have the effectof restricting the use of certain business and/or work visas. In the event that any of these measures become law,our business, results of operations and financial condition could be adversely affected and our ability to provideservices to our customers could be impaired.
In addition, from time to time, there has been publicity about negative experiences associated with offshoreoutsourcing, such as domestic job loss, and theft and misappropriation of sensitive client data, particularlyinvolving service providers in India. Current or prospective clients may elect to perform certain servicesthemselves or may be discouraged from utilizing global service delivery providers due to negative perceptionsthat may be associated with using global service delivery models or firms. Any slowdown or reversal of existingindustry trends toward global service delivery would seriously harm our ability to compete effectively withcompetitors that provide the majority of their services from within the country in which our clients operate.
Existing and future legislative and administrative/regulatory policies restricting the performance of businessprocess services from an offshore location in jurisdictions in Europe, the Asia Pacific, or any other region inwhich we have clients could also have a material adverse effect on our business, results of operations andfinancial condition. For example, legislation enacted in the United Kingdom, based on the 1977 EC AcquiredRights Directive, has been adopted in some form by many European Union, or EU, countries, and provides that ifa company outsources all or part of its business to a service provider or changes its current service provider, the
22

affected employees of the company or of the previous service provider are entitled to become employees of thenew service provider, generally on the same terms and conditions as their original employment. In addition,dismissals of employees who were employed by the company or the previous service provider immediately priorto that transfer are automatically considered unfair dismissals that entitle such employees to compensation. As aresult, to avoid unfair dismissal claims, we may have to offer, and become liable for, voluntary redundancypayments to the employees of our clients who outsource business to us in the United Kingdom and other EUcountries that have adopted similar laws. These types of policies may materially affect our ability to obtain newbusiness from companies in the United Kingdom and EU and to provide outsourced services to companies in theUnited Kingdom and EU in a cost-effective manner.
Our growth may be hindered by immigration restrictions.
Our future success continues to depend on our ability to attract and retain employees with technical and projectmanagement skills from developing countries, especially India. The ability of foreign nationals to work in theUnited States and Europe depends on their ability and our ability to obtain the necessary visas and work permits.
The H-1B visa classification enables United States employers to hire certain qualified foreign workers inpositions that require an education at least equal to a four-year bachelor degree in the United States in specialtyoccupations such as IT systems engineering and computer systems analysis. The H-1B visa usually permits anindividual to work and live in the United States for a period of up to six years. Under certain limitedcircumstances, H-1B visa extensions after the six-year period may be available. There is a limit on the number ofnew H-1B petitions that the United States Citizenship and Immigration Services, or CIS, may approve in anyfederal fiscal year, and in years in which this limit is reached, we may be unable to obtain H-1B visas necessaryto bring foreign employees to the United States. Currently, the limit is 65,000 for holders of United States orUnited States-equivalent bachelor degrees (the general cap), and an additional 20,000 for holders of advanceddegrees from United States post-secondary educational institutions. We began filing H-1B petitions with CISagainst the fiscal year (FY) 2012 caps beginning April 1, 2011 for work in H-1B status beginning on October 1,2011. We also have begun planning for H-1B filings for FY 2013. As part of our advanced planning process, webelieve that we have a sufficient number of employees who are permit-ready to meet our anticipated businessgrowth in the current year. In addition, there are strict labor regulations associated with the H-1B visaclassification. Larger users of the H-1B visa program face higher legal and regulatory standards, and are oftensubject to investigations by the Wage and Hour Division of the United States Department of Labor (DOL) andunannounced random site inspections by CIS’s parent agency, the United States Department of HomelandSecurity (DHS). A finding by DOL, DHS, and/or another governmental agency of willful or substantial failure tocomply with existing regulations on the H-1B classification may result in back-pay liability, substantial fines,and/or a ban on future use of the H-1B program and other immigration benefits.
We also regularly transfer foreign professionals to the United States to work on projects at client sites usingthe L-1 visa classification. Companies abroad are allowed to transfer certain managers and executives throughthe L-1A visa, and employees with specialized company knowledge through the L-1B visa to related UnitedStates companies, such as a parent, subsidiary, affiliate, joint venture, or branch office. We have an approved“Blanket L” petition, under which the corporate relationships of our transferring and receiving entities have beenpre-approved by CIS, thus enabling individual L-1 visa applications to be presented directly to a visa-issuingUnited States consular post abroad rather than undergoing a pre-approval process through CIS in the UnitedStates. In recent years, both the United States consular posts in India that review initial L-1 applications and CIS,which adjudicates individual petitions for initial grants and extensions of L-1 visa status, have becomeincreasingly restrictive with respect to this category, particularly the L-1B “specialized knowledge” standard. Asa result, the rate of refusals of initial individual L-1 petitions and extensions for Indian nationals has increased. Inaddition, even where L-1 visas are ultimately granted and issued, security measures undertaken by United Statesconsular posts around the world have delayed or prevented visa issuances. Our inability to bring qualifiedtechnical personnel into the United States to staff on-site customer locations would have a material adverse effecton our business, results of operations and financial condition.
23

Pursuant to the L-1 Visa Reform Act, we must meet a number of restrictions and requirements to obtain L-1visas for our personnel. For example, all L-1 applicants, including those brought to the United States under aBlanket L Program, must have worked abroad with the related company for one full year in the prior three years.In addition, L-1B “specialized knowledge” visa holders may not be primarily stationed at the work site of anotheremployer if the L-1B visa holder will be principally controlled and supervised by an employer other than thepetitioning employer. Finally, L-1B status may not be granted where placement of the L-1B visa holder at a thirdparty site is part of an arrangement to provide labor for the third party, rather than placement at the site inconnection with the provision of a product or service involving specialized knowledge specific to the petitioningemployer.
We do not place L-1B workers at third party sites where they are under the primary supervision of adifferent employer, nor do we place L-1B workers at third party sites in an arrangement to provide labor for thethird party without providing a service involving our workers’ specialized knowledge. Since implementation ofthe L-1 Visa Reform Act, we consistently have established this fact to CIS’s satisfaction. However, if CIS and/orthe United States Department of State, through its visa-issuing consular posts abroad, decide to interpret theseprovisions in a very restrictive fashion, this could impair our ability to effectively staff our projects in the UnitedStates with personnel from abroad. New guidance governing these and related statutory provisions from CIS isexpected in FY 2012, and if such guidance is restrictive in nature, our ability to staff our projects in the UnitedStates with personnel from abroad will be impaired.
We also process immigrant visas for lawful permanent residence (green cards) in the United States foremployees to fill positions for which there are an insufficient number of able, willing, and qualified United Statesworkers available to fill the positions. Compliance with existing United States immigration and labor laws, orchanges in those laws making it more difficult to hire foreign nationals or limiting our ability to successfullyobtain permanent residence for our foreign employees in the United States, could require us to incur additionalunexpected labor costs and expenses or could restrain our ability to retain the skilled professionals we need forour operations in the United States. Any of these restrictions or limitations on our hiring practices could have amaterial adverse effect on our business, results of operations and financial condition.
In addition to immigration restrictions in the United States, there are certain restrictions on transferringemployees to work in the United Kingdom, where we have experienced significant growth. The United Kingdomcurrently requires that all employees who are not nationals of European Union countries (plus nationals of Bulgariaand Romania), or EEA nationals, obtain work permission before obtaining a visa/entry clearance to travel to theUnited Kingdom. European nations such as Hungary, Poland, Lithuania, Slovakia, and the Czech Republic do nothave a work permit requirement but employees need to register to work within 30 days of arrival. The UnitedKingdom has a points-based system under which certain certificates of sponsorship are issued by licensed employersponsors, provided the employees they seek to employ in the United Kingdom can accumulate a certain number ofpoints based on certain attributes. Where the employee has not worked for a Cognizant group company outside theUnited Kingdom for at least 6 months, we must carry out a resident labor market test to confirm that the intendedrole cannot be filled by an EEA national. We are currently an A-rated sponsor and were allocated certificates ofsponsorship which we believe are sufficient to meet our current and expected demand for transfers to the UnitedKingdom. On November 23, 2010, the United Kingdom announced new restrictions to control annual net migration,but allowed for temporary intra-company transfers of employees from outside the European Economic Area for upto five years as long as the employees meet certain compensation requirements.
Immigration and work permit laws and regulations in the United States, the United Kingdom, the EU,Switzerland and other countries are subject to legislative and administrative changes as well as changes in theapplication of standards and enforcement. Immigration and work permit laws and regulations can be significantlyaffected by political forces and levels of economic activity. Our international expansion strategy and our business,results of operations, and financial condition may be materially adversely affected if changes in immigration andwork permit laws and regulations or the administration or enforcement of such laws or regulations impair our abilityto staff projects with professionals who are not citizens of the country where the work is to be performed.
24

Our revenues are highly dependent on clients primarily located in the United States and Europe, aswell as on clients concentrated in certain industries, including the financial services industry. Continuingor worsening economic conditions or factors that negatively affect the economic health of the UnitedStates, Europe or these industries may adversely affect our business.
Approximately 78.5% of our revenues during the year ended December 31, 2011 were derived fromcustomers located in North America. In the same period, approximately 17.9% of our revenues were derivedfrom customers located in Europe. If the United States or European economy continues to weaken or slow andconditions in the financial markets continue to deteriorate, pricing for our services may be depressed and ourcustomers may reduce or postpone their technology spending significantly, which may in turn lower the demandfor our services and negatively affect our revenues and profitability. Additionally, any prolonged recession in theUnited States and Europe could have an adverse impact on our revenues because our revenues are primarilyderived from the United States and Europe. In addition, during the year ended December 31, 2011, we earnedapproximately 41.1% of our revenues from the financial services industry, which includes insurance.Deterioration in the financial services industry or significant consolidation in that industry, or a decrease ingrowth or consolidation in other industry segments on which we focus, may reduce the demand for our servicesand negatively affect our revenues and profitability. In addition, if we are unable to successfully anticipatechanging economic and political conditions affecting the industries and markets in which we operate, we may beunable to effectively plan for or respond to those changes, and our business could be negatively affected.
We face intense competition from other service providers.
We operate in intensely competitive industries that experience rapid technological developments, changes inindustry standards, and changes in customer requirements. The intensely competitive information technology,consulting and business process outsourcing professional services markets include a large number of participantsand are subject to rapid change. These markets include participants from a variety of market segments, including:
• systems integration firms;
• contract programming companies;
• application software companies;
• internet solutions providers;
• large or traditional consulting companies;
• professional services groups of computer equipment companies; and
• infrastructure management and outsourcing companies.
These markets also include numerous smaller local competitors in the various geographic markets in whichwe operate which may be able to provide services and solutions at lower costs or on terms more attractive toclients than we can. Our direct competitors include, among others, Accenture, Capgemini, Computer SciencesCorporation, HCL Technologies, HP Enterprise (formerly Electronic Data Systems), IBM Global Services,Infosys Technologies, Perot Systems (acquired by Dell Inc.), Tata Consultancy Services and Wipro. Many of ourcompetitors have significantly greater financial, technical and marketing resources and greater name recognitionand, therefore, may be better able to compete for new work and skilled professionals. There is a risk thatincreased competition could put downward pressure on the prices we can charge for our services and on ouroperating margins. Similarly, if our competitors develop and implement methodologies that yield greaterefficiency and productivity, they may be able to offer services similar to ours at lower prices without adverselyaffecting their profit margins. Even if our offerings address industry and client needs, our competitors may bemore successful at selling their services. If we are unable to provide our clients with superior services andsolutions at competitive prices or successfully market those services to current and prospective clients, our resultsof operations may suffer. Further, a client may choose to use its own internal resources rather than engage an
25

outside firm to perform the types of services we provide. We cannot be certain that we will be able to sustain ourcurrent levels of profitability or growth in the face of competitive pressures, including competition for skilledtechnology professionals and pricing pressure from competitors employing an on-site/offshore business model.
In addition, we may face competition from companies that increase in size or scope as the result of strategicmergers or acquisitions. These transactions may include consolidation activity among hardware manufacturers,software companies and vendors, and service providers. The result of any such vertical integration may begreater integration of products and services that were once offered separately by independent vendors. Our accessto such products and services may be reduced as a result of such an industry trend, which could adversely affectour competitive position. These types of events could have a variety of negative effects on our competitiveposition and our financial results, such as reducing our revenue, increasing our costs, lowering our gross marginpercentage, and requiring us to recognize impairments on our assets.
We may not be able to sustain our current level of profitability.
For the year ended December 31, 2011, we reported an operating margin of 18.6%. Our operating marginmay decline if we experience declines in demand and pricing for our services, an increase in our operating costs,including imposition of new non-income related taxes, or due to adverse fluctuations in foreign currencyexchange rates. In addition, historically, wages in India have increased at a faster rate than in the United States.Additionally, the number and type of equity-based compensation awards and the assumptions used in valuingequity-based compensation awards may change resulting in increased stock-based compensation expense andlower margins. Although we have historically been able to partially offset wage increases and foreign currencyfluctuations through further leveraging the scale of our operating structure, obtaining price increases, and issuinga lower number of stock-based compensation awards in proportion to our overall headcount, we cannot be surethat we will be able to continue to do so in the future.
Our profitability could suffer if we are not able to control our costs or improve our efficiency.
Our ability to control our costs and improve our efficiency affects our profitability. If we are unable tocontrol our costs or improve our efficiency, our profitability could be negatively affected.
Our business will suffer if we fail to develop new services and enhance our existing services in order tokeep pace with the rapidly evolving technological environment.
The information technology, consulting and business process outsourcing professional services markets arecharacterized by rapid technological change, evolving industry standards, changing customer preferences andnew product and service introductions. Our future success will depend on our ability to develop solutions thatkeep pace with changes in the markets in which we provide services. We cannot be sure that we will besuccessful in developing new services addressing evolving technologies in a timely or cost-effective manner or,if these services are developed, that we will be successful in the marketplace. In addition, we cannot be sure thatproducts, services or technologies developed by others will not render our services non-competitive or obsolete.Our failure to address the demands of the rapidly evolving technological environment could have a materialadverse effect on our business, results of operations and financial condition.
Our ability to remain competitive will also depend on our ability to design and implement, in a timely andcost-effective manner, solutions for customers that both leverage their legacy systems and appropriately utilizenewer technologies such as cloud-based services, Web 2.0 models, software-as-a-service, and service orientedarchitectures. Our failure to design and implement solutions in a timely and cost-effective manner could have amaterial adverse effect on our business, results of operations and financial condition.
26

We may face difficulties in providing end-to-end business solutions or delivering complex and largeprojects for our clients that could cause clients to discontinue their work with us, which in turn couldharm our business.
We have been expanding the nature and scope of our engagements and have added new service offerings,such as IT consulting, business and knowledge process outsourcing, systems integration and outsourcing of entireportions of IT infrastructure. The success of these service offerings is dependent, in part, upon continued demandfor such services by our existing, new and prospective clients and our ability to meet this demand in a cost-competitive and effective manner. In addition, our ability to effectively offer a wider breadth of end-to-endbusiness solutions depends on our ability to attract existing or new clients to these service offerings. To obtainengagements for such end-to-end solutions, we also are more likely to compete with large, well-establishedinternational consulting firms, resulting in increased competition and marketing costs. Accordingly, we cannot becertain that our new service offerings will effectively meet client needs or that we will be able to attract existingand new clients to these service offerings.
The increased breadth of our service offerings may result in larger and more complex projects with ourclients. This will require us to establish closer relationships with our clients and a thorough understanding of theiroperations. Our ability to establish such relationships will depend on a number of factors, including theproficiency of our professionals and our management personnel. Our failure to understand our clientrequirements or our failure to deliver services that meet the requirements specified by our clients could result intermination of client contracts, and we could be liable to our clients for significant penalties or damages.
Larger projects may involve multiple engagements or stages, and there is a risk that a client may choose notto retain us for additional stages or may cancel or delay additional planned engagements. These terminations,cancellations or delays may result from factors that have little or nothing to do with the quality of our services,such as the business or financial condition of our clients or the economy generally. Such cancellations or delaysmake it difficult to plan for project resource requirements, and inaccuracies in such resource planning andallocation may have a negative impact on our profitability.
If our clients are not satisfied with our services, our business could be adversely affected.
Our business model depends in large part on our ability to attract additional work from our base of existingclients. Our business model also depends on our account teams’ ability to develop relationships with our clientsthat enable us to understand our clients’ needs and deliver solutions and services that are tailored to those needs.If a client is not satisfied with the quality of work performed by us, or with the type of services or solutionsdelivered, then we could incur additional costs to address the situation, the profitability of that work might beimpaired, and the client’s dissatisfaction with our services could damage our ability to obtain additional workfrom that client. In particular, clients that are not satisfied might seek to terminate existing contracts prior to theirscheduled expiration date and could direct future business to our competitors. In addition, negative publicityrelated to our client services or relationships, regardless of its accuracy, may further damage our business byaffecting our ability to compete for new contracts with current and prospective clients.
We rely on a few customers for a large portion of our revenues.
Our top five customers generated approximately 16.3% of our revenues for the year ended December 31,2011. The volume of work performed for specific customers is likely to vary from year to year, and a majorcustomer in one year may not use our services in a subsequent year. The loss of one of our large customers couldhave a material adverse effect on our business, results of operations and financial condition.
27

We generally do not have long-term contracts with our customers and our results of operations couldbe adversely affected if our clients terminate their contracts with us on short notice.
Consistent with industry practice, we generally do not enter into long-term contracts with our customers. Amajority of our contracts can be terminated by our clients with short notice and without significant earlytermination cost. Terminations may result from factors that are beyond our control and unrelated to our workproduct or the progress of the project, including the business or financial conditions of the client, changes inownership or management at our clients, changes in client strategies or the economy or markets generally. Whencontracts are terminated, we lose the anticipated revenues and might not be able to eliminate our associated costsin a timely manner. Consequently, our profit margins in subsequent periods could be lower than expected. If weare unable to replace the lost revenue with other work on terms we find acceptable or effectively eliminate costs,we may not be able to maintain our level of profitability.
Our results of operations may be affected by the rate of growth in the use of technology in businessand the type and level of technology spending by our clients.
Our business depends, in part, upon continued growth in the use of technology in business by our clients andprospective clients as well as their customers and suppliers. In challenging economic environments, our clientsmay reduce or defer their spending on new technologies in order to focus on other priorities. At the same time,many companies have already invested substantial resources in their current means of conducting commerce andexchanging information, and they may be reluctant or slow to adopt new approaches that could disrupt existingpersonnel, processes and infrastructures. If the growth of technology usage in business, or our clients’ spendingon technology in business, declines, or if we cannot convince our clients or potential clients to embrace newtechnological solutions, our results of operations could be adversely affected.
If we are unable to collect our receivables from, or bill our unbilled services to, our clients, our resultsof operations and cash flows could be adversely affected.
Our business depends on our ability to successfully obtain payment from our clients of the amounts theyowe us for work performed. We evaluate the financial condition of our clients and usually bill and collect onrelatively short cycles. We maintain allowances against receivables and unbilled services. Actual losses on clientbalances could differ from those that we currently anticipate and, as a result, we might need to adjust ourallowances. There is no guarantee that we will accurately assess the creditworthiness of our clients.Macroeconomic conditions, such as the continued credit crisis and related turmoil in the global financial system,could also result in financial difficulties, including limited access to the credit markets, insolvency or bankruptcy,for our clients, and, as a result, could cause clients to delay payments to us, request modifications to theirpayment arrangements that could increase our receivables balance, or default on their payment obligations to us.Timely collection of client balances also depends on our ability to complete our contractual commitments andbill and collect our contracted revenues. If we are unable to meet our contractual requirements, we mightexperience delays in collection of and/or be unable to collect our client balances, and if this occurs, our results ofoperations and cash flows could be adversely affected. In addition, if we experience an increase in the time to billand collect for our services, our cash flows could be adversely affected.
We are investing substantial cash in new facilities and physical infrastructure, and our profitabilitycould be reduced if our business does not grow proportionately.
We have made and continue to make significant contractual commitments related to capital expenditures onconstruction or expansion of our development and delivery centers. We may encounter cost overruns or projectdelays in connection with new facilities. These expansions will likely increase our fixed costs and if we areunable to grow our business and revenues proportionately, our profitability may be reduced.
28

Competition for highly-skilled technical personnel is intense and the success of our business dependson our ability to attract and retain highly-skilled professionals.
Our future success will depend to a significant extent on our ability to attract, train and retain highly-skilledprofessionals so as to keep our supply of skills and resources in balance with client demand. In particular, wemust attract, train and retain appropriate numbers of talented people, including project managers, IT engineersand other senior technical personnel, with diverse skills in order to serve client needs and grow our business. Weare particularly dependent on retaining our senior executives and other experienced managers with the skill setsrequired by our business, and if we are unable to do so, our ability to develop new business and effectively leadour current projects could be jeopardized. Similarly, the profitability of our business model depends on ourability to effectively utilize personnel with the right mix of skills and experience to support our projects. Theprocesses and costs associated with recruiting, training and retaining employees place significant demands on ourresources.
We believe there is a shortage of, and significant competition for, professionals with the advancedtechnological skills necessary to perform the services we offer. We have subcontracted to a limited extent in thepast, and may do so in the future, with other service providers in order to meet our obligations to our customers.Our ability to maintain and renew existing engagements and obtain new business will depend, in large part, onour ability to attract, train and retain technical personnel with the skills that keep pace with continuing changes ininformation technology, evolving industry standards and changing customer preferences. Further, we must trainand manage our growing work force, requiring an increase in the level of responsibility for both existing and newmanagement personnel. We cannot guarantee that the management skills and systems currently in place will beadequate or that we will be able to train and assimilate new employees successfully. Our profits and ability tocompete for and manage client engagements could be adversely affected if we cannot manage employee hiringand attrition to achieve a stable and efficient workforce structure.
Our ability to operate and compete effectively could be impaired if we lose key personnel or if wecannot attract additional qualified personnel.
Our future performance depends to a significant degree upon the continued service of the key members ofour management team, as well as marketing, sales and technical personnel, and our ability to attract and retainnew management and other personnel. We do not maintain key man life insurance on any of our executiveofficers or significant employees. Competition for personnel is intense, and there can be no assurance that wewill be able to retain our key employees or that we will be successful in attracting and retaining new personnel inthe future. The loss of any one or more of our key personnel or the failure to attract and retain key personnelcould have a material adverse effect on our business, results of operations and financial condition.
Restrictions in non-competition agreements with our executive officers may not be enforceable.
Currently we have entered into non-competition agreements with the majority of our executive officers. Wecannot be certain, however, that the restrictions in these agreements prohibiting such executive officers fromengaging in competitive activities are enforceable. Further, substantially all of our professional non-executivestaff are not covered by agreements that would prohibit them from working for our competitors. If any of our keyprofessional personnel leaves our employment and joins one of our competitors, our business could be adverselyaffected.
Our earnings may be adversely affected if we change our intent not to repatriate earnings in India orif such earnings become subject to U.S. tax on a current basis.
Effective January 1, 2002, and in accordance with authoritative literature, we no longer accrue incrementalU.S. taxes on our Indian earnings recognized after 2001 as these earnings (as well as other foreign earnings forall periods) are considered to be indefinitely reinvested outside of the United States. While we have no plans todo so, events may occur that could effectively force us to change our intent not to repatriate such earnings. If we
29

change our intent and repatriate such earnings, we will have to accrue taxes associated with such earnings at asubstantially higher rate than our effective income tax rate in 2011. These increased taxes could have a materialadverse effect on our business, results of operations and financial condition.
Our operating results may be negatively impacted by the loss of certain tax benefits provided by Indiato companies in our industry as well as by proposed tax legislation in India.
Cognizant India is primarily export-oriented and is eligible for certain income tax holiday benefits grantedby the Indian government for export activities. These benefits for export activities conducted within SoftwareTechnology Parks, or STPs, expired on March 31, 2011, and the income from such activities is now subject tocorporate income tax at the current rate of 32.4%, resulting in a significant increase in our effective tax rate for2011.
In addition to STPs, we have constructed our newer development centers in areas designated as SpecialEconomic Zones, or SEZs. Development centers operating in SEZs are entitled to certain income tax incentivesfor periods up to 15 years. Changes in Indian tax laws that would reduce or deny SEZ tax benefits could have amaterial adverse effect on our business, results of operations and financial condition. In addition, effectiveApril 1, 2011, all Indian profits, including those generated within SEZs, are subject to the MAT, at the currentrate of approximately 20.0%. Any MAT paid is creditable against future corporate income tax, subject tolimitations. Currently, we anticipate utilizing our existing MAT balances against future corporate incometax. Our ability to fully do so will depend on possible changes to the Indian tax laws as well as the futurefinancial results of Cognizant India. Our inability to fully utilize our deferred income tax assets related to theMAT could have a material adverse effect on our business, results of operations and financial condition.
Our operating results and financial condition may be negatively impacted by certain tax relatedmatters.
We are subject to income taxes in both the United States and numerous foreign jurisdictions. The provisionfor income taxes and cash tax liability in the future could be adversely affected by numerous factors including,but not limited to, income before taxes being lower than anticipated in countries with lower statutory tax ratesand higher than anticipated in countries with higher statutory tax rates, changes in the valuation of deferred taxassets and liabilities, and changes in tax laws, regulations, accounting principles or interpretations thereof, whichcould adversely impact our results of operations and financial condition in future periods. In addition, our incometax returns are subject to examination in the jurisdictions in which we operate. We regularly assess the likelihoodof adverse outcomes resulting from these examinations to determine the adequacy of our provision for incometaxes. An unfavorable outcome of one or more of these examinations may have an adverse effect on our business,results of operations and financial condition.
If our pricing structures are based on inaccurate expectations and assumptions regarding the cost andcomplexity of performing our work, then our contracts could be unprofitable.
We negotiate pricing terms with our clients utilizing a range of pricing structures and conditions. Wepredominantly contract to provide services either on a time-and-materials basis or on a fixed-price basis. Ourpricing is highly dependent on our internal forecasts and predictions about our projects and the marketplace,which might be based on limited data and could turn out to be inaccurate. If we do not accurately estimate thecosts and timing for completing projects, our contracts could prove unprofitable for us or yield lower profitmargins than anticipated. We face a number of risks when pricing our contracts, as many of our projects entailthe coordination of operations and workforces in multiple locations and utilizing workforces with different skillsets and competencies across geographically diverse service locations. Our pricing, cost and profit marginestimates for the work that we perform frequently include anticipated long-term cost savings fromtransformational and other initiatives that we expect to achieve and sustain over the life of the contract. There is arisk that we will underprice our projects, fail to accurately estimate the costs of performing the work or fail to
30

accurately assess the risks associated with potential contracts. In particular, any increased or unexpected costs,delays or failures to achieve anticipated cost savings, or unexpected risks we encounter in connection with theperformance of this work, including those caused by factors outside our control, could make these contracts lessprofitable or unprofitable, which could have an adverse effect on our profit margin.
In addition, a significant portion of our projects are on a fixed-price basis, subjecting us to the foregoingrisks to an even greater extent. Fixed-price contracts accounted for approximately 31.7% of our revenues for theyear ended December 31, 2011. We expect that an increasing number of our future projects will be contracted ona fixed-price basis. In addition to the other risks described in the paragraph above, we bear the risk of cost over-runs and operating cost inflation in connection with projects covered by fixed-price contracts. Our failure toestimate accurately the resources and time required for a fixed-price project, or our failure to complete ourcontractual obligations within the time frame committed, could have a material adverse effect on our business,results of operations and financial condition.
Our profitability could suffer if we are not able to maintain favorable pricing rates.
Our profit margin, and therefore our profitability, is dependent on the rates we are able to recover for ourservices. If we are not able to maintain favorable pricing for our services, our profit margin and our profitabilitycould suffer. The rates we are able to recover for our services are affected by a number of factors, including:
• our clients’ perceptions of our ability to add value through our services;
• competition;
• introduction of new services or products by us or our competitors;
• our competitors’ pricing policies;
• our ability to accurately estimate, attain and sustain contract revenues, margins and cash flows overincreasingly longer contract periods;
• bid practices of clients and their use of third-party advisors;
• the use by our competitors and our clients of offshore resources to provide lower-cost service deliverycapabilities;
• our ability to charge premium prices when justified by market demand or the type of service; and
• general economic and political conditions.
Our profitability could suffer if we are not able to maintain favorable utilization rates.
The cost of providing our services, including the utilization rate of our professionals, affects ourprofitability. If we are not able to maintain an appropriate utilization rate for our professionals, our profit marginand our profitability may suffer. Our utilization rates are affected by a number of factors, including:
• our ability to efficiently transition employees from completed projects to new assignments;
• our ability to hire and assimilate new employees;
• our ability to accurately forecast demand for our services and thereby maintain an appropriateheadcount in each of our geographies and workforces;
• our ability to effectively manage attrition; and
• our need to devote time and resources to training, professional development and other non-chargeableactivities.
31

If we do not continue to improve our operational, financial and other internal controls and systems tomanage our rapid growth and size or if we are unable to enter, operate and compete effectively in newgeographic markets, our business may suffer and the value of our stockholders’ investment in ourCompany may be harmed.
Our anticipated growth will continue to place significant demands on our management and other resources.Our growth will require us to continue to develop and improve our operational, financial and other internalcontrols, both in the United States, Europe, India and elsewhere. In particular, our continued growth will increasethe challenges involved in:
• recruiting, training and retaining technical, finance, marketing and management personnel with theknowledge, skills and experience that our business model requires;
• maintaining high levels of client satisfaction;
• developing and improving our internal administrative infrastructure, particularly our financial,operational, communications and other internal systems;
• preserving our culture, values and entrepreneurial environment; and
• effectively managing our personnel and operations and effectively communicating to our personnelworldwide our core values, strategies and goals.
In addition, the increasing size and scope of our operations increase the possibility that a member of ourpersonnel will engage in unlawful or fraudulent activity, breach our contractual obligations, or otherwise exposeus to unacceptable business risks, despite our efforts to train our people and maintain internal controls to preventsuch instances. If we do not continue to develop and implement the right processes and tools to manage ourenterprise, our ability to compete successfully and achieve our business objectives could be impaired.
As part of our growth strategy, we plan to continue expanding our operations in Europe, Asia, the MiddleEast, and Latin America. We may not be able to compete effectively in these markets and the cost of enteringthese markets may be substantially greater than we expect. If we fail to compete effectively in the new marketswe enter, or if the cost of entering those markets is substantially greater than we expect, our business, results ofoperations and financial condition could be adversely affected. In addition, if we cannot compete effectively, wemay be required to reconsider our strategy to invest in our international expansion plans and change our intent onthe repatriation of our earnings.
Our operating results may experience significant quarterly fluctuations.
Historically, we have experienced significant quarterly fluctuations in our revenues and results of operationsand expect these fluctuations to continue. Among the factors causing these variations have been:
• the nature, number, timing, scope and contractual terms of the projects in which we are engaged;
• delays incurred in the performance of those projects;
• the accuracy of estimates of resources and time required to complete ongoing projects; and
• general economic conditions.
In addition, our future revenues, operating margins and profitability may fluctuate as a result of:
• changes in pricing in response to customer demand and competitive pressures;
• changes to the financial condition of our clients;
• the mix of on-site and offshore staffing;
• the ratio of fixed-price contracts versus time-and-materials contracts;
32
• employee wage levels and utilization rates;
• changes in foreign exchange rates, including the Indian rupee versus the U.S. dollar;
• the timing of collection of accounts receivable;
• enactment of new taxes;
• changes in domestic and international income tax rates and regulations; and
• changes to levels and types of stock-based compensation awards and assumptions used to determinethe fair value of such awards.
A high percentage of our operating expenses, particularly personnel and rent, are relatively fixed in advanceof any particular period. As a result, unanticipated variations in the number and timing of our projects or inemployee wage levels and utilization rates may cause significant variations in our operating results in anyparticular period, and could result in losses. Any significant shortfall of revenues in relation to our expectations,any material reduction in utilization rates for our professional staff or variance in the on-site/offshore staffingmix, an unanticipated termination of a major project, a customer’s decision not to pursue a new project orproceed to succeeding stages of a current project or the completion of several major customer projects during aquarter could require us to pay underutilized employees and could therefore have a material adverse effect on ourbusiness, results of operations and financial condition.
As a result of these factors, it is possible that in some future periods, our revenues and operating results maybe significantly below the expectations of public market analysts and investors. In such an event, the price of ourcommon stock would likely be materially and adversely affected.
We could be held liable for damages or our reputation could be damaged by disclosure of confidentialinformation or personal data, security breaches or system failures.
We are dependent on information technology networks and systems to process, transmit and securely storeelectronic information and to communicate among our locations around the world and with our clients. Securitybreaches of this infrastructure could lead to shutdowns or disruptions of our systems and potential unauthorizeddisclosure of confidential information or data, including personal data. In addition, many of our engagementsinvolve projects that are critical to the operations of our customers’ businesses and provide benefits that aredifficult to quantify. The theft and/or unauthorized use or publication of our, or our clients’, confidentialinformation or other proprietary business information as a result of such an incident could adversely affect ourcompetitive position and reduce marketplace acceptance of our services. Any failure in the networks or computersystems used by us or our customers could result in a claim for substantial damages against us and significantreputational harm, regardless of our responsibility for the failure. Although we attempt to limit by contract ourliability for damages arising from negligent acts, errors, mistakes or omissions in rendering our services, wecannot assure you that any contractual limitations on liability will be enforceable in all instances or willotherwise protect us from liability for damages.
In addition, we often have access to or are required to manage, utilize, collect and store sensitive orconfidential client or employee data, including nonpublic personal data. As a result, we are subject to numerousU.S. and foreign jurisdiction laws and regulations designed to protect this information, such as the EuropeanUnion Directive on Data Protection and various U.S. federal and state laws governing the protection of health orother individually identifiable information. If any person, including any of our employees, negligently disregardsor intentionally breaches controls or procedures with which we are responsible for complying with respect tosuch data or otherwise mismanages or misappropriates that data, or if unauthorized access to or disclosure of datain our possession or control occurs, we could be subject to significant liability to our clients or our clients’customers for breaching contractual confidentiality and security provisions or privacy laws, as well as liabilityand penalties in connection with any violation of applicable privacy laws and/or criminal prosecution.
33

Unauthorized disclosure of sensitive or confidential client or employee data, whether through breach of computersystems, systems failure, employee negligence, fraud or misappropriation, or otherwise, could damage ourreputation and cause us to lose clients. Similarly, unauthorized access to or through our information systems andnetworks or those we develop or manage for our clients, whether by our employees or third parties, could resultin negative publicity, legal liability and damage to our reputation.
Although we have general liability insurance coverage, including coverage for errors or omissions, there canbe no assurance that coverage will continue to be available on reasonable terms or will be sufficient in amount tocover one or more large claims, or that the insurer will not disclaim coverage as to any future claim. Thesuccessful assertion of one or more large claims against us that exceed available insurance coverage or changesin our insurance policies, including premium increases or the imposition of large deductible or co-insurancerequirements, could have a material adverse effect on our business, results of operations and financial condition.
Our business could be negatively affected if we incur legal liability, including with respect to ourcontractual obligations, in connection with providing our solutions and services.
If we fail to meet our contractual obligations or otherwise breach obligations to our clients, we could besubject to legal liability. We may enter into non-standard agreements because we perceive an importanteconomic opportunity by doing so or because our personnel did not adequately adhere to our guidelines. Inaddition, the contracting practices of our competitors may cause contract terms and conditions that areunfavorable to us to become standard in the marketplace. If we cannot or do not perform our obligations, wecould face legal liability and our contracts might not always protect us adequately through limitations on thescope and/or amount of our potential liability. If we cannot, or do not, meet our contractual obligations to providesolutions and services, and if our exposure is not adequately limited through the enforceable terms of ouragreements, we might face significant legal liability and our business could be adversely affected.
In the normal course of business and in conjunction with certain client engagements, we have entered intocontractual arrangements through which we may be obligated to indemnify clients or other parties with whom weconduct business with respect to certain matters. These arrangements can include provisions whereby we agree tohold the indemnified party and certain of their affiliated entities harmless with respect to third-party claimsrelated to such matters as our breach of certain representations or covenants, or out of our intellectual propertyinfringement, our gross negligence or willful misconduct or certain other claims made against certain parties.Payments by us under any of these arrangements are generally conditioned on the client making a claim andproviding us with full control over the defense and settlement of such claim. It is not possible to determine themaximum potential amount under these indemnification agreements due to the unique facts and circumstancesinvolved in each particular agreement. Historically, we have not made payments under these indemnificationagreements so they have not had any impact on our operating results, financial position, or cash flows. However,if events arise requiring us to make payment for indemnification claims under our indemnification obligations incontracts we have entered, such payments could have a material impact on our operating results, financialposition, and cash flows.
We could incur liability or our reputation could be damaged if our provision of services and solutionsto our clients contributes to our clients’ internal control deficiencies.
Our clients may perform audits or require us to perform audits and provide audit reports with respect to thecontrols and procedures that we use in the performance of services for such clients, especially when we processdata belonging to them. Our ability to acquire new clients and retain existing clients may be adversely affectedand our reputation could be harmed if we receive a qualified opinion, or if we cannot obtain an unqualifiedopinion, with respect to our controls and procedures in connection with any such audit in a timely manner.Additionally, we could incur liability if our controls and procedures, or the controls and procedures we managefor a client, were to result in internal controls failures or impair our client’s ability to comply with its owninternal control requirements.
34

We may not be able to enforce or protect our intellectual property rights, which may harm our abilityto compete and harm our business.
Our future success will depend, in part, on our ability to protect our proprietary methodologies and othervaluable intellectual property. We presently hold no patents or registered copyrights. We rely upon acombination of copyright and trade secret laws, non-disclosure and other contractual arrangements and varioussecurity measures to protect our intellectual property rights. Existing laws of some countries in which we provideservices or solutions, such as China, might offer only limited protection of our intellectual property rights. Indiais a member of the Berne Convention, and has agreed to recognize protections on copyrights conferred under thelaws of foreign countries, including the laws of the United States. We believe that laws, rules, regulations andtreaties in effect in the United States, India and other countries in which we operate are adequate to protect usfrom misappropriation or unauthorized use of our intellectual property. However, there can be no assurance thatthese laws will not change in ways that may prevent or restrict the transfer of software components, libraries andtoolsets and other technology or data we use in the performance of our services among the countries in which weoperate and provide services. There can be no assurance that the steps we have taken to protect our intellectualproperty rights will be adequate to deter misappropriation of any of our intellectual property, or that we will beable to detect unauthorized use and take appropriate steps to enforce our rights. Enforcing our rights might alsorequire considerable time, money and oversight. Unauthorized use of our intellectual property may result indevelopment of technology, products or services that compete with our products and services and unauthorizedparties may infringe upon or misappropriate our products, services or proprietary information. If we are unable toprotect our intellectual property, our business may be adversely affected.
Depending on the circumstances, we might need to grant a specific client greater rights in intellectualproperty developed or used in connection with a contract than we generally do. In certain situations, we mightforego all rights to the use of intellectual property we create and intend to reuse across multiple clientengagements, which would limit our ability to reuse that intellectual property for other clients. Any limitation onour ability to provide a service or solution could cause us to lose revenue-generating opportunities and require usto incur additional expenses to develop new or modified solutions for future projects.
Our ability to enforce our software license agreements, service agreements, and other intellectual propertyrights is subject to general litigation risks, as well as uncertainty as to the enforceability of our intellectualproperty rights in various countries. To the extent that we seek to enforce our rights, we could be subject toclaims that an intellectual property right is invalid, otherwise not enforceable, or is licensed to the party againstwhom we are pursuing a claim. In addition, our assertion of intellectual property rights often results in the otherparty seeking to assert alleged intellectual property rights or assert other claims against us, which could harm ourbusiness. If we are not successful in defending these claims in litigation, we may not be able to sell or license aparticular service or solution due to an injunction, or we may have to pay damages that could, in turn, harm ourresults of operations. In addition, governments may adopt regulations, or courts may render decisions, requiringcompulsory licensing of intellectual property to others, or governments may require that products meet specifiedstandards that serve to favor local companies. Our inability to enforce our intellectual property rights under thesecircumstances may harm our competitive position and our business.
Our services or solutions could infringe upon the intellectual property rights of others and we may besubject to claims of infringement of third-party intellectual property rights.
We cannot be sure that our services and solutions, or the solutions of others that we offer to our clients, do notinfringe on the intellectual property rights of others. Third parties may assert against us or our customers claimsalleging infringement of patent, copyright, trademark, or other intellectual property rights to technologies orservices that are important to our business. Infringement claims could harm our reputation, cost us money andprevent us from offering some services or solutions. In our contracts, we generally agree to indemnify our clients forany expenses or liabilities resulting from our infringement of the intellectual property rights of third parties. In someinstances, the amount of our liability under these indemnities could be substantial. Any claims that our products,
35

services or processes infringe the intellectual property rights of others, regardless of the merit or resolution of suchclaims, may cause us to incur significant costs in defending and resolving such claims, and may divert the effortsand attention of our management and technical personnel from our business. In addition, as result of suchintellectual property infringement claims, we could be required or otherwise decide that it is appropriate to:
• pay third-party infringement claims;
• discontinue using, licensing, or selling particular products subject to infringement claims;
• discontinue using the technology or processes subject to infringement claims;
• develop other technology not subject to infringement claims, which could be costly or may not bepossible; and/or
• license technology from the third party claiming infringement, which license may not be available oncommercially reasonable terms.
The occurrence of any of the foregoing could result in unexpected expenses or require us to recognize animpairment of our assets, which would reduce the value of our assets and increase expenses. In addition, if wealter or discontinue our offering of affected items or services, our revenue could be harmed. If a claim ofinfringement were successful against us or our clients, an injunction might be ordered against our client or ourown services or operations, causing further damages.
We expect that the risk of infringement claims against us will increase if our competitors are able to obtainpatents for software products and methods, technological solutions, and processes. We may be subject tointellectual property infringement claims from certain individuals and companies who have acquired patentportfolios for the primary purpose of asserting such claims against other companies. The risk of infringementclaims against us may also increase as we continue to develop and license our intellectual property to our clientsand other third parties. Any infringement claim or litigation against us could have a material adverse effect onour business, results of operations and financial condition.
We might lose our ability to utilize the intellectual property of others, which could harm our business.
We could lose our ability, or be unable to secure the right, to utilize the intellectual property of others.Third-party suppliers of software, hardware or other intellectual assets could be unwilling to permit us to usetheir intellectual property and this could impede or disrupt use of their products or services by us and our clients.If our ability to provide services and solutions to our clients is impaired as a result of any such denial, ouroperating results could be adversely affected.
We may not be able to successfully acquire target companies or integrate acquired companies ortechnologies into our company, and we may become subject to certain liabilities assumed or incurred inconnection with our acquisitions that could harm our operating results.
If we are unable to complete the number and kind of acquisitions for which we plan, or if we are inefficientor unsuccessful at integrating any acquired businesses into our operations, we may not be able to achieve ourplanned rates of growth or improve our market share, profitability or competitive position in specific markets orservices. We expect to continue pursuing strategic acquisition and joint venture opportunities designed toenhance our capabilities, expand our capacity and geographic presence and/or enter new technology areas. Wecannot predict or guarantee that we will successfully identify suitable acquisition candidates or consummate anyacquisition or joint venture. We may need to divert and/or dedicate management and other resources to completethe transactions. Once we have consummated an acquisition transaction or entered into a joint venturetransaction, we may not be able to integrate the acquired business or joint venture (and personnel) into ouroperations, recognize anticipated efficiencies and/or benefits, realize our strategic objectives or achieve thedesired financial and operating results, in each case, both generally and as a result of our unique organizational
36

structure. Acquisitions and joint ventures involve a number of special risks, including diversion of management’sattention, failure to retain key personnel and the potential assumption or incurrence of liabilities and/orobligations.
Although we conduct due diligence in connection with each of our acquisitions, there may be liabilities thatwe fail to discover, that we inadequately assess in our due diligence efforts or that are not properly disclosed tous. In particular, to the extent that any acquired business (or any properties thereof) (i) failed to comply with orotherwise violated applicable laws or regulations, (ii) failed to fulfill contractual obligations to customers or(iii) incurred material liabilities or obligations to customers that are not identified during the diligence process,we, as the successor owner, may be financially responsible for these violations, failures and liabilities and maysuffer financial and/or reputational harm or otherwise be adversely affected. In addition, as part of an acquisition,we may assume responsibilities and obligations of the acquired business pursuant to the terms and conditions ofservices agreements entered by the acquired entity that are not consistent with the terms and conditions that wetypically accept and require. Although we attempt to structure acquisitions in such a manner as to minimize ourexposure to, among other things, the factors and conditions contemplated by the foregoing two sentences(including through indemnification protection), we cannot predict or guarantee that our efforts will be effectiveor will protect us from liability. The discovery of any material liabilities associated with our acquisitions forwhich we are unable to recover indemnification amounts could harm our operating results.
System failure or disruptions in communications could disrupt our business and result in lostcustomers and curtailed operations which would reduce our revenue and profitability.
To deliver our services to our customers, we must maintain a high speed network of satellite, fiber optic andland lines and active voice and data communications twenty-four hours a day between our main operating officesin Chennai, our other development and delivery centers and the offices of our customers worldwide. Althoughwe maintain redundancy facilities and satellite communications links, any systems failure or a significant lapse inour ability to transmit voice and data through satellite and telephone communications could result in lostcustomers and curtailed operations which would reduce our revenue and profitability.
Consolidation in the industries that we serve could adversely affect our business.
Companies in the industries that we serve may seek to achieve economies of scale and other synergies bycombining with or acquiring other companies. If two or more of our current clients merge or consolidate andcombine their operations, it may decrease the amount of work that we perform for these clients. If one of our currentclients merges or consolidates with a company that relies on another provider for its consulting, systems integrationand technology, or outsourcing services, we may lose work from that client or lose the opportunity to gainadditional work. The increased market power of larger companies could also increase pricing and competitivepressures on us. Any of these possible results of industry consolidation could adversely affect our business.
Our ability to attract and retain business may depend on our reputation in the marketplace.
Our services are marketed to clients and prospective clients based on a number of factors. Since many of ourspecific client engagements involve unique services and solutions, our corporate reputation is a significant factorin our clients’ evaluation of whether to engage our services. We believe the Cognizant brand name and ourreputation are important corporate assets that help distinguish our services from those of our competitors and alsocontribute to our efforts to recruit and retain talented employees. However, our corporate reputation is potentiallysusceptible to damage by actions or statements made by current or former clients, competitors, vendors,adversaries in legal proceedings, government regulators, as well as members of the investment community andthe media. There is a risk that negative information about our company, even if based on false rumor ormisunderstanding, could adversely affect our business. In particular, damage to our reputation could be difficultand time-consuming to repair, could make potential or existing clients reluctant to select us for newengagements, resulting in a loss of business, and could adversely affect our recruitment and retention efforts.
37

Damage to our reputation could also reduce the value and effectiveness of the Cognizant brand name and couldreduce investor confidence in us, adversely affecting our share price.
Provisions in our charter, by-laws and stockholders’ rights plan and provisions under Delaware lawmay discourage unsolicited takeover proposals.
Provisions in our charter and by-laws, each as amended, our stockholders’ rights plan and Delaware GeneralCorporate Law, or DGCL, may have the effect of deterring unsolicited takeover proposals or delaying orpreventing changes in our control or management, including transactions in which stockholders might otherwisereceive a premium for their shares over then-current market prices. In addition, these documents and provisionsmay limit the ability of stockholders to approve transactions that they may deem to be in their best interests. Ourboard of directors has the authority, without further action by the stockholders, to fix the rights and preferences,and issue shares of preferred stock. Our charter provides for a classified board of directors, which will prevent achange of control of our board of directors at a single meeting of stockholders. The prohibition of ourstockholders’ ability to act by written consent and to call a special meeting will delay stockholder actions untilannual meetings or until a special meeting is called by our chairman or chief executive officer or our board ofdirectors. The supermajority-voting requirement for specified amendments to our charter and by-laws allows aminority of our stockholders to block those amendments. The DGCL also contains provisions preventingstockholders from engaging in business combinations with us, subject to certain exceptions. These provisionscould also discourage bids for our common stock at a premium as well as create a depressive effect on the marketprice of the shares of our common stock.
New and changing corporate governance and public disclosure requirements add uncertainty to ourcompliance policies and increases our costs of compliance.
Changing laws, regulations and standards relating to accounting, corporate governance and publicdisclosure, including the Sarbanes-Oxley Act of 2002, other SEC regulations, and the NASDAQ Global SelectMarket rules, are creating uncertainty for companies like ours. These laws, regulations and standards may lackspecificity and are subject to varying interpretations. Their application in practice may evolve over time, as newguidance is provided by regulatory and governing bodies. This could result in continuing uncertainty regardingcompliance matters and higher costs of compliance as a result of ongoing revisions to such corporate governancestandards.
In particular, our efforts to comply with Section 404 of the Sarbanes-Oxley Act of 2002 and the relatedregulations regarding our required assessment of our internal controls over financial reporting and our externalauditors’ audit of that assessment requires the commitment of significant financial and managerial resources. Weconsistently assess the adequacy of our internal controls over financial reporting, remediate any controldeficiencies that may be identified, and validate through testing that our controls are functioning as documented.While we do not anticipate any material weaknesses, the inability of management and our independent auditor toprovide us with an unqualified report as to the adequacy and effectiveness, respectively, of our internal controlsover financial reporting for future year ends could result in adverse consequences to us, including, but not limitedto, a loss of investor confidence in the reliability of our financial statements, which could cause the market priceof our stock to decline.
We are committed to maintaining high standards of corporate governance and public disclosure, and ourefforts to comply with evolving laws, regulations and standards in this regard have resulted in, and are likely tocontinue to result in, increased general and administrative expenses and a diversion of management time andattention from revenue-generating activities to compliance activities. In addition, the laws, regulations and standardsregarding corporate governance may make it more difficult for us to obtain director and officer liability insurance.Further, our board members, chief executive officer and chief financial officer could face an increased risk ofpersonal liability in connection with their performance of duties. As a result, we may face difficulties attracting andretaining qualified board members and executive officers, which could harm our business. If we fail to comply withnew or changed laws, regulations or standards of corporate governance, our business and reputation may be harmed.
38

Our share price could be adversely affected if we are unable to maintain effective internal controls.
The accuracy of our financial reporting is dependent on the effectiveness of our internal controls. We arerequired to provide a report from management to our stockholders on our internal control over financial reportingthat includes an assessment of the effectiveness of these controls. Internal control over financial reporting hasinherent limitations, including human error, the possibility that controls could be circumvented or becomeinadequate because of changed conditions, and fraud. Because of these inherent limitations, internal control overfinancial reporting might not prevent or detect all misstatements or fraud. If we cannot maintain and executeadequate internal control over financial reporting or implement required new or improved controls to ensure thereliability of the financial reporting and preparation of our financial statements for external use, we could sufferharm to our reputation, fail to meet our public reporting requirements on a timely basis, or be unable to properlyreport on our business and the results of our operations, and the market price of our securities could be materiallyadversely affected.
We are exposed to credit risk and fluctuations in the market values of our investment portfolio.
Recent turmoil in the financial markets has adversely affected economic activity in the United States andother regions of the world in which we do business. We believe that based on our current cash, cash equivalentsand investment balances and expected operating cash flows, the current lack of liquidity in the credit markets willnot have a material impact on our liquidity, cash flow or financial flexibility. Continued deterioration of thecredit and capital markets could result in volatility of our investment earnings and impairments to our investmentportfolio, which could negatively impact our financial condition and reported income. The continued decline ineconomic activity could adversely affect the ability of counterparties to certain financial instruments such asmarketable securities and derivatives to meet their obligations to us.
Our stock price continues to be volatile.
Our stock has at times experienced substantial price volatility as a result of variations between our actualand anticipated financial results, announcements by us and our competitors, projections or speculation about ourbusiness or that of our competitors by the media or investment analysts or uncertainty about current globaleconomic conditions. The stock market, as a whole, also has experienced extreme price and volume fluctuationsthat have affected the market price of many technology companies in ways that may have been unrelated to thesecompanies’ operating performance. Furthermore, we believe our stock price should reflect future growth andprofitability expectations and, if we fail to meet these expectations, our stock price may significantly decline.
Item 1B. Unresolved Staff Comments
None.
39

Item 2. Properties
To support our planned growth, we are continually expanding our development and delivery center capacitythrough the construction of new facilities, supplemented by additional leasing of non-owned facilities. Below is asummary of development and delivery facilities in India, China and the Philippines and our executive office inTeaneck, New Jersey as of December 31, 2011.
LocationNumber ofLocations
Square FootageLeased
Square FootageOwned
Total SquareFootage
Development and Delivery Facilities:India:
Chennai . . . . . . . . . . . . . . . . . . . . . . . . 11 1,800,185 5,041,307 6,841,492Pune . . . . . . . . . . . . . . . . . . . . . . . . . . . 6 1,469,964 343,703 1,813,667Hyderabad . . . . . . . . . . . . . . . . . . . . . . 7 1,654,782 — 1,654,782Kolkata . . . . . . . . . . . . . . . . . . . . . . . . 6 681,203 827,727 1,508,930Bangalore . . . . . . . . . . . . . . . . . . . . . . 5 994,667 225,000 1,219,667Coimbatore . . . . . . . . . . . . . . . . . . . . . 3 173,641 725,611 899,252Mumbai . . . . . . . . . . . . . . . . . . . . . . . . 3 279,940 — 279,940Cochin . . . . . . . . . . . . . . . . . . . . . . . . . 2 204,326 — 204,326Gurgaon . . . . . . . . . . . . . . . . . . . . . . . . 4 107,726 — 107,726Mangalore . . . . . . . . . . . . . . . . . . . . . . 1 42,210 — 42,210
Shanghai, China . . . . . . . . . . . . . . . . . . . . . 3 100,500 — 100,500Manila, the Philippines . . . . . . . . . . . . . . . . 2 114,371 — 114,371
Total . . . . . . . . . . . . . . . . . . . . . . 53 7,623,515 7,163,348 14,786,863
Executive Office:Teaneck . . . . . . . . . . . . . . . . . . . . . . . . 1 96,107 — 96,107
We operate out of our Teaneck, New Jersey headquarters and our regional and international offices. Wehave business development offices located in metropolitan areas including in North and Latin America: Atlanta(GA), Boston (MA), Bridgewater (NJ), Buenos Aires, Chicago (IL), Dallas (TX), Los Angeles (CA),Minneapolis (MN), Phoenix (AZ), San Francisco (CA), Sao Paulo, Seattle (WA), and Toronto; in Europe:Amsterdam, Brussels, Copenhagen, Frankfurt, Geneva, Helsinki, London, Madrid, Paris, Stockholm, and Zurich;in the Middle East: Dubai; and in the Asia Pacific region: Bangkok, Chennai, Cyberjaya, Hong Kong, KualaLumpur, Manila, Melbourne, Shanghai, Sydney, Singapore, and Tokyo.
In addition, we operate development and delivery facilities, in North and Latin America: Bentonville (AR),Boston (MA), Bridgewater (NJ), Buenos Aires, Chicago (IL), Detroit (MI), Guadalajara, Phoenix (AZ), SaoPaulo, Tampa (FL) and Toronto; in Europe: Amsterdam, Budapest and London; and in India and the Asia Pacificarea: Bangalore, Chennai, Cochin, Coimbatore, Gurgaon, Hyderabad, Kolkata, Mangalore, Manila, Mumbai,Pune, and Shanghai. We also have several training facilities strategically located near or within our main officesand development and delivery centers. We believe that our current facilities are adequate to support our existingoperations. We also believe that we will be able to obtain suitable additional facilities on commerciallyreasonable terms on an “as needed” basis.
Item 3. Legal Proceedings
We are involved in various claims and legal actions arising in the ordinary course of business. In the opinionof our management, the outcome of such claims and legal actions, if decided adversely, is not expected to have amaterial adverse effect on our quarterly or annual operating results, cash flows or consolidated financial position.
Item 4. Mine Safety Disclosures
None.
40

PART II
Item 5. Market for Registrant’s Common Equity, Related Stockholder Matters and Issuer Purchases ofEquity Securities
Our Class A common stock trades on the NASDAQ Global Select Market (NASDAQ) under the symbol“CTSH”.
The following table shows the per share range of high and low sale prices for shares of our Class A commonstock, as listed for quotation on the NASDAQ, and the quarterly cash dividends paid per share for the quarterlyperiods indicated.
Quarter Ended High LowCash Dividend
Per Share
March 31, 2010 . . . . . . . . . . . . . . . . . . . . . . . . . . . . . . . . $52.68 $42.08 $0.00June 30, 2010 . . . . . . . . . . . . . . . . . . . . . . . . . . . . . . . . . $54.81 $45.85 $0.00September 30, 2010 . . . . . . . . . . . . . . . . . . . . . . . . . . . . . $65.75 $48.98 $0.00December 31, 2010 . . . . . . . . . . . . . . . . . . . . . . . . . . . . . $74.79 $61.26 $0.00March 31, 2011 . . . . . . . . . . . . . . . . . . . . . . . . . . . . . . . . $81.85 $70.53 $0.00June 30, 2011 . . . . . . . . . . . . . . . . . . . . . . . . . . . . . . . . . $83.48 $64.40 $0.00September 30, 2011 . . . . . . . . . . . . . . . . . . . . . . . . . . . . . $77.71 $53.54 $0.00December 31, 2011 . . . . . . . . . . . . . . . . . . . . . . . . . . . . . $77.44 $59.95 $0.00
As of December 31, 2011, the approximate number of holders of record of our Class A common stock was202 and the approximate number of beneficial holders of our Class A common stock was 41,200.
Dividends
We have never declared or paid cash dividends on our Class A common stock. We currently intend to retainany future earnings to finance the growth of our business and, therefore, do not currently anticipate paying anycash dividends in the foreseeable future.
41

Equity Compensation Plan Information
The following table provides information as of December 31, 2011 with respect to the shares of our Class Acommon stock that may be issued under our existing equity compensation plans. We previously had four equitycompensation plans, each of which was approved by our stockholders: (1) Amended and Restated 1999 IncentiveCompensation Plan, which we refer to as the 1999 Incentive Plan; (2) Amended and Restated Non-EmployeeDirectors’ Stock Option Plan, which we refer to as the Director Plan; (3) the Amended and Restated KeyEmployees’ Stock Option Plan; and (4) Amended and Restated 2004 Employee Stock Purchase Plan, which werefer to as the 2004 Employee Stock Purchase Plan. The 1999 Incentive Plan, the Director Plan and the KeyEmployees’ Stock Option Plan were succeeded by the Cognizant Technology Solutions Corporation 2009Incentive Compensation Plan, which we refer to as the 2009 Incentive Plan, which was approved by ourstockholders. Awards granted under the previous plans are still valid, however no additional awards may begranted from these previous plans. For additional information on our equity compensation plans, please see Note12 to our consolidated financial statements.
Plan Category
Number of Securitiesto be Issued Upon Vesting
of Awards orExercise of
Outstanding Stock Options
Weighted AverageExercise Price of
Awards orOutstandingStock Options
Number of SecuritiesAvailable for FutureIssuance Under EquityCompensation Plans
Equity compensation plans that have beenapproved by security holders—stockoptions(1) . . . . . . . . . . . . . . . . . . . . . . . . . . . . 10,498,661(2) $23.06 19,797,812(3)
Equity compensation plans that have beenapproved by security holders—performancestock units(4) . . . . . . . . . . . . . . . . . . . . . . . . . 1,828,928 N/A —
Equity compensation plans that have beenapproved by security holders—restrictedstock units(5) . . . . . . . . . . . . . . . . . . . . . . . . . 2,160,591 N/A —
Equity compensation plans not approved bysecurity holders . . . . . . . . . . . . . . . . . . . . . . — —
Total . . . . . . . . . . . . . . . . . . . . . . . . . . . . . 14,488,180 19,797,812
(1) Consists of the 1999 Incentive Plan, the Director Plan, the Key Employees’ Stock Option Plan, the 2004Employee Stock Purchase Plan and the 2009 Incentive Plan.
(2) Excludes purchase rights outstanding under the 2004 Employee Stock Purchase Plan. Under such plan,employees may purchase whole shares of stock at price per share equal to 90% of the lower of the fairmarket value per share on the first day of the purchase period or the fair market value per share on the lastday of the purchase period.
(3) Includes 16,902,502 shares of Class A common stock available for future issuance under the 2009 IncentivePlan and 2,895,310 shares of Class A common stock available for future issuance under the 2004 EmployeeStock Purchase Plan.
(4) Consists of 10,000 shares and 1,818,928 shares that are issuable to holders of performance stock unitsgranted pursuant to the 1999 Incentive Plan and the 2009 Incentive Plan, respectively, upon the achievementof certain performance and vesting criteria.
(5) Consists of 2,160,591shares that are issuable to holders of restricted stock units granted pursuant to the 2009Incentive Plan.
Issuer Purchases of Equity Securities
In December 2010, our Board of Directors authorized up to $150.0 million in funds for repurchases ofCognizant’s outstanding shares of Class A common stock. The $150.0 million authorization excluded fees and
42

expenses and was set to expire in December 2011. In May 2011, our Board of Directors approved an increase toour stock repurchase program of $150 million bringing the total authorization under the repurchase program to$300 million, excluding fees and expenses. In addition, the expiration date was extended to June 30, 2012. InAugust 2011, our Board of Directors approved an additional increase to our stock repurchase program of $300million bringing the total authorization under the repurchase program to $600 million, excluding fees andexpenses. The program authorizes management to repurchase shares in the open market or in private transactionsfrom time to time, depending on market conditions. During the three months ended December 31, 2011, werepurchased approximately $2.4 million of our Class A common stock under our stock repurchase program.Stock repurchases were funded from working capital.
Month
Total Numberof SharesPurchased
AveragePrice Paidper Share
Total Number ofShares Purchasedas Part of Publicly
AnnouncedPlans orPrograms
ApproximateDollar Value of Shares
that May Yet BePurchased under thePlans or Programs(in thousands)
October 1, 2011 – October 31, 2011 . . . . . . . . 39,800 $60.00 39,800 $219,510November 1, 2011 – November 30, 2011 . . . . — $ — — $219,510December 1, 2011 – December 31, 2011 . . . . — $ — — $219,510
Total . . . . . . . . . . . . . . . . . . . . . . . . . . . . 39,800 $60.00 39,800
Recent Sales of Unregistered Securities
On September 26, 2011, we issued an aggregate of 162,601 shares (of which 40,650 shares are being held inescrow for a period of one year) of our Class A common stock, $0.01 par value, to Zaffera, LLC (“Zaffera”), inconsideration of our acquisition of substantially all of the assets of Zaffera. In connection with this issuance, werelied upon the exemption from the registration requirements pursuant to the provisions of Section 4(2) of theSecurities Act.
43

Performance Graph
The following graph compares the cumulative total stockholder return on our Class A common stock withthe cumulative total return on the NASDAQ-100 Index, S&P 500 Index and a Peer Group Index (capitalizationweighted) for the period beginning January 1, 2007 and ending on the last day of our last completed fiscal year.The stock performance shown on the graph below is not indicative of future price performance.
COMPARISON OF CUMULATIVE TOTAL RETURN(1)(2)
Among Cognizant, the NASDAQ-100 Index, the S&P 500 Index
And a Peer Group Index(3) (Capitalization Weighted)
12/31/06 12/31/07 12/31/08 12/31/09 12/31/10 12/31/11$0
$50
$100
$150
$200
Comparison of Cumulative Five Year Total Return
Cognizant Technology Solutions Corp S&P 500 Index Nasdaq 100 Index Peer Group
Company / Index
BasePeriod12/31/06 12/31/07 12/31/08 12/31/09 12/31/10 12/31/11
COGNIZANT TECHNOLOGY SOLUTIONSCORP . . . . . . . . . . . . . . . . . . . . . . . . . . . . . . . . . . . . . 100 87.97 46.81 117.50 189.97 166.69
S&P 500 INDEX . . . . . . . . . . . . . . . . . . . . . . . . . . . . . . 100 105.49 66.46 84.05 96.71 98.76NASDAQ-100 . . . . . . . . . . . . . . . . . . . . . . . . . . . . . . . . 100 118.67 68.97 105.89 126.24 129.65PEER GROUP . . . . . . . . . . . . . . . . . . . . . . . . . . . . . . . . 100 93.49 59.32 110.23 132.99 105.44
(1) Graph assumes $100 invested on January 1, 2007 in our Class A common stock, the NASDAQ-100 Index,the S&P 500 Index, and the Peer Group Index (capitalization weighted).
(2) Cumulative total return assumes reinvestment of dividends.(3) We have constructed a Peer Group Index of other information technology consulting firms consisting of
Accenture Ltd., Computer Sciences Corporation, Computer Task Group, Inc., Exlservice Holdings Inc,Genpact Ltd Inc., iGate Corp., Infosys Technologies Ltd., Sapient Corp., Satyam Computer Services Ltd.,Syntel, Inc., Wipro Ltd. and WNS Holdings LTD.
44

Item 6. Selected Financial Data
The following table sets forth our selected consolidated historical financial data as of the dates and for theperiods indicated. Our selected consolidated financial data set forth below as of December 31, 2011 and 2010 andfor each of the three years in the period ended December 31, 2011 has been derived from the audited financialstatements included elsewhere herein. Our selected consolidated financial data set forth below as ofDecember 31, 2009, 2008 and 2007 and for each of the years ended December 31, 2008 and 2007 are derivedfrom our audited consolidated financial statements not included elsewhere herein. Our selected consolidatedfinancial information for 2011, 2010 and 2009 should be read in conjunction with the Consolidated FinancialStatements and the Notes and “Item 7. Management’s Discussion and Analysis of Financial Condition andResults of Operations” which are included elsewhere in this Annual Report on Form 10-K.
Year Ended December 31,
2011 2010 2009 2008 2007
(in thousands, except per share data)Consolidated Operations Data:Revenues . . . . . . . . . . . . . . . . . . . . . . . . . . . . . . . . $6,121,156 $4,592,389 $3,278,663 $2,816,304 $2,135,577Cost of revenues (exclusive of depreciation andamortization expense shown separatelybelow) . . . . . . . . . . . . . . . . . . . . . . . . . . . . . . . . 3,538,622 2,654,569 1,849,443 1,572,816 1,206,035
Selling, general and administrative expenses . . . . 1,328,665 972,093 721,359 652,021 494,102Depreciation and amortization expense . . . . . . . . . 117,401 103,875 89,371 74,797 53,918
Income from operations . . . . . . . . . . . . . . . . . . . . . 1,136,468 861,852 618,490 516,670 381,522
Other income (expense), net:Interest income . . . . . . . . . . . . . . . . . . . . . . . . 39,249 25,793 15,895 22,188 29,560Other, net . . . . . . . . . . . . . . . . . . . . . . . . . . . . (6,568) (9,065) 2,566 (23,648) 3,274
Total other income (expense), net . . . . . . . . . . . . . 32,681 16,728 18,461 (1,460) 32,834
Income before provision for income taxes . . . . . . 1,169,149 878,580 636,951 515,210 414,356Provision for income taxes . . . . . . . . . . . . . . . . . . 285,531 145,040 101,988 84,365 64,223
Net income . . . . . . . . . . . . . . . . . . . . . . . . . . . . . . . $ 883,618 $ 733,540 $ 534,963 $ 430,845 $ 350,133
Basic earnings per share . . . . . . . . . . . . . . . . . . . . $ 2.91 $ 2.44 $ 1.82 $ 1.49 $ 1.22
Diluted earnings per share . . . . . . . . . . . . . . . . . . . $ 2.85 $ 2.37 $ 1.78 $ 1.44 $ 1.15
Cash dividends declared per common share . . . . . $ — $ — $ — $ — $ —
Weighted average number of common sharesoutstanding—Basic . . . . . . . . . . . . . . . . . . . . . . 303,277 300,781 293,304 290,121 288,155
Weighted average number of common sharesoutstanding—Diluted . . . . . . . . . . . . . . . . . . . . . 310,351 309,137 301,115 298,940 303,593
Consolidated Financial Position Data:Cash and cash equivalents and short-terminvestments . . . . . . . . . . . . . . . . . . . . . . . . . . . . $2,432,264 $2,226,388 $1,399,332 $ 762,579 $ 670,425
Long-term investments . . . . . . . . . . . . . . . . . . . . . — — 151,131 161,693 —Long-term obligations:
Deferred income tax liabilities, net . . . . . . . . 3,339 4,946 — 7,294 15,145Other noncurrent liabilities . . . . . . . . . . . . . . 342,003 62,971 38,455 14,111 14,267
Working capital . . . . . . . . . . . . . . . . . . . . . . . . . . . 2,875,801 2,587,508 1,660,960 1,080,542 901,495Total assets . . . . . . . . . . . . . . . . . . . . . . . . . . . . . . . 5,507,933 4,583,074 3,338,240 2,374,560 1,838,306Stockholders’ equity . . . . . . . . . . . . . . . . . . . . . . . 3,952,886 3,584,431 2,653,177 1,965,578 1,468,210
45

Item 7. Management’s Discussion and Analysis of Financial Condition and Results of Operations
Executive Summary
In 2011, our revenues increased to $6,121.2 million compared to $4,592.4 million in 2010. Net incomeincreased to $883.6 million or $2.85 per diluted share, including stock-based compensation expense, net of tax,equal to $0.22 per diluted share during 2011. This is compared to net income of $733.5 million, or $2.37 perdiluted share, including stock-based compensation expense and applicable stock-based Indian fringe benefit taxexpense, net of tax, of $0.14 per diluted share during 2010. The key drivers of our revenue growth in 2011 wereas follows:
• strong performance across all business segments with revenue growth ranging from 26.1% for ourOther segment to 40.9% for Manufacturing, Retail and Logistics as compared to 2010;
• continued penetration of the European market where we experienced revenue growth of 28.3% ascompared to 2010;
• increased customer spending on discretionary development projects;
• expansion of our service offerings, which enabled us to cross-sell new services to our customers andmeet the rapidly growing demand for complex large-scale outsourcing solutions;
• increased penetration at existing customers, including strategic customers; and
• continued expansion of the market for global delivery of IT services and business process outsourcing.
We saw a continued demand from our customers for a broad range of IT solutions, including applicationmaintenance, complex systems development engagements, testing, enterprise resource planning, or ERP,infrastructure management, business process outsourcing, or BPO, and business intelligence. We finished theyear with approximately 785 active clients compared to approximately 712 as of December 31, 2010 andincreased the number of strategic clients by 25 during the year bringing the total number of our strategic clientsto 191. We define a strategic client as one offering the potential to generate at least $5 million to $50 million ormore in annual revenues at maturity. Our top five and top ten customers accounted for 16.3% and 27.7%,respectively, of our total revenues in 2011 as compared to 17.9% and 30.3%, respectively, for the year endedDecember 31, 2010. As we continue to add new customers and increase our penetration at existing customers, weexpect the percentage of revenues from our top five and top ten customers to decline over time.
Our revenue from European customers increased by 28.3% to approximately $1,097.5 million in 2011compared to approximately $855.6 million in 2010. Revenue from Europe, excluding the UK, increased byapproximately $102.3 million from approximately $296.3 million in 2010 to approximately $398.6 million in2011 and revenue from the UK increased by approximately $139.6 million from approximately $559.3 million in2010 to approximately $698.9 million in 2011. In 2012, as a result of the ongoing uncertainty in the Europeaneconomy, we expect Europe to grow at a slower rate than the rest of the company. We believe that Europe willcontinue to be an area of significant investment for us as we see this region as well as the Middle East and theAsia Pacific regions, particularly Japan, India, Australia and Singapore, as growth opportunities for the longterm.
Our revenue growth is also attributed to increasing market acceptance of, and strong demand for, offshoreIT software and services and business process outsourcing. NASSCOM (India’s National Association ofSoftware and Service Companies) reports indicate that India’s IT software and services and business processoutsourcing sectors are expected to exceed $87 billion at the end of NASSCOM’s fiscal year 2012. This is anexpected growth rate of approximately 15% over the prior fiscal year. According to the latest NASSCOM“Perspective 2020: Transform Business, Transform India” report, global changes and new megatrends withineconomic, demographic, business, social and environmental areas are set to expand the outsourcing industry bycreating new dynamics and opportunities and are expected to result in export revenues of $175 billion by 2020.
46

In 2011, our operating margin decreased slightly to 18.6% compared to 18.8% in 2010. Excluding stock-based compensation expense of approximately $90.2 million, operating margin in 2011 was 20.0%. This was inline with our historic targeted operating margin range, excluding stock-based compensation costs and applicablestock-based Indian fringe benefit tax expense, of 19% to 20% of total revenues. Operating margin was affectedby an increase in compensation and benefit costs, including stock-based compensation costs, and investments togrow our business, including expanded sales and marketing activities partially offset by the depreciation of theIndian rupee versus the U.S. dollar. Historically, we have invested our profitability above the 19% to 20%operating margin level, which excludes stock-based compensation and any related stock-based Indian fringebenefit tax expense, back into our business, which we believe is a significant contributing factor to our strongrevenue growth. This investment is primarily focused in the areas of: hiring client partners and relationshippersonnel with specific industry experience or domain expertise; training our technical staff in a broader range ofservice offerings; strengthening our business analytic capabilities; strengthening and expanding our portfolio ofservices; continuing to expand our geographic presence for both sales and delivery; and recognizing andrewarding exceptional performance by our employees. In addition, this investment includes maintaining a levelof resources, trained in a broad range of service offerings, to be well positioned to respond to our customerrequests to take on additional projects. For the year ending December 31, 2012, we expect to continue to investamounts in excess of our targeted operating margin levels back into the business.
We finished the year with total headcount of approximately 137,700, which is an increase of approximately33,700 over the prior year. The increase in the number of our technical personnel and the related infrastructurecosts, to meet the demand for our services, is the primary driver of the increase in our operating expenses in2011. Annual turnover, including both voluntary and involuntary, was approximately 13.2% for 2011. Themajority of our turnover occurs in India. As a result, annualized attrition rates on-site at clients are below ourglobal attrition rate. In addition, attrition is weighted towards the more junior members of our staff. We haveexperienced increases in compensation and benefit costs, including incentive-based compensation costs, in Indiawhich may continue in the future; however, historically, this has not had a material impact on our results ofoperations as we have been able to absorb such cost increases through price increases or cost managementstrategies such as managing discretionary costs, mix of professional staff and utilization levels, and achievingother operating efficiencies.
Our current India real estate development program includes planned construction of an additional10.5 million square feet of new space between 2011 and the end of 2015. The expanded program includes theexpenditure of over $700.0 million during this period on land acquisition, facilities construction and furnishingsto build new company-owned state-of-the-art IT development and delivery centers in regions primarilydesignated as Special Economic Zones, or SEZs, located in India. During 2012, including the Indian real estatedevelopment program, we expect to spend approximately $370 million globally for capital expenditures.
At December 31, 2011, we had cash and cash equivalents and short-term investments of $2,432.3 millionand working capital of $2,875.8 million. Accordingly, we do not anticipate any near-term liquidity issues. During2011 and 2010, we repurchased approximately $338.8 million and $41.9 million, respectively, of our Class Acommon stock under our existing stock repurchase program. Stock repurchases under this program were fundedfrom working capital.
While several measures have indicated that the economy is stabilizing, we believe the global economicenvironment remains fragile. During 2012, barring any unforeseen events, we expect the following factors toaffect our business and our operating results:
• Continued focus by customers on directing IT spending towards cost containment projects, such asapplication maintenance, infrastructure management and BPO;
• Demand from our customers to help them achieve their dual mandate of simultaneously achieving costsavings while investing in innovation;
• Secular changes driven by evolving technologies and regulatory changes;
47

• Volatility in foreign currency rates; and
• Continued uncertainty in the world economy, particularly in Europe.
In response to this fragile macroeconomic environment, we plan to:
• Continue to invest in our talent base and new service offerings;
• Partner with our existing customers to provide innovative solutions resulting in our garnering anincreased portion of our customers’ overall IT spend;
• Continue our focus on growing our business in Europe, the Middle East and the Asia Pacific region,where we believe there are opportunities to gain market share;
• Continue to increase our strategic customer base across all of our business segments;
• Opportunistically look for acquisitions that may improve our overall service delivery capabilities,expand our geographic presence and/or enable us to enter new areas of technology;
• Continue operating focus and discipline to appropriately manage our cost structure; and
• Continue to locate most of our new development center facilities in tax incentivized areas.
Critical Accounting Estimates and Risks
Management’s discussion and analysis of our financial condition and results of operations is based on ouraccompanying consolidated financial statements that have been prepared in accordance with accountingprinciples generally accepted in the United States of America. The preparation of these financial statementsrequires management to make estimates and assumptions that affect the amounts reported for assets andliabilities, including the recoverability of tangible and intangible assets, disclosure of contingent assets andliabilities as of the date of the financial statements, and the reported amounts of revenues and expenses during thereported period. On an on-going basis, we evaluate our estimates. The most significant estimates relate to therecognition of revenue and profits based on the percentage of completion method of accounting for certainfixed-bid contracts, the allowance for doubtful accounts, income taxes, valuation of investments, goodwill andother long-lived assets, assumptions used in valuing stock-based compensation awards and derivative financialinvestments, contingencies and litigation. We base our estimates on historical experience and on various otherassumptions that are believed to be reasonable under the circumstances, the results of which form the basis formaking judgments about the carrying values of assets and liabilities that are not readily apparent from othersources. The actual amounts may differ from the estimates used in the preparation of the accompanyingconsolidated financial statements. Our significant accounting policies are described in Note 1 to theaccompanying consolidated financial statements.
We believe the following critical accounting policies require a higher level of management judgments andestimates than others in preparing the consolidated financial statements:
Revenue Recognition. Revenues related to our highly complex information technology applicationdevelopment contracts, which are predominantly fixed-price contracts, are recognized as the services are performedusing the percentage of completion method of accounting. Under this method, total contract revenue during the termof an agreement is recognized on the basis of the percentage that each contract’s total labor cost to date bears to thetotal expected labor cost (cost to cost method). This method is followed where reasonably dependable estimates ofrevenues and costs can be made. Management reviews total expected labor costs on an ongoing basis. Revisions toour estimates may result in increases or decreases to revenues and income and are reflected in the consolidatedfinancial statements in the periods in which they are first identified. If our estimates indicate that a contract loss willbe incurred, a loss provision is recorded in the period in which the loss first becomes probable and reasonablyestimable. Contract losses are determined to be the amount by which the estimated costs of the contract exceed theestimated total revenues that will be generated by the contract and are included in cost of revenues in ourconsolidated statement of operations. Contract losses for the periods presented were immaterial.
48

Stock-Based Compensation. Utilizing the fair value recognition provisions prescribed by the authoritativeguidance, stock-based compensation cost is measured at the grant date based on the value of the award and isrecognized as expense over the vesting period. Determining the fair value of stock-based awards at the grant daterequires judgment, including estimating the expected term over which the stock awards will be outstandingbefore they are exercised, the expected volatility of our stock and the number of stock-based awards that areexpected to be forfeited. In addition, for performance stock units, we are required to estimate the most probableoutcome of the performance conditions in order to determine the amount of stock compensation costs to berecorded over the vesting period. If actual results differ significantly from our estimates, stock-basedcompensation expense and our results of operations could be materially impacted.
Income Taxes. Determining the consolidated provision for income tax expense, deferred income tax assets(and related valuation allowance, if any) and liabilities requires significant judgment. We are required tocalculate and provide for income taxes in each of the jurisdictions where we operate and changes in thegeographic mix of income before taxes or estimated level of annual pre-tax income can affect the overalleffective income tax rate. The consolidated provision for income taxes may also change period to period basedon non-recurring events, such as the settlement of income tax audits and changes in tax laws, regulations, oraccounting principles.
Our provision for income taxes also includes the impact of provisions established for uncertain income taxpositions, as well as the related net interest, which can involve complex issues and may require an extendedperiod to resolve. Although we believe we have adequately reserved for our uncertain tax positions, no assurancecan be given that the final tax outcome of these matters will not differ from our recorded amounts. We adjustthese reserves in light of changing facts and circumstances, such as the closing of a tax audit or the refinement ofan estimate. To the extent that the final tax outcome of these matters differs from the amounts recorded, suchdifferences will impact the provision for income taxes in the period in which such determination is made.
Significant judgment is also required in determining any valuation allowance recorded against deferredincome tax assets. In assessing the need for a valuation allowance, we consider all available evidence for eachjurisdiction including past operating results, estimates of future taxable income and the feasibility of tax planningstrategies. In the event we change our determination as to the amount of deferred income tax assets that can berealized, we will adjust the valuation allowance with a corresponding impact recorded to income tax expense inthe period in which such determination was made.
Our Indian subsidiaries, collectively referred to as Cognizant India, are primarily export-oriented and areeligible for certain income tax holiday benefits granted by the Indian government for export activities. Thesebenefits for export activities conducted within STPs expired on March 31, 2011. The income of our STPs is nowsubject to corporate income tax at the current rate of 32.4%. The expiration of the income tax holiday for STPs isthe primary driver of the significant increase in our effective tax rate for 2011. We have constructed and expectto continue to locate most of our newer development facilities in SEZs, which are entitled to certain income taxincentives for export activities for periods up to 15 years. Effective April 1, 2011, all Indian profits, includingthose generated within SEZs, are subject to the MAT, at the current rate of approximately 20.0%. Any MAT paidis creditable against future corporate income taxes, subject to limitations. Currently, we anticipate utilizing ourexisting MAT balances against future corporate income tax. However, our ability to fully do so will depend onpossible changes to the Indian tax laws as well as the future financial results of Cognizant India.
Derivative Financial Instruments. Derivative financial instruments are accounted for in accordance with theauthoritative guidance which requires that each derivative instrument be recorded on the balance sheet as eitheran asset or liability measured at its fair value as of the reporting date. Our derivative financial instruments consistof foreign exchange forward contracts. We estimate the fair value of each foreign exchange forward contract byusing a present value of expected cash flows model. This model utilizes various assumptions, including, but notlimited to timing and amounts of cash flows, discount rates, and credit risk factors. The use of differentassumptions could have a positive or negative effect on our results of operations and financial condition.
49

Investments. Our investment portfolio is primarily comprised of time deposits and U.S. dollar denominatedcorporate bonds, municipal bonds, debt issuances by the U.S. government, U.S. government agencies, foreigngovernments and supranational entities and asset-backed securities. The asset-backed securities include securitiesbacked by auto loans, credit card receivables, and other receivables and are rated AAA/Aaa. The years ofissuance of our asset-backed securities fall in the 2002 to 2011 range.
We utilize various inputs to determine the fair value of our investment portfolio. To the extent they exist,unadjusted quoted market prices for identical assets in active markets (Level 1) or quoted prices on similar assets(Level 2) are utilized to determine the fair value of each investment in the portfolio. In the absence of quotedprices or liquid markets, valuation techniques would be used to determine fair value of any investments thatrequire inputs that are both significant to the fair value measurement and unobservable (Level 3). Valuationtechniques are based on various assumptions, including, but not limited to timing and amounts of cash flows,discount rates, rate of return, and adjustments for nonperformance and liquidity. A significant degree of judgmentis involved in valuing investments using Level 3 inputs. The use of different assumptions could have a positiveor negative effect on our results of operations and financial condition. See Note 10 to our consolidated financialstatements for additional information related to our security valuation methodologies.
We periodically evaluate if unrealized losses, as determined based on the security valuation methodologiesdiscussed above, on individual securities classified as available for sale in the investment portfolio are consideredto be other-than-temporary. The analysis of other-than-temporary impairment requires the use of variousassumptions, including, but not limited to, the length of time an investment’s book value is greater than fairvalue, the severity of the investment’s decline, any credit deterioration of the investment, whether managementintends to sell the security and whether it is more likely than not that we will be required to sell the security priorto recovery of its amortized cost basis. Once a decline in fair value is determined to be other-than-temporary, animpairment charge is generally recorded to income and a new cost basis in the investment is established.
Allowance for Doubtful Accounts. We maintain an allowance for doubtful accounts for estimated lossesresulting from the inability of our customers to make required payments. The allowance for doubtful accounts isdetermined by evaluating the relative credit-worthiness of each customer, historical collections experience andother information, including the aging of the receivables. If the financial condition of our customers were todeteriorate, resulting in an impairment of their ability to make payments, additional allowances may be required.
Goodwill. We evaluate goodwill for impairment at least annually, or as circumstances warrant. Whendetermining the fair value of our reporting units, we utilize various assumptions, including projections of futurecash flows. Any adverse changes in key assumptions about our businesses and their prospects or an adversechange in market conditions may cause a change in the estimation of fair value and could result in an impairmentcharge. Based upon our most recent evaluation of goodwill, there are no significant risks of impairment. As ofDecember 31, 2011, our goodwill balance was $288.8 million.
Long-Lived Assets and Intangibles. We review long-lived assets and certain identifiable intangibles forimpairment whenever events or changes in circumstances indicate that the carrying amount of an asset may notbe recoverable. In general, we will recognize an impairment loss when the sum of undiscounted expected futurecash flows is less than the carrying amount of such asset. The measurement for such an impairment loss is thenbased on the fair value of the asset. If such assets were determined to be impaired, it could have a materialadverse effect on our business, results of operations and financial condition.
Risks. The majority of our development and delivery centers, including a majority of our employees, arelocated in India. As a result, we may be subject to certain risks associated with international operations, includingrisks associated with foreign currency exchange rate fluctuations and risks associated with the application andimposition of protective legislation and regulations relating to import and export or otherwise resulting fromforeign policy or the variability of foreign economic or political conditions. Additional risks associated withinternational operations include difficulties in enforcing intellectual property rights, limitations on immigration
50

programs, the burdens of complying with a wide variety of foreign laws, potential geo-political and other risksassociated with terrorist activities and local and cross border conflicts, and potentially adverse tax consequences,tariffs, quotas and other barriers. We are also subject to risks associated with our overall compliance withSection 404 of the Sarbanes-Oxley Act of 2002. The inability of our management to ensure the adequacy andeffectiveness of our internal control over financial reporting for future year ends could result in adverseconsequences to us, including, but not limited to, a loss of investor confidence in the reliability of our financialstatements, which could cause the market price of our stock to decline. See Part I, Item 1A. “Risk Factors.”
Results of Operations
The following table sets forth, for the periods indicated, certain financial data expressed for the three yearsended December 31, 2011:
(Dollars in thousands)
2011% of
Revenues 2010% of
Revenues 2009% of
Revenues
Increase (Decrease)
2011 2010
Revenues . . . . . . . . . $6,121,156 100.0 $4,592,389 100.0 $3,278,663 100.0 $1,528,767 $1,313,726Cost of revenues(1) . . 3,538,622 57.8 2,654,569 57.8 1,849,443 56.4 884,053 805,126Selling, general andadministrative(2) . . 1,328,665 21.7 972,093 21.2 721,359 22.0 356,572 250,734
Depreciation andamortization . . . . . 117,401 1.9 103,875 2.3 89,371 2.7 13,526 14,504
Income fromoperations . . . . . . . 1,136,468 18.6 861,852 18.8 618,490 18.9 274,616 243,362
Other income(expense), net . . . . 32,681 16,728 18,461 15,953 (1,733)
Provision for incometaxes . . . . . . . . . . . 285,531 145,040 101,988 140,491 43,052
Net income . . . . . . . . $ 883,618 14.4 $ 733,540 16.0 $ 534,963 16.3 $ 150,078 $ 198,577
(1) Includes stock-based compensation expense of $15,257, $13,147, and $14,889 for the years endedDecember 31, 2011, 2010 and 2009, respectively, and stock-based Indian fringe benefit tax expense of $187for the year ended December 31, 2009, and is exclusive of depreciation and amortization expense.
(2) Includes stock-based compensation expense of $74,975, $43,837, and $29,927 for the years endedDecember 31, 2011, 2010 and 2009, respectively, and stock-based Indian fringe benefit tax expense of $758for the year ended December 31, 2009, and is exclusive of depreciation and amortization expense.
The following table includes non-GAAP income from operations, excluding stock-based compensation andapplicable stock-based Indian fringe benefit tax expense, a measure defined by the Securities and ExchangeCommission as a non-GAAP financial measure. This non-GAAP financial measure is not based on anycomprehensive set of accounting rules or principles and should not be considered a substitute for, or superior to,financial measures calculated in accordance with GAAP, and may be different from non-GAAP measures usedby other companies. In addition, this non-GAAP measure, the financial statements prepared in accordance withGAAP and reconciliations of our GAAP financial statements to such non-GAAP measure should be carefullyevaluated.
We seek to manage the company to a targeted operating margin, excluding stock-based compensationexpense and applicable stock-based Indian fringe benefit tax expense, of 19% to 20% of revenues. Accordingly,we believe that non-GAAP income from operations, excluding stock-based compensation expense and applicablestock-based Indian fringe benefit tax, which was repealed during the third quarter of 2009, retroactive to April 1,
51

2009, is a meaningful measure for investors to evaluate our financial performance. For our internal managementreporting and budgeting purposes, we use financial statements that do not include stock-based compensationexpense and applicable stock-based Indian fringe benefit tax expense for financial and operational decisionmaking, to evaluate period-to-period comparisons and for making comparisons of our operating results to that ofour competitors. Moreover, because of varying available valuation methodologies and the variety of award typesthat companies can use to account for stock-based compensation expense, we believe that providing a non-GAAPfinancial measure that excludes stock-based compensation expense and applicable stock-based Indian fringebenefit tax expense allows investors to make additional comparisons between our operating results and those ofother companies. Accordingly, we believe that the presentation of non-GAAP income from operations when readin conjunction with our reported GAAP income from operations can provide useful supplemental information toour management and to investors regarding financial and business trends relating to our financial condition andresults of operations.
A limitation of using non-GAAP income from operations versus income from operations reported inaccordance with GAAP is that non-GAAP income from operations excludes stock-based compensation expense,which is recurring. Stock-based compensation expense will continue to be for the foreseeable future a significantrecurring expense in our business. In addition, other companies may calculate non-GAAP financial measuresdifferently than us, thereby limiting the usefulness of this non-GAAP financial measure as a comparative tool.We compensate for these limitations by providing specific information regarding the GAAP amounts excludedfrom non-GAAP income from operations and evaluating such non-GAAP financial measures with financialmeasures calculated in accordance with GAAP.
A reconciliation of income from operations as reported and non-GAAP income from operations, excludingstock-based compensation expense and stock-based Indian fringe benefit tax expense, is as follows for the yearsended December 31:
(Dollars in thousands)
2011% of
Revenues 2010% of
Revenues 2009% of
Revenues
Income from operations, as reported . . . . . $1,136,468 18.6 $861,852 18.8 $618,490 18.9Add: stock-based compensationexpense . . . . . . . . . . . . . . . . . . . . . . 90,232 1.4 56,984 1.2 44,816 1.4
Add: stock-based Indian fringebenefit tax expense . . . . . . . . . . . . . — — — — 945 —
Non-GAAP income from operations,excluding stock-based compensationexpense and stock-based Indian fringebenefit tax expense . . . . . . . . . . . . . . . . . $1,226,700 20.0 $918,836 20.0 $664,251 20.3
The fringe benefit tax regulation in India obligated us to pay, upon exercise or distribution of shares under astock-based compensation award, a non-income related tax on the appreciation of the award from date of grant todate of vest. There was no cash cost to us as we recovered the cost of the Indian fringe benefit tax from theemployee’s proceeds from the award. Under U.S. GAAP, the stock-based Indian fringe benefit tax expense isrequired to be recorded as an operating expense and the related recovery of such tax from our employee isrequired to be recorded to stockholders’ equity as proceeds from a stock-based compensation award. During thethird quarter of 2009, the Indian government repealed the fringe benefit tax retroactive to April 1, 2009.
Year Ended December 31, 2011 Compared to Year Ended December 31, 2010
Revenue. Revenue increased by 33.3%, or approximately $1,528.8 million, from approximately$4,592.4 million during 2010 to approximately $6,121.2 million in 2011. This increase was primarily attributed
52

to greater acceptance of the global delivery model among an increasing number of industries, continued interestin using the global delivery model as a means to reduce overall IT costs and increased customer spending ondiscretionary development projects. Revenue from customers existing as of December 31, 2010 increased byapproximately $1,371.3 million and revenue from new customers added during 2011 was approximately$157.5 million or approximately 10.3% of the year over year revenue increase and 2.6% of total revenues for theyear ended December 31, 2011. In addition, revenue from our North American and European customersincreased in 2011 by $1,220.2 million and $241.9 million, respectively, as compared to 2010. We hadapproximately 785 active clients as of December 31, 2011 as compared to approximately 712 active clients as ofDecember 31, 2010. In addition, we experienced strong demand across all of our business segments for anincreasingly broad range of services. Our Financial Services and Healthcare business segments accounted forapproximately $574.0 million and $445.0 million, respectively, of the $1,528.8 million increase in revenue.Additionally, our IT consulting and technology services and IT outsourcing revenues increased by approximately40.7% and 26.4%, respectively, compared to 2010 and represented approximately 50.9% and 49.1%,respectively, of total revenues in 2011. No customer accounted for sales in excess of 10% of revenues during2011 or 2010.
Cost of Revenues (Exclusive of Depreciation and Amortization Expense). Our cost of revenues consistsprimarily of salaries, incentive-based compensation, stock-based compensation expense, payroll taxes,employees benefits, immigration and project-related travel for technical personnel, subcontracting and salescommissions related to revenues. Our cost of revenues increased by approximately 33.3% or $884.0 million from$2,654.6 million during 2010 to $3,538.6 million in 2011. The increase was due primarily to an increase incompensation and benefits costs of approximately $821.8 million, resulting from the increase in the number ofour technical personnel necessary to support our revenue growth.
Selling, General and Administrative Expenses. Selling, general and administrative expenses consistprimarily of salaries, incentive-based compensation, stock-based compensation expense, payroll taxes, employeebenefits, travel, promotion, communications, management, finance, administrative and occupancy costs. Selling,general and administrative expenses, including depreciation and amortization, increased by approximately 34.4%or $370.1 million, from $1,076.0 million during 2010, to $1,446.1 million during 2011, and increased as apercentage of revenue from 23.4% in 2010 to 23.6% in 2011. The increase as a percentage of revenue was dueprimarily to increases in compensation and benefit costs and investments to grow our business, includingexpanded sales and marketing activities.
Income from Operations. Income from operations increased approximately 31.9%, or $274.6 million, fromapproximately $861.9 million during 2010 to approximately $1,136.5 million during 2011, representingoperating margins of 18.6% of revenues in 2011 and 18.8% of revenues in 2010. The decrease in operatingmargin was attributed to an increase in compensation and benefit costs and investments to grow our business,including expanded sales and marketing activities. Excluding the impact of applicable designated cash flowhedges, the depreciation of the Indian rupee against the U.S. dollar positively impacted our operating margin byapproximately 54 basis points or 0.54 percentage points. Each additional 1.0% change in the exchange ratebetween the Indian rupee and the U.S. dollar will have the effect of moving our operating margin byapproximately 27 basis points or 0.27 percentage points. Excluding stock-based compensation expense of $90.2million and $57.0 million for 2011 and 2010, respectively, operating margins for the years ended December 31,2011 and 2010 were 20.0% and 20.0%, respectively.
We entered into foreign exchange forward contracts to hedge certain Indian rupee denominated payments inIndia. These hedges are intended to mitigate the volatility of the changes in the exchange rate between the U.S.dollar and the Indian rupee. During 2011, settlement of certain cash flow hedges favorably impacted ouroperating margin by approximately 31 basis points or 0.31 percentage points.
53

Other Income (Expense), Net. Total other income (expense), net consists primarily of foreign currencyexchange gains and (losses) and interest income. The following table sets forth, for the periods indicated, Totalother income (expense), net:
(Dollars in thousands)
2011 2010Increase/(Decrease)
Foreign currency exchange (losses) gains . . . . . . . . . . . . . . . . . . . . . . . . . . . . . . $(32,400) $ 11,220 $(43,620)Gains (losses) on foreign exchange forward contracts not designated ashedging instruments . . . . . . . . . . . . . . . . . . . . . . . . . . . . . . . . . . . . . . . . . . . . 23,621 (21,088) 44,709
Net foreign currency exchange (losses) . . . . . . . . . . . . . . . . . . . . . . . . . . . (8,779) (9,868) 1,089Interest income . . . . . . . . . . . . . . . . . . . . . . . . . . . . . . . . . . . . . . . . . . . . . . . . . . 39,249 25,793 13,456Other, net . . . . . . . . . . . . . . . . . . . . . . . . . . . . . . . . . . . . . . . . . . . . . . . . . . . . . . . 2,211 803 1,408
Total other income (expense), net . . . . . . . . . . . . . . . . . . . . . . . . . . . . . . . . . . . . $ 32,681 $ 16,728 $ 15,953
The foreign currency exchange losses of approximately $32.4 million were primarily attributed to theremeasurement of the Indian rupee net monetary assets on Cognizant India’s books to the U.S. dollar functionalcurrency. The $23.6 million of gains on foreign exchange forward contracts were primarily related to the changein fair value of foreign exchange forward contracts entered into to offset foreign currency exposure to Indianrupee denominated net monetary assets and the realized losses related to the settlement of certain foreignexchange forward contracts in 2011. At December 31, 2011, the notional value of our undesignated hedges was$234.2 million. The $13.5 million increase in interest income was primarily attributed to higher investedbalances.
Provision for Income Taxes. The provision for income taxes increased from approximately $145.0 million in2010 to approximately $285.5 million in 2011. The effective income tax rate increased from 16.5% in 2010 to24.4% in 2011. The increase in our effective income tax rate was primarily attributed to the expiration of India’sSTP tax holiday program in 2011.
Net Income. Net income increased from approximately $733.5 million in 2010 to approximately$883.6 million in 2011, representing 16.0% and 14.4% of revenues, respectively. The decrease in net income as apercentage of revenues in 2011 is primarily attributed to a higher effective income tax rate in 2011.
Year Ended December 31, 2010 Compared to Year Ended December 31, 2009
Revenue. Revenue increased by 40.1%, or approximately $1,313.7 million, from approximately$3,278.7 million during 2009 to approximately $4,592.4 million in 2010. This increase was primarily attributedto greater acceptance of the global delivery model among an increasing number of industries, continued interestin using the global delivery model as a means to reduce overall IT costs, increased customer spending on post-acquisition integration engagements and discretionary development projects, and greater penetration in theEuropean market. Revenue from customers existing as of December 31, 2009 increased by approximately$1,193.3 million and revenue from new customers added during 2010 was approximately $120.4 million orapproximately 9.2% of the year over year revenue increase and 2.6% of total revenues for the year endedDecember 31, 2010. In addition, revenue from our North American and European customers increased in 2010by $988.5 million and $248.8 million, respectively, as compared to 2009. We had approximately 712 activeclients as of December 31, 2010 as compared to approximately 589 active clients as of December 31, 2009. Inaddition, during 2010 we experienced strong demand across all of our business segments for an increasinglybroad range of services. Our Financial Services and Healthcare business segments accounted for approximately
54

$537.8 million and $316.7 million, respectively, of the $1,313.7 million increase in revenue. Additionally, our ITconsulting and technology services and IT outsourcing revenues increased by approximately 52.1% and 30.4%,respectively, compared to 2009 and represented approximately 48.3% and 51.7%, respectively, of total revenuesin 2010. No customer accounted for sales in excess of 10% of revenues during 2010 or 2009.
Cost of Revenues (Exclusive of Depreciation and Amortization Expense). Our cost of revenues consistsprimarily of salaries, incentive-based compensation, stock-based compensation expense, payroll taxes, benefits,immigration and project-related travel for technical personnel, subcontracting and sales commissions related torevenues. Our cost of revenues increased by approximately 43.5% or $805.2 million from $1,849.4 millionduring 2009 to $2,654.6 million in 2010. The increase was due primarily to an increase in compensation andbenefits costs of approximately $671.2 million, resulting from the increase in the number of our technicalpersonnel and incentive-based compensation, as well as the appreciation of the Indian rupee versus the U.S.dollar.
Selling, General and Administrative Expenses. Selling, general and administrative expenses consistprimarily of salaries, incentive-based compensation, stock-based compensation expense, payroll taxes, employeebenefits, travel, promotion, communications, management, finance, administrative and occupancy costs. Selling,general and administrative expenses, including depreciation and amortization, increased by approximately 32.7%or $265.2 million, from $810.7 million during 2009, to $1,075.9 million during 2010, and decreased as apercentage of revenue from 24.7% in 2009 to 23.4% in 2010. The decrease as a percentage of revenue was dueprimarily to economies of scale driven by increased revenues that resulted from our expanded sales andmarketing activities in the current and prior years that allowed us to leverage our cost structure over a largerorganization, partially offset by an increase in compensation and benefit costs, including incentive-basedcompensation and the impact of the appreciation of the Indian rupee versus the U.S. dollar.
Income from Operations. Income from operations increased approximately 39.3%, or $243.4 million, fromapproximately $618.5 million during 2009 to approximately $861.9 million during 2010, representing operatingmargins of 18.8% of revenues in 2010 and 18.9% of revenues in 2009. The operating margin was impacted by anincrease in compensation and benefit costs, including incentive-based compensation costs, and investments togrow our business, partially offset by expanded sales and marketing activities in the current and prior years thatallowed us to leverage our cost structure over a larger organization. Excluding the impact of applicabledesignated cash flow hedges, the appreciation of the Indian rupee against the U.S. dollar negatively impacted ouroperating margin by approximately 157 basis points or 1.57 percentage points. Each additional 1.0% change inthe exchange rate between the Indian rupee and the U.S. dollar will have the effect of moving our operatingmargin by approximately 27 basis points or 0.27 percentage points. Excluding stock-based compensation expenseof $57.0 million and $44.8 million for 2010 and 2009 and stock-based Indian fringe benefit tax expense of $0.9million in 2009, operating margins for the years ended December 31, 2010 and 2009 were 20.0% and 20.3%,respectively.
We entered into foreign exchange forward contracts to hedge certain Indian rupee denominated payments inIndia. These hedges are intended to mitigate the volatility of the changes in the exchange rate between the U.S.dollar and the Indian rupee. During 2010, settlement of certain cash flow hedges favorably impacted ouroperating margin by approximately 91 basis points or 0.91 percentage points.
55

Other Income (Expense), Net. Total other income (expense), net consists primarily of foreign currency exchangegains and (losses) and interest income. The following table sets forth, for the periods indicated, Total otherincome (expense), net:
(Dollars in thousands)
2010 2009Increase/(Decrease)
Foreign currency exchange gains . . . . . . . . . . . . . . . . . . . . . . . . . $ 11,220 $ 22,493 $(11,273)(Losses) on foreign exchange forward contracts not designatedas hedging instruments . . . . . . . . . . . . . . . . . . . . . . . . . . . . . . . (21,088) (20,821) (267)
Net foreign currency exchange (losses) gains . . . . . . . . . . . . (9,868) 1,672 (11,540)Interest income . . . . . . . . . . . . . . . . . . . . . . . . . . . . . . . . . . . . . . . 25,793 15,895 9,898Other, net . . . . . . . . . . . . . . . . . . . . . . . . . . . . . . . . . . . . . . . . . . . . 803 894 (91)
Total other income (expense), net . . . . . . . . . . . . . . . . . . . . . . . . . $ 16,728 $ 18,461 $ (1,733)
The foreign currency exchange gains of approximately $11.2 million were primarily attributed tointercompany balances between our European subsidiaries and Cognizant India for services performed byCognizant India on behalf of our European customers and the remeasurement of the Indian rupee net monetaryassets on Cognizant India’s books to the U.S. dollar functional currency. The $21.1 million of losses on foreignexchange forward contracts were related to the change in fair value of foreign exchange forward contractsentered into to offset foreign currency exposure to Indian rupee denominated net monetary assets and the realizedlosses related to the settlement of certain foreign exchange forward contracts in 2010. At December 31, 2010, thenotional value of these undesignated hedges was $234.0 million. The $9.9 million increase in interest income wasprimarily attributed to higher invested balances.
Provision for Income Taxes. The provision for income taxes increased from approximately $102.0 million in2009 to approximately $145.0 million in 2010. The effective income tax rate increased from 16.0% in 2009 to16.5% in 2010. The increase in our effective income tax rate was primarily attributed to discrete tax items in2010, a higher U.S. state effective income tax rate in 2010, as well as an increase in our taxable income in Indiaresulting from an increase in non-export profits that are taxable at the India statutory rate.
Net Income. Net income increased from approximately $535.0 million in 2009 to approximately$733.5 million in 2010, representing 16.3% and 16.0% of revenues, respectively. The decrease in net income as apercentage of revenues in 2010 is primarily attributed to an increase in net foreign currency exchange losses anda higher effective income tax rate.
Results by Business Segment
Our reportable segments are: Financial Services, which includes customers providing banking / transactionprocessing, capital markets and insurance services; Healthcare, which includes healthcare providers and payersas well as life sciences customers; Manufacturing/Retail/Logistics, which includes manufacturers, retailers, traveland other hospitality customers, as well as customers providing logistics services; and Other, which is anaggregation of industry operating segments which, individually, are less than 10.0% of consolidated revenues andsegment operating profit. The Other segment includes information, media and entertainment services,communications, and high technology operating segments. Our sales managers, account executives, accountmanagers and project teams are aligned in accordance with the specific industries they serve.
Our chief operating decision maker evaluates Cognizant’s performance and allocates resources based onsegment revenues and operating profit. Segment operating profit is defined as income from operations beforeunallocated costs. Generally, operating expenses for each operating segment have similar characteristics and are
56

subject to the same factors, pressures and challenges. However, the economic environment and its effects onindustries served by our operating groups may affect revenue and operating expenses to differing degrees.Expenses included in segment operating profit consist principally of direct selling and delivery costs as well as aper seat charge for use of the development and delivery centers. Certain selling, general and administrativeexpenses, excess or shortfall of incentive compensation for delivery personnel as compared to target, a portion ofdepreciation and amortization, stock-based compensation expense and the related stock-based Indian fringebenefit tax, and the impact of the settlements of our cash flow hedges are not allocated to individual segments ininternal management reports used by the chief operating decision maker. Accordingly, such expenses areexcluded from segment operating profit.
As of December 31, 2011, we had approximately 785 active customers. Accordingly, we provide asignificant volume of services to many customers in each of our business segments. Therefore, a loss of asignificant customer or a few significant customers in a particular segment could materially reduce revenues forsuch segment. However, no individual customer exceeded 10.0% of our consolidated revenues for the yearsended December 31, 2011, 2010, or 2009. In addition, the services we provide to our larger customers are oftencritical to the operations of such customers and a termination of our services would require an extended transitionperiod with gradual declining revenues.
Revenues from external customers and segment operating profit, before unallocated expenses, for theFinancial Services, Healthcare, Manufacturing/Retail/Logistics, and Other segments for the years endedDecember 31, 2011, 2010, and 2009 are as follows:
2011 2010
2011 2010 2009 Increase % Increase %
(Dollars in thousands)
Revenues:Financial Services . . . . . . $2,518,422 $1,944,450 $1,406,629 $ 573,972 29.5 $ 537,821 38.2Healthcare . . . . . . . . . . . . 1,622,157 1,177,113 860,427 445,044 37.8 316,686 36.8Manufacturing/Retail/Logistics . . . . . . . . . . . 1,197,472 849,643 564,917 347,829 40.9 284,726 50.4
Other . . . . . . . . . . . . . . . . 783,105 621,183 446,690 161,922 26.1 174,493 39.1
Total revenues . . . . . $6,121,156 $4,592,389 $3,278,663 $1,528,767 33.3 $1,313,726 40.1
Segment Operating Profit:Financial Services . . . . . . $ 872,267 $ 668,595 $ 503,689 $ 203,672 30.5 $ 164,906 32.7Healthcare . . . . . . . . . . . . 625,052 436,879 331,007 188,173 43.1 105,872 32.0Manufacturing/Retail/Logistics . . . . . . . . . . . 440,416 283,676 184,636 156,740 55.3 99,040 53.6
Other . . . . . . . . . . . . . . . . 254,145 208,306 147,246 45,839 22.0 61,060 41.5
Total segmentoperating profit . . $2,191,880 $1,597,456 $1,166,578 $ 594,424 37.2 $ 430,878 36.9
Year Ended December 31, 2011 Compared to Year Ended December 31, 2010
Financial Services Segment
Revenue. Revenue increased by 29.5%, or approximately $573.9 million, from approximately$1,944.5 million during 2010 to approximately $2,518.4 million in 2011. The increase in revenue was primarilydriven by continued expansion of existing customer relationships as well as revenue contributed by newcustomers. The increase in revenue from customers existing as of December 31, 2010 and customers addedduring 2011 was approximately $531.3 million and approximately $42.6 million, respectively. Within thesegment, revenue from our banking and insurance customers increased approximately $395.7 million and $178.2
57

million, respectively, over the prior year. Overall, the full year 2011 increase in the segment can also beattributed to leveraging sales and marketing investments in this business segment as well as greater acceptance ofour global services delivery model and increased customer spending on discretionary development projects.
Segment Operating Profit. Segment operating profit increased by 30.5%, or approximately $203.7 million,from approximately $668.6 million during 2010 to approximately $872.3 million during 2011. The increase insegment operating profit was attributable primarily to increased revenues during the year.
Healthcare Segment
Revenue. Revenue increased by 37.8%, or approximately $445.0 million, from approximately$1,177.1 million during 2010 to approximately $1,622.2 million in 2011. The increase in revenue was primarilydriven by continued expansion of existing customer relationships as well as revenue contributed by newcustomers. The increase in revenue from customers existing as of December 31, 2010 and customers addedduring 2011 was approximately $394.7 million and approximately $50.3 million, respectively. Within thesegment, growth was strong among both our healthcare and life sciences customers, where revenue during 2011increased by approximately $279.8 million and $165.2 million, respectively. The increase can also be attributedto leveraging sales and marketing investments in this business segment as well as greater acceptance of ourglobal services delivery model and increased customer spending on discretionary development projects.
Segment Operating Profit. Segment operating profit increased 43.1%, or approximately $188.2 million,from approximately $436.9 million during 2010 to approximately $625.1 million during 2011. The increase insegment operating profit was attributable primarily to increased revenues, achieving operating efficiencies,including continued leverage of prior sales and marketing investments, and the impact of the depreciation of theIndian rupee versus the U.S. dollar, partially offset by an increase in compensation and benefit costs resultingfrom additional headcount to support our revenue growth.
Manufacturing/Retail/Logistics Segment
Revenue. Revenue increased by 40.9%, or approximately $347.8 million, from approximately$849.6 million during 2010 to approximately $1,197.5 million in 2011. The increase in revenue was primarilydriven by continued expansion of existing customer relationships as well as revenue contributed by newcustomers. The increase in revenue from customers existing as of December 31, 2010 and customers addedduring 2011 was approximately $307.2 million and approximately $40.6 million, respectively. Within thesegment, growth was strong among both our retail and hospitality and manufacturing and logistics customers,where revenue during 2011 increased by approximately $221.7 million and $126.1 million, respectively. Theincrease can also be attributed to leveraging sales and marketing investments in this business segment as well asgreater acceptance of our global services delivery model and increased customer spending on discretionarydevelopment projects.
Segment Operating Profit. Segment operating profit increased 55.3%, or approximately $156.7 million,from approximately $283.7 million during 2010 to approximately $440.4 million during 2011. The increase insegment operating profit was attributable primarily to increased revenues during the year, achieving operatingefficiencies, including continued leverage of prior sales and marketing investments, and the impact of thedepreciation of the Indian rupee versus the U.S. dollar, partially offset by an increase in compensation andbenefit costs resulting from additional headcount to support our revenue growth.
Other Segment
Revenue. Revenue increased by 26.1%, or approximately $161.9 million, from approximately$621.2 million in 2010 to approximately $783.1 million in 2011. The increase in revenue was primarily driven bycontinued expansion of existing customer relationships as well as revenue contributed by new customers. The
58

increase in revenue from customers existing as of December 31, 2010 and customers added during 2011 wasapproximately $137.9 million and approximately $24.0 million, respectively. Within the Other segment, growthwas particularly strong among our telecommunication customers, where revenue during 2011 increasedapproximately $75.7 million. The increase can also be attributed to leveraging sales and marketing investmentsin this business segment as well as greater acceptance of our global services delivery model and increasedcustomer spending on discretionary development projects.
Segment Operating Profit. Segment operating profit increased 22.0%, or approximately $45.8 million, fromapproximately $208.3 million in 2010 to approximately $254.1 million in 2011. The increase in segmentoperating profit was attributable primarily to increased revenues during the year and the impact of thedepreciation of the Indian rupee versus the U.S. dollar, partially offset by an increase in compensation andbenefit costs resulting from additional headcount to support our revenue growth, continued investment in salesand marketing and an increase in compensation and benefit costs.
Year Ended December 31, 2010 Compared to Year Ended December 31, 2009
Financial Services Segment
Revenue. Revenue increased by 38.2%, or approximately $537.8 million, from approximately$1,406.6 million during 2009 to approximately $1,944.5 million in 2010. The increase in revenue was primarilydriven by continued expansion of existing customer relationships as well as revenue contributed by newcustomers. The increase in revenue from customers existing as of December 31, 2009 and customers addedduring 2010 was approximately $508.1 million and approximately $29.7 million, respectively. Within thesegment, revenue from our banking and insurance customers increased approximately $410.3 million and $127.5million, respectively, over the prior year. Overall, the full year 2010 increase in the segment can also beattributed to leveraging sales and marketing investments in this business segment as well as greater acceptance ofour global services delivery model and increased customer spending on post-acquisition integration engagementsand discretionary development projects.
Segment Operating Profit. Segment operating profit increased by 32.7%, or approximately $164.9 million,from approximately $503.7 million during 2009 to approximately $668.6 million during 2010. The increase insegment operating profit was attributable primarily to increased revenues, partially offset by additional headcountto support our revenue growth, continued investment in sales and marketing, an increase in compensation andbenefit costs and the impact of the appreciation of the Indian rupee versus the U.S. dollar.
Healthcare Segment
Revenue. Revenue increased by 36.8%, or approximately $316.7 million, from approximately$860.4 million during 2009 to approximately $1,177.1 million in 2010. The increase in revenue was primarilydriven by continued expansion of existing customer relationships as well as revenue contributed by newcustomers. The increase in revenue from customers existing as of December 31, 2009 and customers addedduring 2010 was approximately $293.9 million and approximately $22.8 million, respectively. Within thesegment, growth was strong among both our healthcare and life sciences customers, where revenue during 2010increased by approximately $205.4 million and $111.3 million, respectively. The increase can also be attributedto leveraging sales and marketing investments in this business segment as well as greater acceptance of ourglobal services delivery model and increase in discretionary development projects.
Segment Operating Profit. Segment operating profit increased 32.0%, or approximately $105.9 million,from approximately $331.0 million during 2009 to approximately $436.9 million during 2010. The increase insegment operating profit was attributable primarily to increased revenues, partially offset by additional headcountto support our revenue growth, continued investment in sales and marketing, an increase in compensation andbenefit costs and the impact of the appreciation of the Indian rupee versus the U.S. dollar.
59

Manufacturing/Retail/Logistics Segment
Revenue. Revenue increased by 50.4%, or approximately $284.7 million, from approximately$564.9 million during 2009 to approximately $849.6 million in 2010. The increase in revenue was primarilydriven by continued expansion of existing customer relationships as well as revenue contributed by newcustomers. The increase in revenue from customers existing as of December 31, 2009 and customers addedduring 2010 was approximately $241.7 million and approximately $43.0 million, respectively. Within thesegment, growth was strong among both our retail and hospitality and manufacturing and logistics customers,where revenue during 2010 increased by approximately $159.6 million and $125.1 million, respectively. Theincrease can also be attributed to leveraging sales and marketing investments in this business segment as well asgreater acceptance of our global services delivery model and increase in discretionary development projects.
Segment Operating Profit. Segment operating profit increased 53.6%, or approximately $99.1 million, fromapproximately $184.6 million during 2009 to approximately $283.7 million during 2010. The increase in segmentoperating profit was attributable primarily to increased revenues during the year and achieving operatingefficiencies, including continued leverage of prior sales and marketing investments, partially offset by additionalheadcount to support our revenue growth, an increase in compensation and benefit costs and the impact of theappreciation of the Indian rupee versus the U.S. dollar.
Other Segment
Revenue. Revenue increased by 39.1%, or approximately $174.5 million, from approximately$446.7 million in 2009 to approximately $621.2 million in 2010. The increase in revenue was primarily driven bycontinued expansion of existing customer relationships as well as revenue contributed by new customers. Theincrease in revenue from customers existing as of December 31, 2009 and customers added during 2010 wasapproximately $149.6 million and approximately $24.9 million, respectively. Within the Other segment, growthwas particularly strong among both our information, media and entertainment services customers and ourtelecommunication customers, where revenue during 2010 increased approximately $74.1 million and $56.6million, respectively. The increase can also be attributed to leveraging sales and marketing investments in thisbusiness segment as well as greater acceptance of our global services delivery model and increase indiscretionary development projects.
Segment Operating Profit. Segment operating profit increased 41.5%, or approximately $61.1 million, fromapproximately $147.2 million in 2009 to approximately $208.3 million in 2010. The increase in segmentoperating profit was attributable primarily to increased revenues during the year and achieving operatingefficiencies, including continual leverage of prior sales and marketing investments, partially offset by additionalheadcount to support our revenue growth, an increase in compensation and benefit costs and the impact of theappreciation of the Indian rupee versus the U.S. dollar.
Liquidity and Capital Resources
At December 31, 2011, we had cash and cash equivalents and short-term investments of $2,432.3 million.We have used, and plan to use, such cash for expansion of existing operations, including our offshoredevelopment and delivery centers; continued development of new service lines; possible acquisitions of relatedbusinesses; formation of joint ventures; stock repurchases; and general corporate purposes, including workingcapital. As of December 31, 2011, we had no third party debt and had working capital of approximately $2,875.8million as compared to working capital of approximately $2,587.5 million as of December 31, 2010.Accordingly, we do not anticipate any near-term liquidity issues.
Net cash provided by operating activities was approximately $875.2 million for the year endedDecember 31, 2011, $764.7 million for the year ended December 31, 2010 and $672.3 million for the year endedDecember 31, 2009. The increase in both years is primarily attributed to the increase in our net income. Trade
60

accounts receivable increased from approximately $626.3 million at December 31, 2009 to approximately$901.3 million at December 31, 2010 and to approximately $1,179.0 million at December 31, 2011. Unbilledaccounts receivable increased from approximately $83.0 million at December 31, 2009 to approximately $113.0at December 31, 2010 and to approximately $139.6 million at December 31, 2011. The increase in trade accountsreceivable and unbilled receivables during 2011 was due primarily to increased revenues. We monitor turnover,aging and the collection of accounts receivable through the use of management reports that are prepared on acustomer basis and evaluated by our finance staff. At December 31, 2009, our days sales outstanding, includingunbilled receivables, was approximately 72 days as compared to 71 days as of December 31, 2010 and 73 days asof December 31, 2011.
Our investing activities used net cash of approximately $850.3 million for the year ended December 31,2011, $446.9 million for the year ended December 31, 2010 and $394.8 million for the year ended December 31,2009. The increase in net cash used in investing activities during 2011 is related to an increase in net purchasesof investments, an increase in capital expenditures during the year and increased payments for acquisitions. Theincrease in net cash used in investing activities during 2010 as compared to 2009 related to an increase in capitalexpenditures during the year partially offset by decreased payments for acquisitions and a decrease in netpurchases of investments.
Our financing activities used net cash of approximately $255.5 million for the year ended December 31,2011, and provided net cash of approximately $120.0 million for the year ended December 31, 2010 and$76.9 million for the year ended December 31, 2009. The increase in net cash used in financing activities in 2011is primarily related to additional repurchases of our common stock under our stock repurchase program. Theincrease in net cash provided by the financing activities in 2010 as compared to 2009 was related to additionalproceeds and excess tax benefits from issuances under our stock-based compensation plans partially offset byadditional repurchases of our common stock under our stock repurchase program.
As of December 31, 2011, a majority of our cash, cash equivalents and short-term investments was held byour foreign subsidiaries. We utilize a variety of tax planning and financing strategies in an effort to ensure thatour worldwide cash is available in the locations in which it is needed. Most of the amounts held outside of theUnited States could be repatriated to the United States but, under current law, would be subject to United Statesfederal income taxes, less applicable foreign tax credits. However, other than amounts representing pre-2002undistributed Indian earnings for which we have already accrued U.S. taxes, our intent is to permanently reinvestthese funds outside the U.S. and our current plans do not demonstrate a need to repatriate these amounts to fundour U.S. operations.
Our ability to expand and grow our business in accordance with current plans, to make acquisitions andform joint ventures and to meet our long-term capital requirements beyond a twelve month period will depend onmany factors, including the rate, if any, at which our cash flow increases, our ability and willingness toaccomplish acquisitions and joint ventures with capital stock, our continued intent not to repatriate foreignearnings, and the availability of public and private debt and equity financing. We cannot be certain thatadditional financing, if required, will be available on terms favorable to us, if at all. We expect our operating cashflow and cash and cash equivalents to be sufficient to meet our operating requirements for the next twelvemonths. There were no off-balance sheet transactions, arrangements or other relationships with unconsolidatedentities or other persons in 2011, 2010, and 2009 that would have affected our liquidity or the availability of, orrequirements for, capital resources.
61
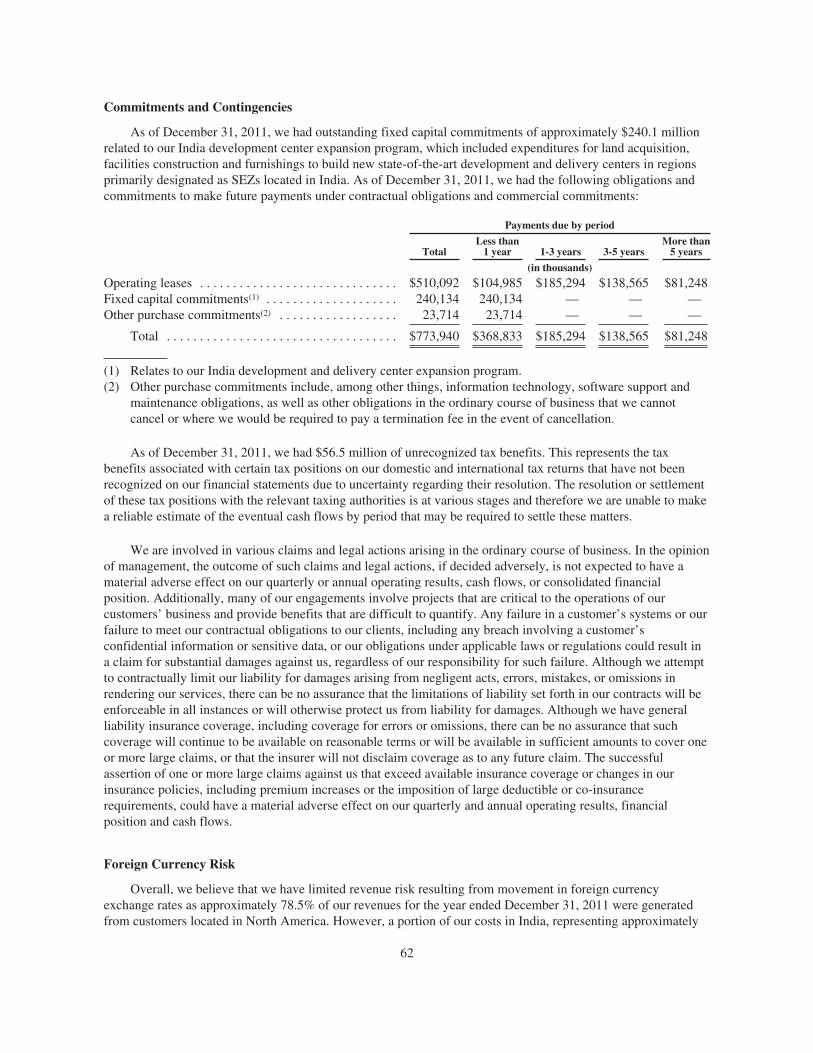
Commitments and Contingencies
As of December 31, 2011, we had outstanding fixed capital commitments of approximately $240.1 millionrelated to our India development center expansion program, which included expenditures for land acquisition,facilities construction and furnishings to build new state-of-the-art development and delivery centers in regionsprimarily designated as SEZs located in India. As of December 31, 2011, we had the following obligations andcommitments to make future payments under contractual obligations and commercial commitments:
Payments due by period
TotalLess than1 year 1-3 years 3-5 years
More than5 years
(in thousands)
Operating leases . . . . . . . . . . . . . . . . . . . . . . . . . . . . . . $510,092 $104,985 $185,294 $138,565 $81,248Fixed capital commitments(1) . . . . . . . . . . . . . . . . . . . . 240,134 240,134 — — —Other purchase commitments(2) . . . . . . . . . . . . . . . . . . 23,714 23,714 — — —
Total . . . . . . . . . . . . . . . . . . . . . . . . . . . . . . . . . . . $773,940 $368,833 $185,294 $138,565 $81,248
(1) Relates to our India development and delivery center expansion program.(2) Other purchase commitments include, among other things, information technology, software support and
maintenance obligations, as well as other obligations in the ordinary course of business that we cannotcancel or where we would be required to pay a termination fee in the event of cancellation.
As of December 31, 2011, we had $56.5 million of unrecognized tax benefits. This represents the taxbenefits associated with certain tax positions on our domestic and international tax returns that have not beenrecognized on our financial statements due to uncertainty regarding their resolution. The resolution or settlementof these tax positions with the relevant taxing authorities is at various stages and therefore we are unable to makea reliable estimate of the eventual cash flows by period that may be required to settle these matters.
We are involved in various claims and legal actions arising in the ordinary course of business. In the opinionof management, the outcome of such claims and legal actions, if decided adversely, is not expected to have amaterial adverse effect on our quarterly or annual operating results, cash flows, or consolidated financialposition. Additionally, many of our engagements involve projects that are critical to the operations of ourcustomers’ business and provide benefits that are difficult to quantify. Any failure in a customer’s systems or ourfailure to meet our contractual obligations to our clients, including any breach involving a customer’sconfidential information or sensitive data, or our obligations under applicable laws or regulations could result ina claim for substantial damages against us, regardless of our responsibility for such failure. Although we attemptto contractually limit our liability for damages arising from negligent acts, errors, mistakes, or omissions inrendering our services, there can be no assurance that the limitations of liability set forth in our contracts will beenforceable in all instances or will otherwise protect us from liability for damages. Although we have generalliability insurance coverage, including coverage for errors or omissions, there can be no assurance that suchcoverage will continue to be available on reasonable terms or will be available in sufficient amounts to cover oneor more large claims, or that the insurer will not disclaim coverage as to any future claim. The successfulassertion of one or more large claims against us that exceed available insurance coverage or changes in ourinsurance policies, including premium increases or the imposition of large deductible or co-insurancerequirements, could have a material adverse effect on our quarterly and annual operating results, financialposition and cash flows.
Foreign Currency Risk
Overall, we believe that we have limited revenue risk resulting from movement in foreign currencyexchange rates as approximately 78.5% of our revenues for the year ended December 31, 2011 were generatedfrom customers located in North America. However, a portion of our costs in India, representing approximately
62

33.2% of our global operating costs for the year ended December 31, 2011, are denominated in the Indian rupeeand are subject to foreign exchange rate fluctuations. These foreign currency exchange rate fluctuations have animpact on our results of operations. In addition, a portion of our balance sheet is exposed to foreign currencyexchange rate fluctuations, which may result in non-operating foreign currency exchange gains or losses uponremeasurement. In 2011 and 2010, we reported foreign currency exchange (losses) and gains, exclusive ofhedging gains or losses, of approximately ($32.4) million and $11.2 million, respectively, which were primarilyattributed to the remeasurement of Indian rupee net monetary assets on Cognizant India’s books to the U.S.dollar functional currency. On an ongoing basis, we manage a portion of this risk by limiting our net monetaryasset exposure to certain currencies in our foreign subsidiaries, primarily the Indian rupee.
We entered into a series of foreign exchange forward contracts that are designated as cash flow hedges ofcertain Indian rupee denominated payments in India. Cognizant India converts U.S. dollar receipts fromintercompany billings to Indian rupees to fund local expenses. These hedges to buy Indian rupees and sell U.S.dollars are intended to partially offset the impact of movement of exchange rates on future operating costs.During 2011 and 2010, we recorded income of $18.8 million and $41.6 million, respectively, on contracts thatsettled during each year. As of December 31, 2011, we have outstanding contracts with a notional value of$1,193.5 million and a weighted average forward rate of 49.1 rupees to the U.S. dollar scheduled to mature in2012, outstanding contracts with a notional value of $1,080.0 million and a weighted average forward rate of50.4 rupees to the U.S. dollar scheduled to mature in 2013, outstanding contracts with a notional value of $810.0million and a weighted average forward rate of 52.7 rupees to the U.S. dollar scheduled to mature in 2014, andoutstanding contracts with a notional value of $420.0 million and a weighted average forward rate of 54.3 rupeesto the U.S. dollar scheduled to mature in 2015.
Our foreign subsidiaries are exposed to foreign exchange rate risk for transactions denominated incurrencies other than the functional currency of the respective subsidiary. We also use foreign exchange forwardcontracts to hedge balance sheet exposure to certain monetary assets and liabilities denominated in currenciesother than the functional currency of the subsidiary. These contracts are not designated as hedges and areintended to offset the foreign currency exchange gains or losses upon remeasurement of these net monetaryassets. We entered into a series of foreign exchange forward contracts scheduled to mature in 2012 which areprimarily used to hedge our Indian rupee denominated net monetary assets. At December 31, 2011, the notionalvalue of the outstanding contracts was $234.2 million and the related fair value was an asset of $30.7 million.During 2011, inclusive of gains of $23.6 million on these undesignated balance sheet hedges, we reported netforeign currency exchange (losses) of approximately ($8.8) million.
Effects of Inflation
Our most significant costs are the salaries and related benefits for our programming staff and otherprofessionals. Competition in India, the United States and Europe for professionals with advanced technical skillsnecessary to perform our services offered has caused wages to increase at a rate greater than the general rate ofinflation. As with other service providers in our industry, we must adequately anticipate wage increases,particularly on our fixed-price contracts. Historically, we have experienced increases in compensation andbenefit costs, including incentive-based compensation, in India; however, this has not had a material impact onour results of operations as we have been able to absorb such cost increases through price increases or costmanagement strategies such as managing discretionary costs, mix of professional staff and utilization levels andachieving other operating efficiencies. There can be no assurance that we will be able to offset such costincreases in the future.
Recent Accounting Pronouncements
In December 2010, the Financial Accounting Standards Board, or FASB, issued new guidance clarifyingcertain disclosure requirements related to business combinations that are material on an individual or aggregatebasis. Specifically, the guidance states that, if comparative financial statements are presented, the entity should
63

disclose revenue and earnings of the combined entity as though the business combination(s) that occurred duringthe current year occurred as of the beginning of the comparable prior annual reporting period only. Additionally,the new standard expands the supplemental pro forma disclosures required by the authoritative guidance toinclude a description of the nature and amount of material, nonrecurring pro forma adjustments directlyattributable to the business combination in the reported pro forma revenue and earnings. We adopted the newguidance effective January 1, 2011. Our adoption of this standard did not have a material effect on our financialcondition or consolidated results of operations. However, it may result in additional disclosures in the event thatwe enter into a business combination that is material either on an individual or aggregate basis.
In June 2011, the FASB issued new guidance, which requires that comprehensive income be presentedeither in a single continuous statement of comprehensive income or in two separate consecutive statements, thuseliminating the option of presenting the components of comprehensive income as part of the statement ofchanges in stockholders’ equity. In addition, the new guidance requires that the reclassification adjustments foritems that are reclassified from accumulated other comprehensive income to net income be presented on the faceof the financial statements. In December 2011, the FASB deferred the new requirements related to thepresentation of reclassification adjustments. The requirement to present comprehensive income either in a singlecontinuous statement of comprehensive income or in two separate consecutive statements has not been deferredand will be effective on a retrospective basis for periods beginning on or after January 1, 2012. The adoption ofthis standard affects financial statement presentation only and will have no effect on our financial condition orconsolidated results of operations.
In September 2011, the FASB issued new guidance related to goodwill impairment testing. This standardallows, but does not require, an entity to first assess qualitative factors to determine whether the existence ofevents or circumstances leads to a determination that it is more likely than not that the fair value of a reportingunit is less than its carrying amount. If, after assessing the totality of events or circumstances, an entitydetermines it is not more likely than not that the fair value of a reporting unit is less than its carrying amount,then performing the two-step impairment test is unnecessary. However, if an entity concludes otherwise, then itis required to perform the first step of the two-step impairment test by calculating the fair value of the reportingunit and comparing the fair value with the carrying amount of the reporting unit. If the carrying amount of areporting unit exceeds its fair value, then the entity is required to perform the second step of the goodwillimpairment test to measure the amount of the impairment loss, if any. The new standard gives an entity theoption to bypass the qualitative assessment for any reporting unit in any period and proceed directly toperforming the first step of the two-step goodwill impairment test. An entity may resume performing thequalitative assessment in any subsequent period. This new standard will be effective for periods beginning on orafter January 1, 2012 and will not have a material effect on our financial condition or consolidated results ofoperations.
In December 2011, the FASB issued guidance requiring enhanced disclosures related to the nature of anentity’s rights to offset and any related arrangements associated with its financial instruments and derivativeinstruments. The new guidance requires the disclosure of the gross amounts subject to rights of set-off, amountsoffset in accordance with the accounting standards followed and the related net exposure. The new guidance willbe effective for periods beginning on or after January 1, 2013. The adoption of this standard affects financialstatement disclosures only and will have no effect on our financial condition or consolidated results ofoperations.
Forward Looking Statements
The statements contained in this Annual Report on Form 10-K that are not historical facts are forward-looking statements (within the meaning of Section 21E of the Securities Exchange Act of 1934, as amended) thatinvolve risks and uncertainties. Such forward-looking statements may be identified by, among other things, theuse of forward-looking terminology such as “believes,” “expects,” “may,” “could,” “would,” “plan,” “intend,”“estimate,” “predict,” “potential,” “continue,” “should” or “anticipates” or the negative thereof or other
64

variations thereon or comparable terminology, or by discussions of strategy that involve risks and uncertainties.From time to time, we or our representatives have made or may make forward-looking statements, orally or inwriting.
Such forward-looking statements may be included in various filings made by us with the Securities andExchange Commission, or press releases or oral statements made by or with the approval of one of ourauthorized executive officers. These forward-looking statements, such as statements regarding anticipated futurerevenues or operating margins, contract percentage completions, earnings, capital expenditures and otherstatements regarding matters that are not historical facts, involve predictions. Our actual results, performance orachievements could differ materially from the results expressed in, or implied by, these forward-lookingstatements. We undertake no obligation to update or revise any forward-looking statements, whether as a resultof new information, future events or otherwise, except as may be required under applicable securities laws. Thereare a number of important factors that could cause our results to differ materially from those indicated by suchforward-looking statements. These factors include those set forth in Part I, in the section entitled Item 1A.“Risk Factors”.
Item 7A. Quantitative and Qualitative Disclosures About Market Risk
We are exposed to foreign currency exchange rate risk in the ordinary course of doing business as wetransact or hold a portion of our funds in foreign currencies, particularly the Indian rupee. Accordingly, weperiodically evaluate the need for hedging strategies, including the use of derivative financial instruments, tomitigate the effect of foreign currency exchange rate fluctuations and expect to continue to use such instrumentsin the future to reduce foreign currency exposure to appreciation or depreciation in the value of certain foreigncurrencies. All hedging transactions are authorized and executed pursuant to regularly reviewed policies andprocedures.
We have entered into a series of foreign exchange forward contracts that are designated as cash flow hedgesof certain Indian rupee denominated payments in India. Cognizant India converts U.S. dollar receipts fromintercompany billings to Indian rupees to fund local expenses. These U.S. dollar / Indian rupee hedges areintended to partially offset the impact of movement of exchange rates on future operating costs. As ofDecember 31, 2011 and December 31, 2010, the notional value of these contracts was $3,503.5 million and$2,160.0 million, respectively. The outstanding contracts as of December 31, 2011 are scheduled to mature eachmonth during 2012, 2013, 2014 and 2015. At December 31, 2011 and December 31, 2010, the net unrealized(loss) gain on our outstanding foreign exchange forward contracts was ($385.6) million and $32.3 million,respectively. The change in the net unrealized gain (loss) position from December 31, 2010 to December 31,2011 was attributed to the depreciation of the Indian rupee versus the U.S. dollar in the latter part of 2011. Basedupon a sensitivity analysis of our foreign exchange forward contracts at December 31, 2011, which estimates thefair value of the contracts based upon market exchange rate fluctuations, a 10.0% change in the foreign currencyexchange rate against the U.S. dollar with all other variables held constant would have resulted in a change in thefair value of approximately $291.1 million.
Our foreign subsidiaries are exposed to foreign exchange rate risk for transactions denominated incurrencies other than the functional currency of the respective subsidiary. We also use foreign exchange forwardcontracts to hedge balance sheet exposure to certain monetary assets and liabilities denominated in currenciesother than the functional currency of the subsidiary. These contracts are not designated as hedges and areintended to offset the foreign currency exchange gains or losses upon remeasurement of these net monetaryassets. We entered into a series of foreign exchange forward contracts scheduled to mature in 2012 which areprimarily used to hedge our Indian rupee denominated net monetary assets. At December 31, 2011, the notionalvalue of the outstanding contracts was $234.2 million and the related fair value was an asset of $30.7 million.Based upon a sensitivity analysis of our foreign exchange forward contracts at December 31, 2011, whichestimates the fair value of the contracts based upon market exchange rate fluctuations, a 10.0% change in theforeign currency exchange rate against the U.S. dollar with all other variables held constant would have resultedin a change in the fair value of approximately $18.6 million.
65

There were no off-balance sheet transactions, arrangements or other relationships with unconsolidatedentities or other persons in 2011, 2010 and 2009 that would have affected our liquidity or the availability of orrequirements for capital resources.
We do not believe we are exposed to material direct risks associated with changes in interest rates other thanwith our cash and cash equivalents and short-term investments. As of December 31, 2011, we had approximately$2,432.3 million of cash and cash equivalents and short-term investments most of which are impacted almostimmediately by changes in short-term interest rates.
We typically invest in highly rated securities and our policy generally limits the amount of credit exposureto any one issuer. Our investment policy requires investments to be investment grade with the objective ofminimizing the potential risk of principal loss. We may sell our investments prior to their stated maturities forstrategic purposes, in anticipation of credit deterioration, or for duration management. As of December 31, 2011,our short-term investments totaled $1,121.4 million. Our investment portfolio is primarily comprised of timedeposits and U.S. dollar denominated corporate bonds, municipal bonds, debt issuances by the U.S. governmentand U.S. government agencies, debt issuances by foreign governments and supranational entities and asset-backed securities.
Item 8. Financial Statements and Supplementary Data
The financial statements required to be filed pursuant to this Item 8 are appended to this Annual Report onForm 10-K. A list of the financial statements filed herewith is found in Part IV, “Item 15. Exhibits, FinancialStatements and Financial Statement Schedule”.
Item 9. Changes in and Disagreements with Accountants on Accounting and Financial Disclosure
Not applicable.
Item 9A. Controls and Procedures
Evaluation of Disclosure Controls and Procedures
Our management under the supervision and with the participation of our chief executive officer and ourchief financial officer, evaluated the design and operating effectiveness of our disclosure controls and procedures(as defined in Rules 13a-15(e) and 15d-15(e) under the Securities Exchange Act of 1934, as amended, or theExchange Act) as of December 31, 2011. Based on this evaluation, our chief executive officer and our chieffinancial officer concluded that, as of December 31, 2011, our disclosure controls and procedures were effectiveto ensure that information required to be disclosed by us in our reports that we file or submit under the ExchangeAct is (i) recorded, processed, summarized and reported within the time periods specified in the SEC’s rules andforms and (ii) accumulated and communicated to our chief executive officer and our chief financial officer asappropriate to allow timely decisions regarding required disclosure.
Changes in Internal Control over Financial Reporting
No changes in our internal control over financial reporting (as defined in Rules 13a-15(f) and 15d-15(f)under the Exchange Act) occurred during the fiscal quarter ended December 31, 2011 that have materiallyaffected, or are reasonably likely to materially affect, our internal control over financial reporting.
Management’s Responsibility for Financial Statements
Our management is responsible for the integrity and objectivity of all information presented in this annualreport. The consolidated financial statements were prepared in conformity with accounting principles generally
66

accepted in the United States of America and include amounts based on management’s best estimates andjudgments. Management believes the consolidated financial statements fairly reflect the form and substance oftransactions and that the financial statements fairly represent the Company’s financial position and results ofoperations.
The Audit Committee of the Board of Directors, which is composed solely of independent directors, meetsregularly with the Company’s independent registered public accounting firm and representatives of managementto review accounting, financial reporting, internal control and audit matters, as well as the nature and extent ofthe audit effort. The Audit Committee is responsible for the engagement of the independent registered publicaccounting firm. The independent registered public accounting firm has free access to the Audit Committee.
Management’s Report on Internal Control Over Financial Reporting
Our management is responsible for establishing and maintaining adequate internal control over financialreporting. Internal control over financial reporting is defined in Rule 13a-15(f) or 15d-15(f) of the Exchange Actand is a process designed by, or under the supervision of, our chief executive and chief financial officers andeffected by our Board of Directors, management and other personnel, to provide reasonable assurance regardingthe reliability of financial reporting and the preparation of financial statements for external purposes inaccordance with generally accepted accounting principles and includes those policies and procedures that:
• Pertain to the maintenance of records that, in reasonable detail, accurately and fairly reflect thetransactions and dispositions of our assets;
• Provide reasonable assurance that transactions are recorded as necessary to permit preparation offinancial statements in accordance with generally accepted accounting principles, and that receipts andexpenditures of the Company are being made only in accordance with authorizations of ourmanagement and directors; and
• Provide reasonable assurance regarding prevention or timely detection of unauthorized acquisition, useor disposition of the Company’s assets that could have a material effect on the financial statements.
Our management assessed the effectiveness of the company’s internal control over financial reporting as ofDecember 31, 2011. In making this assessment, the Company’s management used the criteria set forth by theCommittee of Sponsoring Organizations of the Treadway Commission (COSO) in Internal Control-IntegratedFramework.
Based on its evaluation, our management has concluded that, as of December 31, 2011, our internal controlover financial reporting was effective. The effectiveness of our internal control over financial reporting as ofDecember 31, 2011 has been audited by PricewaterhouseCoopers LLP, an independent registered publicaccounting firm, as stated in their report which is included on page F-2.
Inherent Limitations of Internal Controls
Because of its inherent limitations, internal control over financial reporting may not prevent or detect allmisstatements. Projections of any evaluation of effectiveness to future periods are subject to the risk that controlsmay become inadequate because of changes in conditions, or that the degree of compliance with the policies orprocedures may deteriorate.
Item 9B. Other Information
None.
67

PART III
Item 10. Directors, Executive Officers and Corporate Governance
The information relating to our directors and nominees for election as directors under the heading “Electionof Directors” in our definitive proxy statement for the 2012 Annual Meeting of Stockholders is incorporatedherein by reference to such proxy statement. The information relating to our executive officers in response to thisitem is contained in part under the caption “Our Executive Officers” in Part I of this Annual Report onForm 10-K and the remainder is incorporated herein by reference to our definitive proxy statement for the 2012Annual Meeting of Stockholders under the headings “Section 16(a) Beneficial Ownership ReportingCompliance,” “Corporate Governance-Code of Ethics” and “Committees of the Board-Audit Committee.”
We have adopted a written code of business conduct and ethics, entitled “Cognizant’s Core Values andStandards of Business Conduct,” that applies to all of our employees, including our principal executive officer,principal financial officer, principal accounting officer and controller, or persons performing similar functions.We make available our code of business conduct and ethics free of charge through our website which is locatedat www.cognizant.com. We intend to disclose any amendments to, or waivers from, our code of business conductand ethics that are required to be publicly disclosed pursuant to rules of the SEC and the NASDAQ Global SelectMarket by filing such amendment or waiver with the SEC and by posting it on our website.
Item 11. Executive Compensation
The discussion under the heading “Executive Compensation,” “Compensation Committee Report,”“Executive Compensation Tables” and “Compensation Committee Interlocks and Insider Participation” in ourdefinitive proxy statement for the 2012 Annual Meeting of Stockholders is incorporated herein by reference tosuch proxy statement.
Item 12. Security Ownership of Certain Beneficial Owners and Management and Related StockholderMatters
The discussion under the heading “Security Ownership of Certain Beneficial Owners and Management” inour definitive proxy statement for the 2012 Annual Meeting of Stockholders is incorporated herein by referenceto such proxy statement.
Item 13. Certain Relationships and Related Transactions, and Director Independence
The discussion under the heading “Certain Relationships and Related Transactions and DirectorIndependence” in our definitive proxy statement for the 2012 Annual Meeting of Stockholders is incorporatedherein by reference to such proxy statement.
Item 14. Principal Accountant Fees and Services
The discussion under the heading “Independent Registered Public Accounting Firm Fees and Other Matters”in our definitive proxy statement for the 2012 Annual Meeting of Stockholders is incorporated herein byreference to such proxy statement.
68

PART IV
Item 15. Exhibits, Financial Statement Schedules
(a) (1) Consolidated Financial Statements.Reference is made to the Index to Consolidated Financial Statements on Page F-1.
(2) Consolidated Financial Statement Schedule.Reference is made to the Index to Financial Statement Schedule on Page F-1.
(3) Exhibits.Reference is made to the Index to Exhibits on Page 71.
Schedules other than as listed above are omitted as not required or inapplicable or because the requiredinformation is provided in the consolidated financial statements, including the notes thereto.
69

SIGNATURES
Pursuant to the requirements of Section 13 or 15(d) of the Securities Exchange Act of 1934, the Registranthas duly caused this report to be signed on its behalf by the undersigned, thereunto duly authorized this 27th dayof February, 2012.
COGNIZANT TECHNOLOGY SOLUTIONSCORPORATION
By: /s/ FRANCISCO D’SOUZAFrancisco D’Souza,
Chief Executive Officer(Principal Executive Officer)
Pursuant to the requirements of the Securities Exchange Act of 1934, this report has been signed below bythe following persons on behalf of the Registrant and in the capacities and on the dates indicated.
Signature Title Date
/s/ FRANCISCO D’SOUZAFrancisco D’Souza
Chief Executive Officer and Director(Principal Executive Officer)
February 27, 2012
/s/ GORDON COBURN
Gordon Coburn
President February 27, 2012
/s/ KAREN MCLOUGHLINKaren McLoughlin
Chief Financial Officer(Principal Financial and AccountingOfficer)
February 27, 2012
/s/ JOHN E. KLEIN
John E. Klein
Chairman of the Board and Director February 27, 2012
/s/ LAKSHMI NARAYANAN
Lakshmi Narayanan
Vice Chairman of the Board andDirector
February 27, 2012
/s/ THOMAS M. WENDEL
Thomas M. Wendel
Director February 27, 2012
/s/ ROBERT W. HOWE
Robert W. Howe
Director February 27, 2012
/s/ ROBERT E. WEISSMAN
Robert E. Weissman
Director February 27, 2012
/s/ JOHN N. FOX, JR.John N. Fox, Jr.
Director February 27, 2012
/s/ MAUREEN BREAKIRON-EVANSMaureen Breakiron-Evans
Director February 27, 2012
70
EXHIBIT INDEX
Exhibit No. Description of Exhibit
3.1 Restated Certificate of Incorporation. (Incorporated by reference to Exhibit 3.1 to the Company’sCurrent Report on Form 8-K dated February 13, 2003.)
3.2 Amended and Restated By-laws of the Company, as amended on April 18, 2008. (Incorporated byreference to Exhibit 3.1 to the Company’s Current Report on Form 8-K dated April 18, 2008.)
3.3 Amendment to Restated Certificate of Incorporation dated May 26, 2004. (Incorporated byreference to Exhibit 3.1 to the Company’s Quarterly Report on Form 10-Q for the quarter endedJune 30, 2004.)
3.4 Amendment to Restated Certificate of Incorporation dated June 13, 2006. (Incorporated byreference to Exhibit 99.1 to the Company’s Current Report on Form 8-K dated June 13, 2006.)
3.5 Amendment to Restated Certificate of Incorporation dated June 2, 2011. (Incorporated byreference to Exhibit 3.1 to the Company’s Current Report on Form 8-K dated June 2, 2011.)
3.6 Amendment to Amended and Restated By-laws of the Company, as amended, dated June 2, 2011.(Incorporated by reference to Exhibit 3.2 to the Company’s Current Report on Form 8-K datedJune 2, 2011.)
4.1 Rights Agreement, dated March 5, 2003, between the Company and American Stock Transfer &Trust Company, as Rights Agent, which includes the Certificate of Designations for the Series AJunior Participating Preferred Stock as Exhibit A, the Form of Right Certificate as Exhibit B andthe Summary of Rights to Purchase Preferred Shares as Exhibit C (Incorporated by reference toExhibit 4.1 to the Company’s Current Report on Form 8-K dated March 5, 2003.)
4.2 Specimen Certificate for shares of Class A common stock. (Incorporated by reference toExhibit 4.2 to the Company’s Amendment Number 4 to the Company’s Form S-4 datedJanuary 30, 2003.)
10.1* Form of Indemnification Agreement for Directors and Officers. (Incorporated by reference toExhibit 10.1 to the Company’s Registration Statement on Form S-1 (File Number 333-49783)which became effective on June 18, 1998.)
10.2* Amended and Restated Cognizant Technology Solutions Key Employees’ Stock Option Plan.(Incorporated by reference to Exhibit 10.2 to the Company’s Registration Statement on Form S-1(File Number 333-49783) which became effective on June 18, 1998.)
10.3* Amended and Restated Cognizant Technology Solutions Non-Employee Directors’ Stock OptionPlan. (Incorporated by reference to Exhibit 10.3 to the Company’s Registration Statement onForm S-1 (File Number 333-49783) which became effective on June 18, 1998.)
10.4* Form of Severance and Non-Competition Agreement between the Company and each of itsExecutive Officers. (Incorporated by reference to Exhibit 10.9 to the Company’s RegistrationStatement on Form S-1 (File Number 333-49783) which became effective on June 18, 1998.)
10.5* Amended and Restated 1999 Incentive Compensation Plan (As Amended and Restated ThroughApril 26, 2007). (Incorporated by reference to Exhibit 10.1 to the Company’s Current Report onForm 8-K dated June 7, 2007.)
10.6* 2004 Employee Stock Purchase Plan (as amended and restated effective as of April 1, 2010).(Incorporated by reference to Exhibit 10.1 to the Company’s Form 8-K dated June 1, 2010.)
10.7* Form of Stock Option Certificate. (Incorporated by reference to Exhibit 10.1 to the Company’sQuarterly Report on Form 10-Q for the quarter ended September 30, 2004.)
71

Exhibit No. Description of Exhibit
10.8* The Cognizant Technology Solutions Executive Pension Plan. (Incorporated by reference toExhibit 10.2 to the Company’s Quarterly Report on Form 10-Q for the quarter ended June 30,2005.)
10.9 Distribution Agreement between IMS Health Incorporated and the Company dated January 7,2003. (Incorporated by reference to Exhibit 10.13 to the Company’s Amendment Number 4 to theCompany Form S-4 dated January 30, 2003.)
10.10* Form of Stock Option Agreement between the Company and Lakshmi Narayanan pursuant towhich stock options were granted on February 5, 2003. (Incorporated by reference toExhibit 10.11 to the Company’s Form 10-K dated March 12, 2004.)
10.11* Form of Stock Option Agreement between the Company and Francisco D’Souza pursuant towhich stock options were granted on February 5, 2003. (Incorporated by reference toExhibit 10.13 to the Company’s Form 10-K dated March 12, 2004.)
10.12* Severance and Noncompetition Agreement between the Company and RamakrishnanChandrasekaran dated December 13, 2004. (Incorporated by reference to Exhibit 10.1 to theCompany’s Current Report on Form 8-K dated December 17, 2004.)
10.13* Amended and Restated 1999 Incentive Compensation Plan Amendment No. 1, which becameeffective on March 2, 2007. (Incorporated by reference to Exhibit 10.1 to the Company’sQuarterly Report on Form 10-Q for the quarter ended March 31, 2007.)
10.14* Amended and Restated Key Employees’ Stock Option Plan Amendment No. 1, which becameeffective on March 2, 2007. (Incorporated by reference to Exhibit 10.2 to the Company’sQuarterly Report on Form 10-Q for the quarter ended March 31, 2007.)
10.15* Amended and Restated Non-Employee Directors’ Stock Option Plan Amendment No. 1, whichbecame effective on March 2, 2007. (Incorporated by reference to Exhibit 10.3 to the Company’sQuarterly Report on Form 10-Q for the quarter ended March 31, 2007.)
10.16* Severance and Noncompetition Agreement with Rajeev Mehta dated July 23, 2007. (Incorporatedby reference to Exhibit 10.1 to the Company’s Current Report on Form 8-K dated July 18, 2007.)
10.17* Form of Performance Unit Award for grants to certain executive officers. (Incorporated byreference to Exhibit 10.1 to the Company’s Current Report on Form 8-K dated December 6,2007.)
10.18* Form of Stock Unit Award Agreement pursuant to the Cognizant Technology SolutionsCorporation Amended and Restated 1999 Incentive Compensation Plan. (Incorporated byreference to Exhibit 10.1 to the Company’s Form 8-K dated September 4, 2008.)
10.19* Form of Amendment to Severance and Noncompetition Agreements with the Named ExecutiveOfficers. (Incorporated by reference to Exhibit 10.1 to the Company’s Form 8-K datedDecember 3, 2008.)
10.20* The Cognizant Technology Solutions Executive Pension Plan, as amended and restated.(Incorporated by reference to Exhibit 10.2 to the Company’s Form 8-K dated December 3, 2008.)
10.21* Cognizant Technology Solutions Corporation 2009 Incentive Compensation Plan. (Incorporatedby reference to Exhibit 10.1 to the Company’s Quarterly Report on Form 10-Q for the quarterended June 3, 2010.)
10.22* Form of Cognizant Technology Solutions Corporation Stock Option Agreement. (Incorporated byreference to Exhibit 10.1 to the Company’s Current Report on Form 8-K filed July 6, 2010.
72

Exhibit No. Description of Exhibit
10.23* Form of Cognizant Technology Solutions Corporation Notice of Grant of Stock Option.(Incorporated by reference to Exhibit 10.2 to the Company’s Current Report on Form 8-K filedJuly 6, 2010.)
10.24* Form of Cognizant Technology Solutions Corporation Restricted Stock Unit Award AgreementTime-Based Vesting. (Incorporated by reference to Exhibit 10.3 to the Company’s Current Reporton Form 8-K filed July 6, 2010.)
10.25* Form of Cognizant Technology Solutions Corporation Notice of Award of Restricted Stock UnitsTime-Based Vesting. (Incorporated by reference to Exhibit 10.4 to the Company’s Current Reporton Form 8-K filed July 6, 2010.)
10.26* Form of Cognizant Technology Solutions Corporation Restricted Stock Unit Award AgreementPerformance-Based Vesting. (Incorporated by reference to Exhibit 10.5 to the Company’s CurrentReport on Form 8-K filed July 6, 2010.)
10.27* Form of Cognizant Technology Solutions Corporation Notice of Award of Restricted Stock UnitsPerformance-Based Vesting. (Incorporated by reference to Exhibit 10.6 to the Company’s CurrentReport on Form 8-K filed July 6, 2010.)
10.28* Form of Cognizant Technology Solutions Corporation Notice of Award of Restricted Stock UnitsNon-Employee Director Deferred Issuance. (Incorporated by reference to Exhibit 10.8 to theCompany’s Current Report on Form 8-K filed July 6, 2010.)
21.1 † List of subsidiaries of the Company.
23.1 † Consent of PricewaterhouseCoopers LLP.
31.1 † Certification Pursuant to Rule 13a-14(a) and 15d-14(a) of the Exchange Act, as Adopted Pursuantto Section 302 of the Sarbanes-Oxley Act of 2002 (Chief Executive Officer).
31.2 † Certification Pursuant to Rule 13a-14(a) and 15d-14(a) of the Exchange Act, as Adopted Pursuantto Section 302 of the Sarbanes-Oxley Act of 2002 (Chief Financial Officer).
32.1 †† Certification Pursuant to 18 U.S.C. Section 1350 (Chief Executive Officer).
32.2 †† Certification Pursuant to 18 U.S.C. Section 1350 (Chief Financial Officer).
101.INS XBRL Instance Document
101.SCH XBRL Taxonomy Extension Schema Document
101.CAL XBRL Taxonomy Extension Calculation Linkbase Document
101.DEF XBRL Taxonomy Extension Definition Linkbase Document
101.LAB XBRL Taxonomy Extension Label Linkbase Document
101.PRE XBRL Taxonomy Extension Presentation Linkbase Document
* A management contract or compensatory plan or arrangement required to be filed as an exhibit pursuant toItem 15(a)(3) of Form 10-K.
† Filed herewith. All other exhibits previously filed.†† Furnished herewith.
73

COGNIZANT TECHNOLOGY SOLUTIONS CORPORATION
INDEX TO CONSOLIDATED FINANCIAL STATEMENTSAND FINANCIAL STATEMENT SCHEDULE
Page
Consolidated Financial Statements:Report of Independent Registered Public Accounting Firm . . . . . . . . . . . . . . . . . . . . . . . . . . . . . . . . . . F-2Consolidated Statements of Financial Position as of December 31, 2011 and 2010 . . . . . . . . . . . . . . . F-3Consolidated Statements of Operations for the years ended December 31, 2011, 2010 and 2009 . . . . . F-4Consolidated Statements of Stockholders’ Equity for the years ended December 31, 2011, 2010 and2009 . . . . . . . . . . . . . . . . . . . . . . . . . . . . . . . . . . . . . . . . . . . . . . . . . . . . . . . . . . . . . . . . . . . . . . . . . . . F-5
Consolidated Statements of Cash Flows for the years ended December 31, 2011, 2010 and 2009 . . . . F-6Notes to Consolidated Financial Statements . . . . . . . . . . . . . . . . . . . . . . . . . . . . . . . . . . . . . . . . . . . . . . F-7
Financial Statement Schedule:Schedule of Valuation and Qualifying Accounts . . . . . . . . . . . . . . . . . . . . . . . . . . . . . . . . . . . . . . . . . . F-32
F-1

Report of Independent Registered Public Accounting Firm
To the Board of Directors and Stockholders of Cognizant Technology Solutions Corporation:
In our opinion, the consolidated financial statements listed in the accompanying index appearing underItem 15(a)(1) present fairly, in all material respects, the financial position of Cognizant Technology SolutionsCorporation (the “Company”) and its subsidiaries at December 31, 2011 and December 31, 2010, and the resultsof their operations and their cash flows for each of the three years in the period ended December 31, 2011 inconformity with accounting principles generally accepted in the United States of America. In addition, in ouropinion, the financial statement schedule listed in the accompanying index presents fairly, in all materialrespects, the information set forth therein when read in conjunction with the related consolidated financialstatements. Also in our opinion, the Company maintained, in all material respects, effective internal control overfinancial reporting as of December 31, 2011, based on criteria established in Internal Control—IntegratedFramework issued by the Committee of Sponsoring Organizations of the Treadway Commission (COSO). TheCompany’s management is responsible for these financial statements and financial statement schedule, formaintaining effective internal control over financial reporting and for its assessment of the effectiveness ofinternal control over financial reporting, included in Management’s Report on Internal Control Over FinancialReporting appearing under Item 9A. Our responsibility is to express opinions on these financial statements, onthe financial statement schedule, and on the Company’s internal control over financial reporting based on ourintegrated audits. We conducted our audits in accordance with the standards of the Public Company AccountingOversight Board (United States). Those standards require that we plan and perform the audits to obtainreasonable assurance about whether the financial statements are free of material misstatement and whethereffective internal control over financial reporting was maintained in all material respects. Our audits of thefinancial statements included examining, on a test basis, evidence supporting the amounts and disclosures in thefinancial statements, assessing the accounting principles used and significant estimates made by management,and evaluating the overall financial statement presentation. Our audit of internal control over financial reportingincluded obtaining an understanding of internal control over financial reporting, assessing the risk that a materialweakness exists, and testing and evaluating the design and operating effectiveness of internal control based onthe assessed risk. Our audits also included performing such other procedures as we considered necessary in thecircumstances. We believe that our audits provide a reasonable basis for our opinions.
A company’s internal control over financial reporting is a process designed to provide reasonable assuranceregarding the reliability of financial reporting and the preparation of financial statements for external purposes inaccordance with generally accepted accounting principles. A company’s internal control over financial reportingincludes those policies and procedures that (i) pertain to the maintenance of records that, in reasonable detail,accurately and fairly reflect the transactions and dispositions of the assets of the company; (ii) provide reasonableassurance that transactions are recorded as necessary to permit preparation of financial statements in accordancewith generally accepted accounting principles, and that receipts and expenditures of the company are being madeonly in accordance with authorizations of management and directors of the company; and (iii) provide reasonableassurance regarding prevention or timely detection of unauthorized acquisition, use, or disposition of thecompany’s assets that could have a material effect on the financial statements.
Because of its inherent limitations, internal control over financial reporting may not prevent or detectmisstatements. Also, projections of any evaluation of effectiveness to future periods are subject to the risk thatcontrols may become inadequate because of changes in conditions, or that the degree of compliance with thepolicies or procedures may deteriorate.
PRICEWATERHOUSECOOPERS LLPNew York, New YorkFebruary 27, 2012
F-2

COGNIZANT TECHNOLOGY SOLUTIONS CORPORATION
CONSOLIDATED STATEMENTS OF FINANCIAL POSITION(in thousands, except par values)
At December 31,
2011 2010
AssetsCurrent assets:
Cash and cash equivalents . . . . . . . . . . . . . . . . . . . . . . . . . . . . . . . . . . . . . . . . . . . . $1,310,906 $1,540,969Short-term investments . . . . . . . . . . . . . . . . . . . . . . . . . . . . . . . . . . . . . . . . . . . . . . 1,121,358 685,419Trade accounts receivable, net of allowances of $24,658 and $20,991,respectively . . . . . . . . . . . . . . . . . . . . . . . . . . . . . . . . . . . . . . . . . . . . . . . . . . . . . 1,179,043 901,308
Unbilled accounts receivable . . . . . . . . . . . . . . . . . . . . . . . . . . . . . . . . . . . . . . . . . 139,627 112,960Deferred income tax assets, net . . . . . . . . . . . . . . . . . . . . . . . . . . . . . . . . . . . . . . . . 109,042 96,164Other current assets . . . . . . . . . . . . . . . . . . . . . . . . . . . . . . . . . . . . . . . . . . . . . . . . . 225,530 181,414
Total current assets . . . . . . . . . . . . . . . . . . . . . . . . . . . . . . . . . . . . . . . . . . . . . 4,085,506 3,518,234Property and equipment, net of accumulated depreciation of $455,506 and $352,472,respectively . . . . . . . . . . . . . . . . . . . . . . . . . . . . . . . . . . . . . . . . . . . . . . . . . . . . . . . . . 758,034 570,448
Goodwill . . . . . . . . . . . . . . . . . . . . . . . . . . . . . . . . . . . . . . . . . . . . . . . . . . . . . . . . . . . . . 288,772 223,963Intangible assets, net . . . . . . . . . . . . . . . . . . . . . . . . . . . . . . . . . . . . . . . . . . . . . . . . . . . . 97,616 85,136Deferred income tax assets, net . . . . . . . . . . . . . . . . . . . . . . . . . . . . . . . . . . . . . . . . . . . . 164,192 109,808Other noncurrent assets . . . . . . . . . . . . . . . . . . . . . . . . . . . . . . . . . . . . . . . . . . . . . . . . . . 113,813 75,485
Total assets . . . . . . . . . . . . . . . . . . . . . . . . . . . . . . . . . . . . . . . . . . . . . . . . . . . $5,507,933 $4,583,074
Liabilities and Stockholders’ EquityCurrent liabilities:
Accounts payable . . . . . . . . . . . . . . . . . . . . . . . . . . . . . . . . . . . . . . . . . . . . . . . . . . $ 72,205 $ 75,373Deferred revenue . . . . . . . . . . . . . . . . . . . . . . . . . . . . . . . . . . . . . . . . . . . . . . . . . . . 105,713 84,590Accrued expenses and other current liabilities . . . . . . . . . . . . . . . . . . . . . . . . . . . . 1,031,787 770,763
Total current liabilities . . . . . . . . . . . . . . . . . . . . . . . . . . . . . . . . . . . . . . . . . . 1,209,705 930,726Deferred income tax liabilities, net . . . . . . . . . . . . . . . . . . . . . . . . . . . . . . . . . . . . . . . . . 3,339 4,946Other noncurrent liabilities . . . . . . . . . . . . . . . . . . . . . . . . . . . . . . . . . . . . . . . . . . . . . . . 342,003 62,971
Total liabilities . . . . . . . . . . . . . . . . . . . . . . . . . . . . . . . . . . . . . . . . . . . . . . . . 1,555,047 998,643
Commitments and contingencies (See Note 13)
Stockholders’ equity:Preferred stock, $.10 par value, 15,000 shares authorized, none issued . . . . . . . . . . . . . — —Class A common stock, $.01 par value, 1,000,000 shares authorized at December 31,2011 and 500,000 shares authorized at December 31, 2010; 303,106 and 303,941shares issued and outstanding at December 31, 2011 and 2010, respectively . . . . . . 3,031 3,039
Additional paid-in capital . . . . . . . . . . . . . . . . . . . . . . . . . . . . . . . . . . . . . . . . . . . . . . . . 692,723 846,886Retained earnings . . . . . . . . . . . . . . . . . . . . . . . . . . . . . . . . . . . . . . . . . . . . . . . . . . . . . . 3,582,526 2,698,908Accumulated other comprehensive income (loss) . . . . . . . . . . . . . . . . . . . . . . . . . . . . . (325,394) 35,598
Total stockholders’ equity . . . . . . . . . . . . . . . . . . . . . . . . . . . . . . . . . . . . . . . . 3,952,886 3,584,431
Total liabilities and stockholders’ equity . . . . . . . . . . . . . . . . . . . . . . . . . . . . $5,507,933 $4,583,074
The accompanying notes are an integral part of the consolidated financial statements.
F-3

COGNIZANT TECHNOLOGY SOLUTIONS CORPORATION
CONSOLIDATED STATEMENTS OF OPERATIONS(in thousands, except per share data)
Year Ended December 31,
2011 2010 2009
Revenues . . . . . . . . . . . . . . . . . . . . . . . . . . . . . . . . . . . . . . . . . . . . . . . . . . $6,121,156 $4,592,389 $3,278,663Operating expenses:
Cost of revenues (exclusive of depreciation and amortizationexpense shown separately below) . . . . . . . . . . . . . . . . . . . . . . . . . 3,538,622 2,654,569 1,849,443
Selling, general and administrative expenses . . . . . . . . . . . . . . . . . . 1,328,665 972,093 721,359Depreciation and amortization expense . . . . . . . . . . . . . . . . . . . . . . 117,401 103,875 89,371
Income from operations . . . . . . . . . . . . . . . . . . . . . . . . . . . . . . . . . . . . . . 1,136,468 861,852 618,490
Other income (expense), net:Interest income . . . . . . . . . . . . . . . . . . . . . . . . . . . . . . . . . . . . . . . . . 39,249 25,793 15,895Other, net . . . . . . . . . . . . . . . . . . . . . . . . . . . . . . . . . . . . . . . . . . . . . . (6,568) (9,065) 2,566
Total other income (expense), net . . . . . . . . . . . . . . . . . . . . . . . . . . . . . . . 32,681 16,728 18,461
Income before provision for income taxes . . . . . . . . . . . . . . . . . . . . . . . . 1,169,149 878,580 636,951Provision for income taxes . . . . . . . . . . . . . . . . . . . . . . . . . . . . . . . . . . . . 285,531 145,040 101,988
Net income . . . . . . . . . . . . . . . . . . . . . . . . . . . . . . . . . . . . . . . . . . . . . . . . $ 883,618 $ 733,540 $ 534,963
Basic earnings per share . . . . . . . . . . . . . . . . . . . . . . . . . . . . . . . . . . . . . . $ 2.91 $ 2.44 $ 1.82
Diluted earnings per share . . . . . . . . . . . . . . . . . . . . . . . . . . . . . . . . . . . . . $ 2.85 $ 2.37 $ 1.78
Weighted average number of common shares outstanding—Basic . . . . . 303,277 300,781 293,304Dilutive effect of shares issuable under stock-based compensationplans . . . . . . . . . . . . . . . . . . . . . . . . . . . . . . . . . . . . . . . . . . . . . . . . . . . 7,074 8,356 7,811
Weighted average number of common shares outstanding—Diluted . . . . 310,351 309,137 301,115
The accompanying notes are an integral part of the financial statements.
F-4
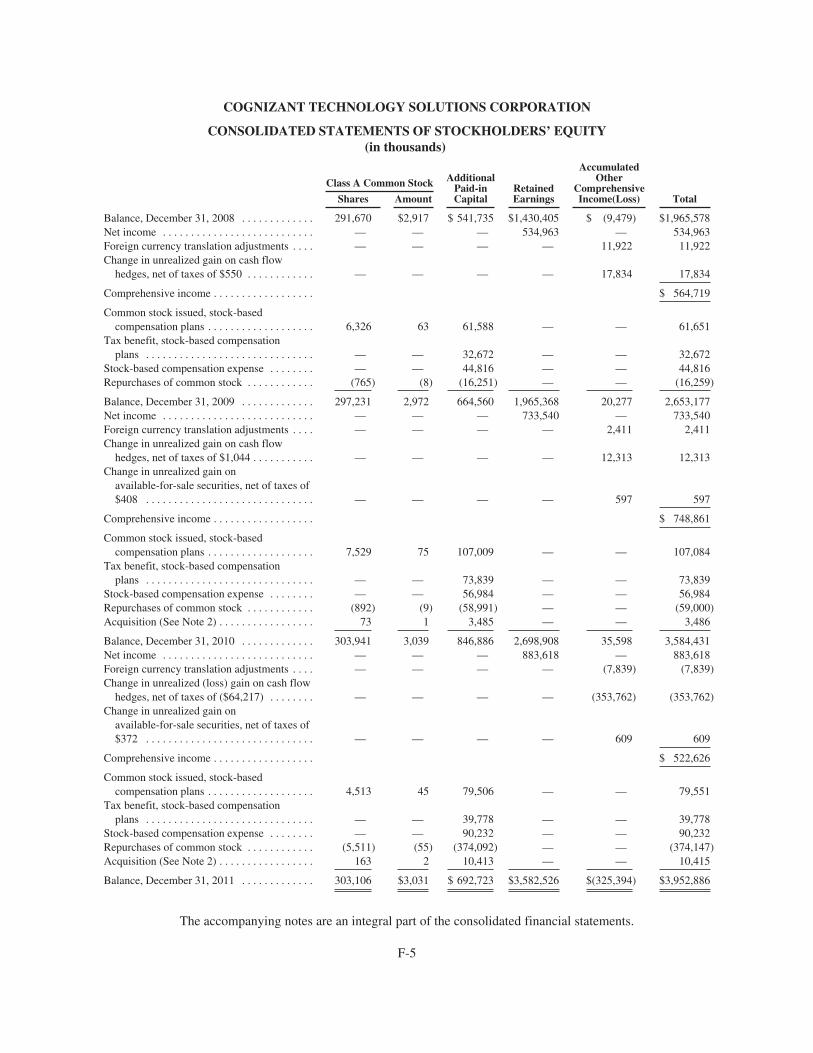
COGNIZANT TECHNOLOGY SOLUTIONS CORPORATION
CONSOLIDATED STATEMENTS OF STOCKHOLDERS’ EQUITY(in thousands)
Class A Common Stock AdditionalPaid-inCapital
RetainedEarnings
AccumulatedOther
ComprehensiveIncome(Loss) TotalShares Amount
Balance, December 31, 2008 . . . . . . . . . . . . . 291,670 $2,917 $ 541,735 $1,430,405 $ (9,479) $1,965,578Net income . . . . . . . . . . . . . . . . . . . . . . . . . . . — — — 534,963 — 534,963Foreign currency translation adjustments . . . . — — — — 11,922 11,922Change in unrealized gain on cash flowhedges, net of taxes of $550 . . . . . . . . . . . . — — — — 17,834 17,834
Comprehensive income . . . . . . . . . . . . . . . . . . $ 564,719
Common stock issued, stock-basedcompensation plans . . . . . . . . . . . . . . . . . . . 6,326 63 61,588 — — 61,651
Tax benefit, stock-based compensationplans . . . . . . . . . . . . . . . . . . . . . . . . . . . . . . — — 32,672 — — 32,672
Stock-based compensation expense . . . . . . . . — — 44,816 — — 44,816Repurchases of common stock . . . . . . . . . . . . (765) (8) (16,251) — — (16,259)
Balance, December 31, 2009 . . . . . . . . . . . . . 297,231 2,972 664,560 1,965,368 20,277 2,653,177Net income . . . . . . . . . . . . . . . . . . . . . . . . . . . — — — 733,540 — 733,540Foreign currency translation adjustments . . . . — — — — 2,411 2,411Change in unrealized gain on cash flowhedges, net of taxes of $1,044 . . . . . . . . . . . — — — — 12,313 12,313
Change in unrealized gain onavailable-for-sale securities, net of taxes of$408 . . . . . . . . . . . . . . . . . . . . . . . . . . . . . . — — — — 597 597
Comprehensive income . . . . . . . . . . . . . . . . . . $ 748,861
Common stock issued, stock-basedcompensation plans . . . . . . . . . . . . . . . . . . . 7,529 75 107,009 — — 107,084
Tax benefit, stock-based compensationplans . . . . . . . . . . . . . . . . . . . . . . . . . . . . . . — — 73,839 — — 73,839
Stock-based compensation expense . . . . . . . . — — 56,984 — — 56,984Repurchases of common stock . . . . . . . . . . . . (892) (9) (58,991) — — (59,000)Acquisition (See Note 2) . . . . . . . . . . . . . . . . . 73 1 3,485 — — 3,486
Balance, December 31, 2010 . . . . . . . . . . . . . 303,941 3,039 846,886 2,698,908 35,598 3,584,431Net income . . . . . . . . . . . . . . . . . . . . . . . . . . . — — — 883,618 — 883,618Foreign currency translation adjustments . . . . — — — — (7,839) (7,839)Change in unrealized (loss) gain on cash flowhedges, net of taxes of ($64,217) . . . . . . . . — — — — (353,762) (353,762)
Change in unrealized gain onavailable-for-sale securities, net of taxes of$372 . . . . . . . . . . . . . . . . . . . . . . . . . . . . . . — — — — 609 609
Comprehensive income . . . . . . . . . . . . . . . . . . $ 522,626
Common stock issued, stock-basedcompensation plans . . . . . . . . . . . . . . . . . . . 4,513 45 79,506 — — 79,551
Tax benefit, stock-based compensationplans . . . . . . . . . . . . . . . . . . . . . . . . . . . . . . — — 39,778 — — 39,778
Stock-based compensation expense . . . . . . . . — — 90,232 — — 90,232Repurchases of common stock . . . . . . . . . . . . (5,511) (55) (374,092) — — (374,147)Acquisition (See Note 2) . . . . . . . . . . . . . . . . . 163 2 10,413 — — 10,415
Balance, December 31, 2011 . . . . . . . . . . . . . 303,106 $3,031 $ 692,723 $3,582,526 $(325,394) $3,952,886
The accompanying notes are an integral part of the consolidated financial statements.
F-5

COGNIZANT TECHNOLOGY SOLUTIONS CORPORATION
CONSOLIDATED STATEMENTS OF CASH FLOWS(in thousands)
Year Ended December 31,
2011 2010 2009
Cash flows from operating activities:Net income . . . . . . . . . . . . . . . . . . . . . . . . . . . . . . . . . . . . . . . . . . . . . . . . $ 883,618 $ 733,540 $ 534,963Adjustments to reconcile net income to net cash provided by operatingactivities:
Depreciation and amortization . . . . . . . . . . . . . . . . . . . . . . . . . 124,175 110,172 89,371Provision for doubtful accounts . . . . . . . . . . . . . . . . . . . . . . . . 4,582 5,950 3,347Deferred income taxes . . . . . . . . . . . . . . . . . . . . . . . . . . . . . . . (8,599) (51,909) (26,589)Stock-based compensation expense . . . . . . . . . . . . . . . . . . . . . 90,232 56,984 44,816Excess tax benefit on stock-based compensation plans . . . . . . (39,141) (71,919) (31,556)Other . . . . . . . . . . . . . . . . . . . . . . . . . . . . . . . . . . . . . . . . . . . . 46,036 (7,598) (6,101)
Changes in assets and liabilities:Trade accounts receivable . . . . . . . . . . . . . . . . . . . . . . . . . . . . (284,167) (278,418) (98,451)Other current assets . . . . . . . . . . . . . . . . . . . . . . . . . . . . . . . . . (99,224) (75,347) (42,778)Other assets . . . . . . . . . . . . . . . . . . . . . . . . . . . . . . . . . . . . . . . (28,805) (24,296) (9,255)Accounts payable . . . . . . . . . . . . . . . . . . . . . . . . . . . . . . . . . . . (8,593) 18,597 6,675Other current and noncurrent liabilities . . . . . . . . . . . . . . . . . . 195,038 348,898 207,883
Net cash provided by operating activities . . . . . . . . . . . . . . . . . . . . . . . . 875,152 764,654 672,325
Cash flows (used in) investing activities:Purchases of property and equipment . . . . . . . . . . . . . . . . . . . . . . . (288,221) (185,512) (76,639)Purchases of investments . . . . . . . . . . . . . . . . . . . . . . . . . . . . . . . . . (1,338,664) (934,185) (348,209)Proceeds from maturity or sale of investments . . . . . . . . . . . . . . . . 859,404 706,670 98,697Acquisitions, net of cash acquired . . . . . . . . . . . . . . . . . . . . . . . . . . (82,800) (33,863) (68,613)
Net cash (used in) investing activities . . . . . . . . . . . . . . . . . . . . . . . . . . . (850,281) (446,890) (394,764)
Cash flows (used in) provided by financing activities:Issuance of common stock under stock-based compensationplans . . . . . . . . . . . . . . . . . . . . . . . . . . . . . . . . . . . . . . . . . . . . . . . 79,551 107,084 61,651
Excess tax benefit on stock-based compensation plans . . . . . . . . . . 39,141 71,919 31,556Repurchases of common stock . . . . . . . . . . . . . . . . . . . . . . . . . . . . . (374,147) (59,000) (16,259)
Net cash (used in) provided by financing activities . . . . . . . . . . . . . . . . . (255,455) 120,003 76,948
Effect of currency translation on cash and cash equivalents . . . . . . . . . . 521 2,272 11,355
(Decrease) increase in cash and cash equivalents . . . . . . . . . . . . . . . . . . (230,063) 440,039 365,864Cash and cash equivalents, at beginning of year . . . . . . . . . . . . . . . . . . . 1,540,969 1,100,930 735,066
Cash and cash equivalents, at end of year . . . . . . . . . . . . . . . . . . . . . . . . $ 1,310,906 $1,540,969 $1,100,930
Supplemental information:Cash paid for income taxes during the year . . . . . . . . . . . . . . . . . . . $ 248,229 $ 127,129 $ 120,544
The accompanying notes are an integral part of the consolidated financial statements.
F-6

Notes to Consolidated Financial Statements(Dollars in thousands, except share data)
1. Summary of Significant Accounting Policies
The terms “Cognizant,” “we,” “our,” “us” and the “Company” refer to Cognizant Technology SolutionsCorporation and its subsidiaries unless the context indicates otherwise.
Description of Business. Cognizant is a leading provider of custom information technology, or IT,consulting and business process outsourcing services. Our customers are primarily Global 2000 companies. Ourcore competencies include Technology Strategy Consulting, Complex Systems Development and Integration,Enterprise Software Package Implementation and Maintenance, Data Warehousing, Business Intelligence andAnalytics, Application Testing, Application Maintenance, Infrastructure Management and Business andKnowledge Process Outsourcing. We tailor our services to specific industries, and utilize an integrated globaldelivery model. This seamless global delivery model combines technical and account management teams locatedon-site at the customer location and at dedicated near-shore and offshore development and delivery centerslocated primarily in India, China, the United States, Canada, Argentina, Hungary and the Philippines.
Basis of Presentation and Principles of Consolidation. The consolidated financial statements are presentedin accordance with generally accepted accounting principles in the United States of America, or U.S. GAAP, andreflect the consolidated financial position, results of operations and cash flows of our consolidated subsidiariesfor all periods presented. All intercompany balances and transactions have been eliminated in consolidation.
Cash and Cash Equivalents and Investments. Cash and cash equivalents consist of all cash balances,including money market funds and liquid instruments. Liquid instruments are classified as cash equivalents whentheir maturities at the date of purchase are three months or less and as short-term investments when theirmaturities at the date of purchase are greater than three months.
We determine the appropriate classification of our investments in marketable securities at the date ofpurchase and reevaluate such designation at each balance sheet date. We have classified and accounted for ourmarketable securities as available-for-sale. After consideration of our risk versus reward objectives, as well asour liquidity requirements, we may sell these securities prior to their stated maturities. As we view thesemarketable securities as available to support current operations, we classify such securities with maturities at thedate of purchase beyond twelve months as short-term investments because such investments represent aninvestment in cash that is available for current operations. Non-marketable investments are classified as short-term investments when their maturities are between three and twelve months and as long-term investments whentheir maturities are greater than twelve months.
Available-for-sale securities are reported at fair value with changes in unrealized gains and losses recordedas a separate component of accumulated other comprehensive income (loss) until realized. We determine the costof the securities sold based on the specific identification method. Trading securities are reported at fair value withany unrealized gains or losses related to the changes in fair value recorded in income or loss. Time deposits withfinancial institutions are valued at cost, which approximates fair value.
Interest and amortization of premiums and discounts for debt securities are included in interest income. Wealso evaluate our available-for-sale investments periodically for possible other-than-temporary impairment byreviewing factors such as the length of time and extent to which fair value has been below cost basis, thefinancial condition of the issuer, whether we intend to sell the security and whether it is more likely than not thatwe will be required to sell the security prior to recovery of its amortized cost basis. Once a decline in fair value isdetermined to be other-than-temporary, an impairment charge is generally recorded to income and a new costbasis in the investment is established.
F-7
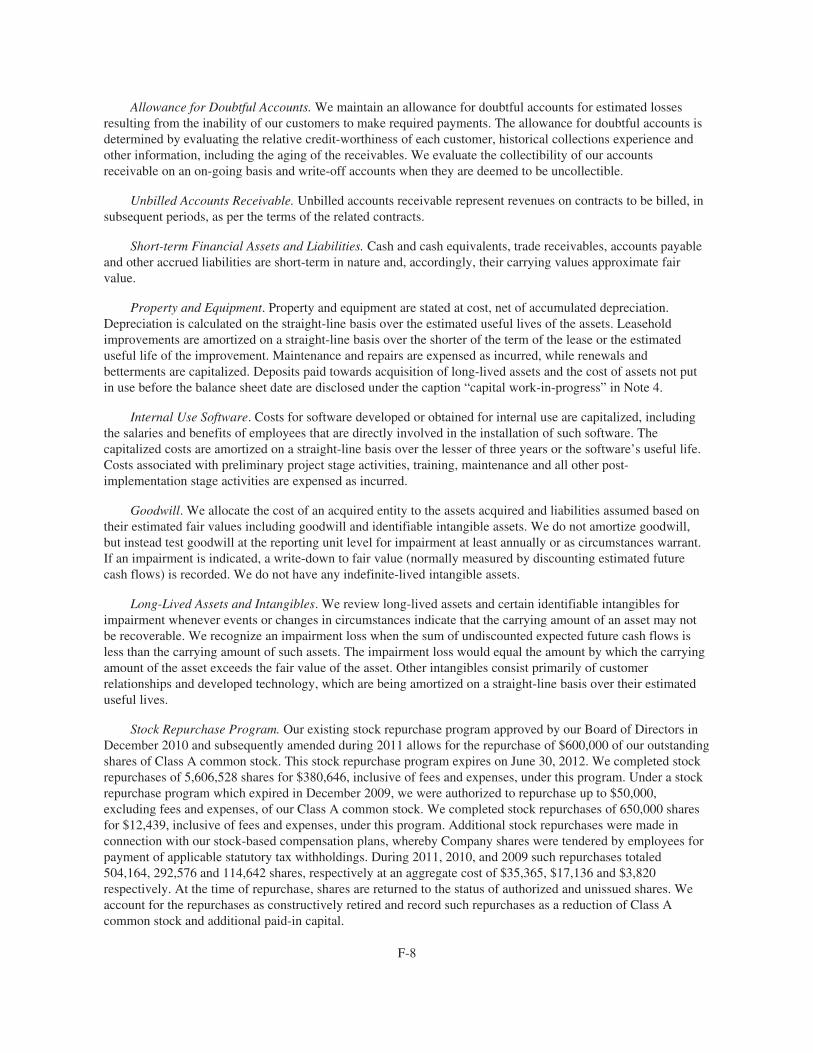
Allowance for Doubtful Accounts. We maintain an allowance for doubtful accounts for estimated lossesresulting from the inability of our customers to make required payments. The allowance for doubtful accounts isdetermined by evaluating the relative credit-worthiness of each customer, historical collections experience andother information, including the aging of the receivables. We evaluate the collectibility of our accountsreceivable on an on-going basis and write-off accounts when they are deemed to be uncollectible.
Unbilled Accounts Receivable. Unbilled accounts receivable represent revenues on contracts to be billed, insubsequent periods, as per the terms of the related contracts.
Short-term Financial Assets and Liabilities. Cash and cash equivalents, trade receivables, accounts payableand other accrued liabilities are short-term in nature and, accordingly, their carrying values approximate fairvalue.
Property and Equipment. Property and equipment are stated at cost, net of accumulated depreciation.Depreciation is calculated on the straight-line basis over the estimated useful lives of the assets. Leaseholdimprovements are amortized on a straight-line basis over the shorter of the term of the lease or the estimateduseful life of the improvement. Maintenance and repairs are expensed as incurred, while renewals andbetterments are capitalized. Deposits paid towards acquisition of long-lived assets and the cost of assets not putin use before the balance sheet date are disclosed under the caption “capital work-in-progress” in Note 4.
Internal Use Software. Costs for software developed or obtained for internal use are capitalized, includingthe salaries and benefits of employees that are directly involved in the installation of such software. Thecapitalized costs are amortized on a straight-line basis over the lesser of three years or the software’s useful life.Costs associated with preliminary project stage activities, training, maintenance and all other post-implementation stage activities are expensed as incurred.
Goodwill. We allocate the cost of an acquired entity to the assets acquired and liabilities assumed based ontheir estimated fair values including goodwill and identifiable intangible assets. We do not amortize goodwill,but instead test goodwill at the reporting unit level for impairment at least annually or as circumstances warrant.If an impairment is indicated, a write-down to fair value (normally measured by discounting estimated futurecash flows) is recorded. We do not have any indefinite-lived intangible assets.
Long-Lived Assets and Intangibles. We review long-lived assets and certain identifiable intangibles forimpairment whenever events or changes in circumstances indicate that the carrying amount of an asset may notbe recoverable. We recognize an impairment loss when the sum of undiscounted expected future cash flows isless than the carrying amount of such assets. The impairment loss would equal the amount by which the carryingamount of the asset exceeds the fair value of the asset. Other intangibles consist primarily of customerrelationships and developed technology, which are being amortized on a straight-line basis over their estimateduseful lives.
Stock Repurchase Program. Our existing stock repurchase program approved by our Board of Directors inDecember 2010 and subsequently amended during 2011 allows for the repurchase of $600,000 of our outstandingshares of Class A common stock. This stock repurchase program expires on June 30, 2012. We completed stockrepurchases of 5,606,528 shares for $380,646, inclusive of fees and expenses, under this program. Under a stockrepurchase program which expired in December 2009, we were authorized to repurchase up to $50,000,excluding fees and expenses, of our Class A common stock. We completed stock repurchases of 650,000 sharesfor $12,439, inclusive of fees and expenses, under this program. Additional stock repurchases were made inconnection with our stock-based compensation plans, whereby Company shares were tendered by employees forpayment of applicable statutory tax withholdings. During 2011, 2010, and 2009 such repurchases totaled504,164, 292,576 and 114,642 shares, respectively at an aggregate cost of $35,365, $17,136 and $3,820respectively. At the time of repurchase, shares are returned to the status of authorized and unissued shares. Weaccount for the repurchases as constructively retired and record such repurchases as a reduction of Class Acommon stock and additional paid-in capital.
F-8

Revenue Recognition. Our contracts are entered into on either a time-and-materials or fixed-price basis.Revenues related to time-and-material contracts are recognized as the service is performed. Revenues related tofixed-price contracts that provide for highly complex information technology application development servicesare recognized as the service is performed using the percentage of completion method of accounting, underwhich the total value of revenue is recognized on the basis of the percentage that each contract’s total labor costto date bears to the total expected labor costs (cost to cost method). Revenues related to fixed-price contracts thatprovide solely for application maintenance services are recognized on a straight-line basis unless revenues areearned and obligations are fulfilled in a different pattern. Revenues related to fixed-price contracts that do notprovide for highly complex information technology development services are recognized as services areperformed on a proportional performance basis based upon the level of effort. Expenses are recorded as incurredover the contract period.
Revenues related to business process outsourcing, or BPO, contracts entered into on a time-and-material basisare recognized as the services are performed. Revenues from fixed-price BPO contracts are recognized on astraight-line basis, unless revenues are earned and obligations are fulfilled in a different pattern. Revenues fromtransaction-priced contracts are recognized as transactions are processed. Amounts billable for transition or set-upactivities are deferred and recognized as revenue evenly over the period services are provided. Costs related todelivering BPO services are expensed as incurred with the exception of certain transition costs related to the set-upof processes, personnel and systems, which are deferred during the transition period and expensed evenly over theperiod of service. The deferred costs are specific internal costs or external costs directly related to transition orset-up activities necessary to enable the BPO services. Generally, deferred amounts are protected in the event ofearly termination of the contract and are monitored regularly for impairment. Impairment losses are recorded whenprojected undiscounted operating cash flows of the related contract are not sufficient to recover the carrying amountof the deferred assets. Deferred transition revenues and costs as of December 31, 2011 and 2010 were immaterial.
Contingent or incentive revenues are recognized when the contingency is satisfied and we conclude theamounts are earned. Volume discounts are recorded as a reduction of revenue over the contract period as servicesare provided.
For contracts with multiple deliverables, we evaluate at the inception of each new contract all deliverablesin an arrangement to determine whether they represent separate units of accounting. For arrangements withmultiple units of accounting, primarily fixed-price contracts that provide both application maintenance andapplication development services and certain application maintenance contracts, arrangement consideration isallocated among the units of accounting, where separable, based on their relative selling price. Relative sellingprice is determined based on vendor-specific objective evidence, if it exists. Otherwise, third-party evidence ofselling price is used, when it is available, and in circumstances when neither vendor-specific objective evidencenor third-party evidence of selling price is available, management’s best estimate of selling price is used.Revenue is recognized for each unit of accounting based on our revenue recognition policy described above.
Fixed-price contracts are cancelable subject to a specified notice period. All services provided by us throughthe date of cancellation are due and payable under the contract terms. We issue invoices related to fixed-pricecontracts based upon achievement of milestones during a project or other contractual terms. Differences betweenthe timing of billings, based upon contract milestones or other contractual terms, and the recognition of revenueare recognized as either unbilled receivables or deferred revenue. Estimates of certain fixed-price contracts aresubject to adjustment as a project progresses to reflect changes in expected completion costs or efforts. Thecumulative impact of any revision in estimates is reflected in the financial reporting period in which the changein estimate becomes known and any anticipated losses on contracts are recognized immediately. Warrantyprovisions generally exist under such contracts for a period of up to ninety days past contract completion andcosts related to such provisions are accrued at the time the related revenues are recorded.
For all services, revenue is earned when, and if, evidence of an arrangement is obtained and the othercriteria to support revenue recognition are met, including the price is fixed or determinable, services have been
F-9

rendered and collectability is reasonably assured. Revenues related to services performed without a signedagreement or work order are not recognized until there is evidence of an arrangement, such as when agreementsor work orders are signed or payment is received; however, the cost related to the performance of such work isrecognized in the period the services are rendered.
We account for reimbursement of out-of-pocket expenses as revenues. Subcontractor costs are included incost of services as they are incurred.
Stock-Based Compensation. Stock-based compensation expense for awards of equity instruments toemployees and non-employee directors is determined based on the grant-date fair value of those awards. Werecognize these compensation costs net of an estimated forfeiture rate over the requisite service period of theaward. Forfeitures are estimated on the date of grant and revised if actual or expected forfeiture activity differsmaterially from original estimates.
Foreign Currency. The assets and liabilities of our foreign subsidiaries whose functional currency is not theU.S. dollar are translated into U.S. dollars from local currencies at current exchange rates and revenues andexpenses are translated from local currencies at average monthly exchange rates. The resulting translationadjustments are recorded in accumulated other comprehensive income (loss) on the accompanying consolidatedstatements of financial position. The U.S. dollar is the functional currency for certain foreign subsidiaries whoconduct business predominantly in U.S. dollars. For these foreign subsidiaries, non-monetary assets andliabilities are remeasured at historical exchange rates, while monetary assets and liabilities are remeasured atcurrent exchange rates. Foreign currency exchange gains or losses from remeasurement are included in income.Net foreign currency exchange (losses) gains included in our results of operations, inclusive of our undesignatedforeign currency hedges, were ($8,779), ($9,868), and $1,672, for the years ended December 31, 2011, 2010 and2009, respectively.
Derivative Financial Instruments. Derivative financial instruments are accounted for in accordance with theauthoritative guidance which requires that each derivative instrument be recorded on the balance sheet as eitheran asset or liability measured at its fair value as of the reporting date. Our derivative financial instruments consistof foreign exchange forward contracts. For derivative financial instruments to qualify for hedge accounting, thefollowing criteria must be met: (1) the hedging instrument must be designated as a hedge; (2) the hedgedexposure must be specifically identifiable and expose us to risk; and (3) it is expected that a change in fair valueof the derivative financial instrument and an opposite change in the fair value of the hedged exposure will have ahigh degree of correlation. The authoritative guidance also requires that changes in our derivatives’ fair values berecognized in income unless specific hedge accounting and documentation criteria are met (i.e., the instrumentsare accounted for as hedges). For items which hedge accounting is applied, we record the effective portion of ourderivative financial instruments that are designated as cash flow hedges in accumulated other comprehensiveincome (loss) in the accompanying consolidated statements of financial position. Any ineffectiveness or excludedportion of a designated cash flow hedge is recognized in income.
Use of Estimates. The preparation of financial statements requires management to make estimates andassumptions that affect the reported amounts of assets and liabilities, including the recoverability of tangible andintangible assets, disclosure of contingent assets and liabilities as of the date of the financial statements, and thereported amounts of revenues and expenses during the period. On an on-going basis, management reevaluatesthese estimates. The most significant estimates relate to the recognition of revenue and profits based on thepercentage of completion method of accounting for certain fixed-bid contracts, the allowance for doubtfulaccounts, income taxes and related deferred income tax assets and liabilities, valuation of investments, goodwilland other long-lived assets, assumptions used in determining the fair value of stock-based compensation awardsand derivative financial instruments, contingencies and litigation. Management bases its estimates on historicalexperience and on various other assumptions that are believed to be reasonable under the circumstances. Theactual amounts may vary from the estimates used in the preparation of the accompanying consolidated financialstatements.
F-10

Risks and Uncertainties. The majority of our development and delivery centers and employees are located inIndia. As a result, we may be subject to certain risks associated with international operations, including risksassociated with foreign currency exchange rate fluctuations and risks associated with the application andimposition of protective legislation and regulations relating to import and export or otherwise resulting fromforeign policy or the variability of foreign economic or political conditions. Additional risks associated withinternational operations include difficulties in enforcing intellectual property rights, the burdens of complyingwith a wide variety of foreign laws, potential geo-political and other risks associated with terrorist activities andlocal or cross border conflicts and potentially adverse tax consequences, tariffs, quotas and other barriers.
Concentration of Credit Risk. Financial instruments that potentially subject us to significant concentrationsof credit risk consist primarily of cash and cash equivalents, time deposits, investments in securities, derivativefinancial instruments and trade accounts receivable. We maintain our cash and cash equivalents and investmentswith high credit quality financial institutions, invest in investment-grade debt securities and limit the amount ofcredit exposure to any one commercial issuer. Trade accounts receivable is dispersed across many customersoperating in different industries; therefore, concentration of credit risk is limited.
Income Taxes. We provide for income taxes utilizing the asset and liability method of accounting. Underthis method, deferred income taxes are recorded to reflect the tax consequences in future years of differencesbetween the tax basis of assets and liabilities and their financial reporting amounts at each balance sheet date,based on enacted tax laws and statutory tax rates applicable to the periods in which the differences are expectedto affect taxable income. If it is determined that it is more likely than not that future tax benefits associated with adeferred income tax asset will not be realized, a valuation allowance is provided. The effect on deferred incometax assets and liabilities of a change in the tax rates is recognized in income in the period that includes theenactment date. Tax benefits earned on exercise of employee stock options in excess of compensation charged toincome are credited to additional paid-in capital. Our provision for income taxes also includes the impact ofprovisions established for uncertain income tax positions, as well as the related interest.
Earnings Per Share, or EPS. Basic EPS excludes dilution and is computed by dividing earnings available tocommon stockholders by the weighted-average number of common shares outstanding for the period. DilutedEPS includes all potential dilutive common stock in the weighted average shares outstanding. For purposes ofcomputing diluted earnings per share for the years ended December 31, 2011, 2010 and 2009, respectively,7,074,000, 8,356,000, and 7,811,000 shares were assumed to have been outstanding related to common shareequivalents. We exclude options with exercise prices that are greater than the average market price from thecalculation of diluted EPS because their effect would be anti-dilutive. We excluded 12,500 shares in 2011, zeroshares in 2010, and 3,839,000 shares in 2009 from our diluted EPS calculation. Also, in accordance with theauthoritative guidance, we excluded from the calculation of diluted EPS options to purchase an additional 38,600shares in 2011, 16,500 shares in 2010, and 228,000 shares in 2009, whose combined exercise price, unamortizedfair value and excess tax benefits were greater in each of those periods than the average market price of ourcommon stock because their effect would be anti-dilutive. We include performance stock unit awards in thedilutive potential common shares when they become contingently issuable per the authoritative guidance andexclude the awards when they are not contingently issuable.
Accounting Changes and New Accounting Standards.
In December 2010, the Financial Accounting Standards Board, or FASB, issued new guidance clarifyingcertain disclosure requirements related to business combinations that are material on an individual or aggregatebasis. Specifically, the guidance states that, if comparative financial statements are presented, the entity shoulddisclose revenue and earnings of the combined entity as though the business combination(s) that occurred duringthe current year occurred as of the beginning of the comparable prior annual reporting period only. Additionally,the new standard expands the supplemental pro forma disclosures required by the authoritative guidance toinclude a description of the nature and amount of material, nonrecurring pro forma adjustments directlyattributable to the business combination in the reported pro forma revenue and earnings. We adopted the new
F-11

guidance effective January 1, 2011. Our adoption of this standard did not have a material effect on our financialcondition or consolidated results of operations. However, it may result in additional disclosures in the event thatwe enter into a business combination that is material either on an individual or aggregate basis.
In June 2011, the FASB issued new guidance, which requires that comprehensive income be presentedeither in a single continuous statement of comprehensive income or in two separate consecutive statements, thuseliminating the option of presenting the components of comprehensive income as part of the statement ofchanges in stockholders’ equity. In addition, the new guidance requires that the reclassification adjustments foritems that are reclassified from accumulated other comprehensive income to net income be presented on the faceof the financial statements. In December 2011, the FASB deferred the new requirements related to thepresentation of reclassification adjustments. The requirement to present comprehensive income either in a singlecontinuous statement of comprehensive income or in two separate consecutive statements has not been deferredand will be effective on a retrospective basis for periods beginning on or after January 1, 2012. The adoption ofthis standard affects financial statement presentation only and will have no effect on our financial condition orconsolidated results of operations.
In September 2011, the FASB issued new guidance related to goodwill impairment testing. This standardallows, but does not require, an entity to first assess qualitative factors to determine whether the existence ofevents or circumstances leads to a determination that it is more likely than not that the fair value of a reportingunit is less than its carrying amount. If, after assessing the totality of events or circumstances, an entitydetermines it is not more likely than not that the fair value of a reporting unit is less than its carrying amount,then performing the two-step impairment test is unnecessary. However, if an entity concludes otherwise, then itis required to perform the first step of the two-step impairment test by calculating the fair value of the reportingunit and comparing the fair value with the carrying amount of the reporting unit. If the carrying amount of areporting unit exceeds its fair value, then the entity is required to perform the second step of the goodwillimpairment test to measure the amount of the impairment loss, if any. The new standard gives an entity theoption to bypass the qualitative assessment for any reporting unit in any period and proceed directly toperforming the first step of the two-step goodwill impairment test. An entity may resume performing thequalitative assessment in any subsequent period. This new standard will be effective for periods beginning on orafter January 1, 2012 and will not have a material effect on our financial condition or consolidated results ofoperations.
In December 2011, the FASB issued guidance requiring enhanced disclosures related to the nature of anentity’s rights to offset and any related arrangements associated with its financial instruments and derivativeinstruments. The new guidance requires the disclosure of the gross amounts subject to rights of set-off, amountsoffset in accordance with the accounting standards followed and the related net exposure. The new guidance willbe effective for periods beginning on or after January 1, 2013. The adoption of this standard affects financialstatement disclosures only and will have no effect on our financial condition or consolidated results ofoperations.
2. Acquisitions
During 2011, we completed two business combinations for total consideration, including stock, ofapproximately $91,000 (net of cash acquired). These transactions strengthen our business process and analyticssolution offerings and enhance our retail SAP capabilities.
During 2010, we completed three business combinations for total consideration, including stock, ofapproximately $46,000 (net of cash acquired). These transactions expand our business process outsourcingexpertise within our logistic services, strengthen our business transformation and program managementcapabilities and expand our testing services within Europe. As of December 31, 2010, we accrued additionalconsideration of approximately $6,500 that was contingent on the achievement of certain financial and operatingtargets during the earn-out period by a company which we previously acquired.
F-12

During 2009, we completed four business combinations for an aggregate consideration of approximately$97,300 (net of cash acquired). In December 2009, we acquired the stock of UBS India Service Centre PrivateLimited (“UBS ISC”) for cash consideration of approximately $62,800, net of acquired cash. As part of thistransaction, we acquired multi-year service agreements, an assembled workforce, land, equipment and otherassets. The acquisition expands our business and knowledge process outsourcing capabilities in the financialservices industry. In the third quarter of 2009, we entered into a transaction with Invensys pursuant to which weacquired a multi-year service agreement, an assembled workforce and certain other assets. Under the currentauthoritative business combination guidelines, this transaction qualified as business combination. Thistransaction, with no initial cash consideration, expands our business process outsourcing expertise withinengineering services. The remaining two acquisitions were completed to strengthen our retail and infrastructuremanagement capabilities.
We made an allocation of the purchase price to the tangible and intangible assets and liabilities acquired,including tax deductible goodwill and non-tax deductible goodwill as described in the table below:
2011 2010 2009
Total initial consideration, net of cash acquired(1) . . . . . . . . . . $ 91,000 $ 46,000 $ 97,300Purchase price allocated to:
Tax deductible goodwill . . . . . . . . . . . . . . . . . . . . . . . . . 21,367 — 2,200Non-deductible goodwill . . . . . . . . . . . . . . . . . . . . . . . . . 44,713 22,600 36,600Intangible assets . . . . . . . . . . . . . . . . . . . . . . . . . . . . . . . . 19,400 25,700 37,300
Weighted average life of intangible assets . . . . . . . . . . . . . . . 8.2 years 8.6 years 6.3 years
(1) Includes stock consideration in 2011 and 2010.
The acquisitions in 2011, 2010, and 2009 were included in our consolidated financial statements as of thedate which they were acquired and were not material to our operations, financial position or cash flows. Foradditional details of our goodwill and intangible assets see Note 5.
Note 3 — Investments
Investments were as follows as of December 31:
2011 2010
Available-for-sale securities:U.S. Treasury and agency debt securities . . . . . . . $ 464,938 $340,384Corporate and other debt securities . . . . . . . . . . . . 202,705 122,909Asset-backed securities . . . . . . . . . . . . . . . . . . . . . 100,894 33,154Municipal debt securities . . . . . . . . . . . . . . . . . . . . 43,889 41,655Foreign government debt securities . . . . . . . . . . . . 10,500 7,926
Total available-for-sale securities . . . . . . . . . . . . . . . . . 822,926 546,028Time deposits . . . . . . . . . . . . . . . . . . . . . . . . . . . . . 298,432 139,391
Total investments . . . . . . . . . . . . . . . . . . . . . . . . . . . . . . $1,121,358 $685,419
Our available-for-sale investment securities consist of U.S. dollar denominated investments primarily inU.S. Treasury notes, U.S. government agency debt securities, municipal debt securities, non-U.S. governmentdebt securities, U.S. and international corporate bonds, debt securities issued by supranational institutions andasset-backed securities, including those backed by auto loans, credit card receivables, mortgage loans and otherreceivables. Our investment guidelines are to purchase securities which are investment grade at the time ofacquisition. We monitor the credit ratings of the securities in our portfolio on an ongoing basis. The carryingvalue of the time deposits approximated fair value as of December 31, 2011 and 2010.
F-13

Available-for-Sale Securities
The amortized cost, gross unrealized gains and losses and fair value of available-for-sale investmentsecurities were as follows at December 31:
2011
AmortizedCost
GrossUnrealized
Gains
GrossUnrealizedLosses
FairValue
U.S. Treasury and agency debt securities . . . . . . . . . . . $463,318 $1,742 $(122) $464,938Corporate and other debt securities . . . . . . . . . . . . . . . . 202,284 902 (481) 202,705Asset-backed securities . . . . . . . . . . . . . . . . . . . . . . . . . 101,068 100 (274) 100,894Municipal debt securities . . . . . . . . . . . . . . . . . . . . . . . . 43,873 101 (85) 43,889Foreign government debt securities . . . . . . . . . . . . . . . . 10,397 105 (2) 10,500
Total available-for-sale investment securities . . . . $820,940 $2,950 $(964) $822,926
2010
AmortizedCost
GrossUnrealized
Gains
GrossUnrealizedLosses
FairValue
U.S. Treasury and agency debt securities . . . . . . . . . . . $339,982 $ 994 $(592) $340,384Corporate and other debt securities . . . . . . . . . . . . . . . . 122,137 835 (63) 122,909Asset-backed securities . . . . . . . . . . . . . . . . . . . . . . . . . 33,258 33 (137) 33,154Municipal debt securities . . . . . . . . . . . . . . . . . . . . . . . . 41,802 2 (149) 41,655Foreign government debt securities . . . . . . . . . . . . . . . . 7,844 83 (1) 7,926
Total available-for-sale investment securities . . . . $545,023 $1,947 $(942) $546,028
The fair value and related unrealized losses of available-for-sale investment securities in a continuousunrealized loss position for less than 12 months and for 12 months or longer were as follows as of December 31,2011:
Less than 12 Months 12 Months or More Total
FairValue
UnrealizedLosses
FairValue
UnrealizedLosses
FairValue
UnrealizedLosses
U.S. Treasury and agency debt securities . . . $122,124 $(122) $ — $ — $122,124 $(122)Corporate and other debt securities . . . . . . . . 75,076 (481) — — 75,076 (481)Asset-backed securities . . . . . . . . . . . . . . . . . 58,503 (241) 2,292 (33) 60,795 (274)Municipal debt securities . . . . . . . . . . . . . . . . 5,149 (17) 1,732 (68) 6,881 (85)Foreign government debt securities . . . . . . . 1,507 (2) — — 1,507 (2)
Total . . . . . . . . . . . . . . . . . . . . . . . . . . . . $262,359 $(863) $4,024 $(101) $266,383 $(964)
The fair value and related unrealized losses of available-for-sale investment securities in a continuousunrealized loss position for a period of less than 12 months were as follows as of December 31, 2010:
FairValue
UnrealizedLosses
U.S. Treasury and agency debt securities . . . . . . . . . . . . . $200,772 $(592)Corporate and other debt securities . . . . . . . . . . . . . . . . . . 16,518 (63)Asset-backed securities . . . . . . . . . . . . . . . . . . . . . . . . . . . 17,791 (137)Municipal debt securities . . . . . . . . . . . . . . . . . . . . . . . . . 25,598 (149)Foreign government debt securities . . . . . . . . . . . . . . . . . 1,203 (1)
Total . . . . . . . . . . . . . . . . . . . . . . . . . . . . . . . . . . . . . . $261,882 $(942)
F-14

As of December 31, 2010, we did not have any investments in available-for-sale securities that had been inan unrealized loss position for 12 months or longer.
The unrealized losses for the above securities as of December 31, 2011 and 2010 are primarily attributableto changes in interest rates. As of December 31, 2011, we do not consider any of the investments to be other-than-temporarily impaired.
The gross unrealized gains and losses in the above tables were recorded, net of tax, in accumulated othercomprehensive income (loss).
The contractual maturities of available-for-sale investment securities as of December 31, 2011 are set forthin the following table:
AmortizedCost
FairValue
Due within one year . . . . . . . . . . . . . . . . . . . . . . . . . . . . . $ 95,885 $ 95,971Due after one year through five years . . . . . . . . . . . . . . . . 619,689 621,815Due after ten years . . . . . . . . . . . . . . . . . . . . . . . . . . . . . . . 4,298 4,246Asset-backed securities . . . . . . . . . . . . . . . . . . . . . . . . . . . 101,068 100,894
Total available-for-sale investment securities . . . . . . $820,940 $822,926
Asset-backed securities were excluded from the maturity categories because the actual maturities may differfrom the contractual maturities since the underlying receivables may be prepaid without penalties. Further, actualmaturities of debt securities may differ from those presented above since certain obligations provide the issuerthe right to call or prepay the obligation prior to scheduled maturity without penalty.
Proceeds from sales of available-for-sale investment securities and the gross gains and losses that have beenincluded in earnings as a result of those sales were as follows for the years ended December 31:
2011 2010
Proceeds from sales of available-for-sale investment securities . . . . $652,992 $195,693
Gross gains . . . . . . . . . . . . . . . . . . . . . . . . . . . . . . . . . . . . . . . . . . . . $ 3,102 $ 778Gross losses . . . . . . . . . . . . . . . . . . . . . . . . . . . . . . . . . . . . . . . . . . . . (785) (124)
Net gains on sales of available-for-sale investmentsecurities . . . . . . . . . . . . . . . . . . . . . . . . . . . . . . . . . . . . . . . . $ 2,317 $ 654
During 2009, proceeds from sales of available-for-sale investment securities and the gross gains and lossesthat have been included in earnings as a result of those sales were immaterial.
F-15

4. Property and Equipment, net
Property and equipment were as follows as of December 31:
Estimated Useful Life (Years) 2011 2010
Buildings . . . . . . . . . . . . . . . . . . . . . . . . . . . 30 $ 321,280 $ 289,260Computer equipment and purchasedsoftware . . . . . . . . . . . . . . . . . . . . . . . . . . 3 291,883 227,189
Furniture and equipment . . . . . . . . . . . . . . . 5 – 9 186,983 152,289Land . . . . . . . . . . . . . . . . . . . . . . . . . . . . . . . 16,042 16,042Leasehold land . . . . . . . . . . . . . . . . . . . . . . 39,186 33,653Capital work-in-progress . . . . . . . . . . . . . . . 211,140 95,496Leasehold improvements . . . . . . . . . . . . . . Shorter of the lease term or
the life of leased asset 147,026 108,991
Sub-total . . . . . . . . . . . . . . . . . . . . . . . 1,213,540 922,920Accumulated depreciation andamortization . . . . . . . . . . . . . . . . . . . . . . . (455,506) (352,472)
Property and equipment, net . . . . . . . . . . . . $ 758,034 $ 570,448
Depreciation and amortization expense related to property and equipment was $107,257, 93,190, and$79,126 for the years ended December 31, 2011, 2010, and 2009, respectively.
In India, leasehold land is leased by us from the government of India with lease terms ranging up to 99years. Lease payments are made at the inception of the lease agreement and amortized over the lease term.Amortization expense of leasehold land is immaterial for the periods presented and is included in depreciationand amortization expense in our accompanying consolidated statements of operations.
5. Goodwill and Intangible Assets, net
Changes in goodwill were as follows for the years ended December 31:
2011 2010
Balance, beginning of year . . . . . . . . . . . . . . . . . . . . . . . . $223,963 $192,372Acquisitions and adjustments . . . . . . . . . . . . . . . . . . 66,080 29,120Cumulative translation adjustments . . . . . . . . . . . . . (1,271) 2,471
Balance, end of year . . . . . . . . . . . . . . . . . . . . . . . . . . . . . $288,772 $223,963
In 2011 and 2010, the increase in goodwill was primarily related to the 2011 and 2010 acquisitions,respectively. No impairment losses were recognized during the three years ended December 31, 2011.
Goodwill has been allocated to our reportable segments as follows as of December 31:
2011 2010
Financial Services . . . . . . . . . . . . . . . . . . . . . . . . . . . . . . . $126,550 $ 82,365Healthcare . . . . . . . . . . . . . . . . . . . . . . . . . . . . . . . . . . . . . 70,977 71,302Manufacturing/Retail/Logistics . . . . . . . . . . . . . . . . . . . . . 48,057 26,946Other . . . . . . . . . . . . . . . . . . . . . . . . . . . . . . . . . . . . . . . . . 43,188 43,350
Total goodwill . . . . . . . . . . . . . . . . . . . . . . . . . . . . . . . . . . $288,772 $223,963
F-16
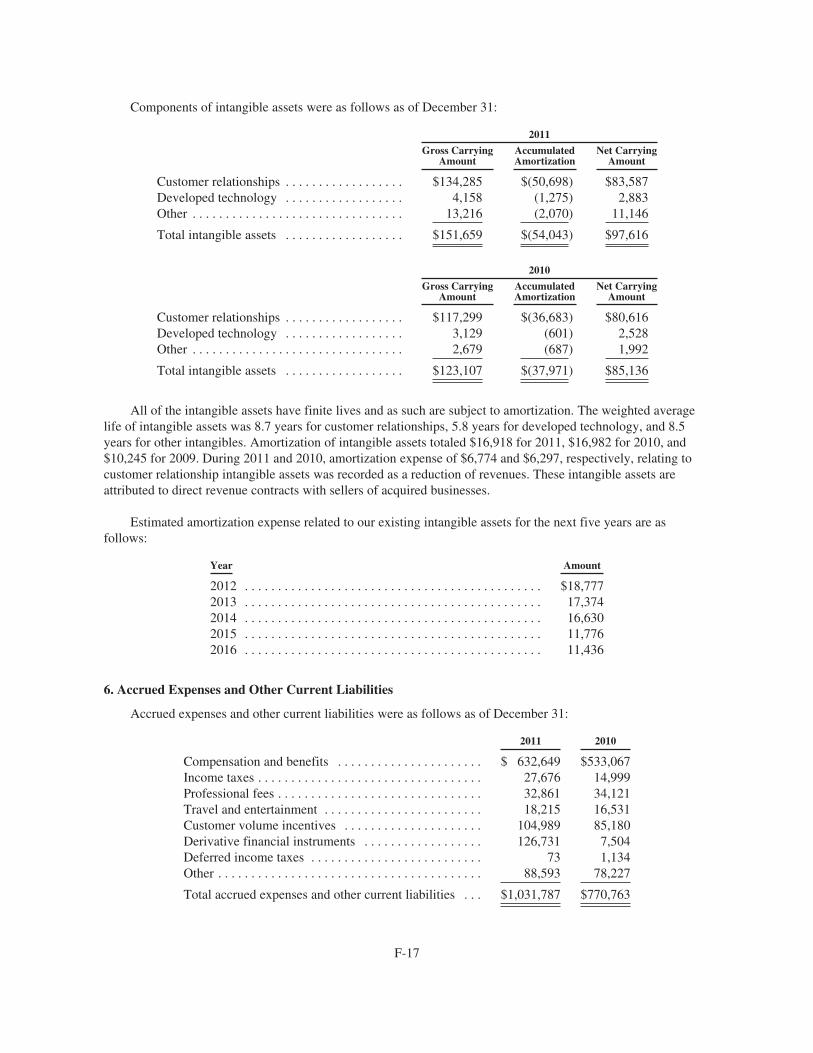
Components of intangible assets were as follows as of December 31:
2011
Gross CarryingAmount
AccumulatedAmortization
Net CarryingAmount
Customer relationships . . . . . . . . . . . . . . . . . . $134,285 $(50,698) $83,587Developed technology . . . . . . . . . . . . . . . . . . 4,158 (1,275) 2,883Other . . . . . . . . . . . . . . . . . . . . . . . . . . . . . . . . 13,216 (2,070) 11,146
Total intangible assets . . . . . . . . . . . . . . . . . . $151,659 $(54,043) $97,616
2010
Gross CarryingAmount
AccumulatedAmortization
Net CarryingAmount
Customer relationships . . . . . . . . . . . . . . . . . . $117,299 $(36,683) $80,616Developed technology . . . . . . . . . . . . . . . . . . 3,129 (601) 2,528Other . . . . . . . . . . . . . . . . . . . . . . . . . . . . . . . . 2,679 (687) 1,992
Total intangible assets . . . . . . . . . . . . . . . . . . $123,107 $(37,971) $85,136
All of the intangible assets have finite lives and as such are subject to amortization. The weighted averagelife of intangible assets was 8.7 years for customer relationships, 5.8 years for developed technology, and 8.5years for other intangibles. Amortization of intangible assets totaled $16,918 for 2011, $16,982 for 2010, and$10,245 for 2009. During 2011 and 2010, amortization expense of $6,774 and $6,297, respectively, relating tocustomer relationship intangible assets was recorded as a reduction of revenues. These intangible assets areattributed to direct revenue contracts with sellers of acquired businesses.
Estimated amortization expense related to our existing intangible assets for the next five years are asfollows:
Year Amount
2012 . . . . . . . . . . . . . . . . . . . . . . . . . . . . . . . . . . . . . . . . . . . . . $18,7772013 . . . . . . . . . . . . . . . . . . . . . . . . . . . . . . . . . . . . . . . . . . . . . 17,3742014 . . . . . . . . . . . . . . . . . . . . . . . . . . . . . . . . . . . . . . . . . . . . . 16,6302015 . . . . . . . . . . . . . . . . . . . . . . . . . . . . . . . . . . . . . . . . . . . . . 11,7762016 . . . . . . . . . . . . . . . . . . . . . . . . . . . . . . . . . . . . . . . . . . . . . 11,436
6. Accrued Expenses and Other Current Liabilities
Accrued expenses and other current liabilities were as follows as of December 31:
2011 2010
Compensation and benefits . . . . . . . . . . . . . . . . . . . . . . $ 632,649 $533,067Income taxes . . . . . . . . . . . . . . . . . . . . . . . . . . . . . . . . . . 27,676 14,999Professional fees . . . . . . . . . . . . . . . . . . . . . . . . . . . . . . . 32,861 34,121Travel and entertainment . . . . . . . . . . . . . . . . . . . . . . . . 18,215 16,531Customer volume incentives . . . . . . . . . . . . . . . . . . . . . 104,989 85,180Derivative financial instruments . . . . . . . . . . . . . . . . . . 126,731 7,504Deferred income taxes . . . . . . . . . . . . . . . . . . . . . . . . . . 73 1,134Other . . . . . . . . . . . . . . . . . . . . . . . . . . . . . . . . . . . . . . . . 88,593 78,227
Total accrued expenses and other current liabilities . . . $1,031,787 $770,763
F-17

7. Accumulated Other Comprehensive Income (Loss)
The components of accumulated other comprehensive income (loss) were as follows as of December 31:
2011 2010
Foreign currency translation adjustments . . . . . . . . . . . . . . . . . . . . . . . . . . . . . $ (3,561) $ 4,278Unrealized (losses) gains on cash flow hedges, net of taxes . . . . . . . . . . . . . . . (323,039) 30,723Unrealized gains on available-for-sale securities, net of taxes . . . . . . . . . . . . . 1,206 597
Total accumulated other comprehensive income (loss) . . . . . . . . . . . . . . . . . . $(325,394) $35,598
8. Employee Benefits
We contribute to defined contribution plans in the United States and Europe, including a 401(k) savings andsupplemental retirement plans in the United States. Total expenses for company contributions to these plans were$19,453, $13,447, and $10,015 for the years ended December 31, 2011, 2010, and 2009, respectively.
We maintain employee benefit plans that cover substantially all India-based employees. The employees’provident fund, pension and family pension plans are statutory defined contribution retirement benefit plans.Under the plans, employees contribute up to 12% of their base compensation, which is matched by an equalcontribution by the Company. For these plans, we recognized a contribution expense of $49,200, $35,049, and$20,729 for the years ended December 31, 2011, 2010, and 2009, respectively.
We also maintain a gratuity plan in India that is a statutory post-employment benefit plan providing definedlump sum benefits. We make annual contributions to an employees’ gratuity fund established with a government-owned insurance corporation to fund a portion of the estimated obligation. Accordingly, our liability for thegratuity plan reflects the undiscounted benefit obligation payable as of the balance sheet date which was basedupon the employees’ salary and years of service. As of December 31, 2011 and 2010, the amount accrued underthe gratuity plan was $39,916 and $25,350, which is net of fund assets of $40,744 and $36,132, respectively.Expense recognized by us was $29,703, $16,949, and $8,918 for the years ended December 31, 2011, 2010, and2009, respectively.
9. Income Taxes
Income before provision for income taxes shown below is based on the geographic location to which suchincome is attributed for years ended December 31:
2011 2010 2009
United States . . . . . . . . . . . . . . . . . . . . . . . . . . . . . . . . . . . . . . $ 344,143 $220,234 $151,711Foreign . . . . . . . . . . . . . . . . . . . . . . . . . . . . . . . . . . . . . . . . . . . 825,006 658,346 485,240
Income before provision for income taxes . . . . . . . . . . . . . . . . $1,169,149 $878,580 $636,951
The provision for income taxes consists of the following components for the years ended December 31:
2011 2010 2009
Current:Federal and state . . . . . . . . . . . . . . . . . . . . . . . . . . . . . . . . . $120,441 $110,713 $101,170Foreign . . . . . . . . . . . . . . . . . . . . . . . . . . . . . . . . . . . . . . . . 173,689 86,236 59,539
Total current . . . . . . . . . . . . . . . . . . . . . . . . . . . . . . . . 294,130 196,949 160,709
Deferred:Federal and state . . . . . . . . . . . . . . . . . . . . . . . . . . . . . . . . . 26,549 (12,597) (35,315)Foreign . . . . . . . . . . . . . . . . . . . . . . . . . . . . . . . . . . . . . . . . (35,148) (39,312) (23,406)
Total deferred . . . . . . . . . . . . . . . . . . . . . . . . . . . . . . . (8,599) (51,909) (58,721)
Total provision for income taxes . . . . . . . . . . . . . . . . $285,531 $145,040 $101,988
F-18

The reconciliation between our effective income tax rate and the U.S. federal statutory rate is as follows:
2011 % 2010 % 2009 %
Tax expense, at U.S. federal statutory rate . . . . . . . . $ 409,202 35.0 $ 307,503 35.0 $ 222,933 35.0State and local income taxes, net of federalbenefit . . . . . . . . . . . . . . . . . . . . . . . . . . . . . . . . . . 20,373 1.7 13,699 1.6 8,648 1.4
Non-taxable income for Indian tax purposes . . . . . . (125,708) (10.8) (166,800) (19.0) (127,800) (20.0)Rate differential on foreign earnings . . . . . . . . . . . . . (26,030) (2.2) (17,733) (2.0) (9,338) (1.5)Other . . . . . . . . . . . . . . . . . . . . . . . . . . . . . . . . . . . . . 7,694 0.7 8,371 0.9 7,545 1.1
Total provision for income taxes . . . . . . . . . . . . $ 285,531 24.4 $ 145,040 16.5 $ 101,988 16.0
The significant components of deferred income tax assets and liabilities recorded on the consolidatedstatements of financial position as of December 31:
2011 2010
Deferred income tax assets:Net operating losses . . . . . . . . . . . . . . . . . . . . . . . . . . . . . . . . . $ 9,742 $ 9,663Revenue recognition . . . . . . . . . . . . . . . . . . . . . . . . . . . . . . . . . 33,083 37,526Compensation and benefits . . . . . . . . . . . . . . . . . . . . . . . . . . . . 60,358 38,480Stock-based compensation . . . . . . . . . . . . . . . . . . . . . . . . . . . . 30,366 24,780Minimum alternative tax (MAT) and other credits . . . . . . . . . . 120,843 100,468Foreign exchange forward contracts . . . . . . . . . . . . . . . . . . . . . 50,194 1,311Depreciation and amortization . . . . . . . . . . . . . . . . . . . . . . . . . 859 4,304Other . . . . . . . . . . . . . . . . . . . . . . . . . . . . . . . . . . . . . . . . . . . . . 4,829 24,982
310,274 241,514Less valuation allowance . . . . . . . . . . . . . . . . . . . . . . . . . . . . . (10,365) (10,684)
Deferred income tax assets, net . . . . . . . . . . . . . . . . . . . . . . . . . 299,909 230,830
Deferred income tax liabilities:Undistributed Indian earnings . . . . . . . . . . . . . . . . . . . . . . . . . . 5,689 6,096Intangible assets . . . . . . . . . . . . . . . . . . . . . . . . . . . . . . . . . . . . 24,398 24,842
Deferred income tax liabilities . . . . . . . . . . . . . . . . . . . . . . . . . 30,087 30,938
Net deferred income tax assets . . . . . . . . . . . . . . . . . . . . . . . . . . . . . $269,822 $199,892
At December 31, 2011, we had foreign net operating loss carryforwards of approximately $36,400. We haverecorded a full valuation allowance on most of the foreign net operating loss carryforwards. As of December 31,2011 and 2010, deferred income tax assets related to the MAT were approximately $112,200 and $98,600,respectively. The calculation of the MAT includes all profits realized by our Indian subsidiaries and any MATpaid in a taxable year is creditable against future Indian corporate income tax within a 10-year expiration period,subject to certain limitations. Our existing MAT assets expire between March 2018 and March 2022 and weexpect to fully utilize them within the applicable 10-year expiration periods.
Our Indian subsidiaries, collectively referred to as Cognizant India, are primarily export-oriented and areeligible for certain income tax holiday benefits granted by the government of India for export activities. Thesebenefits for export activities conducted within Software Technology Parks, or STPs, expired on March 31, 2011.The income of our STPs is now subject to corporate income tax at the current rate of 32.4%. The expiration ofthe income tax holiday for STPs is the primary driver of the significant increase in our effective income tax ratefor 2011. We have constructed most of our newer Indian development centers in areas designated as SpecialEconomic Zones, or SEZs. Development centers operating in SEZs are entitled to certain income tax incentivesfor export activities for periods up to 15 years. For the years ended December 31, 2011, 2010, and 2009, the
F-19

effect of the income tax holidays for our STPs and SEZs was to reduce the overall income tax provision andincrease net income by approximately $125,708, $166,800, and $127,800, respectively, and increase diluted EPSby $0.41, $0.54, and $0.42, respectively.
During the first quarter of 2002, we made a strategic decision to pursue an international strategy thatincludes expanded infrastructure investments in India and geographic expansion in Europe and Asia. We do notintend to repatriate our foreign earnings for all periods (except with respect to Indian earnings generated prior to2002) as such earnings are deemed to be permanently reinvested outside the United States. As of December 31,2011, the amount of unrepatriated Indian earnings and total foreign earnings (including unrepatriated Indianearnings) upon which no incremental U.S. taxes have been recorded is approximately $2,660,500 and$2,906,000, respectively. If such earnings are repatriated in the future, or are no longer deemed to be indefinitelyreinvested, we will accrue the applicable amount of taxes associated with such earnings. Due to the variousmethods by which such earnings could be repatriated in the future, it is not currently practicable to determine theamount of applicable taxes that would result from such repatriation.
Due to the geographical scope of our operations, we are subject to tax examinations in various jurisdictions.Accordingly, we may record incremental tax expense, based upon the more-likely-than-not standard, for anyuncertain tax positions. In addition, when applicable, we adjust the previously recorded tax expense to reflectexamination results when the position is effectively settled. Our ongoing assessments of the more-likely-than-notoutcomes of the examinations and related tax positions require judgment and can increase or decrease oureffective tax rate, as well as impact our operating results. The specific timing of when the resolution of each taxposition will be reached is uncertain.
Changes in unrecognized tax benefits were as follows for the years ended December 31:
2011 2010
Balance, beginning of year . . . . . . . . . . . . . . . . . . . . . . . . . . . . . . . . . . . . . . . . . . $22,950 $10,553Additions based on tax positions related to the current year . . . . . . . . . . . . 16,897 2,677Additions for tax positions of prior years . . . . . . . . . . . . . . . . . . . . . . . . . . . 7,559 10,135Additions for tax positions of acquired subsidiaries . . . . . . . . . . . . . . . . . . . 16,056 —Reductions for tax positions due to lapse of statutes of limitations . . . . . . . (4,190) (597)Settlements . . . . . . . . . . . . . . . . . . . . . . . . . . . . . . . . . . . . . . . . . . . . . . . . . . (1,591) —Foreign currency exchange movement . . . . . . . . . . . . . . . . . . . . . . . . . . . . . (1,155) 182
Balance, end of year . . . . . . . . . . . . . . . . . . . . . . . . . . . . . . . . . . . . . . . . . . . . . . . $56,526 $22,950
At December 31, 2011, the entire balance of unrecognized tax benefits would affect the effective tax rate, ifrecognized. While the Company believes uncertain tax positions may be settled within the next twelve months, itis difficult to estimate the income tax impact of these potential resolutions at this time. We recognize accruedinterest and penalties associated with uncertain tax positions as part of our provision for income taxes. The totalamount of accrued interest and penalties at December 31, 2011 and 2010 was approximately $10,884 and $6,766,respectively, and relates to U.S. and foreign tax matters. The amount of interest and penalties expensed in 2011,2010, and 2009 were immaterial.
We file a U.S. federal consolidated income tax return. The U.S. federal statute of limitations remains openfor the years 2008 and onward. The statute of limitations for state audits varies by state. Years still underexamination by foreign tax authorities are years 2001 and forward.
F-20

10. Fair Value Measurements
We measure our cash equivalents, investments and foreign exchange forward contracts at fair value. Theauthoritative guidance defines fair value as the exit price, or the amount that would be received to sell an asset orpaid to transfer a liability in an orderly transaction between market participants as of the measurement date. Theauthoritative guidance also establishes a fair value hierarchy that is intended to increase consistency andcomparability in fair value measurements and related disclosures. The fair value hierarchy is based on inputs tovaluation techniques that are used to measure fair value that are either observable or unobservable. Observableinputs reflect assumptions market participants would use in pricing an asset or liability based on market dataobtained from independent sources while unobservable inputs reflect a reporting entity’s pricing based upon theirown market assumptions.
The fair value hierarchy consists of the following three levels:
• Level 1—Inputs are quoted prices in active markets for identical assets or liabilities.
• Level 2—Inputs are quoted prices for similar assets or liabilities in an active market, quoted prices foridentical or similar assets or liabilities in markets that are not active, inputs other than quoted pricesthat are observable and market-corroborated inputs which are derived principally from or corroboratedby observable market data.
• Level 3—Inputs are derived from valuation techniques in which one or more significant inputs or valuedrivers are unobservable.
The following table summarizes our financial assets and (liabilities) measured at fair value on a recurringbasis as of December 31, 2011:
Level 1 Level 2 Level 3 Total
Cash equivalents:Money market funds . . . . . . . . . . . . . . . . . . . . . . . . . . . . . . . . $128,004 $ — $— $ 128,004Time deposits . . . . . . . . . . . . . . . . . . . . . . . . . . . . . . . . . . . . . . — 13,283 — 13,283Commercial paper . . . . . . . . . . . . . . . . . . . . . . . . . . . . . . . . . . — 11,626 — 11,626
Total cash equivalents . . . . . . . . . . . . . . . . . . . . . . . . . . . . . . . . . . . 128,004 24,909 — 152,913
Investments:Time deposits . . . . . . . . . . . . . . . . . . . . . . . . . . . . . . . . . . . . . . — 298,432 — 298,432
Available-for-sale securities:U.S. Treasury and agency debt securities . . . . . . . . . . . . 326,659 138,279 — 464,938Corporate and other debt securities . . . . . . . . . . . . . . . . . — 202,705 — 202,705Asset-backed debt securities . . . . . . . . . . . . . . . . . . . . . . — 100,894 — 100,894Municipal debt securities . . . . . . . . . . . . . . . . . . . . . . . . . — 43,889 — 43,889Foreign government debt securities . . . . . . . . . . . . . . . . . — 10,500 — 10,500
Total available-for-sale securities . . . . . . . . . . . . . . . . . . . . . . 326,659 496,267 — 822,926
Total investments . . . . . . . . . . . . . . . . . . . . . . . . . . . . . . . . . . . . . . . 326,659 794,699 — 1,121,358
Derivative financial instruments – foreign exchange forwardcontracts:Other current assets . . . . . . . . . . . . . . . . . . . . . . . . . . . . . . . . . — 30,935 — 30,935Accrued expenses and other current liabilities . . . . . . . . . . . . — (126,731) — (126,731)Other noncurrent liabilities . . . . . . . . . . . . . . . . . . . . . . . . . . . — (259,104) — (259,104)
Total . . . . . . . . . . . . . . . . . . . . . . . . . . . . . . . . . . . . . . . . . . . . . . . . . $454,663 $ 464,708 $— $ 919,371
F-21

The following table summarizes our financial assets and (liabilities) measured at fair value on a recurringbasis as of December 31, 2010:
Level 1 Level 2 Level 3 Total
Cash equivalents:Money market funds . . . . . . . . . . . . . . . . . . . . . . . . . . . . . . . . . $421,424 $ — $— $ 421,424Time deposits . . . . . . . . . . . . . . . . . . . . . . . . . . . . . . . . . . . . . . — 67,703 — 67,703
Total cash equivalents . . . . . . . . . . . . . . . . . . . . . . . . . . . . . . . . . . . . 421,424 67,703 — 489,127
Investments:Time deposits . . . . . . . . . . . . . . . . . . . . . . . . . . . . . . . . . . . . . . — 139,391 — 139,391
Available-for-sale securities:U.S. Treasury and agency debt securities . . . . . . . . . . . . . 268,114 72,270 — 340,384Corporate and other debt securities . . . . . . . . . . . . . . . . . . — 122,909 — 122,909Asset-backed debt securities . . . . . . . . . . . . . . . . . . . . . . . — 33,154 — 33,154Municipal debt securities . . . . . . . . . . . . . . . . . . . . . . . . . . — 41,655 — 41,655Foreign government debt securities . . . . . . . . . . . . . . . . . — 7,926 — 7,926
Total available-for-sale securities . . . . . . . . . . . . . . . . . . . . . . . 268,114 277,914 — 546,028
Total investments . . . . . . . . . . . . . . . . . . . . . . . . . . . . . . . . . . . . . . . 268,114 417,305 — 685,419
Derivative financial instruments – foreign exchange forwardcontracts:Other current assets . . . . . . . . . . . . . . . . . . . . . . . . . . . . . . . . . . — 30,983 — 30,983Accrued expenses and other current liabilities . . . . . . . . . . . . . — (7,504) — (7,504)Other noncurrent assets . . . . . . . . . . . . . . . . . . . . . . . . . . . . . . . — 8,144 — 8,144Other noncurrent liabilities . . . . . . . . . . . . . . . . . . . . . . . . . . . . — (6,601) — (6,601)
Total . . . . . . . . . . . . . . . . . . . . . . . . . . . . . . . . . . . . . . . . . . . . . . . . . . $689,538 $510,030 $— $1,199,568
We measure the fair value of money market funds and U.S. Treasury securities based on quoted prices inactive markets for identical assets. The fair value of commercial paper, U.S. government agency securities,municipal debt securities, U.S. and international corporate bonds and foreign government debt securities ismeasured based on relevant trade data, dealer quotes, or model driven valuations using significant inputs derivedfrom or corroborated by observable market data, such as yield curves and credit spreads. We measure the fairvalue of our asset-backed securities using model driven valuations based on dealer quotes, available tradeinformation, spread data, current market assumptions on prepayment speeds and defaults and historical data ondeal collateral performance.
We estimate the fair value of each foreign exchange forward contract by using a present value of expectedcash flows model. This model calculates the difference between the current market forward price and thecontracted forward price for each foreign exchange contract and applies the difference in the rates to eachoutstanding contract. The market forward rates included a discount and credit risk factor. The amounts wereaggregated by type of contract and maturity.
During the years ended December 31, 2011 and 2010, there were no transfers among Level 1, Level 2, orLevel 3 financial assets and liabilities.
11. Derivative Financial Instruments
In the normal course of business, we use foreign exchange forward contracts to manage foreign currencyexchange rate risk. The estimated fair value of the foreign exchange forward contracts considers the followingitems: discount rate, timing and amount of cash flow and counterparty credit risk. Derivatives may give rise to
F-22
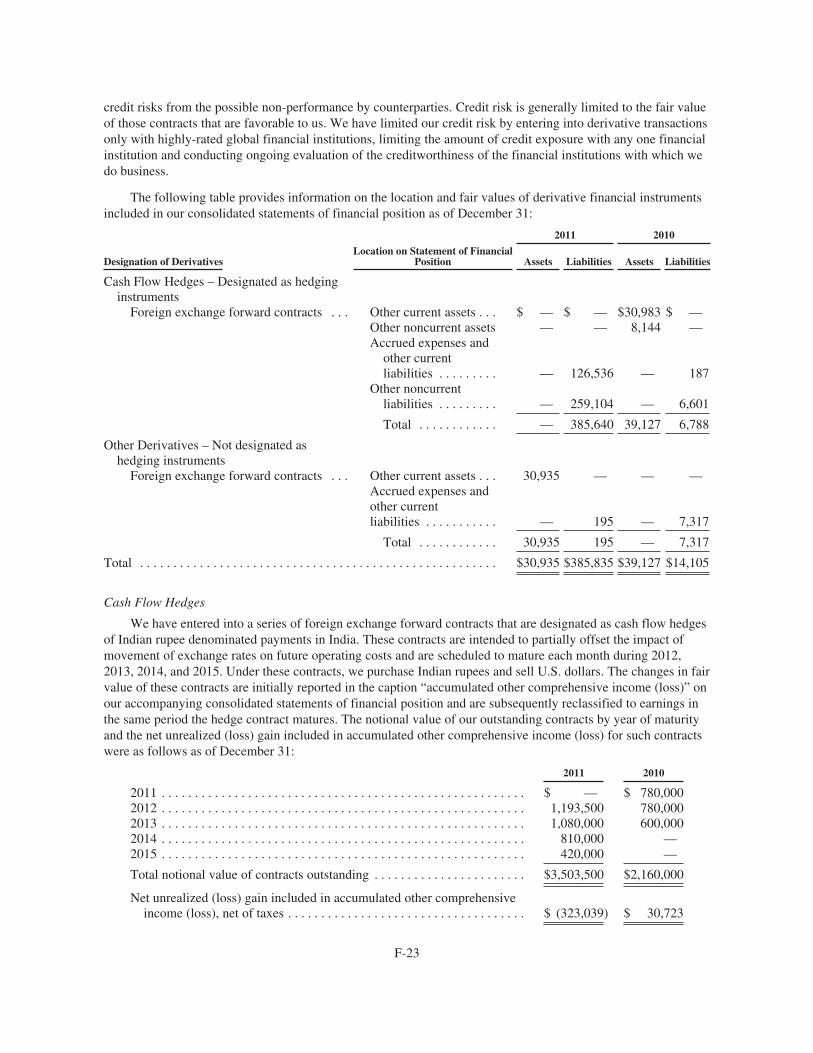
credit risks from the possible non-performance by counterparties. Credit risk is generally limited to the fair valueof those contracts that are favorable to us. We have limited our credit risk by entering into derivative transactionsonly with highly-rated global financial institutions, limiting the amount of credit exposure with any one financialinstitution and conducting ongoing evaluation of the creditworthiness of the financial institutions with which wedo business.
The following table provides information on the location and fair values of derivative financial instrumentsincluded in our consolidated statements of financial position as of December 31:
2011 2010
Designation of DerivativesLocation on Statement of Financial
Position Assets Liabilities Assets Liabilities
Cash Flow Hedges – Designated as hedginginstrumentsForeign exchange forward contracts . . . Other current assets . . . $ — $ — $30,983 $ —
Other noncurrent assets — — 8,144 —Accrued expenses andother currentliabilities . . . . . . . . . — 126,536 — 187
Other noncurrentliabilities . . . . . . . . . — 259,104 — 6,601
Total . . . . . . . . . . . . — 385,640 39,127 6,788
Other Derivatives – Not designated ashedging instrumentsForeign exchange forward contracts . . . Other current assets . . . 30,935 — — —
Accrued expenses andother currentliabilities . . . . . . . . . . . — 195 — 7,317
Total . . . . . . . . . . . . 30,935 195 — 7,317
Total . . . . . . . . . . . . . . . . . . . . . . . . . . . . . . . . . . . . . . . . . . . . . . . . . . . . . . $30,935 $385,835 $39,127 $14,105
Cash Flow Hedges
We have entered into a series of foreign exchange forward contracts that are designated as cash flow hedgesof Indian rupee denominated payments in India. These contracts are intended to partially offset the impact ofmovement of exchange rates on future operating costs and are scheduled to mature each month during 2012,2013, 2014, and 2015. Under these contracts, we purchase Indian rupees and sell U.S. dollars. The changes in fairvalue of these contracts are initially reported in the caption “accumulated other comprehensive income (loss)” onour accompanying consolidated statements of financial position and are subsequently reclassified to earnings inthe same period the hedge contract matures. The notional value of our outstanding contracts by year of maturityand the net unrealized (loss) gain included in accumulated other comprehensive income (loss) for such contractswere as follows as of December 31:
2011 2010
2011 . . . . . . . . . . . . . . . . . . . . . . . . . . . . . . . . . . . . . . . . . . . . . . . . . . . . . . . $ — $ 780,0002012 . . . . . . . . . . . . . . . . . . . . . . . . . . . . . . . . . . . . . . . . . . . . . . . . . . . . . . . 1,193,500 780,0002013 . . . . . . . . . . . . . . . . . . . . . . . . . . . . . . . . . . . . . . . . . . . . . . . . . . . . . . . 1,080,000 600,0002014 . . . . . . . . . . . . . . . . . . . . . . . . . . . . . . . . . . . . . . . . . . . . . . . . . . . . . . . 810,000 —2015 . . . . . . . . . . . . . . . . . . . . . . . . . . . . . . . . . . . . . . . . . . . . . . . . . . . . . . . 420,000 —
Total notional value of contracts outstanding . . . . . . . . . . . . . . . . . . . . . . . $3,503,500 $2,160,000
Net unrealized (loss) gain included in accumulated other comprehensiveincome (loss), net of taxes . . . . . . . . . . . . . . . . . . . . . . . . . . . . . . . . . . . . $ (323,039) $ 30,723
F-23

Upon settlement or maturity of the cash flow hedge contracts we record the related gain or loss, based onour designation at the commencement of the contract, to cost of revenues and selling, general and administrativeexpenses. The following table provides information on the location and amounts of pre-tax gains (losses) on ourcash flow hedges for the years ended December 31:
Increase (decrease) inDerivative Gains
(Losses) Recognizedin Accumulated Other
Comprehensive Income (Loss)(effective portion)
Location of Net Derivative Gains(Losses) Reclassified
from Accumulated OtherComprehensive Income (Loss)
into Income(effective portion)
Net Gain (Loss) Reclassifiedfrom Accumulated Other
Comprehensive Income (Loss)into Income
(effective portion)
2011 2010 2011 2010
Cash Flow Hedges – Designatedas hedging instrumentsForeign exchange forwardcontracts . . . . . . . . . . . . . $(399,205) $54,919 Cost of revenues $15,294 $34,974
Selling, generaland administrativeexpenses . . . . . . . 3,480 6,588
Total . . . . . . . . . . . . . . . . . . . . . . $(399,205) $54,919 $18,774 $41,562
Other Derivatives
We use foreign exchange forward contracts, which have not been designated as hedges, to hedge balancesheet exposure to certain monetary assets and liabilities denominated in currencies other than the functionalcurrency of our foreign subsidiaries. We entered into a series of foreign exchange forward contracts scheduled tomature in 2012 which are primarily to purchase U.S. dollars and sell Indian rupees. Realized gains or losses andchanges in the estimated fair value of these derivative financial instruments are recorded in Other, net in ourconsolidated statements of operations.
Additional information related to our outstanding contracts is as follows as of December 31:
2011 2010
Notional value of contracts outstanding . . . . . . . . . . . . . . $234,239 $234,021
The following table provides information on the location and amounts of realized and unrealized pre-taxgains (losses) on our other derivative financial instruments for years ended December 31, 2011 and 2010.
Location of Net Gains / (Losses)on Derivative Instruments
Amount of Net Gains (Losses)on Derivative Instruments
2011 2010
Other Derivatives—Not designated as hedginginstrumentsForeign exchange forward contracts . . . . . . . . . . . . Other, net $23,621 $(21,088)
The related cash flow impacts of all of our derivative activities are reflected as cash flows from operatingactivities.
12. Stock-Based Compensation Plans
On June 5, 2009, our stockholders approved the adoption of the Cognizant Technology Solutions Corporation2009 Incentive Compensation Plan (the “2009 Incentive Plan”), under which 24,000,000 shares of our Class A
F-24

common stock were reserved for issuance. The 2009 Incentive Plan is the successor plan to our Amended andRestated 1999 Incentive Compensation Plan which terminated on April 13, 2009 in accordance with its terms (the“1999 Incentive Plan”), our Amended and Restated Non-Employee Directors’ Stock Option Plan (the “DirectorPlan”) and our Amended and Restated Key Employees’ Stock Option Plan (the “Key Employee Plan”) whichterminated in July 2009 (collectively, the “Predecessor Plans”). The 2009 Incentive Plan will not affect any optionsor stock issuances outstanding under the Predecessor Plans. No further awards will be made under the PredecessorPlans. As of December 31, 2011, we have 16,902,502 shares available for grant under the 2009 Incentive Plan.
Stock options granted to employees under our plans have a life ranging from seven to ten years, vestproportionally over four years, unless specified otherwise, and have an exercise price equal to the fair marketvalue of the common stock on the date of grant. Grants to non-employee directors vest proportionally over twoyears. Stock-based compensation expense relating to stock options is recognized on a straight-line basis over therequisite service period.
Restricted stock units vest proportionately in quarterly or annual installments over three years. Stock-basedcompensation expense relating to restricted stock units is recognized on a straight-line basis over the requisiteservice period.
We granted performance stock units that cliff vest after three years, principally to executive officers, andperformance stock units that vest over periods ranging from one to three years to employees, including theexecutive officers. The vesting of performance stock units is contingent on both meeting revenue performancetargets and continued service. Stock-based compensation costs for performance stock units that cliff vest arerecognized on a straight-line basis and awards that vest proportionally are recognized on a graded-vesting basisover the vesting period based on the most probable outcome of the performance conditions. If the minimumperformance targets are not met, no compensation cost is recognized and any recognized compensation cost isreversed.
The Company’s 2004 Employee Stock Purchase Plan (the “Purchase Plan”), as amended in 2010, providesfor the issuance of up to 9,000,000 shares of Class A common stock to eligible employees. The Purchase Planprovides for eligible employees to purchase whole shares of Class A common stock at a price of 90% of thelesser of: (a) the fair market value of a share of Class A common stock on the first date of the purchase period or(b) the fair market value of a share of Class A common stock on the last date of the purchase period. Stock-basedcompensation expense for the Purchase Plan is recognized over the vesting period of three months on a straight-line basis. As of December 31, 2011, we had 2,895,310 shares available for future grants and issuances under thePurchase Plan.
The allocation of total stock-based compensation expense between cost of revenues and selling, general andadministrative expenses as well as the related income tax benefit were as follows for the three years endedDecember 31:
2011 2010 2009
Cost of revenues . . . . . . . . . . . . . . . . . . . . . . . . . . . . . . . . . $15,257 $13,147 $14,889Selling, general and administrative expenses . . . . . . . . . . . 74,975 43,837 29,927
Total stock-based compensation expense . . . . . . . . . . . . . $90,232 $56,984 $44,816
Income tax benefit . . . . . . . . . . . . . . . . . . . . . . . . . . . . . . . $21,510 $13,453 $ 9,881
Effective April 1, 2007, the Indian government enacted a fringe benefit tax, or FBT, on the intrinsic value ofstock options and awards as of the vesting date that is payable by us at the time of exercise or distribution foremployees subject to FBT. We elected to recover this cost from the employee and withhold the FBT from theemployee’s stock option or award proceeds at the time of exercise or distribution before remitting the tax to the
F-25

Indian government. Because we were the primary obligor of this tax obligation, we recorded the FBT as anoperating expense and the recovery from the employee was recorded in additional paid-in capital as proceedsfrom stock issuance. During the third quarter of 2009, the Indian government repealed the FBT retroactive toApril 1, 2009. Stock-based FBT expense was as follows for the years ended December, 31:
2011 2010 2009
Stock-based FBT expense . . . . . . . . . . . . . . . . . . . . . . . . . . . . . . . . . . . . . . . . $— $— $945
We estimate the fair value of each stock option granted using the Black-Scholes option-pricing model. Forthe years ended December 31, 2011, 2010 and 2009, expected volatility was calculated using implied marketvolatilities. In addition, the expected term, which represents the period of time, measured from the grant date,that vested options are expected to be outstanding, was derived by incorporating exercise and post-vesttermination assumptions, based on historical data, in a Monte Carlo simulation model. The risk-free rate isderived from the U.S. Treasury yield curve in effect at the time of grant. We have not paid any dividends.Forfeiture assumptions used in amortizing stock-based compensation expense are based on an analysis ofhistorical data.
The fair values of option grants, including the Purchase Plan, were estimated at the date of grant during theyears ended December 31, 2011, 2010, and 2009 based upon the following assumptions and were as follows:
2011 2010 2009
Dividend yield . . . . . . . . . . . . . . . . . . . . . . . . . . . . . . . . . . . . . . . . . . . . . 0% 0% 0%Weighted average volatility factor:
Stock options . . . . . . . . . . . . . . . . . . . . . . . . . . . . . . . . . . . . . . . . . . 31.87% 39.98% 45.98%Purchase Plan . . . . . . . . . . . . . . . . . . . . . . . . . . . . . . . . . . . . . . . . . 34.66% 33.35% 56.63%
Weighted average expected life (in years):Stock options . . . . . . . . . . . . . . . . . . . . . . . . . . . . . . . . . . . . . . . . . . 3.54 3.53 4.18Purchase Plan . . . . . . . . . . . . . . . . . . . . . . . . . . . . . . . . . . . . . . . . . 0.25 0.25 0.25
Weighted average risk-free interest rate:Stock options . . . . . . . . . . . . . . . . . . . . . . . . . . . . . . . . . . . . . . . . . . 1.06% 1.55% 2.48%Purchase Plan . . . . . . . . . . . . . . . . . . . . . . . . . . . . . . . . . . . . . . . . . 0.05% 0.13% 0.14%
Weighted average grant date fair value:Stock options . . . . . . . . . . . . . . . . . . . . . . . . . . . . . . . . . . . . . . . . . . $18.85 $15.35 $10.49Purchase Plan . . . . . . . . . . . . . . . . . . . . . . . . . . . . . . . . . . . . . . . . . $12.21 $ 8.75 $ 5.04
During the year ended December 31, 2011, we issued 732,555 shares of Class A common stock under thePurchase Plan with a total vested fair value of approximately $8,944.
A summary of the activity for stock options granted under our stock-based compensation plans as ofDecember 31, 2011 and changes during the year then ended is presented below:
Number ofOptions
WeightedAverage Exercise
Price(in dollars)
WeightedAverage
RemainingLife
(in years)
AggregateIntrinsicValue
(in thousands)
Outstanding at January 1, 2011 . . . . . . . . . . . . . . . . . . . . . . . . . . 12,867,658 $21.23Granted . . . . . . . . . . . . . . . . . . . . . . . . . . . . . . . . . . . . . . . . . . . . 70,000 75.36Exercised . . . . . . . . . . . . . . . . . . . . . . . . . . . . . . . . . . . . . . . . . . . (2,400,039) 14.55Cancelled . . . . . . . . . . . . . . . . . . . . . . . . . . . . . . . . . . . . . . . . . . . (33,683) 34.70Expired . . . . . . . . . . . . . . . . . . . . . . . . . . . . . . . . . . . . . . . . . . . . (5,275) 34.22
Outstanding at December 31, 2011 . . . . . . . . . . . . . . . . . . . . . . . 10,498,661 $23.06 3.75 $433,805
Vested and expected to vest at December 31, 2011 . . . . . . . . . . 10,459,245 $23.01 3.74 $432,643
Exercisable at December 31, 2011 . . . . . . . . . . . . . . . . . . . . . . . 10,039,536 $22.54 3.62 $419,348
F-26

As of December 31, 2011, $4,012 of total remaining unrecognized stock-based compensation cost related tostock options is expected to be recognized over the weighted-average remaining requisite service period of 0.78years. The total intrinsic value of options exercised was $136,182, $270,349, and $142,676 for the years endedDecember 31, 2011, 2010, and 2009, respectively.
The fair value of performance stock units and restricted stock units is determined based on the number ofstock units granted and the quoted price of our stock at date of grant.
A summary of the activity for performance stock units granted under our stock-based compensation plans asof December 31, 2011 and changes during the year then ended is presented below. The presentation reflects thenumber of performance stock units at the maximum performance milestones.
Number ofUnits
Weighted AverageGrant DateFair Value(in dollars)
Unvested at January 1, 2011 . . . . . . . . . . . . . . . . . . . . . . . . . . . . . . . . . . . . . . . . . . . 1,104,987 $44.15Granted . . . . . . . . . . . . . . . . . . . . . . . . . . . . . . . . . . . . . . . . . . . . . . . . . . . . . . . . . . . . 1,294,375 67.51Vested . . . . . . . . . . . . . . . . . . . . . . . . . . . . . . . . . . . . . . . . . . . . . . . . . . . . . . . . . . . . (492,499) 27.50Forfeited . . . . . . . . . . . . . . . . . . . . . . . . . . . . . . . . . . . . . . . . . . . . . . . . . . . . . . . . . . . (15,476) 48.32Reduction due to the achievement of lower than maximum performancemilestones . . . . . . . . . . . . . . . . . . . . . . . . . . . . . . . . . . . . . . . . . . . . . . . . . . . . . . . (62,459) 60.88
Unvested at December 31, 2011 . . . . . . . . . . . . . . . . . . . . . . . . . . . . . . . . . . . . . . . . 1,828,928 $64.56
As of December 31, 2011, $64,002 of total remaining unrecognized stock-based compensation cost relatedto performance stock units is expected to be recognized over the weighted-average remaining requisite serviceperiod of 2.29 years.
A summary of the activity for restricted stock units granted under our stock-based compensation plans as ofDecember 31, 2011 and changes during the year then ended is presented below:
Number ofUnits
WeightedAverage Grant Date
Fair Value(in dollars)
Unvested at January 1, 2011 . . . . . . . . . . . . . . . . 1,394,027 $41.78Granted . . . . . . . . . . . . . . . . . . . . . . . . . . . . . . . . 1,735,730 72.06Vested . . . . . . . . . . . . . . . . . . . . . . . . . . . . . . . . . (888,013) 40.11Forfeited . . . . . . . . . . . . . . . . . . . . . . . . . . . . . . . (81,153) 60.75
Unvested at December 31, 2011 . . . . . . . . . . . . . 2,160,591 $66.08
As of December 31, 2011, $107,685 of total remaining unrecognized stock-based compensation cost relatedto restricted stock units is expected to be recognized over the weighted-average remaining requisite serviceperiod of 2.29 years.
F-27

13. Commitments and Contingencies
We lease office space and equipment under operating leases, which expire at various dates through the year2023. Certain leases contain renewal provisions and generally require us to pay utilities, insurance, taxes, andother operating expenses. Future minimum rental payments under non-cancelable operating leases as ofDecember 31, 2011 are as follows:
2012 . . . . . . . . . . . . . . . . . . . . . . . . . . . . . . . . . . . . . . . . . . . . $ 104,9852013 . . . . . . . . . . . . . . . . . . . . . . . . . . . . . . . . . . . . . . . . . . . . 98,3982014 . . . . . . . . . . . . . . . . . . . . . . . . . . . . . . . . . . . . . . . . . . . . 86,8962015 . . . . . . . . . . . . . . . . . . . . . . . . . . . . . . . . . . . . . . . . . . . . 77,5392016 . . . . . . . . . . . . . . . . . . . . . . . . . . . . . . . . . . . . . . . . . . . . 61,026Thereafter . . . . . . . . . . . . . . . . . . . . . . . . . . . . . . . . . . . . . . . 81,248
Total minimum lease payments . . . . . . . . . . . . . . . . . . . . . . $ 510,092
Rental expense totaled $122,035, $94,863, and $75,170 for years ended December 31, 2011, 2010, and2009, respectively.
Our current India real estate development program includes planned construction of an additional10.5 million square feet of new space between 2011 and the end of 2015. The expanded program includes theexpenditure of over $700,000 during this period on land acquisition, facilities construction and furnishings tobuild new company-owned state-of-the-art IT development and delivery centers in regions primarily designatedas SEZs located in India. As of December 31, 2011, we had outstanding fixed capital commitments of $240,134related to our India development center expansion program.
We are involved in various claims and legal actions arising in the ordinary course of business. In the opinionof management, the outcome of such claims and legal actions, if decided adversely, is not expected to have amaterial adverse effect on our business, financial condition, results of operations and cash flows. Additionally,many of our engagements involve projects that are critical to the operations of our customers’ business andprovide benefits that are difficult to quantify. Any failure in a customer’s systems or our failure to meet ourcontractual obligations to our clients, including any breach involving a customer’s confidential information orsensitive data, or our obligations under applicable laws or regulations could result in a claim for substantialdamages against us, regardless of our responsibility for such failure. Although we attempt to contractually limitour liability for damages arising from negligent acts, errors, mistakes, or omissions in rendering our services,there can be no assurance that the limitations of liability set forth in our contracts will be enforceable in allinstances or will otherwise protect us from liability for damages. Although we have general liability insurancecoverage, including coverage for errors or omissions, there can be no assurance that such coverage will continueto be available on reasonable terms or will be available in sufficient amounts to cover one or more large claims,or that the insurer will not disclaim coverage as to any future claim. The successful assertion of one or more largeclaims against us that exceed available insurance coverage or changes in our insurance policies, includingpremium increases or the imposition of large deductible or co-insurance requirements, could have a materialadverse effect on our business, results of operations and financial condition.
In the normal course of business and in conjunction with certain client engagements, we have entered intocontractual arrangements through which we may be obligated to indemnify clients or other parties with whom weconduct business with respect to certain matters. These arrangements can include provisions whereby we agree tohold the indemnified party and certain of their affiliated entities harmless with respect to third-party claimsrelated to such matters as our breach of certain representations or covenants, or out of our intellectual propertyinfringement, our gross negligence or willful misconduct or certain other claims made against certain parties.Payments by us under any of these arrangements are generally conditioned on the client making a claim andproviding us with full control over the defense and settlement of such claim. It is not possible to determine themaximum potential amount under these indemnification agreements due to the unique facts and circumstancesinvolved in each particular agreement. Historically, we have not made payments under these indemnification
F-28

agreements so they have not had any impact on our operating results, financial position, or cash flows. However,if events arise requiring us to make payment for indemnification claims under our indemnification obligations incontracts we have entered, such payments could have material impact on our operating results, financial position,and cash flows.
14. Segment Information
Our reportable segments are: Financial Services, which includes customers providing banking/transactionprocessing, capital markets and insurance services; Healthcare, which includes healthcare providers and payersas well as life sciences customers; Manufacturing/Retail/Logistics, which includes manufacturers, retailers, traveland other hospitality customers, as well as customers providing logistics services; and Other, which is anaggregation of industry segments which, individually, are less than 10% of consolidated revenues and segmentoperating profit. The Other reportable segment includes our information, media and entertainment services,communications and high technology operating segments. Our sales managers, account executives, accountmanagers and project teams are aligned in accordance with the specific industries they serve.
Our chief operating decision maker evaluates the Company’s performance and allocates resources based onsegment revenues and operating profit. Segment operating profit is defined as income from operations beforeunallocated costs. Generally, operating expenses for each operating segment have similar characteristics and aresubject to the same factors, pressures and challenges. However, the economic environment and its effects onindustries served by our operating segments may affect revenue and operating expenses to differing degrees.Expenses included in segment operating profit consist principally of direct selling and delivery costs as well as aper seat charge for use of the development and delivery centers. Certain selling, general and administrativeexpenses, excess or shortfall of incentive compensation for delivery personnel as compared to target, a portion ofdepreciation and amortization, stock-based compensation expense and the related stock-based Indian fringebenefit tax, and the impact of the settlements of our cash flow hedges are not allocated to individual segments ininternal management reports used by the chief operating decision maker. Accordingly, such expenses areexcluded from segment operating profit and are separately disclosed as “unallocated” and adjusted only againstour total income from operations. Additionally, management has determined that it is not practical to allocateidentifiable assets, by segment, since such assets are used interchangeably among the segments.
Revenues from external customers and segment operating profit, before unallocated expenses, for theFinancial Services, Healthcare, Manufacturing/Retail/Logistics, and Other reportable segments were as followsfor the years ended December 31:
2011 2010 2009
Revenues:Financial Services . . . . . . . . . . . . . . . . . . . . . . . . . . . . . . . $2,518,422 $1,944,450 $1,406,629Healthcare . . . . . . . . . . . . . . . . . . . . . . . . . . . . . . . . . . . . . 1,622,157 1,177,113 860,427Manufacturing/Retail/Logistics . . . . . . . . . . . . . . . . . . . . . 1,197,472 849,643 564,917Other . . . . . . . . . . . . . . . . . . . . . . . . . . . . . . . . . . . . . . . . . . 783,105 621,183 446,690
Total revenues . . . . . . . . . . . . . . . . . . . . . . . . . . . . . . $6,121,156 $4,592,389 $3,278,663
2011 2010 2009
Segment Operating Profit:Financial Services . . . . . . . . . . . . . . . . . . . . . . . . . . . . . . . $ 872,267 $ 668,595 $ 503,689Healthcare . . . . . . . . . . . . . . . . . . . . . . . . . . . . . . . . . . . . . 625,052 436,879 331,007Manufacturing/Retail/Logistics . . . . . . . . . . . . . . . . . . . . . 440,416 283,676 184,636Other . . . . . . . . . . . . . . . . . . . . . . . . . . . . . . . . . . . . . . . . . . 254,145 208,306 147,246
Total segment operating profit . . . . . . . . . . . . . . . . . . 2,191,880 1,597,456 1,166,578Less—unallocated costs(1) . . . . . . . . . . . . . . . . . . . . . . . . . 1,055,412 735,604 548,088
Income from operations . . . . . . . . . . . . . . . . . . . . . . . $1,136,468 $ 861,852 $ 618,490
F-29

(1) Includes $90,232, $56,984, and $44,816 of stock-based compensation expense for the years ended December 31, 2011,2010, and 2009, respectively, and $945 of stock-based Indian fringe benefit tax expense for the years endedDecember 31, 2009.
Geographic Area Information
Revenue and long-lived assets, by geographic area, are as follows:
North America(2) Europe(3) Other(5)(6) Total
2011Revenues(1) . . . . . . . . . . . . . . . . . . . . . . . . $4,802,958 $1,097,475 $220,723 $6,121,156Long-lived assets(4) . . . . . . . . . . . . . . . . . . 27,387 5,232 725,415 758,034
2010Revenues(1) . . . . . . . . . . . . . . . . . . . . . . . . $3,582,719 $ 855,575 $154,095 $4,592,389Long-lived assets(4) . . . . . . . . . . . . . . . . . . 12,198 3,687 554,563 570,448
2009Revenues(1) . . . . . . . . . . . . . . . . . . . . . . . . $2,594,210 $ 606,804 $ 77,649 $3,278,663Long-lived assets(4) . . . . . . . . . . . . . . . . . . 9,042 3,145 469,329 481,516
(1) Revenues are attributed to regions based upon customer location.(2) Substantially all relates to operations in the United States.(3) Includes revenue from operations in the United Kingdom of $698,853, $559,297, and $353,471 in 2011,
2010, and 2009, respectively.(4) Long-lived assets include property and equipment net of accumulated depreciation and amortization.(5) Includes our operations in Asia Pacific, Middle East and Latin America.(6) Substantially all of these long-lived assets relate to operations in India.
15. Quarterly Financial Data (Unaudited)
Summarized quarterly results for the two years ended December 31, 2011 are as follows:
Three Months Ended
Full Year2011 March 31 June 30 September 30 December 31
Revenues . . . . . . . . . . . . . . . . . . . . . . . . . . . . $1,371,253 $1,485,242 $1,600,954 $1,663,707 $6,121,156Cost of revenues (exclusive of depreciationand amortization expense shownseparately below) . . . . . . . . . . . . . . . . . . . 782,176 860,871 924,886 970,689 3,538,622
Selling, general and administrativeexpenses . . . . . . . . . . . . . . . . . . . . . . . . . . 296,330 326,718 353,161 352,456 1,328,665
Depreciation and amortization expense . . . . 27,382 27,695 29,905 32,419 117,401Income from operations . . . . . . . . . . . . . . . . 265,365 269,958 293,002 308,143 1,136,468Net income . . . . . . . . . . . . . . . . . . . . . . . . . . 208,327 208,045 227,119 240,127 883,618Basic EPS . . . . . . . . . . . . . . . . . . . . . . . . . . . $ 0.69 $ 0.68 $ 0.75 $ 0.79 $ 2.91Diluted EPS . . . . . . . . . . . . . . . . . . . . . . . . . $ 0.67 $ 0.67 $ 0.73 $ 0.78 $ 2.85
F-30

Three Months Ended
Full Year2010 March 31 June 30 September 30 December 31
Revenues . . . . . . . . . . . . . . . . . . . . . . . . . . . . . $959,720 $1,105,154 $1,216,913 $1,310,602 $4,592,389Cost of revenues (exclusive of depreciationand amortization expense shown separatelybelow) . . . . . . . . . . . . . . . . . . . . . . . . . . . . . 555,904 641,019 699,623 758,023 2,654,569
Selling, general and administrativeexpenses . . . . . . . . . . . . . . . . . . . . . . . . . . . . 194,993 234,547 262,632 279,921 972,093
Depreciation and amortization expense . . . . . . 25,806 23,673 26,359 28,037 103,875Income from operations . . . . . . . . . . . . . . . . . . 183,017 205,915 228,299 244,621 861,852Net income . . . . . . . . . . . . . . . . . . . . . . . . . . . . 151,500 172,175 203,699 206,166 733,540Basic EPS . . . . . . . . . . . . . . . . . . . . . . . . . . . . $ 0.51 $ 0.57 $ 0.68 $ 0.68 $ 2.44Diluted EPS . . . . . . . . . . . . . . . . . . . . . . . . . . . $ 0.49 $ 0.56 $ 0.66 $ 0.66 $ 2.37
F-31

Cognizant Technology Solutions Corporation
Valuation and Qualifying AccountsFor the Years Ended December 31, 2011, 2010, and 2009
(Dollars in Thousands)
Description
Balance atBeginning of
Period
Charged toCosts andExpenses
Charged toOther
AccountsDeductions/
Other
Balance atEnd ofPeriod
Accounts receivable allowance for doubtfulaccounts:2011 . . . . . . . . . . . . . . . . . . . . . . . . . . . . . . . . . . $20,991 $ 4,516 $— $ 849 $24,6582010 . . . . . . . . . . . . . . . . . . . . . . . . . . . . . . . . . . $16,465 $ 5,950 $— $ 1,424 $20,9912009 . . . . . . . . . . . . . . . . . . . . . . . . . . . . . . . . . . 13,441 3,347 — 323 16,465
Warranty accrual:2011 . . . . . . . . . . . . . . . . . . . . . . . . . . . . . . . . . . $ 9,094 $14,078 $— $10,881 $12,2912010 . . . . . . . . . . . . . . . . . . . . . . . . . . . . . . . . . . $ 6,575 $10,384 $— $ 7,865 $ 9,0942009 . . . . . . . . . . . . . . . . . . . . . . . . . . . . . . . . . . 5,669 7,588 — 6,682 6,575
Valuation allowance—deferred income tax assets:2011 . . . . . . . . . . . . . . . . . . . . . . . . . . . . . . . . . . $10,684 $ 470 $— $ 789 $10,3652010 . . . . . . . . . . . . . . . . . . . . . . . . . . . . . . . . . . $10,230 $ 1,362 $— $ 908 $10,6842009 . . . . . . . . . . . . . . . . . . . . . . . . . . . . . . . . . . 7,883 2,362 — 15 10,230
F-32

EXHIBIT 31.1
CERTIFICATION
I, Francisco D’Souza, certify that:
1. I have reviewed this Annual Report on Form 10-K of Cognizant Technology Solutions Corporation;
2. Based on my knowledge, this report does not contain any untrue statement of a material fact or omit tostate a material fact necessary to make the statements made, in light of the circumstances under whichsuch statements were made, not misleading with respect to the period covered by this report;
3. Based on my knowledge, the financial statements, and other financial information included in thisreport, fairly present in all material respects the financial condition, results of operations and cashflows of the registrant as of, and for, the periods presented in this report;
4. The registrant’s other certifying officer and I are responsible for establishing and maintainingdisclosure controls and procedures (as defined in Exchange Act Rules 13a-15(e) and 15d-15(e)) andinternal control over financial reporting (as defined in Exchange Act Rules 13a-15(f) and 15d-15(f)) forthe registrant and have:
a) Designed such disclosure controls and procedures, or caused such disclosure controls andprocedures to be designed under our supervision, to ensure that material information relating tothe registrant, including its consolidated subsidiaries, is made known to us by others within thoseentities, particularly during the period in which this report is being prepared;
b) Designed such internal control over financial reporting, or caused such internal control overfinancial reporting to be designed under our supervision, to provide reasonable assuranceregarding the reliability of financial reporting and the preparation of financial statements forexternal purposes in accordance with generally accepted accounting principles;
c) Evaluated the effectiveness of the registrant’s disclosure controls and procedures and presented inthis report our conclusions about the effectiveness of the disclosure controls and procedures, as ofthe end of the period covered by this report based on such evaluation; and
d) Disclosed in this report any change in the registrant’s internal control over financial reporting thatoccurred during the registrant’s most recent fiscal quarter (the registrant’s fourth fiscal quarter inthe case of an annual report) that has materially affected, or is reasonably likely to materiallyaffect, the registrant’s internal control over financial reporting; and
5. The registrant’s other certifying officer and I have disclosed, based on our most recent evaluation ofinternal control over financial reporting, to the registrant’s auditors and the audit committee of theregistrant’s board of directors (or persons performing the equivalent function):
a) All significant deficiencies and material weaknesses in the design or operation of internal controlover financial reporting which are reasonably likely to adversely affect the registrant’s ability torecord, process, summarize and report financial information; and
b) Any fraud, whether or not material, that involves management or other employees who have asignificant role in the registrant’s internal control over financial reporting.
Dated: February 27, 2012
/S/ FRANCISCO D’SOUZAFrancisco D’Souza
Chief Executive Officer(Principal Executive Officer)
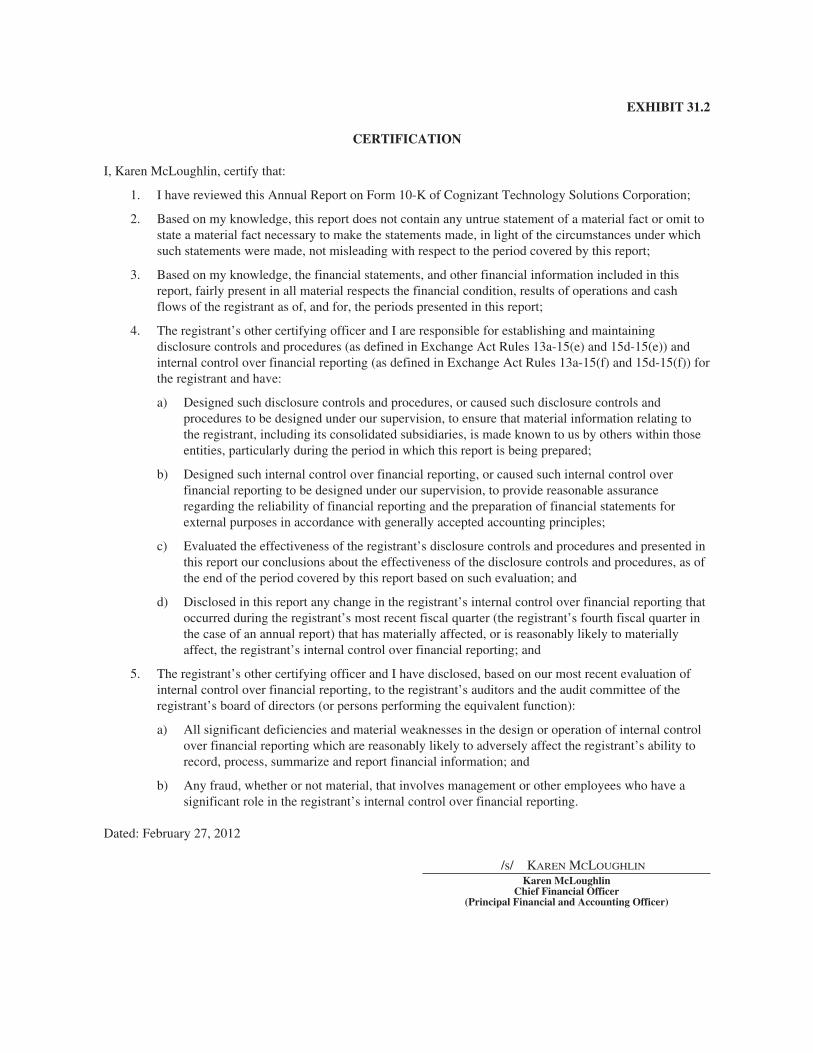
EXHIBIT 31.2
CERTIFICATION
I, Karen McLoughlin, certify that:
1. I have reviewed this Annual Report on Form 10-K of Cognizant Technology Solutions Corporation;
2. Based on my knowledge, this report does not contain any untrue statement of a material fact or omit tostate a material fact necessary to make the statements made, in light of the circumstances under whichsuch statements were made, not misleading with respect to the period covered by this report;
3. Based on my knowledge, the financial statements, and other financial information included in thisreport, fairly present in all material respects the financial condition, results of operations and cashflows of the registrant as of, and for, the periods presented in this report;
4. The registrant’s other certifying officer and I are responsible for establishing and maintainingdisclosure controls and procedures (as defined in Exchange Act Rules 13a-15(e) and 15d-15(e)) andinternal control over financial reporting (as defined in Exchange Act Rules 13a-15(f) and 15d-15(f)) forthe registrant and have:
a) Designed such disclosure controls and procedures, or caused such disclosure controls andprocedures to be designed under our supervision, to ensure that material information relating tothe registrant, including its consolidated subsidiaries, is made known to us by others within thoseentities, particularly during the period in which this report is being prepared;
b) Designed such internal control over financial reporting, or caused such internal control overfinancial reporting to be designed under our supervision, to provide reasonable assuranceregarding the reliability of financial reporting and the preparation of financial statements forexternal purposes in accordance with generally accepted accounting principles;
c) Evaluated the effectiveness of the registrant’s disclosure controls and procedures and presented inthis report our conclusions about the effectiveness of the disclosure controls and procedures, as ofthe end of the period covered by this report based on such evaluation; and
d) Disclosed in this report any change in the registrant’s internal control over financial reporting thatoccurred during the registrant’s most recent fiscal quarter (the registrant’s fourth fiscal quarter inthe case of an annual report) that has materially affected, or is reasonably likely to materiallyaffect, the registrant’s internal control over financial reporting; and
5. The registrant’s other certifying officer and I have disclosed, based on our most recent evaluation ofinternal control over financial reporting, to the registrant’s auditors and the audit committee of theregistrant’s board of directors (or persons performing the equivalent function):
a) All significant deficiencies and material weaknesses in the design or operation of internal controlover financial reporting which are reasonably likely to adversely affect the registrant’s ability torecord, process, summarize and report financial information; and
b) Any fraud, whether or not material, that involves management or other employees who have asignificant role in the registrant’s internal control over financial reporting.
Dated: February 27, 2012
/s/ KAREN MCLOUGHLINKaren McLoughlin
Chief Financial Officer(Principal Financial and Accounting Officer)

EXHIBIT 32.1
CERTIFICATION PURSUANT TO 18 U.S.C. SECTION 1350,AS ADOPTED PURSUANT TO
SECTION 906 OF THE SARBANES-OXLEY ACT OF 2002
In connection with the Annual Report on Form 10-K of Cognizant Technology Solutions Corporation (the“Company”) for the period ended December 31, 2011 as filed with the Securities and Exchange Commission onthe date hereof (the “Report”), the undersigned, Francisco D’Souza, Chief Executive Officer of the Company,hereby certifies, pursuant to 18 U.S.C. Section 1350, that:
(1) The Report fully complies with the requirements of Section 13(a) or 15(d) of the Securities ExchangeAct of 1934; and
(2) The information contained in the Report fairly presents, in all material respects, the financial conditionand results of operations of the Company.
Dated: February 27, 2012
/S/ FRANCISCO D’SOUZA *Francisco D’Souza
Chief Executive Officer(Principal Executive Officer)
* A signed original of this written statement required by Section 906 has been provided to CognizantTechnology Solutions Corporation and will be retained by Cognizant Technology Solutions Corporationand furnished to the Securities and Exchange Commission or its staff upon request.

EXHIBIT 32.2
CERTIFICATION PURSUANT TO 18 U.S.C. SECTION 1350,AS ADOPTED PURSUANT TO
SECTION 906 OF THE SARBANES-OXLEY ACT OF 2002
In connection with the Annual Report on Form 10-K of Cognizant Technology Solutions Corporation (the“Company”) for the period ended December 31, 2011 as filed with the Securities and Exchange Commission onthe date hereof (the “Report”), the undersigned, Karen McLoughlin, Chief Financial Officer, of the Company,hereby certifies, pursuant to 18 U.S.C. Section 1350, that:
(1) The Report fully complies with the requirements of Section 13(a) or 15(d) of the Securities ExchangeAct of 1934; and
(2) The information contained in the Report fairly presents, in all material respects, the financial conditionand results of operations of the Company.
Dated: February 27, 2012
/S/ KAREN MCLOUGHLIN *
Karen McLoughlin,Chief Financial Officer
(Principal Financial and Accounting Officer)
* A signed original of this written statement required by Section 906 has been provided to CognizantTechnology Solutions Corporation and will be retained by Cognizant Technology Solutions Corporationand furnished to the Securities and Exchange Commission or its staff upon request.

$6,121,15611
$4,592,38910
$3,278,66309
$2,816,30408
$2,135,57707
RE
VE
NU
ES
(In
Th
ou
san
ds)
$1,136,46811
$861,85210
$618,49009
$516,67008
$381,52207
OP
ER
AT
ING
IN
CO
ME
(In
Th
ou
san
ds)
$3,952,88611
$3,584,43110
$2,653,17709
$1,965,57808
$1,468,21007
ST
OC
KH
OL
DE
RS
’ E
QU
ITY
(I
n T
ho
usa
nd
s)
137,70011
104,00010
78,42209
61,69708
55,40507
EM
PL
OY
EE
S
Revenues have increased
33% over 2010 & increased
187% SINCE 2007
Companies cannot master 21st century challenges with 20th century
strategies and methods. Organizations need to rethink their business
models to change the ways they interact with consumers, employees,
partners and others. We can help them rethink their value chain
to increase productivity and gain competitive advantage. Businesses
must also reinvent the workforce to reflect the millennial mindset
and its flexible, open and inclusive way of working. We can help them
adopt new tools to enable knowledge sharing and drive productivity
and innovation. And companies must rewire operations that are
being transformed by mobile devices, cloud computing, predictive
analytics, social networks and global commerce. We can help them
use these technologies to find new ways to increase flexibility, lower
costs and decrease time to market. As we help companies reimagine
their businesses for the future, the result will be greater value-creation
for clients —and continued industry-leading growth for Cognizant.
DIRECTORS
John E. Klein (1) (2) (3)
Chairman of the Board
Cognizant,
President and
Chief Executive Officer
Polarex, Inc.
Lakshmi Narayanan
Vice Chairman
Cognizant
John N. Fox, Jr. (1) (3)
Former Vice Chairman
Deloitte & Touche LLP
Robert W. Howe (1) (3)
Chairman
ADS
Robert E. Weissman (1) (3)
Chairman
Shelburne Investments
Thomas M. Wendel (2) (3)
Former Chief Executive Officer
Bridge Information Systems
Maureen Breakiron-Evans (2) (3)
Former Chief Financial Officer
Towers Perrin
Francisco D’Souza
Chief Executive Officer
Cognizant
BOARD COMMITTEES:
(1) Compensation Committee
(2) Audit Committee
(3) Nominating and Corporate Governance Committee
EXECUTIVE OFFICERS
Lakshmi Narayanan
Vice Chairman
Francisco D’Souza
Chief Executive Officer
Gordon J. Coburn
President
Karen McLoughlin
Chief Financial Officer
Ramakrishnan Chandrasekaran
Group Chief Executive–
Technology and Operations
Rajeev Mehta
Group Chief Executive –
Industries and Markets
Malcolm Frank
Executive Vice President,
Strategy and Marketing
Steven Schwartz
Senior Vice President,
General Counsel
and Secretary
EXECUTIVE OFFICES
Glenpointe Centre West
500 Frank W. Burr Blvd.
Teaneck, NJ 07666
Phone: 201.801.0233
FORM 10-K
A copy of the Company’s Form 10-K is
available without charge upon request
by contacting Investor Relations at the
address or phone number listed.
COMMON STOCK INFORMATION
The Company’s Class A common stock
(CTSH) is listed on the NASDAQ Global
Select Market.
ANNUAL MEETING
The Company’s annual meeting
of stockholders will be held at
9:30 am on Tuesday, June 5, 2012
at the Company’s headquarters:
Glenpointe Centre West
500 Frank W. Burr Blvd.
Teaneck, NJ 07666
LEGAL COUNSEL
DLA Piper LLP (US)
300 Campus Drive
Florham Park, NJ 07932
INDEPENDENT REGISTERED
PUBLIC ACCOUNTING FIRM
PricewaterhouseCoopers LLP
300 Madison Avenue
New York, NY 10017
TRANSFER AGENT
American Stock Transfer
& Trust Company, LLC
6201 15th Avenue
Brooklyn, NY 11219
INTERNET
Additional company information is
available on the World Wide Web:
www.cognizant.com
INVESTOR RELATIONS
Requests for financial information
should be sent to:
David Nelson
Cognizant Technology Solutions
Glenpointe Centre West
500 Frank W. Burr Blvd.
Teaneck, NJ 07666
Phone: 201.801.0233
CORPORATE INFORMATION

WORLD HEADQUARTERS
Glenpointe Centre West500 Frank W. Burr Blvd.Teaneck, NJ 07666
PHONE: 201.801.0233TOLL FREE: 888.937.3277www.cognizant.com
CO
GN
IZA
NT
2011 A
NN
UA
L R
EP
OR
T
ANNUAL REPORT 2011
Helping companies RETHINK, REINVENT & REWIRE
their businesses for the future