Embed Size (px)
Citation preview
Towards COast to COast NETworks of marine protected areas (from the shore to the high and
deep sea), coupled with sea
Date:05/08/2015
Work package: WP9
Authors: Valentina Grande (CNR-
Participants: CNR-ISMAR, UkrSCES.
COCONET Project
Collaborative project
Theme: OCEAN.2011-4
Grant agreement no: 287844
COCONET
Towards COast to COast NETworks of marine protected areas (from the shore to the high and
deep sea), coupled with sea-based wind energy potential
WEBGIS MANUAL
Version: v3
-ISMAR), Federica Foglini (CNR-ISMAR)
, UkrSCES.
Towards COast to COast NETworks of marine protected areas (from the shore to the high and
based wind energy potential
Contents
The WebGIS platform .................................................................................................................................... 3
1. Navigation panel and Table Of Content .................................................................................................... 4
2. Identify ....................................................................................................................................................... 4
3. Query table ................................................................................................................................................ 6
4. Erase .......................................................................................................................................................... 8
5. Table of content visualization ................................................................................................................... 8
6. Advanced search ........................................................................................................................................ 9
7. Print map ................................................................................................................................................. 11
8. Download................................................................................................................................................. 13
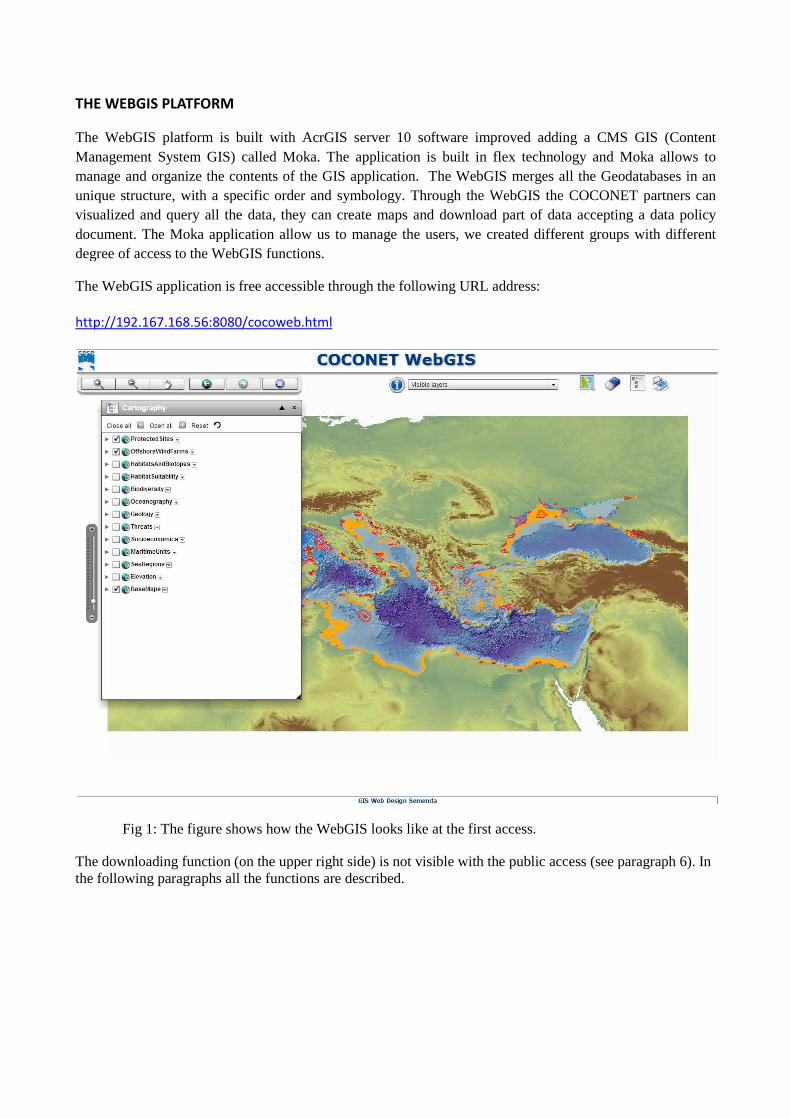
THE WEBGIS PLATFORM
The WebGIS platform is built with AcrGIS server 10 softwareManagement System GIS) called Mokamanage and organize the contents of the GIS application. unique structure, with a specific order and symbology. Through the WebGIS the COCONET partnervisualized and query all the data, they can create maps and download part of data adocument. The Moka application allow us to manage the degree of access to the WebGIS functions.
The WebGIS application is free accessible through the following URL
http://192.167.168.56:8080/cocoweb.html
Fig 1: The figure shows how the WebGIS looks like at the first access.
The downloading function (on the upper right sidethe following paragraphs all the functions are described.
built with AcrGIS server 10 software improved adding a CMS GIS (Moka. The application is built in flex technology and
manage and organize the contents of the GIS application. The WebGIS merges all the Geodatabaseunique structure, with a specific order and symbology. Through the WebGIS the COCONET partnervisualized and query all the data, they can create maps and download part of data a
application allow us to manage the users, we created different groups with different degree of access to the WebGIS functions.
accessible through the following URL address:
http://192.167.168.56:8080/cocoweb.html
shows how the WebGIS looks like at the first access.
on the upper right side) is not visible with the public access (see paragraph 6). In all the functions are described.
adding a CMS GIS (Content technology and Moka allows to
The WebGIS merges all the Geodatabases in an unique structure, with a specific order and symbology. Through the WebGIS the COCONET partners can visualized and query all the data, they can create maps and download part of data accepting a data policy
users, we created different groups with different
) is not visible with the public access (see paragraph 6). In
1. NAVIGATION PANEL AND
These two elements allows the user to move in the
1. The Table Of Content allows to manage the visualization of the layerhe user can choose what kind of data display. Here the user finds to three tools: a) Set transparency (it allows tb) Zoom to layer full extent c) Visible from scale 1: x (it allows to go to the scale of thvisible only from a scale or out of a settled scale)
2. Zoom in and zoom out bar (left click to see the current scale) 3. Zoom in and zoom out bottom4. Pan 5. Go back to previous extent and 6. Go to initial extent
Fig 2: The figure shows how to navigate
2. IDENTIFY
Clicking a feature on the map with this tool, the user can visualize the information about the the visible layers or choose a specific layer in the drop down menu.
1. Choose the layer to identify 2. Select the tool 3. Click the feature of interest 4. Click on the name to visualize the related information5. Click on the related table to visualize the inf
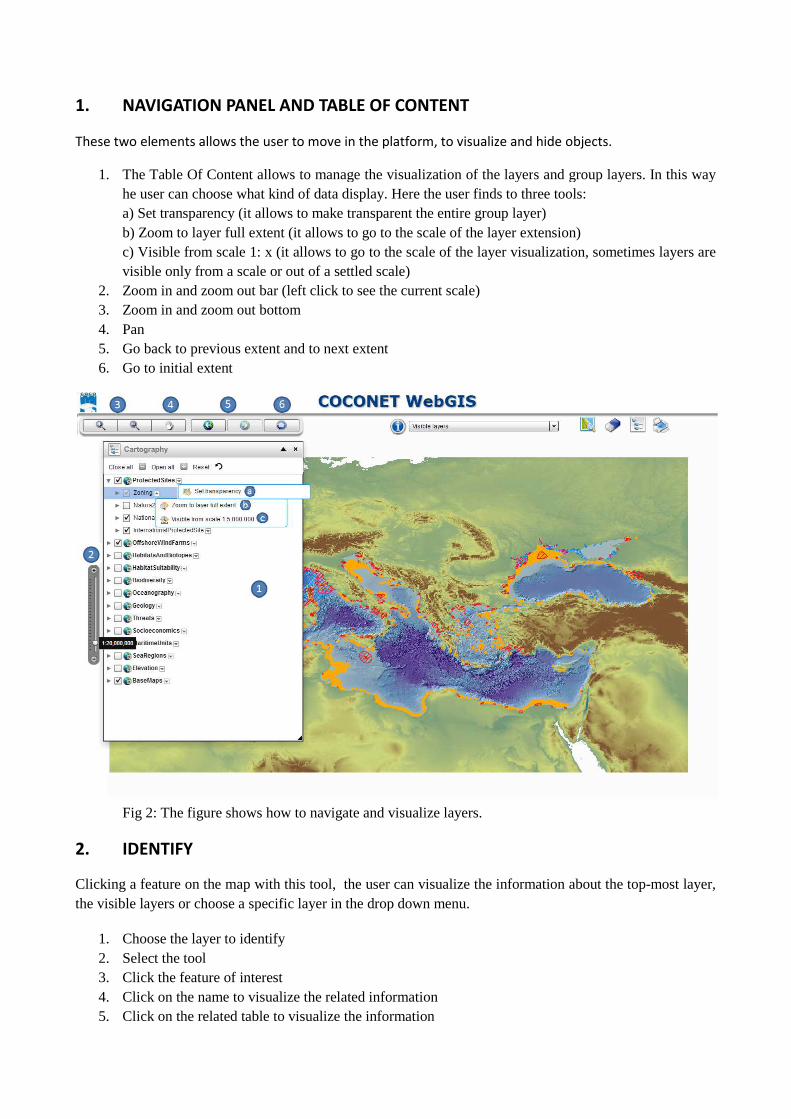
NAVIGATION PANEL AND TABLE OF CONTENT
These two elements allows the user to move in the platform, to visualize and hide objects.
The Table Of Content allows to manage the visualization of the layers and group layers. In this way hoose what kind of data display. Here the user finds to three tools:
a) Set transparency (it allows to make transparent the entire group layer) b) Zoom to layer full extent (it allows to go to the scale of the layer extension)c) Visible from scale 1: x (it allows to go to the scale of the layer visualization, some
scale or out of a settled scale) (left click to see the current scale)
Zoom in and zoom out bottom
previous extent and to next extent
shows how to navigate and visualize layers.
icking a feature on the map with this tool, the user can visualize the information about the choose a specific layer in the drop down menu.
name to visualize the related information
table to visualize the information
platform, to visualize and hide objects.
s and group layers. In this way hoose what kind of data display. Here the user finds to three tools:
o to the scale of the layer extension) e layer visualization, sometimes layers are
icking a feature on the map with this tool, the user can visualize the information about the top-most layer,
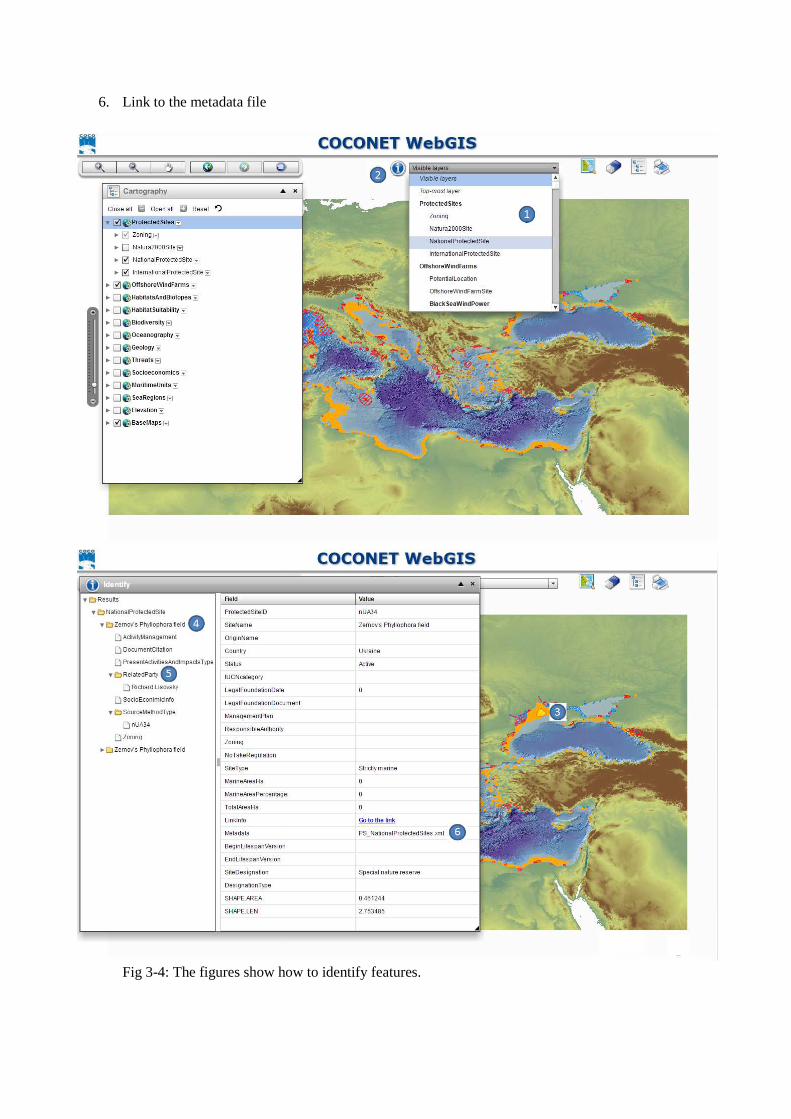
6. Link to the metadata file
Fig 3-4: The figures show how to identify features.how to identify features.
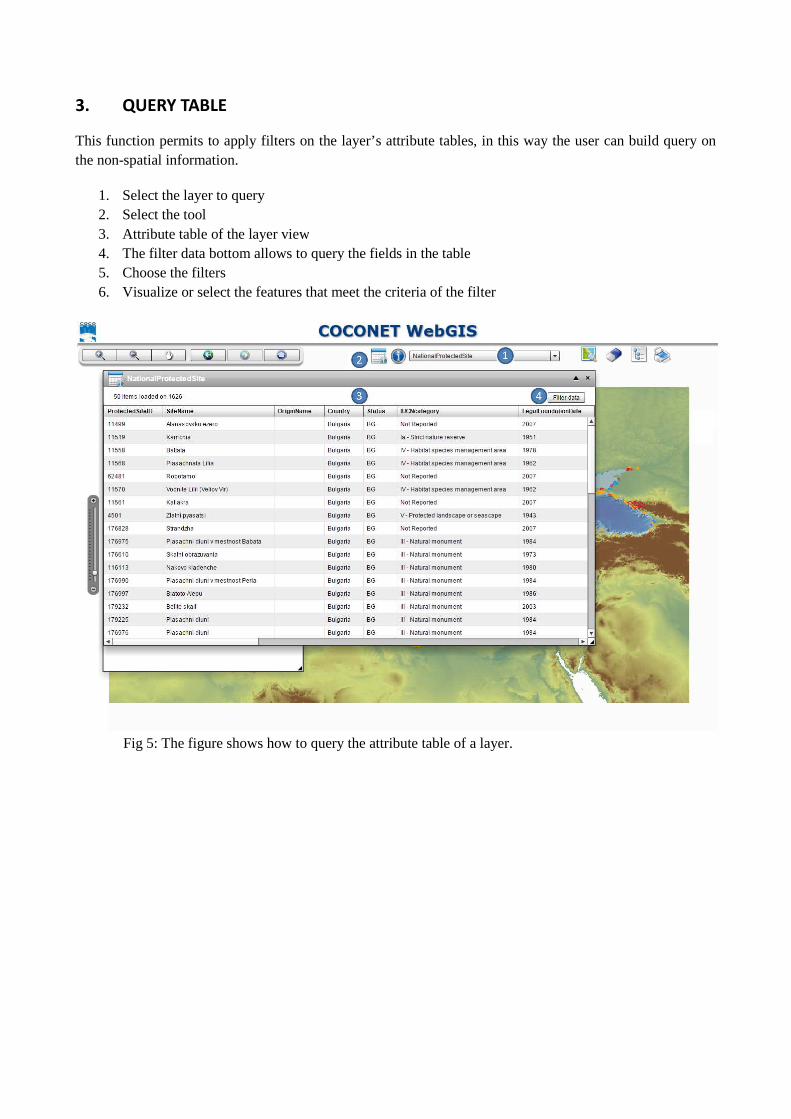
3. QUERY TABLE
This function permits to apply filters on the layer’s attribute tables, in this way the user can build query on the non-spatial information.
1. Select the layer to query 2. Select the tool 3. Attribute table of the layer view4. The filter data bottom allows to query the fields in the table 5. Choose the filters 6. Visualize or select the feature
Fig 5: The figure shows how to query the
filters on the layer’s attribute tables, in this way the user can build query on
Attribute table of the layer view The filter data bottom allows to query the fields in the table
Visualize or select the features that meet the criteria of the filter
shows how to query the attribute table of a layer.
filters on the layer’s attribute tables, in this way the user can build query on
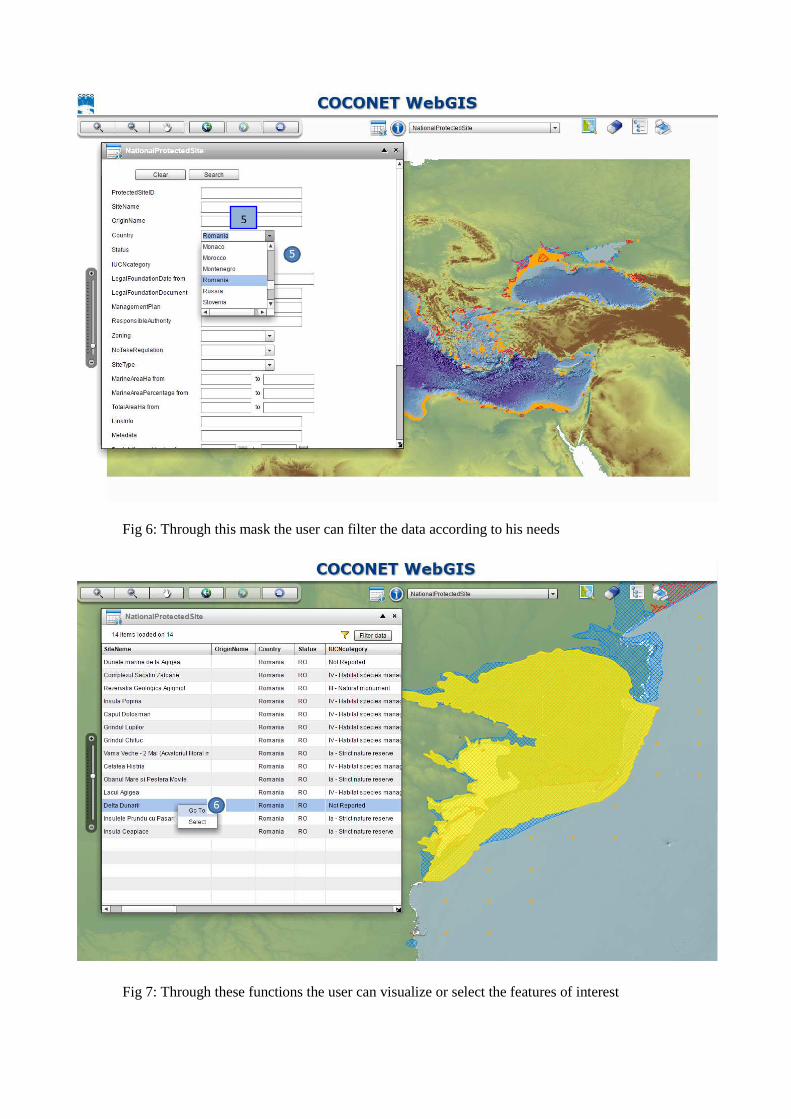
Fig 6: Through this mask the user can
Fig 7: Through these function
5
Through this mask the user can filter the data according to his needs
functions the user can visualize or select the features of interest
of interest
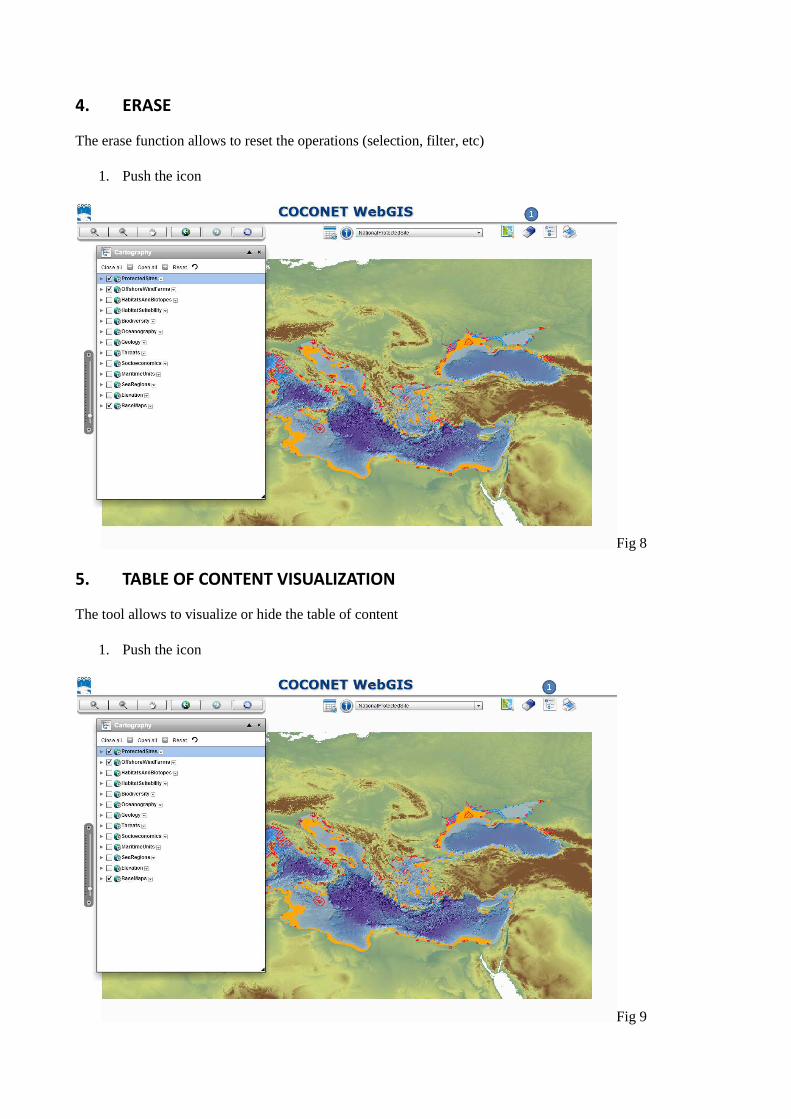
4. ERASE
The erase function allows to reset the operations (selection, filter,
1. Push the icon
5. TABLE OF CONTENT VIS
The tool allows to visualize or hide the table of content
1. Push the icon
The erase function allows to reset the operations (selection, filter, etc)
TABLE OF CONTENT VISUALIZATION
the table of content
Fig 8
Fig 9
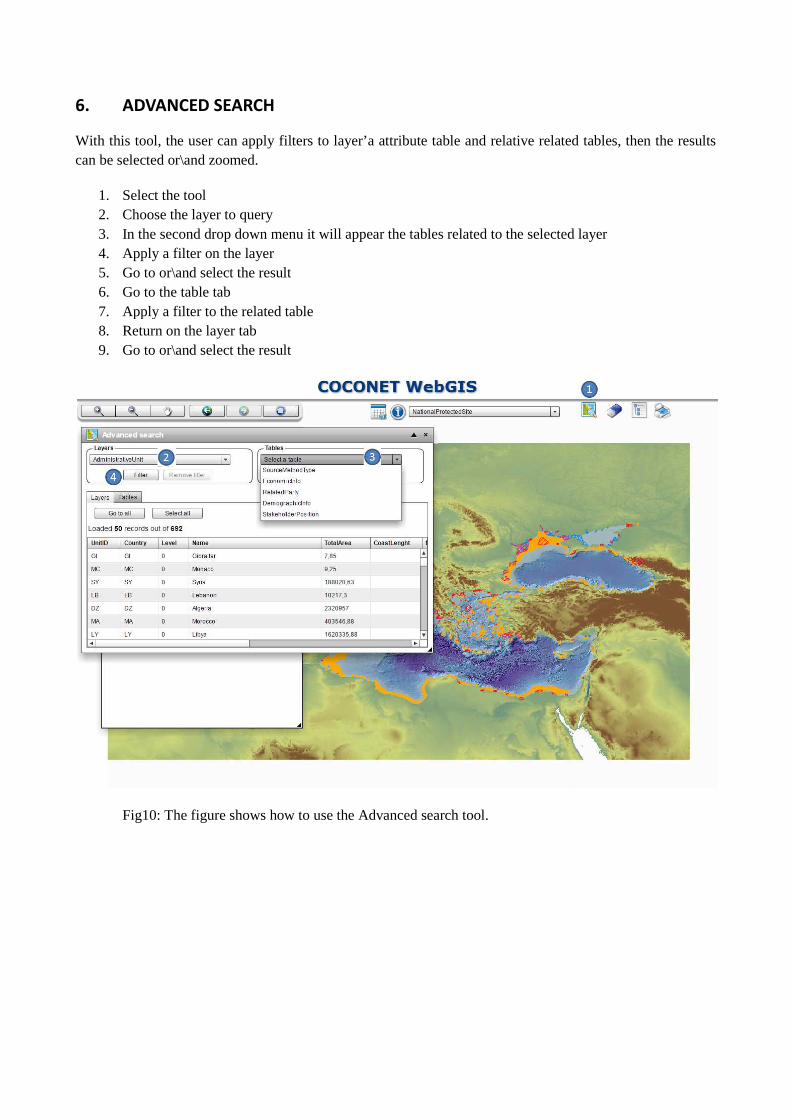
6. ADVANCED SEARCH
With this tool, the user can apply filters to layer’a attribute table and relative related tables, then the results can be selected or\and zoomed.
1. Select the tool 2. Choose the layer to query 3. In the second drop down menu it will appear the tables related to the selected layer4. Apply a filter on the layer 5. Go to or\and select the result6. Go to the table tab 7. Apply a filter to the related table8. Return on the layer tab 9. Go to or\and select the result
Fig10: The figure shows how to use the Advanced search tool.
With this tool, the user can apply filters to layer’a attribute table and relative related tables, then the results
second drop down menu it will appear the tables related to the selected layer
and select the result
Apply a filter to the related table
and select the result
The figure shows how to use the Advanced search tool.
With this tool, the user can apply filters to layer’a attribute table and relative related tables, then the results
second drop down menu it will appear the tables related to the selected layer
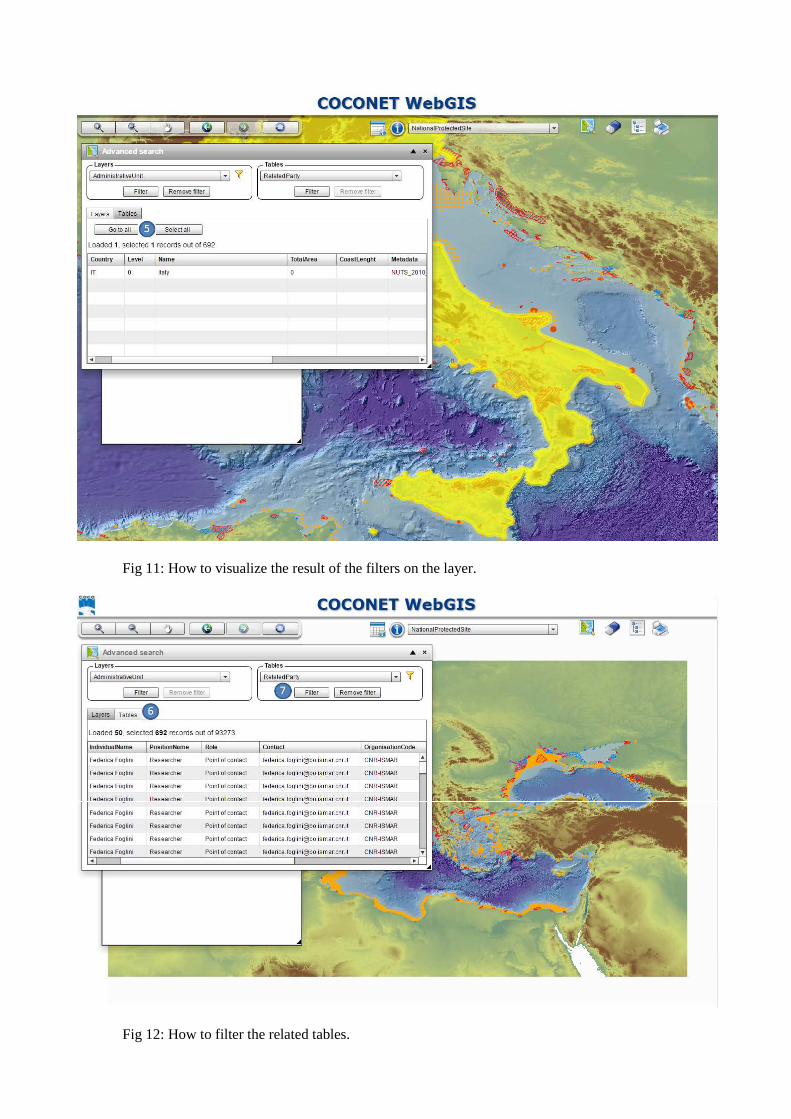
Fig 11: How to visualize the result of the filters on the layer.
Fig 12: How to filter the related tables.
How to visualize the result of the filters on the layer.
How to filter the related tables.
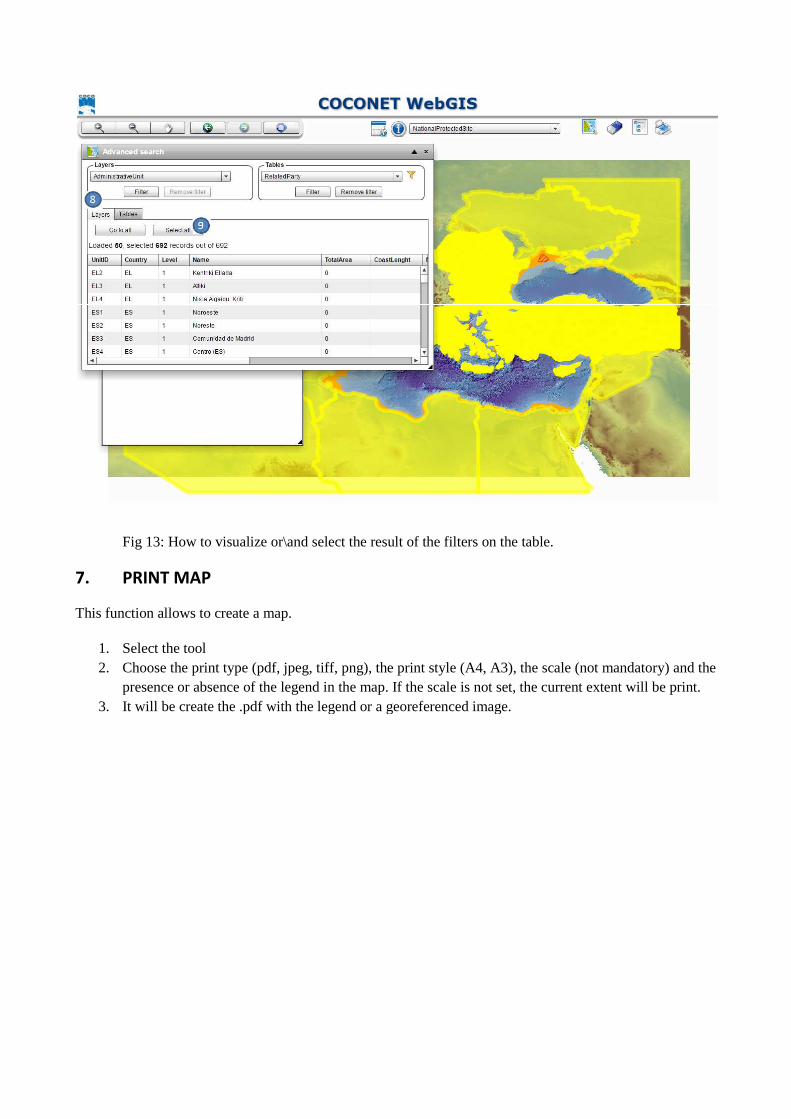
Fig 13: How to visualize or\
7. PRINT MAP
This function allows to create a map.
1. Select the tool 2. Choose the print type (pdf, jpeg, tiff, png), the print style (A4,
presence or absence of the legend in the map3. It will be create the .pdf with the legend or a georeferenced image.
\and select the result of the filters on the table.
This function allows to create a map.
the print type (pdf, jpeg, tiff, png), the print style (A4, A3), the scale (not mandatory) presence or absence of the legend in the map. If the scale is not set, the current extentIt will be create the .pdf with the legend or a georeferenced image.
A3), the scale (not mandatory) and the . If the scale is not set, the current extent will be print.
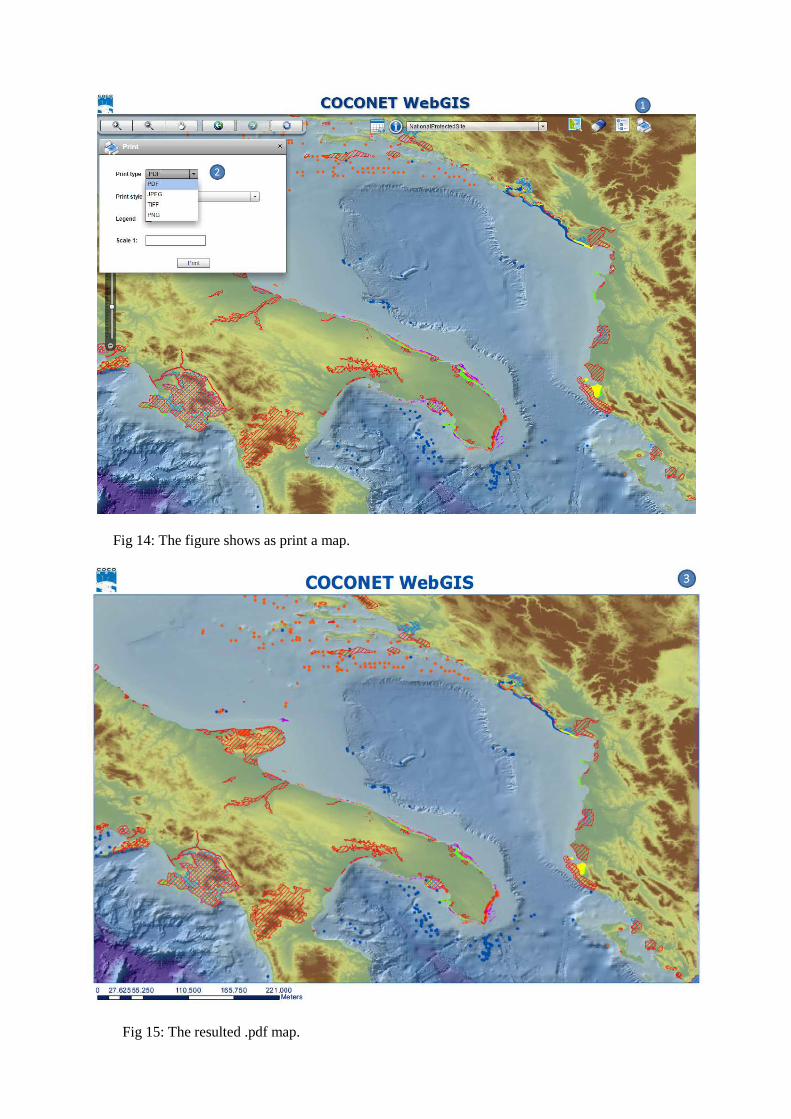
Fig 14: The figure shows as print a map.
Fig 15: The resulted .pdf map.
The figure shows as print a map.
The resulted .pdf map.
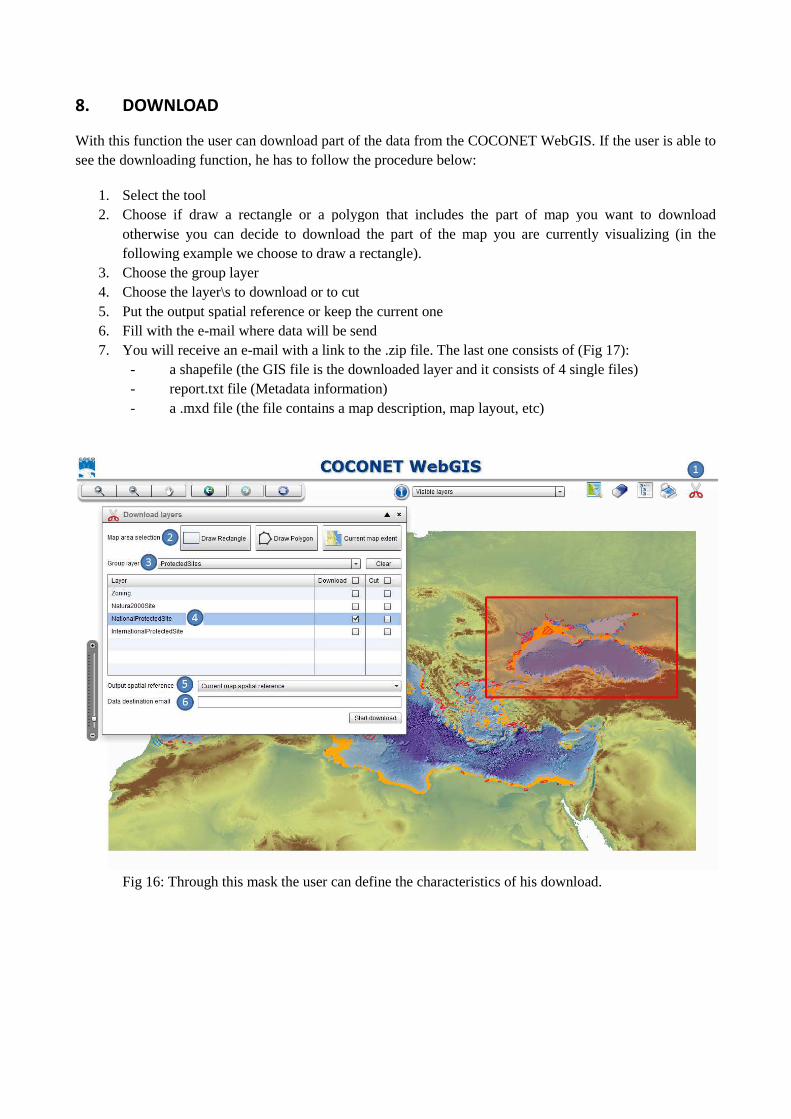
8. DOWNLOAD
With this function the user can download part of tsee the downloading function, he has to follow the procedure below:
1. Select the tool 2. Choose if draw a rectangle or a polygon that includes the part of map you want to download
otherwise you can decide to download the part of the map yofollowing example we choose to draw a rectangle).
3. Choose the group layer 4. Choose the layer\s to download or 5. Put the output spatial reference or keep the current one6. Fill with the e-mail where data will be send7. You will receive an e-mail with a link to the .zip file. The last one
- a shapefile (the GIS file - report.txt file (Metadata information)- a .mxd file (the file contain
Fig 16: Through this mask the user can define the characteristics of his download.
With this function the user can download part of the data from the COCONET WebGIS. see the downloading function, he has to follow the procedure below:
if draw a rectangle or a polygon that includes the part of map you want to download otherwise you can decide to download the part of the map you are currently visualizing (in the following example we choose to draw a rectangle).
to download or to cut he output spatial reference or keep the current one
mail where data will be send il with a link to the .zip file. The last one consists of
le (the GIS file is the downloaded layer and it consists of 4 single files)(Metadata information)
contains a map description, map layout, etc)
: Through this mask the user can define the characteristics of his download.
he data from the COCONET WebGIS. If the user is able to
if draw a rectangle or a polygon that includes the part of map you want to download are currently visualizing (in the
consists of (Fig 17): of 4 single files)
: Through this mask the user can define the characteristics of his download.
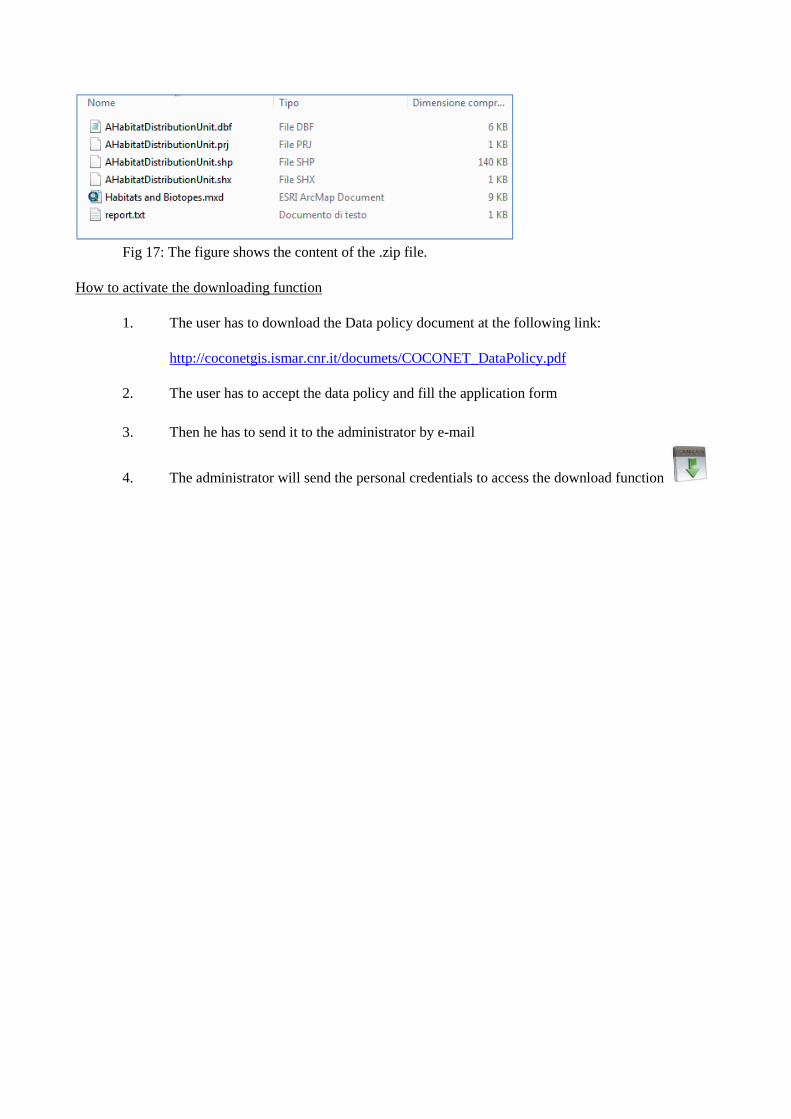
Fig 17: The figure shows the content of the .zip file.
How to activate the downloading function
1. The user has to download the Data policy document at the following link:
http://coconetgis.ismar.cnr.it/documets/COCONET_DataPolicy.pdf
2. The user has to accept the data policy and fill the application form 3. Then he has to send it to the administrator by e-mail
4. The administrator will send the personal credentials to access the download function