Embed Size (px)
Citation preview
Coastal Ocean Currents Monitoring Program (COCMP) in Southern California
Grant # 04-078
1st Quarterly Report 2006 Period of Performance: 1 January 2006 – 31 March 2006
Submitted to the State Coastal Conservancy by the Southern California Coastal Ocean Observing System (SCCOOS)
April 2006
COCMP Quarterly Report, April 2006
Southern California Coastal Ocean Observing System
2
INTRODUCTION The Southern California Coastal Ocean Observing System (SCCOOS) continues the implementation of the Coastal Ocean Currents Monitoring Program (COCMP) for Southern California. As described in this report, Principal Investigators (PIs) and project scientists have made progress in each of the task areas identified in the COCMP 2006 Annual Work Plan. COCMP is a significant component of SCCOOS’s efforts to build ocean observing and monitoring capacity for the region. This effort is being augmented with federal funding to serve user needs and contribute to the evolution of a comprehensive ocean observational system for both the region and State. SCCOOS continues to coordinate with the Central and Northern California Ocean Observing System (CeNCOOS) to ensure a unified statewide system. Program tasks include:
A. Surface Current Mapping (SCM) Array B. Nearshore and Surfzone Observations C. Subsurface Observations D. Regional Ocean Modeling E. Data Distribution and Management
PROGRESS REPORT BY TASK Task A. ESTABLISH SCM ARRAY FOR MAPPING OCEAN CURRENTS Task A.1 SCM Site Assessment CalPoly, UCSB, USC, and SIO continued efforts on HF radar site assessments and permissions throughout the first quarter of 2006. SCCOOS members held a Task A conference call on January 18th, 2006 in order to review year 2005 and prioritize year 2006 efforts. PI's agreed first quarter 2006 activities should focus on deployment of HF radars in support of the summer 2006 Huntington Beach experiment. Following site assessment, Santa Catalina Island, Point Fermin, and Newport Pier proved the most ideal locations for system deployment. HF radar installation at these three locations will provide the maximum amount of coverage for Huntington Beach. SIO began negotiations for a site just north of the Ocean Institute at Dana Point. This region is owned by the City of Dana Point, but currently under the jurisdiction of the Headlands for restoration and configuration of Harbor Point Park. Lisa Hazard conducted a site tour with Brad Fowler, Director of Public Works and Engineering Services and Erica Williams, City Planner to discuss feasibility. Unfortunately, the attorneys for the Headlands project rejected the idea of placing a Surface Current Mapping antenna at this location due to current policy. Headlands policy prohibits the deployment of any equipment in the area of Dana Point at Harbor Point Park. SIO is currently looking into alternative sites as well as negotiating sites at La Jolla Children’s Pool, Point Loma Wastewater Treatment Plant, Cardiff State Park, and Camp Pendleton. UCSB continued assessing possible new HF radar sites in Central and Southern California. On 8 March 2006, three potential sites on San Nicholas Island were surveyed, and one of these, referred to as “Balloon Launch” appears to be suitable. Also on 8 March, a
COCMP Quarterly Report, April 2006
Southern California Coastal Ocean Observing System
3
mainland site at Pt. Mugu was also assessed and it appears to be a good possibility. UCSB began discussions with Arguello PXP in April 2006 to access a site near Gaviota, California, in the western Santa Barbara Channel. A site assessment conducted in April indicated that it should be suitable. Discussions began in March with the planning personnel from the city of Malibu to locate a new site west of Pt. Dume. This will complement a site east of Pt. Dume to be operated by the USC HF radar group. UCSB personnel reestablished contact with the external project office Vandenberg Air Force Base to renew the agreement for the HF radar site near Pt. Sal. A proposal was submitted to operate a 4Mhz, long-range system on the base in the future. Task A.2 Site Permissions COCMP members continued to pursue site permissions with varying landowners throughout the quarter. USCG permissions, in particular, have undergone several iterations since the May 3, 2005 USCG meeting. The state now has a centralized point of contact for all USCG sites and two procedure paths to follow: 1.) environmental 2.) frequency. The environmental approval necessitates review from the Coastal Commission, US Fish & Wildlife, and the State Historic Preservation Office (SHPO). Each package submitted to the USCG for site approval should include all documentation necessary for contacting these agencies: 1.) Letter of request to USCG 2.) USCG NEPA Checklist (USCG form) - Coastal Commission and US Fish & Wildlife 3.) USCG Technical Specifications Sheet (USCG form) 4.) SHPO letter of no adverse affects Natalie Lindquist from the State Historic Preservation Office recommended the following procedure for obtaining concurrence from the agency for a letter of no adverse affect: 1.) Check the archives for location
a.) Determine point of contact from IC Roster (Information Centers) http://ohp.parks.ca.gov/default.asp?page_id=1068 b.) Inquire for each location: there is a whole list of identification of Historic properties, but essentially it's those listed on the National Register.
2.) Submit 106 a.) There are 3 determinations
1.) No Historic Properties Affected (nothing in the area will be affected) 2.) Determination of No Adverse Affect (there are historic/cultural concerns but they will not be adversely affected) 3.) Determinations of Adverse Affect (there is a potential for adverse affect and this will take further negotiations and research)
3.) Included in Standard 106 a.) Define area of potential effects (provide pictures and topo with area delineated):
1.) APE (Area of Potential Effect) Direct: area of potential ground disturbance and any property, or any portion thereof, that will be physically altered or destroyed by the undertaking.
COCMP Quarterly Report, April 2006
Southern California Coastal Ocean Observing System
4
2.) APE Visual: Geographic area in which the undertaking has the potential to introduce visual elements that diminish or alter the setting, including landscape, where the setting is a character-defining feature of a Historic Property that makes in eligible for listing on the National Register. For Tower less than 200' that distance is 1/2 mile. "In determining whether Historic Properties in the APE may be adversely affected, applicants should consider topography, vegetation, known presence of Historic Properties, and existing land use."
b.) Identify Historic Properties w/in APE c.) Assess the effects of the Undertaking on Historic Properties with a description of any historical property in the area taken from Information Center (IC) roster
Unfortunately, COCMP members are caught in a catch-22 situation regarding the frequency authorization. The USCG requires an intermodulation study performed between SeaSonde experimentally licensed frequencies and USCG operational frequencies. Although staff at Scripps (Tony de Paolo) is available to perform this study, the USCG will not release operational frequencies, and has not offered to perform the study internally. This situation is currently under review and discussion by both USCG and COCMP funded personnel. In the interim, we hope to move forward with "temporary authorizations" especially Point Fermin, one location necessary for the upcoming 2006 Huntington Beach experiment. UCSB has submitted a proposal to the US Navy to obtain permission to use establish a site on the Pt. Mugu Naval Base. A proposal was submitted to Reliant Energy to obtain permission for a new site at the Ormond Electrical Generating Station. An earlier assessment of the site indicated it should be suitable. Task A.3 Frequency Allocation The FCC granted SCCOOS a 5-year experimental license for the following frequencies and locations: 4.30MHz, 4.40MHz, 5.2MHz, 13.5MHz, 25.9MHz, 26.3MHz
- Point Estero - Point Buchon - Point Sal - Point Arguello - Point Mugu - Ventura - San Pedro Point - Point Dume - Point Vicente - Point Fermin - Huntington Beach - Newport Beach - Dana Point - Santa Catalina East - San Clemente Island - Oceanside - Cardiff
Two additional frequency allocations were obtained from the FCC for medium range HF radar sites in the Santa Barbara Channel.
COCMP Quarterly Report, April 2006
Southern California Coastal Ocean Observing System
5
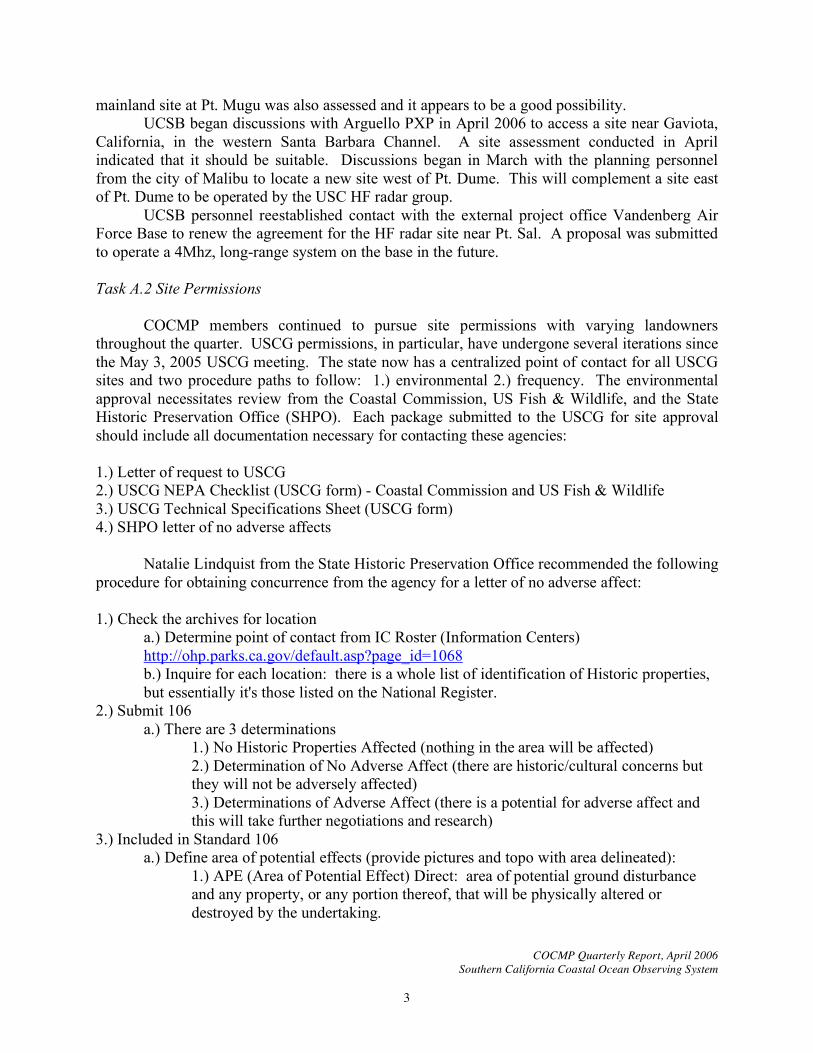
Task A.4 Site Preparation and Equipment Order SCCOOS HF radar technicians continuously research and test new and reliable equipment as part of the Surface Current Mapping Antennas installation. Enclosure
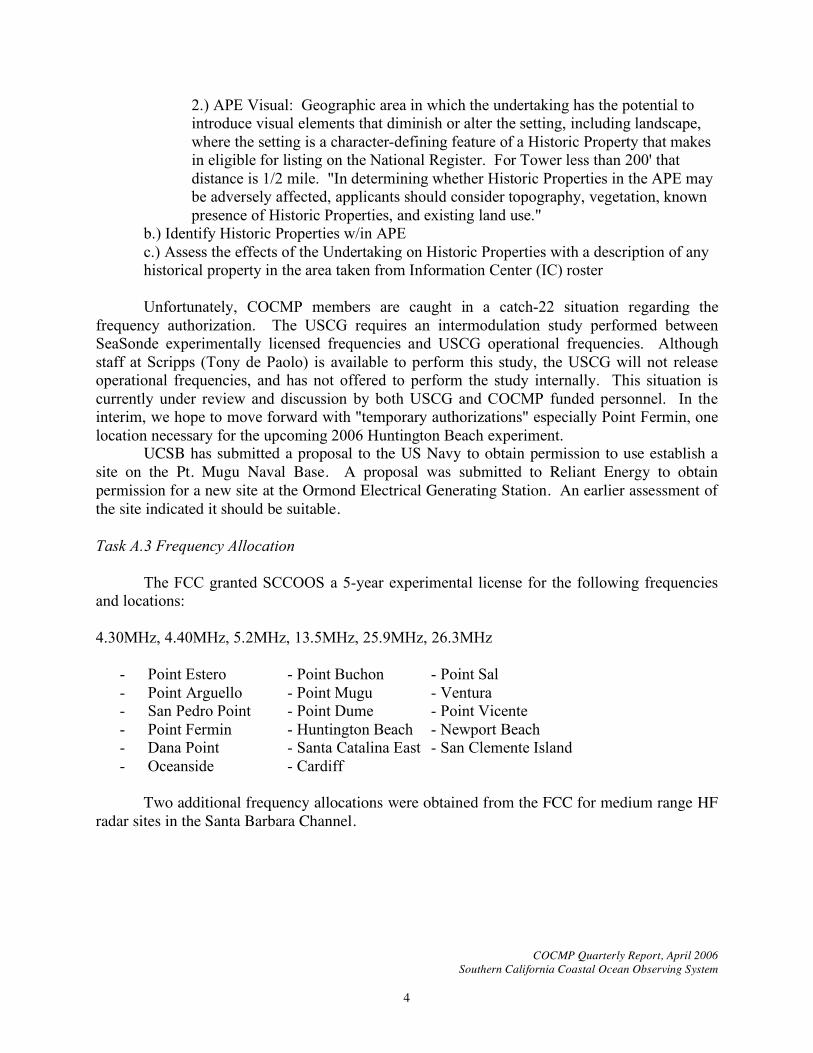
specifications must have a compact design, withstand varying weather conditions, and fit standard 19” rack equipment. One solution from EIC solutions is the stainless steel enclosure shown here. Technical staff has found that the original air conditioner rated at 800BTU was unable to provide the operational temperatures required for sustained SeaSonde electronics operation, and replaced the cooling unit with the larger 1500BTU model. The enclosure will be installed at Santa Catalina following lab testing. Communications out to the sites are an essential part of the real-time capability. Often times, the best locations for these systems are in remote areas, which lack any communications infrastructure. From past experience, engineers have had success with wireless communications for remote, long-haul legs. As previous solutions became obsolete or discontinued,
technicians are replacing the hardware with new technology. Trango Broadband 5.8 GHz LINK-10 technology offers secure and reliable communications between sites. Because hardware allows only master/slave communications, much tighter network security is provided as hackers must have the exact same hardware, configured with the exact same channel and password, and somehow remove the original slave or master device. These systems allow for only one-to-one communications. SCCOOS technicians intend to deploy the new equipment at Santa Catalina East in early April. The UCSB group is coordinating with Lisa Hazard of the SIO/UCSD group to modify the SeaSonde equipment order to allow the upgrade of six older UCSB CODAR units. The upgrades will provide GPS timing, USB connectivity, and allow the most up-to-date Apple operating system to be run when operating the equipment. UCSB took delivery of a new fiberglass enclosure for installation at the Ormond Electrical Generating Station. Having the enclosure on hand will allow rapid occupation of the site once permission is obtained. UCSB hired an engineer to fill the second HF radar technician position (50% time through 31 December 2006) funded by COCMP. The UCSB technical personnel now include one full time technician (Mr. Brian Emery), two half-time technicians (Mr. Kirk Ireson and Mr. Cyril Johnson) and one undergraduate electrical and computer engineering student (Mr. Joshua Kleiner). The electrical circuit and related equipment at Mandalay Electrical Generating Station
COCMP Quarterly Report, April 2006
Southern California Coastal Ocean Observing System
6
were replaced. Reliant Energy donated the parts and labor at no cost, representing an important financial leverage to the COCMP program. Task A.5 Standard Operating Practices COCMP HF radar operators from SIO and UCSB attended the second annual Radiowave Operators Working Group (ROWG) Workshop in Charleston, South Carolina on March 21st – 24th. This workshop is a collaborative effort between HF radar operators from all over the country. The goal is to share and exchange valuable information on both hardware and software operations. Members are able to download and post information on an SIO maintained interactive plone site exclusive for operational users. The meeting agenda can be accessed here: http://www.homepage.mac.com/paduan/row/ROWG2MeetingAgenda.doc PI’s from SIO/UCSD, USC, UCSB, and Cal Poly San Luis Obispo continued to hold conference calls as needed to coordinate planning activities. UCSB PI Washburn attended the SCCOOS Board of Governors meeting at UCLA on 13 February to discuss activities of the Southern California Coastal Ocean Observing System. Part of this discussion focused on various COCMP components including HF radar activities. Washburn also attended the California Ocean Protection Council Meeting in Santa Barbara, CA on 13 January to learn more about the Council’s activities and the Pacific Ocean Observing System Workshop on 19 February to learn about possible synergies with COCMP activities. TASK B. ESTABLISH NEARSHORE AND SURFZONE OBSERVATIONS (HB06) Task B.1 Wave and Current Observations A demonstration project (HB06) to calibrate and test SCOOS model predictions of shallow water waves and surfzone currents is planned for Huntington Beach during summer-fall 2006. The surfzone component supported under this task will take place approximately 15 September -15 October 2006. A wave directional buoy in 22m-depth off Huntington Beach, deployed in June 2005, is being used to validate the nearshore wave prediction model and will provide incident wave observations in support of surfzone current measurements during HB06. The buoy data is available in real time. (http://cdip.ucsd.edu). The costs to install and maintain this buoy are partially supported by the Army Corp of Engineers and are a significant leveraging asset for COCMP. Planning and preparation for HB06 is well underway. We are on schedule with the nearshore current measuring system including cables, surfzone drifters, current and pressure sensors, and frames for mounting instruments in the surfzone. USGS and the Orange County Sanitation District plan to deploy moorings that will expand the observations beyond those supported by SCCOOS. Additionally, some of the SCCOOS PIs have obtained ONR, Sea Grant and other funds to build out HB06. HB06 now extends much further offshore than originally planned and contains several new components (e.g. sampling biota and FIBS, dye releases, and studies of nearshore mixing.). The HB06 PIs vested stakeholders are meeting again in early May 2006. A website designed specifically to display nearshore information for Huntington Beach is
COCMP Quarterly Report, April 2006
Southern California Coastal Ocean Observing System
7
under construction. This site will include our modeled waves and surfzone currents, and historical bathymetric surveys in shallow water. During HB06, observed and modeled surfzone currents will be compared. Huntington Beach is heavily used for recreation. State Parks has estimated that approximately $59,000 will be needed for the additional lifeguard services required to maintain public safety. The fixed frames deployed in the surfzone are hazardous to swimmers/surfers, as are the jet skis used for surveying and dye-tracking. These funds were not included in our existing budgets. Resolution is needed as soon as possible to secure funding for these additional lifeguard services. Task B.2 Transition Zone Observations – AUV, Drifter and Mooring Deployment Drifters (UCSB) have been purchased from Pacific Gyre Corporation (Oceanside, CA) and prepared for this summer’s Huntington Beach monitoring program. During the Huntington Beach transition zone monitoring period, drifter tracks will be updated on the web hourly. A first draft of the web page that will host the drifter data has been completed and is available at: http://www.icess.ucsb.edu/drifter/HB/index.php. The page has a summary of the program, links to other COCMP related web sites, and a map on which the drifter tracks will appear. Drifter tracks from test deployments off the San Diego coast, which demonstrate the sort of data that will be collected off Huntington Beach can be viewed at: http://www.icess.ucsb.edu/drifter/common/plots.php?LOC=SDSS&DY=20060322. Planning and preparations for the two shallow-water moorings for the Huntington Beach experiment July-October 2006 is under way. Locations and sampling have been narrowed down to occupying 2 different lags/distances alongshore from the central cross-shore mooring line already in place by OCSD and USGS. High emphasis will be placed on the real-time delivery of the data, and the focus will be on ocean currents from ADCPs on the moorings, plus temperature records at several depths in the water column. It is likely that the original experiment plan will be enhanced with additional observations on the moorings for salinity, bottom pressure, and better depth sampling with temperature, even though these data would not be telemetered in real-time. The necessary equipment is being purchased and work is proceeding according to plan. Numerous meetings with other transition group investigators, and additional players, have taken place in effort to develop a coordinated and comprehensive near-shore monitoring program for Huntington Beach giving information desired by a variety of local agencies and municipalities. Task B.3 Modeling wave evolution & currents to nowcast surfzone currents Near real-time predictions (updated every 3 hours) of breaking wave height and surfzone-averaged alongshore currents for a 50km reach of the Southern California coastline are now available: http://cdip.ucsd.edu/models/cocmp/nearshore/waves+currents Predictions of wave conditions with high alongshore, spatial resolution (100m) are obtained using a "network" wave model that concurrently uses wave measurements from multiple buoys in the surrounding CDIP and NOAA wave observation networks. This wave model output is then used to drive a simple 1-D model for surfzone alongshore currents. The
COCMP Quarterly Report, April 2006
Southern California Coastal Ocean Observing System
8
accuracy of the wave and current models is degraded by poorly known and/or complicated nearshore bathymetry. Project scientists are currently expanding these model predictions northward to include Orange and LA Counties. Development continues on the web interface to allow users to access wave and current predictions at specific sites along the coast. Information available in real time will include wave frequency spectra and the four lowest order directional moments at each frequency, as well as the total (frequency integrated) radiation stress component Sxy, significant wave height, peak wave frequency, mean direction at the peak frequency, and the modeled currents. A beta version of this interface will be used as part of the COCMP Huntington Beach Nearshore Experiment in the fall of 2006. Task B.4 Northern and Central Nearshore Data The new network wave model has been implemented for the coastline of the Central California coastlines of Monterey, Santa Cruz and San Mateo Counties. The network model uses concurrent data from the CDIP Harvest, NOAA Monterey Bay, and CDIP Pt Reyes directional wave buoys. We are validating the model with recently collected nearshore measurements from Ocean Beach, San Francisco, in coordination with USGS. Development continues on the selection of alongshore wave model output locations for the Central California wave predictions, and their integration into the CDIP web interface.
C. ESTABLISH SUBSURFACE OBSERVATIONS Task C.1 Underway CTD UCSB, USC, and SIO continued working together to establish a time series section of vertical conductivity, temperature, and pressure (CTD) observations across the San Pedro Channel. Initial testing of the underway CTD, referred to as uCTD, occurred September through November 2005 and routine observations began in 23 January 2006. The UCSB group is pleased to acknowledge the important contributions of Mr. Troy Gunderson of USC and Mr. Jochen Klinke of UCSD/SIO to bring the uCTD into routine operation. The uCTD is deployed about every two weeks from the R/V Sea Watch during its routine transits to the Wrigley Marine Institute on Catalina Island. The use of the R/V Sea Watch as a research platform for uCTD operations at no cost represents very important financial leverage for COCMP. Typically a total of about 14 profiles are obtained on the outbound and inbound transits. Once several profiles were obtained, a series of software tests were conducted to improve algorithms for computation of salinity and density profiles. These tests were completed this quarter and procedures for routine data processing have been developed. To date, uCTD data have been collected on 5 dates. Processed data along with plots of transects and various property sections are available at: http://www.icess.ucsb.edu/iog/uCTD/index.php UCSB is working with SIO/UCSD to place all uCTD data on the SCCOOS data server. The transfer of funds from UCSB to cover costs of personnel time and other expenses at USC and SIO/UCSD is currently being worked out.
COCMP Quarterly Report, April 2006
Southern California Coastal Ocean Observing System
9
Task C.2 Bight-Scale Monitoring The Instrument Development Group (IDG) at UCSD has experienced delays in production of Spray gliders. Three COCMP gliders remain in the production queue with the first promised August 2006 in time for deployment offshore of the Huntington Beach 2006 exercise. As production continues, we borrowed units from other projects to begin regular surveys in 2005, earlier than proposed. Because the SCCOOS data-assimilating model was not yet ready to ingest glider data, and the HF radar array was not yet ready for comparisons, we focused on repeated sampling of a line through the Santa Barbara Channel and then west-southwest offshore approximately 300 km along CalCOFI Line 80. A goal is to establish a baseline of physical and biological data from which the pattern of climate variability can be detected. The first mission, from 13 October through 22 November of 2005, was a single trip out through the Channel and out Line 80 that was reversed back to Santa Barbara. Spray sampled physics, phytoplankton through chlorophyll fluorescence, and zooplankton with an acoustic Doppler profiler. Clear distinction of the biological signals accompanying sharp contrasts in water properties, particularly salinity, was noted. The general response to decreased nutrient supply, as water moved away from the upwelling zone, was formation of a subsurface chlorophyll maximum. The second mission, begun 25 February 2006 and schedule for recovery late in May, is underway and expected to complete four transects of Line 80. Both legs of the first mission disclosed an anticyclonic eddy centered near 33045’N, 1220W and the same feature was found on the first two legs of this mission. This feature appears to be potentially significant for retention of plankton and small fish in the generally southward flow of the California Current. It is also most unexpected as such eddies are generally believed to propagate with time scales of a few weeks. Santa Barbara and Line 80 sampling will continue this year. A second glider will be put in service to monitor offshore variability near Huntington Beach during the upcoming field campaign there. All SIO Spray-glider data, including that from the COCMP missions, can be viewed at, and downloaded from, http://www.spray.ucsd.edu. D. ESTABLISH REGIONAL OCEAN MODELING Task D.1 Model Research and Development UCLA successfully designed, ordered, and installed a Linux cluster from Aspen Systems. The cluster is now housed in UCLA's Academic Technology Services (ATS) Room 4328 of the Math Sciences Data Center. The UCLA COCMP researchers are now using the cluster. Dr. Matthew Munnich is the project researcher who coordinated the installation of the cluster. Bill Labate, manager at ATS, is responsible for finishing the installation of power, cooling, network, security, and backup services from ATS. Next steps for the UCLA group include: • Extend the fine-resolution model to the year 2006 forced by both wind forcing and tides.
Focus the analysis on eddies and the alongshore pressure gradient to guide the planning and interpretation of the Huntington Beach experiment in Fall 2006.
• By incorporating the wave-current interaction in the model, update the ROMS and sediment
COCMP Quarterly Report, April 2006
Southern California Coastal Ocean Observing System
10
component. • Make a special study of the diurnal variation of the surface stratification and currents due to
combined tidal, inertial, solar, and sea-breeze influences. • Work with JPL and SIO to implement CODAR data assimilation in ROMS.
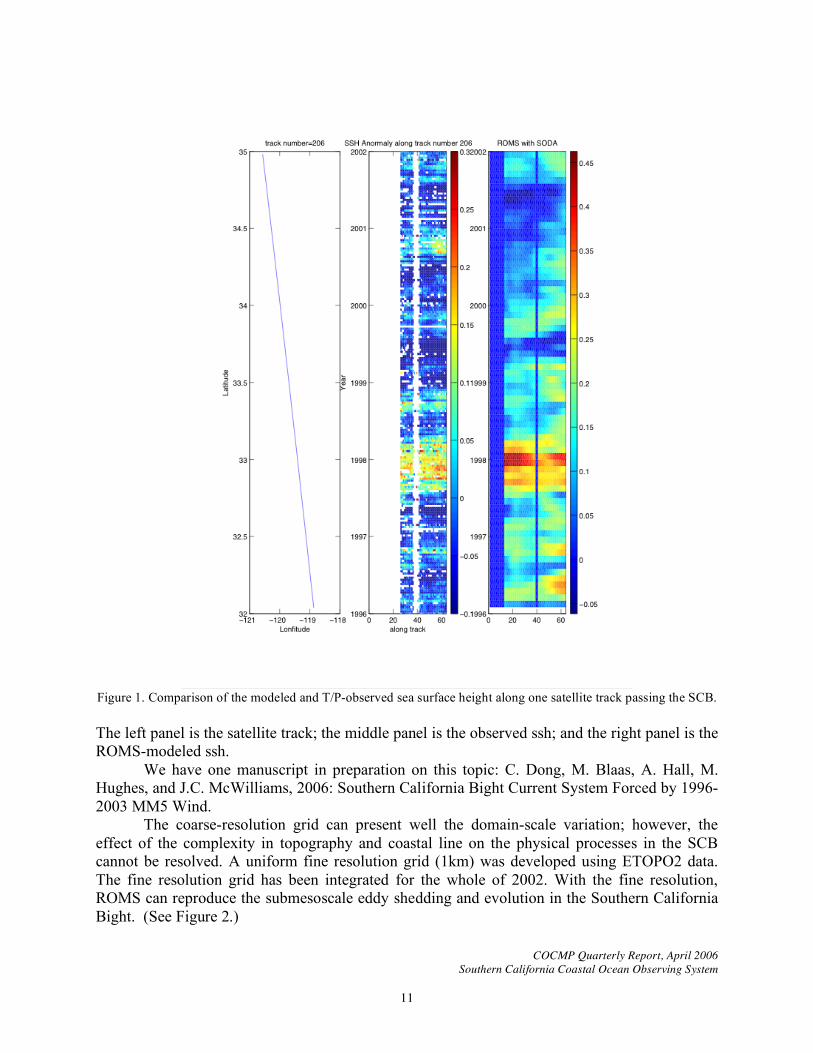
The UCLA group is now designing modifications to the Regional Oceanic Modeling System (ROMS) to include the effects of surface gravity waves on currents (n.b., their effects on sediment resuspension are already in ROMS). The basis for this design is an empirical wave analysis product from the CDIP group at U.C. San Diego, a new theory of wave-current interaction, and a parameterization of nearshore wavebreaking. ROMS's largest domain spans the West Coast. Up to three levels of subdomains, with progressively finer grid resolution, are used to focus in on the Bight. Boundary conditions for the largest domain are set either by climatological data for the North Pacific Ocean or by ROMS solutions for the whole Pacific forced by global atmospheric wind analyses. In this configuration a retrospective simulation from 1995-2003 has been made for the Bight to determine the mean monthly regional currents and their spontaneous mesoscale eddy variability and to compare these with measurements to evaluate the quality of the model. During the years 2001-2002, simulations have been made for several strong events of wind, river run-off, and surface waves focusing on the episodic sediment resuspension, transport, and deposition within Santa Monica Bay and on the flushing of materials (e.g., pollutants) from Santa Monica and San Pedro Bays, most effectively by passing eddies. These assessments are in support for use of ROMS in assimilating real-time measurements for circulation analyses to be produced by JPL. The Regional Ocean Modeling System (ROMS) is employed to study the oceanic current system in the Southern Californian Bight (SCB). Its largest domain spans the U.S. West Coast, and up to three levels of subdomains with progressively finer grid resolution used to focus in on the SCB. To better understand the equilibrium state and seasonal and interannual variability in the SCB current system, we have applied both climatological (COADS and Levitus) and eight-year (1996-2003) real-time boundary flux including both surface and lateral boundaries (MM5 as surface flux and SODA as the lateral flux). In two-layer one-way nesting grids, the outer grid (20km) covers the whole U.S. West Coast, and the inner grid (6.7 km) is focused on the SCB. We found that the interannual variability is significantly influenced by the remote forcing, e.g., signals from the equatorial region. Figure 1 shows the comparison of the modeled and T/P-observed sea surface height along one satellite track passing the SCB, in which the large anomaly in ssh in the 97-98 El-Nino year is well presented.
COCMP Quarterly Report, April 2006
Southern California Coastal Ocean Observing System
11
Figure 1. Comparison of the modeled and T/P-observed sea surface height along one satellite track passing the SCB. The left panel is the satellite track; the middle panel is the observed ssh; and the right panel is the ROMS-modeled ssh. We have one manuscript in preparation on this topic: C. Dong, M. Blaas, A. Hall, M. Hughes, and J.C. McWilliams, 2006: Southern California Bight Current System Forced by 1996-2003 MM5 Wind. The coarse-resolution grid can present well the domain-scale variation; however, the effect of the complexity in topography and coastal line on the physical processes in the SCB cannot be resolved. A uniform fine resolution grid (1km) was developed using ETOPO2 data. The fine resolution grid has been integrated for the whole of 2002. With the fine resolution, ROMS can reproduce the submesoscale eddy shedding and evolution in the Southern California Bight. (See Figure 2.)

COCMP Quarterly Report, April 2006
Southern California Coastal Ocean Observing System
12
Figure 2. The Santa Catalina Island wake: normalized surface vorticity maps during March 14-18, 2002. March 14 = day 0
The figure is adapted from Dong and McWilliams, 2006: A Numerical Study of Island Wakes in the Southern California Bight, Continental Shelf Research, in press. A second manuscript, Island Wakes in Deep Water was recently submitted to the Journal of Physical Oceanography. Surface flux is produced by MM5 reanalysis model. Tidal forcings are included in the model forcing. Both Oregon global and ADCIRC regional data are applied to the model. Eleven tidal constituents are considered: M2, K1, O1, S2, N2, P1, K2, Q1, M4, M6, Z0. Wave forcing for the whole Southern California Bight (SCB) is under way. We plan to use SWAN (Simulating Waves Nearshore) to generate the wave data for the SCB simulation. The project team experienced one setback when the installation of the Linux cluster took slightly longer than anticipated because the Math Data Center is a new UCLA facility, and there was a delay waiting for the wiring to be installed. Task D.2 Wind Product for use by ROMS Preliminary evaluations were carried out by UCLA using the Weather Research and Forecast (WRF) regional atmospheric model from the National Center for Atmospheric Research as a likely successor to the present model (MM5) we use to produce surface wind analyses for
COCMP Quarterly Report, April 2006
Southern California Coastal Ocean Observing System
13
Southern California. The UCLA researchers are investigating how to improve atmospheric simulations of marine stratocumulus clouds, which are quite challenging to simulate even in high resolution models. Doing so will lead to more realistic solar fluxes at the air-sea interface, resulting in more realistic surface boundary layer behaviors (e.g., for sea surface temperature and biological activity) in ocean simulations. UCLA technical accomplishments during the reporting period were: The group simulated atmospheric winds at various resolutions to determine whether wind resolution is a cause of ocean model failure to reproduce realistic coastal ocean circulation variability. They ran the MM5 model covering the southern third of California and adjacent ocean zones at four resolutions (54, 18, 6, and 2 km) for March 2002. The model was forced at its boundaries by reanalysis data, and so can be thought of as a reconstruction of March 2002 winds consistent with MM5 physics, their best guess of large-scale weather, and resolved topography. The team then imposed the four sets of simulated winds on a nested ROMS model whose highest resolution (1 km) domain covers the Southern California Bight. The date of March 2002 was chosen because of an observed unusual upwelling event during the month that we have been unable to simulate when currently available COAMPS wind products are imposed on the ocean model. They found that the ocean model fails to simulate the upwelling event when the 54 and 18 km simulated winds are imposed on it. However, when 6 km winds are imposed, the event emerges, being approximately half the magnitude of the observed when measured in terms of the SST drop generated by the upwelling at a mooring location in the Santa Barbara channel. When 2 km winds are imposed the simulated SST drop increases, so that the event becomes even more realistic. Apparently the coastal and island topography introduces significant structure into wind fields on spatial scales on the order of 6 km or less which is crucial for ocean response. These results will guide refinements in future wind products. One manuscript has resulted in this research area: C. Dong, A. Hall, M. Hughes, and J. McWilliams, 2006: Impact of wind resolution on simulation of a major coastal upwelling event, submitted to Geophysical Research Letters. The 4km MM5 forecast product has been operational since the beginning of January 2006. The vertical resolution proved important for correct boundary layer simulation, hence, the number of vertical levels is set at 38 for these forecasts (with ~16 levels within the boundary layer). A website to make these daily forecasts available for download is currently under construction. The WRF forecast product is currently in the testing phase, with forecast automation projected for May 2006. Task D.3.1 Covariance and Objective Mapping using COCMP observations Data covariances have been worked up using the original algorithms and beam patterns. It is being re-done for the CODAR using the new mapping formalism we have implemented which goes directly from radials to vector currents. This eliminates most of the spurious values that plagued the older efforts, especially along baselines between CODAR installations. The CODAR data have been processed with the measured antenna patterns, which also increases the quality of the data. Maps and movies have been improved as the estimates are optimized, and a model of particle trajectories from the Tijuana River has been implemented using the observed velocities.
COCMP Quarterly Report, April 2006
Southern California Coastal Ocean Observing System
14
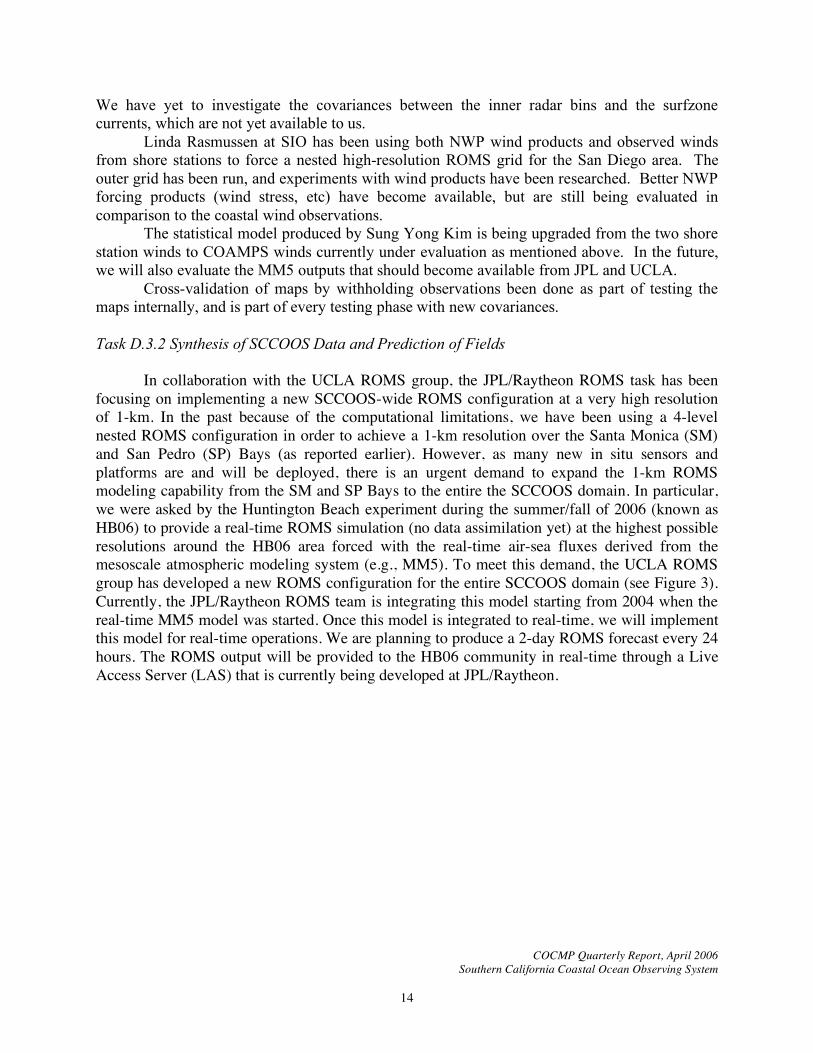
We have yet to investigate the covariances between the inner radar bins and the surfzone currents, which are not yet available to us. Linda Rasmussen at SIO has been using both NWP wind products and observed winds from shore stations to force a nested high-resolution ROMS grid for the San Diego area. The outer grid has been run, and experiments with wind products have been researched. Better NWP forcing products (wind stress, etc) have become available, but are still being evaluated in comparison to the coastal wind observations. The statistical model produced by Sung Yong Kim is being upgraded from the two shore station winds to COAMPS winds currently under evaluation as mentioned above. In the future, we will also evaluate the MM5 outputs that should become available from JPL and UCLA. Cross-validation of maps by withholding observations been done as part of testing the maps internally, and is part of every testing phase with new covariances. Task D.3.2 Synthesis of SCCOOS Data and Prediction of Fields In collaboration with the UCLA ROMS group, the JPL/Raytheon ROMS task has been focusing on implementing a new SCCOOS-wide ROMS configuration at a very high resolution of 1-km. In the past because of the computational limitations, we have been using a 4-level nested ROMS configuration in order to achieve a 1-km resolution over the Santa Monica (SM) and San Pedro (SP) Bays (as reported earlier). However, as many new in situ sensors and platforms are and will be deployed, there is an urgent demand to expand the 1-km ROMS modeling capability from the SM and SP Bays to the entire the SCCOOS domain. In particular, we were asked by the Huntington Beach experiment during the summer/fall of 2006 (known as HB06) to provide a real-time ROMS simulation (no data assimilation yet) at the highest possible resolutions around the HB06 area forced with the real-time air-sea fluxes derived from the mesoscale atmospheric modeling system (e.g., MM5). To meet this demand, the UCLA ROMS group has developed a new ROMS configuration for the entire SCCOOS domain (see Figure 3). Currently, the JPL/Raytheon ROMS team is integrating this model starting from 2004 when the real-time MM5 model was started. Once this model is integrated to real-time, we will implement this model for real-time operations. We are planning to produce a 2-day ROMS forecast every 24 hours. The ROMS output will be provided to the HB06 community in real-time through a Live Access Server (LAS) that is currently being developed at JPL/Raytheon.
COCMP Quarterly Report, April 2006
Southern California Coastal Ocean Observing System
15
Figure 3. Snapshot of sea surface temperature simulated by the new SCCOOS ROMS at 1-km resolutions.
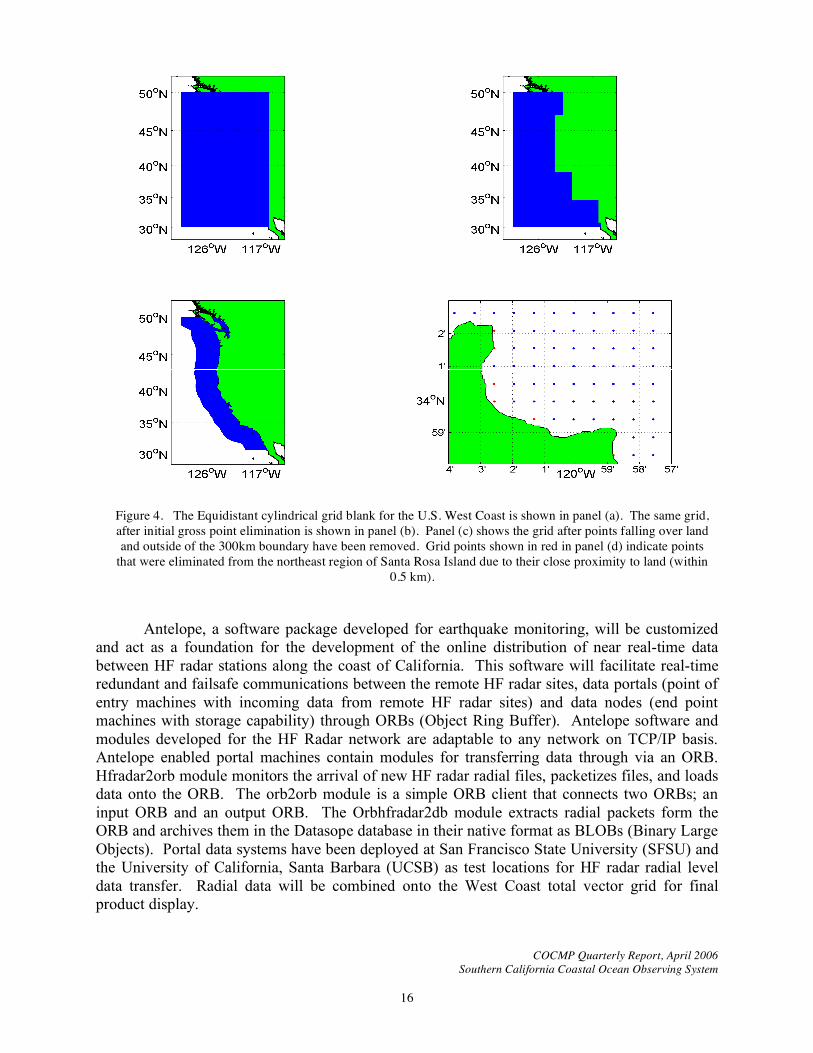
E. DATA DISTRIBUTION AND MANAGEMENT Task E.1 Information Technology Development SCCOOS data managers continue to update and improve the data system under development for integrating various sensor and data types, managing the data flow from remote stations, and providing near real-time access to data products. First quarter 2006 efforts focused on development of HF radar data transfer, storage, and display. Mark Otero from SIO developed a high-resolution 1 km spacing statewide data grid, which will enable participants to display HF radar surface current maps along a seamless coastline.
COCMP Quarterly Report, April 2006
Southern California Coastal Ocean Observing System
16
Figure 4. The Equidistant cylindrical grid blank for the U.S. West Coast is shown in panel (a). The same grid, after initial gross point elimination is shown in panel (b). Panel (c) shows the grid after points falling over land and outside of the 300km boundary have been removed. Grid points shown in red in panel (d) indicate points
that were eliminated from the northeast region of Santa Rosa Island due to their close proximity to land (within 0.5 km).
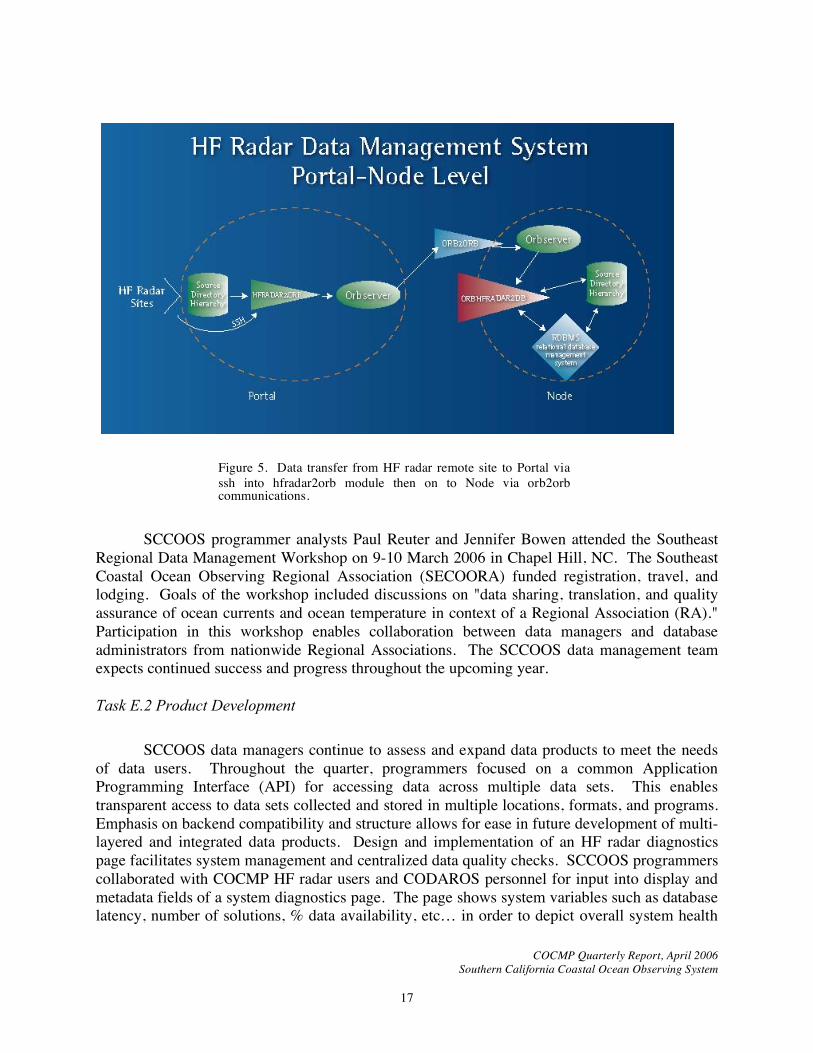
Antelope, a software package developed for earthquake monitoring, will be customized and act as a foundation for the development of the online distribution of near real-time data between HF radar stations along the coast of California. This software will facilitate real-time redundant and failsafe communications between the remote HF radar sites, data portals (point of entry machines with incoming data from remote HF radar sites) and data nodes (end point machines with storage capability) through ORBs (Object Ring Buffer). Antelope software and modules developed for the HF Radar network are adaptable to any network on TCP/IP basis. Antelope enabled portal machines contain modules for transferring data through via an ORB. Hfradar2orb module monitors the arrival of new HF radar radial files, packetizes files, and loads data onto the ORB. The orb2orb module is a simple ORB client that connects two ORBs; an input ORB and an output ORB. The Orbhfradar2db module extracts radial packets form the ORB and archives them in the Datasope database in their native format as BLOBs (Binary Large Objects). Portal data systems have been deployed at San Francisco State University (SFSU) and the University of California, Santa Barbara (UCSB) as test locations for HF radar radial level data transfer. Radial data will be combined onto the West Coast total vector grid for final product display.
COCMP Quarterly Report, April 2006
Southern California Coastal Ocean Observing System
17
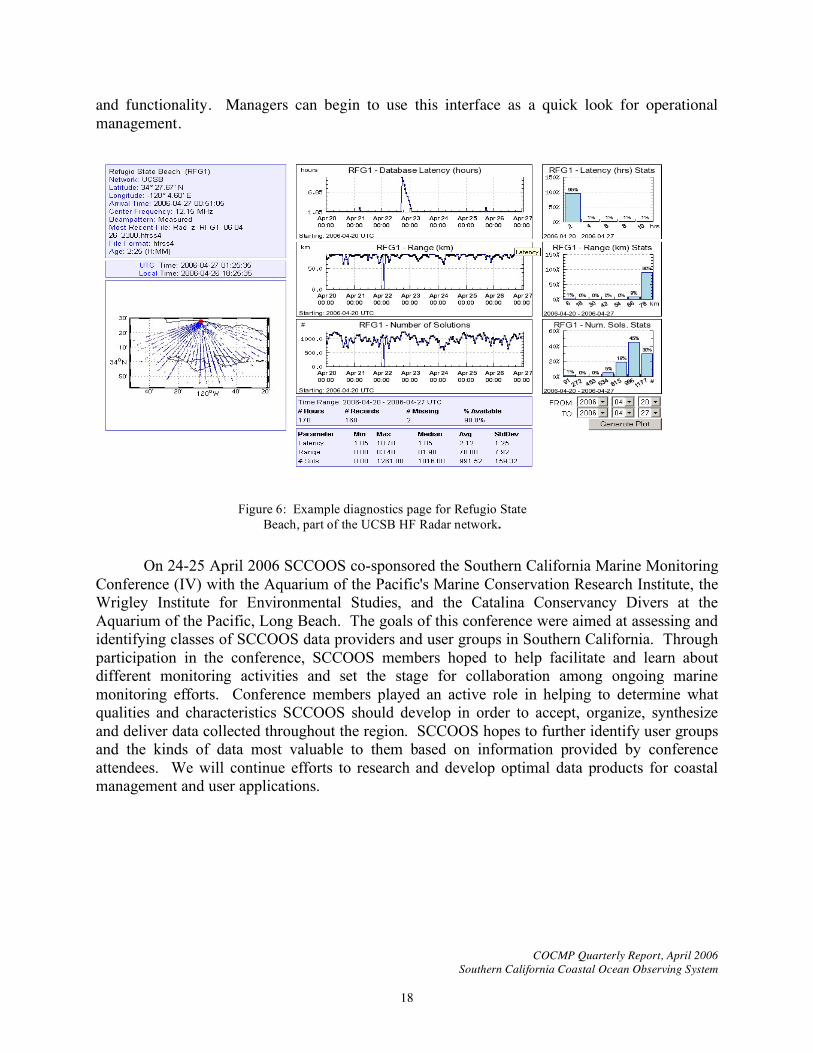
SCCOOS programmer analysts Paul Reuter and Jennifer Bowen attended the Southeast Regional Data Management Workshop on 9-10 March 2006 in Chapel Hill, NC. The Southeast Coastal Ocean Observing Regional Association (SECOORA) funded registration, travel, and lodging. Goals of the workshop included discussions on "data sharing, translation, and quality assurance of ocean currents and ocean temperature in context of a Regional Association (RA)." Participation in this workshop enables collaboration between data managers and database administrators from nationwide Regional Associations. The SCCOOS data management team expects continued success and progress throughout the upcoming year. Task E.2 Product Development SCCOOS data managers continue to assess and expand data products to meet the needs of data users. Throughout the quarter, programmers focused on a common Application Programming Interface (API) for accessing data across multiple data sets. This enables transparent access to data sets collected and stored in multiple locations, formats, and programs. Emphasis on backend compatibility and structure allows for ease in future development of multi-layered and integrated data products. Design and implementation of an HF radar diagnostics page facilitates system management and centralized data quality checks. SCCOOS programmers collaborated with COCMP HF radar users and CODAROS personnel for input into display and metadata fields of a system diagnostics page. The page shows system variables such as database latency, number of solutions, % data availability, etc… in order to depict overall system health
Figure 5. Data transfer from HF radar remote site to Portal via ssh into hfradar2orb module then on to Node via orb2orb communications.
COCMP Quarterly Report, April 2006
Southern California Coastal Ocean Observing System
18
Figure 6: Example diagnostics page for Refugio State Beach, part of the UCSB HF Radar network.
and functionality. Managers can begin to use this interface as a quick look for operational management.
On 24-25 April 2006 SCCOOS co-sponsored the Southern California Marine Monitoring Conference (IV) with the Aquarium of the Pacific's Marine Conservation Research Institute, the Wrigley Institute for Environmental Studies, and the Catalina Conservancy Divers at the Aquarium of the Pacific, Long Beach. The goals of this conference were aimed at assessing and identifying classes of SCCOOS data providers and user groups in Southern California. Through participation in the conference, SCCOOS members hoped to help facilitate and learn about different monitoring activities and set the stage for collaboration among ongoing marine monitoring efforts. Conference members played an active role in helping to determine what qualities and characteristics SCCOOS should develop in order to accept, organize, synthesize and deliver data collected throughout the region. SCCOOS hopes to further identify user groups and the kinds of data most valuable to them based on information provided by conference attendees. We will continue efforts to research and develop optimal data products for coastal management and user applications.
![COASTAL TRAPPED DIURNAL TIDAL WAVES OBSERVED ALONG … · Simulated currents (from Nakamura et al. [2000]) Observations of diurnal continental shelf waves and coastal trapped waves](https://img.pdfslide.us/doc/110x75/60e3028012bd9820fb6f12bc/coastal-trapped-diurnal-tidal-waves-observed-along-simulated-currents-from-nakamura.jpg)


![COASTAL TRAPPED DIURNAL TIDAL WAVES … · Simulated currents (from Nakamura et al. [2000]) Observations of diurnal continental shelf waves and coastal trapped waves Bottom currents](https://img.pdfslide.us/doc/110x75/5baa17da09d3f221798bba35/coastal-trapped-diurnal-tidal-waves-simulated-currents-from-nakamura-et-al.jpg)