Embed Size (px)
Citation preview

Coal Seam Gas Development and CO2 Sequestration in Low Rank Coals: Progress in New Zealand
Tim A. MooreSolid Energy NZ Ltd. &Department of Geological Sciences, University of Canterbury
With:Greg Twombly, RDTSadiq Zarrouk, University of AucklandTennille Mares, University of Canterbury
And also:Carol Butland, University of CanterburyAndy Nicol, GNS ScienceGrant Gillard, Solid EnergyCarlos Galceran, Solid Energy

Structure of talk
•Background of CSG in New Zealand – to give context
•Our approach – to show how we got to where we are going
•Results – both practical and scientific
•The Future – CO2 sequestration

CSG Exploration in New Zealand
as of Nov. 05
•Some early evaluations by Ministry in 1980s
•Southgas/Northgas experiences in the 1990s
•Westgas developments early 2000s
•Exploration of low rank coals early 2000s
•Kenham/L&M Group
•RDT
•Solid Energy
•Bridge/Westech

Waikato Prospect
•Nov. 2002: RDT awarded PEP
•Nov. 2004: CBM Ltd. JV formed Nov. 2004
•June – Oct 05: Exploration phase in Huntly Coalfield
THREE STAGE APPROACH
1. Initial basin assessment
2. Basin wide exploration
3. Appraisal wells
Expected outcomes of each stage
Initial Assessment:
Exploration:
Appraisal:
Indicative gas in-place
Gas volume, quality &water quality
Flow rates (gas & water), completion technologies, permeabilities
Field Development

Stage 1: Initial Basin Analysis
1,048Total0Raynors
29Kupakupa1Weavers
56Ralphs17Huntly East
265Okowhao376Huntly West143Rangiriri West101Horohoro
60Churchill
Coal (Mt)Sector
Reported coal volumes Reported gas quality
Gas Measure Result
CH4 % 91.00
CO2 % 5.30
C2H4 ppm -
C2H6 ppm 449.00
C3H6 ppm -
C3H8 ppm -
He ppm -
O2 %
N2 %H2 ppm 36554
Reported gas volumeHUNTLY TW1 CH4 ISOTHERM
0
1
2
3
4
5
6
7
8
9
10
0.0 0.5 1.0 1.5 2.0 2.5 3.0 3.5 4.0 4.5 5.0 5.5 6.0 6.5 7.0 7.5 8.0
Pressure (MPa)
Gas
Con
tent
(cc/
g) As AnalysedCurve aaDry Ash FreeCurve dafDepth AADepth DAF

Stage 2:Exploration Drill Holes
Location selection based on:
•Geology (seam thickness, depth)
•Previous reported gas shows
•Geographic spread
•Access

Stage 2: Data Collection
Reservoir delineation (rock volume)
Reservoir character (gas volume & flow)
More detail in –

Stage 2: Detailed Correlations of Reservoirs

Stage 2:Structural Re-interpretation
•Structural model for:
•Renown coal seam
•Kupakupa coal seam
•Basement
•Probability assessment of faults:
•Missing ~50% of faults <10m
•Fault spacing 600 – 800 m

Stage 2: Detailed isopach & structural models
•Refinement of reservoir vol. model
•Depth related to gas volume model

Stage 2: Data Collection
Reservoir delineation (rock volume)
Reservoir character (gas volume & flow)
More detail in –

Stage 2: Reservoir Character Data Types

Stage 2: Holding Capacity (Adsorption)
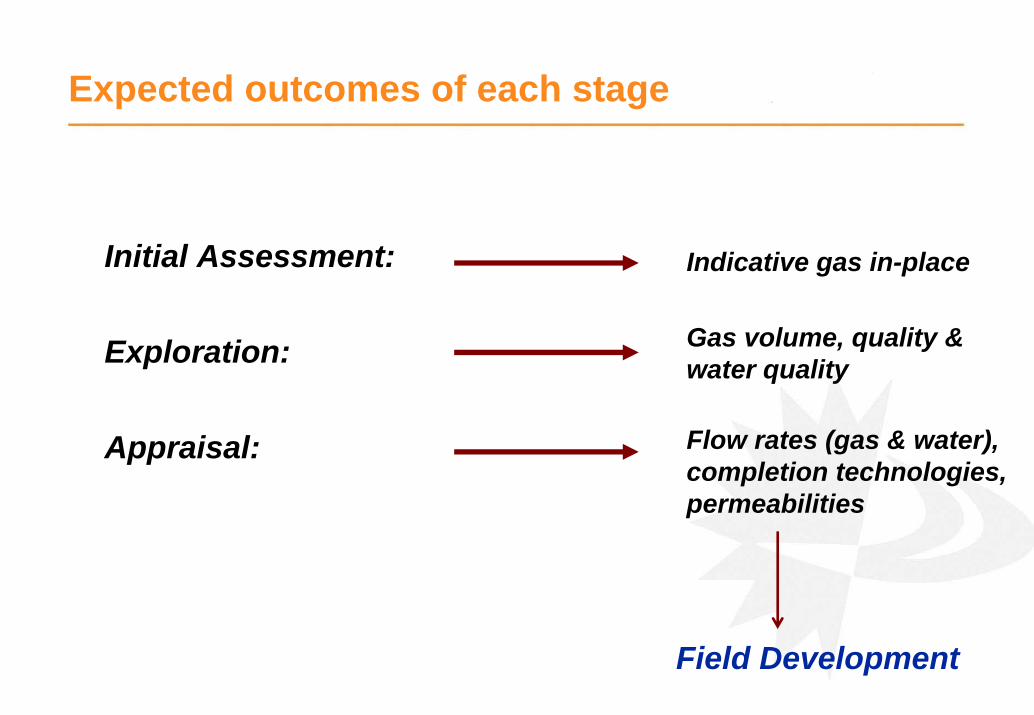
Stage 2: Measured Gas Content (Desorption)
n = over 100 canisters
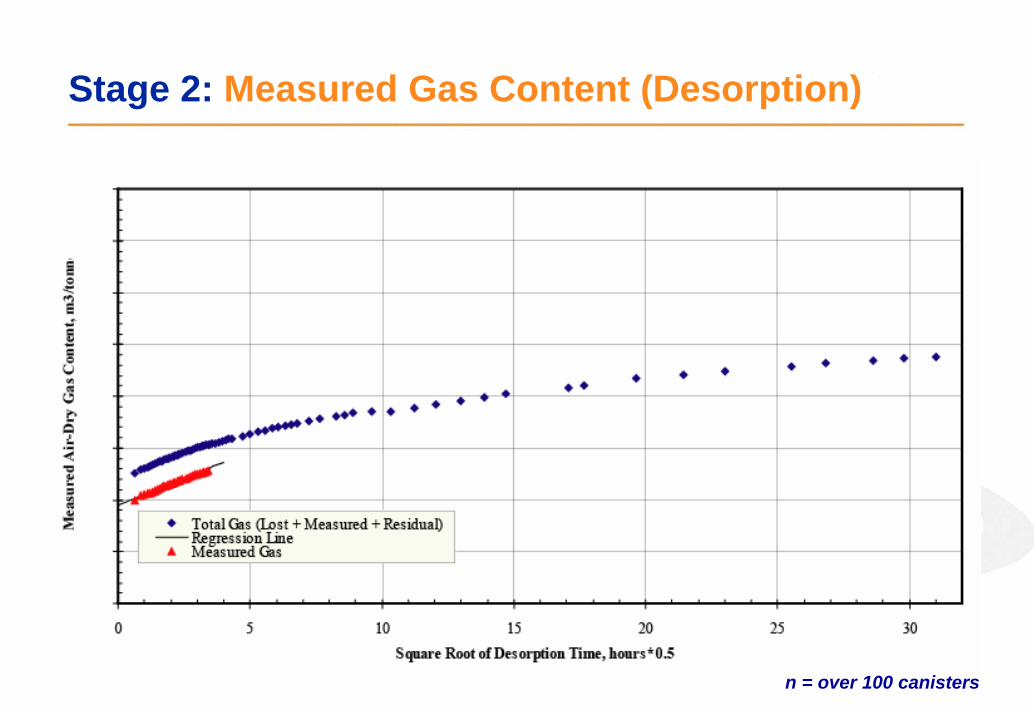
Stage 2: Gas Quality
Gas basis Mean Stand. Dev.
CH4 % 98.43 1.77
CO2 % 1.52 1.77
C2H4 ppm 0.00 0.00
C2H6 ppm 338.72 280.38
H2 ppm 154.90 403.96
O2 % 0.00 0.00
N2 % 0.00 0.00
n = 41

Stage 2: Origin of Gas – Isotopic Analysis

Stage 2 Output: Gas in-place uncertainty
Petajoules
++

Stage 2: Outcome – Next Stage?
•Gas in-place good (25 – 200 PJ)•Gas quality great (98% methane)•Gas flows good, 2-5 PJ/yr•Water quality good
Stage 2: Exploration results
Stage 3: Appraisal Well Drilling•Five closely spaced wells (~450m)•Test permeability (reservoir character)•Determine completion methodology•Establish gas flow profiles
•Assess character of pore and fracture systems etc.

Appraisal Wells
Tim A. MooreCSG Project
Manager
Tim BishellAccounting
Chris FordLegal Services
Pete SimpsonFinancial Modelling
Andy MathesonMarketing/
Commercial
Andrew MelvilleProcurement
Officer
Anne BeexCommunication
Alan MerrillCSG Operations
Supervisor
Grant GillardCSG Geologist
Reuben MillsEnvironmental
Manager
Sadiq ZarroukReservoir Engineer
Jaco FourieSite Manager
Administration
Appraisal Well Operations
Boart LongyearDrilling Contractor
Site Preparation Surface Facilities
CRL EnergyDesorption Services
CRL EnergyCoal & Gas
Quality Analysis
Tennille MaresMudlogging, Desorption,
Sample Collection, Data Input
John LavisDesorption
StudentMudlogger Assistant
KMLConsents
Formerly KMLWater Quality
Tennille MaresGeological
Reservoir Data
TBAEngineering
Reservoir Data
Cath MooreHydrogeological
data
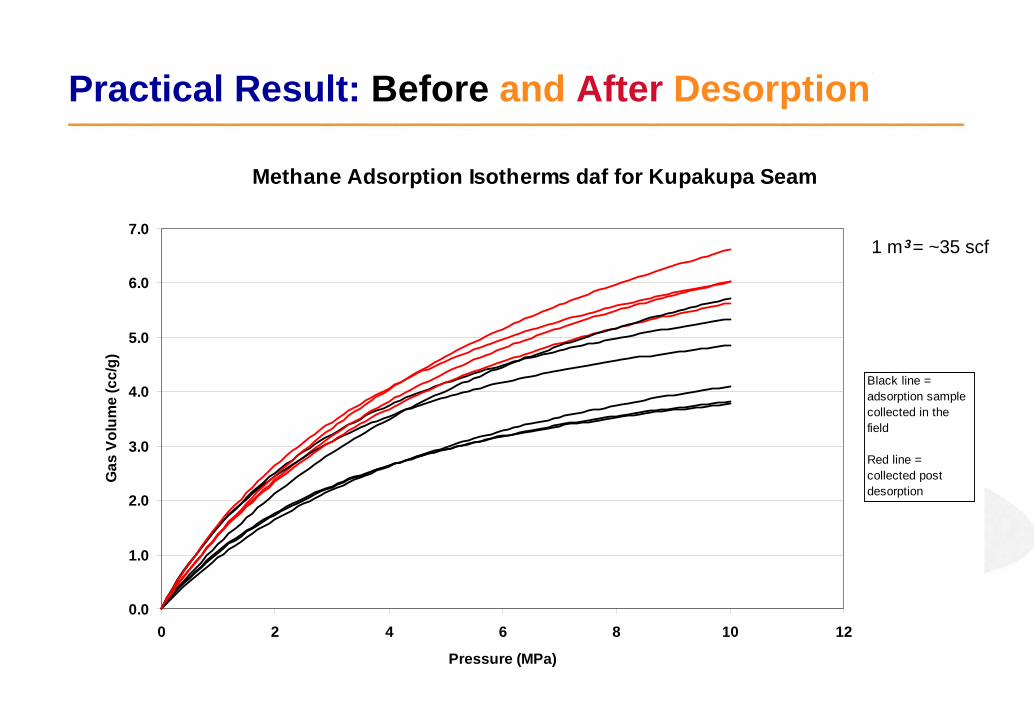
Practical Result: Before and After Desorption
Methane Adsorption Isotherms daf for Kupakupa Seam
0.0
1.0
2.0
3.0
4.0
5.0
6.0
7.0
0 2 4 6 8 10 12
Pressure (MPa)
Gas
Vol
ume
(cc/
g)
Black line = adsorption sample collected in the field
Red line = collected post desorption
1 m = ~35 scf3

CO2 Sequestration: Objectives
• Investigate the potential for CO2 and N2 gases storage in depleted Coal Seam Gas (CSG) reservoirs.
• Enhance methane recovery from CSG wells.

Reservoir sensitivity analysis for Huntly
• 80 Acres well spacing• 4 injection wells at the corners and 1 production well in the middle• Constant permeability• Production from Renown and Kupakupa.• Maximum pump capacity (400 bbl/day)• Flue gases are injected in the gas phase• Variable CO2 and N2 injection rates
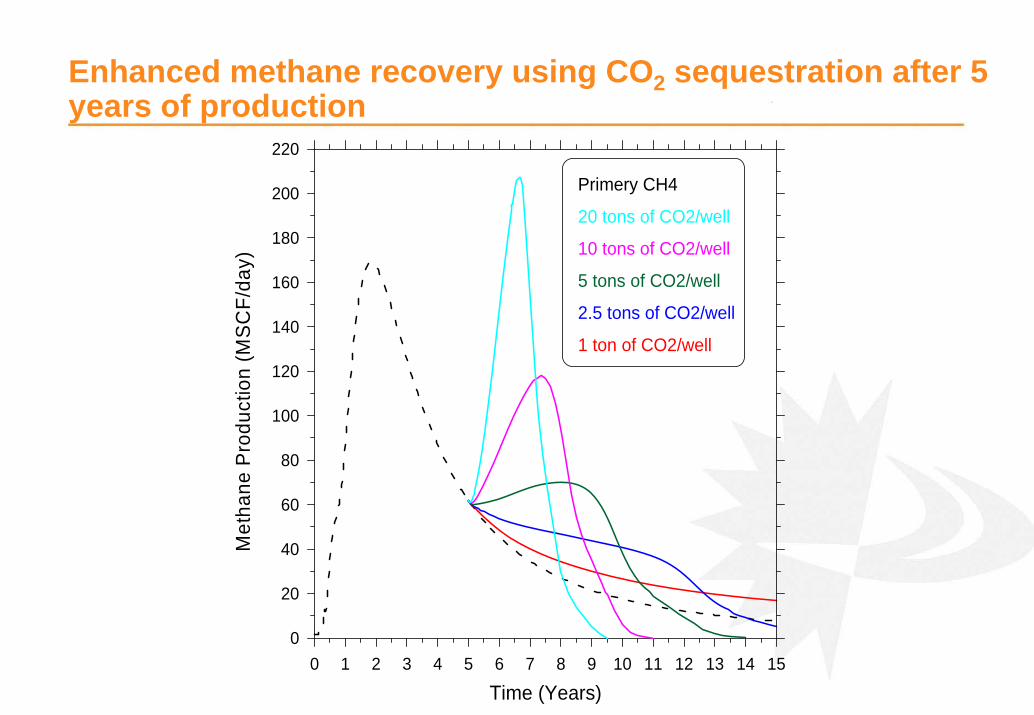
Enhanced methane recovery using CO2 sequestration after 5 years of production
0 1 2 3 4 5 6 7 8 9 10 11 12 13 14 15
Time (Years)
0
20
40
60
80
100
120
140
160
180
200
220
Met
hane
Pro
duct
ion
(MS
CF/
day)
Primery CH4
20 tons of CO2/well
10 tons of CO2/well
5 tons of CO2/well
2.5 tons of CO2/well
1 ton of CO2/well

CO2 production rate per well
5 6 7 8 9 10 11 12 13 14 15Time (years)
0
10
20
30
40
50
60
70
80
CO
2 pr
oduc
tion
rate
(Ton
/day
)
20 tons of CO2/well10 tons of CO2/well5 tons of CO2/well2.5 tons of CO2/well1 ton of CO2/well

Comparison between CO2 and N2sequestration for 5 ton/day gas injection
5 6 7 8 9 10 11 12 13 14 15
Time (years)
0
50
100
150
200
250
300
350
400
450
500
Met
hane
Pro
duct
ion
(MS
CF/
day)
5 tons of N2/well
5 tons of CO2/well
Primary methane
5 6 7 8 9 10 11 12 13 14 15Time (years)
0
5
10
15
20
25
30
35
40
Gas
pro
duct
ion
rate
(Ton
/day
)
5 tons/day of N2/well
5 tons/day of CO2/well
CO2 BreakthroughN2 Breakthrough

Flue gas injection 5 ton/day
5 6 7 8 9 10
Time (years)
0
10
20
30
40
50
60
% G
as P
rodu
ctio
n
N2
CO2CH4
75% CO2 + 25% N2
5 6 7 8 9
Time (years)
0
10
20
30
40
50
60
70
80
90
Gas
Pro
duct
ion
%
N2
CO2CH4
25% CO2 +75% N2

CO2 Sequestration: Conclusions
• The injection of CO2 and N2 significantly increase the rate methane recovery.
• The breakthrough of N2 is much faster than that of CO2, due to the low adsorption capacity for N2 compared to CO2.
• The use of CO2 is recommended for the enhancement of methane recovery.

FINAL SUMMARY
•Exploration phase successful:•Reservoir & gas data good
•Appraisal phase underway:•Begun drilling August 06•Testing for 6-12 months
•Decision for FIELD Development:•By June 07
•Commercial development of gas:•Possibly by Feb. 08
•Making Scenarios [Stats] CRUCIAL•Having Science Correct & Targeted CRUCIAL•Looking Forward IMPERATIVE