Embed Size (px)
Citation preview

October 2, 2013
Global and U.S. Coal Outlook
2013 American Waterways Symposium
Jacob Williams
Vice President Global Energy Analytics
Global and U.S. Coal Outlook
● Coal is the fastest-growing fuel in the world and
expected to surpass oil as the world‟s largest energy
source in coming years
● Near-term coal demand is rebounding in the United
States due to coal‟s competitive advantage over higher
priced natural gas
● Greater deployment of advanced technologies drives our
energy, economic and environmental “3E” goals
Key Discussion Points
2
0
1,000
2,000
3,000
4,000
5,000
Coal Oil Natural Gas
Nuclear Hydro Bio- energy
Wind/ Solar
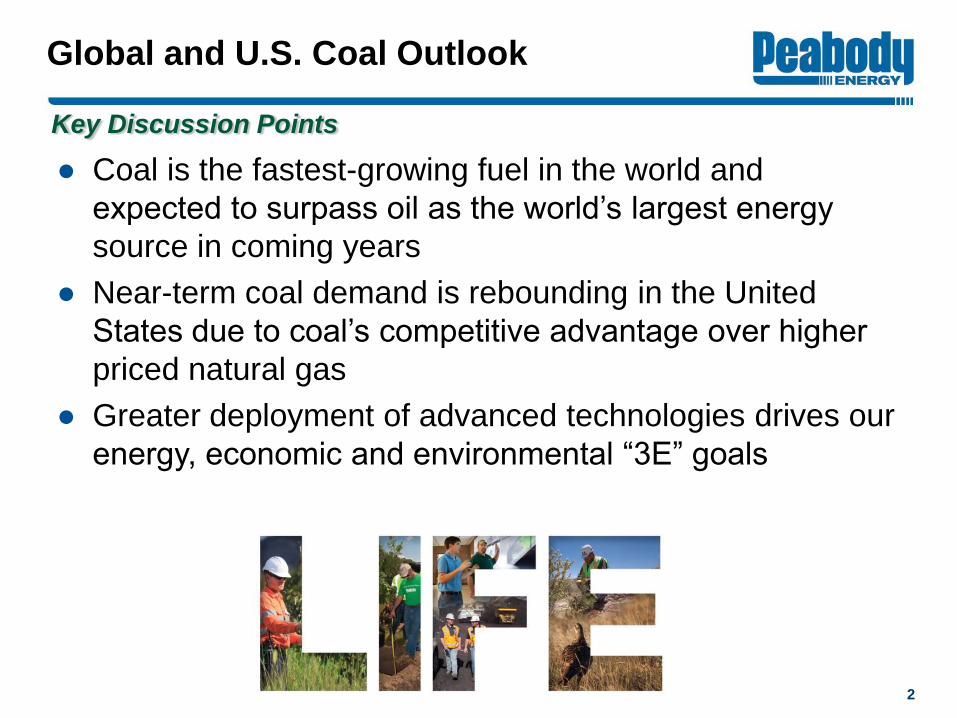
Coal: The World’s Fastest Growing Major Fuel
0%
10%
20%
30%
40%
50%
60%
Coal Hydro Natural Gas
Oil Nuclear
56%
35%
13%
31%
0%
Source: BP Statistical Review of World Energy 2012; International Energy Agency, World Energy Outlook 2012 „Current Policies‟ scenario. 3
Largest Share of Global Energy Since 1969
Growth 2001 – 2011 Growth to 2020
20
10
2
02
0
Mil
lio
n T
on
ne
s o
f O
il E
qu
iva
len
t
Coal Expected to Approach Oil by 2020
0
200
400
600
800
1,000
1,200
2012 Atlantic Other Pacific
India China 2017P
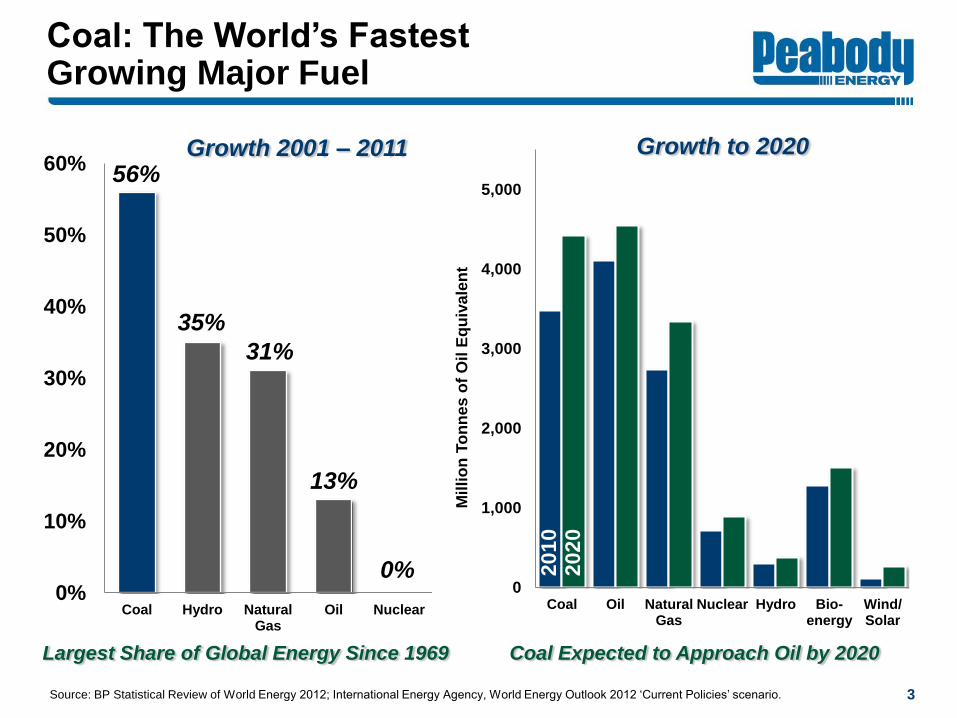
New Generation Drives Significant Global Thermal Coal Demand
● New coal fueled
generation requires
210 million tonnes
per year of additional
seaborne demand
● Asia accounts for all
seaborne thermal
growth
● Largest thermal coal
import growth from
India
910
1,120
+75
+80
+75
Global Seaborne Thermal Coal Demand (Tonnes in Millions)
23% Growth
China
Other
Pacific
India
-20
Atlantic 190
440
Source: Peabody Global Analytics, McCloskey, other industry sources. 4
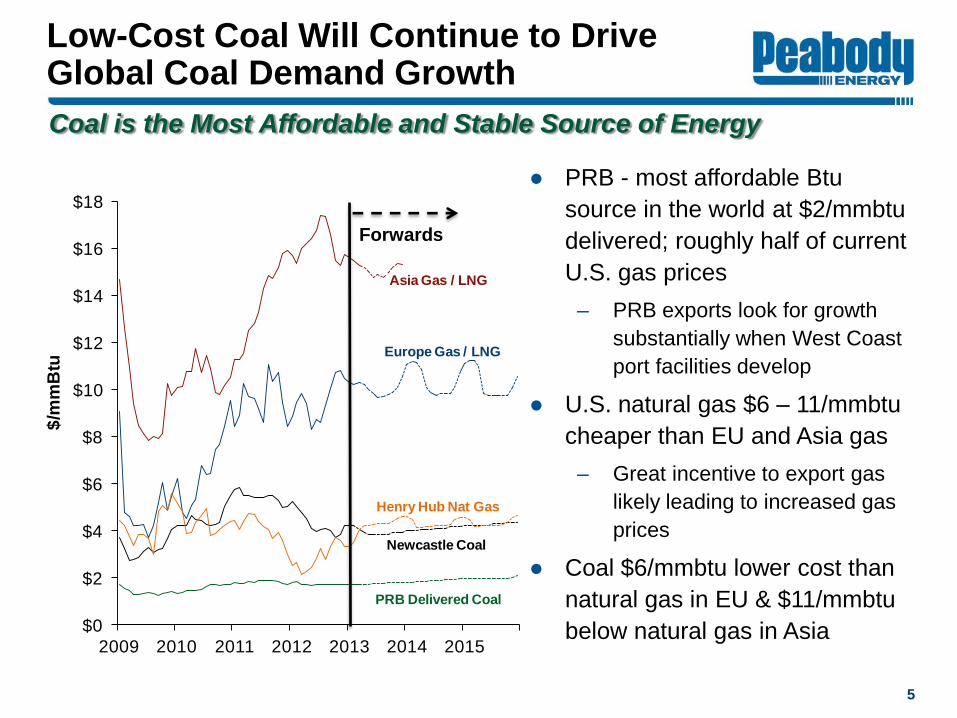
Low-Cost Coal Will Continue to Drive Global Coal Demand Growth
Coal is the Most Affordable and Stable Source of Energy
5
● PRB - most affordable Btu
source in the world at $2/mmbtu
delivered; roughly half of current
U.S. gas prices
‒ PRB exports look for growth
substantially when West Coast
port facilities develop
● U.S. natural gas $6 – 11/mmbtu
cheaper than EU and Asia gas
‒ Great incentive to export gas
likely leading to increased gas
prices
● Coal $6/mmbtu lower cost than
natural gas in EU & $11/mmbtu
below natural gas in Asia
$0
$2
$4
$6
$8
$10
$12
$14
$16
$18
2009 2010 2011 2012 2013 2014 2015
$/m
mB
tu
Europe Gas / LNG
Newcastle Coal
Henry Hub Nat Gas
PRB Delivered Coal
Asia Gas / LNG
Forwards
$10,000
$20,000
$30,000
$40,000
$50,000
$60,000
$70,000
$80,000
$90,000
$100,000
2,000
4,000
6,000
8,000
10,000
12,000
14,000
16,000
1970 1980 1990 2000 2010 2020 2030
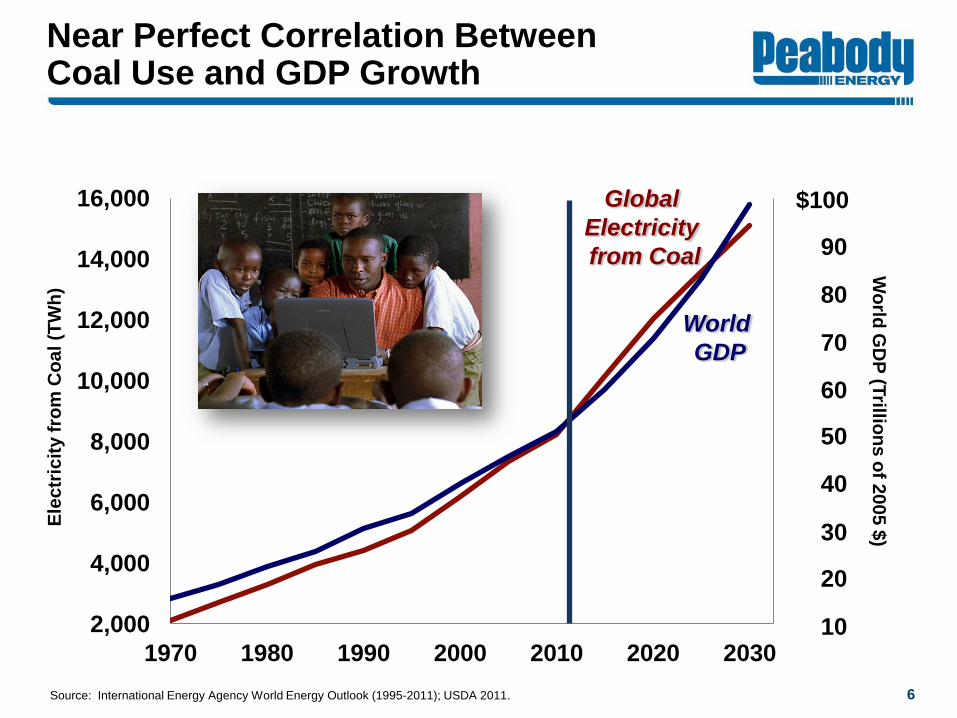
Near Perfect Correlation Between Coal Use and GDP Growth
Ele
ctr
icit
y f
rom
Co
al
(TW
h)
Global
Electricity
from Coal
World
GDP
Source: International Energy Agency World Energy Outlook (1995-2011); USDA 2011.
$100
90
80
70
60
50
40
30
20
10
Wo
rld G
DP
(Trillio
ns
of 2
00
5 $
)
6
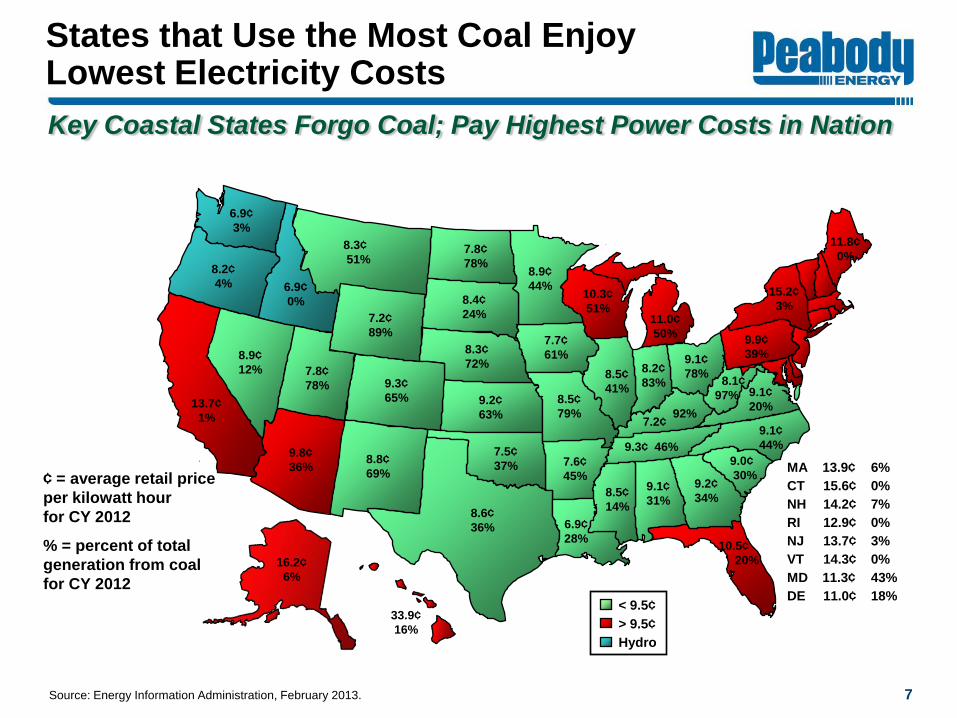
States that Use the Most Coal Enjoy Lowest Electricity Costs
7 Source: Energy Information Administration, February 2013.
10.5¢
20%
8.3¢
51% 7.8¢
78%
6.9¢
3%
8.3¢
72%
7.2¢
89%
9.3¢
65%
8.2¢
4%
9.2¢
63%
8.8¢
69%
8.9¢
12%
13.7¢
1%
7.8¢
78%
8.4¢
24%
8.6¢
36%
7.7¢
61%
8.9¢
44%
7.5¢
37%
8.5¢
79%
8.5¢
41%
9.8¢
36%
10.3¢
51%
7.6¢
45%
6.9¢
28%
11.0¢
50%
8.2¢
83%
9.1¢
78%
11.8¢
0%
8.5¢
14%
9.1¢
31%
9.2¢
34%
9.0¢
30%
7.2¢
9.1¢
20%
9.9¢
39%
8.1¢
97%
9.1¢
44% 9.3¢ 46%
6.9¢
0%
16.2¢
6%
33.9¢
16%
MA 13.9¢ 6%
CT 15.6¢ 0%
NH 14.2¢ 7%
RI 12.9¢ 0%
NJ 13.7¢ 3%
VT 14.3¢ 0%
MD 11.3¢ 43%
DE 11.0¢ 18%
¢ = average retail price
per kilowatt hour
for CY 2012
% = percent of total
generation from coal
for CY 2012
< 9.5¢
> 9.5¢
Hydro
15.2¢
3%
92%
Key Coastal States Forgo Coal; Pay Highest Power Costs in Nation
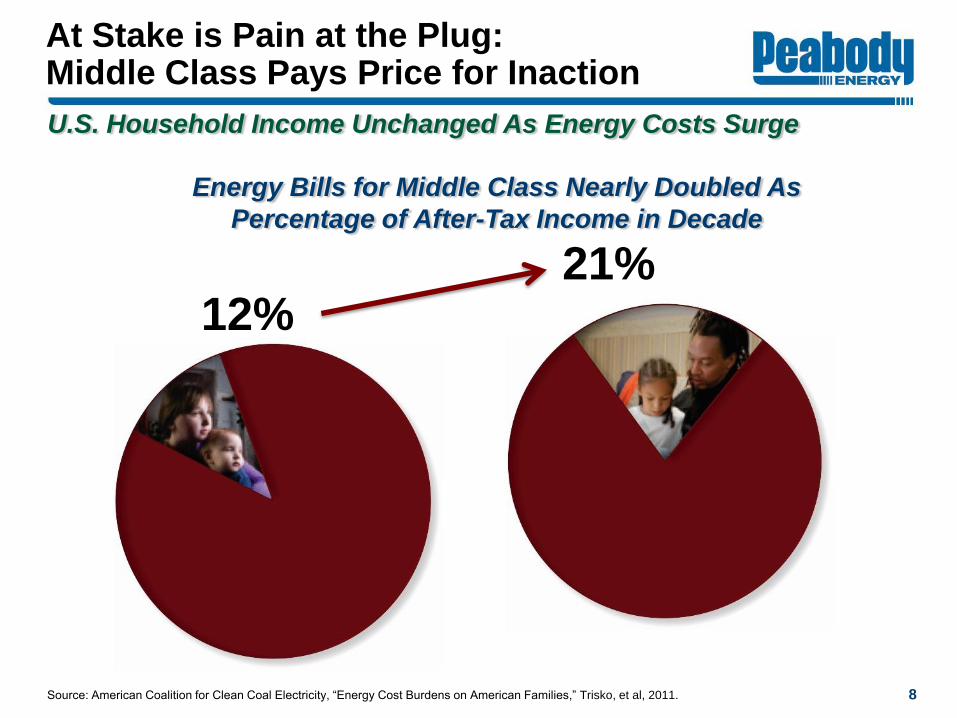
12% 21%
U.S. Household Income Unchanged As Energy Costs Surge
Source: American Coalition for Clean Coal Electricity, “Energy Cost Burdens on American Families,” Trisko, et al, 2011.
Energy Bills for Middle Class Nearly Doubled As
Percentage of After-Tax Income in Decade
8
At Stake is Pain at the Plug: Middle Class Pays Price for Inaction
0
200
400
600
Source: Peabody Global Analytics.
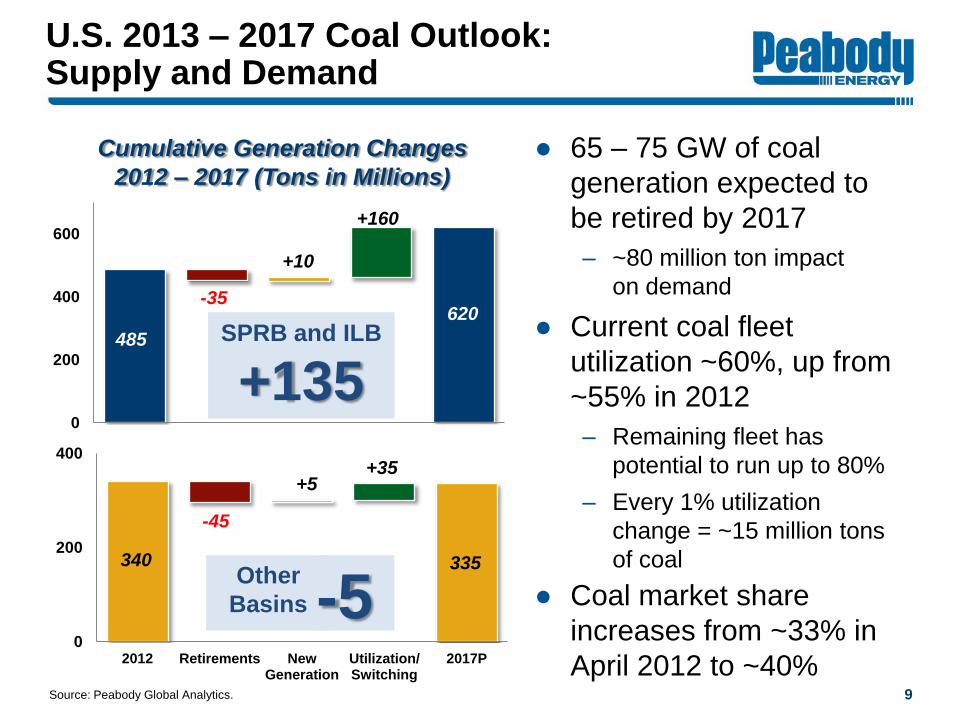
U.S. 2013 – 2017 Coal Outlook: Supply and Demand
● 65 – 75 GW of coal
generation expected to
be retired by 2017
– ~80 million ton impact
on demand
● Current coal fleet
utilization ~60%, up from
~55% in 2012
– Remaining fleet has
potential to run up to 80%
– Every 1% utilization
change = ~15 million tons
of coal
● Coal market share
increases from ~33% in
April 2012 to ~40%
Cumulative Generation Changes
2012 – 2017 (Tons in Millions)
(35)
+35
+160
+135
0
200
400
2012 Retirements New Generation
Utilization/ Switching
2017P
-35
-45
+10
+5
+160
+35
SPRB and ILB
+135
Other
Basins
485
620
340 335
9
-5
10 Sources: Energy Information Administration and Peabody estimates
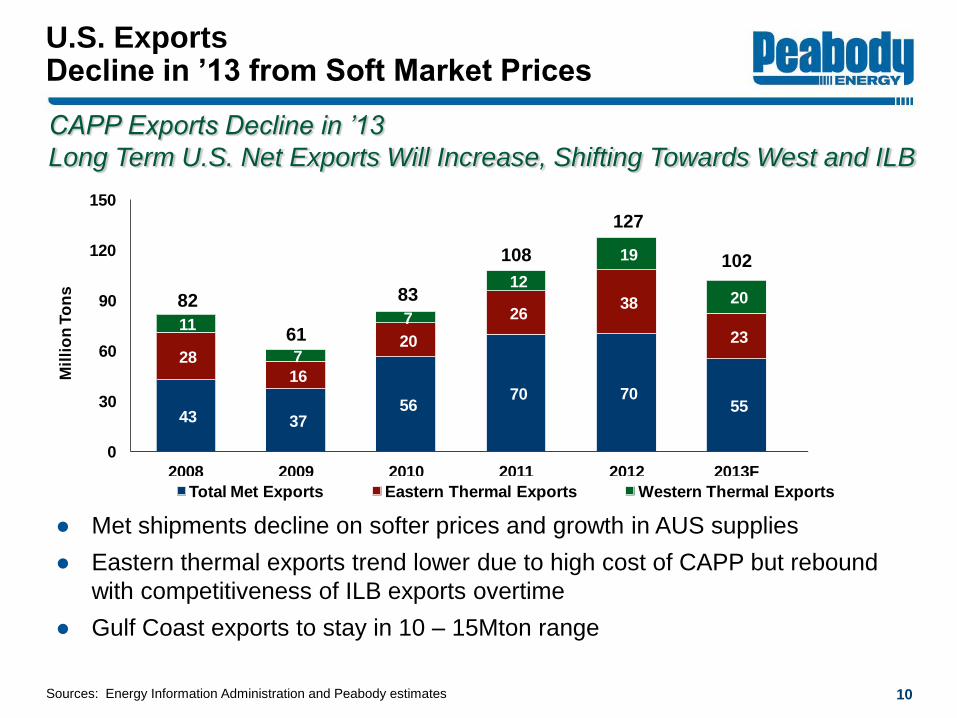
● Met shipments decline on softer prices and growth in AUS supplies
● Eastern thermal exports trend lower due to high cost of CAPP but rebound
with competitiveness of ILB exports overtime
● Gulf Coast exports to stay in 10 – 15Mton range
CAPP Exports Decline in ’13
Long Term U.S. Net Exports Will Increase, Shifting Towards West and ILB
U.S. Exports Decline in ’13 from Soft Market Prices
43 37 56
70 70 55
44
28 16
20
26 38
23 32
11
7
7
12
19
20 23 82
61
83
108
127
102 99
0
30
60
90
120
150
2008 2009 2010 2011 2012 2013F 2017F
Mil
lio
n T
on
s
Total Met Exports Eastern Thermal Exports Western Thermal Exports
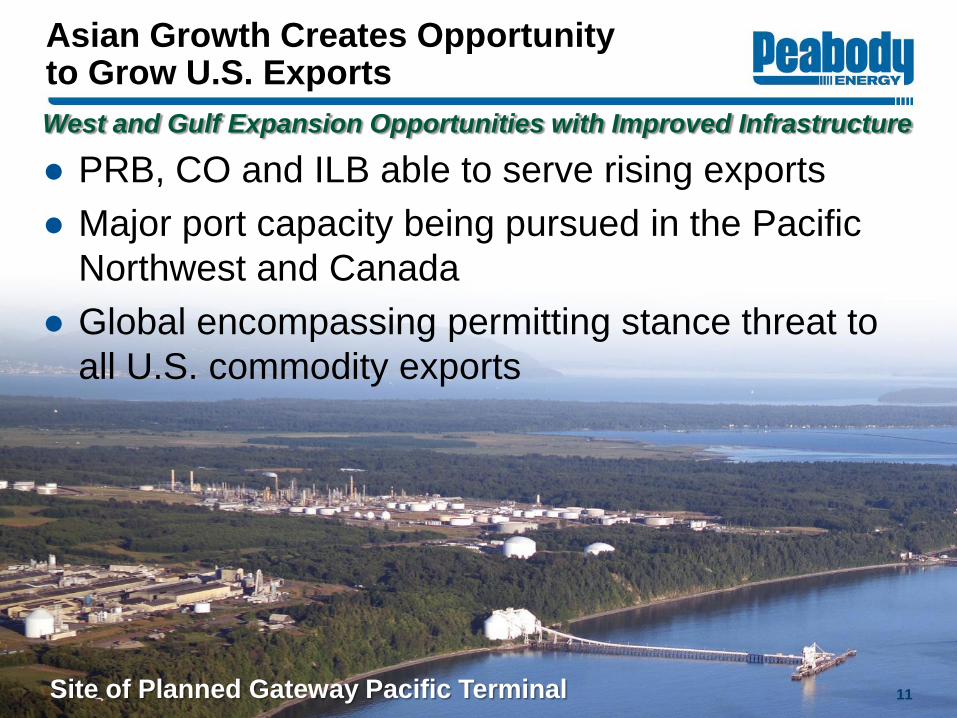
● PRB, CO and ILB able to serve rising exports
● Major port capacity being pursued in the Pacific
Northwest and Canada
● Global encompassing permitting stance threat to
all U.S. commodity exports
West and Gulf Expansion Opportunities with Improved Infrastructure
Asian Growth Creates Opportunity to Grow U.S. Exports
Site of Planned Gateway Pacific Terminal 11
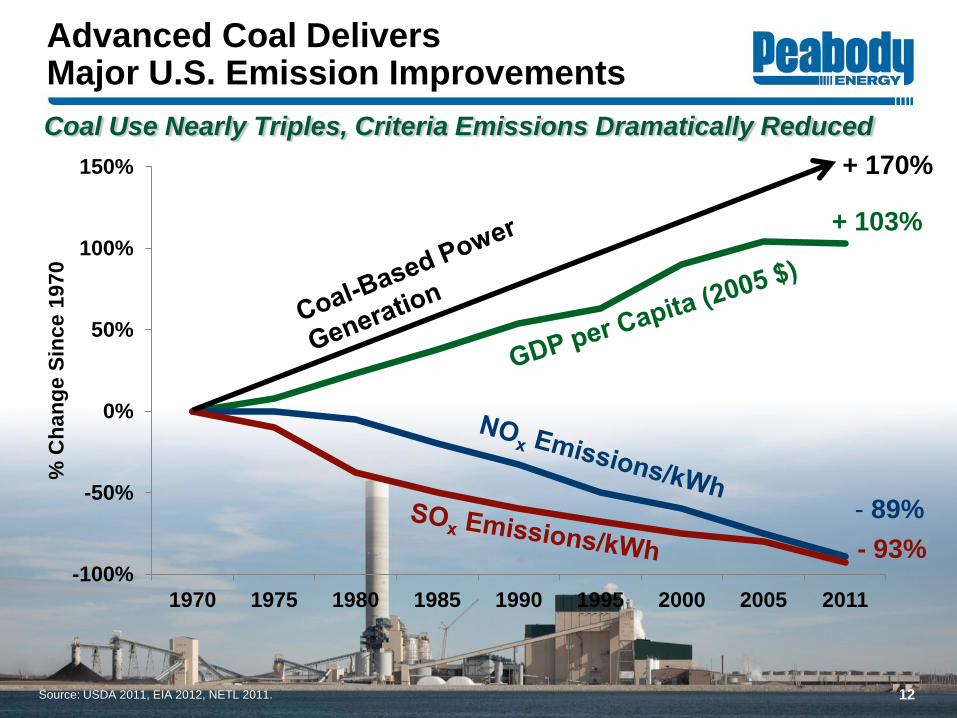
Advanced Coal Delivers Major U.S. Emission Improvements
12
-100%
-50%
0%
50%
100%
150%
1970 1975 1980 1985 1990 1995 2000 2005 2011
% C
han
ge S
ince 1
970
+ 103%
- 89%
- 93%
Source: USDA 2011, EIA 2012, NETL 2011.
+ 170%
Coal Use Nearly Triples, Criteria Emissions Dramatically Reduced
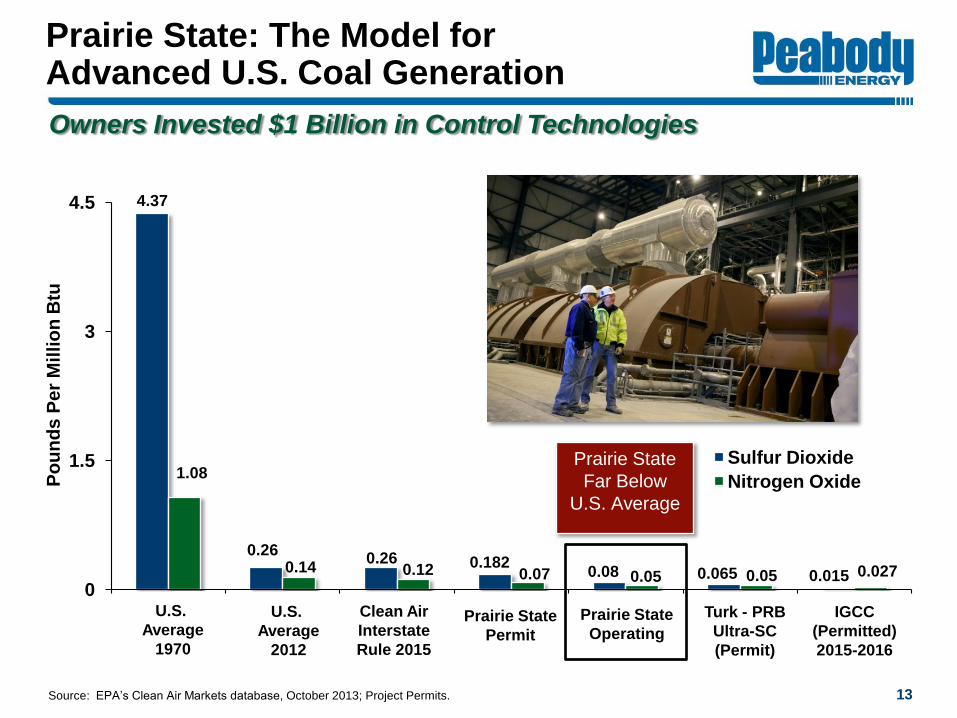
0
1.5
3
4.5
Po
un
ds
Pe
r M
illio
n B
tu
Sulfur Dioxide
Nitrogen Oxide
Prairie State
Far Below
U.S. Average
Source: EPA‟s Clean Air Markets database, October 2013; Project Permits.
U.S.
Average
2012
Prairie State
Permit
Clean Air
Interstate
Rule 2015
4.37
0.14
0.26 0.12 0.182
0.07
1.08
0.26
U.S.
Average
1970
0.015 0.027
IGCC
(Permitted)
2015-2016
Turk - PRB
Ultra-SC
(Permit)
0.065 0.05
Owners Invested $1 Billion in Control Technologies
Prairie State
Operating
0.08 0.05
Prairie State: The Model for Advanced U.S. Coal Generation
13
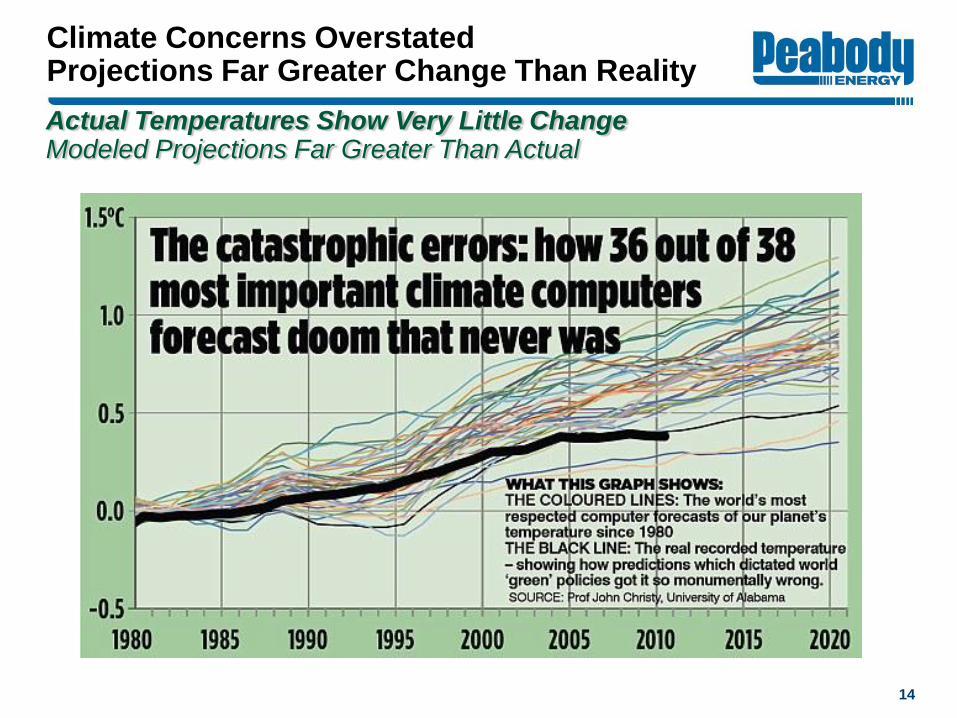
Actual Temperatures Show Very Little Change Modeled Projections Far Greater Than Actual
Climate Concerns Overstated Projections Far Greater Change Than Reality
14

www.PeabodyEnergy.com