Embed Size (px)
Citation preview
General rights Copyright and moral rights for the publications made accessible in the public portal are retained by the authors and/or other copyright owners and it is a condition of accessing publications that users recognise and abide by the legal requirements associated with these rights.
• Users may download and print one copy of any publication from the public portal for the purpose of private study or research. • You may not further distribute the material or use it for any profit-making activity or commercial gain • You may freely distribute the URL identifying the publication in the public portal
If you believe that this document breaches copyright please contact us providing details, and we will remove access to the work immediately and investigate your claim.
Downloaded from orbit.dtu.dk on: Jul 16, 2018
Oxy-Fuel Combustion of Coal
Brix, Jacob; Jensen, Anker Degn; Jensen, Peter Arendt
Publication date:2011
Document VersionPublisher's PDF, also known as Version of record
Link back to DTU Orbit
Citation (APA):Brix, J., Jensen, A. D., & Jensen, P. A. (2011). Oxy-Fuel Combustion of Coal. Technical University of Denmark,Department of Chemical and Biochemical Engineering.
Oxy-Fuel Combustion of Coal PhD-Thesis
Jacob Brix
Supervisors:
Professor Anker Degn Jensen
Associate Professor Peter Arendt Jensen
CHEC Research Centre
Department of Chemical and Biochemical Engineering
Technical University of Denmark
i
Abstract
This Ph.D. thesis describes an experimental and modeling investigation of the thermal
conversion of coal and an experimental investigation of the emission of NO from char
combustion in O2/N2 and O2/CO2 atmospheres. The motivation for the work has been the
prospective use of the technology “Oxy-Fuel Combustion” as a mean of CO2 abatement
in large scale energy conversion.
Entrained Flow Reactor (EFR) experiments have been conducted in O2/N2 and O2/CO2
mixtures in the temperature interval 1173 K – 1673 K using inlet O2 concentrations
between 5 – 28 vol. %. Bituminous coal has been used as fuel in all the experiments.
Devolatilization experiments showed that the volatile weight loss was not affected by the
change from N2 to CO2. Analysis by Scanning Electron Microscopy (SEM) and
Brunauer-Emmett-Teller (BET) surface area of sampled char did not reveal differences
between the two atmospheres either. Char conversion profiles, obtained from sampled
char did not show differences in conversion rate between O2/N2 and O2/CO2 atmospheres
across the span of O2 concentrations in the interval of reactor temperatures 1173 K –
1373 K. At the reactor temperatures 1573 K and 1673 K and an inlet O2 concentration of
5 vol. % it was found that char conversion rate was lowered in O2/CO2 compared to
O2/N2. This is caused by the lower diffusion coefficient of O2 in CO2 (~ 22 %) that limits
the reaction rate in zone III compared to combustion in O2/N2. Using char sampled in the
EFR experiments ThermoGravimetric Analyzer (TGA) reactivity profiles for combustion
and CO2 gasification has been found at 5 vol. % O2 or 80 vol. % CO2 and a heating rate
of 5 K/min to a peak temperature of 1273 K or 1373 K. These experiments did not reveal
differences in reactivity between EFR-chars formed in O2/N2 and O2/CO2. Reactivity
profiles for TGA combustion of partly converted EFR-char, sampled at 1173 K and 28
vol. % O2, showed the presence of two phases of distinctively different reactivity. The
least reactive of these phases are believed to be formed from interactions between
mineral matter and secondary volatiles evolved during the fierce heating upon particle
ignition at the high O2 concentrations. From TGA reactivity profiles of EFR-chars
devolatilized at 1173 K – 1673 K intrinsic kinetic parameters has been found for
combustion. The rate constant includes both a deactivation and an activation term.
ii
Intrinsic kinetics was also found for CO2 gasification though using only EFR-char
devolatilized at 1273 K, 1473 K and 1573 K due to a lack of samples. Interestingly, it
was found that devolatilization temperature did not affect the gasification rate constant. A
detailed COal COmbustion MOdel (COCOMO) encompassing among others the three
char morphologies; cenospheres, network- and dense chars, each distributed between six
discrete particle sizes has been developed. The model showed a reasonable ability to
predict the conversion profiles obtained in the EFR experiments using the intrinsic TGA
kinetics for combustion and gasification. At the reactor temperature 1173 K COCOMO
over predicts char conversion at O2 inlet concentrations of 5 and 28 vol. %. At the reactor
temperature 1273 K COCOMO also over predicts char conversion at an inlet O2
concentration of 5 vol. %. Over prediction at the high O2 concentration is caused by the
formation of char with a low reactivity as discussed above. Simulation under these
conditions show that particle excess temperatures of 500 – 600 K is reached upon ignition
at heating rates as high as 20000 K/s, which can indeed cause a significant release of
secondary volatiles. At the low O2 concentration deviation between model and
experiments is caused by an experimental delay in ignition that is not captured by the
model. Though this causes a deviation in total conversion COCOMO still predicts
conversion rates accurately after ignition. A laboratory scale Fixed Bed Reactor (FBR),
operated isothermally at 1073 K, has been used for combustion of millimeter-sized
lignite- and bituminous char particles in 5 – 80 vol. % O2 in N2 or CO2 atmospheres.
Particle temperatures have been recorded by a Charged Coupled Device (CCD) camera
and experiments have been carried out with single and multiple particles of different
sizes. NO emission from lignite char were not affected by the change of N2 with CO2.
Emissions from bituminous char were lower in O2/CO2. Emissions for both char types
decreased as the O2 concentration or the particle size increased. An intermediate particle
size was found where emissions peaked for the bituminous char. The CCD camera
measured in situ temperatures accurately during experiments and the ability of film
recording proved a valuable tool for data interpretation. The results suggest that transport
phenomena and kinetics alone can not account for changes in NO emissions between
O2/N2 and O2/CO2. The effect of mineral catalysis and the presence of other N-containing
species, such as HCN and NH3, may also play a role.
iii
Resumé
Denne Ph.d. afhandling beskriver en eksperimentel- og modelundersøgelse af
kulomsætning ved suspensionsfyrede forhold samt en eksperimentel undersøgelse af NO
emission fra koksforbrænding udført i O2/N2 og O2/CO2 atmosfærer. Motivationen til
dette arbejde har været muligheden for at bruge ”Oxy-Fuel Forbrænding” som en metode
til at reducere CO2 emissionen fra energikonvertering i industriel skala.
Forsøg er udført i en FastBrændselsReaktor (FBR) i O2/N2 og O2/CO2 atmosfærer i
temperaturintervallet 1173 K – 1673 K og ved O2 indgangskoncentrationer mellem 5 og
28 vol. %. Bituminøst kul har været benyttet som brændsel under alle forsøgene.
Pyrolyseeksperimenter viser, at vægttabet af flygtige bestanddele ikke bliver påvirket ved
skiftet fra N2 til CO2. Analyse med ElektronMikroskopi (EM) og Brunauer-Emmett-
Teller (BET) måling på opsamlet pyrolysekoks viser heller ikke nogen indflydelse af
gasatmosfære. Koksomsætningsprofiler, fundet fra opsamlet koks, viser ikke forskel i
omsætningshastighed mellem O2/N2 og O2/CO2 ved de anvendte O2 koncentrationer i
temperaturintervallet 1173 K – 1373 K. Ved reaktortemperaturer på 1573 K og 1673 K
og ved en indgangskoncentration af O2 på 5 vol. % er omsætningshastigheden i O2/CO2
langsommere end i O2/N2. Dette skyldes en lavere diffusionskoefficient af O2 i CO2 (~ 22
%), hvilket begrænser omsætningshastigheden af koks i zone III.
Reaktivitetsprofiler for FBR-koks er målt i en TermoGravimetrisk Analysator (TGA) for
forbrænding og forgasning ved enten 5 vol. % O2 eller 80 vol. % CO2 under en
opvarmningshastighed på 5 K/min til enten 1273 K eller 1373 K. Disse profiler viser
ingen forskel i reaktivitet mellem FBR-koks skabt i O2/N2 og O2/CO2 atmosfærer.
Reaktivitetsprofiler for TGA forbrænding af delvist omsat FBR-koks, opsamlet ved 1173
K i 28 vol. % O2, viser tilstedeværelsen af to faser med forskellig reaktivitet. Den mindst
reaktive fase tænkes dannet fra interaktioner mellem koksens mineralindhold og flygtige
bestanddele fra en sekundær pyrolyse igangsat af den intense partikelopvarmning, der
finder sted under antændingen ved den høje O2 koncentration. Ud fra reaktivitetsprofiler
for FBR-koks, dannet ved pyrolyse ved temperaturer mellem 1173 K og 1673 K, er der
fundet kinetiske parametre for forbrænding. Hastighedskonstanten indeholder både et
aktiverings- og deaktiveringsled. Kinetiske parametre er også fundet for CO2 forgasning,
iv
dog kun med FBR-koks dannet ved 1273 K, 1473 K og 1573 K, da der var begrænsede
mængder af koks til rådighed. Forbavsende viser hastighedskonstanten for CO2
forgasning ikke tegn på termisk deaktivering.
Detaljeret modellering med en ”COal COmbustion MOdel (COCOMO)”, udviklet i
projektet, viser en rimelig evne til at beskrive koksomsætningsprofilerne, fundet under
FBR-forsøgene, ved brug af TGA-kinetikken. COCOMO udfører beregninger på de tre
koksmorfologier; cenosfærer, netværkskoks og kompakt koks, hver fordelt mellem seks
diskrete partikelstørrelser. Ved en reaktortemperatur på 1173 K overestimerer COCOMO
koksomsætningsgraden ved indgangskoncentrationer af O2 på 5 og 28 vol. %. Ved en
reaktortemperatur på 1273 K overestimerer COCOMO også koksomsætningsgraden ved
5 vol. % O2. Overestimeringen ved den høje iltkoncentration skyldes tilstedeværelsen af
koks med forskellig reaktivitet, som det er beskrevet ovenfor. Simuleringer under disse
betingelser viser, at partikelovertemperaturer på 500 – 600 K nås under antændingen med
opvarmingshastigheder op til 20000 K/s, hvilket bestemt vil medføre en frigivelse af
flygtige bestanddele. Ved den lave O2 koncentration skyldes afvigelsen mellem
COCOMO og de eksperimentelle data, at der sker en forsinkelse i koksantændelsen under
forsøgene. Selv om COCOMO ikke fanger forsinkelsen, beskrives
koksomsætningshastigheden stadig præcist.
I en laboratorieskala Pakket Reaktor (PR), kørt isotermt ved 1073 K, er der udført
forbrændingsforsøg med brunkuls- og bituminøse kokspartikler i millimeterstørrelse med
henblik på måling af NO emission. Forsøgene er udført med O2 koncentrationer mellem 5
og 80 vol. % i N2 eller CO2. Der er blevet målt partikeltemperaturer med et digitalkamera
under forsøgene. NO emissionen fra brunkulskoks er ikke påvirket af skiftet fra N2 til
CO2, mens emissionen fra bituminøst koks er lavest i O2/CO2. Emissionen fra begge
typer koks falder med en stigning i enten O2 koncentrationen eller partikelstørrelsen. En
intermediær partikelstørrelse, hvor NO emissionen toppede, blev fundet for bituminøst
koks. Digitalkameraet gav præcise temperaturmålinger under forsøgene. Resultaterne
tyder på, at transportfænomener og kinetik alene, ikke er i stand til at redegøre for
forskellene i NO emission mellem O2/N2 og O2/CO2. Effekten af mineralsk katalyse samt
eksistensen of N-holdige gasser som HCN og NH3 kan også spille en rolle.
v
Preface
This dissertation constitutes the partial fulfillment of a Ph.D.-thesis. It was carried out at
the Department of Chemical and Biochemical Engineering at the Technical University of
Denmark as part of the CHEC (Combustion and Harmful Emission Control) research
centre with Professor Anker Degn Jensen and Associate Professor Peter Arendt Jensen as
supervisors.
I would like to give my sincere thanks to Anker Degn Jensen, Peter Arendt Jensen and
Peter Glarborg for excellent supervision and for increasing the quality of the work
through fruitful discussions and careful reading of my manuscripts.
I thank the members of CHEC and the department for the creation a collegial work
environment with a high degree of knowledge exchange. I especially want to address this
thank to Carsten Nørby and Thomas Wolfe for their help during the experiments.
I thank Henning Engelbrecht Larsen and Sønnik Clausen at Risø DTU for their help with
the CCD camera experiments and for their patience during subsequent data treatment.
I sincerely thank the students Peter Løvengreen Bonnek, Joachim Bachmann Nielsen,
Leyre Gómez Navascués, Jesper Banke Grosmann and Morten Storgaard Petersen for
their contributions to the experimental results of this thesis.
I thank the members of the EU project “Friendly Coal” for the discussions during project
meetings and for bringing a broad perspective to my understanding of oxy-fuel
combustion.
For financial support I acknowledge the Technical University of Denmark, the European
Community’s Research Fund for Coal and Steel (RFCS), the Danish Agency for Science
Technology and Innovation, Energinet.dk, Vattenfall Research and Development AB and

vi
ALSTOM Power Systems Gmbh. The support and funding from these entities are greatly
valued.
I thank my family, family-in-law and friends for their sincere interest in my project and
for the help and support when it demanded most of my time. I especially want to thank
my mother for a supportive upbringing.
At last I will like to thank my beautiful wife Helene for her continued support in the
sometimes laborious efforts of finishing this work and my daughter Isabella for bringing
sunshine into our family. I therefore dedicate this thesis, and the thousands of hours put
into it, to them.
Kgs. Lyngby, January 2011
Jacob Brix
vii
List of Articles Article I: Coal Devolatilization and Char Conversion under Suspension Fired
Conditions in O2/N2 and O2/CO2 Atmospheres.
Article II: Coal Char Reactivity: A Thermogravimetric Study on Chars Obtained in O2/N2 and O2/CO2 in an Entrained Flow Reactor Under Suspension Fired Conditions and in a TGA.
Article III: Modeling Char Conversion under Suspension Fired Conditions in O2/N2 and O2/CO2 Atmospheres.
Article IV: Oxy-Fuel Combustion of Coal Char: Particle Temperature and NO Formation.
viii
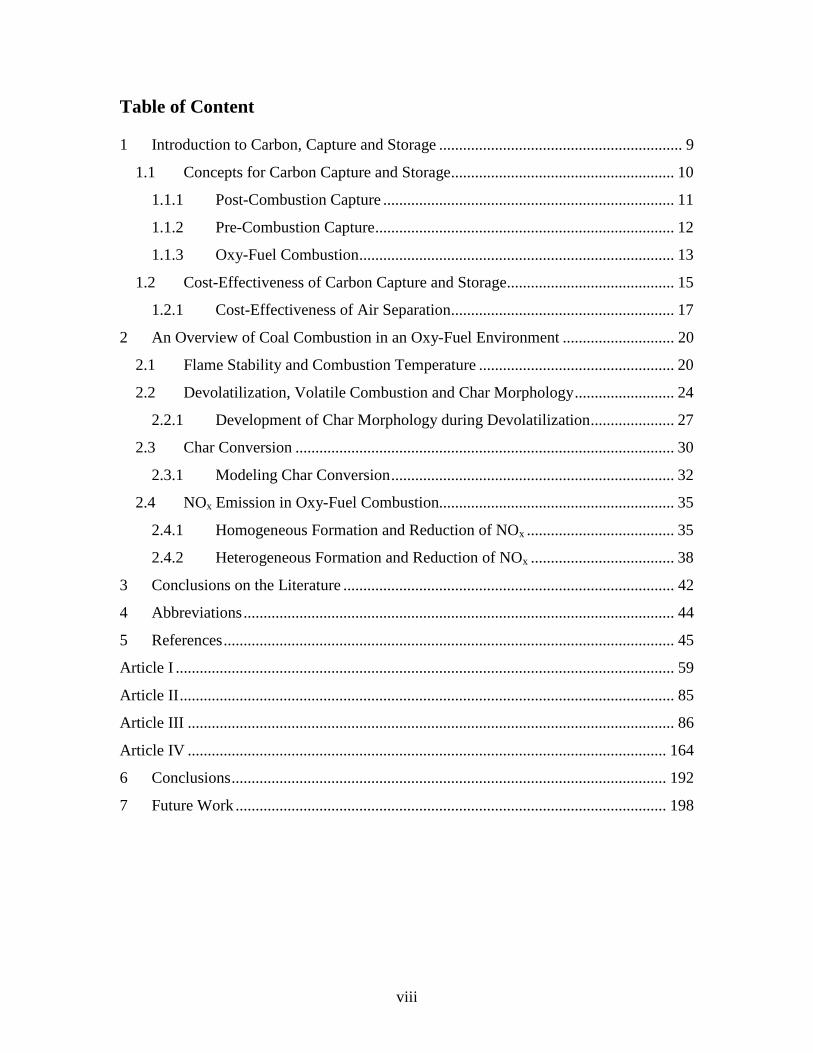
Table of Content 1 Introduction to Carbon, Capture and Storage ............................................................. 9
1.1 Concepts for Carbon Capture and Storage ........................................................ 10
1.1.1 Post-Combustion Capture ......................................................................... 11
1.1.2 Pre-Combustion Capture ........................................................................... 12
1.1.3 Oxy-Fuel Combustion ............................................................................... 13
1.2 Cost-Effectiveness of Carbon Capture and Storage .......................................... 15
1.2.1 Cost-Effectiveness of Air Separation........................................................ 17
2 An Overview of Coal Combustion in an Oxy-Fuel Environment ............................ 20
2.1 Flame Stability and Combustion Temperature ................................................. 20
2.2 Devolatilization, Volatile Combustion and Char Morphology ......................... 24
2.2.1 Development of Char Morphology during Devolatilization ..................... 27
2.3 Char Conversion ............................................................................................... 30
2.3.1 Modeling Char Conversion ....................................................................... 32
2.4 NOx Emission in Oxy-Fuel Combustion........................................................... 35
2.4.1 Homogeneous Formation and Reduction of NOx ..................................... 35
2.4.2 Heterogeneous Formation and Reduction of NOx .................................... 38
3 Conclusions on the Literature ................................................................................... 42
4 Abbreviations ............................................................................................................ 44
5 References ................................................................................................................. 45
Article I ............................................................................................................................. 59
Article II ............................................................................................................................ 85
Article III .......................................................................................................................... 86
Article IV ........................................................................................................................ 164
6 Conclusions ............................................................................................................. 192
7 Future Work ............................................................................................................ 198
9
1 Introduction to Carbon, Capture and Storage
In the recent years there has been an ever increasing awareness of the supposed role of
anthropogenic CO2 emission on the climate. This focus has resulted in stricter
environmental regulations both globally and within the European Union [1,2].
Today fossil fuels, coal in particular, accounts for approximately 85 % of the energy
production world wide [3,4]. To overcome present and future environmental regulations
and to solve the potential problems related to CO2 emissions the energy industry relaying
on fossil fuels is under strain to find technological alternatives that will utilize the fuels
more environmental friendly, if they are to be kept as feedstocks. This technological
development is necessary since the dependence on fossil fuels as an energy source will be
present for years to come despite the research in alternative energy sources [1,3,5]. The
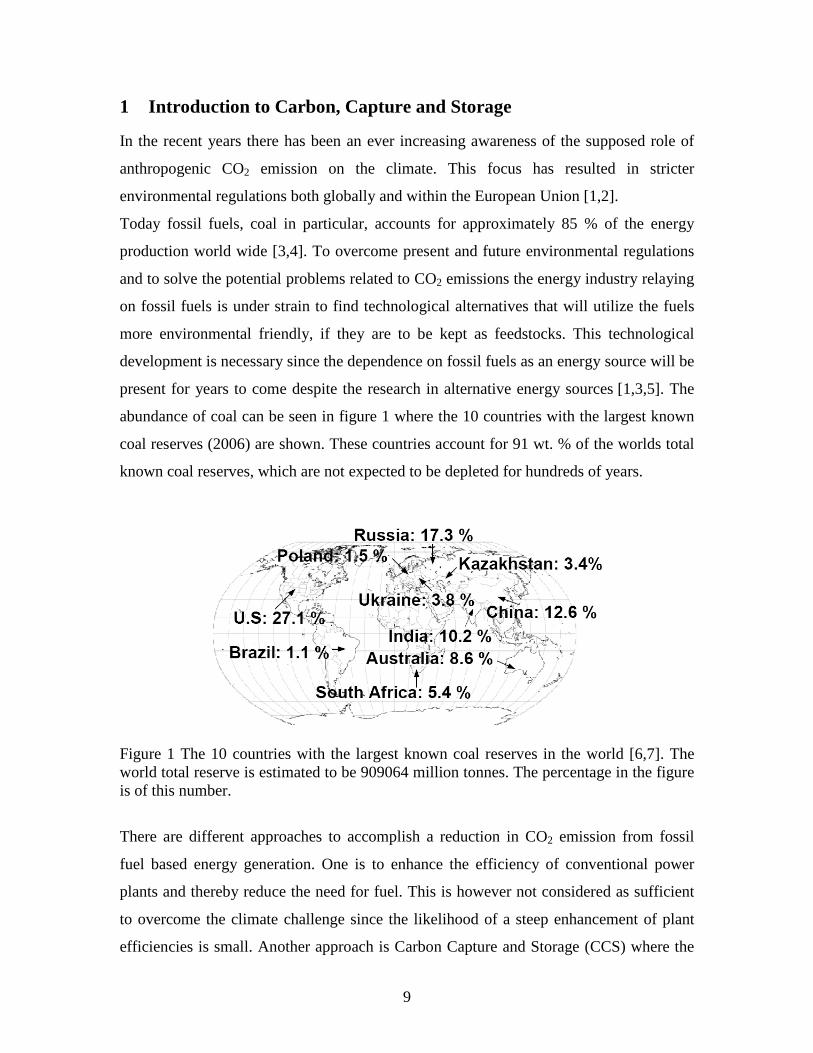
abundance of coal can be seen in figure 1 where the 10 countries with the largest known
coal reserves (2006) are shown. These countries account for 91 wt. % of the worlds total
known coal reserves, which are not expected to be depleted for hundreds of years.
Figure 1 The 10 countries with the largest known coal reserves in the world [6,7]. The world total reserve is estimated to be 909064 million tonnes. The percentage in the figure is of this number.
There are different approaches to accomplish a reduction in CO2 emission from fossil
fuel based energy generation. One is to enhance the efficiency of conventional power
plants and thereby reduce the need for fuel. This is however not considered as sufficient
to overcome the climate challenge since the likelihood of a steep enhancement of plant
efficiencies is small. Another approach is Carbon Capture and Storage (CCS) where the
10
CO2 produced in the combustion process is captured and stored in suitable geological
formations such as depleted oil and gas fields, saline formations and unmineable coal
seems [4]. In the possible sequestration locations known today it is estimated that 1120 –
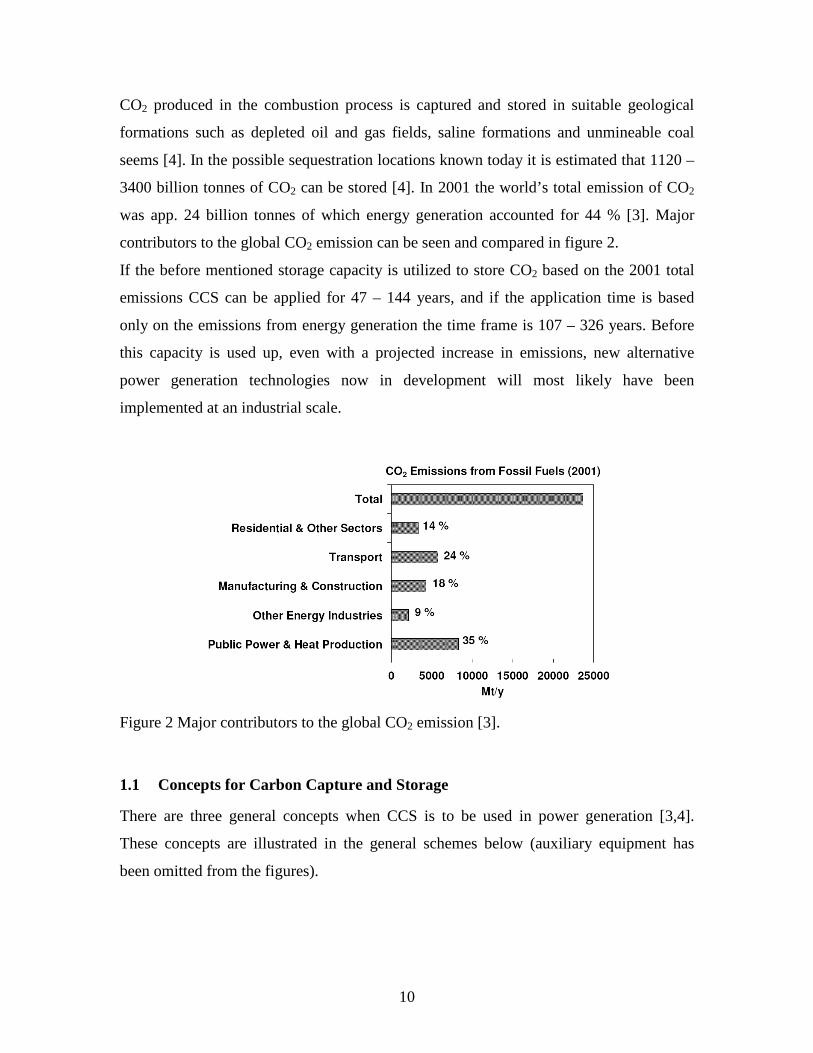
3400 billion tonnes of CO2 can be stored [4]. In 2001 the world’s total emission of CO2
was app. 24 billion tonnes of which energy generation accounted for 44 % [3]. Major
contributors to the global CO2 emission can be seen and compared in figure 2.
If the before mentioned storage capacity is utilized to store CO2 based on the 2001 total
emissions CCS can be applied for 47 – 144 years, and if the application time is based
only on the emissions from energy generation the time frame is 107 – 326 years. Before
this capacity is used up, even with a projected increase in emissions, new alternative
power generation technologies now in development will most likely have been
implemented at an industrial scale.
Figure 2 Major contributors to the global CO2 emission [3].
1.1 Concepts for Carbon Capture and Storage
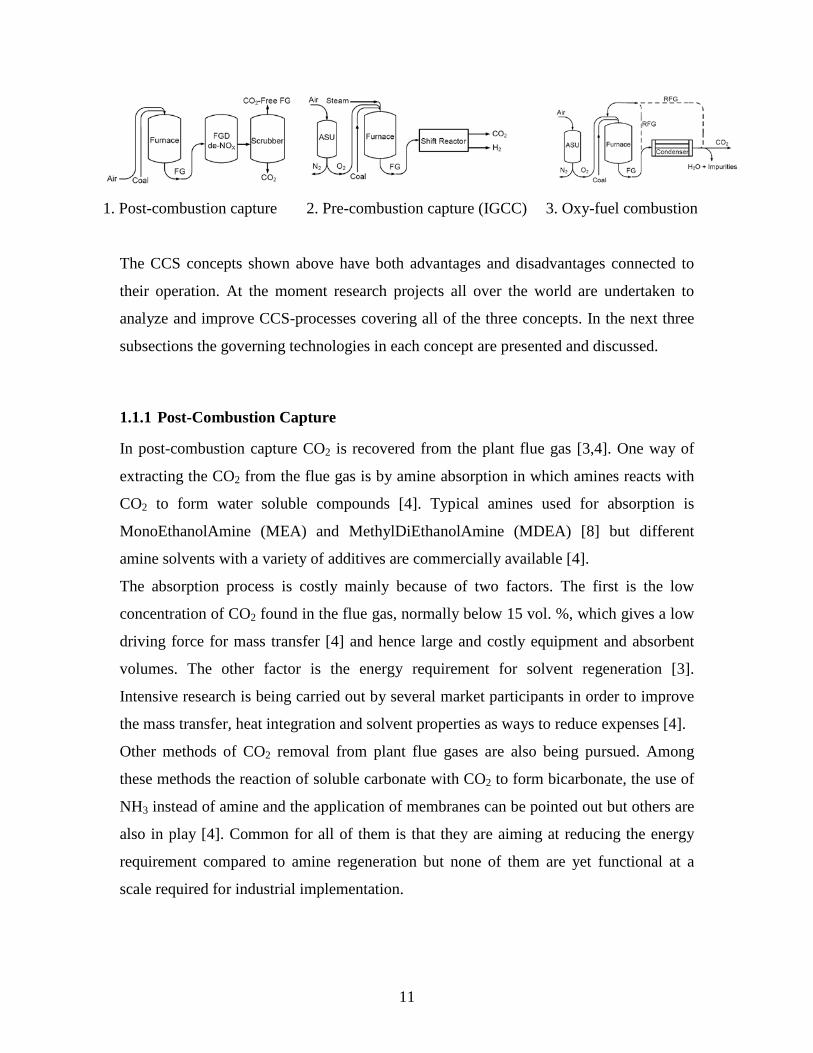
There are three general concepts when CCS is to be used in power generation [3,4].
These concepts are illustrated in the general schemes below (auxiliary equipment has
been omitted from the figures).
11
1. Post-combustion capture 2. Pre-combustion capture (IGCC) 3. Oxy-fuel combustion
The CCS concepts shown above have both advantages and disadvantages connected to
their operation. At the moment research projects all over the world are undertaken to
analyze and improve CCS-processes covering all of the three concepts. In the next three
subsections the governing technologies in each concept are presented and discussed.
1.1.1 Post-Combustion Capture
In post-combustion capture CO2 is recovered from the plant flue gas [3,4]. One way of
extracting the CO2 from the flue gas is by amine absorption in which amines reacts with
CO2 to form water soluble compounds [4]. Typical amines used for absorption is
MonoEthanolAmine (MEA) and MethylDiEthanolAmine (MDEA) [8] but different
amine solvents with a variety of additives are commercially available [4].
The absorption process is costly mainly because of two factors. The first is the low
concentration of CO2 found in the flue gas, normally below 15 vol. %, which gives a low
driving force for mass transfer [4] and hence large and costly equipment and absorbent
volumes. The other factor is the energy requirement for solvent regeneration [3].
Intensive research is being carried out by several market participants in order to improve
the mass transfer, heat integration and solvent properties as ways to reduce expenses [4].
Other methods of CO2 removal from plant flue gases are also being pursued. Among
these methods the reaction of soluble carbonate with CO2 to form bicarbonate, the use of
NH3 instead of amine and the application of membranes can be pointed out but others are
also in play [4]. Common for all of them is that they are aiming at reducing the energy
requirement compared to amine regeneration but none of them are yet functional at a
scale required for industrial implementation.
12
1.1.2 Pre-Combustion Capture
The most dominant process in this category of CCS is Integrated Gasification Combined
Cycles (IGCC’s) with carbon capture and storage. In this process the fuel is gasified
thereby producing a stream rich in CO, H2, CO2 and H2O. This stream is mixed with
steam and sent to a shift reactor where the steam reacts with the remaining CO to form
additional H2 and CO2 [3,4]. The shift reactor is operated at elevated pressures up to 84
bars [9] but normally pressures between 20 – 30 bars are used for the process1
The possible methods of separation when CO2 is to be extracted from the shift reactor
effluent includes absorption using amines or other chemical solvents, identical to post-
combustion capture, but because of the high concentration of CO2 physical solvents can
also be used [3,4]. Important aspects in the choice of solvent, chemical or physical are the
price of regeneration before the solvent is recycled back to the process and its lifetime
measured as possible numbers of recycles. In general regeneration of a physical solvent is
less energy intensive than regeneration of a chemical solvent as no chemical bonds needs
to be broken [3]. The high concentration of CO2 in the shift reactor effluent therefore
makes use of a physical solvent possible and attractive [3]. Some physical solvents are
methanol, propylene carbonate, N-methyl-pyrrolidone, dimethylether, polyethylene or
glycol [11].
[10]. After
separating CO2 from H2, the H2 is mixed with steam or N2, from the Air Separation Unit
(ASU) producing O2 for the gasification, and burned in a turbine [4,8]. The fact that the
exit stream from the shift reactor contains a high concentration of CO2 at elevated
pressure eases its separation from H2 and the following sequestration [4].
The use of membranes for the capture of CO2 is also being investigated either as a stand-
alone method or in combination with e.g. amine absorption. A crucial property of a
suitable membrane, besides its selectivity, is its maximum operating temperature since
the gas stream to be treated is at high temperature [4]. Also, if the retentate stream from a
membrane separator needs further treatment, i.e. absorption due to low membrane
efficiency, the advantage of a high CO2 concentration to facilitate mass transfer is lost. It
will therefore be difficult to optimize the process economically.
1 Reactor pressures of 70 – 80 bars have been proposed for IGCC-CCS [4] and it is therefore possible that the shift reactor will have to operate at similar pressures.
13
Another process for pre-combustion CCS, gaining a lot of interest, is chemical looping
where air oxidizes a solid intermediate that is then sent to oxidize the fuel [4]. In this way
the diluting effect of N2 on the CO2 from the combustion is avoided and the capture costs
are reduced. Chemical looping can also be applied as part of a gasification unit. There are
two different approaches to this kind of gasification, namely direct mixing of the solid
fuel particles and the oxidized intermediate [12] or a separate gasification of the solid fuel
[13,14]. In both cases the exothermic oxidation of the solid intermediate provides energy
for the process and the volatiles and gaseous gasification products are combusted by the
oxidized intermediate. For the first scheme to be feasible for CO2 emission reduction an
efficient separation of the reduced solid intermediate and the unconverted fuel particles is
essential.
1.1.3 Oxy-Fuel Combustion
What separates oxy-fuel combustion as a concept from post-combustion and pre-
combustion capture is that no actual capture is necessary. In oxy-fuel combustion the fuel
is burned in a mixture of O2 and recycled flue gas (~30 % O2 for retrofit plants [8,15])
thereby producing a high purity CO2 stream ready for sequestration [3-5]. The recycled
flue gas serves two purposes, namely to dampen the combustion temperature and to act as
a carrier of the combustion heat and the recycle ratio can be manipulated to achieve heat
transfer characteristics similar to air-blown combustion making retrofits possible [8].
In oxy-fuel combustion an ASU is supplying a near pure O2 stream (95% – 99.5 % [5,20-
22])2
2 The exact value depends on process conditions and if adsorption-based or cryogenic air separation is used. The economical impact vs. purity necessity of oxygen is also still debated.
, which is then mixed with recycled flue gas prior to the boiler entrance. After the
boiler the flue gas is sent through a condenser (recycling can take place before or after the
condenser depending on whether wet or dry recycle is desired) where water vapor
produced in the combustion process is removed along with many of the inorganic
impurities originating from the combustion [3-5,23]. The removal of water vapor must
be effective because the presence of H2O in the high pressure transport of CO2 to storage
could cause gashydrates to form [24] and also give problems with corrosion. At the end
of the process a CO2 stream of 90 % purity or higher will be ready for compression and
14
sequestration [3,5]. Flue gas compositions obtained in different oxy-fuel pilot plant
experiments can be seen in table 1.
Table 1 CO2 percentages in the flue gas obtained for oxy-fuel combustion of pulverized coal. In the case of no flue gas recycle gaseous atmospheres have been created from bottled gases. O2/CO2 % in Flue Gas O2/CO2 % Feed Gas Flue Gas Recycle Reference
4.5 % O2/ 81 % CO23 30 % O2/ 70 % CO2 No [16]
2.1 % O2/ 97 % CO2 35 % O2/ 65 % CO2 Yes [17]
2.2 % O2/ 98 % CO2 35 % O2/ 65 % CO2 Yes [17]
2.7 % O2/ 92 % CO24 35 % O2/ 65 % CO2 Yes [17]
4.2 – 3.7 % O2/ 94 % CO2 25-29 % O2/ 71-69 %
CO2
Yes [18]
5.0 – 3.7 % O2/ 95 % CO2 21-29 % O2/ 79-71 %
CO2
No [19]
In the plant description above flue gas cleaning has been omitted because the extent to
which it is needed has not been clarified. A discussion of this will be taken in section 1.2.
Further it can prove necessary to treat the CO2 stream after potential flue gas cleaning
and condensation if it is to be used for e.g. Enhanced Oil Recovery (EOR). To what level
further CO2 purification is needed is hardly foreseen and depends on the level of boiler
leakage and O2 purity [25].
A different scheme for enhanced NOx reduction in the oxy-fuel combustion process have
been proposed [26] where a fraction of the heat is recovered from the flue gas prior to
particulate removal and recirculated to the boiler entrance by the recycle stream. The
scheme performance is based entirely on modeling, and show that the same coal
combustion intensity as in air combustion can be achieved in 15 vol. % O2 using this
technique, which would make the near burner environment less oxidizing and hence
reduce NOx emission. Experiments by Toporov et al. [27,28] have yielded stable oxy-fuel
flames at O2 concentrations lower than 21 vol. % by burner optimization aiming at
3 10 % of the total gas flow into the furnace was air used for coal entrainment. 4 A leakage was discovered by the authors.
15
internal heat recirculation and stabilization of CO production. In the scheme of Toporov
et al. [27,28] an Ion Transport Membrane (ITM’s) is used for O2 production with
recirculated flue gas as sweep gas on the permeate side of the membrane. It should be
noted, though, that lower O2 concentrations at constant stoichiometry means that a larger
volume of flue gas must be recycled.
1.2 Cost-Effectiveness of Carbon Capture and Storage
Before proceeding further into the technical and engineering aspects of CCS-technology
it must be recognized that the cost-effectiveness of a plant with carbon capture always
will be reduced compared to a plant without. The reason for this is the various additional
equipment and associated work that are needed for the capture, compression, transport
and storage, solvents, ASU etc. which is not required for a conventional plant. When this
is said it must be added that much of the technology such as air separation is subjected to
intensive research and that the effectiveness penalties arising from CCS therefore are
likely to decrease [3]. The discussion taken in this section will focus on a cost-
effectiveness comparison between the three CCS approaches listed in section 1.1.
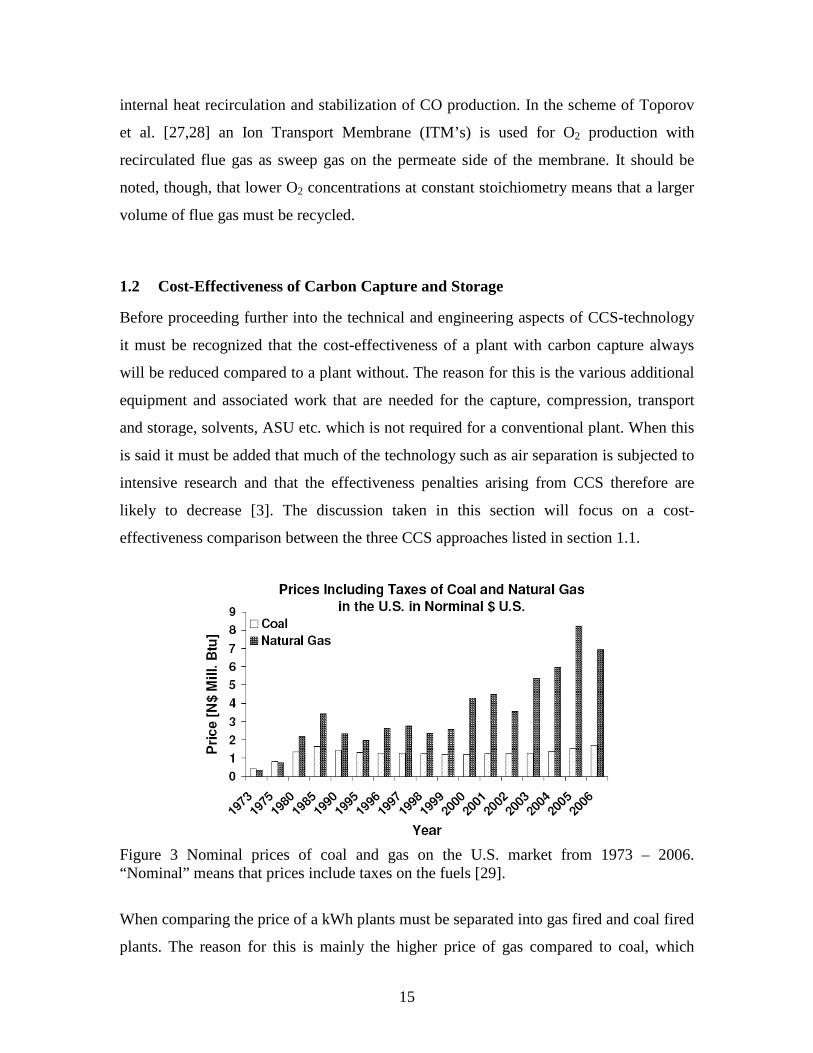
Figure 3 Nominal prices of coal and gas on the U.S. market from 1973 – 2006. “Nominal” means that prices include taxes on the fuels [29].
When comparing the price of a kWh plants must be separated into gas fired and coal fired
plants. The reason for this is mainly the higher price of gas compared to coal, which
16
makes energy penalties associated with CCS more expensive to cover in a gas fired plant
[3]. A comparison of the evolution of prices of coal and gas on the U.S. market is shown
in figure 3.
Cost projections of both coal fired and natural gas fired CCS-plants were made by
Davison [3] based on the IEA Greenhouse Gas R & D Program where engineering
contractors and developers have made design packages for post-combustion capture,
IGCC-CCS and oxy-fuel combustion. The results of this study show that the cost of
electricity production is highest for oxy-fuel combustion (532 MW) and smallest for
IGCC-CCS (730 MW) when coal is used as fuel. It must however be taken into account,
and is so by Davison, that the dimensioning of the plants are made based on fixed
equipments sizes, e.g. turbines. This results in a capacity of the oxy-fuel plant which is 27
% lower than for the IGCC. It is usually the case that the cost of a kWh decreases with
increasing plant capacity and the 21 % higher cost of a kWh in the oxy-fuel plant
compared to the IGCC can therefore not be taken as final.
Wall [8] estimated process efficiencies around 35 % LHV for all the 3 types of CCS
concepts corresponding to efficiency penalties of 7 – 8 % LHV compared to conventional
power plants. In this paper oxy-fuel combustion was presented as the CCS-technology
with the lowest Cost Of Electricity (COE) having a difference compared to conventional
air-blown combustion corresponding to a CO2 tax of $ 15 per ton of CO2. This value can
be compared with $ 25 per ton for post – combustion capture and $ 20 per ton for pre-
combustion capture [8].
The conclusions of Davison [3] and Wall [8] shows that many uncertainties needs to be
clarified in order to make a detailed unambiguous cost estimate of the CCS-technologies,
which is suitable for comparison. An important aspect of the cost-effectiveness is for
example the purity of the captured CO2. If the intended use of the captured CO2 is EOR
then the requirement for purity is > 95 % CO2 and < 10 ppm O2 [8]. This high level of
purity sets high demands for the equipment and post treatment of the CO2. Before actual
test scale plants have been built and optimized the uncertainties regarding the level of air
tightness in the oxy-fuel boiler and the actual level of CO2 purity in IGCC-CCS are
difficult to evaluate, which gives a larger overall uncertainty in economic evaluations
such as those presented above. Instead comparison of the different technologies should be
17
made focusing on the prospect of development and the evaluation of possible step change
reductions in operating costs due to the research that are currently going on.
Two flue gas pollutants that can prove to be conclusive when deciding on CCS-
technology are SOx and NOx. NO2 and SO2 forms heat stable salts with the amine solvent
MEA and a very intensive Flue Gas Desulphurization (FGD) is therefore necessary [8].
NO2 only account for a few percent of the NOx and the SO2 is therefore the crucial
component of the two. In contrast to this there is a possibility that FGD [3,23,24,30] and
Selective Catalytic Reduction (SCR) of NOx [3,30] may not be required for oxy-fuel
combustion. Because the NOx is recycled along with the flue gas into the boiler a
significant reduction of these components is taking place in the flame, and the
development of low-NOx burners specifically for oxy-fuel combustion therefore have a
great potential [8]. The possibility of omitting FGD depends on the level of sulphur in
the fuel and the tolerance level of the equipment [3,8]. If large amounts of SO2 are
contained in the recycled flue gas it may cause corrosion once further oxidized and
reacted with H2O to form H2SO4. Once the flue gas is captured it is expected that the SO2
[3,23,24] and the NOx [3] can be stored together with CO2. There are however possible
technical impacts that can affect the co-storage of the three gases. If calcium sulphates
are produced, i.e. in saline formations, the porosity and therefore the storage capacity will
be reduced [24]. The prospect of omitting the SCR-unit and the FGD-unit is something
that needs to be investigated further before conclusions can drawn but it provides an
important decrease in energy penalty for oxy-fuel combustion if possible. If these units
can not be omitted the prospect of a high primary reduction of NOx still proves promising
for the cost of the SCR.
1.2.1 Cost-Effectiveness of Air Separation
Air separation is a very costly part of IGCC-CCS and oxy-fuel combustion in particular
and this technology therefore deserves a section dedicated to its use and development
prospects. This section will not go into technical details for the variety of plant
configurations found in the literature but focus on general features that can be subjected
to economic optimizations.
18
The three ASU – technologies that have either a dominant role now or holds the greatest
promises for improvements are [31]:
• Cryogenic separation.
• Pressure Swing Adsorption (PSA).
• Membrane separation.
Cryogenic separation is the most used of the technologies today because it is capable of
producing high purity O2 in large amounts (> 3000 tons a day) and argon as a sellable by-
product [31]. Because cryogenic separation has been developing over the last four
decades a step increase in the process efficiency is not likely to take place even though
technical improvements, i.e. of compressors for inlet air compression and structured
packing for distillation, also in the future will reduce the cost of near pure O2 production
[32]. As an example of the efficiency improvement of cryogenic ASU’s the cost of low
pressure gaseous O2 measured as kWh/Nm3 went down 43 % from 0.67 in 1970 to 0.38
in 1985 but only 21 % over the next 15 years to 0.3 in 2000 [31]. In the same time
periods as mentioned before the capacity of the largest cryogenic separation plants went
up 127 % and 44 % respectively too a capacity of 3400 tonnes O2/day in 2000 [31]. This
shows that less decrease in production cost for each percent of increase in capacity were
gained in the period 1985 – 2000 compared to the period 1970 - 1985.
In PSA separation plants compressed air is passed through a vessel containing a selective
adsorbent. This adsorbent is usually zeolite molecular sieves when the desired product is
O2 [33]. When the zeolite becomes saturated with N2 the compressed air stream is
switched to another vessel with fresh adsorbent [31,33]. Because practical and financial
limitations exist when sizing the adsorption vessels an increase in plant capacity is made
by adding more vessels and therefore more zeolite. The only major target for economic
optimization in these plants is therefore the effectiveness of the adsorbent [31]. In this
field research has reduced the production cost of O2 by 50 % since the early 1990’ties
with the prospect of considerable economic improvements still to come [31]. It is
therefore possible that PSA can become attractive to use in CCS plants based on
19
gasification and oxy-fuel combustion though with the batch wise operation being a
possible concern.
The concept of polymeric membrane separation of gas mixtures is well known. As it is
normally the case the financial prospects in air separation using membranes depends on
the obtainable flux and selectivity of the membranes. Most of the polymeric membranes
for air separation are permeable to O2 with selectivity such that they can be used for
production of O2 enriched air [33]. It must however be mentioned that the use of
polymeric membranes in ASU’s is a concept newer than PSA and cryogenic separation
[33]. The simplicity of the process therefore makes it potentially attractable if
improvements in membrane performance can be achieved.
A type of membrane that holds promise is ITM’s. An ITM is a solid inorganic ceramic
membrane operating at high temperatures (1073 K – 1173 K) [32-34]. In this membrane
O2 is carried through as oxygen ions by a partial pressure difference [33]. To keep a high
O2 partial pressure difference across the membrane a sweep gas, e.g. recycled flue gas,
can be passed on the permeate side and the retentate side can be pressurized. This
separation concept is still developing but it is projected to reduce production costs by
more than 33 % when compared to cryogenic separation and reach compatible production
capacities within few years [32].
The purity of O2 in CCS is of great importance since any impurities will reduce the CO2
concentration in the plant flue gas thereby necessitating further treatment. The obtainable
purities for the technologies presented in this section can be seen in table 2.
Table 2 Obtainable purity of O2 for different methods of separation [33]. The purity shown in this table is not necessarily the most cost-effective and the price of O2 production between technologies is not the same. Process Purity of O2 Vol. %
Pressure Swing Adsorption ~ 95
Cryogenic Separation 99 <
Membrane (Polymeric) ~ 40
Membrane (ITM) 99 <
20
2 An Overview of Coal Combustion in an Oxy-Fuel Environment
This chapter will focus on three key aspects of oxy-fuel combustion namely, flame
stability and combustion temperature, devolatilization and char conversion. These
aspects, though interrelated, are crucial factors, the understanding of which, will
determine the success of oxy-fuel combustion as an industrial CO2 abatement technology.
Also treated in this chapter is NOx emission as this holds great promises of future savings
in oxy-fuel combustion especially if co-storage of NOx and CO2 is not possible. A
detailed discussion of literature findings should however not be expected as this chapter
only provides the reader with a technical overview covering some of the aspects of oxy-
fuel combustion that are currently subjects of research. Detailed discussions on specific
issues are taken in each of the articles included in this thesis in connection with the data
treatment they relate to.
2.1 Flame Stability and Combustion Temperature
When flue gas is recycled to act as diluting gas in the combustion process the physical
properties of the gas phase change significantly compared to air blown combustion. This
is illustrated in table 3 that shows relevant physical properties of N2 and CO2.
Table 3 Physical properties of N2 and CO2 at 1123 K and atmospheric pressure [124]. Species Density
[kg/m3]
Heat Capacity
[J/mol K]
Mass Diffusion Coefficient
of O2 in X [m2/s]
N2 0.244 34.18 1.7 · 104
CO2 0.383 57.83 1.3 · 104
Ratio N2/CO2 0.64 0.59 1.31
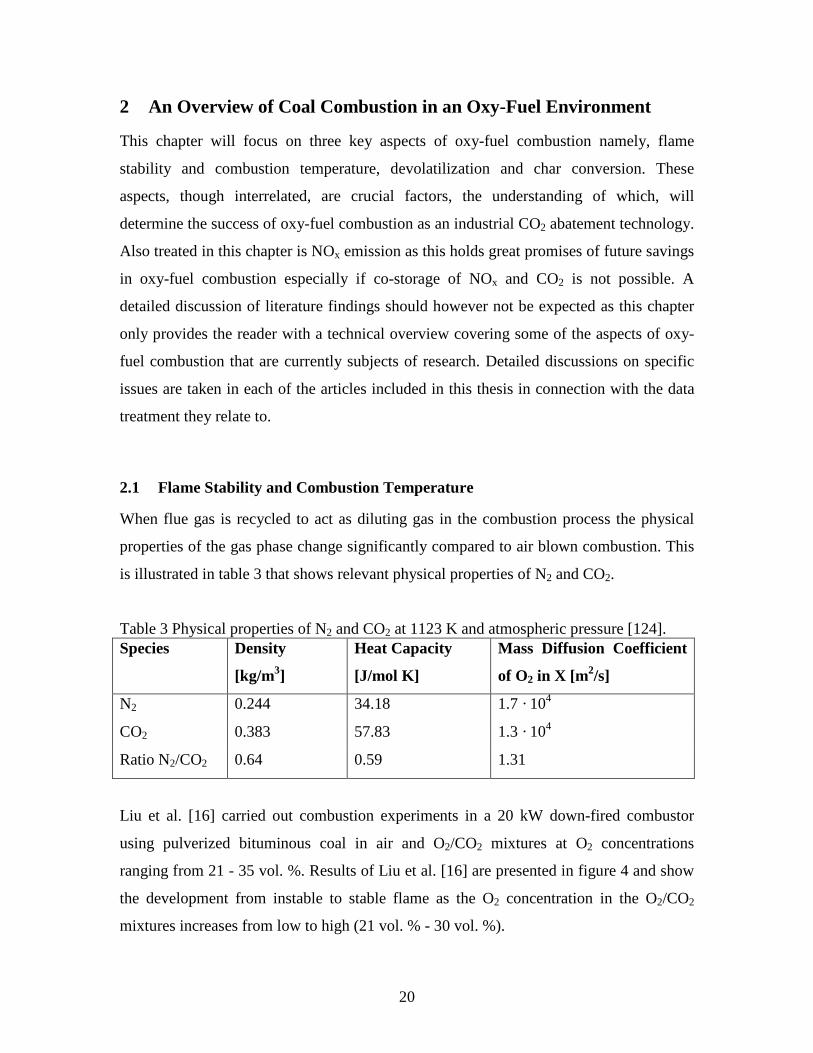
Liu et al. [16] carried out combustion experiments in a 20 kW down-fired combustor
using pulverized bituminous coal in air and O2/CO2 mixtures at O2 concentrations
ranging from 21 - 35 vol. %. Results of Liu et al. [16] are presented in figure 4 and show
the development from instable to stable flame as the O2 concentration in the O2/CO2
mixtures increases from low to high (21 vol. % - 30 vol. %).
21
Figure 4 Temperature profiles measured by Liu et al. [16]. 1st and 2nd refers to non-swirling primary gas used for coal transport and swirling secondary gas. Total stoichiometry is 1.2.
With a mixture composed of 30 vol. % O2 and 70 vol. % CO2 Liu et al. [16] obtain both a
stable flame and a reactor temperature profile similar to combustion in air. Their results
also shows that the instability experienced at 21 vol. % O2 in CO2 is not present when air
is used as primary gas (and N2 thereby reduces the over all heat capacity near the ignition
point in the flame), witnessing of the flame retarding effect of CO2 when it is present in
and near the flame at high concentrations.
Tan et al. [17] performed air blown and oxy-fuel combustion experiments in a vertical
flow combustor using pulverized coals of different rank. They observed a less bright and
more compact flame during oxy-fuel combustion than during air blown combustion. As
observed by Liu et al. [16] Tan et al. [17] observed flame instability at an O2
concentration of 21 vol. % and obtained flame stability, furnace temperatures and heat
fluxes only deviating slightly from air blown combustion at an O2 concentration between
28 - 35 vol. %. Similar results have been obtained by several authors [18,19,35,36].
Operating an oxy-fuel furnace at these conditions will however change burner
aerodynamics due to changes in momentum flux of the primary and secondary gases and
22
cause a more detached flame [36]. A stable turbulent flame has however been achieved at
21 vol. % O2 by Toporov et al. [28] using a strongly swirled secondary stream that
facilitates a strong internal recirculation of hot combustion products back into the flame
zone.
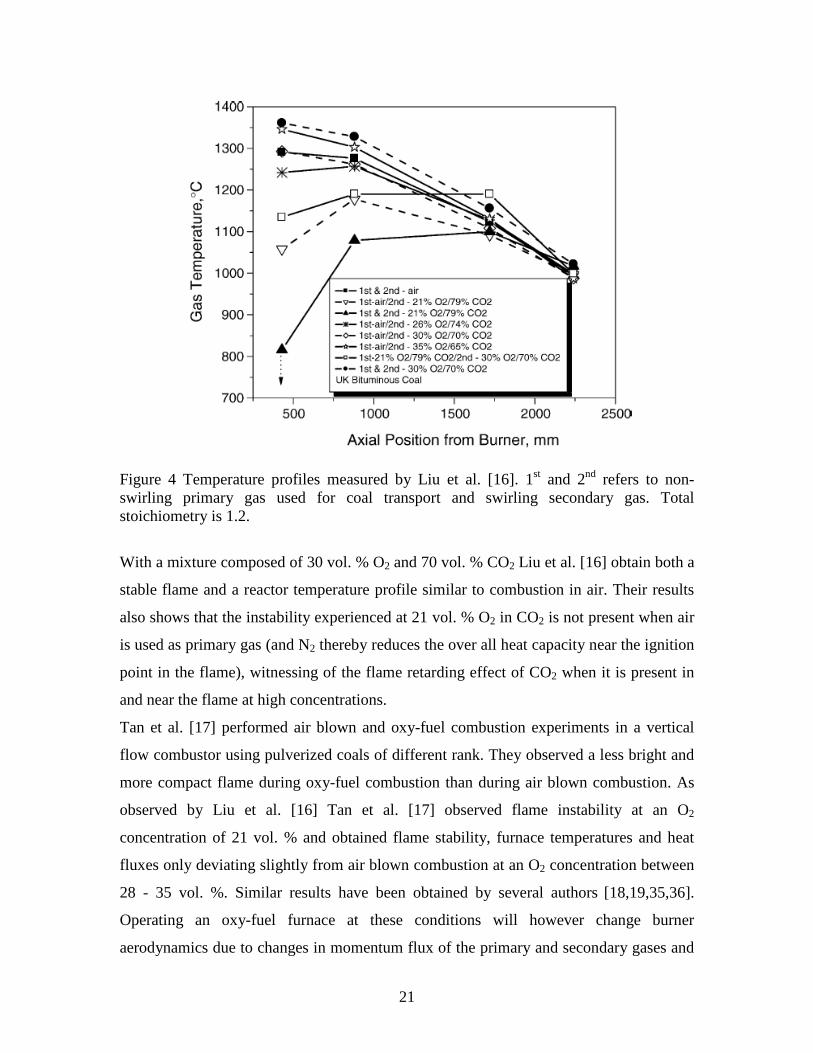
The instability experienced at the lower O2 concentrations can be explained by the lower
flame propagation speed with which pulverized coal clouds are ignited in CO2 compared
to N2. This is illustrated well in figure 5 where measurements of flame propagation speed
has been conducted using N2, CO2 or Ar as balance gas at different O2 concentrations
under microgravity. Figure 5 show that at approximately 30 vol. % O2 in CO2 a flame
speed is obtained that match that in air. This has been reproduced by Suda et al. [37] who
concluded that the difference in flame speed is caused mainly by the higher heat capacity
of CO2.
Figure 5 Flame propagation speeds measured by Kiga et al. [38] in a microgravity combustion chamber using a high volatile bituminous coal. Particle sizes are less than 74 μm.
From wire mesh reactor studies in air and O2/CO2 using brown coal and bituminous coal
as fuels Qiao et al. [39] found that the ignition temperature of char were approximately
1.5 - 5 % higher in O2/CO2 compared to O2/N2. Even lower increases in ignition
23
temperature of 0.5 - 2.5 % under suspension fired conditions were reported by Arias et al.
[40]. The ignition temperature in O2/CO2 decreased rapidly as the O2 concentration was
increased. Qiao et al. [39] included O2/Ar and O2/He mixtures, as well as air and O2/CO2,
and found that the increase in ignition temperature correlated well with an increase in
thermal conductivity. Conductivity could however not be the explanation for the
differences between air and O2/CO2 (CO2 and N2 have almost identical thermal
conductivities). The difference in ignition temperature between these gases was explained
by the authors using endothermic CO2-gasification.
Molina and Shaddix [35] found a delay in homogenous volatile ignition of a bituminous
coal between O2/N2 and O2/CO2 atmospheres. They used an Entrained Flow Reactor
(EFR) and explained their findings by an increased thermal sink in CO2, due to its higher
heat capacity and density, and by reduced mixing of the volatiles and gas caused by lower
diffusivities in CO2. The lower diffusivity of volatiles in CO2 is also expressed through a
more compact coal flame in oxy-fuel combustion [17,41] as discussed above.
From oxy-fuel and air blown combustion experiments in a 1.2 MW furnace using
bituminous coal Nozaki et al. [42] showed that directing a part of the O2 stream directly
through the burner via an injection lance, without increasing overall O2 concentration in
the furnace, had a stabilizing effect on the flame and resulted in a higher combustion
temperature. Their experiments also showed that a dry recycle increased the burner
temperature with 150 K. At a first glance this seems strange since the heat capacity of
H2O is significantly lower than that of CO2. Their findings therefore suggest that factors
such as radiation/absorption and endothermic radical formation, involving the O/H/OH
pool, dominate the temperature effect of H2O in the recycle.
When the gaseous environment changes from N2 based to CO2 based the radiation from
the gas phase changes as well towards higher emissivity and higher heat absorption.
Andersson et al. [43] did, however, conduct radiation intensity measurements in lignite
fired air and oxy-fuel flames and found that the replacement of N2 with CO2 only resulted
in slightly higher total radiation intensity at identical temperatures due to the large
contribution from particle radiation that reduced the effect of gaseous media. They found
though that wet recycle of the flue gas increases radiation intensity more than the increase
in CO2 partial pressure. This observation is in line with that of Nozaki et al. [42] since
24
higher radiation intensity will cause a higher heat loss. In an earlier study Andersson and
Johnsson [44] conducted measurements of radiation intensity in propane fired air and
oxy-fuel combustion. Here they found a much larger difference (~30 %) in total radiation
intensity between air and 27 vol. % O2 in CO2 at identical temperatures. Though partly
due to an increased soot particulate formation in the oxy-fuel case their findings show the
damping effect the presence of coal/char particles have on potential differences in overall
radiation when retrofitting from air-blown to oxy-fuel combustion.
2.2 Devolatilization, Volatile Combustion and Char Morphology
The process of devolatilization starts at temperatures around 473 K to 673 K where
hydrogen bonds are disrupted, water is evaporated and non-chemically bound molecules,
encapsulated in the coal structure, are transported to the particle surface. For coals with
high oxygen content crosslinking in the coal structure will also take place. After this
initial phase of devolatilization, primary devolatilization, where weak bonds in the coal
structure are thermally broken, starts. This results in the release of large organic
fragments that condenses, thereby forming char, or leaves the coal particle as tar [45-47].
During primary devolatilization functional groups in the coal such as alkyl groups,
hydroxyl groups and carboxy groups decomposes and release gaseous volatiles [45-47].
Also released during primary devolatilization are free radical groups such as CH2 and O
[47]. These radical groups have a major influence on the chemistry in the volatile flame
and are therefore important for e.g. NOx formation and destruction. After primary
devolatilization ends secondary devolatilization begins where more stable chemical
bonds such as those found in ether linkage, carbonyl groups and hetero-atoms are broken
[45,46]. Primary devolatilization is normally considered completed when the H2
evolution from depolymerization stops and ring rupture starts to produce HCN. The
distribution of volatile gaseous species is highly dependent on coal composition and
therefore rank and origin wherefore the description above is only qualitative. In general
the amount of gaseous volatiles decreases as the coal rank increases and the amount of tar
is highest for the intermediate coal ranks such as bituminous coals and low for both low
and high rank coals [47].
25
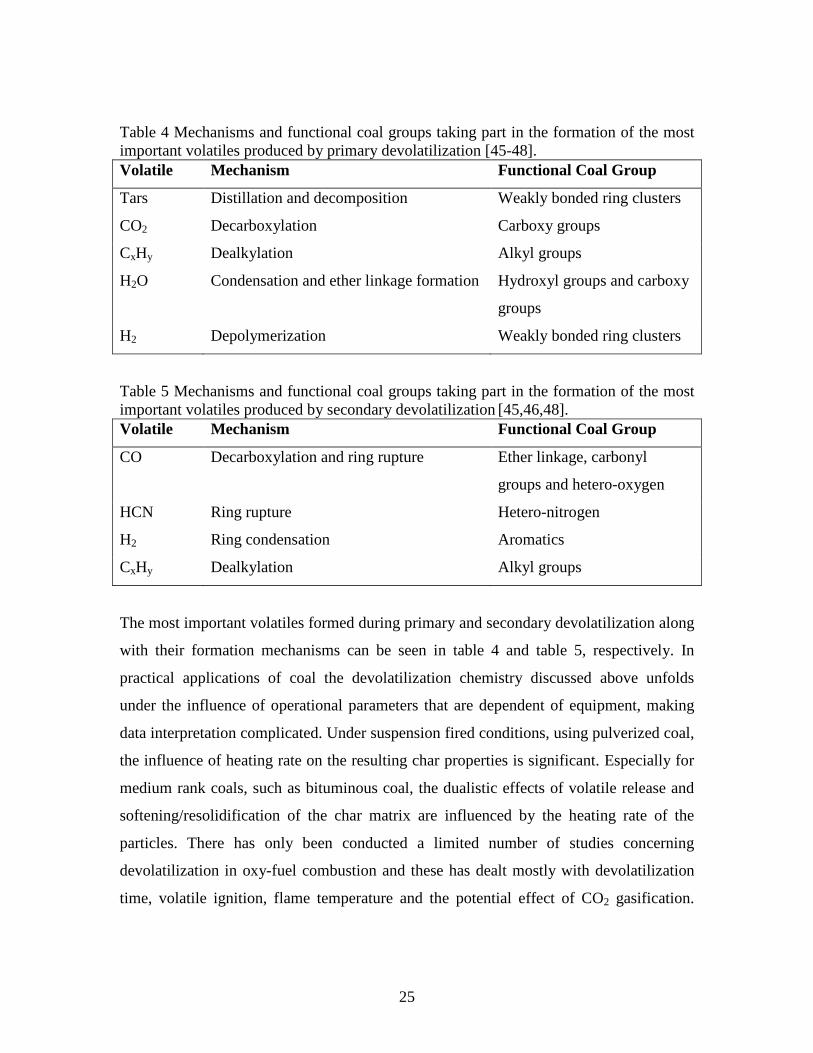
Table 4 Mechanisms and functional coal groups taking part in the formation of the most important volatiles produced by primary devolatilization [45-48]. Volatile Mechanism Functional Coal Group
Tars Distillation and decomposition Weakly bonded ring clusters
CO2 Decarboxylation Carboxy groups
CxHy Dealkylation Alkyl groups
H2O Condensation and ether linkage formation Hydroxyl groups and carboxy
groups
H2 Depolymerization Weakly bonded ring clusters
Table 5 Mechanisms and functional coal groups taking part in the formation of the most important volatiles produced by secondary devolatilization [45,46,48]. Volatile Mechanism Functional Coal Group
CO Decarboxylation and ring rupture Ether linkage, carbonyl
groups and hetero-oxygen
HCN Ring rupture Hetero-nitrogen
H2 Ring condensation Aromatics
CxHy Dealkylation Alkyl groups
The most important volatiles formed during primary and secondary devolatilization along
with their formation mechanisms can be seen in table 4 and table 5, respectively. In
practical applications of coal the devolatilization chemistry discussed above unfolds
under the influence of operational parameters that are dependent of equipment, making
data interpretation complicated. Under suspension fired conditions, using pulverized coal,
the influence of heating rate on the resulting char properties is significant. Especially for
medium rank coals, such as bituminous coal, the dualistic effects of volatile release and
softening/resolidification of the char matrix are influenced by the heating rate of the
particles. There has only been conducted a limited number of studies concerning
devolatilization in oxy-fuel combustion and these has dealt mostly with devolatilization
time, volatile ignition, flame temperature and the potential effect of CO2 gasification.
26
These first three subjects were treated in section 2.1 and the following will therefore
mostly focus on the influence of CO2 gasification.
In a single particle reactor Bejarano and Levendis [49] found, using a three-color
pyrometer, that the duration of the volatile flame from bituminous coal particles is
significantly longer in O2/CO2 mixtures than in O2/N2 mixtures at similar O2
concentrations and that the flame temperature is approximately 200 K lower
(Tfurnace=1400 K, dparticle = 45 – 63 um). The duration of the volatile flame becomes
similar when comparing an O2 concentration in N2 of 20 vol. % with one of 30 vol. % in
CO2. At these conditions the temperature of the volatile flames also becomes similar.
This observation is consistent with the observations on flame characteristics discussed in
section 2.1. Results by Molina and Shaddix [35], also obtained under single particle
conditions (Tfurnace=800 - 1250 K (non-isothermal reactor), dparticle = 106 – 125 um) using
bituminous coal, are somewhat contradictory in that they find no difference in the
duration of volatile combustion once initiated, only a delay in volatile ignition. A similar
delay in volatile ignition is found by Zhang et al. [50]. The disagreement could be due to
differences in particle size, though Bejarano and Levendis [49] obtained similar results
for a 75 – 90 um particle size fraction. It is not likely that the disagreement is due to a
difference in volatile content since the proximate analysis gives 33.5 wt. % and 34.9 wt.
% for the coals used by Bejarano and Molina, respectively. Probably it is due to
differences in heating rate and chemical composition of the volatile pool. As the mixing
of volatiles and O2 contribute significantly to the ignition delay in O2/CO2 due to lower
diffusion coefficients, differences in volatile species, and therefore mixing properties,
would be expected to influence ignition considerably.
Jamil et al. [51] used a wire-mesh reactor to pyrolyse a brown coal, both as raw coal,
demineralized coal and Na or Ca doped coal, in CO2 or He, using heating rates of 1 or
1000 K s-1, to peak temperatures up to 1173 K. They found that the tar yield was not
affected by the gaseous atmosphere but that significant gasification took place in CO2
causing an additional weight loss of up to 10 wt. %. Once a peak temperature of 1173 K
was reached the weight loss caused by gasification was however not significantly
affected by holding time at this temperature for raw- and demineralized coal. In the case
of alkali doped coals the gasification reaction did however primarily contribute during the
27
holding time. This could suggest that the catalytic properties of ash towards gasification
in the raw coal are reduced during pyrolysis, possibly by alkali evaporation or thermal
deactivation of catalytic sites.
The effect of CO2 gasification during devolatilization/pyrolysis is often discussed in the
literature. Several authors reports that gasification contributes to char consumption
[50,52-56] but several factors make it difficult to draw unambiguous conclusions. Firstly,
a number of the studies have been conducted using low rank coals [50,51,55,56], which is
known to be significantly more reactive than the medium rank coals used by other
authors [52,54,56]. Secondly, some of the studies are carried out using
ThermoGravimetric Analyzers (TGA) [52,54], which means that residence times are long
(minutes to hours) and heating rates are low making it difficult to extrapolate the findings
to industrial boiler operation. The studies carried out in flow reactors [50,53,55,56] use
residence times between 0.4 and 1 second, somewhat longer than the devolatilization
time of approximately 0.2 s in a boiler, and reports additional weight losses up to 25 wt.
%, presumably caused by CO2 gasification. This is a very significant contribution to over
all fuel conversion and it some what contradicts the effect of gasification observed during
char consumption with respect to reaction rate. The influence of gasification will be
further discussed in section 2.3 in the context of char consumption.
2.2.1 Development of Char Morphology during Devolatilization
Char development during devolatilization is important for the combustion process. It is
the morphology of the char, through its influence on pore structure, that determines its
combustion behavior comprising among others reaction rate and thereby particle
temperature as well as pore transport of reactant and product molecules such as O2, CO2
and NO. It is therefore imperative to examine the influence of devolatilization conditions
on the development of char morphology. In general the development of char morphology
is dependent on coal rank. This section will mainly focus on bituminous coal since this
rank is widely used in industrial power generation.
Bituminous coals being representative of medium rank coals exhibit fluidity and
softening when heated [47,57,58]. This fluidity is realized as a competition between bond
28
breaking reactions such as breakage of weakly bonded clusters and cross linking of
condensing molecular fractions. The low temperature cross linking found for low rank,
high oxygen containing coals, keep these coals from softening and the high aromatics,
low hydrogen containing, high rank coals does not contain sufficient amounts of e.g.
weakly bonded clusters to exhibit a softening behavior.
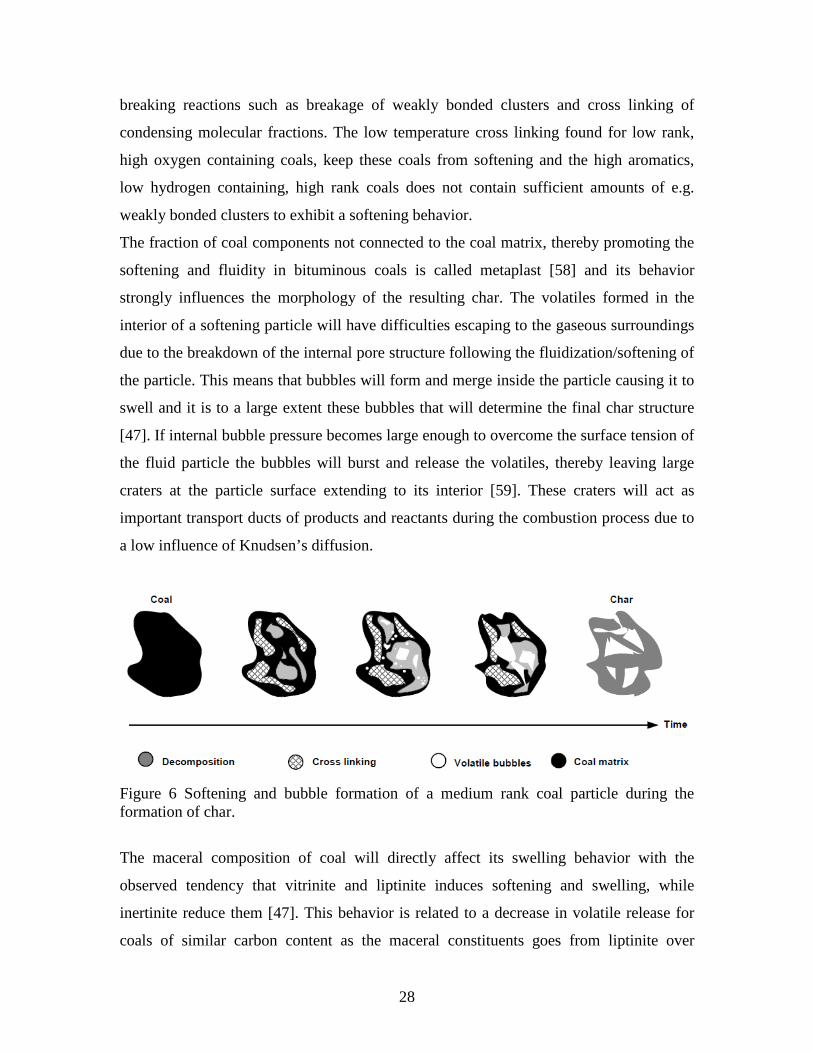
The fraction of coal components not connected to the coal matrix, thereby promoting the
softening and fluidity in bituminous coals is called metaplast [58] and its behavior
strongly influences the morphology of the resulting char. The volatiles formed in the
interior of a softening particle will have difficulties escaping to the gaseous surroundings
due to the breakdown of the internal pore structure following the fluidization/softening of
the particle. This means that bubbles will form and merge inside the particle causing it to
swell and it is to a large extent these bubbles that will determine the final char structure
[47]. If internal bubble pressure becomes large enough to overcome the surface tension of
the fluid particle the bubbles will burst and release the volatiles, thereby leaving large
craters at the particle surface extending to its interior [59]. These craters will act as
important transport ducts of products and reactants during the combustion process due to
a low influence of Knudsen’s diffusion.
Figure 6 Softening and bubble formation of a medium rank coal particle during the formation of char.
The maceral composition of coal will directly affect its swelling behavior with the
observed tendency that vitrinite and liptinite induces softening and swelling, while
inertinite reduce them [47]. This behavior is related to a decrease in volatile release for
coals of similar carbon content as the maceral constituents goes from liptinite over
29
vitrinite to inertinite [60]. The heating process for medium rank coals, responsible for
char creation, is illustrated in figure 6.
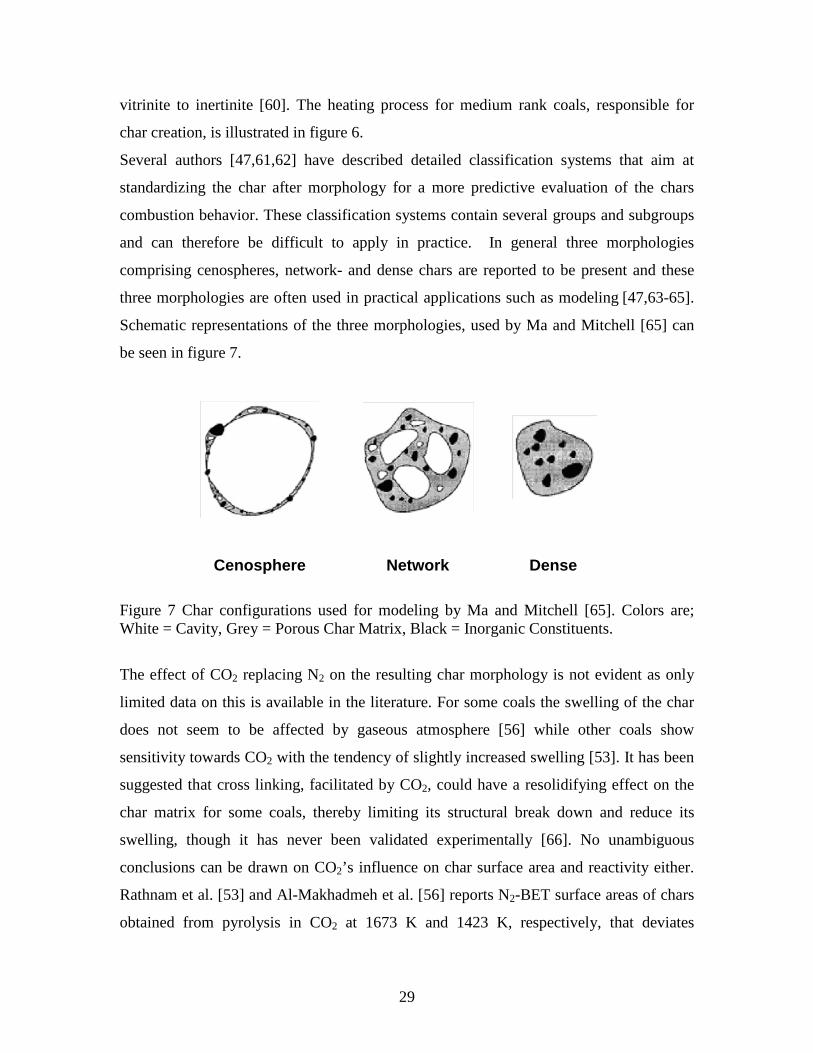
Several authors [47,61,62] have described detailed classification systems that aim at
standardizing the char after morphology for a more predictive evaluation of the chars
combustion behavior. These classification systems contain several groups and subgroups
and can therefore be difficult to apply in practice. In general three morphologies
comprising cenospheres, network- and dense chars are reported to be present and these
three morphologies are often used in practical applications such as modeling [47,63-65].
Schematic representations of the three morphologies, used by Ma and Mitchell [65] can
be seen in figure 7.
Cenosphere Network Dense
Figure 7 Char configurations used for modeling by Ma and Mitchell [65]. Colors are; White = Cavity, Grey = Porous Char Matrix, Black = Inorganic Constituents.
The effect of CO2 replacing N2 on the resulting char morphology is not evident as only
limited data on this is available in the literature. For some coals the swelling of the char
does not seem to be affected by gaseous atmosphere [56] while other coals show
sensitivity towards CO2 with the tendency of slightly increased swelling [53]. It has been
suggested that cross linking, facilitated by CO2, could have a resolidifying effect on the
char matrix for some coals, thereby limiting its structural break down and reduce its
swelling, though it has never been validated experimentally [66]. No unambiguous
conclusions can be drawn on CO2’s influence on char surface area and reactivity either.
Rathnam et al. [53] and Al-Makhadmeh et al. [56] reports N2-BET surface areas of chars
obtained from pyrolysis in CO2 at 1673 K and 1423 K, respectively, that deviates
30
between -88 % to 48 % from the surface areas of chars obtained from pyrolysis in N2 at
the same conditions. The coals used by Rathnam et al. [53] and Al-Makhadmeh et al. [56]
range from low to medium rank. For some chars visual differences, seen by Scanning
Electron Microscopy (SEM), have been reported [53,55] and for others no differences
have been seen [56]. Some authors contribute these visual differences to partial
gasification of the char surface [53,55].
The effect of heating rate on swelling and char structure is significant and not linear and
the different thermal properties of N2 and CO2 therefore present a potential cause of
differences in char structure at non-isothermal conditions. At heating rates below
approximately 103 K s-1, depending on the maceral composition of the coal, the swelling
is reported to increase [67]. When heating rate increases to above 104 K s-1 the swelling
declines from its maximum level and so does particle porosity [67].
2.3 Char Conversion
The heart of the combustion process in both air blown and oxy-fuel combustion is the
fuel conversion. The conversion takes place through volatile and char combustion and the
implications of an O2/CO2 environment on these reaction pathways are therefore crucial.
Devolatilization and volatile combustion was discussed in sections 2.1 and 2.2 wherefore
this section will focus on the thermal conversion of char.
Alterations in the rate of char consumption will change the heat release from
heterogeneous combustion and therefore the heat transfer in the boiler. In addition to
changes in heat transfer there is also a risk of poorer fuel utilization. As an important
feature of oxy-fuel combustion is the possibility of retrofitting existing air blown plants it
is therefore important not only to elucidate differences between O2/N2 and O2/CO2 char
conversion but also to match the burnout and conversion profile of air blown plants.
Várhegyi et al. [68] conducted TGA experiment on bituminous- and lignite chars in
O2/CO2 and O2/Ar environments. The chars were prepared by heating to 1223 K at a
heating rate of 10 K min-1. A size fraction of 120 – 200 μm were then used for
experiments carried out with O2 concentrations between 5 and 100 vol. % using heating
rates of 10, 20, 25 and 50 K min-1 to a peak temperature of 1173 K. Várhegyi et al. [68]
31
concluded that the presence of high concentrations of CO2 did not affect the char
conversion rate due the low gasification rate compared to the char-O2 reaction rate. This
conclusion is supported by other authors working under similar conditions [53,69,70].
Authors that report differences in TGA conversion rate between O2/N2 and O2/CO2 often
operate under the influence of diffusion control making conclusions on intrinsic kinetics
difficult [52,55].
From Drop Tube Furnace (DTF) experiments at 1673 K Rathnam et al. [53] found
increased burnouts of up to 5 percentage points for four different coals in O2/CO2
compared to O2/N2. As the O2 concentration was increased from 5 to 15 vol. % this
difference did however vanish. As discussed in section 2.2 Rathnam et al. [53] also
carried out DTF pyrolysis at the same conditions with the same coals and here they saw
an increase in volatile yield between 1.3 and 12.7 percentage points when CO2 was used
instead of N2. There is no obvious connection between a high additional weight loss
during pyrolysis and combustion in the experiments of Rathnam et al. [53]. This makes it
difficult to conclude on the effect of CO2 gasification as other factors may play a role in
the weightloss during pyrolysis (see section 2.2) and transport phenomena likely
influence the char conversion rate during combustion. Opposite to the findings of
Rathnam et al. [53] Arias et al. [40] saw a 2 – 5 percentage point decrease in char
conversion when bituminous coal was burned in an EFR at 21 vol. % O2 in CO2
compared to combustion in N2, which was also found by Liu et al. [16,71], Li et al. [55]
and Wang et al. [19] under similar conditions.
Al-Makhadmeh et al. [56] conducted experiments under suspension fired conditions at
1573 K at 5 and 15 vol. % O2 in N2 or CO2 using a lignite- and a bituminous char. At 5
vol. % O2 they found no differences in char conversion rate between O2/CO2 and O2/N2
whereas conversion was faster in O2/N2 at 15 vol. % O2. This could be due to the high
fuel load used by the authors, which causes high gas temperatures. At 15 vol. % O2,
where combustion is fierce, the difference in heat capacity between N2 and CO2 could
lower the gas temperature in CO2 (see section 2.1) and cause a lower conversion rate.
Zhang et al. [50] found that the conversion rate of brown coal in a DTF was nearly the
same at 21 vol. % O2 in N2 or CO2 at 1273 K but that the initial conversion rate was
lowered in O2/CO2 compared to O2/N2 when combustion took place at 1073 K. They
32
attributed this to an enhanced effect of CO2 gasification at the higher temperature. Zhang
et al. [50] came to a similar conclusion on bituminous coal combustion, though the effect
of gasification was found to be less pronounced [72]. Measurements of dynamic
conversion profiles in O2/N2 and O2/CO2, such as those of Al-Makhadmeh et al. [56] and
Zhang et al. [50], are rare and more is needed for a thorough evaluation of conversion
rate at industrially relevant conditions.
Observations of particle combustion temperature in O2/CO2 mixtures compared to O2/N2
mixtures were made by Bejarano and Levendis [49] who measured the burning
temperature of bituminous- and lignite char particles in the two different gaseous
environments using a three-color pyrometer under single particle conditions. At
equivalent O2 concentrations the burning temperature was always lower for chars burning
in the O2/CO2 environment by around 200 – 120 K depending on the fuel. As discussed
in section 2.2 the authors found that longer time was needed for volatile combustion in
the CO2 environment but they also found longer char burn out times exceeding the time
delay arising from the devolatilization. This suggests a delayed heterogeneous ignition,
which is supported by data from Molina and Shaddix [35].
2.3.1 Modeling Char Conversion
When heterogeneous char conversion is to be modeled several aspects must be taken into
consideration. A structural model, describing the evolution of density and size of the
particles during reaction, must be established. Transport of reactants and products, both
in the stagnant gas film layer surrounding a particle and in the particles interior, must be
adequately described. It is also important for a trustworthy model that the char conversion
rate is accurately determined. Heat transfer between the particle and its surroundings
must also be accounted for as both char conversion rate and transport phenomena are
highly dependent on temperature.
The construction of a structural model for the particles during the combustion process
stems from the discussion on morphology in section 2.2.1. As char is not homogeneous
detailed models therefore considers the char to consist of different morphologies [63-65].
A variety of equations, describing particle mass balances, can be encountered in the
33
literature all arising from the assumptions made by the modeler. These equations will not
be treated here but they can be found many places in the literature e.g. [73-75]. Here a
discussion will instead be taken on universal aspects of char combustion that must be
accounted for by the modeler and how these are often accommodated.
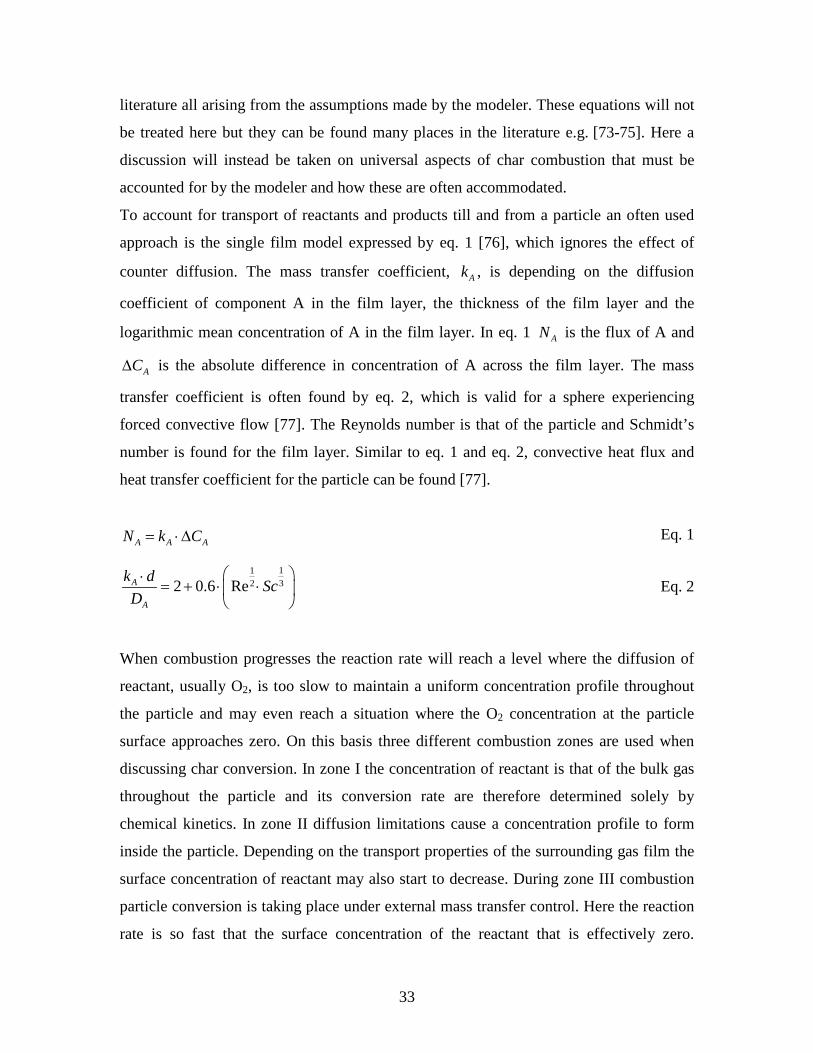
To account for transport of reactants and products till and from a particle an often used
approach is the single film model expressed by eq. 1 [76], which ignores the effect of
counter diffusion. The mass transfer coefficient, Ak , is depending on the diffusion
coefficient of component A in the film layer, the thickness of the film layer and the
logarithmic mean concentration of A in the film layer. In eq. 1 AN is the flux of A and
AC∆ is the absolute difference in concentration of A across the film layer. The mass
transfer coefficient is often found by eq. 2, which is valid for a sphere experiencing
forced convective flow [77]. The Reynolds number is that of the particle and Schmidt’s
number is found for the film layer. Similar to eq. 1 and eq. 2, convective heat flux and
heat transfer coefficient for the particle can be found [77].
A A AN k C= ⋅∆ Eq. 1
11322 0.6 ReA
A
k d ScD
⋅= + ⋅ ⋅
Eq. 2
When combustion progresses the reaction rate will reach a level where the diffusion of
reactant, usually O2, is too slow to maintain a uniform concentration profile throughout
the particle and may even reach a situation where the O2 concentration at the particle
surface approaches zero. On this basis three different combustion zones are used when
discussing char conversion. In zone I the concentration of reactant is that of the bulk gas
throughout the particle and its conversion rate are therefore determined solely by
chemical kinetics. In zone II diffusion limitations cause a concentration profile to form
inside the particle. Depending on the transport properties of the surrounding gas film the
surface concentration of reactant may also start to decrease. During zone III combustion
particle conversion is taking place under external mass transfer control. Here the reaction
rate is so fast that the surface concentration of the reactant that is effectively zero.
34
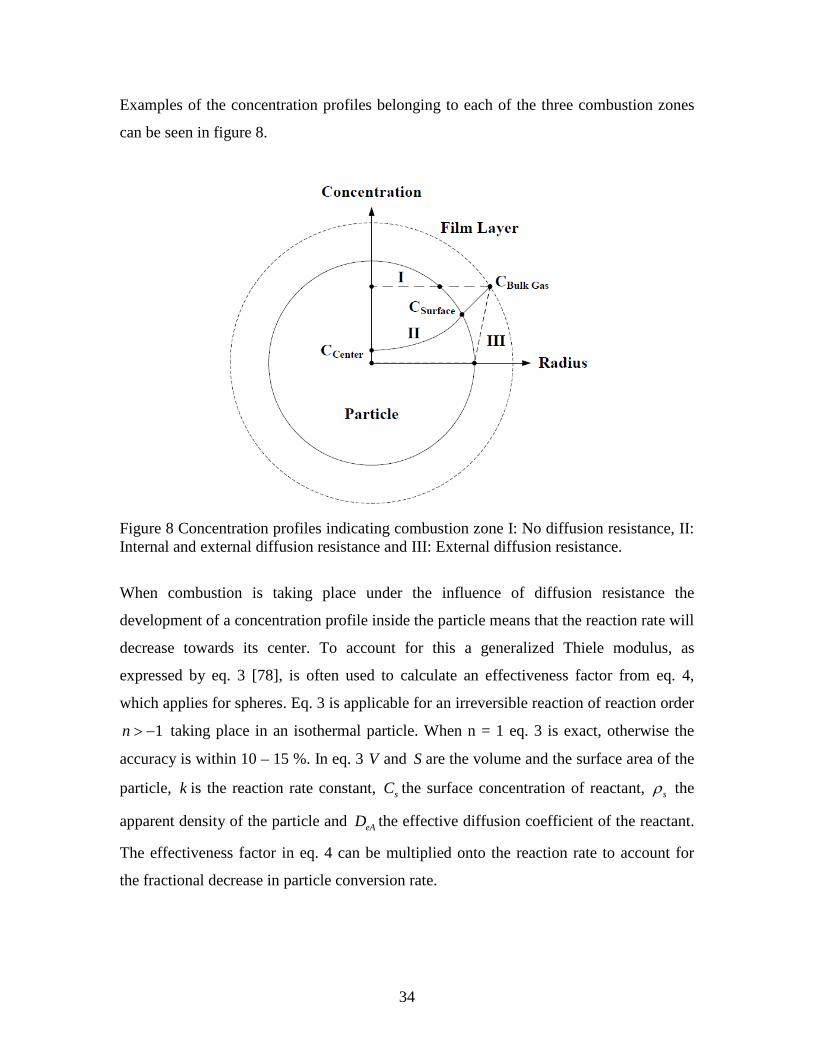
Examples of the concentration profiles belonging to each of the three combustion zones
can be seen in figure 8.
Figure 8 Concentration profiles indicating combustion zone I: No diffusion resistance, II: Internal and external diffusion resistance and III: External diffusion resistance.
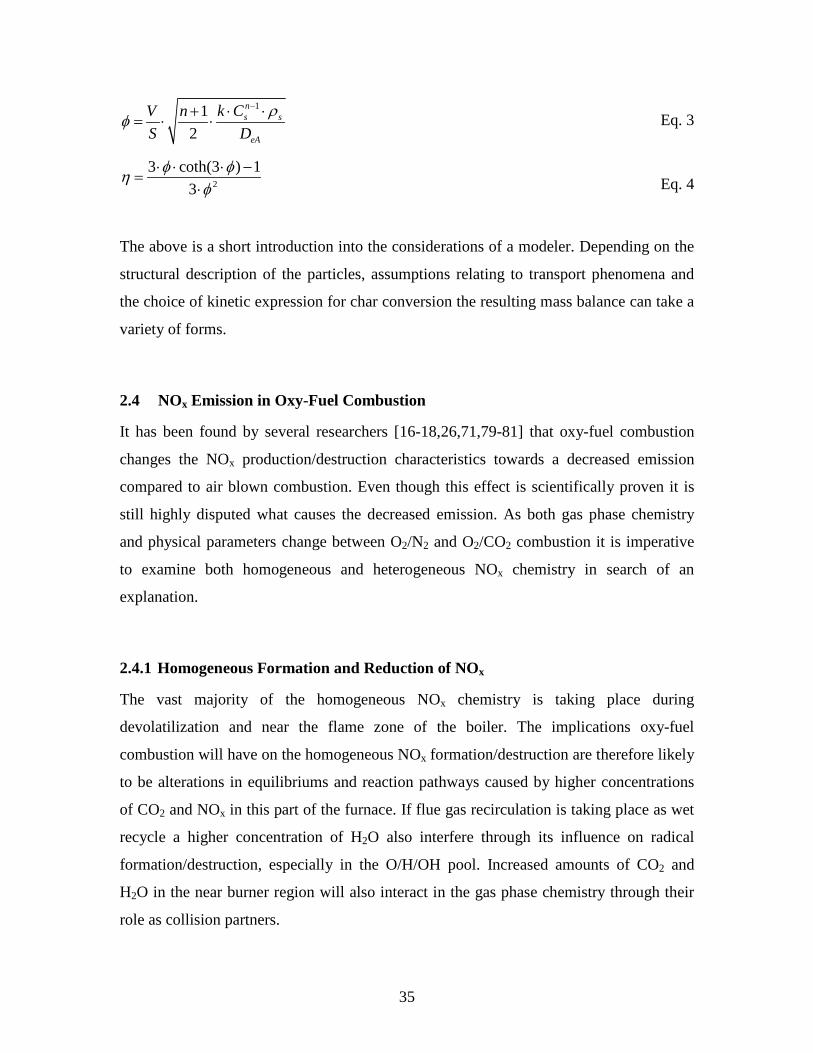
When combustion is taking place under the influence of diffusion resistance the
development of a concentration profile inside the particle means that the reaction rate will
decrease towards its center. To account for this a generalized Thiele modulus, as
expressed by eq. 3 [78], is often used to calculate an effectiveness factor from eq. 4,
which applies for spheres. Eq. 3 is applicable for an irreversible reaction of reaction order
1n > − taking place in an isothermal particle. When n = 1 eq. 3 is exact, otherwise the
accuracy is within 10 – 15 %. In eq. 3 V and S are the volume and the surface area of the
particle, k is the reaction rate constant, sC the surface concentration of reactant, sρ the
apparent density of the particle and eAD the effective diffusion coefficient of the reactant.
The effectiveness factor in eq. 4 can be multiplied onto the reaction rate to account for
the fractional decrease in particle conversion rate.
35
112
ns s
eA
k CV nS D
ρφ−⋅ ⋅+
= ⋅ ⋅
Eq. 3
2
3 coth(3 ) 13
φ φηφ
⋅ ⋅ ⋅ −=
⋅
Eq. 4
The above is a short introduction into the considerations of a modeler. Depending on the
structural description of the particles, assumptions relating to transport phenomena and
the choice of kinetic expression for char conversion the resulting mass balance can take a
variety of forms.
2.4 NOx Emission in Oxy-Fuel Combustion
It has been found by several researchers [16-18,26,71,79-81] that oxy-fuel combustion
changes the NOx production/destruction characteristics towards a decreased emission
compared to air blown combustion. Even though this effect is scientifically proven it is
still highly disputed what causes the decreased emission. As both gas phase chemistry
and physical parameters change between O2/N2 and O2/CO2 combustion it is imperative
to examine both homogeneous and heterogeneous NOx chemistry in search of an
explanation.
2.4.1 Homogeneous Formation and Reduction of NOx
The vast majority of the homogeneous NOx chemistry is taking place during
devolatilization and near the flame zone of the boiler. The implications oxy-fuel
combustion will have on the homogeneous NOx formation/destruction are therefore likely
to be alterations in equilibriums and reaction pathways caused by higher concentrations
of CO2 and NOx in this part of the furnace. If flue gas recirculation is taking place as wet
recycle a higher concentration of H2O also interfere through its influence on radical
formation/destruction, especially in the O/H/OH pool. Increased amounts of CO2 and
H2O in the near burner region will also interact in the gas phase chemistry through their
role as collision partners.
36
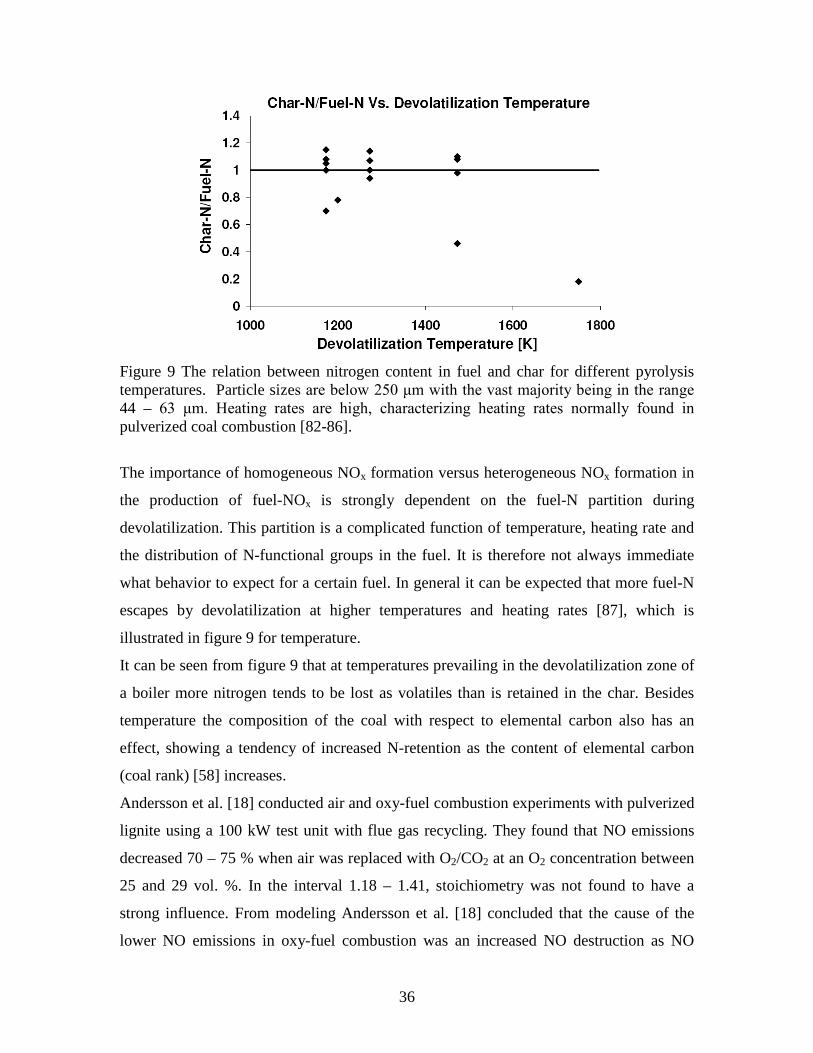
Figure 9 The relation between nitrogen content in fuel and char for different pyrolysis temperatures. Particle sizes are below 250 μm with the vast majority being in the range 44 – 63 μm. Heating rates are high, characterizing heating rates normally found in pulverized coal combustion [82-86].
The importance of homogeneous NOx formation versus heterogeneous NOx formation in
the production of fuel-NOx is strongly dependent on the fuel-N partition during
devolatilization. This partition is a complicated function of temperature, heating rate and
the distribution of N-functional groups in the fuel. It is therefore not always immediate
what behavior to expect for a certain fuel. In general it can be expected that more fuel-N
escapes by devolatilization at higher temperatures and heating rates [87], which is
illustrated in figure 9 for temperature.
It can be seen from figure 9 that at temperatures prevailing in the devolatilization zone of
a boiler more nitrogen tends to be lost as volatiles than is retained in the char. Besides
temperature the composition of the coal with respect to elemental carbon also has an
effect, showing a tendency of increased N-retention as the content of elemental carbon
(coal rank) [58] increases.
Andersson et al. [18] conducted air and oxy-fuel combustion experiments with pulverized
lignite using a 100 kW test unit with flue gas recycling. They found that NO emissions
decreased 70 – 75 % when air was replaced with O2/CO2 at an O2 concentration between
25 and 29 vol. %. In the interval 1.18 – 1.41, stoichiometry was not found to have a
strong influence. From modeling Andersson et al. [18] concluded that the cause of the
lower NO emissions in oxy-fuel combustion was an increased NO destruction as NO
37
formation was found to be slightly higher than in air. It was found that the inverse
Zeldovich mechanism, R 1 - R 3, contributes significantly to NO reduction at high
temperatures.
2O N NO N+ + R 1
2N O NO O+ + R 2
N OH NO H+ + R 3
Glarborg and Bentzen [88] performed experiments in O2/N2 and O2/CO2 using CH4 as
fuel. The temperature interval investigated was 1200 – 1800 K. Peak CO concentrations
were found to increase in O2/CO2 by a factor 4 - 19 compared to O2/N2 across the
temperature interval [88]. This increase was found, primarily, to be due to reaction R 4
though reaction between CH4 and methylene radicals (CH2) contributed to some extent.
2CO H CO OH+ + R 4
The implications of reaction R 4 do not only concern the formation of CO. Mendiara and
Glarborg [91] found that a high CO2 concentration enhanced NO formation from NH3
under reducing conditions while it inhibited NO formation at stoichiometric and lean
conditions. Giménez-López et al. [92] found that an oxy-fuel atmosphere inhibited the
oxidation of HCN under reducing, stoichiometric and oxidizing atmospheres at
temperatures prevailing in an industrial boiler. Mendiara and Glarborg [91] and Giménez-
López et al. [92] explained the effect of CO2 with an alteration of the O/H/OH radical
pool caused by reaction R 4 where CO2 competes with molecules such as O2 for atomic
hydrogen. That a change in O/H/OH radical pool indeed does alter the NO formation
chemistry is seen in figure 10 that shows the main reaction pathways for HCN and NH3
oxidation reported in the literature [93-95].
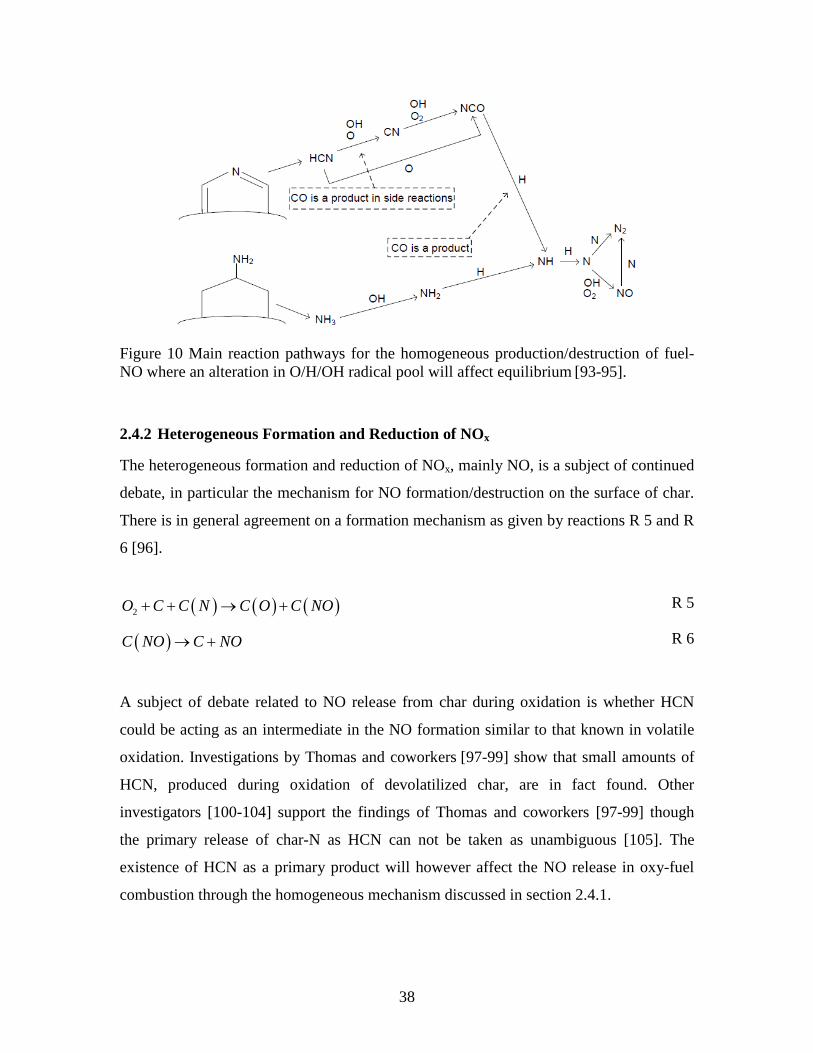
38
Figure 10 Main reaction pathways for the homogeneous production/destruction of fuel-NO where an alteration in O/H/OH radical pool will affect equilibrium [93-95].
2.4.2 Heterogeneous Formation and Reduction of NOx
The heterogeneous formation and reduction of NOx, mainly NO, is a subject of continued
debate, in particular the mechanism for NO formation/destruction on the surface of char.
There is in general agreement on a formation mechanism as given by reactions R 5 and R
6 [96].
( ) ( ) ( )2O C C N C O C NO+ + → + R 5
( )C NO C NO→ + R 6
A subject of debate related to NO release from char during oxidation is whether HCN
could be acting as an intermediate in the NO formation similar to that known in volatile
oxidation. Investigations by Thomas and coworkers [97-99] show that small amounts of
HCN, produced during oxidation of devolatilized char, are in fact found. Other
investigators [100-104] support the findings of Thomas and coworkers [97-99] though
the primary release of char-N as HCN can not be taken as unambiguous [105]. The
existence of HCN as a primary product will however affect the NO release in oxy-fuel
combustion through the homogeneous mechanism discussed in section 2.4.1.
39
The switch from N2 to CO2 itself changes the primary release products to the extent CO2
gasification is taking place (see sections 2.2 and 2.3). Park et al. [106] investigated
nitrogen release from pulverized bituminous coal char during the reaction with O2, CO2
and H2O using Ar as carrier gas. Their experiments showed that an increased
concentration of CO2 moved the selectivity towards lower release ratios of char-N to NO.
In contrast to gasification with H2O no HCN or NH3 were measured when CO2 was used
as reactant. These findings are of interest for the case of oxy-fuel combustion because
they prove that increasing concentrations of CO2 actively interferes with the NO
formation through the suppression of it and its precursors. It will however be the char-O2
reaction that determines how the majority of char-N is released.
Even though most researchers agree on the direct oxidation of char nitrogen through a
path equivalent or similar to reactions R 5 - R 6 there are still a wide dispute as to how
the heterogeneous NO reduction over the char is taking place. With respect to
determination of reaction kinetics, comparison between different chars are made
complicated by the proven catalytic effect that especially alkali metals have on the NO-
char reaction [107-111], the different experimental conditions employed by the
researchers and the distribution of nitrogen functionalities found in different chars.
Therefore an actual kinetic comparison of the different expressions found in the literature
is not made here and focus is kept on mechanistic features of surface reactions.
Since most of the mechanistic studies on the heterogeneous formation and destruction of
NO have been conducted under N2, Ar or He atmospheres this section will mostly present
the findings from these studies. The potential effects of high concentrations of CO2 will
be evaluated through comparison with oxy-fuel studies reported in the literature.
Levy et al. [112] suggested the heterogeneous reduction mechanism for NO on char
shown in reactions R 7 - R 10. The authors based this mechanism on experiments
performed in a laminar flow furnace at 1250 K and 1750 K with He as the main gas.
Reaction R 10 suggests an enhancing effect of CO, which was indeed found by the
authors [112]. The enhancing effect of CO has been confirmed by other authors under
different conditions [113-115] although not all of these authors contribute the
enhancement to reaction R 10. The effect of CO has been found to decrease with
increasing temperature [112,115].
40
The first step of the reaction sequence in R 7 - R 10 is the adsorption and following
dissociation of NO on the char surface. This reaction step is generally accepted and it
therefore forms the basis for almost all mechanisms found in the literature [116-120].
( ) ( )2NO C C N C O+ → + R 7
( ) ( ) 2 2C N C N N C+ → + R 8
( )C O CO→ R 9
( ) 2C O CO CO C+ → + R 10
The reaction between NO and char have been found to exhibit clear two regime behavior
where initially desorption of surface oxides is believed to control the reduction up until
approximately 873 - 1073 K after which the reaction becomes chemisorption controlled
[113,121]. Figure 11 shows the reactivity of NO over three different carbon samples.
From the figure it can be seen that the two regime behavior is only present for
experiments without CO and that the reactivity of NO without CO present approaches
that with CO present as the temperature increases. It is therefore surprising that Levy et
al. [112] observed the enhancing effect of CO, though small, at temperatures as high as
1750 K. This observation can be due to the relatively high CO concentration of 1.4 %
used by Levy et al. [112] compared to values between 100 and 4000 ppm used in many of
the literature studies. In oxy-fuel combustion CO concentrations are higher than in air
blown combustion by a factor of 2-3 [16,79,122], exceeding the 1.4 vol. % of Levy et al.
[112], depending on stoichiometry and reactor position, and CO could therefore have a
positive effect on NO reduction in oxy-fuel combustion even at high temperatures.
Aarna and Suuberg [114] found that the addition of CO to the NO-char reaction in a fixed
bed reactor at 1073 K enhanced the reaction rate instantaneously to a level exceeding that
of a clean char surface (i.e. without oxide complexes) and suggested that a parallel
surface catalyzed reaction, R 11, is taking place and that the stripping of oxide complexes
may not be the governing enhancing effect of CO. R 11 is suggested several places in the
literature [113,118-120,123].
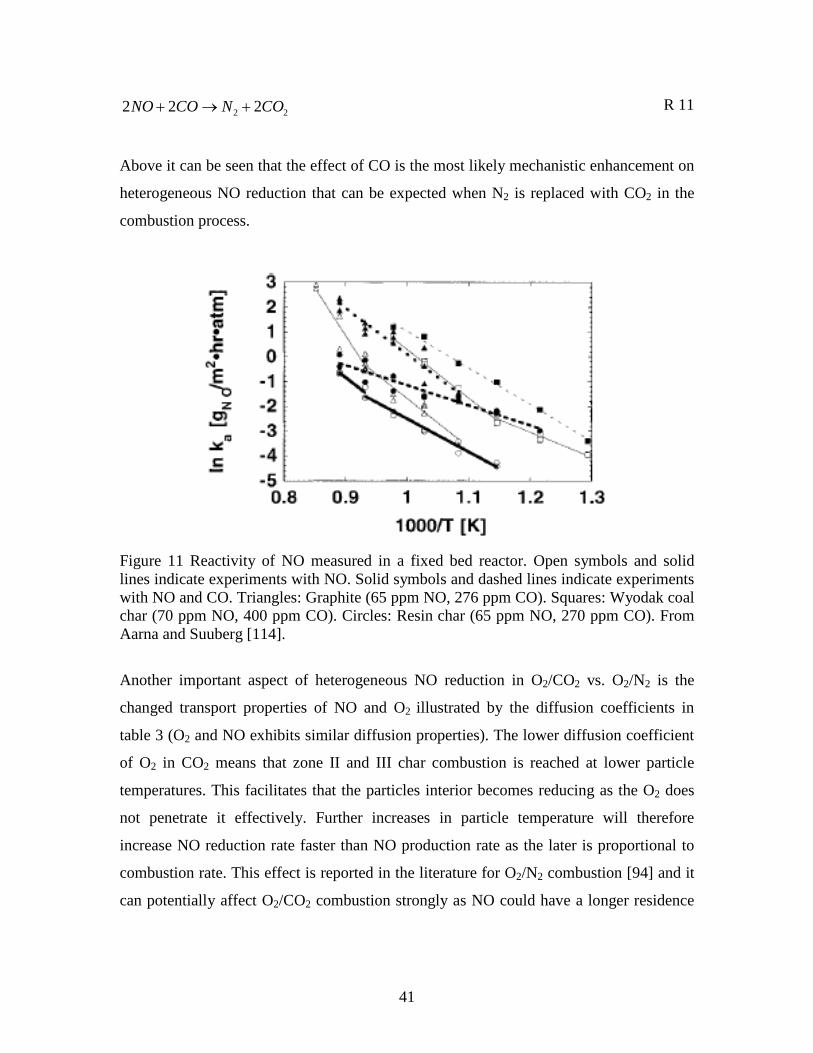
41
2 22 2 2NO CO N CO+ → + R 11
Above it can be seen that the effect of CO is the most likely mechanistic enhancement on
heterogeneous NO reduction that can be expected when N2 is replaced with CO2 in the
combustion process.
Figure 11 Reactivity of NO measured in a fixed bed reactor. Open symbols and solid lines indicate experiments with NO. Solid symbols and dashed lines indicate experiments with NO and CO. Triangles: Graphite (65 ppm NO, 276 ppm CO). Squares: Wyodak coal char (70 ppm NO, 400 ppm CO). Circles: Resin char (65 ppm NO, 270 ppm CO). From Aarna and Suuberg [114].
Another important aspect of heterogeneous NO reduction in O2/CO2 vs. O2/N2 is the
changed transport properties of NO and O2 illustrated by the diffusion coefficients in
table 3 (O2 and NO exhibits similar diffusion properties). The lower diffusion coefficient
of O2 in CO2 means that zone II and III char combustion is reached at lower particle
temperatures. This facilitates that the particles interior becomes reducing as the O2 does
not penetrate it effectively. Further increases in particle temperature will therefore
increase NO reduction rate faster than NO production rate as the later is proportional to
combustion rate. This effect is reported in the literature for O2/N2 combustion [94] and it
can potentially affect O2/CO2 combustion strongly as NO could have a longer residence
42
time in the particle. It is however a task for detailed modeling to quantify this effect
during oxy-fuel combustion.
3 Conclusions on the Literature
If coal is to be kept as a feedstock for energy generation in a carbon constrained world
CCS technology will have to be utilized. Among the CCS-technologies, closest to
industrialization, oxy-fuel combustion is a promising candidate for use in areas with
available storage sites. The price of CO2 capture in oxy-fuel combustion is still uncertain
as technical aspects such as possible plant size, O2 purity requirement, degree of N2-
leakage into the boiler, CO2 purity requirements for transport and storage and the price
and feasibility of O2 production in very large scale have not been elucidated. The
prospect of co-storage of NOx, SOx and CO2 offer savings in plant construction and
operation but for oxy-fuel combustion to stand out markedly compared to e.g. post-
combustion capture and IGCC’s a step reduction in O2 production cost must be made.
This is likely to take place through technological improvements of the unit operations in
cryogenic plants, the introduction of upcoming technologies, such as membrane
separation, at an industrial scale or the lowering of O2 purity requirements.
From several literature investigations it was found that boiler temperature profiles similar
to air-blown combustion can be obtained in oxy-fuel combustion using inlet O2
concentrations of 28 – 35 vol. %. During normal burner operation at O2 concentrations
close to that in air, oxy-fuel combustion will produce an unstable flame not suited for
continues boiler operation. Experiments does however show that by changing burner
configuration and inducing a strong internal recirculation in the boiler it is possible to
achieve stable flames at O2 concentrations similar to that in air. During stable combustion
at similar O2 concentrations O2/CO2 environments will give lower gas and particle
temperatures, slower ignition and volatile combustion and possibly slightly longer
burnout times than combustion in O2/N2. The effect of CO2 gasification is not clear from
literature experiments. While some authors find a strong contribution from CO2
gasification to fuel conversion results of others question this. There does not seem to be a
strong correlation between observed CO2 gasification during devolatilization and
43
subsequent char conversion. There exists a strong need for dynamic char conversion
profiles, obtained under industrial condition in O2/CO2 and O2/N2, for the evaluation of
fuel conversion in oxy-fuel combustion.
The NO emission from coal combustion is significantly affected by the change from N2
to CO2 based combustion. The NO gas phase chemistry is especially affected by the
competition with CO2 for atomic hydrogen, which affects the O/H/OH radical pool and
inhibits the oxidation of HCN and NH3. The inverse Zeldovich mechanism may also play
a role through NO reduction at high gas phase temperature.
Heterogeneous reduction of NO over char is mostly affected by the higher concentration
of CO in O2/CO2 compared to O2/N2 combustion, possibly by the removal of oxygen
surface complexes or by direct surface catalyzed reduction. The lower diffusion
coefficient of O2 in CO2 compared to N2 may cause an enhanced NO reduction due to
longer residence times of NO in the particles.
44
4 Abbreviations
ASU Air Separation Unit
CCS Carbon, Capture and Storage
COE Cost Of Electricity
DTF Drop Tube Furnace
EFR Entrained Flow Reactor
EOR Enhanced Oil Recovery
FGD Flue Gas Desulphurization
IEA International Energy Agency
IGCC Integrated Gasification Combined Cycle
ITM Ion Transport Membrane
MDEA MethylDiEthanolAmine
MEA MonoEthanolAmine
PSA Pressure Swing Adsorption
SCR Selective Catalytic Reduction
SEM Scanning Electron Microscopy
TGA ThermoGravimetric Analyzer
45
5 References
[1] Tan R, Corragio G, Santos S. Oxy-coal combustion with flue gas recycle for the
power generation industry, IFRF, 2005
[2] www.ipcc.ch, 19-06-08
[3] Davison J. Performance and costs of power plants with capture and storage of CO2.
Energy 2007;32:1163-6
[4] Figueroa DJ, Fout T, Plasynski S, McIlvried H. Advances in CO2 capture technology-
The U.S. department of energy’s carbon sequestration program. Int J Greenhouse Gas
Control 2008;2:9-0
[5] Buhre BJP, Elliot LK, Sheng CD, Gupta RP, Wall TF. Oxy-fuel combustion
technology for coal-fired power generation, Prog Energy Combust Sci 2005;31: 283-7
[6]http://www.bp.com/liveassets/bp_internet/globalbp/globalbp_uk_english/reports_and_
publications/statistical_energy_review_2007/STAGING/local_assets/downloads/pdf/coal
_section_2007.pdf, 17-12-09
[7] www.oplevnaturvidenskaben.dk, 30-05-07
[8] Wall TF. Combustion processes for carbon capture. Proc Combust. Inst 2007;31:31-7
[9] Newsome SD. The water-gas shift reaction. Catal Rev-Sci Eng 1980;21:275-8
[10] Chorkendorff J, Niemantsverdriet JW. Concepts of modern catalysis and kinetics.
1st edition. WILEY-VCH; 2005
46
[11] Kanniche M, Bouallou C. CO2 capture study in advanced integrated gasification
combined cycle. Appl Therm Eng 2007;27:2693-2
[12] Berguerand N, Lyngfelt A. Design and operation of a 10 kWth chemical-looping
combustor for solid fuels – Testing with South African coal. Fuel 2008;87:2713 – 6
[13] Xiang W, Wang S. Investigation of gasification chemical looping combustion
combined cycle performance. Energy Fuels 2008;22:961-6
[14] Wang J, Anthony EJ. Clean combustion of solid fuels. Appl Energy 2008;85:73 – 9
[15] Murphy JJ, Shaddix CR. Combustion kinetics of coal chars in oxygen-enriched
environments. Combust Flame 2006;144:710-9
[16] Liu H, Zailani R, Gibbs BM. Comparisons of pulverized coal combustion in air and
in mixtures of O2/CO2. Fuel 2005;84: 833-0
[17] Tan Y, Croiset E, Douglas MA, Thambimuthu KV. Combustion characteristics of
coal in a mixture of oxygen and recycled flue gas. Fuel 2006;85:507-2
[18] Andersson K, Normann F, Johnsson F, Leckner B. NO emission during oxy-fuel
combustion of lignite. Ind Eng Chem Res 2008;47:1835-5
[19] Wang CS, Berry GF, Chang KC, Wolsky AM. Combustion of pulverized coal using
waste carbon dioxide and oxygen. Combust Flame 1988;72:301-0
[20] Singh D, Croiset E, Douglas PL, Douglas MA. Techno-economic study of CO2
capture from an existing coal-fired power plant: MEA scrubbing vs. O2/CO2 recycle
combustion. Energy Convers Manage 2003;44:3073 –1
47
[21] Acharya D, Krishnamurthy KR, Leison M, MacAdam S, Sethi VK, Anheden M,
Jordal K, Yan J. Development of a high temperature oxygen generation process and its
application to oxycombustion power plants with carbon dioxide capture.
http://www.engr.pitt.edu/pcc/Past%20Conferences/2005/294.pdf, 30-09-08
[22] Okawa M, Kimura N, Kiga T, Takano S, Arai K, Kato M. Trial design for CO2
recovery plant by burning pulverized coal in O2/CO2. Energy Convers Manage
1997;38:123 –7
[23] Strömberg L. Combustion in a CO2/O2 mixture for a CO2 emission free process.
Second Nordic Minisymposion on Carbon Dioxide Capture and Storage
[24] Andersson K, Johnsson F. Process evaluation of an 865 MWe lignite fired O2/CO2
power plant. Energy Convers Manage 2006;47: 3487-8
[25] Li H, Yan J, Yan J, Anheden M. Impurity impacts on the purification process in oxy-
fuel combustion based CO2 capture and storage. Appl Energy 2009;86:202-3
[26] Liu H, Okazaki K. Simultaneous easy CO2 recovery and drastic reduction of SOx
and NOx in O2/CO2 coal combustion with heat recirculation. Fuel 2003;82:1427-6
[27] Toporov D, Förster M, Kneer R. How to burn pulverized coal in CO2 atmosphere at
low oxygen concentrations. VDI-BERICHTE 2007;1988:55 – 0
[28] Toporov D, Bocian P, Heil P, Kellermann A, Stadler H, Tschunko S, Förster M,
Kneer R. Detailed investigation of a pulverized fuel swirl flame in CO2/O2 atmosphere.
Combust Flame 2008;155:605-8
[29] www.doe.gov, 17-03-08
48
[30] Kimura N, Omata K, Kiga T, Takano S, Shikisima S. The characteristics of
pulverized coal combustion in O2/CO2 mixtures for CO2 recovery. Energy Convers
Manage 1995;36:805-8
[31] Castle WF. Air separation and liquefaction: Recent developments and prospects for
the beginning of the new millennium. Int J Refrig 2002;25:158-2
[32] Armstrong PA, Foster EP, Gunardson HH. ITM oxygen for gasification. SPE/PS-
CIM/CHOA 97801
[33] Smith AR, Klosek J. A review of air separation technologies and their integration
with energy conversion processes. Fuel Process Technol 2001;70:115-4
[34] Yantovski E, Gorski J, Smyth B, Elshof Jt. Zero-emission fuel-fired power plants
with ion transport membrane. Energy 2004;29:2077-8
[35] Molina A, Shaddix CR. Ignition and devolatilization of pulverized bituminous coal
particles during oxygen/carbon dioxide coal combustion. Proc Combust Inst
2007;31:1905-2
[36] Khare SP, Wall TF, Farida AZ, Liu Y, Moghtaderi B, Gupta RP. Factors influencing
the ignition of flames from air-fired swirl pf burners retrofitted to oxy-fuel. Fuel
2008;87:1042-9
[37] Suda T, Masuko K, Sato J, Yamamoto A, Okazaki K. Effect of carbon dioxide on
flame propagation of pulverized coal clouds in CO2/O2 combustion. Fuel 2007;86:2008-5
[38] Kiga T, Takano S, Kimura N, Omata K, Okawa M, Mori T, Kato M. Characteristics
of pulverized-coal combustion in the system of oxygen/recycled flue gas combustion.
Energy Convers Manage 1997;38:129-4
49
[39] Qiao Y, Zhang L, Binner E, Xu M, Li, C-Z. An investigation of the causes of the
differences in coal particle ignition temperature between combustion in air and in
O2/CO2. Fuel 2010;89: 3381-7
[40] Arias B, Pevida C, Rubiera F, Pis JJ. Effect of biomass blending on coal ignition and
burnout during oxy-fuel combustion. Fuel 2008;87:2753-9
[41] Smart J, Lu G, Yan Y, Riley G. Characterisation of an oxy-fuel flame through digital
imaging. Combust Flame 2010;157:1132-9
[42] Nozaki T, Takano S, Kiga T, Omata K, Kimura N. Analysis of the flame formed
during oxidation of pulverized coal by an O2-CO2 mixture. Energy 1997;22:199-5
[43] Andersson K, Johansson R, Hjärtstam S, Johnsson F, Leckner B. Radiation intensity
of lignite-fired oxy-fuel flames. Exp Therm Fluid Sci 2008;33:67-6
[44] Andersson K, Johnsson F. Flame and radiation characteristics of gas-fired O2/CO2
combustion. Fuel 2007;86:656-8
[45] Solomon PR, Serio MA, Suuberg EM. Coal pyrolysis: Experiments, kinetic rates and
mechanisms. Prog Energy Combust Sci 1992;18:133-0
[46] Mill CJ. Pyrolysis of fine coal particles at high heating rate and pressure. Ph.d
Thesis. University of New South Wales, Australia, 2000
[47] Yu J, Lucas JA, Wall TF. Formation of the structure of chars during devolatilization
of pulverized coal and its thermoproperties: A review. Prog Energy Combust Sci
2007;33:135-0
[48] Loudon GM. Organic Chemistry. 4th edition. Oxford; 2002
50
[49] Bejarano PA, Levendis YA. Single-coal-particle combustion in O2/N2 and O2/CO2
environments. Combust Flame 2008;153:270 – 7
[50] Zhang L, Binner E, Qiao Y, Li C-Z. In situ diagnostics of Victorian brown coal
combustion in O2/N2 and O2/CO2 mixtures in drop-tube furnace. Fuel 2010;89:2703-2
[51] Jamil K, Hayashi J-i, Li C-Z. Pyrolysis of a Victorian brown coal and gasification
of nascent char in CO2 atmosphere in a wire-mesh reactor. Fuel 2004;83:833-3
[52] Li Q, Zhao C, Chen X, Wu W, Li Y. Comparison of pulverized coal combustion in
air and in O2/CO2 mixtures by thermo-gravimetric analysis. J Anal Appl Pyrolysis
2009;85:521-8
[53] Rathnam RK, Elliott LK, Wall TF, Liu Y, Moghtaderi B. Differences in reactivity of
pulverised coal in air (O2/N2) and oxy-fuel (O2/CO2) conditions. Fuel Process Technol
2009;90:797-2
[54] Duan L, Zhao C, Zhou W, Qu C, Chen X. Investigation on coal pyrolysis in CO2
atmosphere. Energy Fuels 2009;23:3826-0
[55] Li X, Rathnam RK, Yu J, Wang Q, Wall T, Meesri C. Pyrolysis and combustion
characteristics of an Indonesian low-rank coal under O2/N2 and O2/CO2 conditions.
Energy Fuels 2010;24:160-4
[56] Al-Makhadmeh L, Maier J, Scheffknecht G. Coal pyrolysis and char combustion
under oxy-fuel conditions. The 34’Th International Technical Conference on Coal
Utilization & Fuel Systems, Clearwater Florida
[57] Fong WS, Khalil YF, Peters WA, Howard JB. Plastic behaviour of coal under rapid-
heating high-temperature conditions. Fuel 1986;65:195-1
51
[58] Cai H-Y, Megaritis A, Messenböck R, Dix M, Dugwell DR, Kandiyoti R. Pyrolysis
of coal maceral concentrates under pf-combustion conditions (II): Changes in heteroatom
partitioning as a function of rank. Fuel 1998;77:1283-9
[59] Oh MS, Peters WA, Howard JB. An experimental and modeling study of softening
coal pyrolysis. AIChE Journal 1989;35:775-2
[60] Cai H-Y, Megaritis A, Messenböck R, Dix M, Dugwell DR, Kandiyoti R. Pyrolysis
of coal maceral concentrates under pf-combustion conditions (I): Changes in volatile
release and char combustibility as a function of rank. Fuel 1998;77:1273-2
[61] Bailey JG, Tate A, Diessel CFK, Wall TF. A char morphology system with
applications to coal combustion. Fuel 1990;69:225-9
[62] Shu X, Xu X. Study on morphology of chars from coal pyrolysis. Energy Fuels
2001;15:1347-3
[63] Cloke M, Wu T, Barranco R, Lester E. Char characterisation and its application in a
coal burnout model. Fuel 2003;82:1989-0
[64] Wu T, Lester E, Cloke M. A burnout prediction model based around char
morphology. Energy Fuels 2006;20:1175-3
[65] Ma L, Mitchell R. Modeling char oxidation behavior under zone II burning
conditions at elevated pressures. Combust Flame 2009;156:37-0
[66] Borrega AG, Alvarez D. Comparison of chars obtained under oxy-fuel and
conventional pulverized coal combustion atmospheres. Energy Fuels 2007;21:3171-9
52
[67] Gale TK, Bartholomew CH, Fletcher TH. Decreases in the swelling and porosity of
bituminous coals during devolatilization at high heating rates. Combust Flame
1995;100:94-0
[68] Várhegyi G, Szabó P, Jakab E, Till F. Mathematical modeling of char reactivity in
Ar-O2 and CO2-O2. Energy Fuels 1996;10:1208-4
[69] Niu S-l, Han K-h, Lu C-m. Characteristic of coal combustion in oxygen/carbon
dioxide atmosphere and nitric oxide release during this process. Energ Convers Manage
2011;52:532-7
[70] Liu H. Combustion of coal chars in O2/CO2 and O2/N2 mixtures: A comparative
study with non-isothermal thermogravimetric analyzer (TGA) tests. Energy Fuels
2009;23:4278-5
[71] Liu H, Zailani R, Gibbs BM. Pulverized coal combustion in air and in O2/CO2
mixtures with NOx recycle. Fuel 2005;84:2109-5
[72] Zhang L, Binner E, Chen L, Qiao Y, Li C-Z, Bhattacharya S, Ninoiya Y.
Experimental investigation of the combustion of bituminous coal in air and O2/CO2
mixtures: 1. Particle Imaging of the combustion of coal and char. Energy Fuels
2010;24:4803-1
[73] Wen CY, Noncatalytic heterogeneous solid fluid reaction models. Industrial and
Engineering Chemistry 1968;60:34-4
[74] Hurt R, Sun J-K, Lunden M. A kinetic model of carbon burnout in pulverized coal
combustion. Combust Flame 1998;113:181-7
[75] Mitchell RE, Ma L, Kim B. On the burning behavior of pulverized coal chars.
Combust Flame 2007;151:426-6
53
[76] Hansen LA. Enhedsoperationer i den kemiske industri 2002. 4th edition. Polyteknisk
forlag;2002
[77] Bird RB, Stewart WE, Lightfoot EN. Transport phenomena. 2nd edition. John Wiley
& Sons, Inc.;2002
[78] Froment GF, Bischoff KB. Chemical reactor analysis and design. 2nd edition. John
Wiley & Sons, Inc.;1990
[79] Hu Y, Naito S, Kobayashi N, Hasatani M. CO2, NOx and SO2 emissions from the
combustion of coal with high oxygen concentration gases. Fuel 2000;79:1925-2
[80] Hu YQ, Kobayashi N, Hasatani M. Effects of coal properties on recycled-NOx
reduction in coal combustion with O2/recycled flue gas. Energy Convers Manage
2003;44:2331-0
[81] Okazaki K, Ando T. NOx reduction mechanism in coal combustion with recycled
CO2. Energy 1997;22:207-5
[82] Nelson PF, Nancarrow PC, Bus J, Prokopiuk A. Fractional conversion of char N to
NO in an entrained flow reactor. Proc Combust Inst 2002;29:2267-4
[83] Valix MG, Harris DJ, Smith IW, Trimm LD. The intrinsic combustion reactivity of
pulverized coal chars: The use of experimental pore diffusion coefficients. Twenty-
Fourth Symposium (International) on Combustion 1992:1217-3
[84] Molina A, Eddings EG, Pershing DW, Sarofim AF. Nitric oxide destruction during
coal and char oxidation under pulverized-coal combustion conditions. Combust Flame
2006;136:303-2
54
[85] Moors JH.J, Banin VE, Haas JHP, Weber R, Veefkind A. Prediction and validation
of burnout curves for Göttelborn char using reaction kinetics determined in shock tube
experiments. Fuel 1999;78:25-9
[86] Liu H, Kojima T, Feng B, Liu D, Lu J. Effect of heterogeneous reactions of coal
char on nitrous oxide formation and reduction in a circulating fluidized bed. Energy Fuels
2001;15:696-1
[87] Solomon PR, Fletcher TH. Impact of coal pyrolysis on combustion. Twenty-Fifth
Symposium (International) on Combustion 1994:463-4
[88] Glarborg P, Bentzen LLB. Chemical effects of high CO2 concentration in oxy-fuel
combustion of methane. Energy Fuels 2008;22:291-6
[89] Liu F, Guo H, Smallwood G.J. The chemical effect of CO2 replacement of N2 in air
on the burning velocity of CH4 and H2 premixed flames. Combust Flame 2003;133:495-7
[90] Masri AR, Dibble RW, Barlow RS. Chemical kinetic effects in nonpremixed flames
of H2/CO2 fuel. Combust Flame 1992;91:285-9
[91] Mendiara T, Glarborg P. Ammonia chemistry in oxy-fuel combustion of methane.
Combust Flame 2009;156:1937-9
[92] Gimeénez-López J, Millera A, Bilbao R, Alzueta MU. HCN oxidation in an O2/CO2
atmosphere: An experimental and kinetic modeling study. Combust Flame 2010;157:267-
6
[93] Miller JA, Bowman CT. Mechanism and modeling of nitrogen chemistry in
combustion. Prog Energy Combust. Sci 1989;15:287-8
55
[94] Glarborg P, Jensen AD, Johnsson JE. Fuel nitrogen conversion in solid fuel fired
systems. Prog Energy Combust Sci 2003;29:89-3
[95] Gardiner WC Jr. Gas-phase combustion chemistry. 1st edition. Springer;2000
[96] Molina A, Eddings EG, Pershing DW, Sarofim AF. Char nitrogen conversion:
Implications to emissions from coal-fired utility boilers. Prog Energy Combust Sci
2000;26:507-1
[97] Wang W, Brown SD, Hindmarsh CJ, Thomas KM. NOx release and reactivity of
chars from a wide range of coals during combustion. Fuel 1994;73:1381-8
[98] Jones JM, Harding AW, Brown SD, Thomas KM. Detection of reactive intermediate
nitrogen and sulfur species in the combustion of carbons that are models for coal chars.
Carbon;33:833-3
[99] Brown SD, Thomas KM. A comparison of NO release from coals and entrained-
flow reactor chars during temperature-programmed combustion. Fuel 1993;72:359-5
[100] Molina A, Murphy JJ, Winter F, Haynes BS, Blevins LG, Shaddix CR. Pathways
for conversion of char nitrogen to nitric oxide during pulverized coal combustion.
Combust Flame 2009;156:574-7
[101] Orikasa H, Tomita A. A study of the HCN formation mechanism during the coal
char gasification by O2. Energy Fuels 2003;17:1536-0
[102] Winter F, Wartha C, Löffler G, Hofbauer H. The NO and N2O formation
mechanism during devolatilization and char combustion under fluidized-bed conditions.
26’th Symposium (International) on Combustion 1996:3325-4
56
[103] Winter F, Wartha C, Löffler G, Hofbauer H. The NO and N2O formation
mechanism during devolatilization and char combustion under fluidized-bed conditions.
26’th Symposium (International) on Combustion 1996:3325-4
[104] Visona SP, Stanmore BR. Modeling NOx release from a single coal particle II.
Formation of NO from char-nitrogen. Combust Flame 1996;106:207-8
[105] Goel S, Zhang B, Sarofim AF. NO and N2O formation during char combustion: Is
it HCN or surface attached nitrogen. Combust Flame 1996;104:213-7
[106] Park D-C, Day SJ, Nelson PF. Nitrogen release during reaction of coal char with
O2, CO2 and H2O. Proc Combust Inst 2005;30:2169-5
[107] Wu SL, Iilsa K. Kinetics of NO reduction by black liquor char. Energy Fuels
1998;12:457-3
[108] Bueno-López A, Soriano-Mora JM, García-García A. Study of the temperature
window for the selective reduction of NOx in O2-rich gas mixtures by metal-loaded
carbon. Catal Commun 2006;7:678-4
[109] Zhao Z, Li W, Qiu J, Wang X, Li B. Influence of Na and Ca on the emission of
NOx during coal combustion. Fuel 2006;85:601-6
[110] Zhu ZH, Lu GQ, Yang RT. New insights into alkali-catalyzed gasification
reactions of carbon: Comparison of N2O reduction with carbon over Na and K catalysts. J
Catal 2000;192:77-7
[111] Wang Z, Zhou J, Wen Z, Liu J, Cen K. Effect of mineral matter on NO reduction in
coal reburning process. Energy Fuels 2007;21:2038-3
57
[112] Levy JM, Chan LK, Sarofim AF, Beér JM. NO/char reactions at pulverized coal
flame conditions. Eighteenth Symposium (International) on Combustion 1981:111-0
[113] López D, Calo J. The NO-carbon reaction: The influence of potassium and CO on
reactivity and populations of oxygen surface complexes. Energy Fuels 2007;21:1872-7
[114] Aarna, I.; Suuberg, E. R.: “The Role of Carbon-Monoxide in the NO-Carbon
Reaction”, Energy Fuels, 13, 1999, 1145-1153
[115] Aarna I, Suuberg EM. A review of the kinetics of the nitric oxide-carbon reaction.
Fuel 1997;76:475-1
[116] Chambrion P, Kyotani T, Tomita A. C-NO reaction in the presence of O2. Twenty-
Seventh Symposium (International) on Combustion 1998:3053-9
[117] Kyotani T, Tomita A. Analysis of the reaction of carbon with NO/N2O using Ab
Initio molecular orbital theory. J Phys Chem B 1999;103:3434-1
[118] Pevida C, Arenillas A, Rubiera F, Pis JJ. Synthetic coal char for the elucidation of
NO heterogeneous reduction mechanisms. Fuel 2007;86:41-9
[119] Jones JJ, Patterson PM, Pourkashanian M, Williams A. Approaches to modelling
heterogeneous char NO formation/destruction during pulverized coal combustion. Carbon
1999;37:1545-2
[120] Chambrion P, Kyotani T, Tomita A. Role of N-containing surface species on NO
reduction by carbon. Energy Fuels 1998;12:416-1
[121] Aarna I, Suuberg EM. A study of the reaction order of the NO-carbon gasification
reaction. Twenty-Seventh Symposium (International) on Combustion 1998:3061-8
58
[122] Andersson K, Normann F, Johnsson F, Leckner B. NO emission during oxy-fuel
combustion of lignite. Ind Eng Chem Res 2008;47:1835-5
[123] Chan LK, Sarofim AF, Beér JM. Kinetics of the NO-carbon reaction at fluidized
bed combustor conditions. Combust Flame 1983;52:37-5
[124] Toftegård MB, Brix J, Jensen PA, Glarborg P, Jensen AD. Oxy-fuel combustion of
solid fuels. Prog Energy Combust Sci 2010;36:581-5

59
Article I Coal Devolatilization and Char Conversion under Suspension Fired
Conditions in O2/N2 and O2/CO2 Atmospheres
60
Coal Devolatilization and Char Conversion under Suspension Fired
Conditions in O2/N2 and O2/CO2 Atmospheres
Jacob Brix, Peter Arendt Jensen, Anker Degn Jensen*
Department of Chemical and Biochemical Engineering, Building 229 Søltofts Plads, 2800 Kgs. Lyngby, Denmark
*Corresponding Author: e-mail: [email protected], Fax: +45 45 88 22 58, Phone: +45 45 25 28 41
Abstract
The aim of the present investigation is to examine differences between O2/N2 and O2/CO2
combustion during devolatilization and char conversion of a bituminous coal at
conditions covering temperatures between 1173 K – 1673 K and inlet oxygen
concentrations between 5 – 28 vol. %. The experiments have been carried out in an
electrically heated entrained flow reactor that is designed to simulate the conditions in a
suspension fired boiler. Coal devolatilized in N2 and CO2 atmospheres provided similar
results regarding char morphology, char N2-BET surface area and volatile yield. This
strongly indicates that a shift from air to oxy-fuel combustion does not influence the
devolatilization process significantly. Char combustion experiments yielded similar char
conversion profiles when N2 was replaced with CO2 under conditions where combustion
was primarily controlled by chemical kinetics. When char was burned at 1573 K and
1673 K a faster conversion was found in N2 suggesting that the lower molecular diffusion
coefficient of O2 in CO2 lowers the char conversion rate when external mass transfer
influences combustion. The reaction of char with CO2 was not observed to have an
influence on char conversion rates at the applied experimental conditions.
Keywords: Oxy-fuel, Devolatilization, Combustion, Char
61
1. Introduction
It is a growing concern that anthropogenic CO2 emission to the atmosphere causes the
planets temperature to raise. This concern has initiated extensive research programs to
pursue alternative energy sources that can meet the increasing demands in both
industrialized and developing countries without emitting CO2 as fossil fuel based power
plants are large emission sources. Today fossil fuels accounts for approximately 85 %
[1,2] of the energy production world wide and it is therefore not likely that new
technologies, which is not presently mature, can substitute fossil fuels, such as coal, in
the short to midterm future [3]. To overcome the challenges the power industry, which is
today relaying on conventional coal combustion, must find alternative technologies that
allow for the continued use of coal, a fuel which is abundant, relatively cheap and steady
in supply.
An interesting alternative to traditional air-blown combustion is the oxy-fuel combustion
process. In oxy-fuel combustion, oxygen is separated from air before it enters the boiler
and mixed with recycled flue gas to obtain a plant exit stream of almost pure CO2 [3].
This CO2 stream can subsequently be stored in suitable geological formations such as
depleted oil and gas reservoirs or saline aquifers [2].
Many technical aspects still need to be clarified for oxy-fuel combustion to be
industrialized. Fundamental knowledge of the oxy-fuel combustion process is therefore
of importance. This knowledge must include an understanding of coal devolatilization
and char conversion in a CO2 rich gas since these processes influence heat release
characteristics, fuel burn out and the need for oxygen, all of which have important
economic implications for the process.
Rathnam et al. [4] examined the reactivity of four pulverized coals in the size range 69-
90 μm. They conducted experiments in a drop tube furnace (DTF) at 1673 K under single
particle conditions using oxygen concentrations between 3 and 21 % in N2 and 5 and 30
% in CO2. From their experiments they found 4 - 24 % higher apparent volatile yields in
CO2 compared to N2 although the standard deviations of the data indicated possible
overlaps between N2 and CO2 yields for three of the four coals studied. The authors
attributed the higher volatile yield in CO2 to gasification. That the presence of CO2
increases the volatile yield compared to N2 was also found by Al-Makhadmeh et al. [5]
62
from entrained flow reactor (EFR) pyrolysis tests. Using a bituminous coal they found an
increase in volatile yield of approximately 16 % when N2 was replaced with CO2 at 1423
K. This contradicts the findings of Borrego and Alvarez [6] that devolatilized high and
low volatile bituminous coal particles in the size range 36-75 μm using a DTF operated at
1573 K. They found a decrease in volatile yield of 62 % and 32 % for the low volatile
and high volatile coal, respectively, when N2 was replaced with CO2. These decreases in
volatile yield are surprisingly high and could be caused by the high amount of cold gas
(1/3 of the total gas volume) used for particle transport during their experiments. Since
CO2 has a higher thermal capacity than N2 the large amount of cold gas could lower the
particle heating rate in CO2 causing the lower volatile yields.
To examine the difference in volatile yield closer Rathnam et al. [4] conducted
thermogravimetric analysis (TGA) pyrolysis on one of their coals in pure N2 and CO2,
using a heating rate of 25 K/min. They found very similar weight loss curves at
temperatures below 1030 K. At this temperature the weight loss in CO2 started to
accelerate significantly compared to N2 indicating an effect of char gasification by CO2.
This effect of CO2 was also found by Li et al. [7] in their TGA pyrolysis experiment
using pulverized bituminous coal at similar temperatures and heating rates of 10, 20 and
30 K/min. That CO2 gasification can take place during pyrolysis have also been found by
other investigators [8,9]. Due to the long residence time and low heating rate of the coal
in a TGA direct comparison with DTF and EFR experiments, where devolatilization is
completed in a time scale of less than a second, should however be made with caution,
especially if these experiments are carried out in an oxidizing atmosphere. Rathnam et al.
[4] also compared coal burnout in O2/N2 and O2/CO2 at varying oxygen concentrations
using their DTF. Here a tendency of higher overall coal conversions (1-3 Wt. %) in
O2/CO2 was found for two of the four coals with most pronounced differences at low
oxygen concentrations. Chars produced in their DTF and combusted in a TGA, using a
heating rate of 25 K/min, showed an increased reactivity in CO2 compared to N2 at
temperatures above 1100 K and an oxygen concentration of 2 %. At oxygen
concentrations above 2 % the TGA experiments showed no difference in reactivity as
char burnout was accomplished at lower temperatures where the effect of CO2
gasification does not impact on char consumption. In the TGA experiments of Várhegyi
63
et al. [10], which were carried out by burning bituminous coal in oxygen concentrations
ranging between 5-100 vol. % in Ar or CO2, the effect of CO2 gasification was also found
to be negligible due to the low gasification rate compared to the char oxidation rate.
Bejarano and Levendis [11] conducted single particle combustion experiments in both
O2/N2 and O2/CO2 using a bituminous coal, a lignite coal and a synthetic char in a
laminar DTF with fixed temperatures of 1400 K and 1600 K. Using a three-color
pyrometer they were able to measure the temperature of the burning particles. The
particle size fractions of the coal used in their experiments were 45-53 μm, 75-90 μm and
150-180 μm whereas the synthetic char had a diameter of 43 μm. When burning 45-53
μm bituminous coal particles at a reactor temperature of 1400 K a particle temperature
drop at 50 % burnout, of approximately 150-200 K, was observed for oxygen
concentrations in the range 20-80 vol. % when N2 was replaced with CO2. In this range of
oxygen concentrations the particle temperature increased approximately from 1800 K to
2620 K in O2/CO2 and from 2000 K to 2800 K in O2/N2. Burnout times at identical
oxygen concentrations were found to be 44-80 % longer in O2/CO2 compared to O2/N2
depending on the oxygen concentration. The authors argued that the combustion was
taking place in Zone II by comparing calculated diffusion-limited burnout times with
experimental data. Their conclusion is however sensitive to factors such as particle
swelling, development of char morphology during devolatilization and choice of
combustion model. If a shrinking sphere model is applied to calculate burnout times in
Zone III the relative difference in burnout times is a measure of the relative difference in
oxygen diffusivity in the particle boundary layer. For the experiments just mentioned the
burnout times in 20 % O2/ 80 % CO2 and 40 % O2/ 60 % CO2 is approximately 44 % and
46 % higher than in the corresponding N2 based atmospheres. The diffusion coefficient of
O2 in N2, as calculated by Chapman-Enskog’s equation [12], using average temperatures
between the particles and the bulk gas, is however 42 % and 40 % higher than in CO2.
This could imply that the experimental data of Bejarano and Levendis [11] is obtained
closer to Zone III than anticipated by the authors, which is most clearly seen at the lower
oxygen concentrations where the largest differences in conversion rates exist. When
experiments were carried out using lignite lower differences in particle temperatures were
found between N2 and CO2 based atmospheres (~ 100 K) compared to combustion of
64
bituminous coal. Burnout times for lignite were found to be lower than for bituminous
coal with smaller differences (~ 3 ms) between O2/N2 and O2/CO2 environments.
Bejarano and Levendis [11] attributed this behavior to a higher reactivity and a lower
fixed carbon content of lignite. In addition, low rank coals tend to form network chars
whereas medium rank coals have a tendency to form cenospheric chars [13]. It is
therefore likely that a more pronounced effect from CO2 gasification on char conversion
will be present during combustion of a low rank coal where CO2 can react on the pore
surface of the char when the reaction with oxygen is controlled partly or completely by
external mass transfer.
Molina and Shaddix [14] carried out experiments in a laminar EFR under single particle
conditions using bituminous coal particles in the size range 106-125 μm. Using a
Charged-Coupled Device (CCD) camera they obtained luminous profiles of particles
burning in both O2/N2 and O2/CO2 mixtures from which the time where devolatilization
begins and the time where volatile ignition takes place could be deduced based on a large
number of repeated experiments. Ignition time in 21 % O2/ 79 % CO2 was approximately
11 % (~ 3 ms) longer than in the equivalent N2 mixture at the same gas temperature. For
30 % O2 the increase in ignition time was reduced to approximately 8 % (~ 2 ms). The
authors explained these observations with the increased thermal capacity (ρp·Cp) and
lower diffusivity of gaseous components in CO2 compared to N2. These factors cause a
delayed ignition and a slower consumption of volatiles through an increased heat uptake
by the gas and a lower reactant mixing rate during devolatilization. No visual differences
were found in devolatilization time neither between carrier gases or oxygen
concentrations, which the authors explained with similar particle heating curves.
The short review above presents data from several researchers. Conclusions based on the
comparison of their data are however difficult as differences in particle temperature
histories, coal composition, and equipment limitations such as gas mixing etc. strongly
influences the results. It is therefore apparent that there is a continued need for broad
consistent data sets that can promote the understanding of coal conversion in oxy-fuel
combustion.
The present investigation aims at clarifying differences in consumption rates when
bituminous coal is devolatilized and burned in O2/N2 and O2/CO2 mixtures. To base
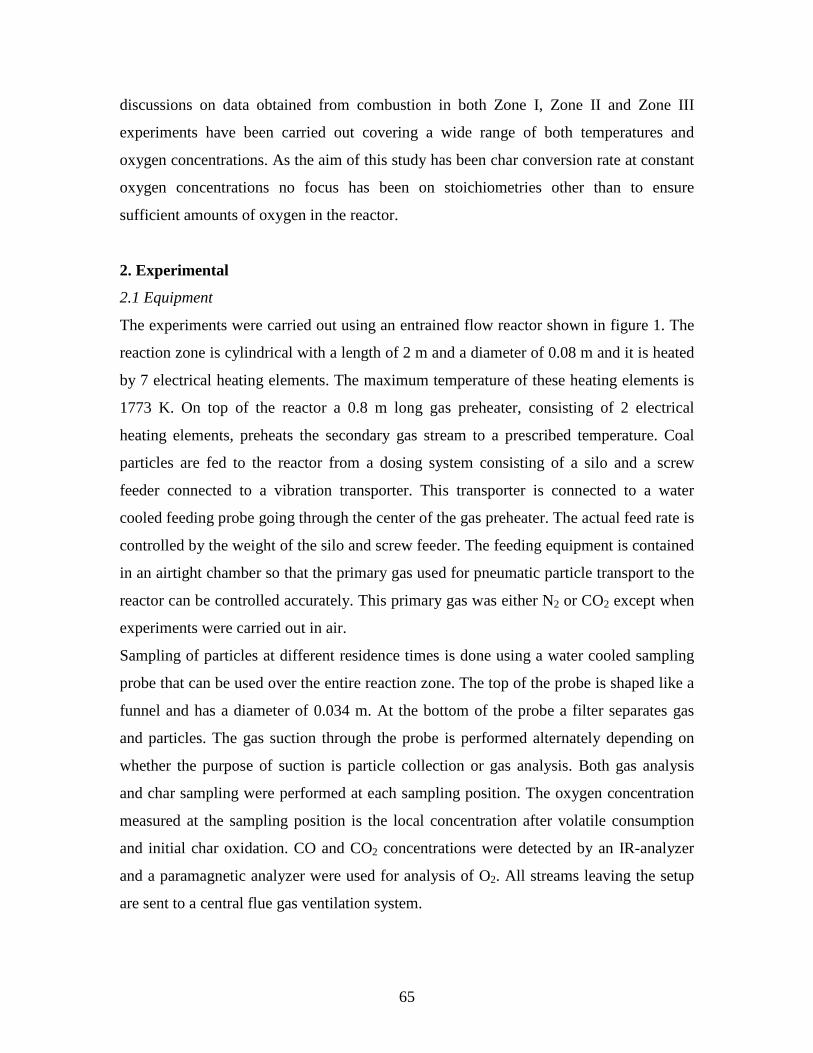
65
discussions on data obtained from combustion in both Zone I, Zone II and Zone III
experiments have been carried out covering a wide range of both temperatures and
oxygen concentrations. As the aim of this study has been char conversion rate at constant
oxygen concentrations no focus has been on stoichiometries other than to ensure
sufficient amounts of oxygen in the reactor.
2. Experimental
2.1 Equipment
The experiments were carried out using an entrained flow reactor shown in figure 1. The
reaction zone is cylindrical with a length of 2 m and a diameter of 0.08 m and it is heated
by 7 electrical heating elements. The maximum temperature of these heating elements is
1773 K. On top of the reactor a 0.8 m long gas preheater, consisting of 2 electrical
heating elements, preheats the secondary gas stream to a prescribed temperature. Coal
particles are fed to the reactor from a dosing system consisting of a silo and a screw
feeder connected to a vibration transporter. This transporter is connected to a water
cooled feeding probe going through the center of the gas preheater. The actual feed rate is
controlled by the weight of the silo and screw feeder. The feeding equipment is contained
in an airtight chamber so that the primary gas used for pneumatic particle transport to the
reactor can be controlled accurately. This primary gas was either N2 or CO2 except when
experiments were carried out in air.
Sampling of particles at different residence times is done using a water cooled sampling
probe that can be used over the entire reaction zone. The top of the probe is shaped like a
funnel and has a diameter of 0.034 m. At the bottom of the probe a filter separates gas
and particles. The gas suction through the probe is performed alternately depending on
whether the purpose of suction is particle collection or gas analysis. Both gas analysis
and char sampling were performed at each sampling position. The oxygen concentration
measured at the sampling position is the local concentration after volatile consumption
and initial char oxidation. CO and CO2 concentrations were detected by an IR-analyzer
and a paramagnetic analyzer were used for analysis of O2. All streams leaving the setup
are sent to a central flue gas ventilation system.
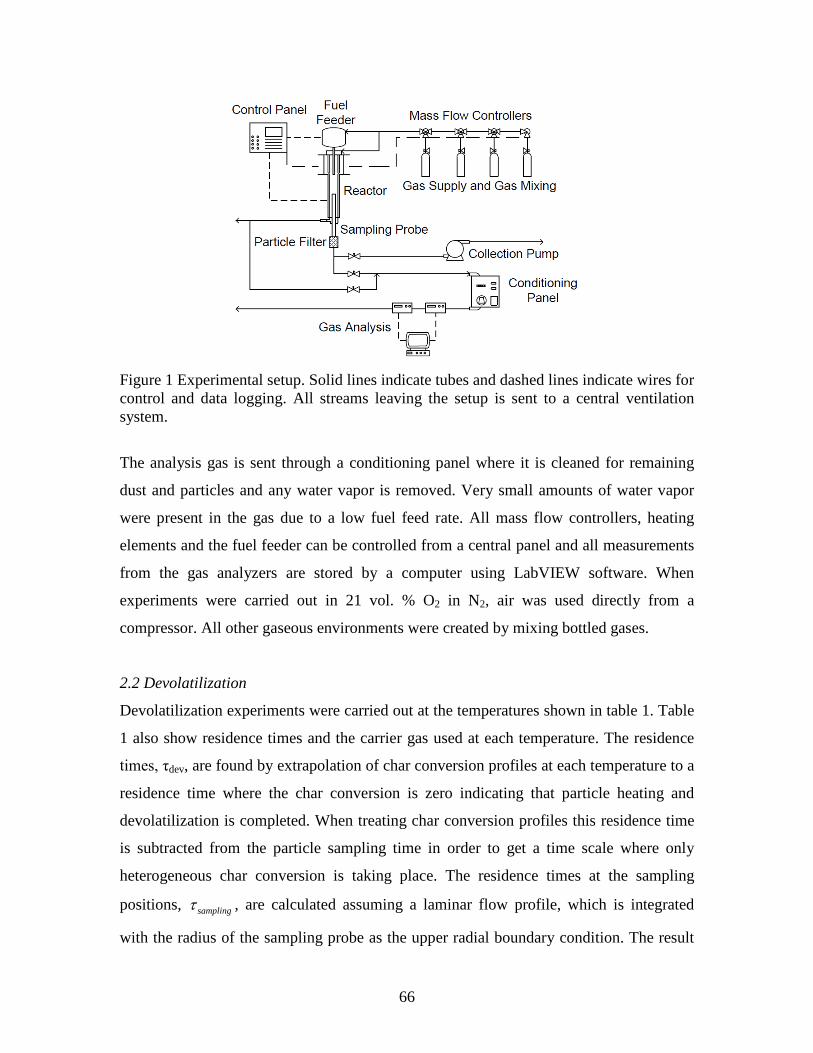
66
Figure 1 Experimental setup. Solid lines indicate tubes and dashed lines indicate wires for control and data logging. All streams leaving the setup is sent to a central ventilation system.
The analysis gas is sent through a conditioning panel where it is cleaned for remaining
dust and particles and any water vapor is removed. Very small amounts of water vapor
were present in the gas due to a low fuel feed rate. All mass flow controllers, heating
elements and the fuel feeder can be controlled from a central panel and all measurements
from the gas analyzers are stored by a computer using LabVIEW software. When
experiments were carried out in 21 vol. % O2 in N2, air was used directly from a
compressor. All other gaseous environments were created by mixing bottled gases.
2.2 Devolatilization
Devolatilization experiments were carried out at the temperatures shown in table 1. Table
1 also show residence times and the carrier gas used at each temperature. The residence
times, τdev, are found by extrapolation of char conversion profiles at each temperature to a
residence time where the char conversion is zero indicating that particle heating and
devolatilization is completed. When treating char conversion profiles this residence time
is subtracted from the particle sampling time in order to get a time scale where only
heterogeneous char conversion is taking place. The residence times at the sampling
positions, samplingτ , are calculated assuming a laminar flow profile, which is integrated
with the radius of the sampling probe as the upper radial boundary condition. The result
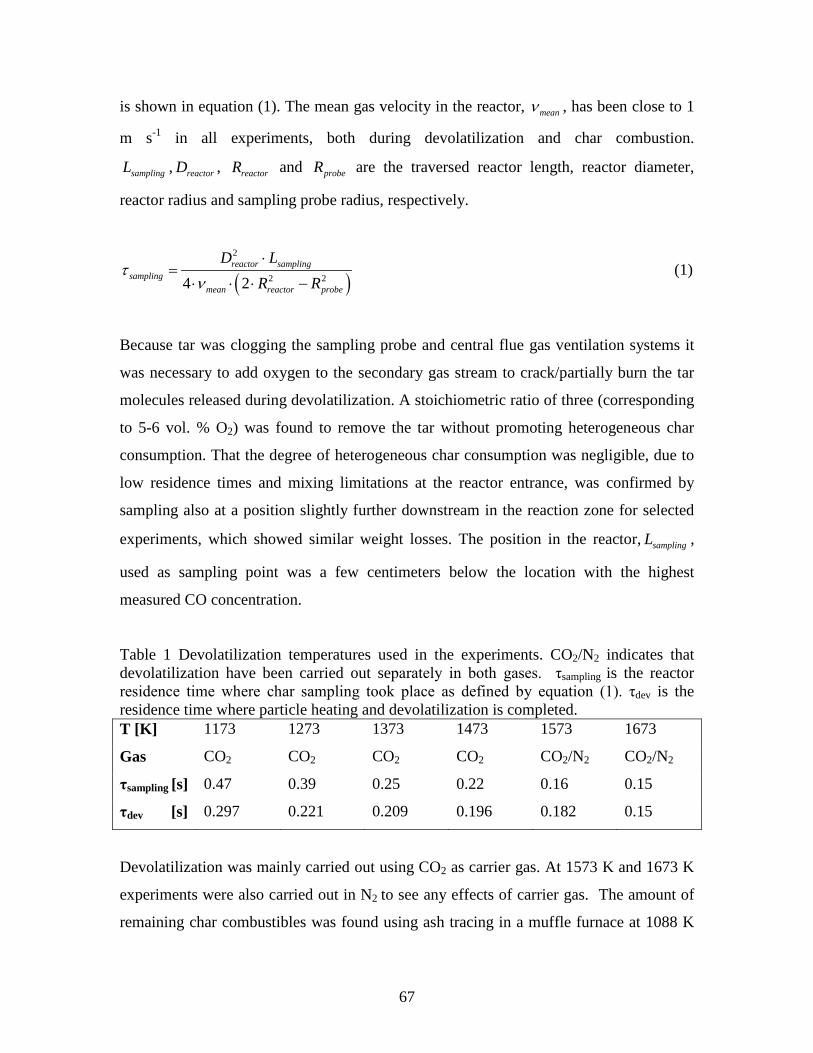
67
is shown in equation (1). The mean gas velocity in the reactor, meanν , has been close to 1
m s-1 in all experiments, both during devolatilization and char combustion.
samplingL , reactorD , reactorR and probeR are the traversed reactor length, reactor diameter,
reactor radius and sampling probe radius, respectively.
( )2
2 24 2reactor sampling
samplingmean reactor probe
D LR R
τν
⋅=
⋅ ⋅ ⋅ − (1)
Because tar was clogging the sampling probe and central flue gas ventilation systems it
was necessary to add oxygen to the secondary gas stream to crack/partially burn the tar
molecules released during devolatilization. A stoichiometric ratio of three (corresponding
to 5-6 vol. % O2) was found to remove the tar without promoting heterogeneous char
consumption. That the degree of heterogeneous char consumption was negligible, due to
low residence times and mixing limitations at the reactor entrance, was confirmed by
sampling also at a position slightly further downstream in the reaction zone for selected
experiments, which showed similar weight losses. The position in the reactor, samplingL ,
used as sampling point was a few centimeters below the location with the highest
measured CO concentration.
Table 1 Devolatilization temperatures used in the experiments. CO2/N2 indicates that devolatilization have been carried out separately in both gases. τsampling is the reactor residence time where char sampling took place as defined by equation (1). τdev is the residence time where particle heating and devolatilization is completed. T [K] 1173 1273 1373 1473 1573 1673
Gas CO2 CO2 CO2 CO2 CO2/N2 CO2/N2
τsampling [s] 0.47 0.39 0.25 0.22 0.16 0.15
τdev [s] 0.297 0.221 0.209 0.196 0.182 0.15
Devolatilization was mainly carried out using CO2 as carrier gas. At 1573 K and 1673 K
experiments were also carried out in N2 to see any effects of carrier gas. The amount of
remaining char combustibles was found using ash tracing in a muffle furnace at 1088 K
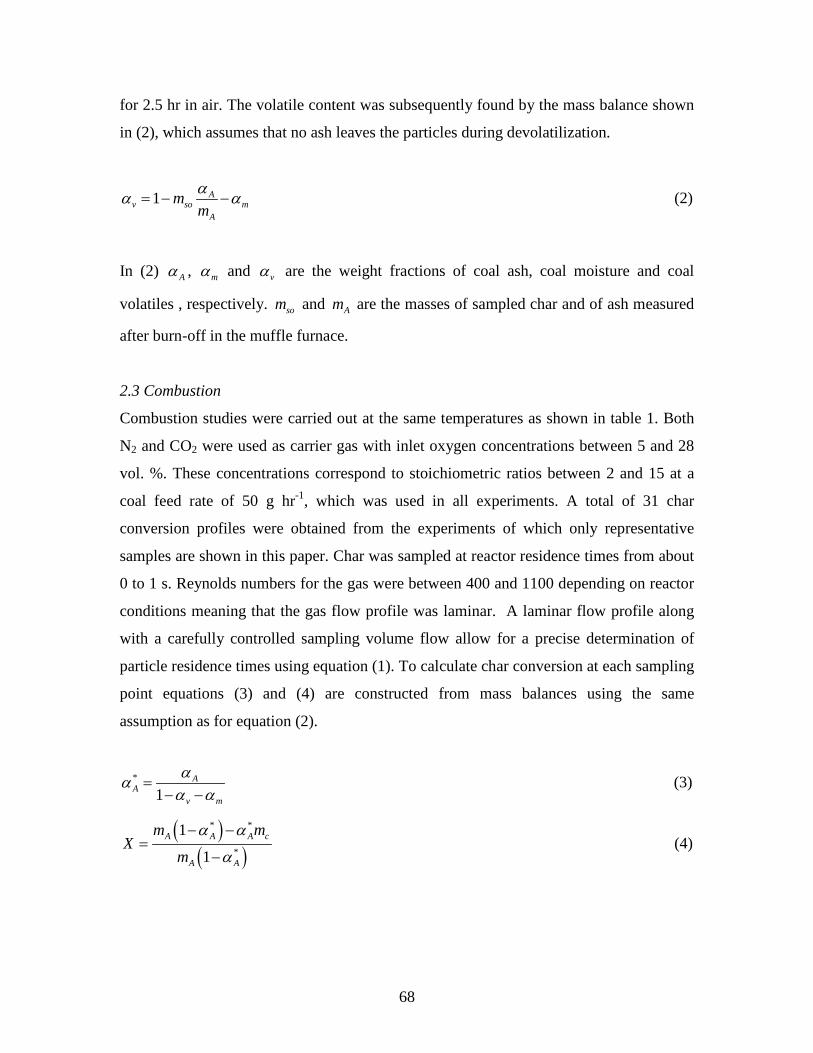
68
for 2.5 hr in air. The volatile content was subsequently found by the mass balance shown
in (2), which assumes that no ash leaves the particles during devolatilization.
1 Av so m
A
mmαα α= − − (2)
In (2) Aα , mα and vα are the weight fractions of coal ash, coal moisture and coal
volatiles , respectively. som and Am are the masses of sampled char and of ash measured
after burn-off in the muffle furnace.
2.3 Combustion
Combustion studies were carried out at the same temperatures as shown in table 1. Both
N2 and CO2 were used as carrier gas with inlet oxygen concentrations between 5 and 28
vol. %. These concentrations correspond to stoichiometric ratios between 2 and 15 at a
coal feed rate of 50 g hr-1, which was used in all experiments. A total of 31 char
conversion profiles were obtained from the experiments of which only representative
samples are shown in this paper. Char was sampled at reactor residence times from about
0 to 1 s. Reynolds numbers for the gas were between 400 and 1100 depending on reactor
conditions meaning that the gas flow profile was laminar. A laminar flow profile along
with a carefully controlled sampling volume flow allow for a precise determination of
particle residence times using equation (1). To calculate char conversion at each sampling
point equations (3) and (4) are constructed from mass balances using the same
assumption as for equation (2).
*
1A
Av m
ααα α
=− −
(3)
( )( )
* *
*
1
1A A A c
A A
m mX
m
α α
α
− −=
− (4)
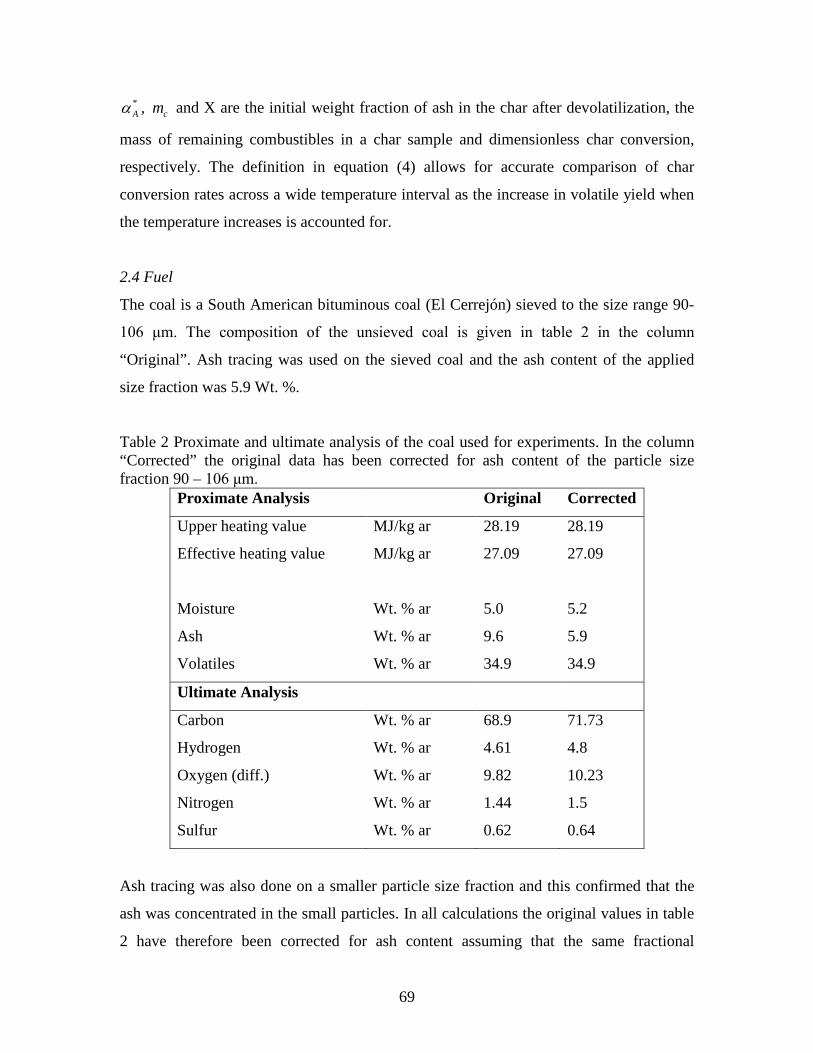
69
*Aα , cm and X are the initial weight fraction of ash in the char after devolatilization, the
mass of remaining combustibles in a char sample and dimensionless char conversion,
respectively. The definition in equation (4) allows for accurate comparison of char
conversion rates across a wide temperature interval as the increase in volatile yield when
the temperature increases is accounted for.
2.4 Fuel
The coal is a South American bituminous coal (El Cerrejón) sieved to the size range 90-
106 μm. The composition of the unsieved coal is given in table 2 in the column
“Original”. Ash tracing was used on the sieved coal and the ash content of the applied
size fraction was 5.9 Wt. %.
Table 2 Proximate and ultimate analysis of the coal used for experiments. In the column “Corrected” the original data has been corrected for ash content of the particle size fraction 90 – 106 μm.
Proximate Analysis Original Corrected
Upper heating value MJ/kg ar 28.19 28.19
Effective heating value MJ/kg ar 27.09 27.09
Moisture Wt. % ar 5.0 5.2
Ash Wt. % ar 9.6 5.9
Volatiles Wt. % ar 34.9 34.9
Ultimate Analysis
Carbon Wt. % ar 68.9 71.73
Hydrogen Wt. % ar 4.61 4.8
Oxygen (diff.) Wt. % ar 9.82 10.23
Nitrogen Wt. % ar 1.44 1.5
Sulfur Wt. % ar 0.62 0.64
Ash tracing was also done on a smaller particle size fraction and this confirmed that the
ash was concentrated in the small particles. In all calculations the original values in table
2 have therefore been corrected for ash content assuming that the same fractional
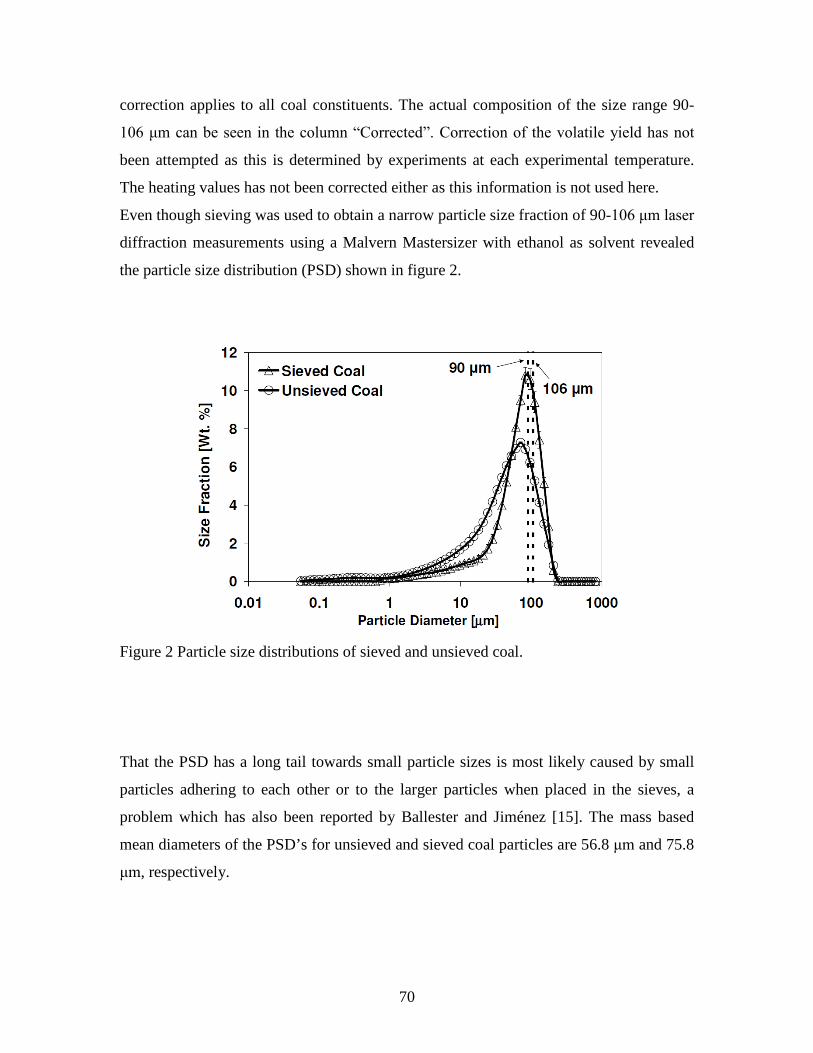
70
correction applies to all coal constituents. The actual composition of the size range 90-
106 μm can be seen in the column “Corrected”. Correction of the volatile yield has not
been attempted as this is determined by experiments at each experimental temperature.
The heating values has not been corrected either as this information is not used here.
Even though sieving was used to obtain a narrow particle size fraction of 90-106 μm laser
diffraction measurements using a Malvern Mastersizer with ethanol as solvent revealed
the particle size distribution (PSD) shown in figure 2.
Figure 2 Particle size distributions of sieved and unsieved coal.
That the PSD has a long tail towards small particle sizes is most likely caused by small
particles adhering to each other or to the larger particles when placed in the sieves, a
problem which has also been reported by Ballester and Jiménez [15]. The mass based
mean diameters of the PSD’s for unsieved and sieved coal particles are 56.8 μm and 75.8
μm, respectively.
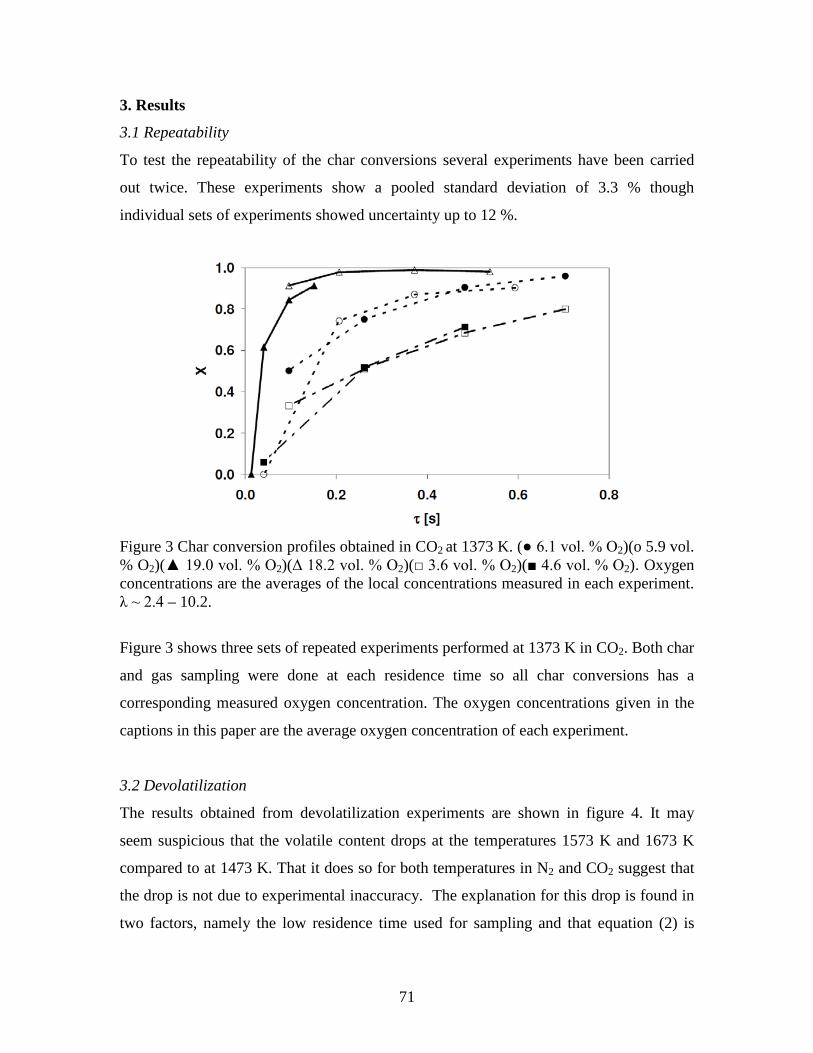
71
3. Results
3.1 Repeatability
To test the repeatability of the char conversions several experiments have been carried
out twice. These experiments show a pooled standard deviation of 3.3 % though
individual sets of experiments showed uncertainty up to 12 %.
Figure 3 Char conversion profiles obtained in CO2 at 1373 K. ( 6.1 vol. % O2)(o 5.9 vol. % O2)( 19.0 vol. % O2)(Δ 18.2 vol. % O2)( 3.6 vol. % O2)( 4.6 vol. % O2). Oxygen concentrations are the averages of the local concentrations measured in each experiment. λ ~ 2.4 – 10.2.
Figure 3 shows three sets of repeated experiments performed at 1373 K in CO2. Both char
and gas sampling were done at each residence time so all char conversions has a
corresponding measured oxygen concentration. The oxygen concentrations given in the
captions in this paper are the average oxygen concentration of each experiment.
3.2 Devolatilization
The results obtained from devolatilization experiments are shown in figure 4. It may
seem suspicious that the volatile content drops at the temperatures 1573 K and 1673 K
compared to at 1473 K. That it does so for both temperatures in N2 and CO2 suggest that
the drop is not due to experimental inaccuracy. The explanation for this drop is found in
two factors, namely the low residence time used for sampling and that equation (2) is
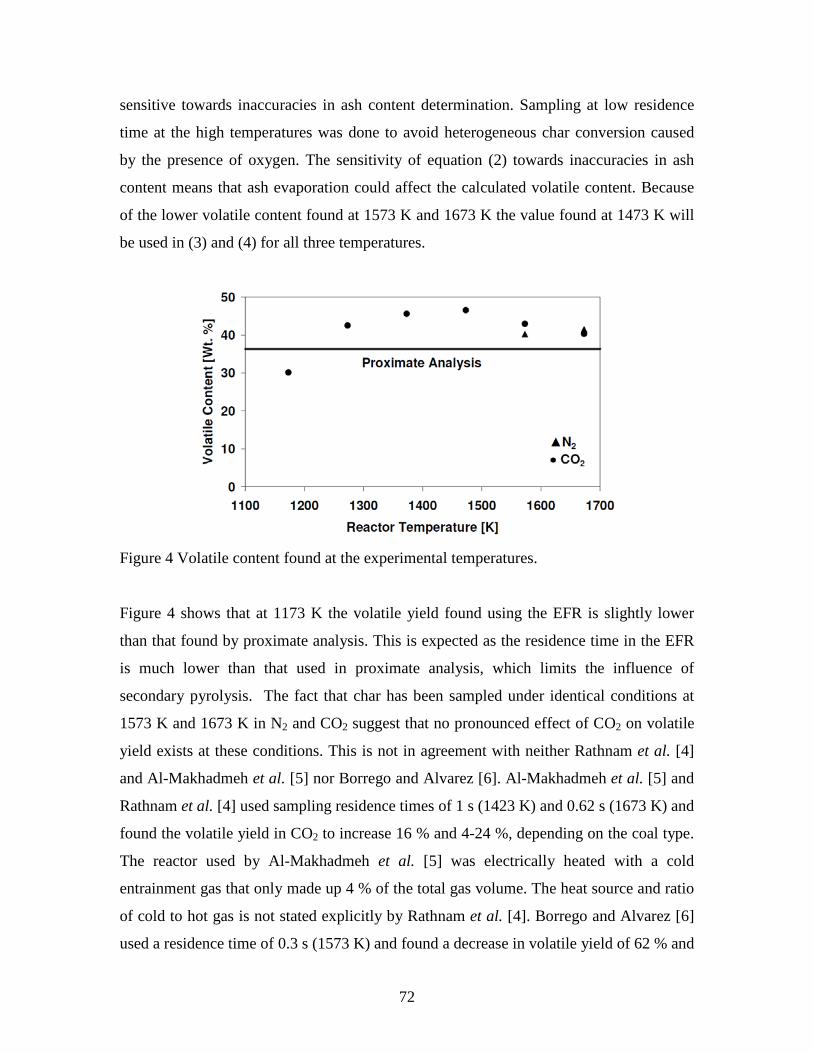
72
sensitive towards inaccuracies in ash content determination. Sampling at low residence
time at the high temperatures was done to avoid heterogeneous char conversion caused
by the presence of oxygen. The sensitivity of equation (2) towards inaccuracies in ash
content means that ash evaporation could affect the calculated volatile content. Because
of the lower volatile content found at 1573 K and 1673 K the value found at 1473 K will
be used in (3) and (4) for all three temperatures.
Figure 4 Volatile content found at the experimental temperatures.
Figure 4 shows that at 1173 K the volatile yield found using the EFR is slightly lower
than that found by proximate analysis. This is expected as the residence time in the EFR
is much lower than that used in proximate analysis, which limits the influence of
secondary pyrolysis. The fact that char has been sampled under identical conditions at
1573 K and 1673 K in N2 and CO2 suggest that no pronounced effect of CO2 on volatile
yield exists at these conditions. This is not in agreement with neither Rathnam et al. [4]
and Al-Makhadmeh et al. [5] nor Borrego and Alvarez [6]. Al-Makhadmeh et al. [5] and
Rathnam et al. [4] used sampling residence times of 1 s (1423 K) and 0.62 s (1673 K) and
found the volatile yield in CO2 to increase 16 % and 4-24 %, depending on the coal type.
The reactor used by Al-Makhadmeh et al. [5] was electrically heated with a cold
entrainment gas that only made up 4 % of the total gas volume. The heat source and ratio
of cold to hot gas is not stated explicitly by Rathnam et al. [4]. Borrego and Alvarez [6]
used a residence time of 0.3 s (1573 K) and found a decrease in volatile yield of 62 % and
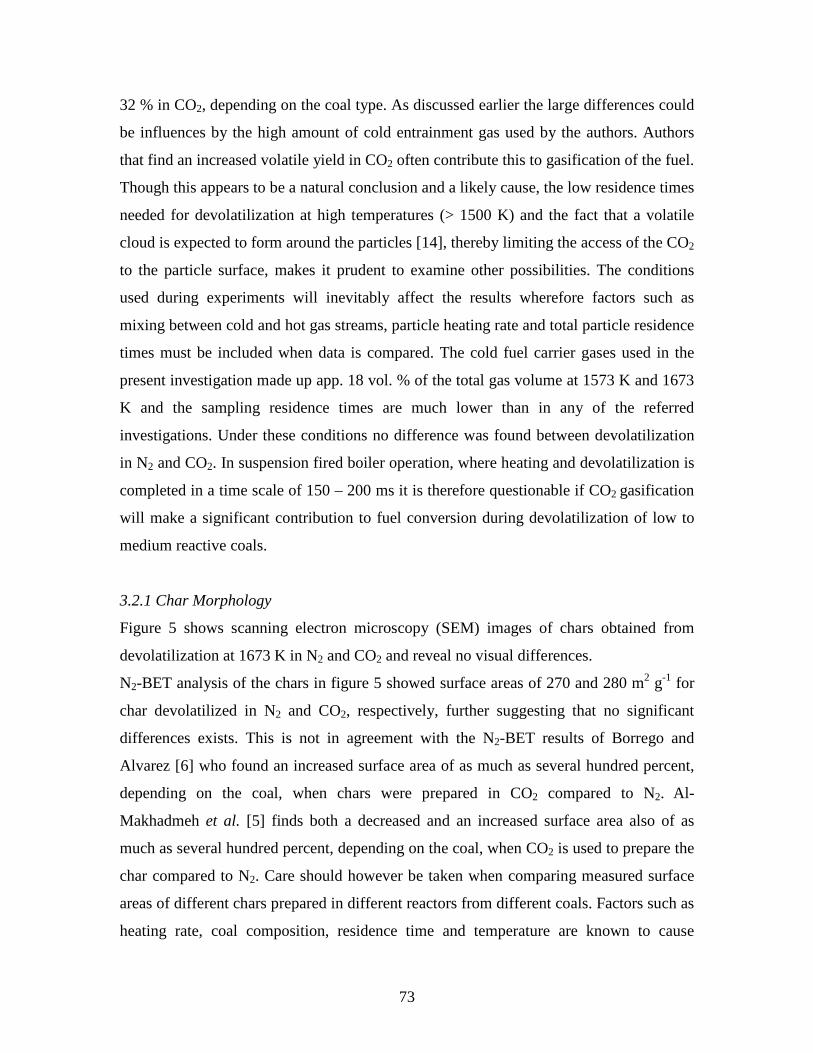
73
32 % in CO2, depending on the coal type. As discussed earlier the large differences could
be influences by the high amount of cold entrainment gas used by the authors. Authors
that find an increased volatile yield in CO2 often contribute this to gasification of the fuel.
Though this appears to be a natural conclusion and a likely cause, the low residence times
needed for devolatilization at high temperatures (> 1500 K) and the fact that a volatile
cloud is expected to form around the particles [14], thereby limiting the access of the CO2
to the particle surface, makes it prudent to examine other possibilities. The conditions
used during experiments will inevitably affect the results wherefore factors such as
mixing between cold and hot gas streams, particle heating rate and total particle residence
times must be included when data is compared. The cold fuel carrier gases used in the
present investigation made up app. 18 vol. % of the total gas volume at 1573 K and 1673
K and the sampling residence times are much lower than in any of the referred
investigations. Under these conditions no difference was found between devolatilization
in N2 and CO2. In suspension fired boiler operation, where heating and devolatilization is
completed in a time scale of 150 – 200 ms it is therefore questionable if CO2 gasification
will make a significant contribution to fuel conversion during devolatilization of low to
medium reactive coals.
3.2.1 Char Morphology
Figure 5 shows scanning electron microscopy (SEM) images of chars obtained from
devolatilization at 1673 K in N2 and CO2 and reveal no visual differences.
N2-BET analysis of the chars in figure 5 showed surface areas of 270 and 280 m2 g-1 for
char devolatilized in N2 and CO2, respectively, further suggesting that no significant
differences exists. This is not in agreement with the N2-BET results of Borrego and
Alvarez [6] who found an increased surface area of as much as several hundred percent,
depending on the coal, when chars were prepared in CO2 compared to N2. Al-
Makhadmeh et al. [5] finds both a decreased and an increased surface area also of as
much as several hundred percent, depending on the coal, when CO2 is used to prepare the
char compared to N2. Care should however be taken when comparing measured surface
areas of different chars prepared in different reactors from different coals. Factors such as
heating rate, coal composition, residence time and temperature are known to cause
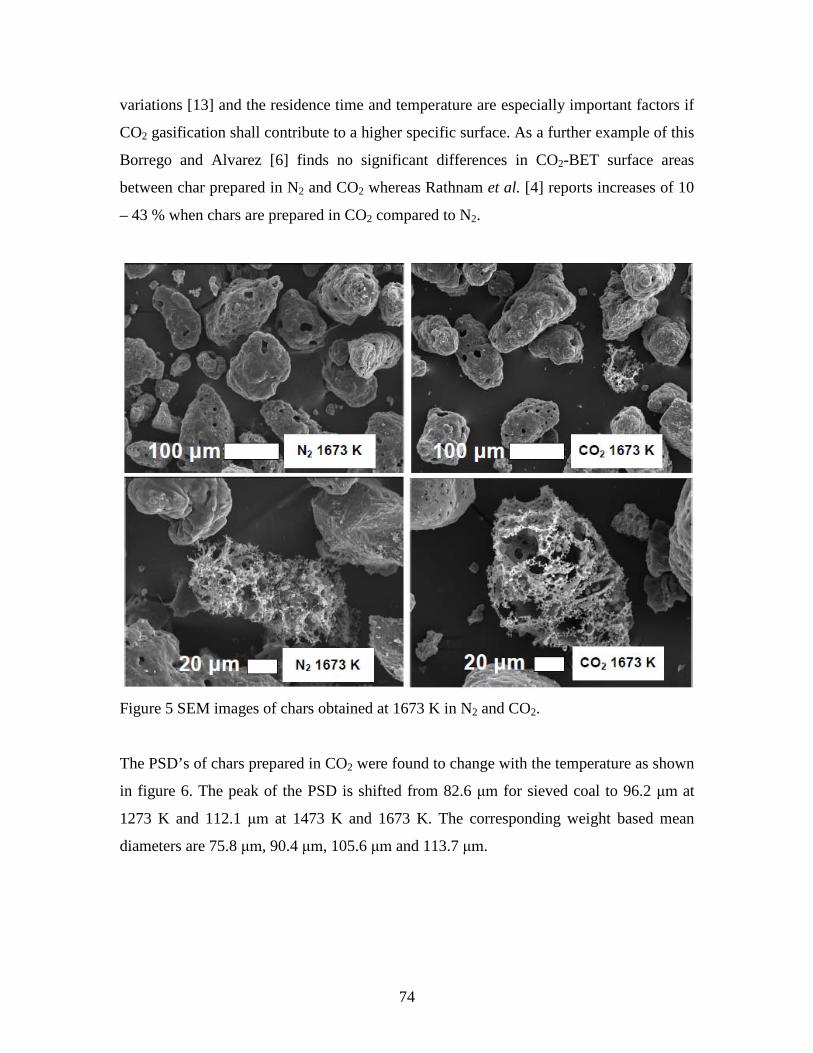
74
variations [13] and the residence time and temperature are especially important factors if
CO2 gasification shall contribute to a higher specific surface. As a further example of this
Borrego and Alvarez [6] finds no significant differences in CO2-BET surface areas
between char prepared in N2 and CO2 whereas Rathnam et al. [4] reports increases of 10
– 43 % when chars are prepared in CO2 compared to N2.
Figure 5 SEM images of chars obtained at 1673 K in N2 and CO2.
The PSD’s of chars prepared in CO2 were found to change with the temperature as shown
in figure 6. The peak of the PSD is shifted from 82.6 μm for sieved coal to 96.2 μm at
1273 K and 112.1 μm at 1473 K and 1673 K. The corresponding weight based mean
diameters are 75.8 μm, 90.4 μm, 105.6 μm and 113.7 μm.
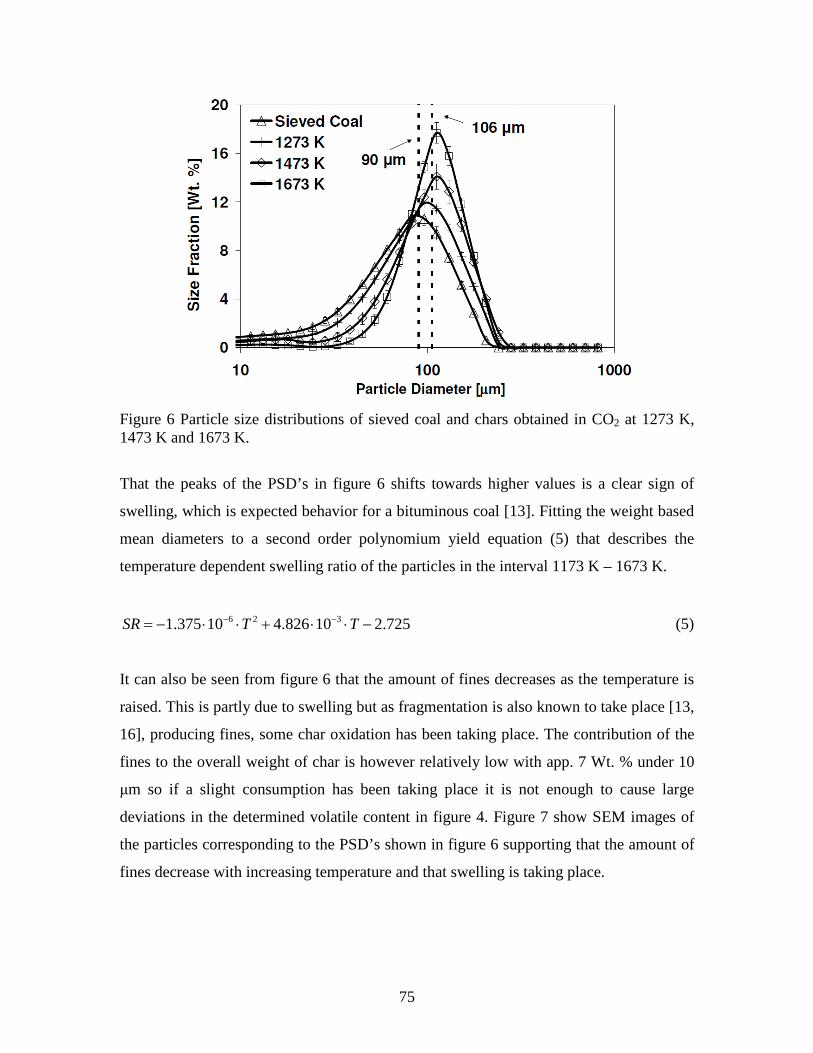
75
Figure 6 Particle size distributions of sieved coal and chars obtained in CO2 at 1273 K, 1473 K and 1673 K.
That the peaks of the PSD’s in figure 6 shifts towards higher values is a clear sign of
swelling, which is expected behavior for a bituminous coal [13]. Fitting the weight based
mean diameters to a second order polynomium yield equation (5) that describes the
temperature dependent swelling ratio of the particles in the interval 1173 K – 1673 K.
6 2 31.375 10 4.826 10 2.725SR T T− −= − ⋅ ⋅ + ⋅ ⋅ − (5)
It can also be seen from figure 6 that the amount of fines decreases as the temperature is
raised. This is partly due to swelling but as fragmentation is also known to take place [13,
16], producing fines, some char oxidation has been taking place. The contribution of the
fines to the overall weight of char is however relatively low with app. 7 Wt. % under 10
μm so if a slight consumption has been taking place it is not enough to cause large
deviations in the determined volatile content in figure 4. Figure 7 show SEM images of
the particles corresponding to the PSD’s shown in figure 6 supporting that the amount of
fines decrease with increasing temperature and that swelling is taking place.
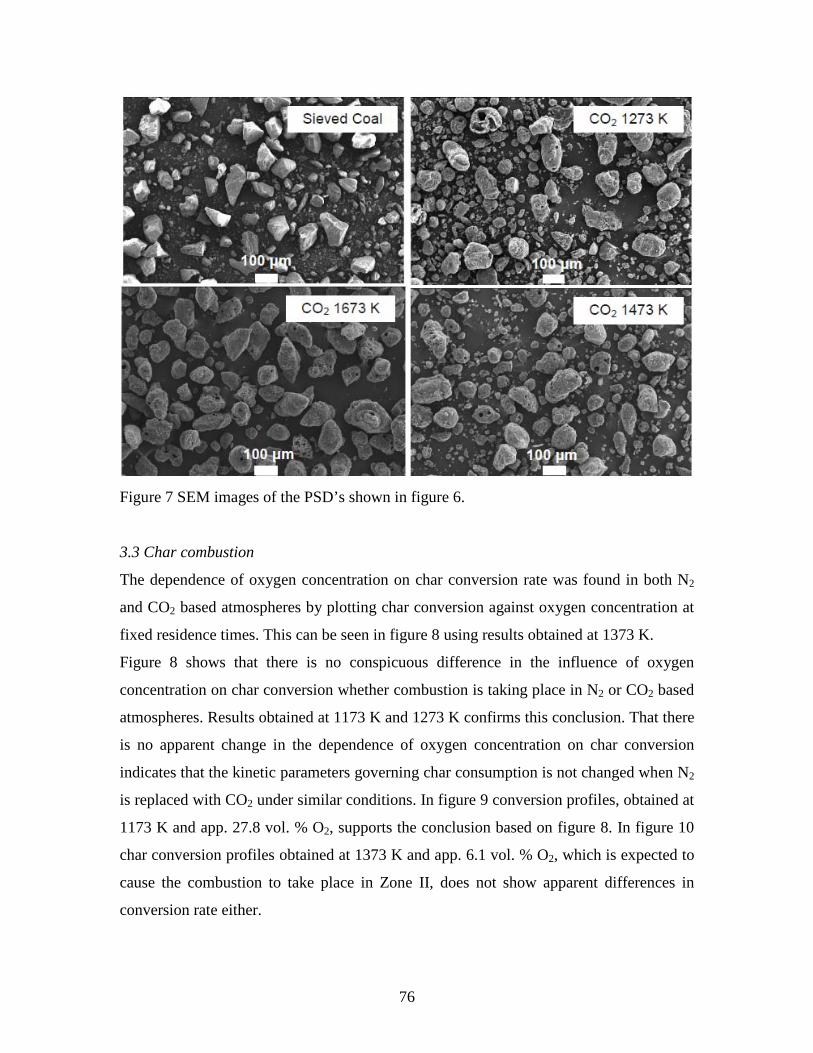
76
Figure 7 SEM images of the PSD’s shown in figure 6.
3.3 Char combustion
The dependence of oxygen concentration on char conversion rate was found in both N2
and CO2 based atmospheres by plotting char conversion against oxygen concentration at
fixed residence times. This can be seen in figure 8 using results obtained at 1373 K.
Figure 8 shows that there is no conspicuous difference in the influence of oxygen
concentration on char conversion whether combustion is taking place in N2 or CO2 based
atmospheres. Results obtained at 1173 K and 1273 K confirms this conclusion. That there
is no apparent change in the dependence of oxygen concentration on char conversion
indicates that the kinetic parameters governing char consumption is not changed when N2
is replaced with CO2 under similar conditions. In figure 9 conversion profiles, obtained at
1173 K and app. 27.8 vol. % O2, supports the conclusion based on figure 8. In figure 10
char conversion profiles obtained at 1373 K and app. 6.1 vol. % O2, which is expected to
cause the combustion to take place in Zone II, does not show apparent differences in
conversion rate either.
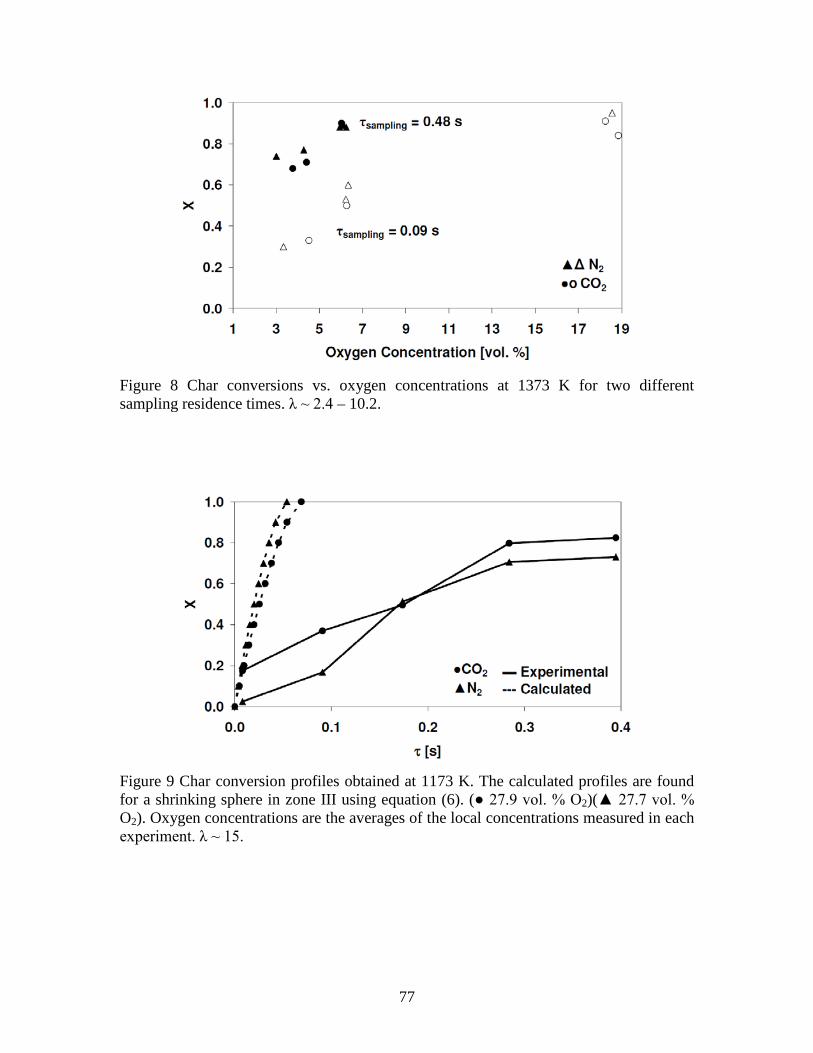
77
Figure 8 Char conversions vs. oxygen concentrations at 1373 K for two different sampling residence times. λ ~ 2.4 – 10.2.
Figure 9 Char conversion profiles obtained at 1173 K. The calculated profiles are found for a shrinking sphere in zone III using equation (6). ( 27.9 vol. % O2)( 27.7 vol. % O2). Oxygen concentrations are the averages of the local concentrations measured in each experiment. λ ~ 15.
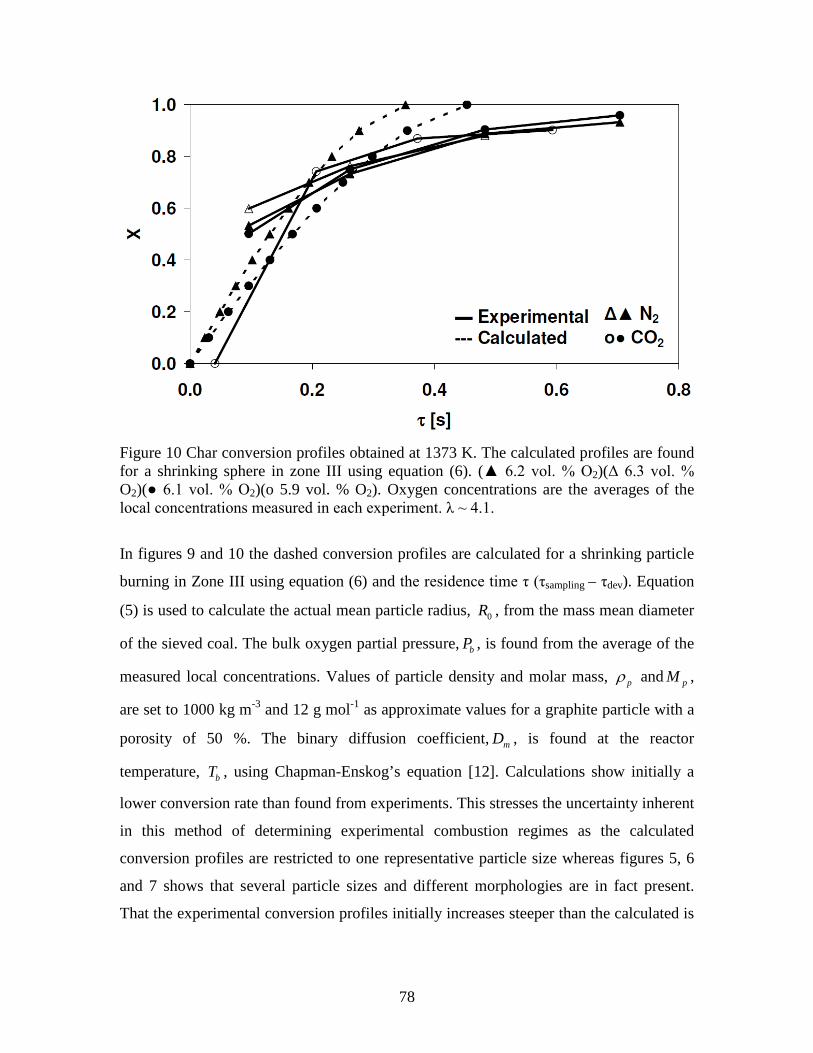
78
Figure 10 Char conversion profiles obtained at 1373 K. The calculated profiles are found for a shrinking sphere in zone III using equation (6). ( 6.2 vol. % O2)(Δ 6.3 vol. % O2)( 6.1 vol. % O2)(o 5.9 vol. % O2). Oxygen concentrations are the averages of the local concentrations measured in each experiment. λ ~ 4.1.
In figures 9 and 10 the dashed conversion profiles are calculated for a shrinking particle
burning in Zone III using equation (6) and the residence time τ (τsampling – τdev). Equation
(5) is used to calculate the actual mean particle radius, 0R , from the mass mean diameter
of the sieved coal. The bulk oxygen partial pressure, bP , is found from the average of the
measured local concentrations. Values of particle density and molar mass, pρ and pM ,
are set to 1000 kg m-3 and 12 g mol-1 as approximate values for a graphite particle with a
porosity of 50 %. The binary diffusion coefficient, mD , is found at the reactor
temperature, bT , using Chapman-Enskog’s equation [12]. Calculations show initially a
lower conversion rate than found from experiments. This stresses the uncertainty inherent
in this method of determining experimental combustion regimes as the calculated
conversion profiles are restricted to one representative particle size whereas figures 5, 6
and 7 shows that several particle sizes and different morphologies are in fact present.
That the experimental conversion profiles initially increases steeper than the calculated is
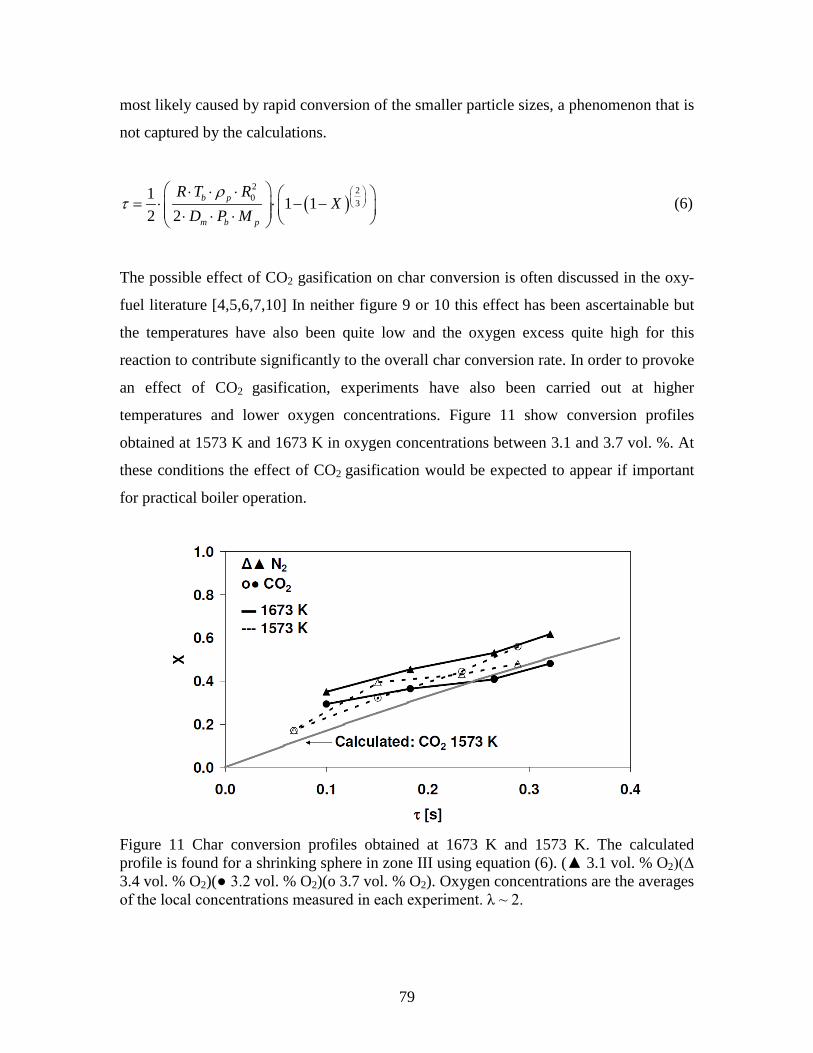
79
most likely caused by rapid conversion of the smaller particle sizes, a phenomenon that is
not captured by the calculations.
( )2 20 3
1 1 12 2
b p
m b p
R T RX
D P Mρ
τ
⋅ ⋅ ⋅ = ⋅ ⋅ − − ⋅ ⋅ ⋅ (6)
The possible effect of CO2 gasification on char conversion is often discussed in the oxy-
fuel literature [4,5,6,7,10] In neither figure 9 or 10 this effect has been ascertainable but
the temperatures have also been quite low and the oxygen excess quite high for this
reaction to contribute significantly to the overall char conversion rate. In order to provoke
an effect of CO2 gasification, experiments have also been carried out at higher
temperatures and lower oxygen concentrations. Figure 11 show conversion profiles
obtained at 1573 K and 1673 K in oxygen concentrations between 3.1 and 3.7 vol. %. At
these conditions the effect of CO2 gasification would be expected to appear if important
for practical boiler operation.
Figure 11 Char conversion profiles obtained at 1673 K and 1573 K. The calculated profile is found for a shrinking sphere in zone III using equation (6). ( 3.1 vol. % O2)(Δ 3.4 vol. % O2)( 3.2 vol. % O2)(o 3.7 vol. % O2). Oxygen concentrations are the averages of the local concentrations measured in each experiment. λ ~ 2.
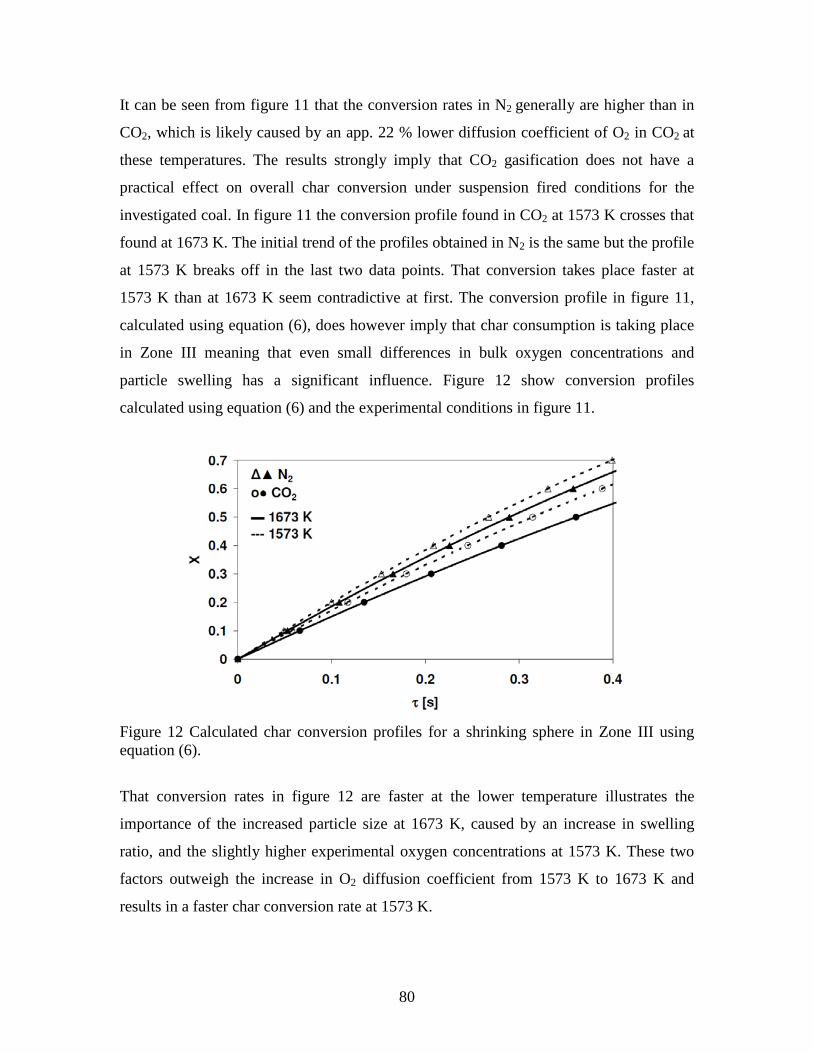
80
It can be seen from figure 11 that the conversion rates in N2 generally are higher than in
CO2, which is likely caused by an app. 22 % lower diffusion coefficient of O2 in CO2 at
these temperatures. The results strongly imply that CO2 gasification does not have a
practical effect on overall char conversion under suspension fired conditions for the
investigated coal. In figure 11 the conversion profile found in CO2 at 1573 K crosses that
found at 1673 K. The initial trend of the profiles obtained in N2 is the same but the profile
at 1573 K breaks off in the last two data points. That conversion takes place faster at
1573 K than at 1673 K seem contradictive at first. The conversion profile in figure 11,
calculated using equation (6), does however imply that char consumption is taking place
in Zone III meaning that even small differences in bulk oxygen concentrations and
particle swelling has a significant influence. Figure 12 show conversion profiles
calculated using equation (6) and the experimental conditions in figure 11.
Figure 12 Calculated char conversion profiles for a shrinking sphere in Zone III using equation (6).
That conversion rates in figure 12 are faster at the lower temperature illustrates the
importance of the increased particle size at 1673 K, caused by an increase in swelling
ratio, and the slightly higher experimental oxygen concentrations at 1573 K. These two
factors outweigh the increase in O2 diffusion coefficient from 1573 K to 1673 K and
results in a faster char conversion rate at 1573 K.
81
4. Conclusion
Devolatilization and combustion of a bituminous coal have been studied in both N2 and
CO2 based atmospheres under suspension fired conditions. Results have been obtained in
the temperature range 1173 K – 1673 K using inlet oxygen concentrations of 5 – 28 vol.
% and sampling residence times up to app. 1 s. No noticeable differences have been
found in volatile yield between N2 and CO2 based environments and SEM images and
N2-BET surface areas of char obtained at 1673 K also show no differences between N2
and CO2 based atmospheres. This indicates that char properties are not influenced by the
gas atmosphere for the investigated bituminous coal. The differences observed in the
literature are believed to be caused by differences in particle temperature histories and
long residence times, which can induce CO2 gasification of reactive coals. With respect
to char conversion, the data show no indication of char gasification by CO2 and the rate of
char conversion is identical at temperatures up to 1373 K in O2/N2 and O2/CO2
atmospheres. Experiments at 1573 K and 1673 K and low oxygen concentrations
between 3.1 and 3.7 vol. % have however shown that the lower molecular diffusion
coefficient of O2 in CO2 compared to N2 becomes important when reaction is taking place
under the influence of external mass transfer limitations leading to slower burnout in
O2/CO2. Comparison of experimental char conversion profiles and profiles calculated for
a shrinking sphere have shown the importance of considering the entire PSD and char
morphology when modeling char oxidation.

82
Acknowledgement
The research leading to these results has received funding from the European
Community's Research Fund for Coal and Steel (RFCS) under contract n° RFCR-CT-
2006-00007, project FRIENDLYCOAL, and is also sponsored by the Danish Agency for
Science, Technology and Innovation. The support and funding from these entities are
greatly valued.
83
References
[1] Davison J. Performance and costs of power plants with capture and storage of CO2.
Energy 2007;32:1163-6.
[2] Figueroa JD, Fout T, Plasynski S, McIlvried H, Srivastava RD. Advances in CO2
capture technology-The U.S. department of energy’s carbon sequestration program. Int J
Greenhouse Gas Control 2008;2:9-0
[3] Buhre BJP, Elliot LK, Sheng CD, Gupta RP, Wall TF. Oxy-fuel combustion
technology for coal-fired power generation. Prog Energy Combust Sci. 2005;31:283-7
[4] Rathnam RK, Elliot LK, Wall TF, Liu Y, Moghtaderi B. Differences in reactivity of
pulverized coal in air (O2/N2) and oxy-fuel (O2/CO2) conditions. Fuel Process Technol
2009;90:797-2
[5] Al-Makhadmeh L, Maier J, Scheffknecht G. Coal pyrolysis and char combustion
under oxy-fuel conditions. 34’Th international technical conference on coal utilization &
fuel systems, Clearwater Florida 2009
[6] Borrego AG, Alvarez D. Comparison of chars obtained under oxy-fuel and
conventional pulverized coal combustion atmospheres. Energy Fuels 2007;21:3171-9
[7] Li Q, Zhao C, Chen X, Wu W, Li Y. Comparison of pulverized coal combustion in air
and in O2/CO2 mixtures by thermo-gravimetric analysis. J Anal Appl Pyrolysis
2009;85:521-8
[8] Duan L, Zhao C, Zhou W, Qu C, Chen X. Investigation on coal pyrolysis in CO2
atmosphere. Energy Fuels 2009;23:3826-0
84
[9] Jamil K, Hayashi J-i, Li C-Z. Pyrolysis of Victorian brown coal and gasification of
nascent char in CO2 atmosphere in a wire-mesh reactor. Fuel 2004;83:833-3
[10] Várhegyi G, Szabó P, Jakab E, Till F. Mathematical modeling of char reactivity in
Ar-O2 and CO2-O2 mixtures. Energy Fuels 1996;10:1208-4
[11] Bejarano PA, Levendis YA. Single-coal-particle combustion in O2/N2 and O2/CO2
environments. Combust Flame 2008;153:270-7
[12] Bird RB, Stewart WE, Lightfoot EN. Transport Phenomena, 2nd ed. John Wiley &
Sons, Inc; 2002
[13] Yu J, Lucas JA, Wall TF. Formation of the structure of chars during devolatilization
of pulverized coal and its Thermoproperties. Prog Energy Combust Sci 2007;33:135-0
[14] Molina A, Shaddix CR. Ignition and devolatilization of pulverized bituminous coal
particles during oxygen/carbon dioxide combustion. Proc Combust Inst 2007;31:1905-2
[15] Ballester J, Jiménez S. Kinetic parameters for the oxidation of pulverized coal as
measured from drop tube tests. Combust Flame 2005;142:210-2
[16] Chen W.-H, Du S.-W, Yang T.-H. Volatile release and particle formation
characteristics of injected pulverized coal in blast furnaces. Energy Convers Manage
2007;48;2025-3
85
Article II Coal Char Reactivity: A Thermogravimetric Study on Chars Obtained in O2/N2 and O2/CO2 in an Entrained Flow Reactor Under Suspension
Fired Conditions and in a TGA
86
Coal Char Reactivity: A Thermogravimetric Study on Chars Obtained in O2/N2 and O2/CO2 in an Entrained Flow Reactor Under Suspension Fired Conditions and in a TGA. Jacob Brix, Morten Storgaard Petersen, Jesper Banke Grossmann, Peter Glarborg, Peter Arendt Jensen, Anker Degn Jensen* Department of Chemical and Biochemical Engineering, Building 229 Søltofts Plads, 2800 Kgs. Lyngby, Denmark
*Corresponding Author: e-mail: [email protected], Fax: +45 45 88 22 58, Phone: +45 45 25 28 41
Abstract
Intrinsic kinetics for combustion and gasification of coal char has been studied by
ThermoGravimetric Analysis (TGA) in O2/N2 and O2/CO2 at 5 vol. % O2 and in CO2/N2
at 80 vol. % CO2. Chars were prepared in situ in the TGA in N2 or in an Entrained Flow
Reactor (EFR) in either O2/N2 or O2/CO2 under suspension fired conditions. The
experiments did not reveal a change in char combustion reactivity with O2 when N2 was
replaced with CO2 during char formation and combustion. Gasification was seen in the
TGA at temperatures above app. 1100 K in an O2 free environment but in the presence of
O2 char consumption was completed below 1000 K. A gradual deactivation towards O2
of chars produced in the EFR at progressively increasing temperatures was observed in
the TGA. Combustion reactivity profiles of chars partly combusted in the EFR at high O2
concentrations showed two distinct peaks indicating phases of different reactivity. This is
attributed to high particle peak temperatures in the EFR that cause a molten/deactivated
phase to form. An Arrhenius expression including the effect of deactivation is presented
for both combustion and gasification.
Keywords: Oxy-fuel, Combustion, TGA, EFR, Char, Kinetics
87
1. Introduction
In the global political and scientific communities, it is a growing concern that
anthropogenic CO2 emissions seem to cause increasing temperatures on earth. As a result
research programs to pursue alternative energy production technologies are initiated all
over the world, many of which are focusing on the emission of CO2 from fossil fuel
combustion. Today fossil fuels account for approximately 85 %1,2 of the power and heat
production worldwide wherefore new technologies, not presently mature, are unlikely to
substitute fossil fuels such as coal the next several decades3. To accommodate this, power
plants today relaying on conventional coal combustion are under strain to reduce their
emissions through technological innovation.
A new technology that could prove able to reduce power plants CO2 emissions markedly
is the oxy-fuel combustion process. In oxy-fuel combustion, O2 is separated from air
before the boiler and mixed with recycled flue gas to obtain a plant exit stream of almost
pure CO23,4. This CO2 stream can subsequently be stored in suitable geological
formations such as depleted oil and gas reservoirs or saline aquifers2,4.
Being an emerging technology many technical aspects still need to be clarified if oxy-fuel
combustion is to be industrialized. A key aspect for industrialization is the clarification of
coal and char combustion characteristics, and a question often raised is whether CO2
gasification may contribute to char conversion or changes in char reactivity. To address
these issues, experimental methods for reliable kinetic measurements must be established
as the feature of CO2 as a reactant that can influence devolatilization and char conversion
is highly dependent on operating conditions. Furthermore, char formation and
deactivation in O2/N2 and O2/CO2 must also be elucidated.
Li et al.5 investigated pulverized bituminous coal pyrolysis and combustion in N2 and
CO2 based atmospheres. They used a TGA at heating rates of 10, 20 and 30 K min-1, a
maximum temperature of 1273 K and particle sizes in the ranges < 48 μm, 48 – 74 μm
and 74 – 90 μm. For their combustion experiments they used O2 concentrations of 21, 30,
40 and 80 vol. % in CO2 or air. From pyrolysis experiments Li et al.5 saw an effect of
CO2 gasification at temperatures above 1073 K that resulted in a faster sample mass loss
than in N2. The quantitative effect of CO2 gasification was small, however, and the
overall pyrolysis mass loss rate was lower than 2.5 wt. % min-1 even at 1273 K. This is
88
consistent with results of Várhegyi et al.6 and Rathnam et al.7 who also saw a small
quantitative effect of gasification above 1030 - 1073 K at similar conditions. Duan et al.8
conducted TGA pyrolysis with a bituminous coal (< 100 μm) using either N2 or CO2 and
heating rates of 10, 30, 50 or 70 K min-1. Peak temperatures of 973 K, 1073 K, 1173 K or
1273 K were reached in their experiments. When N2 was replaced with CO2, Duan et al.8
saw increases in weight loss of as much as 8 wt. % at 1273 K and gasification was
initiated already at 753 K. This initiation temperature is much lower than found by Li et
al.5, Várhegyi et al.6 and Rathnam et al.7 and could indicate that the char used by Duan et
al.8 was particularly reactive. Even though CO2 gasification was observed by Li et al.5,
Várhegyi et al.6, Rathnam et al.7 and Duan et al.8, their results can not be transferred
directly to industrial conditions as residence times used by the authors were from 10 min.
and up whereas industrial scale pyrolysis is finished in a few hundred milliseconds.
In the presence of O2 Li et al.5 found an app. 7 % lower conversion rate in O2/CO2 than in
O2/N2 at 21 vol. % O2, which they attributed to a characteristic difference between N2 and
CO2 based combustion. Further analysis of their data by the present authors yields
activation energies in the range 20 – 50 kJ mol-1, however; well below the values
typically reported in the literature for char combustion under kinetic control. This implies
that the difference encountered by Li et al.5 arise from mass transfer limitations in their
TGA. Using a char obtained from Drop Tube Furnace (DTF) pyrolysis of a low rank coal
at 1673 K in N2 Li et al.9 also found that mass transfer influenced their TGA reactivity
measurements resulting in activation energies of 82.46 kJ mol-1 and 74.66 kJ mol-1 in
O2/CO2 and O2/N2 respectively.
Várhegyi et al.6 conducted TGA experiments at O2 concentrations between 5 and 100
vol. % using either Ar or CO2 as balance gas under careful control of the combustion
regime to ensure a kinetically controlled reaction. Using two different bituminous coals
and a lignite coal Várhegyi et al.6 did not find an effect of CO2 when O2 was present at
heating rates of 10, 20 and 50 K min-1 to a maximum temperature of 1223 K. Similar
experiments by Liu10 and Rathnam et al.7 support the conclusion of Várhegyi et al.6. In
O2/CO2 Liu10 found an activation energy of 127.8 kJ mol-1 for bituminous char and 138.0
kJ mol-1 for anthracitic char, both of which are consistent with literature findings in
O2/N211. Rathnam et al.7 used a bituminous char pyrolized in a DTF at 1673 K in N2,
89
similar to the work of Li et al.9, whereas Liu10 prepared his chars at the same conditions
as proximate analysis. Even though results of Li et al.5, Li et al.9, Várhegyi et al.6, Liu10
and Rathnam et al.7 do not suggest that gasification is influencing intrinsic kinetics, it is
not possible from their experiments to foresee a potential effect at suspension fired
conditions as only Rathnam et al.7 and Li et al.9 prepared their chars in high temperature
setups and both in N2.
Zolin et al.11 investigated the reliability of kinetic measurements by comparing TGA
reactivities of a suite of coals, ranking from subbituminous to low volatile bituminous,
with reactivities found from EFR experiments. Their TGA experiments were carried out
isothermally in the temperature interval 723 – 923 K at 20 vol. % O2 using in situ
pyrolysis at 1173 K in N2 to prepare chars from 90 – 105 μm coal samples. EFR
reference experiments were carried out at 6 and 12 vol. % O2 with coal particles in the
size range 106 – 125 μm and combustion temperatures of approximately 1673 K. For
most of the coals tested a good consistency in the trend of relative reactivities found in
the TGA and EFR was seen, even though the absolute reactivity for individual coals
deviated between the two setups. Zolin et al.11 found that for some of the coals the
reactivity dropped significantly when shifting the TGA with the EFR compared to the
behavior of the other coals. This was explained by the authors with a high content of
inertinite compared to vitrinite in these coals, causing a more severe deactivation at EFR
conditions. The reactivity measured from TGA experiments were generally significantly
higher than that measured from EFR experiments, witnessing of significant thermal
deactivation of the char in the EFR. Zolin et al.11 also saw deviations in reactivity
between the TGA and EFR experiments caused by the catalytic effect of mineral matter
in the TGA. The work of Zolin et al.11 illustrates the inherent uncertainty that exists when
kinetic parameters derived from TGA experiments where both pyrolysis and char
oxidation is performed at low temperatures and heating rates are used at suspension fired
conditions; a conclusion that is supported by the similar work of Manquais et al.12 and
from measurements of ignition temperatures in similar setups by Faúndez et al.13.
The short review above shows that there is a need for a consistent TGA analysis of char
reactivity in O2/CO2 and O2/N2 combustion for chars formed at high temperatures in the
relevant gas atmospheres. The experimental link between suspension fired conditions and
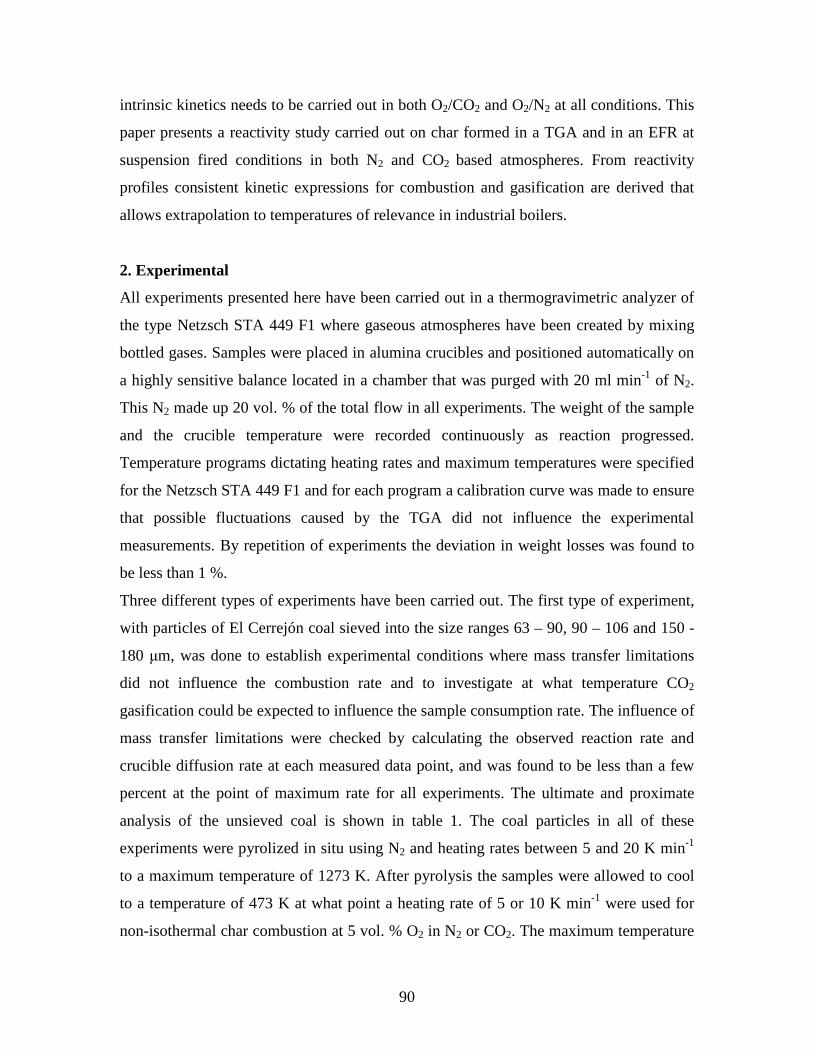
90
intrinsic kinetics needs to be carried out in both O2/CO2 and O2/N2 at all conditions. This
paper presents a reactivity study carried out on char formed in a TGA and in an EFR at
suspension fired conditions in both N2 and CO2 based atmospheres. From reactivity
profiles consistent kinetic expressions for combustion and gasification are derived that
allows extrapolation to temperatures of relevance in industrial boilers.
2. Experimental
All experiments presented here have been carried out in a thermogravimetric analyzer of
the type Netzsch STA 449 F1 where gaseous atmospheres have been created by mixing
bottled gases. Samples were placed in alumina crucibles and positioned automatically on
a highly sensitive balance located in a chamber that was purged with 20 ml min-1 of N2.
This N2 made up 20 vol. % of the total flow in all experiments. The weight of the sample
and the crucible temperature were recorded continuously as reaction progressed.
Temperature programs dictating heating rates and maximum temperatures were specified
for the Netzsch STA 449 F1 and for each program a calibration curve was made to ensure
that possible fluctuations caused by the TGA did not influence the experimental
measurements. By repetition of experiments the deviation in weight losses was found to
be less than 1 %.
Three different types of experiments have been carried out. The first type of experiment,
with particles of El Cerrejón coal sieved into the size ranges 63 – 90, 90 – 106 and 150 -
180 μm, was done to establish experimental conditions where mass transfer limitations
did not influence the combustion rate and to investigate at what temperature CO2
gasification could be expected to influence the sample consumption rate. The influence of
mass transfer limitations were checked by calculating the observed reaction rate and
crucible diffusion rate at each measured data point, and was found to be less than a few
percent at the point of maximum rate for all experiments. The ultimate and proximate
analysis of the unsieved coal is shown in table 1. The coal particles in all of these
experiments were pyrolized in situ using N2 and heating rates between 5 and 20 K min-1
to a maximum temperature of 1273 K. After pyrolysis the samples were allowed to cool
to a temperature of 473 K at what point a heating rate of 5 or 10 K min-1 were used for
non-isothermal char combustion at 5 vol. % O2 in N2 or CO2. The maximum temperature
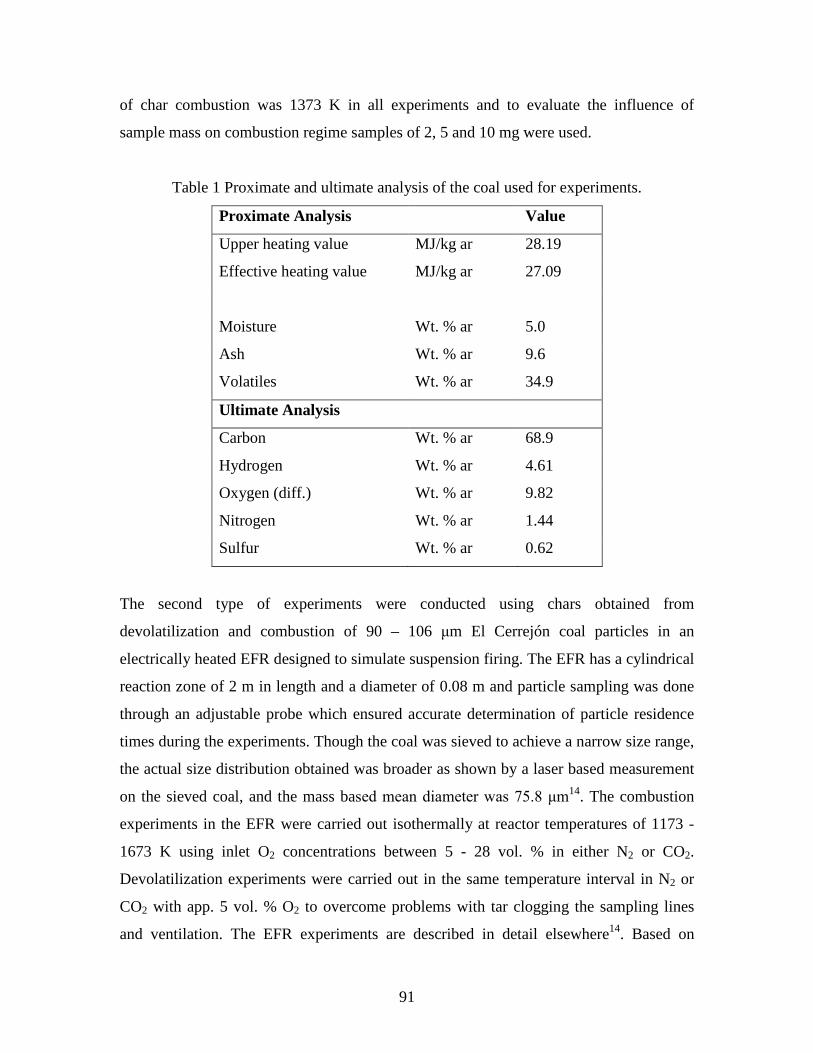
91
of char combustion was 1373 K in all experiments and to evaluate the influence of
sample mass on combustion regime samples of 2, 5 and 10 mg were used.
Table 1 Proximate and ultimate analysis of the coal used for experiments.
Proximate Analysis Value
Upper heating value MJ/kg ar 28.19
Effective heating value MJ/kg ar 27.09
Moisture Wt. % ar 5.0
Ash Wt. % ar 9.6
Volatiles Wt. % ar 34.9
Ultimate Analysis
Carbon Wt. % ar 68.9
Hydrogen Wt. % ar 4.61
Oxygen (diff.) Wt. % ar 9.82
Nitrogen Wt. % ar 1.44
Sulfur Wt. % ar 0.62
The second type of experiments were conducted using chars obtained from
devolatilization and combustion of 90 – 106 μm El Cerrejón coal particles in an
electrically heated EFR designed to simulate suspension firing. The EFR has a cylindrical
reaction zone of 2 m in length and a diameter of 0.08 m and particle sampling was done
through an adjustable probe which ensured accurate determination of particle residence
times during the experiments. Though the coal was sieved to achieve a narrow size range,
the actual size distribution obtained was broader as shown by a laser based measurement
on the sieved coal, and the mass based mean diameter was 75.8 μm14. The combustion
experiments in the EFR were carried out isothermally at reactor temperatures of 1173 -
1673 K using inlet O2 concentrations between 5 - 28 vol. % in either N2 or CO2.
Devolatilization experiments were carried out in the same temperature interval in N2 or
CO2 with app. 5 vol. % O2 to overcome problems with tar clogging the sampling lines
and ventilation. The EFR experiments are described in detail elsewhere14. Based on
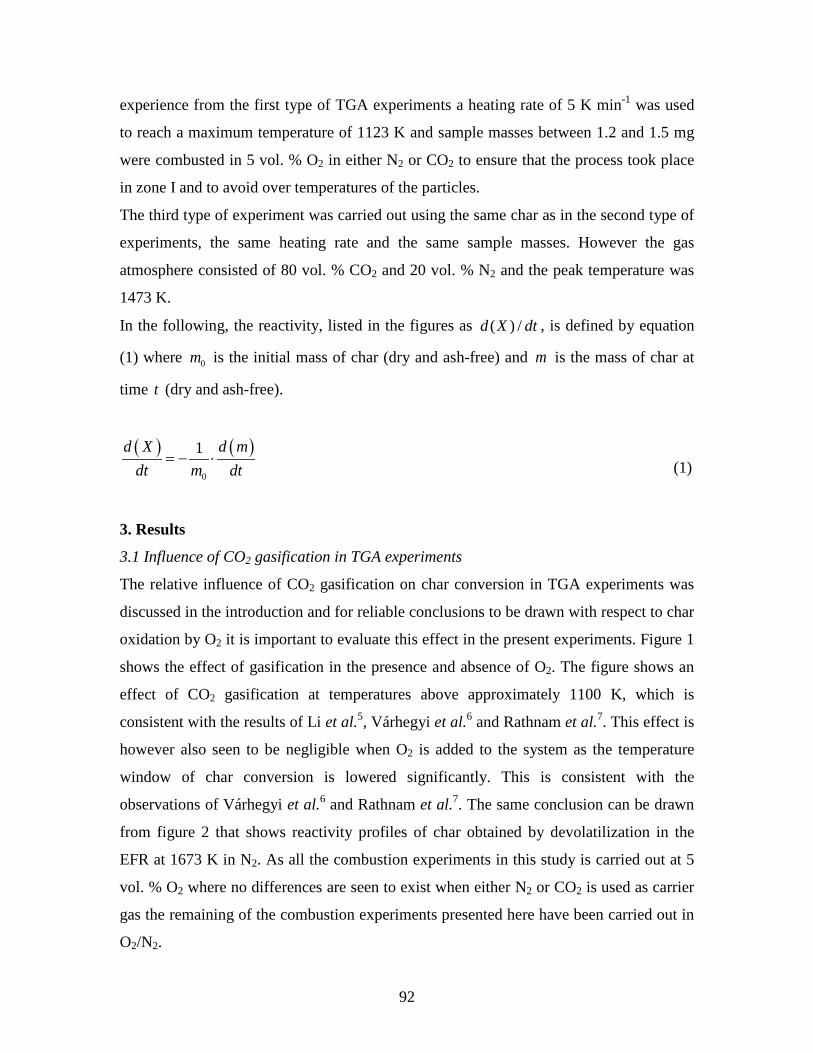
92
experience from the first type of TGA experiments a heating rate of 5 K min-1 was used
to reach a maximum temperature of 1123 K and sample masses between 1.2 and 1.5 mg
were combusted in 5 vol. % O2 in either N2 or CO2 to ensure that the process took place
in zone I and to avoid over temperatures of the particles.
The third type of experiment was carried out using the same char as in the second type of
experiments, the same heating rate and the same sample masses. However the gas
atmosphere consisted of 80 vol. % CO2 and 20 vol. % N2 and the peak temperature was
1473 K.
In the following, the reactivity, listed in the figures as dtXd /)( , is defined by equation
(1) where 0m is the initial mass of char (dry and ash-free) and m is the mass of char at
time t (dry and ash-free).
( ) ( )0
1d X d mdt m dt
= − ⋅
(1)
3. Results
3.1 Influence of CO2 gasification in TGA experiments
The relative influence of CO2 gasification on char conversion in TGA experiments was
discussed in the introduction and for reliable conclusions to be drawn with respect to char
oxidation by O2 it is important to evaluate this effect in the present experiments. Figure 1
shows the effect of gasification in the presence and absence of O2. The figure shows an
effect of CO2 gasification at temperatures above approximately 1100 K, which is
consistent with the results of Li et al.5, Várhegyi et al.6 and Rathnam et al.7. This effect is
however also seen to be negligible when O2 is added to the system as the temperature
window of char conversion is lowered significantly. This is consistent with the
observations of Várhegyi et al.6 and Rathnam et al.7. The same conclusion can be drawn
from figure 2 that shows reactivity profiles of char obtained by devolatilization in the
EFR at 1673 K in N2. As all the combustion experiments in this study is carried out at 5
vol. % O2 where no differences are seen to exist when either N2 or CO2 is used as carrier
gas the remaining of the combustion experiments presented here have been carried out in
O2/N2.
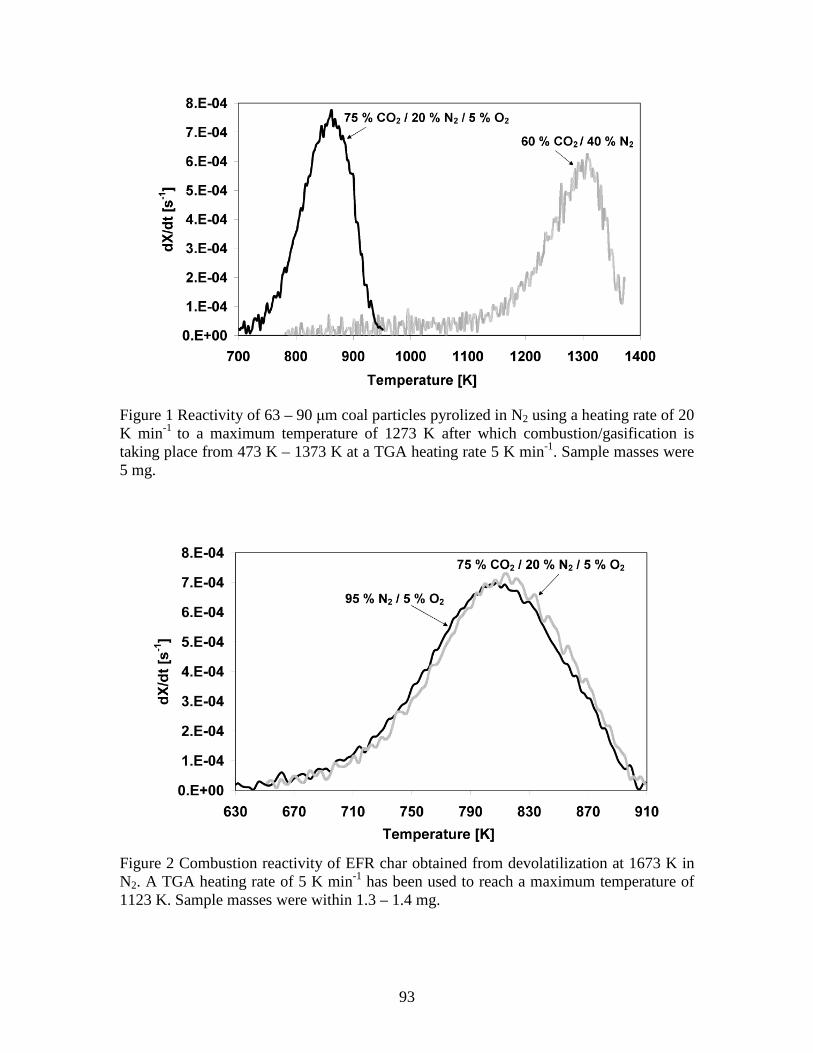
93
Figure 1 Reactivity of 63 – 90 μm coal particles pyrolized in N2 using a heating rate of 20 K min-1 to a maximum temperature of 1273 K after which combustion/gasification is taking place from 473 K – 1373 K at a TGA heating rate 5 K min-1. Sample masses were 5 mg.
Figure 2 Combustion reactivity of EFR char obtained from devolatilization at 1673 K in N2. A TGA heating rate of 5 K min-1 has been used to reach a maximum temperature of 1123 K. Sample masses were within 1.3 – 1.4 mg.
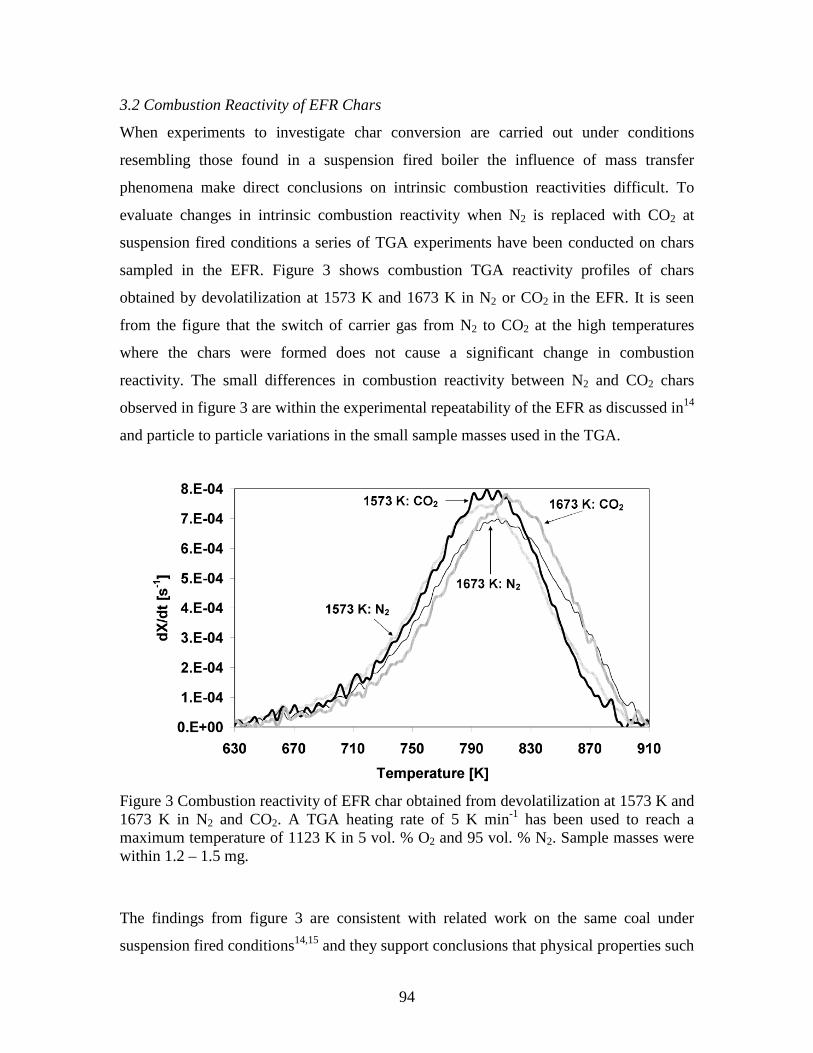
94
3.2 Combustion Reactivity of EFR Chars
When experiments to investigate char conversion are carried out under conditions
resembling those found in a suspension fired boiler the influence of mass transfer
phenomena make direct conclusions on intrinsic combustion reactivities difficult. To
evaluate changes in intrinsic combustion reactivity when N2 is replaced with CO2 at
suspension fired conditions a series of TGA experiments have been conducted on chars
sampled in the EFR. Figure 3 shows combustion TGA reactivity profiles of chars
obtained by devolatilization at 1573 K and 1673 K in N2 or CO2 in the EFR. It is seen
from the figure that the switch of carrier gas from N2 to CO2 at the high temperatures
where the chars were formed does not cause a significant change in combustion
reactivity. The small differences in combustion reactivity between N2 and CO2 chars
observed in figure 3 are within the experimental repeatability of the EFR as discussed in14
and particle to particle variations in the small sample masses used in the TGA.
Figure 3 Combustion reactivity of EFR char obtained from devolatilization at 1573 K and 1673 K in N2 and CO2. A TGA heating rate of 5 K min-1 has been used to reach a maximum temperature of 1123 K in 5 vol. % O2 and 95 vol. % N2. Sample masses were within 1.2 – 1.5 mg.
The findings from figure 3 are consistent with related work on the same coal under
suspension fired conditions14,15 and they support conclusions that physical properties such
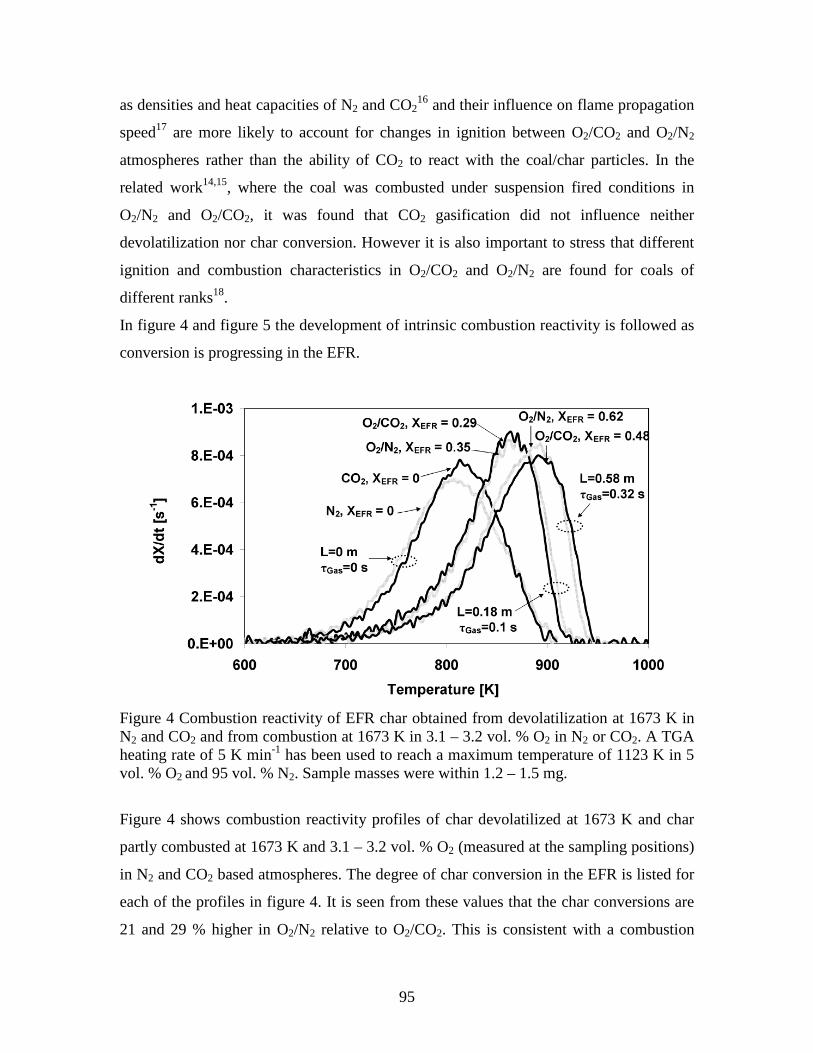
95
as densities and heat capacities of N2 and CO216 and their influence on flame propagation
speed17 are more likely to account for changes in ignition between O2/CO2 and O2/N2
atmospheres rather than the ability of CO2 to react with the coal/char particles. In the
related work14,15, where the coal was combusted under suspension fired conditions in
O2/N2 and O2/CO2, it was found that CO2 gasification did not influence neither
devolatilization nor char conversion. However it is also important to stress that different
ignition and combustion characteristics in O2/CO2 and O2/N2 are found for coals of
different ranks18.
In figure 4 and figure 5 the development of intrinsic combustion reactivity is followed as
conversion is progressing in the EFR.
Figure 4 Combustion reactivity of EFR char obtained from devolatilization at 1673 K in N2 and CO2 and from combustion at 1673 K in 3.1 – 3.2 vol. % O2 in N2 or CO2. A TGA heating rate of 5 K min-1 has been used to reach a maximum temperature of 1123 K in 5 vol. % O2 and 95 vol. % N2. Sample masses were within 1.2 – 1.5 mg.
Figure 4 shows combustion reactivity profiles of char devolatilized at 1673 K and char
partly combusted at 1673 K and 3.1 – 3.2 vol. % O2 (measured at the sampling positions)
in N2 and CO2 based atmospheres. The degree of char conversion in the EFR is listed for
each of the profiles in figure 4. It is seen from these values that the char conversions are
21 and 29 % higher in O2/N2 relative to O2/CO2. This is consistent with a combustion
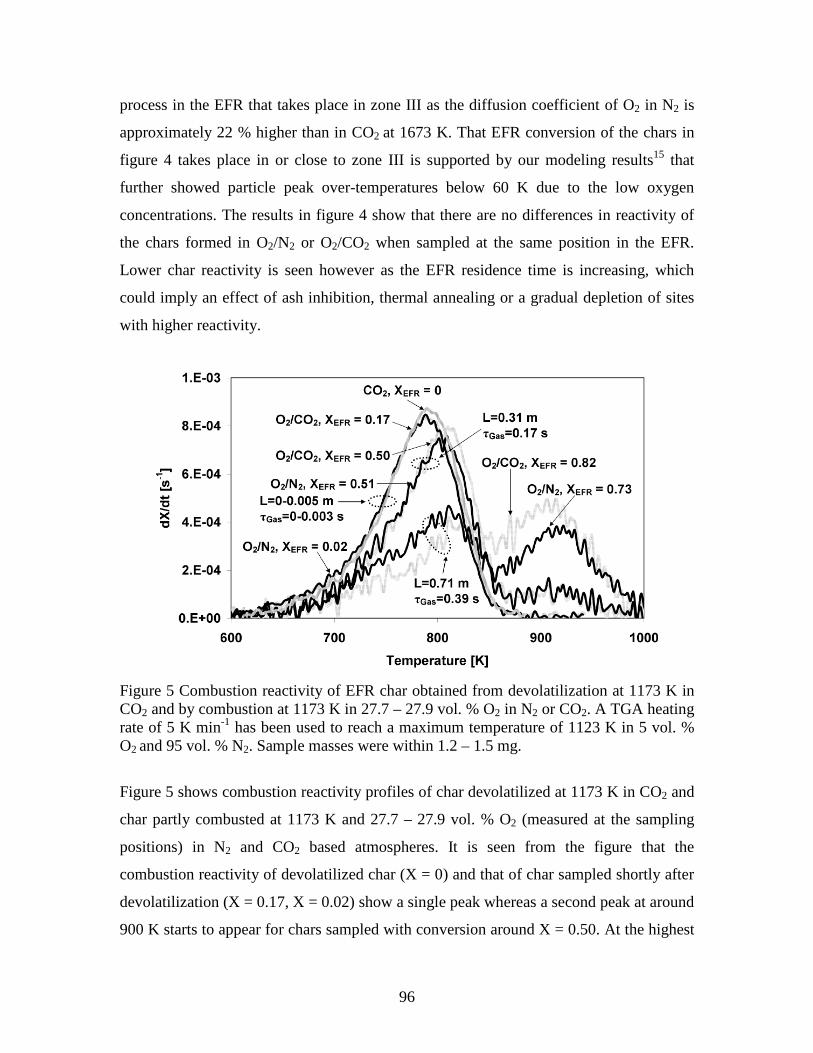
96
process in the EFR that takes place in zone III as the diffusion coefficient of O2 in N2 is
approximately 22 % higher than in CO2 at 1673 K. That EFR conversion of the chars in
figure 4 takes place in or close to zone III is supported by our modeling results15 that
further showed particle peak over-temperatures below 60 K due to the low oxygen
concentrations. The results in figure 4 show that there are no differences in reactivity of
the chars formed in O2/N2 or O2/CO2 when sampled at the same position in the EFR.
Lower char reactivity is seen however as the EFR residence time is increasing, which
could imply an effect of ash inhibition, thermal annealing or a gradual depletion of sites
with higher reactivity.
Figure 5 Combustion reactivity of EFR char obtained from devolatilization at 1173 K in CO2 and by combustion at 1173 K in 27.7 – 27.9 vol. % O2 in N2 or CO2. A TGA heating rate of 5 K min-1 has been used to reach a maximum temperature of 1123 K in 5 vol. % O2 and 95 vol. % N2. Sample masses were within 1.2 – 1.5 mg.
Figure 5 shows combustion reactivity profiles of char devolatilized at 1173 K in CO2 and
char partly combusted at 1173 K and 27.7 – 27.9 vol. % O2 (measured at the sampling
positions) in N2 and CO2 based atmospheres. It is seen from the figure that the
combustion reactivity of devolatilized char (X = 0) and that of char sampled shortly after
devolatilization (X = 0.17, X = 0.02) show a single peak whereas a second peak at around
900 K starts to appear for chars sampled with conversion around X = 0.50. At the highest
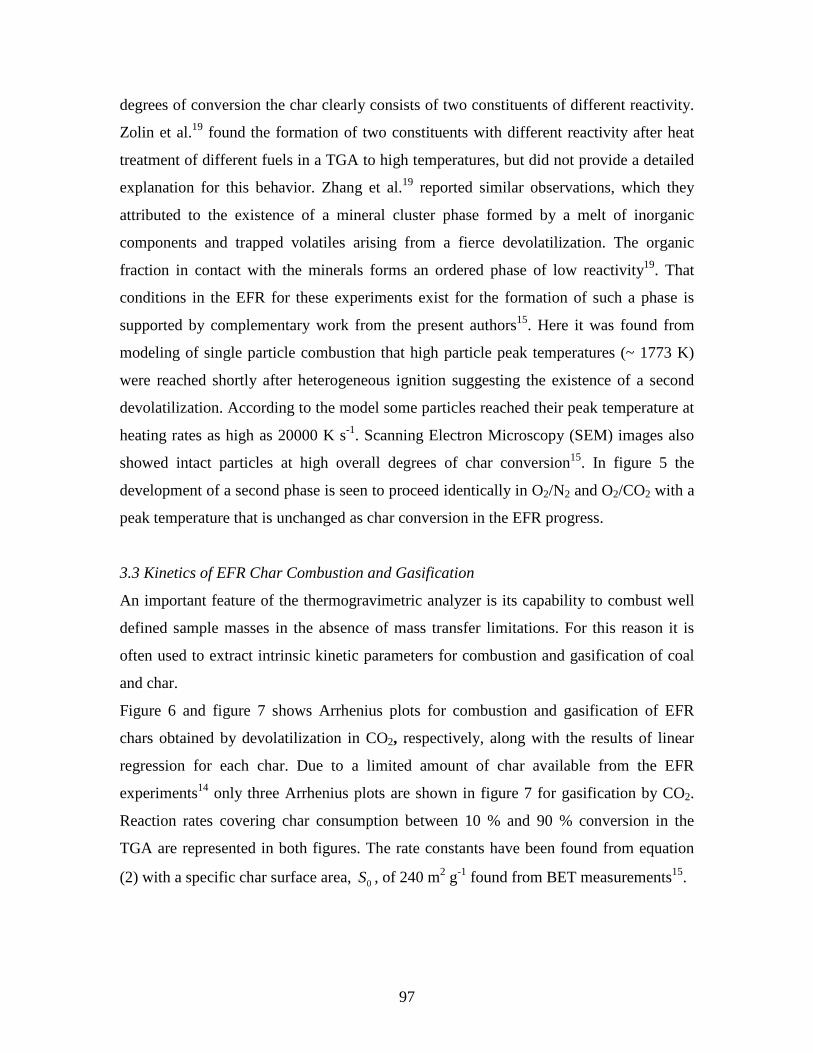
97
degrees of conversion the char clearly consists of two constituents of different reactivity.
Zolin et al.19 found the formation of two constituents with different reactivity after heat
treatment of different fuels in a TGA to high temperatures, but did not provide a detailed
explanation for this behavior. Zhang et al.19 reported similar observations, which they
attributed to the existence of a mineral cluster phase formed by a melt of inorganic
components and trapped volatiles arising from a fierce devolatilization. The organic
fraction in contact with the minerals forms an ordered phase of low reactivity19. That
conditions in the EFR for these experiments exist for the formation of such a phase is
supported by complementary work from the present authors15. Here it was found from
modeling of single particle combustion that high particle peak temperatures (~ 1773 K)
were reached shortly after heterogeneous ignition suggesting the existence of a second
devolatilization. According to the model some particles reached their peak temperature at
heating rates as high as 20000 K s-1. Scanning Electron Microscopy (SEM) images also
showed intact particles at high overall degrees of char conversion15. In figure 5 the
development of a second phase is seen to proceed identically in O2/N2 and O2/CO2 with a
peak temperature that is unchanged as char conversion in the EFR progress.
3.3 Kinetics of EFR Char Combustion and Gasification
An important feature of the thermogravimetric analyzer is its capability to combust well
defined sample masses in the absence of mass transfer limitations. For this reason it is
often used to extract intrinsic kinetic parameters for combustion and gasification of coal
and char.
Figure 6 and figure 7 shows Arrhenius plots for combustion and gasification of EFR
chars obtained by devolatilization in CO2, respectively, along with the results of linear
regression for each char. Due to a limited amount of char available from the EFR
experiments14 only three Arrhenius plots are shown in figure 7 for gasification by CO2.
Reaction rates covering char consumption between 10 % and 90 % conversion in the
TGA are represented in both figures. The rate constants have been found from equation
(2) with a specific char surface area, 0S , of 240 m2 g-1 found from BET measurements15.
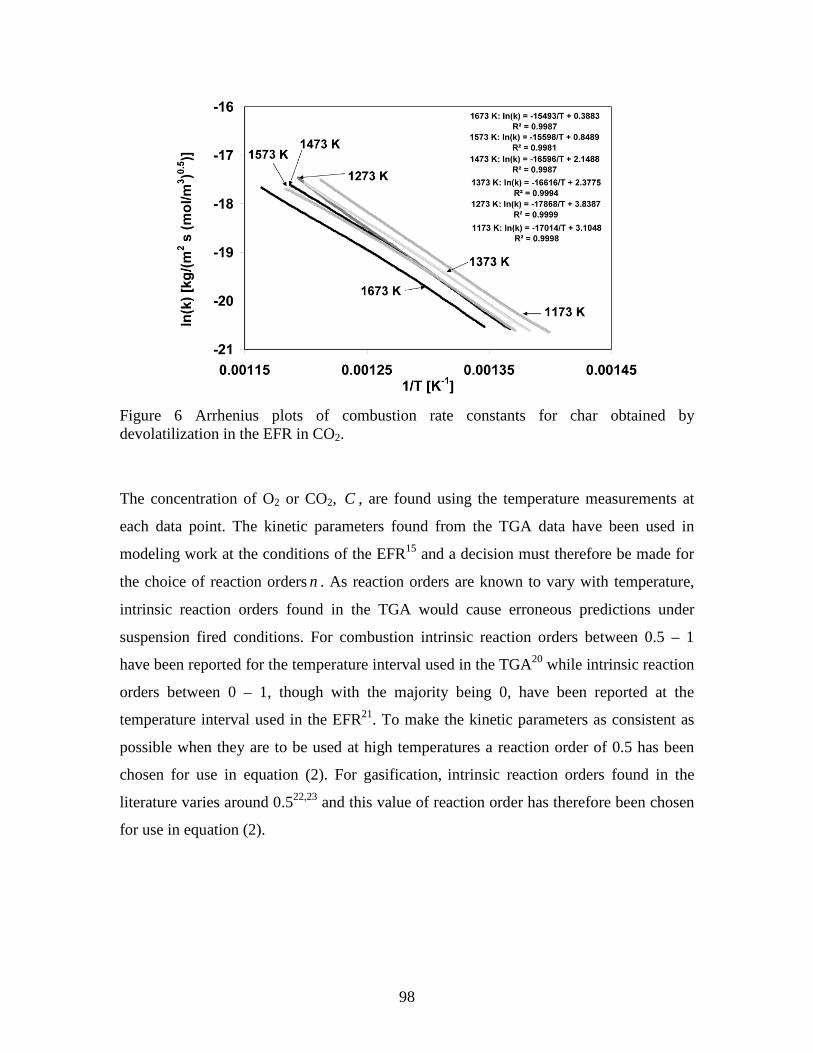
98
Figure 6 Arrhenius plots of combustion rate constants for char obtained by devolatilization in the EFR in CO2.
The concentration of O2 or CO2, C , are found using the temperature measurements at
each data point. The kinetic parameters found from the TGA data have been used in
modeling work at the conditions of the EFR15 and a decision must therefore be made for
the choice of reaction orders n . As reaction orders are known to vary with temperature,
intrinsic reaction orders found in the TGA would cause erroneous predictions under
suspension fired conditions. For combustion intrinsic reaction orders between 0.5 – 1
have been reported for the temperature interval used in the TGA20 while intrinsic reaction
orders between 0 – 1, though with the majority being 0, have been reported at the
temperature interval used in the EFR21. To make the kinetic parameters as consistent as
possible when they are to be used at high temperatures a reaction order of 0.5 has been
chosen for use in equation (2). For gasification, intrinsic reaction orders found in the
literature varies around 0.522,23 and this value of reaction order has therefore been chosen
for use in equation (2).
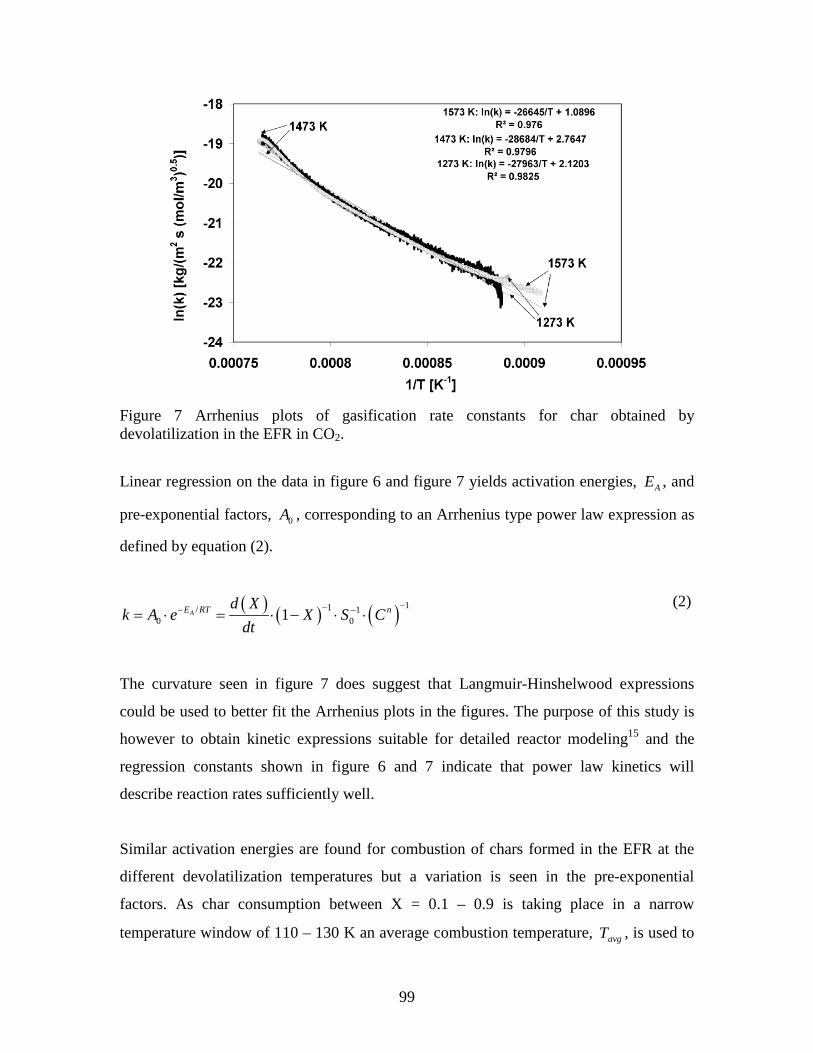
99
Figure 7 Arrhenius plots of gasification rate constants for char obtained by devolatilization in the EFR in CO2.
Linear regression on the data in figure 6 and figure 7 yields activation energies, AE , and
pre-exponential factors, 0A , corresponding to an Arrhenius type power law expression as
defined by equation (2).
( ) ( ) ( ) 11/ 10 01AE RT nd X
k A e X S Cdt
−−− −= ⋅ = ⋅ − ⋅ ⋅ (2)
The curvature seen in figure 7 does suggest that Langmuir-Hinshelwood expressions
could be used to better fit the Arrhenius plots in the figures. The purpose of this study is
however to obtain kinetic expressions suitable for detailed reactor modeling15 and the
regression constants shown in figure 6 and 7 indicate that power law kinetics will
describe reaction rates sufficiently well.
Similar activation energies are found for combustion of chars formed in the EFR at the
different devolatilization temperatures but a variation is seen in the pre-exponential
factors. As char consumption between X = 0.1 – 0.9 is taking place in a narrow
temperature window of 110 – 130 K an average combustion temperature, avgT , is used to
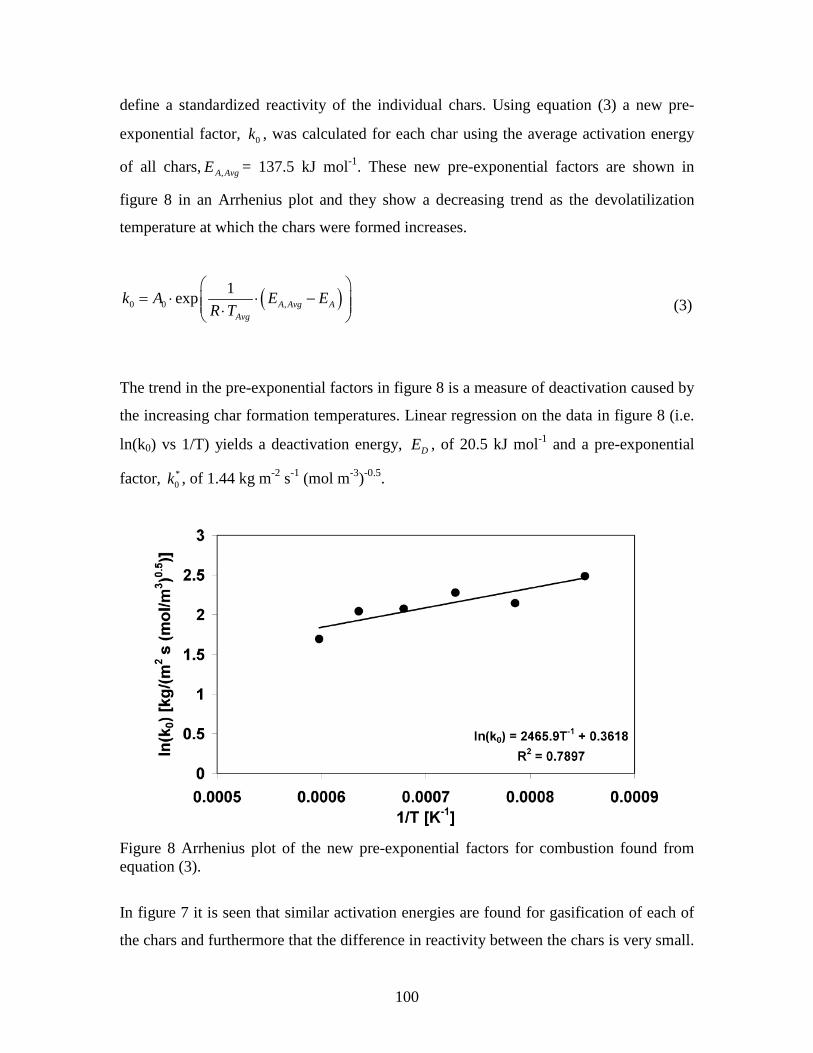
100
define a standardized reactivity of the individual chars. Using equation (3) a new pre-
exponential factor, 0k , was calculated for each char using the average activation energy
of all chars, AvgAE , = 137.5 kJ mol-1. These new pre-exponential factors are shown in
figure 8 in an Arrhenius plot and they show a decreasing trend as the devolatilization
temperature at which the chars were formed increases.
( )0 0 ,1exp A Avg A
Avg
k A E ER T
= ⋅ ⋅ − ⋅
(3)
The trend in the pre-exponential factors in figure 8 is a measure of deactivation caused by
the increasing char formation temperatures. Linear regression on the data in figure 8 (i.e.
ln(k0) vs 1/T) yields a deactivation energy, DE , of 20.5 kJ mol-1 and a pre-exponential
factor, *0k , of 1.44 kg m-2 s-1 (mol m-3)-0.5.
Figure 8 Arrhenius plot of the new pre-exponential factors for combustion found from equation (3).
In figure 7 it is seen that similar activation energies are found for gasification of each of
the chars and furthermore that the difference in reactivity between the chars is very small.
101
The reason for the small difference in reactivity is probably that the range of
devolatilization temperatures covered by the chars is rather narrow. Senneca and
Salatino24 did show that CO2 gasification reactivity is influenced by thermal deactivation
although to a much lower extent than reactivity towards oxygen. However, based on the
present data the gasification reaction was modeled without taking deactivation into
account. Fitting of the data gave a deactivation energy of 0 kJ mol-1, an average pre-
exponential factor, 0k , of 7.33 kg m-2 s-1 (mol m-3)-0.5 and an average activation energy of
230.8 kJ mol-1.
From the kinetic analysis of combustion and gasification above, a general Arrhenius
expression that includes thermal deactivation can be defined as in equation (4) with the
kinetic parameters listed in table 2.
Table 2 Intrinsic kinetic parameters to be used in (4). Species/Property n ED [kJ mol-1] EA [kJ mol-1] k0* [kg m-2 s-1 (mol m-3)-0.5]
O2 0.5 20.5 137.5 1.44
CO2 0.5 0 230.8 7.33
When equation (4) is used *T is the highest temperature a particle has reached during its
conversion, which assumes a rapid deactivation to a pseudo steady value at any given *T .
This means that thermal deactivation, which is the governing mechanism of deactivation
under oxidizing conditions, is accounted for in equation (4) throughout the particles life
time. For gasification the deactivation part in equation (4) will cancel and the expression
will reduce to a normal Arrhenius expression, i.e. *00 kk =
*0 *exp expD AE Ek k
R T R T− = ⋅ ⋅ ⋅ ⋅
(4)
The rate constant in (4) has been used successfully to simulate combustion in O2/N2 and
O2/CO2 based atmospheres in the EFR as discussed by these authors elsewhere15.
102
4. Conclusion
Combustion and gasification of char has been studied in a ThermoGravimetric Analyzer
(TGA). Chars were prepared from in situ pyrolysis in the TGA using N2 and from
devolatilization and combustion in O2/N2 and O2/CO2 in an Entrained Flow Reactor
(EFR) under suspension fired conditions. From experiments on TGA chars in CO2/N2 and
O2/CO2/N2 it was found that the influence of CO2 gasification during combustion in the
TGA was negligible in the temperature window where the chars were converted.
Combustion reactivity profiles of EFR chars did not reveal any differences between chars
obtained by devolatilization in N2 and CO2. The development of two char constituents
with different reactivity was seen when combustion in the EFR was taking place at high
O2 concentrations of about 28 vol. %. This is attributed to high particle peak temperatures
that cause a highly deactivated phase, possibly composed of organic as well as inorganic
components, to form in some particles.
Intrinsic kinetics in terms of Arrhenius parameters for combustion and gasification were
obtained from reactivity profiles of char formed at temperatures between 1173 K and
1673 K in the EFR. For combustion it was found that significant char deactivation was
taking place in the EFR as the reactor temperature increased and the kinetic expression
for combustion therefore includes a deactivation term. For the chars investigated with
respect to CO2 gasification no deactivation was observed and so this reaction was
described by a simple Arrhenius expression.
103
Acknowledgement
The research leading to these results has received funding from the European
Community's Research Fund for Coal and Steel (RFCS) under contract n° RFCR-CT-
2006-00007, project FRIENDLYCOAL, and is also sponsored by the Danish Agency for
Science, Technology and Innovation and Energinet.dk. The support and funding from
these entities are greatly valued.
104
References
(1) Davison, J. Energy. 2007, 32, 1163-1176.
(2) Figueroa, J. D.; Fout, T.; Plasynski, S.; McIlvried, H.; Srivastava, R. D. Int J
Greenhouse Gas Control. 2008, 2, 9-20.
(3) Buhre, B. J. P.; Elliot, L. K.; Sheng, C. D.; Gupta, R. P.; Wall, T. F. Prog Energy
Combust Sci. 2005, 31, 283-307.
(4) Toftegaard, M. B.; Brix, J.; Jensen, P. A.; Glarborg, P.; Jensen, A. D. Prog Energy
Combust Sci. 2010, 36, 581-625.
(5) Li, Q.; Zhao, C.; Chen, X.; Wu, W.; Li, Y. J. Anal. Appl. Pyrolysis. 2009, 85, 521-
528.
(6) Várhegyi, G.; Szabó, P.; Jakab, E.; Till, F.; Richard, J-R. Energy Fuels. 1996, 10,
1208-1214.
(7) Rathnam, R. K.; Elliott, L. K.; Wall, T. F.; Liu, Y.; Moghtaderi, B. Fuel Process.
Technol. 2009, 90, 797-802.
(8) Duan, L.; Zhao, C.; Zhou, W.; Qu, C.; Chen, X. Energy Fuels. 2009, 23, 3826-3840.
(9) Li, X.; Rathnam, R. K.; Yu, J.; Wang, Q.; Wall, T.; Meesri, C. Energy Fuels. 2010,
24, 160-174.
(10) Liu, H. Energy Fuels. 2009, 23, 4278-4285.
(11) Zolin, A.; Jensen, A.; Pedersen, LS.; Dam-Johansen, K.; Tørslev, P. Energy Fuels.
1998, 12, 268-276.
105
(12) Manquais, K. L.; Snape, C.; McRobbie, I.; Barker, J.; Pellegrini, V. Energy Fuels.
2009, 23, 4269-4277.
(13) Faúndez, J.; Arenillas, A.; Rubiera, F.; García, X.; Gordon, A. L.; Pis, J. J. Fuel.
2005, 23, 2172-2177.
(14) Brix, J.; Jensen, P. A.; Jensen, A. D. Fuel. 2010, 89, 3373-3380.
(15) Brix J et al. Fuel (2011), doi:10.1016/j.fuel.2011.01.021
(16) Molina, A.; Shaddix, C. R. Proc Combust Inst. 2007, 31, 1905-1912.
(17) Suda, T.; Masuko, K.; Sato, J.; Yamamoto, A.; Okazaki, K. Fuel. 2007, 86, 2008-
2015.
(18) Bejarano, P. A.; Levendis, Y. A. Combust Flame. 2008, 153, 270-277.
(19) Zhang, H.; Pu, W-X.; Ha, S.; Li, Y.; Sun, M. Fuel. 2009, 88, 2303 – 2310.
(20) Hurt, R. H.; Haynes, B. S. Proc Combust Inst. 2005, 30, 2161-2168.
(21) Hurt, R. H.; Calo, J. M. Combust Flame. 2001, 125, 1138-1149.
(22) Kajatani, S.; Hara, S.; Matsuda, H. Fuel. 2002, 81, 539-546.
(23) Liu, H.; Luo, C.; Toyota, M.; Uemiya, S.; Kojima, T. Fuel Process. Technol. 2006,
87, 769-774.
(24) Senneca, O.; Salatino, P. Proc. Comb. Inst. 2002, 29, 485-493.

106
Article III Modeling Char Conversion under Suspension Fired Conditions in O2/N2
and O2/CO2 Atmospheres
107
Modeling Char Conversion under Suspension Fired Conditions in O2/N2
and O2/CO2 Atmospheres
Jacob Brix, Peter Arendt Jensen, Anker Degn Jensen*
Department of Chemical and Biochemical Engineering, Building 229 Søltofts Plads, 2800 Kgs. Lyngby, Denmark
*Corresponding Author: e-mail: [email protected], Fax: +45 45 88 22 58, Phone: +45 45 25 28 41
Abstract
The aim of this investigation has been to model combustion under suspension fired
conditions in O2/N2 and O2/CO2 mixtures. Experiments used for model validation have
been carried out in an electrically heated Entrained Flow Reactor (EFR) at temperatures
between 1173 K and 1673 K with inlet O2 concentrations between 5 and 28 vol. %. The
COal COmbustion MOdel, COCOMO, includes the three char morphologies:
cenospheric char, network char and dense char each divided between six discrete particle
sizes. Both combustion and gasification with CO2 are accounted for and reaction rates
include thermal char deactivation, which was found to be important for combustion at
high reactor temperatures and high O2 concentrations. COCOMO show in general good
agreement with experimental char conversion profiles at conditions covering zone I-III.
From the experimental profiles no effect of CO2-gasification on char conversion has been
found. COCOMO does however suggest that CO2-gasification in oxy-fuel combustion at
low O2 concentrations can account for as much as 70 % of the overall char consumption
rate during combustion in zone III.
Keywords: Oxy-fuel, Combustion, Char, Modeling
108
1. Introduction
There is an increasing global focus on the anthropogenic CO2 emission to the atmosphere
due to its claimed effect on the earth’s climate. This focus has caused fossil fuelled power
plants, to explore technologies that will allow them to keep using fossil fuels, such as
coal, as a feedstock while reducing CO2 emissions markedly. One technology is oxy-fuel
combustion in which near pure O2 is mixed with recycled flue gas at the entrance to the
boiler, thereby creating a plant exit stream of almost pure CO2 [1]. This CO2 stream can
subsequently be sent to storage in geological formations such as saline aquifers or
depleted oil and gas fields [2].
An important part of the scale up process of the oxy-fuel technology is clarifying
differences in char conversion rates between this technology and conventional air-blown
combustion. As it is the time required for char conversion that determines the size of a
boiler and its heat release profile it is also important that predictive modeling tools are
developed.
There exist many attempts to model char combustion in the literature [3-10]. Many of the
models are very detailed in their description of char morphology, particle size,
fragmentation, ash inhibition, thermal char deactivation and film layer mass transport of
O2, which also means that their outcome is depending on a wide range of parameters that
are often related to specific experimental conditions and equipment. A more detailed
model does however in general do a better job in predicting the combustion process than
simple global models.
In their Char Burnout Kinetic (CBK) model Hurt et al. [4] described the oxidation of coal
char and thereby estimated the fly ash carbon content. The model includes thermal
annealing, statistical kinetics and char densities as well as ash inhibition. The ability of
the model to predict a decrease in conversion rate at high degrees of conversion (X > 90
%), where many other models fail, were mostly due to the inclusion of ash inhibition. The
effect of ash inhibition or ash retention on the conversion rate were also investigated by
Shaddix and Murphy [5] using a shrinking sphere approach. They showed that low or
even negative apparent Arrhenius reaction orders could be expected at the late stages of
char combustion (X > 70 %). Shaddix and Murphy [5] did not find that ash retention
caused a decrease in char conversion rate at conversions below approximately 90 %. On
109
the contrary the lower carbon density caused by the retention of ash caused slightly
higher conversion rates in the earlier stages of combustion than did predictions without
ash retention.
In the development of the CBK model Hurt et al. [11] examined the effect of coal
heterogeneity and found that a distribution of pre-exponential Arrhenius factors,
accounting for the heterogeneity of a Particle Size Distribution (PSD), improved burnout
predictions especially during zone I combustion, where no mass transport limitations
exist and conversion rate is determined only by chemical kinetics, and in the case of
broad PSD’s. The estimation of kinetic parameters is often a cause for concern in
modeling. It has been found that the intrinsic reactivity of bituminous char decreases as
the particle temperature and heating rate during pyrolysis increases. This is due to an
increased graphitization of the char leading to more basal planes that have a lower
content of active carbon sites [12]. The effect of thermal deactivation along with an exact
determination of intrinsic kinetic parameters, obtained in zone I, needs to be accounted
for in trustworthy kinetic expressions that are to be used for combustion across zone I –
III where mass transfer limitations on reactants gradually cause concentration gradients to
form in the particles as the effective concentrations on their surfaces approach zero.
An important feature of many detailed combustion models is the presence of char of
different morphologies. Cloke et al. [6] conducted Drop Tube Furnace (DTF)
experiments at 1573 K, 1423 K and 1273 K using pulverized coal in the size range 106 –
125 μm at 5 % O2. The coal was first devolatilized at the different temperatures using 1
% O2. Through digital images, taken under a microscope and analyzed by a computer,
they divided the chars into three categories; cenospheric char, network char and mixed
char, the latter category being predominately dense. Similar char classifications are
suggested by other researchers [7,13,14]. The char size distribution was described by
Cloke et al. [6] using 8 discrete intervals covering particles between 0 and 150 μm. With
char morphology as input in the CBK model they found relatively good agreement
between simulations and experimental results, though with a tendency of under prediction
by the model. This under prediction was attributed to an over estimation of ash inhibition
in the beginning of the process, i.e. the opposite of what was found by Shaddix &
Murphy [5]. This contradiction witness of the sensitivity of detailed models to inputs
110
such as ash/char porosities, pore sizes, turtoisities and the way in which phenomena such
as ash inhibition are described. In a later paper Cloke et al. [7] conducted similar
experiments at 1573 K using 15 different coals. The chars were classified from image
analysis both as individual coals and as a collected standardized set of input data covering
all coals. Results of predicted char burnout showed reasonable agreement with
experimental results when both types of char classification were used as model input,
suggesting that a generalized morphological description of char can enhance the accuracy
of model predictions without the need for specific experimental measurements.
Experimental char conversion data obtained under oxy-fuel combustion at high
temperatures have been published by several authors [15-19] and low temperature data
are also available in the literature [17,20-22]. Data obtained at high temperatures at
conditions that are encountered in industrial boilers are contradictory regarding the effect
of CO2 gasification. In addition the effect of CO2 gasification suggested by some TGA
investigations appear more likely to be caused by the long residence times and low O2
concentrations used in the experiments.
In the present investigation char consumption from reaction with both O2 and CO2 is
included in a detailed single particle combustion model as an attempt to elucidate under
what conditions CO2-gasification can be expected to contribute to fuel conversion. Model
predictions are compared with an extensive data set covering suspension fired O2/N2 and
O2/CO2 combustion under a wide range of conditions. Conclusions are hereafter drawn
from particle conversion rates, temperature histories and optical appearances determined
by Scanning Electron Microscopy (SEM).
2. Experimental
The experiments were carried out in an electrically heated EFR and are previously
described in the literature [15]. All data on char conversion presented in this text is taken
directly from this reference. The reactor is cylindrical and measures 2 meters in length,
0.08 m in diameter and is shown schematically in figure 1 along with its utilities. The
reaction zone is heated by 7 electrical heating elements and can reach temperatures up to
1773 K. On top of the reactor a 0.8 m long gas preheater, consisting of two heating
elements, preheats the secondary gas stream to a prescribed temperature. Coal is fed to
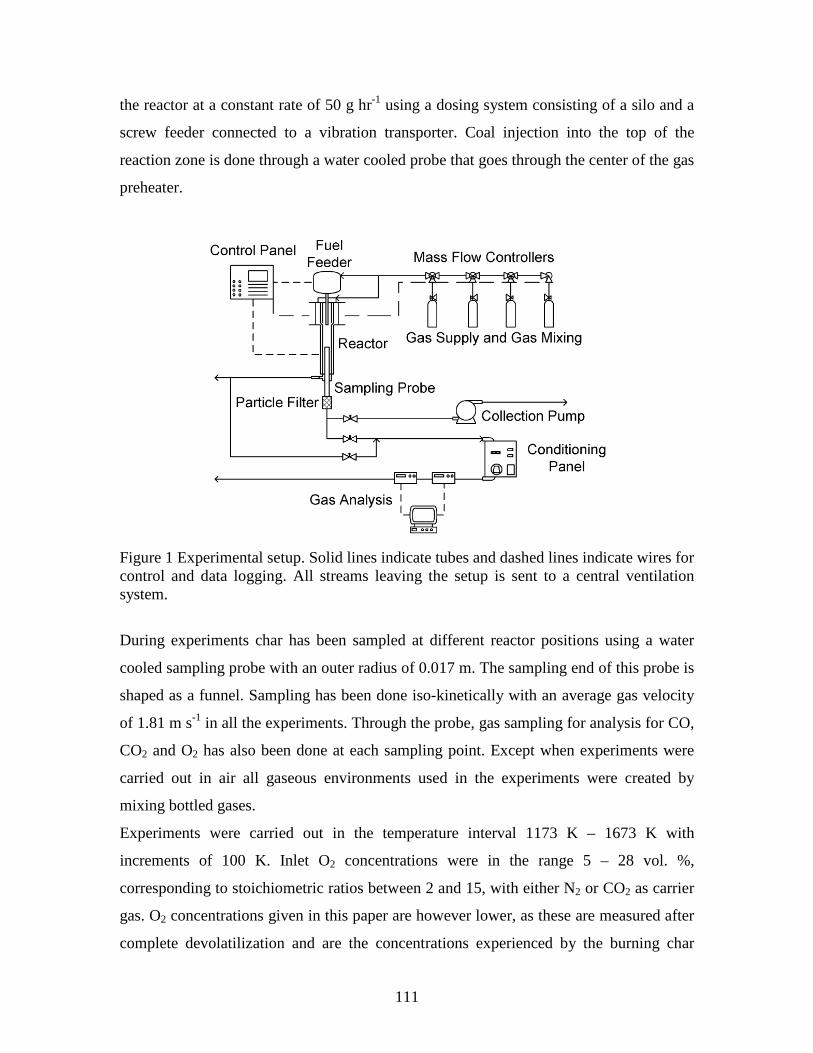
111
the reactor at a constant rate of 50 g hr-1 using a dosing system consisting of a silo and a
screw feeder connected to a vibration transporter. Coal injection into the top of the
reaction zone is done through a water cooled probe that goes through the center of the gas
preheater.
Figure 1 Experimental setup. Solid lines indicate tubes and dashed lines indicate wires for control and data logging. All streams leaving the setup is sent to a central ventilation system.
During experiments char has been sampled at different reactor positions using a water
cooled sampling probe with an outer radius of 0.017 m. The sampling end of this probe is
shaped as a funnel. Sampling has been done iso-kinetically with an average gas velocity
of 1.81 m s-1 in all the experiments. Through the probe, gas sampling for analysis for CO,
CO2 and O2 has also been done at each sampling point. Except when experiments were
carried out in air all gaseous environments used in the experiments were created by
mixing bottled gases.
Experiments were carried out in the temperature interval 1173 K – 1673 K with
increments of 100 K. Inlet O2 concentrations were in the range 5 – 28 vol. %,
corresponding to stoichiometric ratios between 2 and 15, with either N2 or CO2 as carrier
gas. O2 concentrations given in this paper are however lower, as these are measured after
complete devolatilization and are the concentrations experienced by the burning char
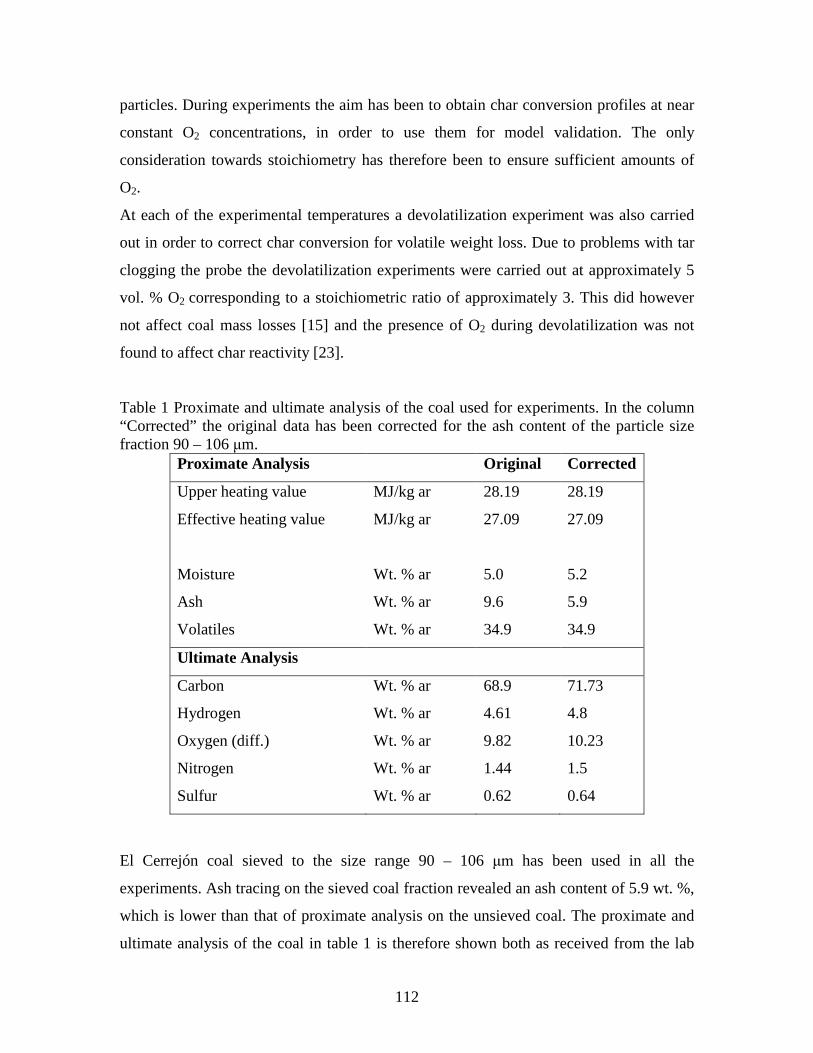
112
particles. During experiments the aim has been to obtain char conversion profiles at near
constant O2 concentrations, in order to use them for model validation. The only
consideration towards stoichiometry has therefore been to ensure sufficient amounts of
O2.
At each of the experimental temperatures a devolatilization experiment was also carried
out in order to correct char conversion for volatile weight loss. Due to problems with tar
clogging the probe the devolatilization experiments were carried out at approximately 5
vol. % O2 corresponding to a stoichiometric ratio of approximately 3. This did however
not affect coal mass losses [15] and the presence of O2 during devolatilization was not
found to affect char reactivity [23].
Table 1 Proximate and ultimate analysis of the coal used for experiments. In the column “Corrected” the original data has been corrected for the ash content of the particle size fraction 90 – 106 μm.
Proximate Analysis Original Corrected
Upper heating value MJ/kg ar 28.19 28.19
Effective heating value MJ/kg ar 27.09 27.09
Moisture Wt. % ar 5.0 5.2
Ash Wt. % ar 9.6 5.9
Volatiles Wt. % ar 34.9 34.9
Ultimate Analysis
Carbon Wt. % ar 68.9 71.73
Hydrogen Wt. % ar 4.61 4.8
Oxygen (diff.) Wt. % ar 9.82 10.23
Nitrogen Wt. % ar 1.44 1.5
Sulfur Wt. % ar 0.62 0.64
El Cerrejón coal sieved to the size range 90 – 106 μm has been used in all the
experiments. Ash tracing on the sieved coal fraction revealed an ash content of 5.9 wt. %,
which is lower than that of proximate analysis on the unsieved coal. The proximate and
ultimate analysis of the coal in table 1 is therefore shown both as received from the lab
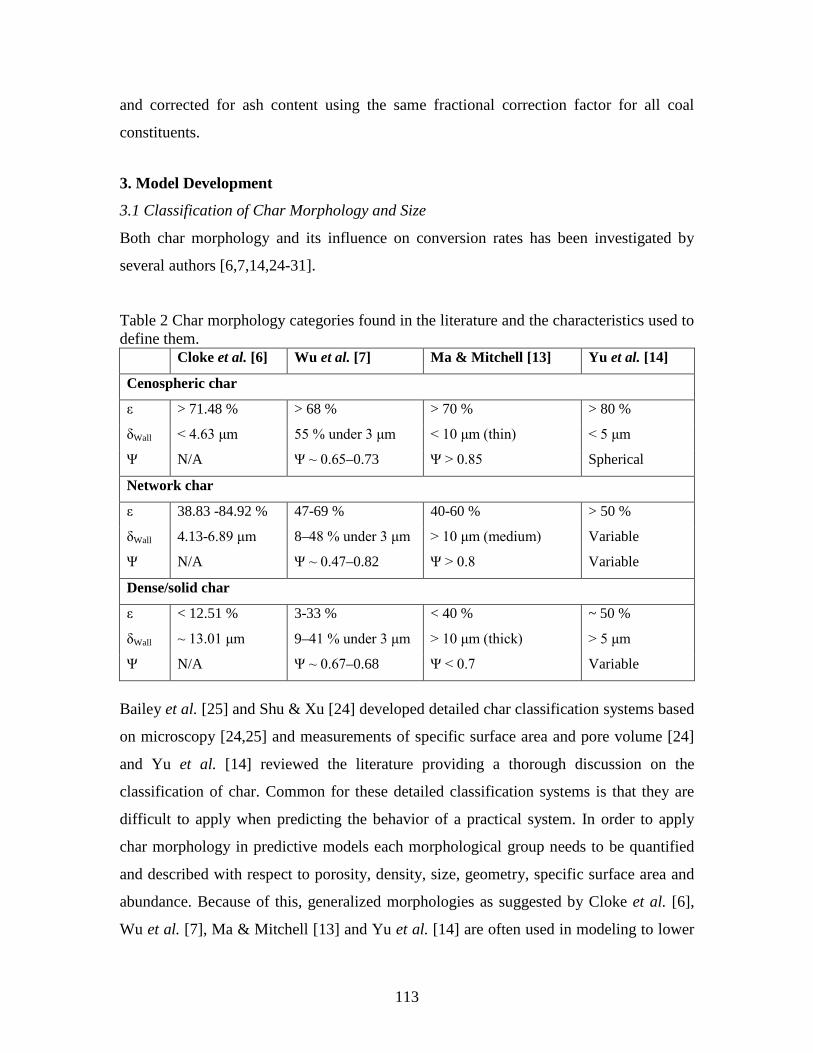
113
and corrected for ash content using the same fractional correction factor for all coal
constituents.
3. Model Development
3.1 Classification of Char Morphology and Size
Both char morphology and its influence on conversion rates has been investigated by
several authors [6,7,14,24-31].
Table 2 Char morphology categories found in the literature and the characteristics used to define them. Cloke et al. [6] Wu et al. [7] Ma & Mitchell [13] Yu et al. [14]
Cenospheric char
ε > 71.48 % > 68 % > 70 % > 80 %
δWall < 4.63 μm 55 % under 3 μm < 10 μm (thin) < 5 μm
Ψ N/A Ψ ~ 0.65–0.73 Ψ > 0.85 Spherical
Network char
ε 38.83 -84.92 % 47-69 % 40-60 % > 50 %
δWall 4.13-6.89 μm 8–48 % under 3 μm > 10 μm (medium) Variable
Ψ N/A Ψ ~ 0.47–0.82 Ψ > 0.8 Variable
Dense/solid char
ε < 12.51 % 3-33 % < 40 % ~ 50 %
δWall ~ 13.01 μm 9–41 % under 3 μm > 10 μm (thick) > 5 μm
Ψ N/A Ψ ~ 0.67–0.68 Ψ < 0.7 Variable
Bailey et al. [25] and Shu & Xu [24] developed detailed char classification systems based
on microscopy [24,25] and measurements of specific surface area and pore volume [24]
and Yu et al. [14] reviewed the literature providing a thorough discussion on the
classification of char. Common for these detailed classification systems is that they are
difficult to apply when predicting the behavior of a practical system. In order to apply
char morphology in predictive models each morphological group needs to be quantified
and described with respect to porosity, density, size, geometry, specific surface area and
abundance. Because of this, generalized morphologies as suggested by Cloke et al. [6],
Wu et al. [7], Ma & Mitchell [13] and Yu et al. [14] are often used in modeling to lower
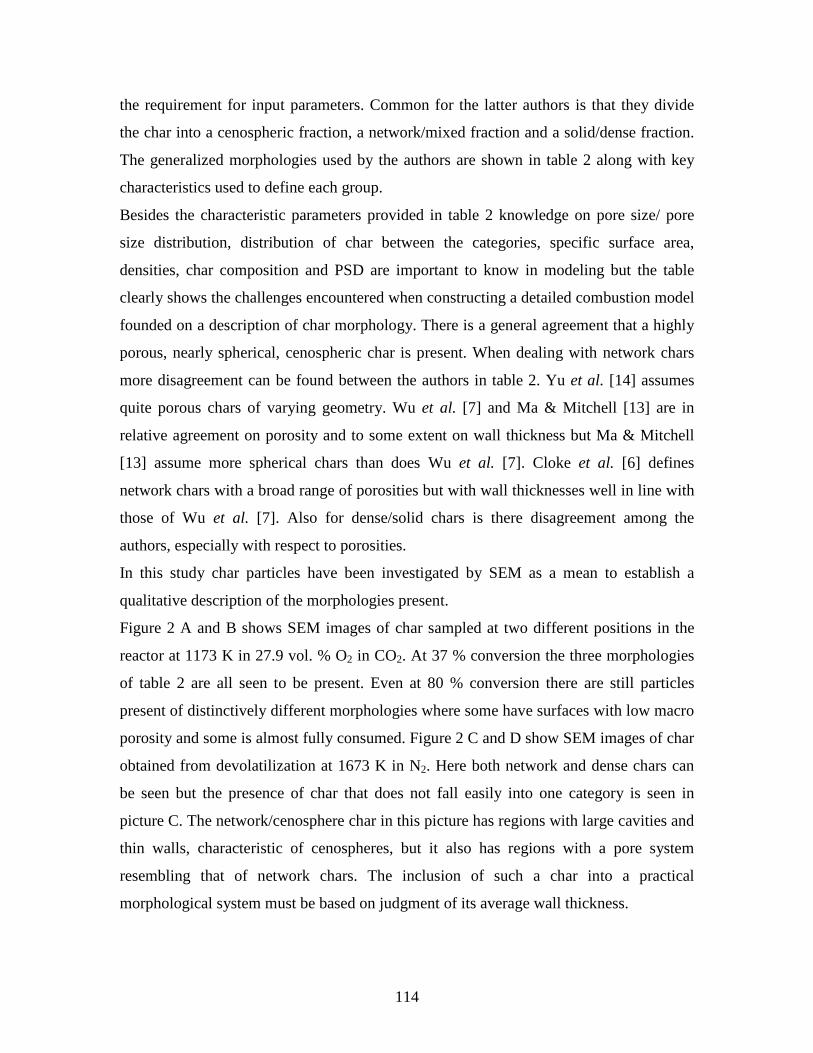
114
the requirement for input parameters. Common for the latter authors is that they divide
the char into a cenospheric fraction, a network/mixed fraction and a solid/dense fraction.
The generalized morphologies used by the authors are shown in table 2 along with key
characteristics used to define each group.
Besides the characteristic parameters provided in table 2 knowledge on pore size/ pore
size distribution, distribution of char between the categories, specific surface area,
densities, char composition and PSD are important to know in modeling but the table
clearly shows the challenges encountered when constructing a detailed combustion model
founded on a description of char morphology. There is a general agreement that a highly
porous, nearly spherical, cenospheric char is present. When dealing with network chars
more disagreement can be found between the authors in table 2. Yu et al. [14] assumes
quite porous chars of varying geometry. Wu et al. [7] and Ma & Mitchell [13] are in
relative agreement on porosity and to some extent on wall thickness but Ma & Mitchell
[13] assume more spherical chars than does Wu et al. [7]. Cloke et al. [6] defines
network chars with a broad range of porosities but with wall thicknesses well in line with
those of Wu et al. [7]. Also for dense/solid chars is there disagreement among the
authors, especially with respect to porosities.
In this study char particles have been investigated by SEM as a mean to establish a
qualitative description of the morphologies present.
Figure 2 A and B shows SEM images of char sampled at two different positions in the
reactor at 1173 K in 27.9 vol. % O2 in CO2. At 37 % conversion the three morphologies
of table 2 are all seen to be present. Even at 80 % conversion there are still particles
present of distinctively different morphologies where some have surfaces with low macro
porosity and some is almost fully consumed. Figure 2 C and D show SEM images of char
obtained from devolatilization at 1673 K in N2. Here both network and dense chars can
be seen but the presence of char that does not fall easily into one category is seen in
picture C. The network/cenosphere char in this picture has regions with large cavities and
thin walls, characteristic of cenospheres, but it also has regions with a pore system
resembling that of network chars. The inclusion of such a char into a practical
morphological system must be based on judgment of its average wall thickness.
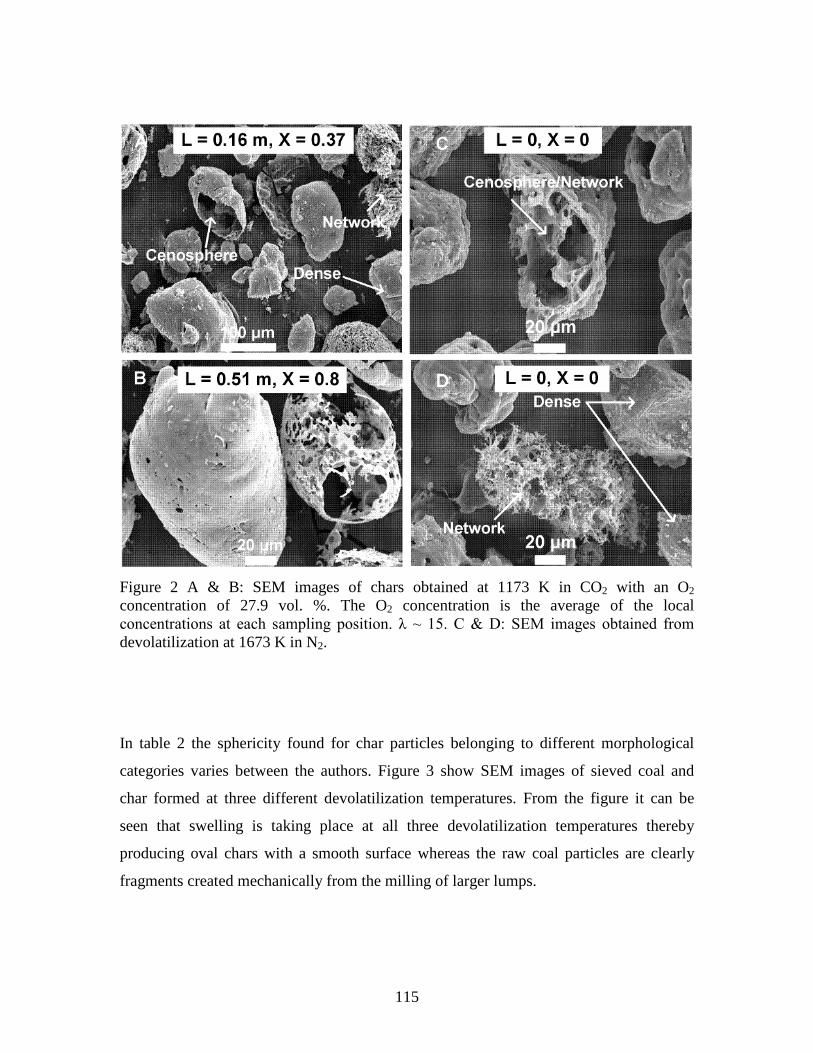
115
Figure 2 A & B: SEM images of chars obtained at 1173 K in CO2 with an O2 concentration of 27.9 vol. %. The O2 concentration is the average of the local concentrations at each sampling position. λ ~ 15. C & D: SEM images obtained from devolatilization at 1673 K in N2.
In table 2 the sphericity found for char particles belonging to different morphological
categories varies between the authors. Figure 3 show SEM images of sieved coal and
char formed at three different devolatilization temperatures. From the figure it can be
seen that swelling is taking place at all three devolatilization temperatures thereby
producing oval chars with a smooth surface whereas the raw coal particles are clearly
fragments created mechanically from the milling of larger lumps.
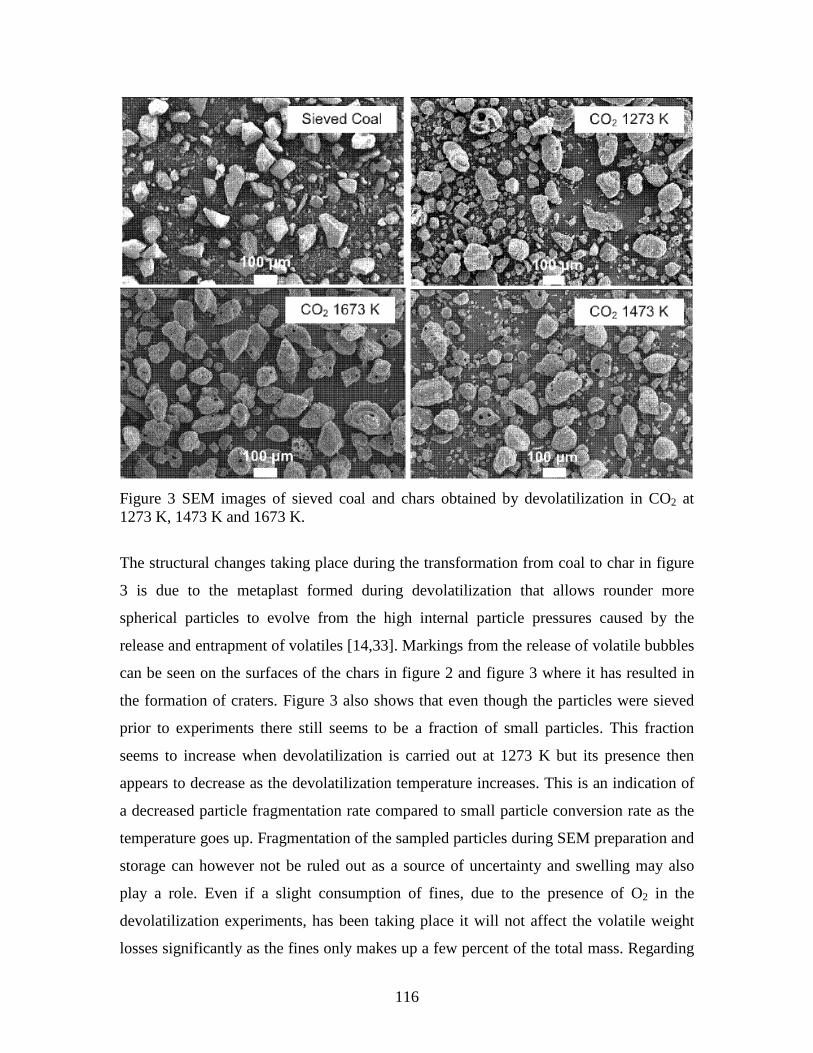
116
Figure 3 SEM images of sieved coal and chars obtained by devolatilization in CO2 at 1273 K, 1473 K and 1673 K.
The structural changes taking place during the transformation from coal to char in figure
3 is due to the metaplast formed during devolatilization that allows rounder more
spherical particles to evolve from the high internal particle pressures caused by the
release and entrapment of volatiles [14,33]. Markings from the release of volatile bubbles
can be seen on the surfaces of the chars in figure 2 and figure 3 where it has resulted in
the formation of craters. Figure 3 also shows that even though the particles were sieved
prior to experiments there still seems to be a fraction of small particles. This fraction
seems to increase when devolatilization is carried out at 1273 K but its presence then
appears to decrease as the devolatilization temperature increases. This is an indication of
a decreased particle fragmentation rate compared to small particle conversion rate as the
temperature goes up. Fragmentation of the sampled particles during SEM preparation and
storage can however not be ruled out as a source of uncertainty and swelling may also
play a role. Even if a slight consumption of fines, due to the presence of O2 in the
devolatilization experiments, has been taking place it will not affect the volatile weight
losses significantly as the fines only makes up a few percent of the total mass. Regarding
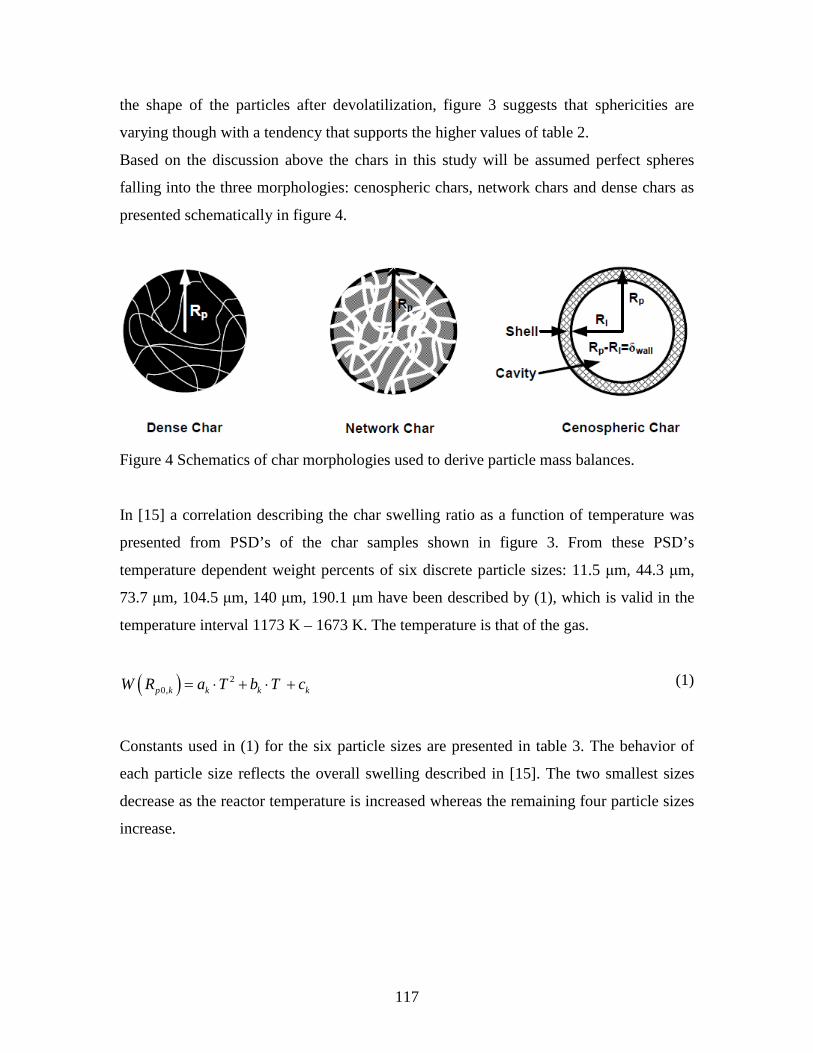
117
the shape of the particles after devolatilization, figure 3 suggests that sphericities are
varying though with a tendency that supports the higher values of table 2.
Based on the discussion above the chars in this study will be assumed perfect spheres
falling into the three morphologies: cenospheric chars, network chars and dense chars as
presented schematically in figure 4.
Figure 4 Schematics of char morphologies used to derive particle mass balances.
In [15] a correlation describing the char swelling ratio as a function of temperature was
presented from PSD’s of the char samples shown in figure 3. From these PSD’s
temperature dependent weight percents of six discrete particle sizes: 11.5 μm, 44.3 μm,
73.7 μm, 104.5 μm, 140 μm, 190.1 μm have been described by (1), which is valid in the
temperature interval 1173 K – 1673 K. The temperature is that of the gas.
( ) 20,p k k k kW R a T b T c= ⋅ + ⋅ + (1)
Constants used in (1) for the six particle sizes are presented in table 3. The behavior of
each particle size reflects the overall swelling described in [15]. The two smallest sizes
decrease as the reactor temperature is increased whereas the remaining four particle sizes
increase.
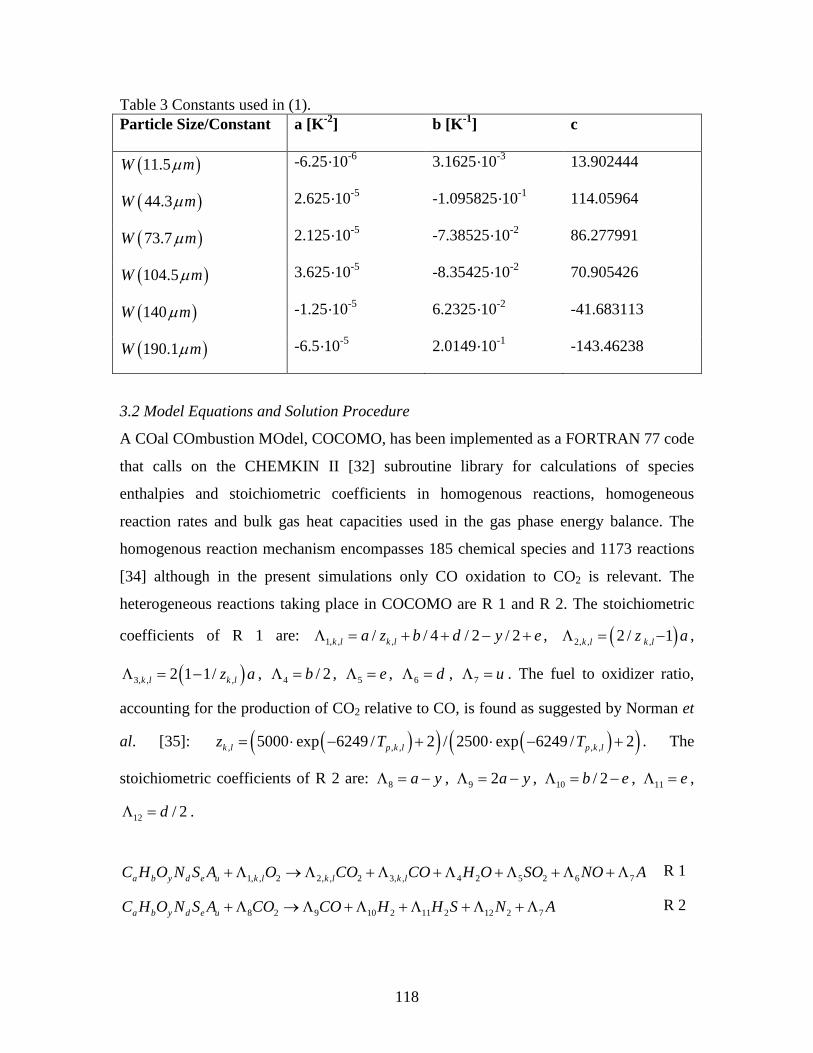
118
Table 3 Constants used in (1). Particle Size/Constant a [K-2] b [K-1] c
( )11.5W mµ -6.25·10-6 3.1625·10-3 13.902444
( )44.3W mµ 2.625·10-5 -1.095825·10-1 114.05964
( )73.7W mµ 2.125·10-5 -7.38525·10-2 86.277991
( )104.5W mµ 3.625·10-5 -8.35425·10-2 70.905426
( )140W mµ -1.25·10-5 6.2325·10-2 -41.683113
( )190.1W mµ -6.5·10-5 2.0149·10-1 -143.46238
3.2 Model Equations and Solution Procedure
A COal COmbustion MOdel, COCOMO, has been implemented as a FORTRAN 77 code
that calls on the CHEMKIN II [32] subroutine library for calculations of species
enthalpies and stoichiometric coefficients in homogenous reactions, homogeneous
reaction rates and bulk gas heat capacities used in the gas phase energy balance. The
homogenous reaction mechanism encompasses 185 chemical species and 1173 reactions
[34] although in the present simulations only CO oxidation to CO2 is relevant. The
heterogeneous reactions taking place in COCOMO are R 1 and R 2. The stoichiometric
coefficients of R 1 are: 1, , ,/ / 4 / 2 / 2k l k la z b d y eΛ = + + − + , ( )2, , ,2 / 1k l k lz aΛ = − ,
( )3, , ,2 1 1/k l k lz aΛ = − , 4 / 2bΛ = , 5 eΛ = , 6 dΛ = , 7 uΛ = . The fuel to oxidizer ratio,
accounting for the production of CO2 relative to CO, is found as suggested by Norman et
al. [35]: ( )( ) ( )( ), , , , ,5000 exp 6249 / 2 / 2500 exp 6249 / 2k l p k l p k lz T T= ⋅ − + ⋅ − + . The
stoichiometric coefficients of R 2 are: 8 a yΛ = − , 9 2a yΛ = − , 10 / 2b eΛ = − , 11 eΛ = ,
12 / 2dΛ = .
1, , 2 2, , 2 3, , 4 2 5 2 6 7a b y d e u k l k l k lC H O N S A O CO CO H O SO NO A+Λ →Λ +Λ +Λ +Λ +Λ +Λ R 1
8 2 9 10 2 11 2 12 2 7a b y d e uC H O N S A CO CO H H S N A+Λ →Λ +Λ +Λ +Λ +Λ R 2
119
In the present investigation the char is assumed only to consist of carbon and ash,
specified as silicon dioxide. The possibility to include H, O, N and S in the char is
included to increase the applicability of COCOMO in future investigations of NOx and
SOx emissions.
In sections 3.2.1, 3.2.2 and 3.2.3 only the mass- and energy balances of COCOMO are
presented. Auxiliary equations are found in Appendix A and a derivation of the mass
balances is given in Appendix B.
3.2.1 Solid Mass Balances
There exist different classical approaches when heterogeneous gas-solid reactions are to
be described mathematically [36-42]. The Grain Model (GRM), developed by Szekely
and coworkers [39-41], considers the particles to be made from numerous small grains.
Yagi & Kunii [42] presented the Unreacted Shrinking Core Model (USCM) where the
gas-solid reaction is considered to take place on a well defined front between an ash layer
and a solid core. Wen [36] also treated the USCM and discussed cases where the front
between the ash layer and the core was not well defined or where reaction occurred
homogeneously throughout the solid phase. Both the approaches of Wen [36] and
Szekely and coworkers [39-41] are termed as Progressive or Volumetric Reaction Models
(PRM’s, VRM’s). The surface area available for reaction in VRM’s is also subject to
modeling efforts though it is given by the grain packing in the GRM. An often used
description of surface area development, especially when dealing with gasification, is the
Random Pore Model (RPM) developed by Bhatia and Perlmutter [37,38]. This model
takes pore expansion and fusion during reaction into account through the inclusion of a
characteristic pore structural parameter and a logarithmic dependence on solid
conversion. In processes where pore structural variation does not play an important role
during reaction the char surface area is normally considered proportional to the mass of
solid.
From TGA experiments [23] it was found that the conversion rates of char sampled in the
EFR at all experimental temperatures are adequately described by a VRM. In the present
model the char burning rate is modeled as taking place on both the particles interior and
exterior surface while char consumption is modeled as a shrinking spherical particle
120
where the ash formed during reaction breaks of. The burning rate expression is therefore
similar to that used for a porous catalyst while the accompanying char consumption takes
place by radial shrinkage of the particle with no formation of an ash layer. This entails
shrinking particles of constant particle density which ease calculations considerably. In
the derivation of the particle mass balances both internal and external surface area is
included, which yields a conversion rate for a cenospheric char described for each
gaseous reactant by (2) and for all gaseous reactants by (3). The conversion rates for
network and dense chars are described by the same equations when 0 1δ = . The first term
in (2) describes the reaction rate in the interior of the particle while the second term
accounts for the reaction rate at its exterior surface.
( )( )
( )( )( )( )( )
23 3
0, ,, , ,0 , , , 3
, , 0, 0
3 1 1 11
1 1
rnSkk l r rk l r k l
k l k l rs k l g p p k
Xk CdXS X
dL R
δη
ν ν ρ δ
⋅ − ⋅ − −⋅ = ⋅ ⋅ − ⋅ +
+ ⋅ ⋅ − −
(2)
, , ,k l k l r
r
dX dXdL dL
=∑ (3)
The effectiveness factor, , ,k l rη , is included in (2) to account for internal mass transfer
resistance in the char particles. When mass transfer limitations cause internal
concentration gradients of reactants to form inside the particles the effectiveness factor
will gradually decrease from one to account for the internal surface area not accessible
for reaction. In (2) the surface concentrations of the reactants are found from mass
balances across the laminar gas film layer surrounding the particles as shown in (4).
( )( ) ( ), , 0, , , ,, , , , , , ,,
k l r p k l k l rB Sc k l r p k l r r s k l gk l
p
m dXk A C C
M dLν ν
Λ ⋅⋅ ⋅ − = ⋅ ⋅ +
(4)
121
The solution of (3) yields the conversion of a particle size belonging to one of the three
morphologies. To calculate the total conversion of a morphological group or of all char
(5) and (6) are used.
( ),1 1l k l kk
X X= − − ⋅Θ∑ (5)
( )1 1T l ll
X X α= − − ⋅∑ (6)
3.2.2 Solid Energy Balance
The energy balance for a burning char particle is given by (7). The energy balance takes
into account convective heat transfer between the gas and particle, radiation between the
particle and reactor wall and the heat generated by the oxidation and gasification of the
particle. These are the general terms included in modeling studies [3,6,8,10,18].
( ) ( ) ( )( )( )
, , 4 40, , , , , , , , , , , , , ,
, ,
, , , , , ,
k l rp k l s k l g k l r p k l p k l g p k l SB w p k l
p k l r
s k l g p k l p k l
dXm H A h T T e T TdT dL
dL m C
ν ν σ
ν ν
− ⋅ + ⋅ ⋅∆ + ⋅ ⋅ − + ⋅ ⋅ −=
+ ⋅ ⋅
∑
(7)
The particle energy balance in (7) does not include radiation between particles of
different sizes and morphologies due to the low coal feed rate used during the
experiments.
3.2.3 Gas Phase Mass and Energy Balances
To account for changes in the gas temperature the energy balance in (8) is set up. This
energy balance includes the heat generated by homogeneous reactions along with
convective heat transfer with the particles and reactor wall. The mass balance in (9)
accounts for both heterogeneous and homogeneous contributions.
122
( ) ( ) ,1
,1
H
G
N
i i w w w g k lg i l k
R N
j p jj
r H a h T T QdTA
dL F C
=
=
⋅ −∆ + ⋅ ⋅ − +
= ⋅
⋅
∑ ∑∑
∑
(8)
, , , , , , ,1
HNj
R j i i k l j k l r k l ri r l k
dFA r N r
dLζ ζ
=
= ⋅ ⋅ + ⋅ ⋅
∑ ∑∑∑
(9)
Even though the experiments presented in this study are carried out at conditions where
the molar gas flow, its composition and its temperature are nearly constant the gas phase
mass- and energy balance in (8) and (9) are included to enhance model accuracy and
general applicability. In the present simulations the only significant gas phase reaction is
CO oxidation and simulated gas temperatures are less than 30 K higher than the reactor
wall at all times. In (8) the convective heat transfer between gas and particles is found as
( ), , , , , , , ,k l k l p k l p k l p k l gQ N h A T T= ⋅ ⋅ ⋅ − . The reactor surface area pr. reactor volume, aw, is
found as 14 RD−⋅ .
3.3 Model Input Parameters
The model presented in (2) - (9) requires a range of input parameters, which are given in
table 4 for the simulations presented here. Skeletal density, porosity and abundance of
morphologies are found for El Cerrejón chars by the respective authors. The density is
found by correcting the apparent value taken from Zolin et al. [43] with the porosity
obtained from Cloke et al. [6]. Char porosities and morphology abundances of Cloke et
al. [6] are found by DTF experiments at 1423 K, which is the average temperature used
during the EFR experiments presented here. Cloke et al. [6] did not find strong effects of
temperature on either porosity or abundance in the interval 1273 K – 1573 K. The values
of tortuosity and char emissivity are used in combustion modeling by Charpenay et al.
[44] and Mon & Amundson [45]. Weight fractions of discrete particle sizes are found
from (1) and are assumed the same for all three morphologies.
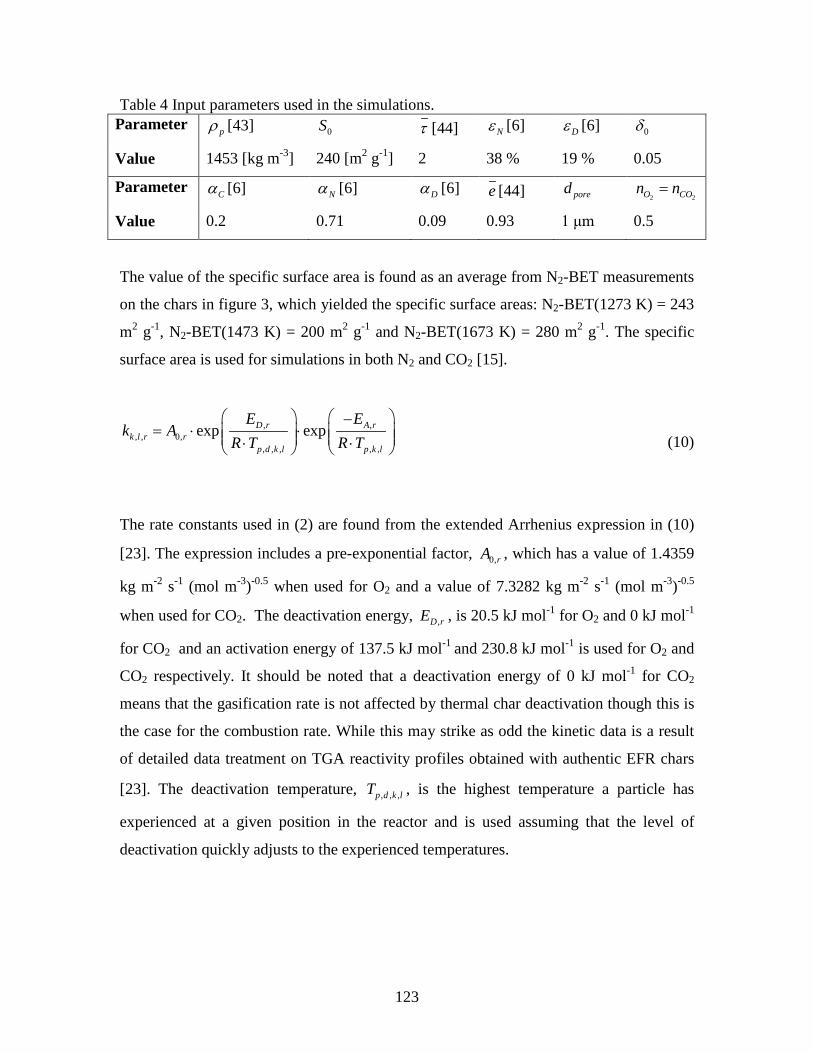
123
Table 4 Input parameters used in the simulations. Parameter pρ [43] 0S τ [44] Nε [6] Dε [6] 0δ
Value 1453 [kg m-3] 240 [m2 g-1] 2 38 % 19 % 0.05
Parameter Cα [6] Nα [6] Dα [6] e [44] pored 2 2O COn n=
Value 0.2 0.71 0.09 0.93 1 μm 0.5
The value of the specific surface area is found as an average from N2-BET measurements
on the chars in figure 3, which yielded the specific surface areas: N2-BET(1273 K) = 243
m2 g-1, N2-BET(1473 K) = 200 m2 g-1 and N2-BET(1673 K) = 280 m2 g-1. The specific
surface area is used for simulations in both N2 and CO2 [15].
, ,, , 0,
, , , , ,
exp expD r A rk l r r
p d k l p k l
E Ek A
R T R T −
= ⋅ ⋅ ⋅ ⋅
(10)
The rate constants used in (2) are found from the extended Arrhenius expression in (10)
[23]. The expression includes a pre-exponential factor, 0,rA , which has a value of 1.4359
kg m-2 s-1 (mol m-3)-0.5 when used for O2 and a value of 7.3282 kg m-2 s-1 (mol m-3)-0.5
when used for CO2. The deactivation energy, ,D rE , is 20.5 kJ mol-1 for O2 and 0 kJ mol-1
for CO2 and an activation energy of 137.5 kJ mol-1 and 230.8 kJ mol-1 is used for O2 and
CO2 respectively. It should be noted that a deactivation energy of 0 kJ mol-1 for CO2
means that the gasification rate is not affected by thermal char deactivation though this is
the case for the combustion rate. While this may strike as odd the kinetic data is a result
of detailed data treatment on TGA reactivity profiles obtained with authentic EFR chars
[23]. The deactivation temperature, , , ,p d k lT , is the highest temperature a particle has
experienced at a given position in the reactor and is used assuming that the level of
deactivation quickly adjusts to the experienced temperatures.
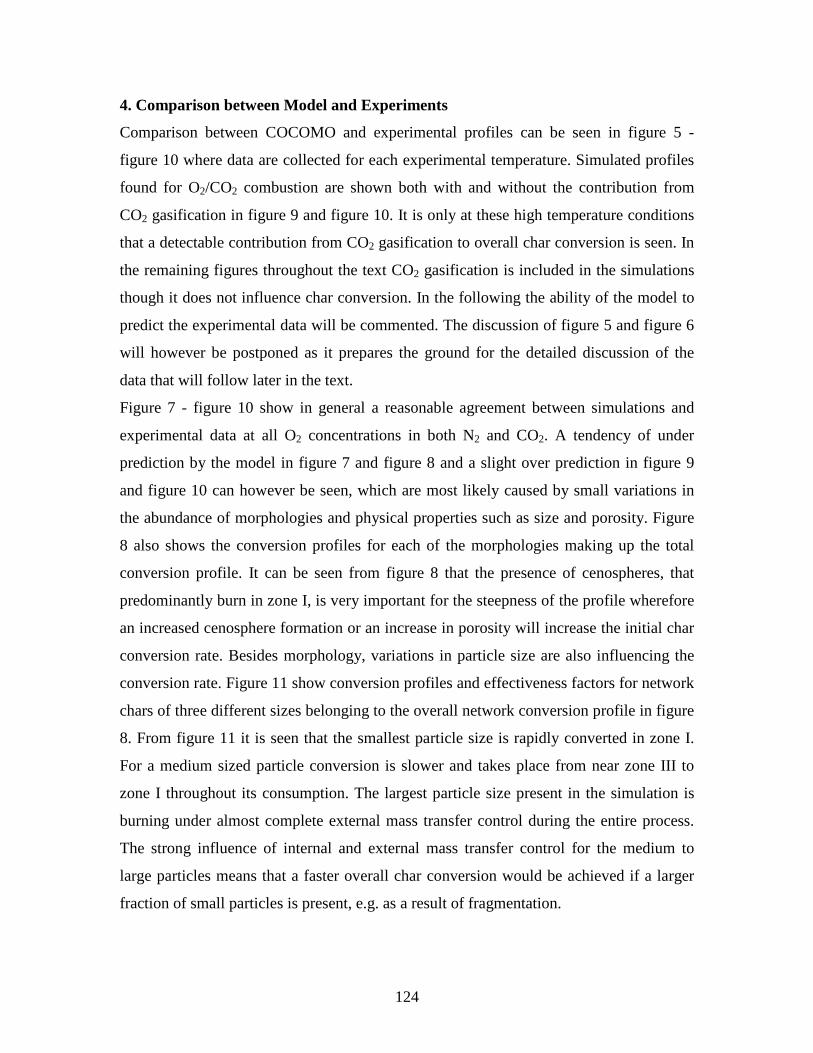
124
4. Comparison between Model and Experiments
Comparison between COCOMO and experimental profiles can be seen in figure 5 -
figure 10 where data are collected for each experimental temperature. Simulated profiles
found for O2/CO2 combustion are shown both with and without the contribution from
CO2 gasification in figure 9 and figure 10. It is only at these high temperature conditions
that a detectable contribution from CO2 gasification to overall char conversion is seen. In
the remaining figures throughout the text CO2 gasification is included in the simulations
though it does not influence char conversion. In the following the ability of the model to
predict the experimental data will be commented. The discussion of figure 5 and figure 6
will however be postponed as it prepares the ground for the detailed discussion of the
data that will follow later in the text.
Figure 7 - figure 10 show in general a reasonable agreement between simulations and
experimental data at all O2 concentrations in both N2 and CO2. A tendency of under
prediction by the model in figure 7 and figure 8 and a slight over prediction in figure 9
and figure 10 can however be seen, which are most likely caused by small variations in
the abundance of morphologies and physical properties such as size and porosity. Figure
8 also shows the conversion profiles for each of the morphologies making up the total
conversion profile. It can be seen from figure 8 that the presence of cenospheres, that
predominantly burn in zone I, is very important for the steepness of the profile wherefore
an increased cenosphere formation or an increase in porosity will increase the initial char
conversion rate. Besides morphology, variations in particle size are also influencing the
conversion rate. Figure 11 show conversion profiles and effectiveness factors for network
chars of three different sizes belonging to the overall network conversion profile in figure
8. From figure 11 it is seen that the smallest particle size is rapidly converted in zone I.
For a medium sized particle conversion is slower and takes place from near zone III to
zone I throughout its consumption. The largest particle size present in the simulation is
burning under almost complete external mass transfer control during the entire process.
The strong influence of internal and external mass transfer control for the medium to
large particles means that a faster overall char conversion would be achieved if a larger
fraction of small particles is present, e.g. as a result of fragmentation.
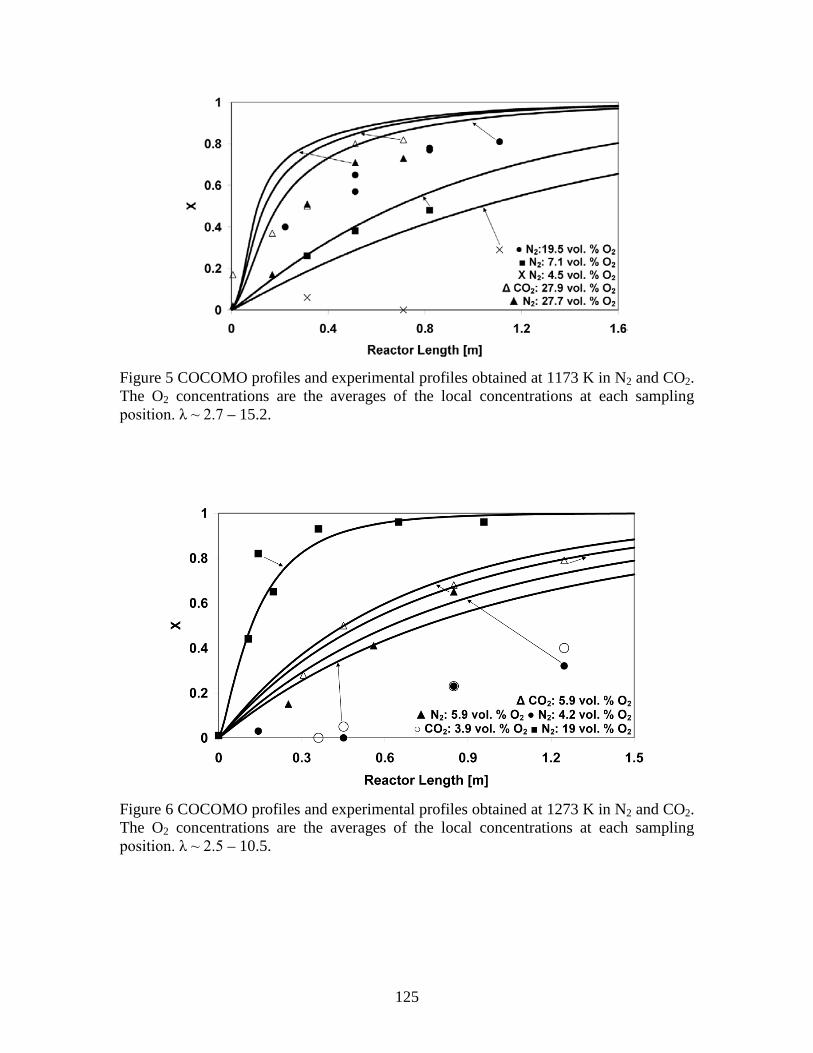
125
Figure 5 COCOMO profiles and experimental profiles obtained at 1173 K in N2 and CO2. The O2 concentrations are the averages of the local concentrations at each sampling position. λ ~ 2.7 – 15.2.
Figure 6 COCOMO profiles and experimental profiles obtained at 1273 K in N2 and CO2. The O2 concentrations are the averages of the local concentrations at each sampling position. λ ~ 2.5 – 10.5.
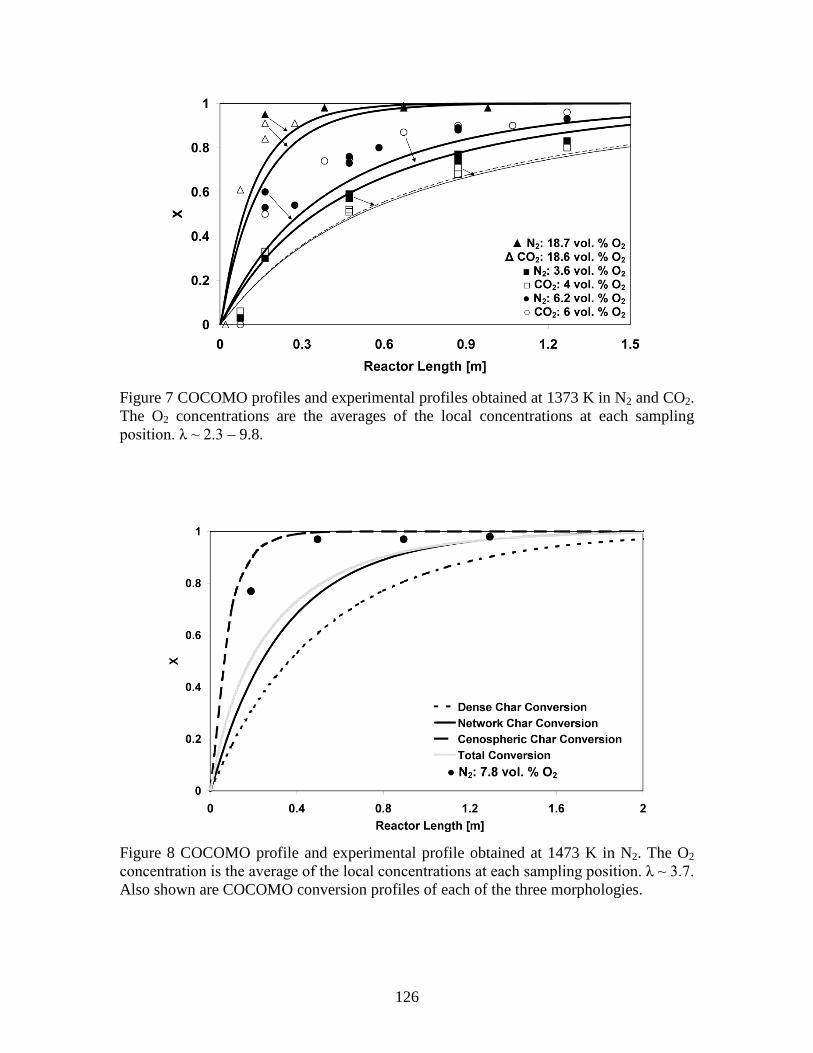
126
Figure 7 COCOMO profiles and experimental profiles obtained at 1373 K in N2 and CO2. The O2 concentrations are the averages of the local concentrations at each sampling position. λ ~ 2.3 – 9.8.
Figure 8 COCOMO profile and experimental profile obtained at 1473 K in N2. The O2 concentration is the average of the local concentrations at each sampling position. λ ~ 3.7. Also shown are COCOMO conversion profiles of each of the three morphologies.
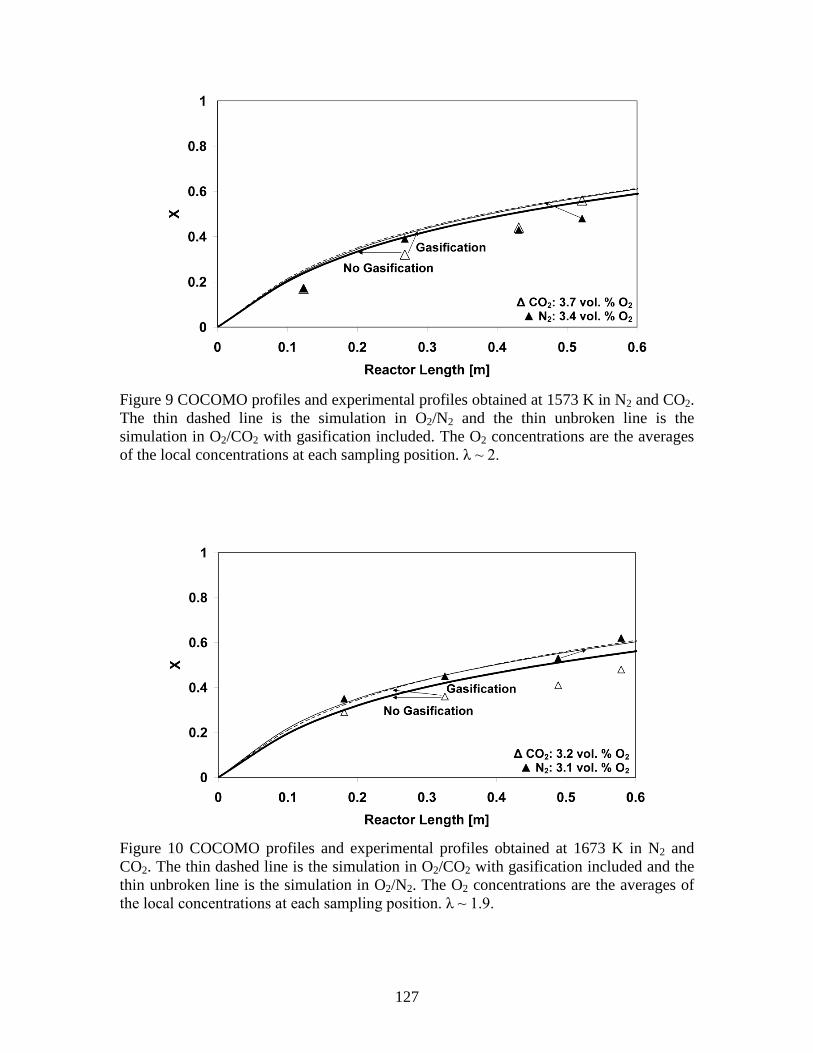
127
Figure 9 COCOMO profiles and experimental profiles obtained at 1573 K in N2 and CO2. The thin dashed line is the simulation in O2/N2 and the thin unbroken line is the simulation in O2/CO2 with gasification included. The O2 concentrations are the averages of the local concentrations at each sampling position. λ ~ 2.
Figure 10 COCOMO profiles and experimental profiles obtained at 1673 K in N2 and CO2. The thin dashed line is the simulation in O2/CO2 with gasification included and the thin unbroken line is the simulation in O2/N2. The O2 concentrations are the averages of the local concentrations at each sampling position. λ ~ 1.9.
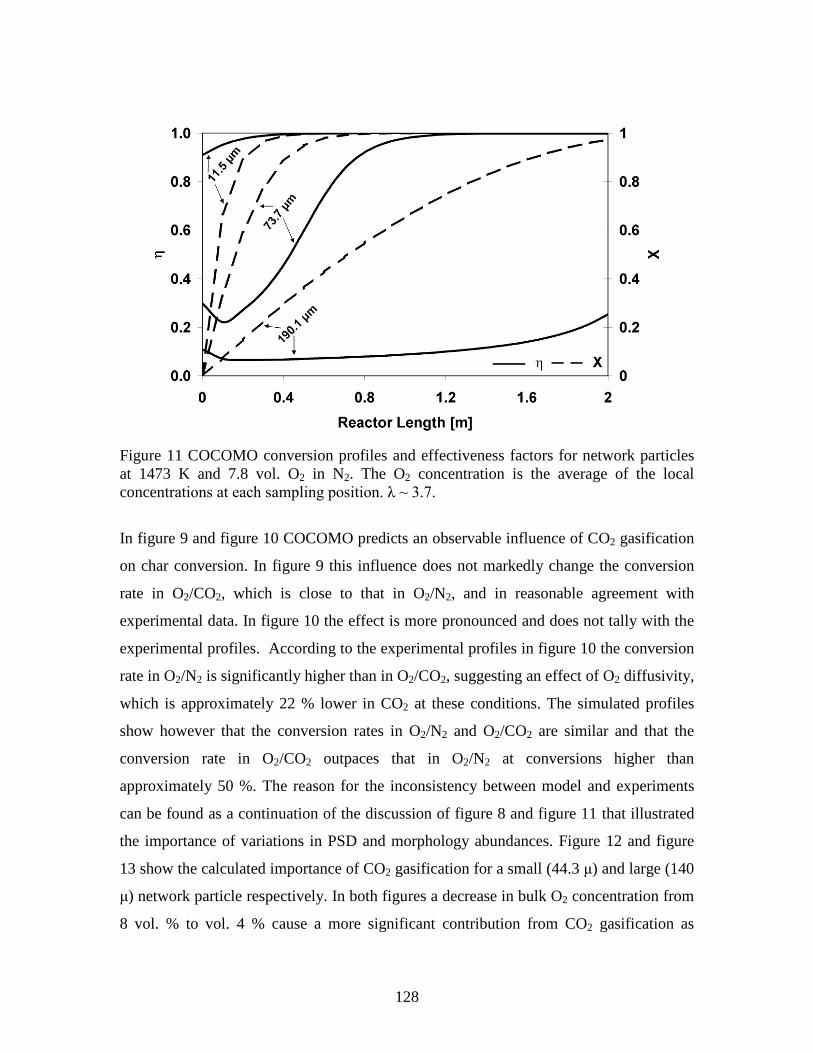
128
Figure 11 COCOMO conversion profiles and effectiveness factors for network particles at 1473 K and 7.8 vol. O2 in N2. The O2 concentration is the average of the local concentrations at each sampling position. λ ~ 3.7.
In figure 9 and figure 10 COCOMO predicts an observable influence of CO2 gasification
on char conversion. In figure 9 this influence does not markedly change the conversion
rate in O2/CO2, which is close to that in O2/N2, and in reasonable agreement with
experimental data. In figure 10 the effect is more pronounced and does not tally with the
experimental profiles. According to the experimental profiles in figure 10 the conversion
rate in O2/N2 is significantly higher than in O2/CO2, suggesting an effect of O2 diffusivity,
which is approximately 22 % lower in CO2 at these conditions. The simulated profiles
show however that the conversion rates in O2/N2 and O2/CO2 are similar and that the
conversion rate in O2/CO2 outpaces that in O2/N2 at conversions higher than
approximately 50 %. The reason for the inconsistency between model and experiments
can be found as a continuation of the discussion of figure 8 and figure 11 that illustrated
the importance of variations in PSD and morphology abundances. Figure 12 and figure
13 show the calculated importance of CO2 gasification for a small (44.3 μ) and large (140
μ) network particle respectively. In both figures a decrease in bulk O2 concentration from
8 vol. % to vol. 4 % cause a more significant contribution from CO2 gasification as
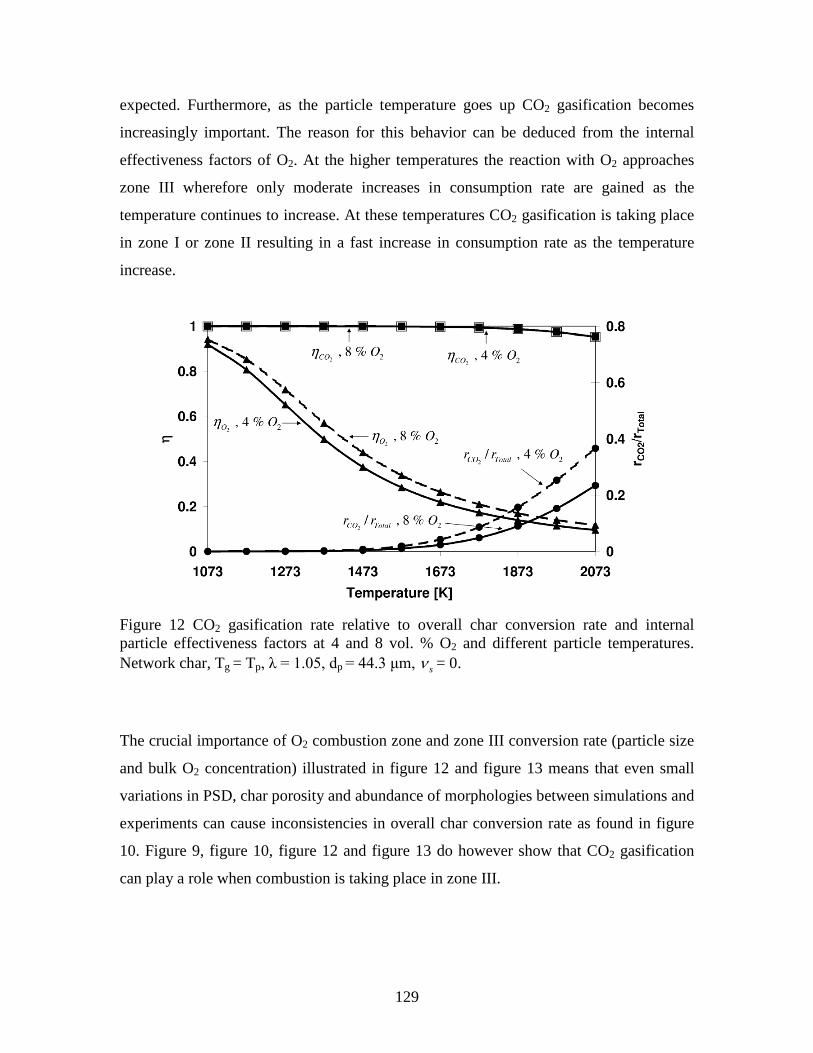
129
expected. Furthermore, as the particle temperature goes up CO2 gasification becomes
increasingly important. The reason for this behavior can be deduced from the internal
effectiveness factors of O2. At the higher temperatures the reaction with O2 approaches
zone III wherefore only moderate increases in consumption rate are gained as the
temperature continues to increase. At these temperatures CO2 gasification is taking place
in zone I or zone II resulting in a fast increase in consumption rate as the temperature
increase.
Figure 12 CO2 gasification rate relative to overall char conversion rate and internal particle effectiveness factors at 4 and 8 vol. % O2 and different particle temperatures. Network char, Tg = Tp, λ = 1.05, dp = 44.3 μm, sν = 0.
The crucial importance of O2 combustion zone and zone III conversion rate (particle size
and bulk O2 concentration) illustrated in figure 12 and figure 13 means that even small
variations in PSD, char porosity and abundance of morphologies between simulations and
experiments can cause inconsistencies in overall char conversion rate as found in figure
10. Figure 9, figure 10, figure 12 and figure 13 do however show that CO2 gasification
can play a role when combustion is taking place in zone III.
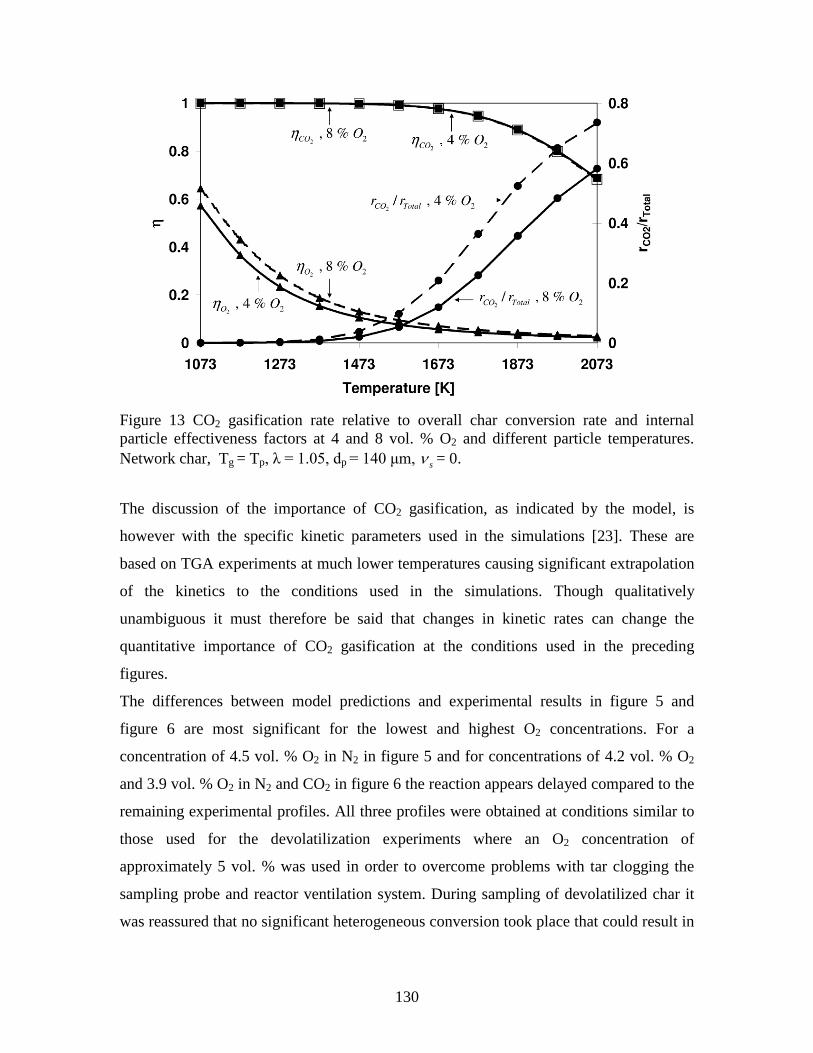
130
Figure 13 CO2 gasification rate relative to overall char conversion rate and internal particle effectiveness factors at 4 and 8 vol. % O2 and different particle temperatures. Network char, Tg = Tp, λ = 1.05, dp = 140 μm, sν = 0.
The discussion of the importance of CO2 gasification, as indicated by the model, is
however with the specific kinetic parameters used in the simulations [23]. These are
based on TGA experiments at much lower temperatures causing significant extrapolation
of the kinetics to the conditions used in the simulations. Though qualitatively
unambiguous it must therefore be said that changes in kinetic rates can change the
quantitative importance of CO2 gasification at the conditions used in the preceding
figures.
The differences between model predictions and experimental results in figure 5 and
figure 6 are most significant for the lowest and highest O2 concentrations. For a
concentration of 4.5 vol. % O2 in N2 in figure 5 and for concentrations of 4.2 vol. % O2
and 3.9 vol. % O2 in N2 and CO2 in figure 6 the reaction appears delayed compared to the
remaining experimental profiles. All three profiles were obtained at conditions similar to
those used for the devolatilization experiments where an O2 concentration of
approximately 5 vol. % was used in order to overcome problems with tar clogging the
sampling probe and reactor ventilation system. During sampling of devolatilized char it
was reassured that no significant heterogeneous conversion took place that could result in
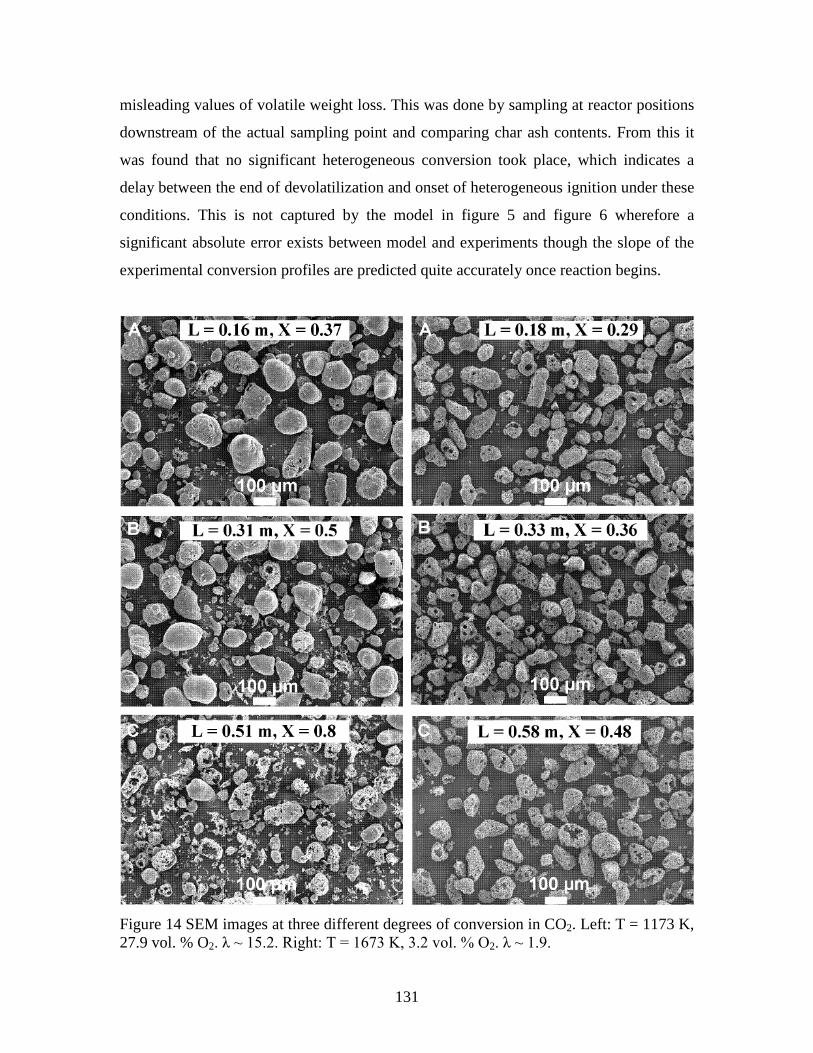
131
misleading values of volatile weight loss. This was done by sampling at reactor positions
downstream of the actual sampling point and comparing char ash contents. From this it
was found that no significant heterogeneous conversion took place, which indicates a
delay between the end of devolatilization and onset of heterogeneous ignition under these
conditions. This is not captured by the model in figure 5 and figure 6 wherefore a
significant absolute error exists between model and experiments though the slope of the
experimental conversion profiles are predicted quite accurately once reaction begins.
Figure 14 SEM images at three different degrees of conversion in CO2. Left: T = 1173 K, 27.9 vol. % O2. λ ~ 15.2. Right: T = 1673 K, 3.2 vol. % O2. λ ~ 1.9.
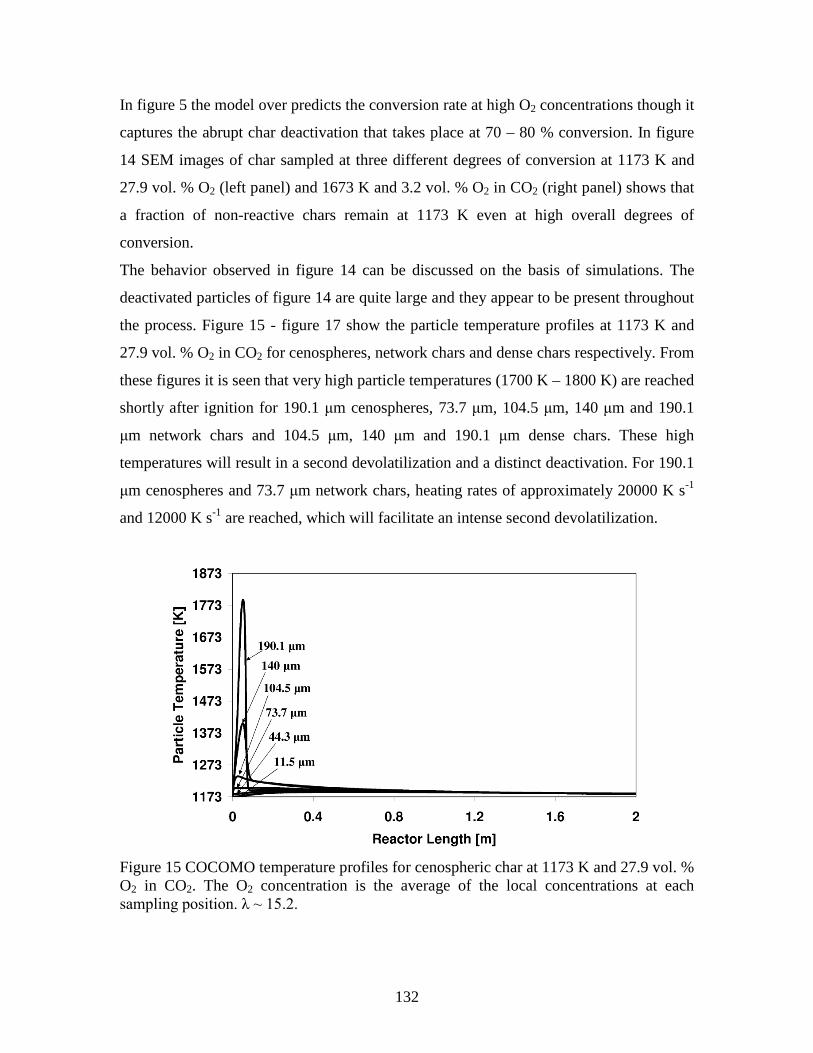
132
In figure 5 the model over predicts the conversion rate at high O2 concentrations though it
captures the abrupt char deactivation that takes place at 70 – 80 % conversion. In figure
14 SEM images of char sampled at three different degrees of conversion at 1173 K and
27.9 vol. % O2 (left panel) and 1673 K and 3.2 vol. % O2 in CO2 (right panel) shows that
a fraction of non-reactive chars remain at 1173 K even at high overall degrees of
conversion.
The behavior observed in figure 14 can be discussed on the basis of simulations. The
deactivated particles of figure 14 are quite large and they appear to be present throughout
the process. Figure 15 - figure 17 show the particle temperature profiles at 1173 K and
27.9 vol. % O2 in CO2 for cenospheres, network chars and dense chars respectively. From
these figures it is seen that very high particle temperatures (1700 K – 1800 K) are reached
shortly after ignition for 190.1 μm cenospheres, 73.7 μm, 104.5 μm, 140 μm and 190.1
μm network chars and 104.5 μm, 140 μm and 190.1 μm dense chars. These high
temperatures will result in a second devolatilization and a distinct deactivation. For 190.1
μm cenospheres and 73.7 μm network chars, heating rates of approximately 20000 K s-1
and 12000 K s-1 are reached, which will facilitate an intense second devolatilization.
Figure 15 COCOMO temperature profiles for cenospheric char at 1173 K and 27.9 vol. % O2 in CO2. The O2 concentration is the average of the local concentrations at each sampling position. λ ~ 15.2.
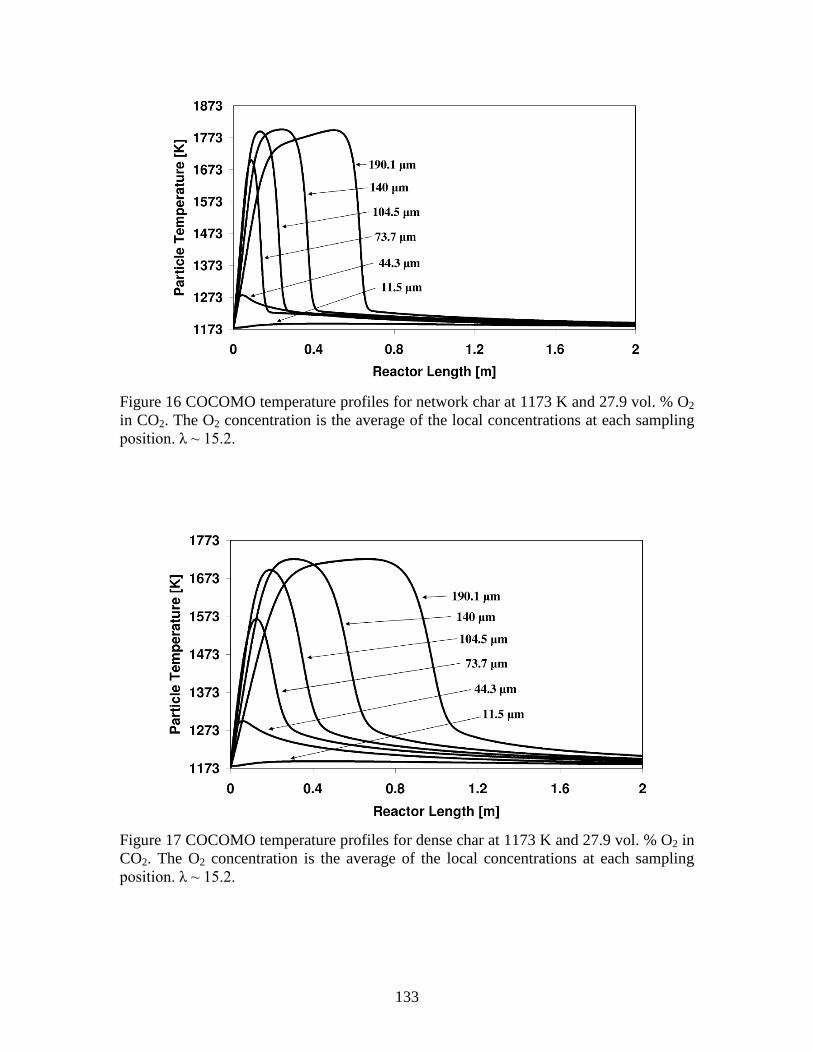
133
Figure 16 COCOMO temperature profiles for network char at 1173 K and 27.9 vol. % O2 in CO2. The O2 concentration is the average of the local concentrations at each sampling position. λ ~ 15.2.
Figure 17 COCOMO temperature profiles for dense char at 1173 K and 27.9 vol. % O2 in CO2. The O2 concentration is the average of the local concentrations at each sampling position. λ ~ 15.2.
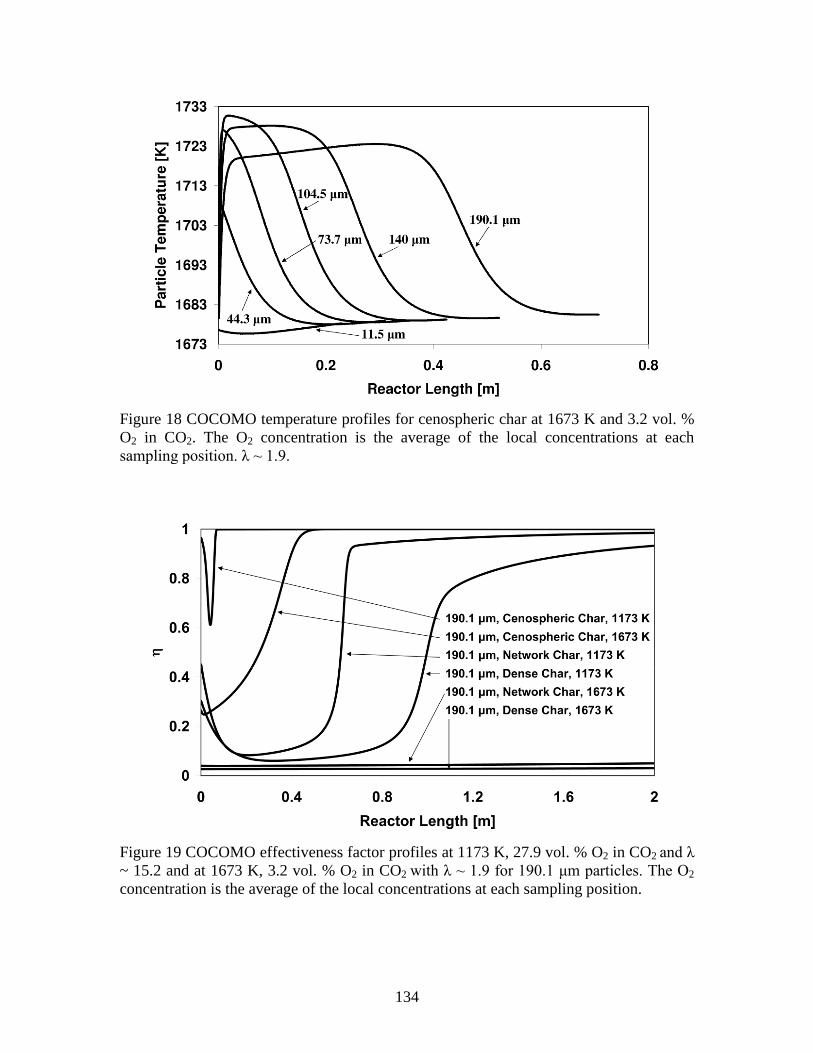
134
Figure 18 COCOMO temperature profiles for cenospheric char at 1673 K and 3.2 vol. % O2 in CO2. The O2 concentration is the average of the local concentrations at each sampling position. λ ~ 1.9.
Figure 19 COCOMO effectiveness factor profiles at 1173 K, 27.9 vol. % O2 in CO2 and λ ~ 15.2 and at 1673 K, 3.2 vol. % O2 in CO2 with λ ~ 1.9 for 190.1 μm particles. The O2 concentration is the average of the local concentrations at each sampling position.
135
Zhang et al. [46] found that when the three factors: high mineral content, high volatile
content and high heating rate was met combustion was inhibited by the formation of an
inactive mineral cluster phase. Zhang et al. [46] suggested that this phase is formed when
liquid/volatile organic fractions are absorbed on the minerals thereby significantly
reducing the void fraction in the particle, increasing the order in its structure and hence
lowering its reactivity. The phase showed up as a second peak on TGA reactivity profiles
in the work of Zhang et al. [46]. TGA measurements on the char sampled at 1173 K and
27.9 vol. % O2 in CO2 indeed also showed two distinct peaks in the reactivity profile [23]
indicating that a separate highly inactive phase is present. This is not accounted for in
COCOMO where char deactivates homogeneously and it therefore causes over
predictions by the model when high particle temperatures are reached at high heating
rates. The strong effect of particle temperature history on char conversion is made clear
in figure 14 where SEM images of char conversions at 1173 K in 27.9 vol. % O2 and at
1673 K and 3.2 vol. % O2 in CO2 are compared. Where the particles at 1173 K undergo
substantial morphological changes due to the intense ignition, the particles at 1673 K
seem to burn uniformly throughout the process. This is due to uniform particle
temperatures illustrated for cenospheres in figure 18 where it is seen that the highest
temperature difference between gas and particle is reached by 104.5 μm particles and is
less than 60 K. This is the highest temperature difference between gas and particle for
any particle size and morphology at 1673 K and 3.2 vol. % O2 in CO2. The cause of the
differences in temperature histories of especially the larger particles between the two
experiments are illustrated by the internal effectiveness factors in figure 19. In figure 19
it is seen that at a reactor temperature of 1173 K the combustion process starts in zone II
for network and dense chars and in zone I for cenospheres. Since the devolatilization has
taken place at 1173 K thermal deactivation of the particles have only been moderate at
the onset of ignition and the high O2 concentration enables efficient mass transfer across
the gas film layer. This allows the particles to reach high peak temperatures before a
combination of thermal char deactivation and external mass transfer limitations slows
down the reaction rate. Figure 19 also shows that when ignition takes place at 1673 K
cenospheres burn in zone II and dense and network chars burns in zone III where the low
O2 concentration hinders effective mass transfer across the gas film layer. Furthermore
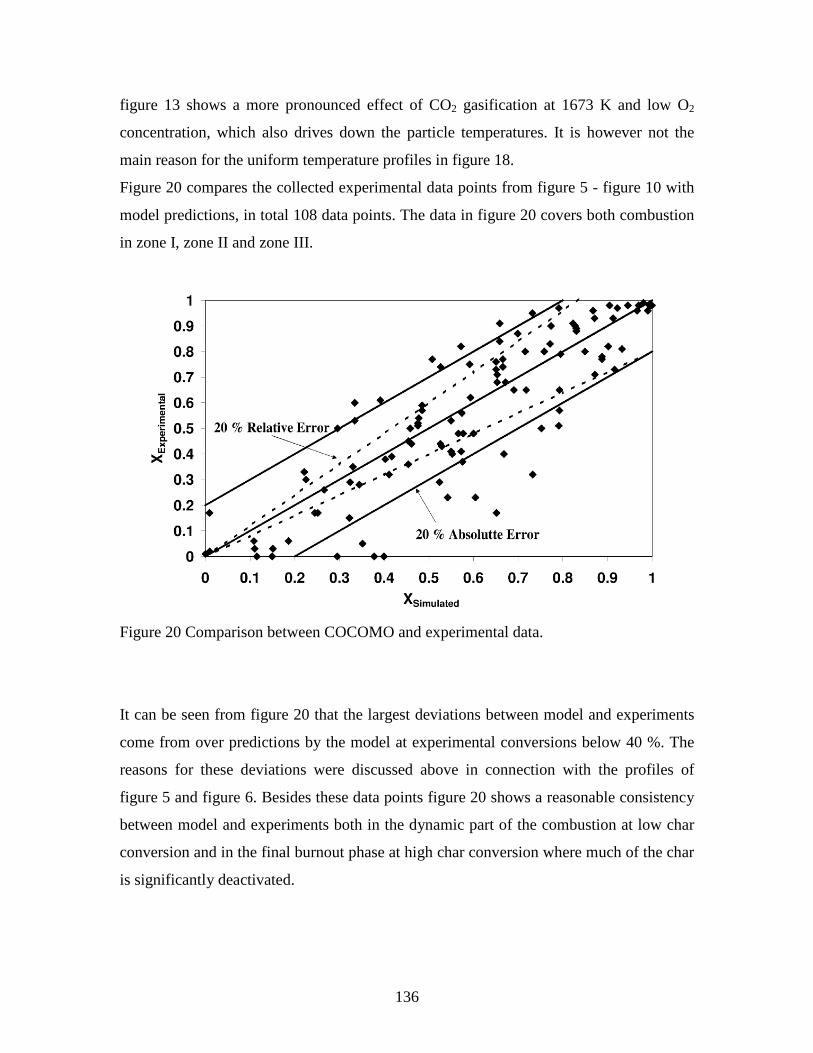
136
figure 13 shows a more pronounced effect of CO2 gasification at 1673 K and low O2
concentration, which also drives down the particle temperatures. It is however not the
main reason for the uniform temperature profiles in figure 18.
Figure 20 compares the collected experimental data points from figure 5 - figure 10 with
model predictions, in total 108 data points. The data in figure 20 covers both combustion
in zone I, zone II and zone III.
Figure 20 Comparison between COCOMO and experimental data.
It can be seen from figure 20 that the largest deviations between model and experiments
come from over predictions by the model at experimental conversions below 40 %. The
reasons for these deviations were discussed above in connection with the profiles of
figure 5 and figure 6. Besides these data points figure 20 shows a reasonable consistency
between model and experiments both in the dynamic part of the combustion at low char
conversion and in the final burnout phase at high char conversion where much of the char
is significantly deactivated.
137
5. Conclusions
A combustion model encompassing dense, network and cenospheric char each distributed
between six discrete particle sizes have been compared to experimental char conversion
profiles obtained in O2/CO2 and O2/N2 mixtures under suspension fired conditions. The
model applies kinetic parameters for char oxidation and CO2 gasification obtained from
TGA experiments with char formed at the experimental temperatures under suspension
fired conditions. The expressions for the rate constants include the effect of thermal char
deactivation only for the reaction with O2, since no deactivation was observed with CO2.
The kinetic expression for O2 combustion has proven to work satisfactorily under a wide
range of suspension fired conditions while that for CO2 gasification show a slight over
prediction at high temperatures.
In the temperature interval 1173 K – 1673 K reasonable consistency was found between
experiments and simulations at inlet O2 concentrations between 5 and 28 vol. %. At high
O2 concentrations and low reactor temperatures simulations showed that the larger
particles of all three morphologies reached high over temperatures of up to 500 – 600 K
shortly after ignition causing additional heating with rates as high as 20000 K/s for 190.1
μm cenospheres. SEM images of partly combusted char, sampled at these conditions
showed large unreacted particles even at high overall degrees of conversion. It is
suggested that these particles are formed during the intense heating from interactions
between products of a secondary devolatilization and particle mineral matter though it is
also possible that mineral matter itself affects char reactivity by ash layer inhibition. Due
to the fraction of highly deactivated particles significant absolute deviation exists
between model and experiment at low reactor temperature and high O2 concentration as
thermal char deactivation is modeled as homogeneous. When both reactor temperature
and O2 concentrations were low a delay between the end of devolatilization and onset of
particle ignition also caused deviations.
From experimental profiles obtained in a range of operating conditions, covering zone I -
III, no evidence suggesting an effect of CO2-gasification on char conversion has been
found. In fact the only indication of an effect of CO2 on char conversion rate is seen in
zone III where the lower diffusion coefficient of O2 in CO2 appears to slow down the
reaction rate compared to O2/N2. Modeling does however suggest that CO2 gasification
138
can contribute to char consumption when the O2 concentration is low, the particle
temperature high and combustion is taking place in zone III, especially for large particles.
It is however questionable whether this effect will be of importance for industrial
applications as the combinations of large particles, low O2 concentrations and high
particle temperatures are difficult to find in a specific position of a boiler. For particularly
reactive coals, such as lignite coal, the window where CO2 gasification is important could
be wider, also encompassing common industrial conditions but further studies are needed
on this topic.

139
Acknowledgement
The research leading to these results has received funding from the European
Community's Research Fund for Coal and Steel (RFCS) under contract n° RFCR-CT-
2006-00007, project FRIENDLYCOAL, and is also sponsored by the Danish Agency for
Science, Technology and Innovation and from Energinet.dk under project PSO-7171. The
support and funding from these entities are greatly valued.
140
Appendix A: Auxiliary Equations
To simplify the calculations of physical properties of the gas, not carried out by
CHEMKIN II [32], it is assumed that only three gaseous species, N2, O2 and CO2, are
present in sufficient amounts during the experiments to influence the properties of the gas
phase. Where multi component properties, indexed mix, are used calculations are based
on bulk gas composition.
A.1 Equations Relating to Particle Geometries and Mass
An expression for the development of particle radius for a cenospheric char is given by
(A 1) and for dense chars and network chars by (A 2).
( )( )( )1
3 3, 0, 01 1 1p k p k kR R X δ
= − ⋅ − −
(A 1)
( )13
, , 0, , ,1p k l p k l k lR R X = ⋅ −
(A 2)
Geometric surface areas and volumes of the particles can be calculated immediately from
(A 1) and (A 2). When the volume is used to calculate particle mass and effectiveness
factor (A 1) can however not be applied directly as it does not take the cavity of a
cenosphere into account. The expression for the volume of a cenosphere occupied by a
continuous char matrix is given by (A 3).
( )( ) ( )33, , 0, 0
4 1 1 13p m k p k kV R Xπ δ= ⋅ ⋅ ⋅ − − ⋅ −
(A 3)
The apparent densities of the three char morphologies can be found from (A 4) - (A 6)
where the skeletal density, ρp, is assumed to be the same for all particle sizes and
morphologies.
141
( ), 1ap N N pρ ε ρ= − ⋅ (A 4)
( )( ) ( ) ( )
( )( )( )3
0
, , 30
1 1 1 1
1 1 1
N p kap C k
k
X
X
δ ε ρρ
δ
− − ⋅ − ⋅ ⋅ −=
− ⋅ − −
(A 5)
( ), 1ap D D pρ ε ρ= − ⋅ (A 6)
When the apparent density of cenospheric char is used to calculate the effectiveness
factor and particle mass based on (A 3), (A 4) is applied instead of (A 5) as these
calculations are based on particle volume occupied by a continuous matrix.
A.2 Effectiveness Factors and Diffusion Coefficients
Because the char oxidation rate is n’th order in O2 concentration a generalized Thiele
modulus, expressed in (A 7), is used to calculate the effectiveness factors, , ,k l rη [47]. The
volume of the particle and the apparent density refers to the fraction of particle occupied
by a continuous matrix.
( ) 1
, , , , 0, , ,, , *
, , , ,
12
rnS ak l r r p k lp k l k lr
k l rp k l p k l r
k C SV nA M D
ρφ
−⋅ ⋅ ⋅+
= ⋅ ⋅⋅
(A 7)
The value of the effectiveness factor is found using (A 8), which is an approximation to
the classical expression for a sphere [47], for all char morphologies.
, , 2, ,
11
k l r
k l r
ηφ
=+
(A 8)
142
The effective diffusion coefficients of O2 and CO2 through the pore system of the char
matrix, *, ,k l rD , are found from (A 9) [47].
1
*, ,
, , , , , ,
1 1lk l r
K k l r mix k l r
DD D
ετ
−
= ⋅ +
(A 9)
The Knudsen diffusion coefficient in (A 9) is found from (A 10) [47].
0.5
, ,, , ,
83pore p k l
K k l rr
d R TD
Mπ⋅ ⋅
= ⋅ ⋅
(A 10)
The molar diffusion coefficient of the reactant is calculated from (A 11) [47]. This
equation is a simplification of Stefan-Maxwell’s equation known as Wilke’s equation and
is derived for the diffusion of a key component through a stagnant mixture.
, , ,
, , ,
1 rmix k l r
j
j k l j rj r
xD xD
≠
−=
∑
(A 11)
The bimolecular diffusion coefficients, , , ,k l j rD , used in (A 11) are calculated by
Chapman-Enskog’s relation, (A 12) [48], which includes the collision integral, , , ,k l j rΩ , to
account for intermolecular forces. The molar unit used here is [g mol-1].
7 3, , , , , 2
, , , ,
1 1 11.8583 10k l j r p k lj r atm j r k l j r
D TM M P σ
−
= ⋅ ⋅ ⋅ + ⋅ ⋅ ⋅Ω
(A 12)
143
, , , 0.1561, , , ,
, ,
, , , ,
, ,
1.06036 0.193
exp 0.47635
1.03587 1.76474
exp 1.52996 exp 3.89411
k l j rp k l p k l
j r j r
p k l p k l
j r j r
T T
T T
κ κε ε
κ κε ε
Ω = + + ⋅ ⋅
⋅
+ ⋅ ⋅
⋅ ⋅
(A 13)
A.3 Equations Relating to Heat and Mass Transfer
The convective heat transfer coefficient between gas and particles are described by (A
14), which is valid for forced convection around a sphere submerged in a fluid [48].
11
, , ,32, , , , , ,
, ,
2 0.60 Re Pr mix f k lp k l p k l p k l
p k l
hdλ
= + ⋅ ⋅ ⋅
(A 14)
The particle Reynolds and Prandtl numbers are defined by (A 15) and (A 16) where the
subscript f indicates that the physical properties of the gas are found at an average
temperature between the particle and the bulk gas.
, , , , , , ,, ,
, , ,
Re p k l s k l mix f k lp k l
mix f k l
d ν ρµ⋅ ⋅
=
(A 15)
, , , , , , ,, ,
, , ,
Pr p mix f k l mix f k lp k l
mix f k l
C µλ
⋅=
(A 16)
The heat transfer between the gas and reactor wall is taking place by forced convection in
the laminar regime (Reg < 4000). The wall heat transfer coefficient, hw, is described by (A
17) that applies for heat transfer in a circular tube [49].
144
11 1 33 31.62 Re Pr mixR
w g gR R
DhL D
λ = ⋅ ⋅ ⋅ ⋅
(A 17)
In order to increase the applicability of the model (A 18) is also included to account for
heat transfer between the gas and reactor wall in case of turbulent gas flow (Reg > 4000)
[49]. As it is the case for (A 17), (A 18) applies for heat transfer in a circular tube.
4 15 30.023 Re Pr mix
w g gR
hDλ
= ⋅ ⋅ ⋅
(A 18)
The Reynolds and Prandtl numbers of the gas are defined by (A 19) and (A 20) where the
absence of the subscript f indicates that the physical properties of the gas are found at the
bulk gas temperature.
Re gR mixg
mix
D ν ρµ⋅ ⋅
=
(A 19)
,Pr p mix mixg
mix
C µλ⋅
=
(A 20)
It should be noted that there exists a transitional interval, Reg ~ 2000 – 4000, where the
flow is shifting gradually from laminar to turbulent. The bulk gas Reynolds numbers
during the experiments have however been between 400 and 1100 wherefore (A 17) has
been used in all the simulations presented here.
In (A 14) - (A 20) heat capacities, viscosities and thermal conductivities of the gas are
depending on temperature, which is also indicated by the subscripts on the Reynolds and
Prandtl number. In addition these properties also depend on the composition of the gas.
The pure component viscosities of N2, CO2 and O2 are found from (A 21), which
145
originates from gas kinetic theory and includes the collision integral, Ωj (A 22), to
account for intermolecular forces [48]. The molar weight jM is in the unit [g mol-1].
622.6693 10 j
jj j
M Tµ
σ−
⋅= ⋅ ⋅
⋅Ω
(A 21)
0.14874
1.16145 0.52487 2.16178
exp 0.77320 exp 2.43787j
j jj
T TT κ κκε εε
Ω = + + ⋅ ⋅ ⋅
(A 22)
In (A 21) and (A 22) the temperature T is not indexed as this can be either the bulk gas or
a film layer temperature. When used for film layer calculations the indexes k and l are
used to account for particle size and morphology.
Using the pure component viscosity in (A 21) the Eucken equation (A 23) [48] and the
Eucken correlation (A 24) [50] are used to find thermal conductivities of the pure
components. The Eucken equation is used for N2 and O2 and the Eucken correlation is
used for CO2 as this was found to give the best fits with available data of thermal
conductivities.
,54j p j j
j
RCM
λ µ
= + ⋅ ⋅
(A 23)
,91
4j p j jj
C RM
λ µ
= − ⋅ − ⋅ ⋅
(A 24)
From the pure component properties the thermal conductivity and viscosity of the
mixture are found from (A 25) [51].
146
,11
j
jmix
mix jh j h
hjh j
xx
µλµ
λ
≠
=+ ⋅ ⋅Γ
∑∑
(A 25)
21
2 1142
,1 1 18
j
j j hj h
hh jh
M MM M
µλ
µλ
−
Γ = ⋅ + ⋅ + ⋅
(A 26)
The pure component heat capacities, necessary to calculate the Prandtl numbers and
thermal conductivities are described by a second order polynomial given in (A 27) [52].
2
,p j j j jC a b T c T −= + ⋅ + ⋅ (A 27)
Values used in (A 27) for the three gases are shown in table A 1 [52].
Table A 1 Constants used in (A 27) [52]. Component/Constant a [J K-1 kg-1] b [J K-2 kg-1] c [J K kg-1]
2N 1020.71 1342.86·10-4 -1785.71·103
2CO 1004.55 1997.73·10-4 -1959.09·104
2O 936.25 1306.25·10-4 -5218.75·103
As it was the case with (A 21) and (A 22) the temperature in (A 27) is not indexed as this
can be either a particle film layer or bulk gas temperature. The heat capacity of the gas
mixture is found from (A 28).
, ,p mix j p jj
C x C= ⋅∑ (A 28)
147
Similar to (A 28) the mixture density is found from (A 29) where the temperature also
can by either that of a particle film layer or the bulk gas.
j jj
mix
P x M
R Tρ
⋅ ⋅=
⋅
∑
(A 29)
The mass transfer coefficient of the gas film layer, , , ,c k l rk , is found from (A 30) [48],
which applies for a sphere experiencing forced convection in a fluid.
11
, , , ,32, , , , , , , ,
, ,
2 0.60 Re mix f k l rc k l r p k l p k l r
p k l
Dk Sc
d
= + ⋅ ⋅ ⋅
(A 30)
The particle Reynolds and Schmidt’s number is defined by (A 15) and (A 31).
, , ,, , ,
, , , , , , ,
mix f k lp k l r
mix f k l mix f k l r
ScD
µρ
=⋅
(A 31)
The molar diffusion coefficient of the reactant, , , , ,mix f k l rD , is found from (A 11) using the
film layer temperature to calculate bimolecular diffusion coefficients in (A 12) and (A
13).
A.4 Particle Slip Velocity, Heat Capacity, Enthalpy and Concentration
The slip velocity of a particle is used in both the mass and energy balances in section 3.2
and to calculate the Reynolds number of a particle in (A 15). The particle slip velocity is
found in (A 32) - (A 34) as suggested by Haider & Levenspiel [53].
148
( )
, ,, , 1
2 3, , ,
, , , , , , , ,
s k ls k l
mix f k la
mix f k l p k l mix f k lg
νν
ρµ ρ ρ
•
= ⋅ ⋅ −
(A 32)
( ) ( )
1.21315
, ,
1.6486 0.41215
, , , ,
110.8323 0.626029s k l
p k l p k ld d
ν •
• •
=
+
(A 33)
( )13
, , , , , , , ,, , , , 2
, , ,
amix f k l p k l mix f k l
p k l p k lmix f k l
gd d
ρ ρ ρ
µ•
⋅ ⋅ − = ⋅
(A 34)
In (A 32) and (A 34) values of film layer viscosity is found from (A 25), film layer
density is found from (A 29) and apparent particle densities are found from (A 4) - (A 6).
In the solid energy balances it is necessary to describe the solid heat capacity as a
function of particle temperature. This relationship is described by Coimbra and Queiroz
[54] in (A 35) - (A 38). In (A 36) the characteristic Einstein temperature, 1θ , which is a
measure of the energy in atomic vibrations, has a constant value of 380 K.
0
Njx
j j
wR R
M=
= ⋅
∑
(A 35)
2, ,
, , 2, ,
, ,
exp
exp 1
i
p k lii k l
p k li
p k l
TEF
T
T
θθ
θ
= ⋅
−
(A 36)
( )2
9 4.973 1100
dafLHVx
VMQR
θ − ⋅ − = ⋅
(A 37)
149
1, , 2, ,, ,
23
3 3k l k lx
p k l
EF EFC R
⋅= ⋅ ⋅ +
(A 38)
In (A 37) the volatile content is zero in all of the simulations as the equation is used on
devolatilized char. The lower heating value, LHVQ , is 32.75 MJ kg-1 corresponding to the
oxidation of one kg carbon to carbon dioxide at standard conditions.
The solid enthalpy, used to calculate the particle heat of reaction, will be approximated as
that of graphite [34].
, , , ,2.286 1099.5p k l p k lH T= ⋅ − (A 39)
The concentration of a particle fraction defined by size and morphology will change
down the reactor as the slip velocity of that fraction will decrease during its consumption.
The concentration of a particle fraction defined by size and morphology is given by (A
40).
( )
~
,0, 0, , ,
Char l kl k a
p k p l s k l g R
mNV A
αρ ν ν
⋅ ⋅Θ=
⋅ ⋅ + ⋅
(A 40)
A.5 Gas Velocities
The linear velocity of the section of the laminar gas front where particles are sampled
during experiments is given by (A 41). The average linear gas velocity in the reactor is
calculated as (A 42).
( )2 2
2
2g R Fg
R
R RR
νν
⋅ ⋅ −=
(A 41)
150
T gg
R
F R TA P
ν⋅ ⋅
=⋅
(A 42)
Appendix B: Derivation of Particle Mass Balances
The particle mass balances for cenospheres, network chars and dense chars are derived in
the following. All mass balances include reaction on both exterior and interior surfaces
but consumption is taking place after a shrinking spheres model. To describe the
development of interior surface the volumetric reaction model is used for all char
morphologies.
B.1 Cenospheric Char
The mass balance for a cenospheric char particle is based on continuous char matrix and
its derivation proceeds as shown below.
( ) ( )( ), ,, , , , ,
r rn np k r S Sp k k k r r k r p k k r rk k
dmm S k C A k C
dtη= − ⋅ ⋅ ⋅ ⋅ + ⋅ ⋅ ⇒
( )
( ) ( ) ( )
3 3, , ,
3 3 2, , , , , , ,
43
4 43
r r
p p k p k I r
n nS Sp k p k I p k k r r k r p k k r rk k
d R R
dt
R R S k C R k C
π ρ
π ρ η π
⋅ ⋅ ⋅ −=
− ⋅ ⋅ − ⋅ ⋅ ⋅ ⋅ ⋅ + ⋅ ⋅ ⋅ ⋅ ⇒
( ) ( ) ( ) ( )3 3 2
, , , ,3 3, , , , , ,
3r rn np k p k I p kS Srp k p k I k k r r k r k r rk k
p
d R R RR R S k C k C
dtη
ρ
− ⋅= − − ⋅ ⋅ ⋅ ⋅ + ⋅ ⋅
(B 1)
Before continuing the derivation the differential in (B 1) must be redefined using particle
conversion. This redefinition is shown in (B 2).
0, ,
0,
p k p kk
p k
m mX
m−
= ⇒
151
( )( )
3 3, , , ,
3 30, , , ,
431 43
ap k p k I p N
ka
p k p k I p N
R RX
R R
π ρ
π ρ
⋅ ⋅ − ⋅= − ⇒
⋅ ⋅ − ⋅
( )( )
3 3, , ,
3 30, , ,
1 p k p k Ik
p k p k I
R RX
R R
−= −
−
( ) ( ) ( )3 3 3 3, , , 0, , , 1p k p k I p k p k I kR R R R X− = − ⋅ − (B 2)
Substituting (B 2) into (B 1) yields (B 3), the last intermediate expression before the final
formulation of the mass balance is achieved.
( ) ( ) ( )2
,,, 0 , 3 3
0, , ,
31rn p kk r S
k r r k k rkp p k p k I
RdXk C X S
dt R Rη
ρ
⋅ = ⋅ ⋅ − ⋅ ⋅ + ⋅ −
(B 3)
In order to express the radius in (B 3) as a function of char conversion the derivation
below is made from (B 2). The definition ( )0 0, , , 0,/p k p k I p kR R Rδ = − is utilized in the
derivation.
( ) ( ) ( )3 3 3 3, , , 0, , , 1p k p k I p k p k I kR R R R X− = − ⋅ − ⇒
( ) ( )( )1
3 3 3 3, 0, , , , ,1p k p k p k I k p k IR R R X R
= − ⋅ − + ⇒
( )1
3 3 3 3, 0, 0, , ,p k p k p k k p k I kR R R X R X
= − ⋅ + ⋅ ⇒
( ) ( )( )1
33 3 3, 0, 0, 01 1p k p k k p k kR R X R Xδ
= ⋅ − + ⋅ − ⋅ ⇒
( )( )( )1
3 3, 0, 01 1 1p k p k kR R X δ
= − ⋅ − −
(B 4)
152
Substituting (B 4) into (B 3) and using the definition of 0δ the final form of the
cenospheric mass balance is (2).
( )( )
( )( )( )( )( )
23 3
0,,0 , 3
, 0, 0
3 1 1 11
1 1
rnSkk r rk r k
k k rs k g p p k
Xk CdXS X
dL R
δη
ν ν ρ δ
⋅ − ⋅ − −⋅ = ⋅ ⋅ − ⋅ +
+ ⋅ ⋅ − −
(2)
B.2 Network Chars and Dense Chars
The derivation of the mass balance for a network chars and a dense chars is identical and
proceeds as follow.
( ) ( )( ), , ,, , , , , , , , , , ,, ,
r rn np k l r S Sp k l k l k l r r k l r p k l k l r rk l k l
dmm S k C A k C
dtη= − ⋅ ⋅ ⋅ ⋅ + ⋅ ⋅ ⇒
( ) ( )3
, , ,3 2
, , , , , , , , , , ,, ,
443 43
r rp p k l r n nS S
p k l p k l k l r r k l r p k l k l r rk l k l
d RR S k C R k C
dt
π ρπ ρ η π
⋅ ⋅ ⋅ = − ⋅ ⋅ ⋅ ⋅ ⋅ ⋅ ⋅ + ⋅ ⋅ ⋅ ⋅ ⇒
( ) ( )3 2
, , , , ,3, , , , , , , , ,, ,
3r rn np k l r p k lS Sp k l k l k l r r k l r k l r rk l k l
p
dR RR S k C k C
dtη
ρ ⋅
= − ⋅ ⋅ ⋅ ⋅ + ⋅ ⋅
(B 5)
Before the derivation can continue the differential in (B 5) must be redefined using char
conversion to express the particle radius. This definition is shown in (B 6).
( )13
, , 0, , ,1p k l p k l k lR R X = ⋅ −
(B 6)
Substituting (B 6) into (B 5) yields the final form of the network- and dense char mass
balances, shown in (B 7). It can be seen that (B 7) is identical to (2) when 0 1δ = .
153
( )3 2
, , , ,, ,, , , , ,3 3,
0, , 0, ,
3rn p k l p k lk l r Sk l r r k l k l rk l
p k l p k l p
R RdXk C S
dt R Rη
ρ ⋅
= ⋅ ⋅ ⋅ ⋅ + ⇒ ⋅
( )( ) ( )
23, , ,, , ,
0 , , ,, , 0, ,
3 11
rnSk l r r k lk l r k l
k l k l rs k l g p p k l
k C XdXS X
dL Rη
ν ν ρ
⋅ ⋅ − = ⋅ ⋅ − ⋅ + + ⋅
(B 7)
154
References
[1] Buhre BJP, Elliot LK, Sheng CD, Gupta RP, Wall TF. Oxy-fuel combustion
technology for coal-fired power generation. Prog Energy Combust Sci. 2005;31:283-7
[2] Figueroa JD, Fout T, Plasynski S, McIlvried H, Srivastava RD. Advances in CO2
capture technology-The U.S. department of energy’s carbon sequestration program. Int J
Greenhouse Gas Control 2008;2:9-0
[3] Murphy JJ, Shaddix CR. Combustion kinetics of coal chars in oxygen-enriched
environments. Combust Flame 2006;144:710-9
[4] Hurt R, Sun J-K, Lunden M. A kinetic model of carbon burnout in pulverized coal
combustion. Combust Flame 1998;113:181-1
[5] Murphy JJ, Shaddix CR. Effect of reactivity loss on apparent reaction order of
burning char particles 2010;157:535-9
[6] Cloke M, Wu T, Barranco R, Lester E. Char characterisation and its application in a
coal burnout model. Fuel 2003;82:1989-0
[7] Wu T, Lester E, Cloke M. A burnout prediction model based around char
morphology. Energy Fuels 2006;20:1175-3
[8] Ballester J, Jiménez S. Kinetic parameters for the oxidation of pulverized coal as
measured from drop tube tests. Combust Flame 2005;142:210-2
[9] Jiménez S, Ballester J. Study of the evolution of particle size distributions and it
effects on the oxidation of pulverized coal. Combust Flame 2007;151:482-4
155
[10] Mitchell RE, Ma L, Kim BJ. On the burning behavior of pulverized coal chars.
Combust Flame 2007;151:426-6
[11] Hurt RH, Lunden MM, Brehob EG, Maloney DJ. Statistical kinetics for pulverized
coal combustion. 26’th Symposium (International) on Combustion 1996:3169-7
[12] Gale TK, Bartholomew CH, Fletcher TH. Effects of pyrolysis heating rate on
intrinsic reactivities of coal char. Energy Fuels 1996;10:766-5
[13] Ma L, Mitchell R. Modeling char oxidation behavior under zone II burning
conditions at elevated pressures. Combust Flame 2009;156:37-0
[14] Yu J, Lucas JA, Wall TF. Formation of the structure of chars during devolatilization
of pulverized coal and its thermoproperties: A review. Prog Energy Combust Sci.
2007;33:135-0
[15] Brix J, Jensen PA, Jensen AD. Coal devolatilization and char conversion under
suspension fired conditions in O2/N2 and O2/CO2 atmospheres. Fuel 2010;89:3373-0
[16] Bejarano PA, Levendis YA. Single-coal-particle combustion in O2/N2 and O2/CO2
environments. Combust Flame 2008;153:270-7
[17] Rathnam RK, Elliot LK, Wall TF, Liu Y, Moghtaderi B. Differences in reactivity of
pulverized coal in air (O2/N2) and oxy-fuel (O2/CO2) conditions. Fuel Proc. Technol.
2009;90:797-2
[18] Molina A, Shaddix CR. Ignition and devolatilization of pulverized bituminous coal
particles during oxygen/carbon dioxide coal combustion. Proc Combust Inst 2007;
31:1905 – 2
156
[19] Shaddix CR, Molina A. Particle imaging of ignition and devolatilization of
pulverized coal during oxy-fuel combustion. Proc Combust Inst 2009;32:2091-8
[20] Li Q, Zhao C, Chen X, Wu W, Li Y. Comparison of pulverized coal combustion in
air and in O2/CO2 mixtures by thermo-gravimetric analysis. J. Anal. Appl. Pyrolysis
2009;85:521-8
[21] Várhegyi G, Szabó P, Jakab E, Till F. Mathematical modeling of char reactivity in
Ar-O2 and CO2-O2 mixtures. Energy Fuels 1996;10:1208-4
[22] Liu H. Combustion of coal char in O2/CO2 and O2/N2 mixtures: A comparative study
with non-isothermal thermogravimetric analyzer (TGA) tests. Energy Fuels
2009;23:4278-5
[23] Brix J et al. Coal char reactivity: A thermogravimetric study on chars obtained in
O2/N2 and O2/CO2 in an entrained flow reactor under suspension fired conditions and in a
TGA. Article in progress
[24] Shu X, Xu X. Study on morphology of chars from coal pyrolysis. Energy Fuels
2001;15:1347-3
[25] Bailey JG, Tate A, Diessel CFK, Wall TF. A char morphology system with
applications to coal combustion. Fuel 1990;69:225-9
[26] Tsai C-Y, Scaroni AW. Reactivity of bituminous coal chars during the initial stage
of pulverized-coal combustion. Fuel 1987;66:1400-6
[27] Tsai C-Y, Scaroni AW. The structural changes of bituminous coal particles during
the initial stages of pulverized-coal combustion. Fuel 1987;66:200-6
157
[28] Gao H, Murata S, Nomura M, Ishigaki M, Qu M, Tokuda M. Experimental
observation and image analysis for evaluation of swelling and fluidity of single coal
particles heated with CO2 laser. Energy Fuels 1997;11:730-8
[29] Gao H, Murata S, Nomura M, Ishigaki M, Tokuda M. Preliminary surface structure
transition of coal particles during prepyrolysis with CO2 laser. Energy Fuels
1996;10:1227-4
[30] Gale TK, Bartholomew CH, Fletcher TH. Decreases in the swelling and porosity of
bituminous coals during devolatilization at high heating rates. Combust Flame
1995;100:94-0
[31] Fletcher TH. Swelling properties of coal chars during rapid pyrolysis and
combustion. Fuel 1993;72:1485-5
[32] Kee RJ, Rupley FM, Miller JA. CHEMKIN II: A FORTRAN chemical kinetics
package for the analysis of gas-phase chemical kinetics, Report No. SAND 89-8009,
Sandia National Laboratories, 1989
[33] Oh MS, Peters WA, Howard JB. An experimental and modeling study of softening
coal pyrolysis. AIChE Journal 1989;35:775-2
[34] Brix J. A model for entrained flow reactor gasification of solid fuels for syngas
production. M.Sc. Thesis, Department of Chemical and Biochemical Engineering, CHEC
Research Center, Technical University of Denmark, 2007:1-4
[35] Norman J, Pourkashanin M, Williams A. Modeling the formation and emission of
environmentally unfriendly coal species in some gasification processes. Fuel
1997;76:1201-6
158
[36] Wen CY. Noncatalytic heterogeneous solid fluid reaction models. Ind. Eng. Chem
1968;9:34-4
[37] Bhatia SK, Perlmutter DD. A random pore model for fluid-solid reactions: I.
Isothermal, kinetic control. AIChE Journal 1980;26:379-6
[38] Bhatia SK, Perlmutter DD. A random pore model for fluid-solid reactions: II.
Diffusion and Transport Effects. AIChE Journal 1981;27:247-4
[39] Szekely J, Evans JW. A structural model for gas-solid reactions with a moving
boundary. Chem. Eng. Sci. 1970;25:1091-7
[40] Szekely J, Evans JW. A structural model for gas-solid reactions with a moving
boundary-II. Chem. Eng. Sci. 1971;26:1901-3
[41] Sohn HY, Szekely J. A structural model for gas-solid reactions with a moving
boundary-III. A general dimensionless representation of the irreversible reaction between
a porous solid and a reactant gas. Chem. Eng. Sci. 1972;27:763-8
[42] Yagi S, Kunii D. Studies on combustion of carbon particles in flames and fluidized
beds. Fifth Symposium (International) on Combustion 1955:231-4
[43] Zolin A, Jensen A, Pedersen LS, Dam-Johansen K. A comparison of coal char
reactivity determined from thermogravimetric and laminar flow reactor experiments.
Energy Fuels 1998;12:268-6
[44] Charpenay S, Serio MA, Solomon PR. The prediction of coal char reactivity under
combustion conditions. Twenty-Fourth Symposium (International) on Combustion
1992:1189-7

159
[45] Mon E, Amundson NR. Diffusion and reaction in a stagnant boundary layer about a
carbon particle. 2. An extension. Ind Eng. Chem. Fundam. 1978;17:313-1
[46] Zhang H, Pu W-X, Ha S, Li Y, Sun M. The influence of included minerals on the
intrinsic reactivity of char prepared at 900 oC in a drop tube furnace and a muffle furnace.
Fuel 2009;88:2303-0
[47] Froment GF, Bischoff KB. Chemical reactor analysis and design, 2’nd edition. John
Wiley & Sons, Inc; 1990
[48] Bird RB, Stewart WE, Lightfoot EN. Transport phenomena, 2’nd edition. John
Wiley & Sons, Inc;2002
[49] Griskey RG. Transport phenomena and unit operations – A combined approach, 1’st
edition, John Wiley & Sons, Inc;2002
[50] Gosse J. The thermal conductivity of pure polyatomic gasses at moderate pressure.
Int. J. Heat Mass Transfer 1992;35:599-4
[51] Wilke CR. A viscosity equation for gas mixtures. J. Chem. Phys. 1950;18:517-9
[52] Laidler KJ, Meiser JH. Sanctuary BC. Physical chemistry, 4’th edition. Houghton
Mifflin:2002
[53] Haider A, Levenspiel O. Drag coefficient and terminal velocity of spherical and
nonspherical particles. Powder Technol. 1989;58:63-0
[54] Coimbra CFM, Queiroz M. Evaluation of a dimensionless group number to
determine second-Einstein temperatures in a heat capacity model for all coal ranks.
Combust Flame 1995;101:209-0
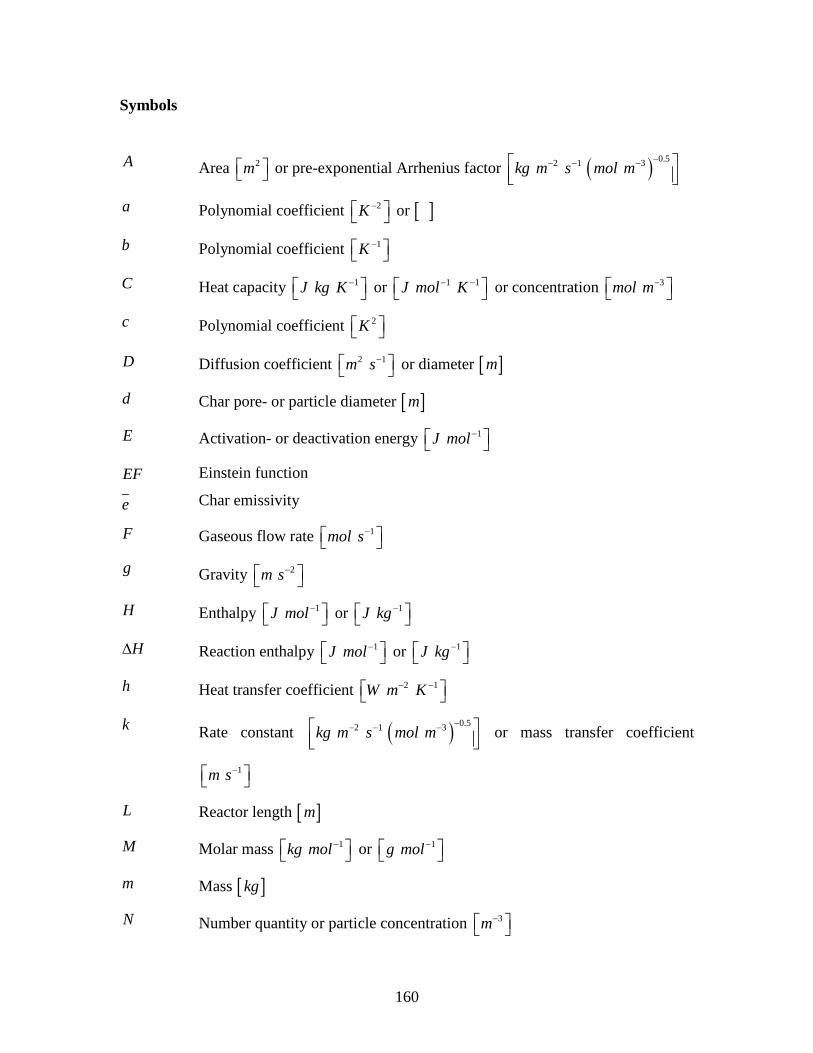
160
Symbols
A Area 2m or pre-exponential Arrhenius factor ( ) 0.52 1 3kg m s mol m−− − −
a Polynomial coefficient 2K − or [ ]
b Polynomial coefficient 1K −
C Heat capacity 1J kg K − or 1 1J mol K− − or concentration 3mol m−
c Polynomial coefficient 2K
D Diffusion coefficient 2 1m s− or diameter [ ]m
d Char pore- or particle diameter [ ]m
E Activation- or deactivation energy 1J mol−
EF Einstein function
e Char emissivity
F Gaseous flow rate 1mol s−
g Gravity 2m s−
H Enthalpy 1J mol− or 1J kg −
H∆ Reaction enthalpy 1J mol− or 1J kg −
h Heat transfer coefficient 2 1W m K− −
k Rate constant ( ) 0.52 1 3kg m s mol m−− − −
or mass transfer coefficient
1m s−
L Reactor length [ ]m
M Molar mass 1kg mol− or 1g mol−
m Mass [ ]kg
N Number quantity or particle concentration 3m−
161
n Reaction order
P Pressure [ ]Pa , [ ]Bar or [ ]atm
Pr Prandtl’s number
Q Convective heat transfer 3W m− or heating value 1J kg −
R Radius [ ]m or gas constant 1 1J mol K− − or 1 1J kg K− −
Re Reynolds number
r Reaction rate 3 1mol m s− − or 1s−
S Specific surface area 2 1m kg −
Sc Schmidt’s number
T Temperature [ ]K
V Volume 3m
VM Volatile fraction
W Initial weight percent of particle size k
w Molar fraction of a char constituents [ ]daf
X Char conversion
x Molar fraction
z Oxidizer to fuel ratio
α Initial weight fraction of a char morphology
δ Cenosphere wall thickness [ ]mµ or cenosphere wall thickness divided by
cenosphere radius
ε Char porosity
εκ Lennard-Jones parameter [ ]K
ς Stoichiometric coefficient η Internal particle effectiveness factor
Θ Initial weight fraction of a particle size
θ Einstein temperature [ ]K
Λ Stoichiometric coefficient of heterogeneous reaction
162
λ Thermal conductivity 1 1W m K− −
µ Viscosity [ ]Pa s
ν Linear velocity 1m s−
ρ Skeletal density (unless indexed by superscript a ) 3kg m−
SBσ Stefan-Boltzmann constant 2 4W m K− −
σ Lennard-Jones parameter Å
τ Tortuosity
φ Thiele modulus
Ψ Particle Sphericity
Ω Collisional integral
Subscripts
A Activation
a Stoichiometric coefficient of carbon in char
b Stoichiometric coefficient of hydrogen in char
C Cenospheric char
c Mass transfer coefficient
D Deactivation or dense char
d Stoichiometric coefficient of nitrogen in char
daf Dry and ash free basis
e Stoichiometric coefficient of sulfur in char
F Funnel of sampling probe
G Index of all gaseous species
f Gas film layer property
H Index of all homogeneous reactions
h Index of gaseous component
I Cenosphere cavity radius
i Index of homogeneous reaction
163
j Index of gaseous component
K Knudsen diffusivity
k Index of initial particle size
LHV Lower heating value
l Index of char morphology
m Relating property to mass
mix Property of N2, CO2 and O2 mixture
N Network char p Particle property or constant pressure gas property pore Pore property
R Reactor property
r Index of gaseous reactant
s Particle slip velocity
T Total amount
u Stoichiometric coefficient of ash in char
Wall Wall of a particle
w Reactor wall property y Stoichiometric coefficient of oxygen in char
0 Initial property
Superscripts
a Apparent density
B Bulk gas property
n Reaction order
S Particle surface property
* Effective diffusivity
^ Mean gas flow
• Dimensionless property
x Based on mass
~ Flow in time
164
Article IV Oxy-Fuel Combustion of Coal Char: Particle Temperature and NO
Formation
165
Oxy-Fuel Combustion of Coal Char: Particle Temperature and NO
Formation
Jacob Brix1, Leyre Gómez Navascués1, Joachim Bachmann Nielsen1, Peter Løvengreen
Bonnek1, Henning Engelbrecht Larsen2, Sønnik Clausen3, Peter Glarborg1, Anker Degn
Jensen*,1
1Department of Chemical and Biochemical Engineering – Technical University of Denmark, Building 229 Søltofts
Plads, 2800 Kgs. Lyngby, Denmark 2Department of Photonics Engineering – Technical University of Denmark, Building 128, Frederiksborgvej 399, 4000
Roskilde 3Department of Plasma Physics and Technology – Technical University of Denmark, Building 128, Fredriksborgvej
399, 4000 Rosklide
*Corresponding Author: e-mail: [email protected], Fax: +45 45 88 22 58, Phone: +45 45 25 28 41
Abstract
The objective of this investigation is to examine differences in char-NO emissions
between O2/N2 and O2/CO2 atmospheres. A laboratory scale fixed bed reactor, operated
isothermally at 1073 K, has been used for combustion of millimeter-sized lignite- and
bituminous char particles in 5 – 80 vol. % O2. Particle temperatures and structural
changes have been recorded by a Charged Coupled Device (CCD) camera during the
experiments. Experiments have been carried out with both single and multiple particles of
different sizes. Emissions from lignite char were not influenced by the change from N2 to
CO2 whereas emissions from bituminous char were lower in O2/CO2. For both chars
emissions decreased as the O2 concentration or the particle size increased. An
intermediate particle size, where emissions peaked was observed however for bituminous
char. The CCD camera provided accurate in situ temperature measurements during the
experiments and film recording proved a valuable tool for data interpretation. Results
suggest that transport phenomena and kinetics alone can not account for changes in NO
emissions between O2/N2 and O2/CO2. The effect of mineral catalysis and the presence of
other N-containing species, such as HCN and NH3, may also play a role.
Keywords: Oxy-fuel, Combustion, CCD Camera, Particle Temperature, NO
166
1. Introduction
In recent years the increased focus on anthropogenic CO2 emission and its effect on the
earth’s climate have lead to research programs that aim at reducing the CO2 emission
from fossil fueled power and heat generation. An interesting technology in this context is
oxy-fuel combustion, where recycled flue gas is mixed with near pure O2 before the
boiler entrance. This results in a plant exit stream of almost pure CO2, ready for
subsequent capture and sequestration [1,2].
The change from N2 to CO2 as the dominant gaseous species alters the characteristics of
NO formation/reduction and gives promises of lower emissions [1-4]. Even though
mechanisms of NO formation/reduction have been extensively studied for decades [5,6-
17], several questions remain unanswered, making interpretation of results obtained
under oxy-fuel conditions difficult. These questions relate to the effect of mineral
catalysis in heterogeneous NO reduction [18-20], the effect of coal rank in heterogeneous
NO reduction [16] and the effect of CO in heterogeneous NO reduction [19,21,22].
Recent results show that homogeneous kinetics of NO formation/reduction, which
changes significantly under oxy-fuel conditions are fairly well described [23-28]. In order
to utilize the potential of reduced NO emission in oxy-fuel combustion through primary
measures knowledge of especially char-NO formation is therefore necessary.
The objective of the present work is to investigate char-NO emissions in N2 and CO2
atmospheres under a wide range of O2 concentrations of relevance to both retrofit- and
future oxy-fuel plants. The work comprises data from laboratory fixed bed combustion of
millimeter-sized lignite- and bituminous char particles. Besides the effect of O2
concentration the influence of particle size- and concentration is also investigated and a
CCD camera has been used for continuously monitoring and recording of particle
temperature and structure. The results are discussed in terms of mechanisms for NO
formation from char nitrogen oxidation.
2. Experimental
2.1 Equipment
Experiments have been carried out in the laboratory scale fixed bed reactor shown
schematically in figure 1. The reactor consists of an inner and outer quartz cylinder
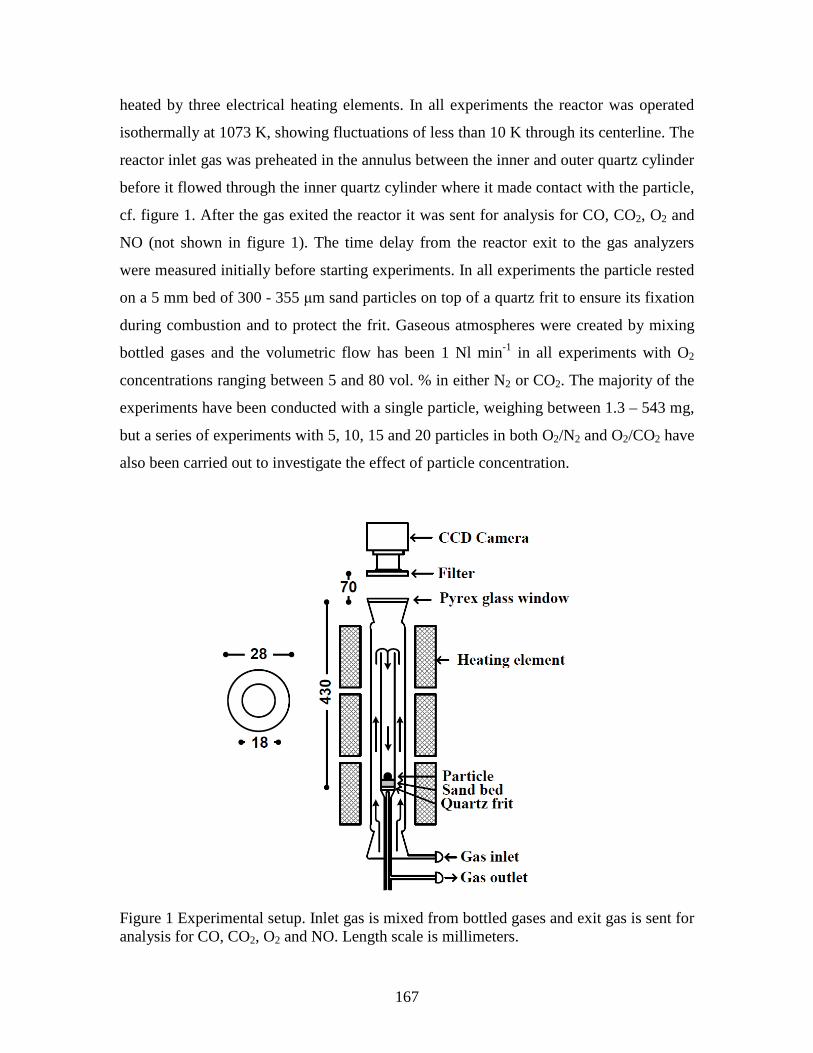
167
heated by three electrical heating elements. In all experiments the reactor was operated
isothermally at 1073 K, showing fluctuations of less than 10 K through its centerline. The
reactor inlet gas was preheated in the annulus between the inner and outer quartz cylinder
before it flowed through the inner quartz cylinder where it made contact with the particle,
cf. figure 1. After the gas exited the reactor it was sent for analysis for CO, CO2, O2 and
NO (not shown in figure 1). The time delay from the reactor exit to the gas analyzers
were measured initially before starting experiments. In all experiments the particle rested
on a 5 mm bed of 300 - 355 μm sand particles on top of a quartz frit to ensure its fixation
during combustion and to protect the frit. Gaseous atmospheres were created by mixing
bottled gases and the volumetric flow has been 1 Nl min-1 in all experiments with O2
concentrations ranging between 5 and 80 vol. % in either N2 or CO2. The majority of the
experiments have been conducted with a single particle, weighing between 1.3 – 543 mg,
but a series of experiments with 5, 10, 15 and 20 particles in both O2/N2 and O2/CO2 have
also been carried out to investigate the effect of particle concentration.
Figure 1 Experimental setup. Inlet gas is mixed from bottled gases and exit gas is sent for analysis for CO, CO2, O2 and NO. Length scale is millimeters.

168
A pyrex glass window was mounted on top of the reactor, directly above the bed, through
which a 16 bit CCD camera measured the intensity of the Near Infra Red (NIR) radiation
emitted by the particle. To ensure pure NIR measurements and to avoid saturation of the
camera’s light sensor, a filter was placed in front of the lens.
2.1.2 CCD Camera and Temperature Measurements
The CCD camera used was a Stingray F033 from Allied Vision Technologies and had a
14 bit analog to digital converter. An extra 2 bit of unsigned resolution was achieved by
averaging a series of shutter intervals thereby providing a total of 216 = 65536 digital
levels that could be detected by the camera. The digital level is a measure of the photon
radiation intensity. The maximum digital level corresponds to a saturation of the detector
and its processing system and it therefore relates to the maximum measurable particle
temperature. A filter, that only allows radiation in the wavelength interval 710 – 1100 nm
(NIR) to reach the sensor, was placed in front of the camera. The camera was calibrated
with the filter in the temperature interval 1023 K – 1873 K using a black body source.
This temperature interval was adequate for the experiments presented here. The filter
served two purposes; It avoided saturation of the camera at each temperature and it
reduced the influence of scatter caused by background radiation. The relationship
between particle temperature and camera response was modeled by integration of
Planck’s law over the wavelength interval of the filter. Constants accounting for the
emissivity of the radiating source, the transmittance of the filter and optics and the
camera sensitivity were established during calibration. The sensitivity of the temperature
measurements towards potential changes in source emissivity, e.g. ash layer formation
during combustion, were tested and found negligible (changes were a few K). Data
acquisition during the experiments was done using a LabVIEW program developed
specifically for this setup and output were given both as movies made up from still
images and data files.
It is important to emphasize that because the camera was recording the NIR radiation
from the part of the particles surface that was positioned in its view point reported
temperatures are surface temperatures of this area. Throughout the text the term
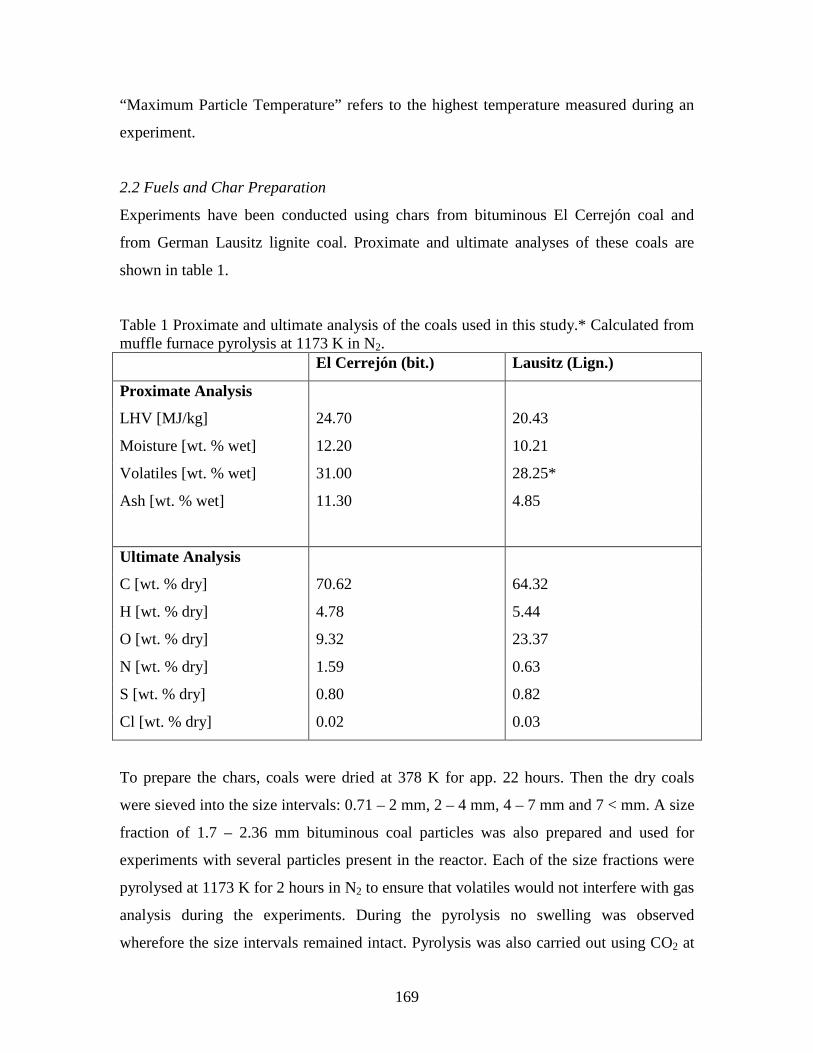
169
“Maximum Particle Temperature” refers to the highest temperature measured during an
experiment.
2.2 Fuels and Char Preparation
Experiments have been conducted using chars from bituminous El Cerrejón coal and
from German Lausitz lignite coal. Proximate and ultimate analyses of these coals are
shown in table 1.
Table 1 Proximate and ultimate analysis of the coals used in this study.* Calculated from muffle furnace pyrolysis at 1173 K in N2. El Cerrejón (bit.) Lausitz (Lign.)
Proximate Analysis
LHV [MJ/kg] 24.70 20.43
Moisture [wt. % wet] 12.20 10.21
Volatiles [wt. % wet] 31.00 28.25*
Ash [wt. % wet] 11.30 4.85
Ultimate Analysis
C [wt. % dry] 70.62 64.32
H [wt. % dry] 4.78 5.44
O [wt. % dry] 9.32 23.37
N [wt. % dry] 1.59 0.63
S [wt. % dry] 0.80 0.82
Cl [wt. % dry] 0.02 0.03
To prepare the chars, coals were dried at 378 K for app. 22 hours. Then the dry coals
were sieved into the size intervals: 0.71 – 2 mm, 2 – 4 mm, 4 – 7 mm and 7 < mm. A size
fraction of 1.7 – 2.36 mm bituminous coal particles was also prepared and used for
experiments with several particles present in the reactor. Each of the size fractions were
pyrolysed at 1173 K for 2 hours in N2 to ensure that volatiles would not interfere with gas
analysis during the experiments. During the pyrolysis no swelling was observed
wherefore the size intervals remained intact. Pyrolysis was also carried out using CO2 at
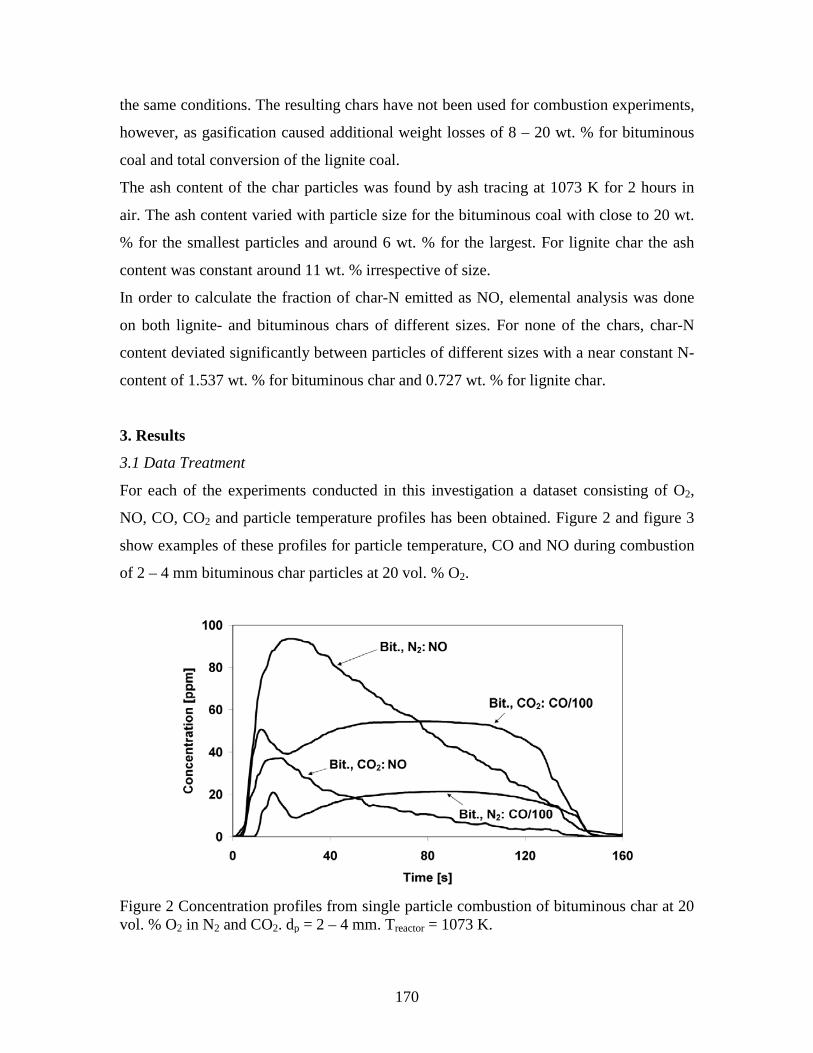
170
the same conditions. The resulting chars have not been used for combustion experiments,
however, as gasification caused additional weight losses of 8 – 20 wt. % for bituminous
coal and total conversion of the lignite coal.
The ash content of the char particles was found by ash tracing at 1073 K for 2 hours in
air. The ash content varied with particle size for the bituminous coal with close to 20 wt.
% for the smallest particles and around 6 wt. % for the largest. For lignite char the ash
content was constant around 11 wt. % irrespective of size.
In order to calculate the fraction of char-N emitted as NO, elemental analysis was done
on both lignite- and bituminous chars of different sizes. For none of the chars, char-N
content deviated significantly between particles of different sizes with a near constant N-
content of 1.537 wt. % for bituminous char and 0.727 wt. % for lignite char.
3. Results
3.1 Data Treatment
For each of the experiments conducted in this investigation a dataset consisting of O2,
NO, CO, CO2 and particle temperature profiles has been obtained. Figure 2 and figure 3
show examples of these profiles for particle temperature, CO and NO during combustion
of 2 – 4 mm bituminous char particles at 20 vol. % O2.
Figure 2 Concentration profiles from single particle combustion of bituminous char at 20 vol. % O2 in N2 and CO2. dp = 2 – 4 mm. Treactor = 1073 K.
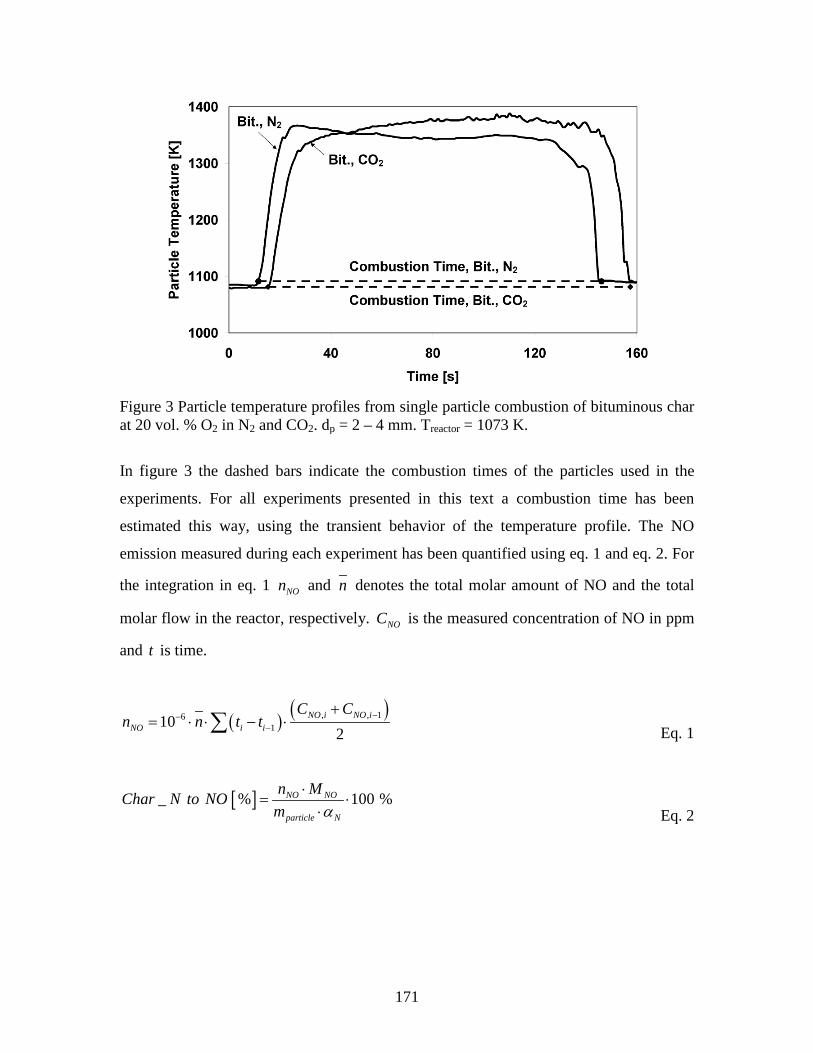
171
Figure 3 Particle temperature profiles from single particle combustion of bituminous char at 20 vol. % O2 in N2 and CO2. dp = 2 – 4 mm. Treactor = 1073 K.
In figure 3 the dashed bars indicate the combustion times of the particles used in the
experiments. For all experiments presented in this text a combustion time has been
estimated this way, using the transient behavior of the temperature profile. The NO
emission measured during each experiment has been quantified using eq. 1 and eq. 2. For
the integration in eq. 1 NOn and n denotes the total molar amount of NO and the total
molar flow in the reactor, respectively. NOC is the measured concentration of NO in ppm
and t is time.
( ) ( ), , 16110
2NO i NO i
NO i i
C Cn n t t −−
−
+= ⋅ ⋅ − ⋅∑
Eq. 1
[ ]_ % 100 %NO NO
particle N
n MChar N to NOm α
⋅= ⋅
⋅
Eq. 2
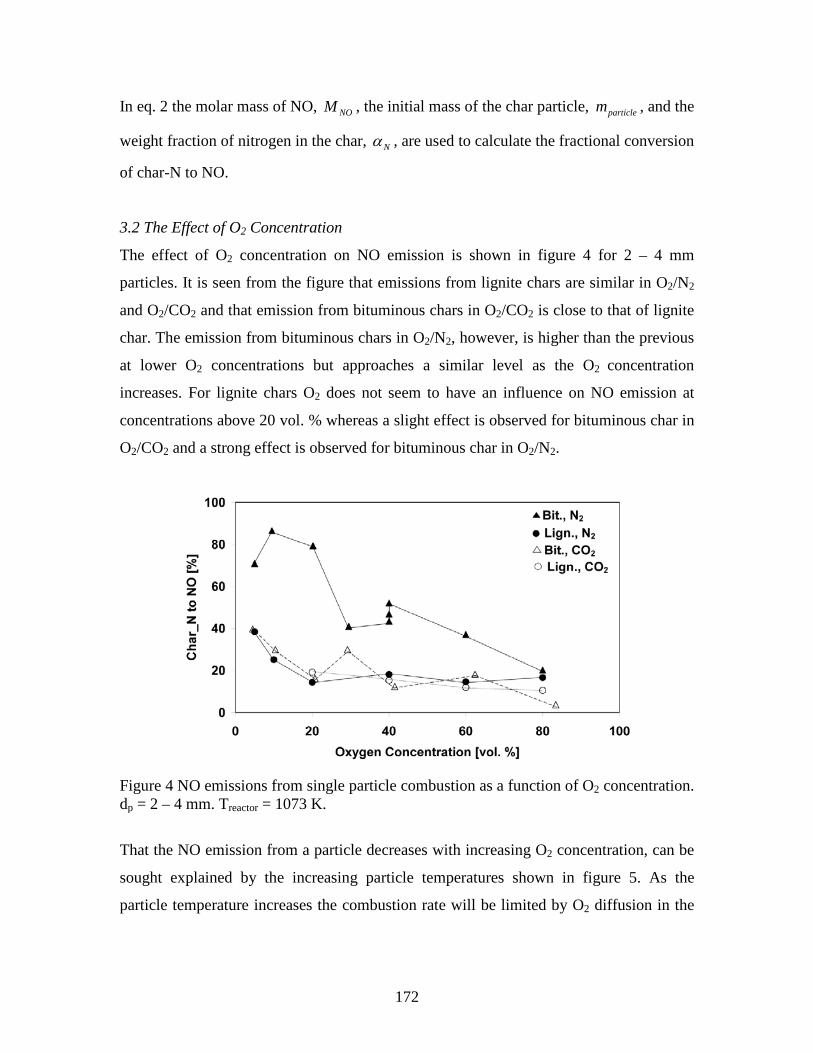
172
In eq. 2 the molar mass of NO, NOM , the initial mass of the char particle, particlem , and the
weight fraction of nitrogen in the char, Nα , are used to calculate the fractional conversion
of char-N to NO.
3.2 The Effect of O2 Concentration
The effect of O2 concentration on NO emission is shown in figure 4 for 2 – 4 mm
particles. It is seen from the figure that emissions from lignite chars are similar in O2/N2
and O2/CO2 and that emission from bituminous chars in O2/CO2 is close to that of lignite
char. The emission from bituminous chars in O2/N2, however, is higher than the previous
at lower O2 concentrations but approaches a similar level as the O2 concentration
increases. For lignite chars O2 does not seem to have an influence on NO emission at
concentrations above 20 vol. % whereas a slight effect is observed for bituminous char in
O2/CO2 and a strong effect is observed for bituminous char in O2/N2.
Figure 4 NO emissions from single particle combustion as a function of O2 concentration. dp = 2 – 4 mm. Treactor = 1073 K.
That the NO emission from a particle decreases with increasing O2 concentration, can be
sought explained by the increasing particle temperatures shown in figure 5. As the
particle temperature increases the combustion rate will be limited by O2 diffusion in the
173
particles interior, meaning that further increases in particle temperature mainly promotes
NO reduction over char in the reducing interior of the particle [6,17,29].
Figure 5 also shows that higher particle temperatures are reached for bituminous char
than for lignite char. This strikes as peculiar as the burnout times in figure 6 shows that
the lignite is significantly more reactive. An unambiguous explanation for this is not
known but factors such as conductive heat transfer between the sand bed and char particle
and the influence of particle surface texture on temperature measurements are likely
contributors.
In figure 4 it is seen that lignite char emissions are lower than for bituminous char when
combustion is taking place in O2/N2. That the char-NO emission decreases with
decreasing rank of the parent coal is previously reported in the literature [5,7,16,30]. It is
generally believed to be due to the development of a more reactive char network structure
upon pyrolysis for low rank coals [31], which increases NO-char reactivity as well as O2-
char reactivity [30,32]. When combustion is taking place in O2/CO2 figure 4 shows that
NO emissions for bituminous char drop significantly whereas emissions from lignite char
is hardly affected. Several factors can influence NO emission from a coal char. Ash
minerals are known to have a catalytic effect on NO reduction mainly due to constituents
such as Ca [10,33], Fe [19,33], Na [10,19,21,33] and K [10,33,34] and ash from low rank
coals have been reported to have a higher catalytic activity [35]. CO is also known to
enhance NO reduction on char [6,10,29], presumably through the removal of surface
oxides [36,37] and/or through a surface catalyzed reaction [21,22]. The relative
importance of CO is known to decrease with increasing temperatures [22,36,37] and to be
promoted by the presence of mineral matter [19,22,37]. Even though the ash content of
the lignite chars and bituminous chars in figure 4 is similar, differences in its composition
could mean that effects of catalytic minerals and CO on NO reduction are different for
each parent coal. For this to explain the trends in figure 4 it would mean that the
enhancement of CO for lignite chars that are highly reactive due a char structure rich in
active and/or catalytic sites is negligible whereas the enhancing effect of CO is
significantly reducing the emission from bituminous chars. That the replacement of N2
with CO2 in fact yields a significant increase in CO concentration is shown in figure 2,
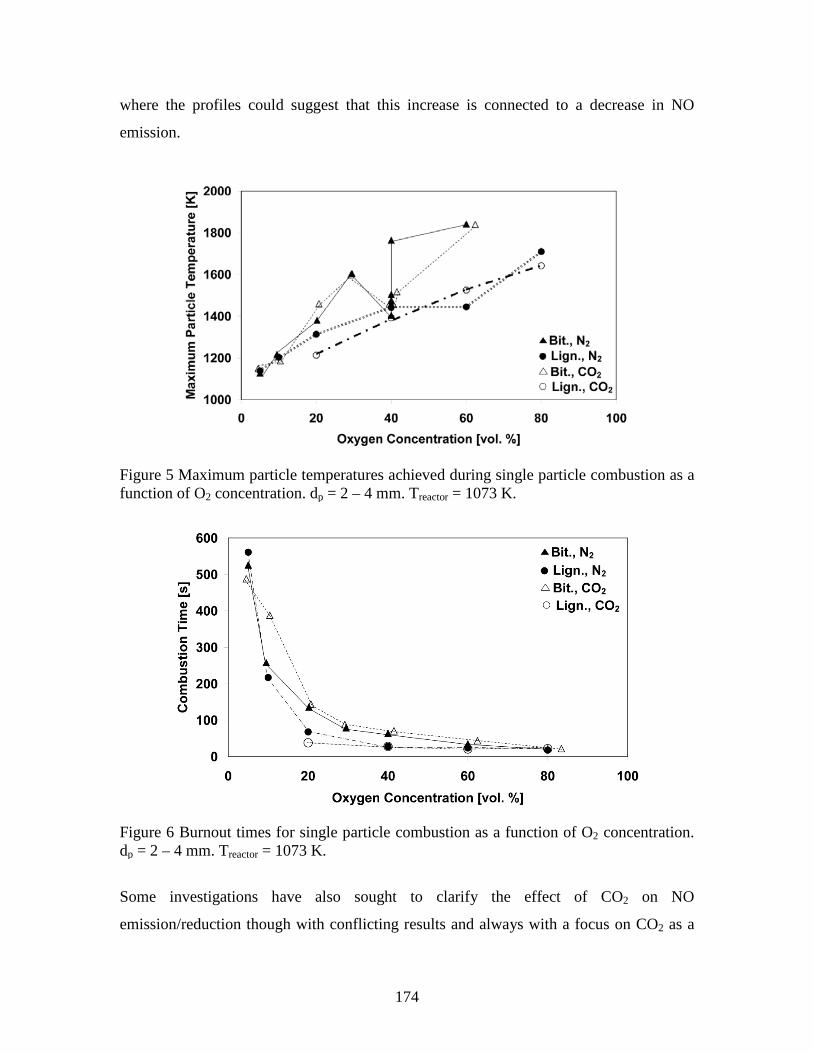
174
where the profiles could suggest that this increase is connected to a decrease in NO
emission.
Figure 5 Maximum particle temperatures achieved during single particle combustion as a function of O2 concentration. dp = 2 – 4 mm. Treactor = 1073 K.
Figure 6 Burnout times for single particle combustion as a function of O2 concentration. dp = 2 – 4 mm. Treactor = 1073 K.
Some investigations have also sought to clarify the effect of CO2 on NO
emission/reduction though with conflicting results and always with a focus on CO2 as a
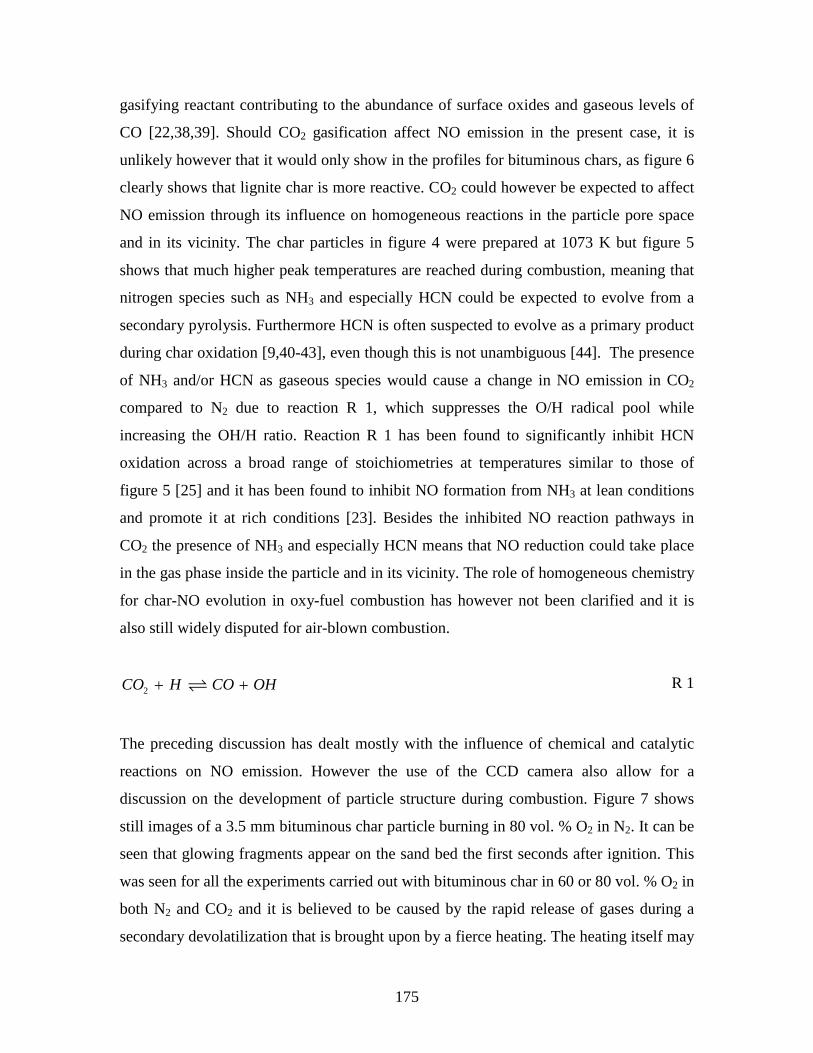
175
gasifying reactant contributing to the abundance of surface oxides and gaseous levels of
CO [22,38,39]. Should CO2 gasification affect NO emission in the present case, it is
unlikely however that it would only show in the profiles for bituminous chars, as figure 6
clearly shows that lignite char is more reactive. CO2 could however be expected to affect
NO emission through its influence on homogeneous reactions in the particle pore space
and in its vicinity. The char particles in figure 4 were prepared at 1073 K but figure 5
shows that much higher peak temperatures are reached during combustion, meaning that
nitrogen species such as NH3 and especially HCN could be expected to evolve from a
secondary pyrolysis. Furthermore HCN is often suspected to evolve as a primary product
during char oxidation [9,40-43], even though this is not unambiguous [44]. The presence
of NH3 and/or HCN as gaseous species would cause a change in NO emission in CO2
compared to N2 due to reaction R 1, which suppresses the O/H radical pool while
increasing the OH/H ratio. Reaction R 1 has been found to significantly inhibit HCN
oxidation across a broad range of stoichiometries at temperatures similar to those of
figure 5 [25] and it has been found to inhibit NO formation from NH3 at lean conditions
and promote it at rich conditions [23]. Besides the inhibited NO reaction pathways in
CO2 the presence of NH3 and especially HCN means that NO reduction could take place
in the gas phase inside the particle and in its vicinity. The role of homogeneous chemistry
for char-NO evolution in oxy-fuel combustion has however not been clarified and it is
also still widely disputed for air-blown combustion.
2CO H CO OH+ + R 1
The preceding discussion has dealt mostly with the influence of chemical and catalytic
reactions on NO emission. However the use of the CCD camera also allow for a
discussion on the development of particle structure during combustion. Figure 7 shows
still images of a 3.5 mm bituminous char particle burning in 80 vol. % O2 in N2. It can be
seen that glowing fragments appear on the sand bed the first seconds after ignition. This
was seen for all the experiments carried out with bituminous char in 60 or 80 vol. % O2 in
both N2 and CO2 and it is believed to be caused by the rapid release of gases during a
secondary devolatilization that is brought upon by a fierce heating. The heating itself may
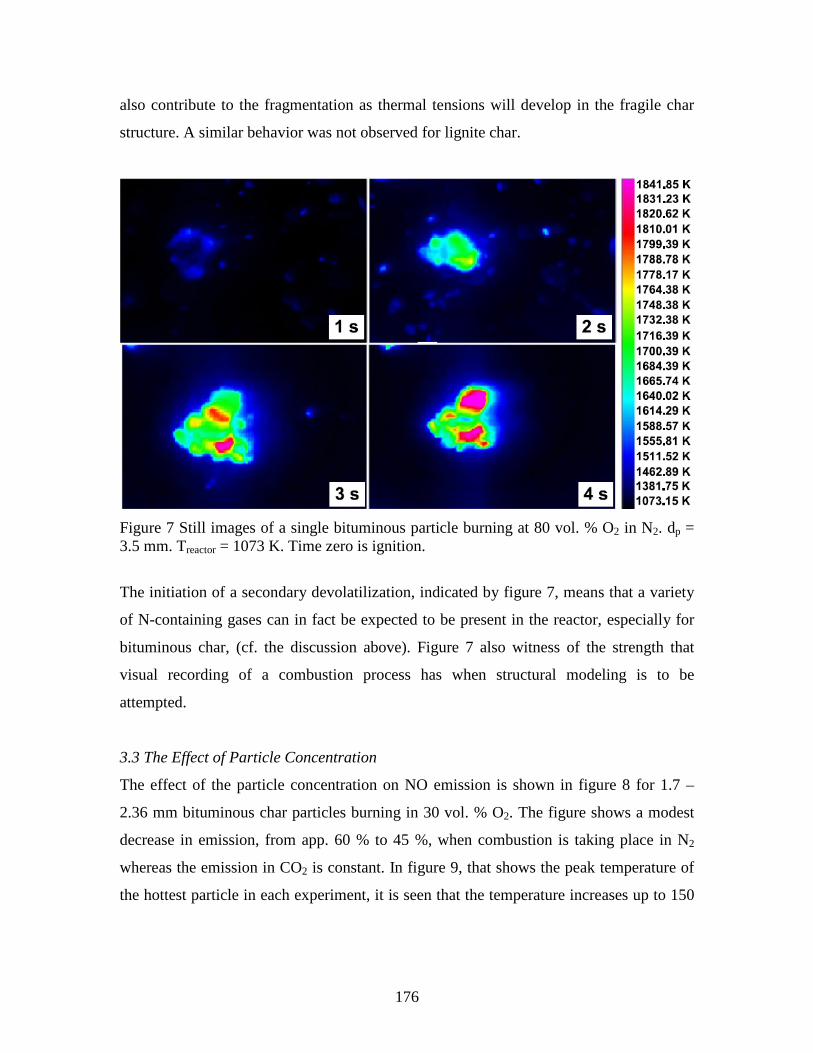
176
also contribute to the fragmentation as thermal tensions will develop in the fragile char
structure. A similar behavior was not observed for lignite char.
Figure 7 Still images of a single bituminous particle burning at 80 vol. % O2 in N2. dp = 3.5 mm. Treactor = 1073 K. Time zero is ignition.
The initiation of a secondary devolatilization, indicated by figure 7, means that a variety
of N-containing gases can in fact be expected to be present in the reactor, especially for
bituminous char, (cf. the discussion above). Figure 7 also witness of the strength that
visual recording of a combustion process has when structural modeling is to be
attempted.
3.3 The Effect of Particle Concentration
The effect of the particle concentration on NO emission is shown in figure 8 for 1.7 –
2.36 mm bituminous char particles burning in 30 vol. % O2. The figure shows a modest
decrease in emission, from app. 60 % to 45 %, when combustion is taking place in N2
whereas the emission in CO2 is constant. In figure 9, that shows the peak temperature of
the hottest particle in each experiment, it is seen that the temperature increases up to 150
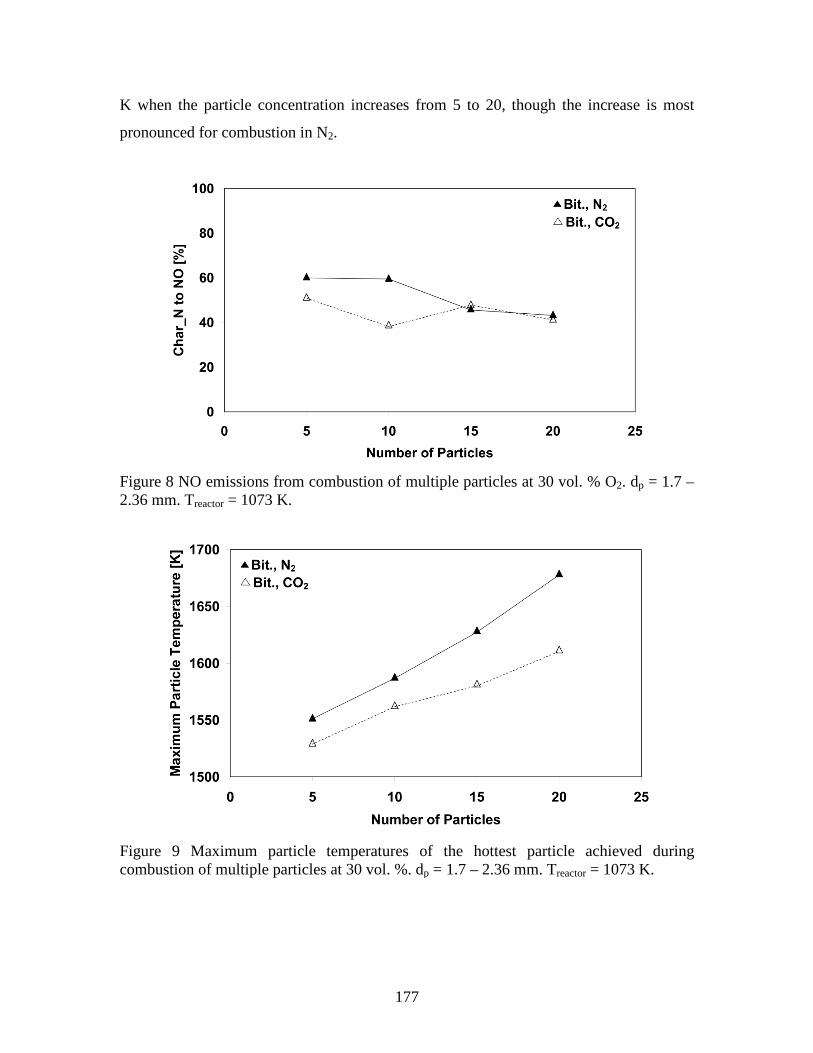
177
K when the particle concentration increases from 5 to 20, though the increase is most
pronounced for combustion in N2.
Figure 8 NO emissions from combustion of multiple particles at 30 vol. % O2. dp = 1.7 – 2.36 mm. Treactor = 1073 K.
Figure 9 Maximum particle temperatures of the hottest particle achieved during combustion of multiple particles at 30 vol. %. dp = 1.7 – 2.36 mm. Treactor = 1073 K.
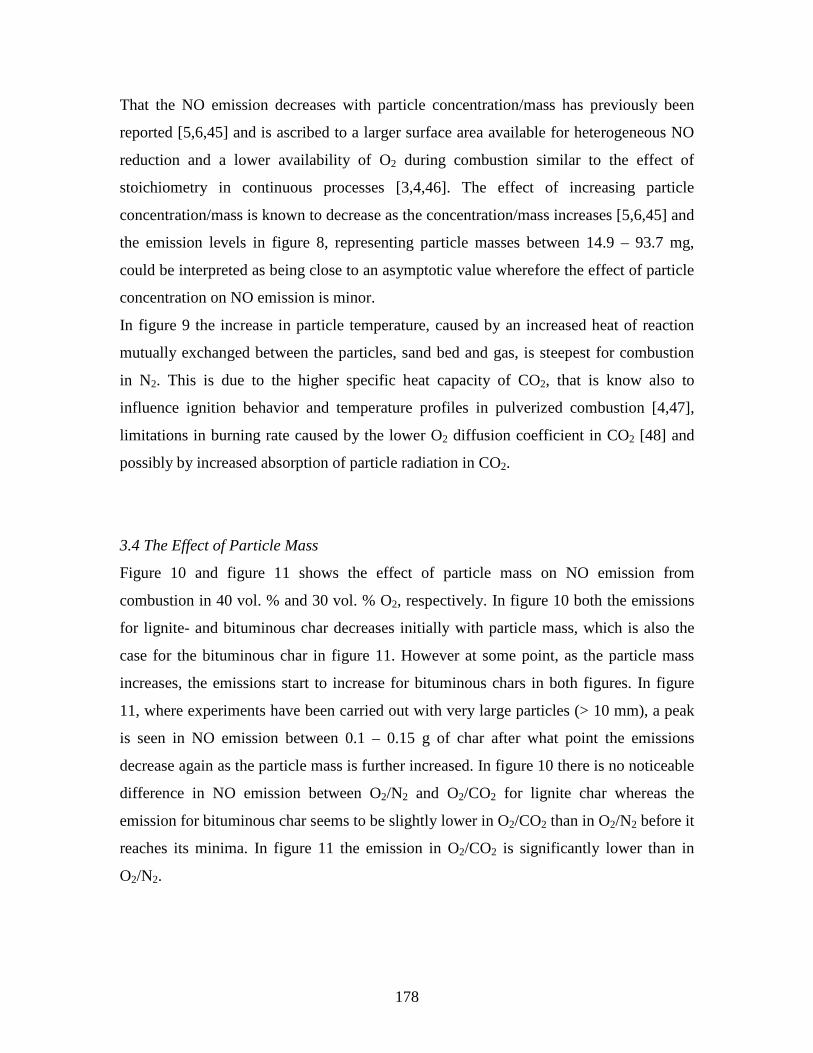
178
That the NO emission decreases with particle concentration/mass has previously been
reported [5,6,45] and is ascribed to a larger surface area available for heterogeneous NO
reduction and a lower availability of O2 during combustion similar to the effect of
stoichiometry in continuous processes [3,4,46]. The effect of increasing particle
concentration/mass is known to decrease as the concentration/mass increases [5,6,45] and
the emission levels in figure 8, representing particle masses between 14.9 – 93.7 mg,
could be interpreted as being close to an asymptotic value wherefore the effect of particle
concentration on NO emission is minor.
In figure 9 the increase in particle temperature, caused by an increased heat of reaction
mutually exchanged between the particles, sand bed and gas, is steepest for combustion
in N2. This is due to the higher specific heat capacity of CO2, that is know also to
influence ignition behavior and temperature profiles in pulverized combustion [4,47],
limitations in burning rate caused by the lower O2 diffusion coefficient in CO2 [48] and
possibly by increased absorption of particle radiation in CO2.
3.4 The Effect of Particle Mass
Figure 10 and figure 11 shows the effect of particle mass on NO emission from
combustion in 40 vol. % and 30 vol. % O2, respectively. In figure 10 both the emissions
for lignite- and bituminous char decreases initially with particle mass, which is also the
case for the bituminous char in figure 11. However at some point, as the particle mass
increases, the emissions start to increase for bituminous chars in both figures. In figure
11, where experiments have been carried out with very large particles (> 10 mm), a peak
is seen in NO emission between 0.1 – 0.15 g of char after what point the emissions
decrease again as the particle mass is further increased. In figure 10 there is no noticeable
difference in NO emission between O2/N2 and O2/CO2 for lignite char whereas the
emission for bituminous char seems to be slightly lower in O2/CO2 than in O2/N2 before it
reaches its minima. In figure 11 the emission in O2/CO2 is significantly lower than in
O2/N2.
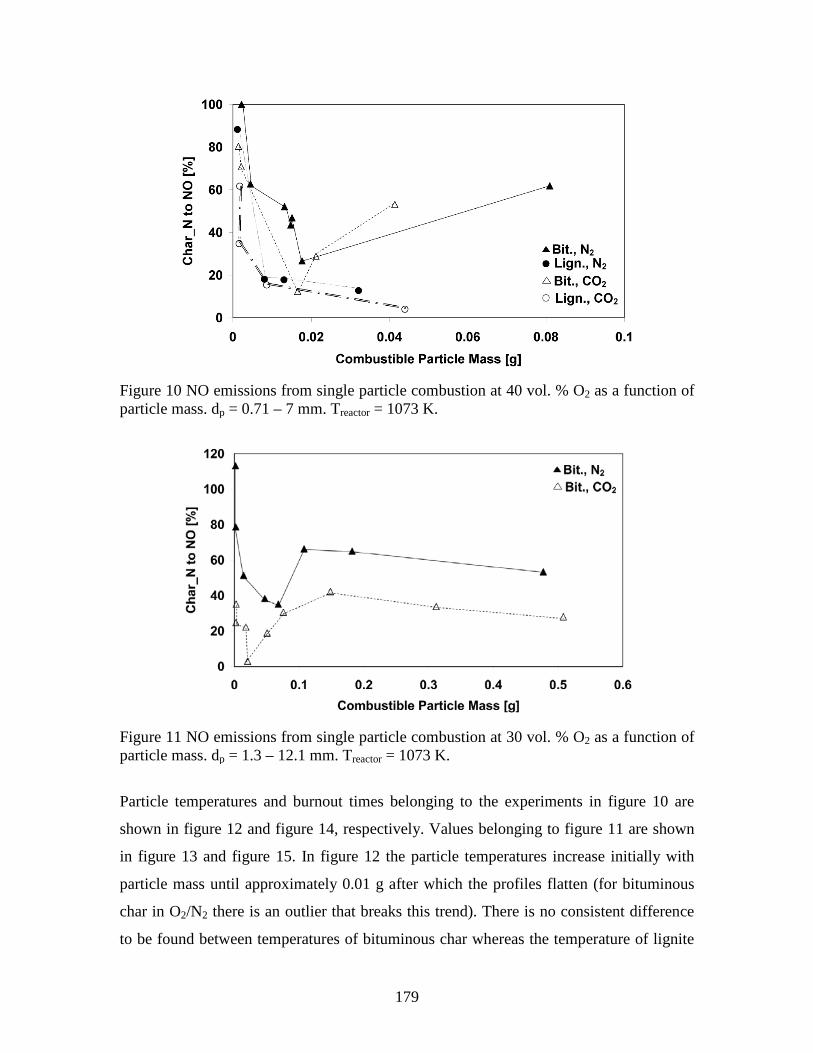
179
Figure 10 NO emissions from single particle combustion at 40 vol. % O2 as a function of particle mass. dp = 0.71 – 7 mm. Treactor = 1073 K.
Figure 11 NO emissions from single particle combustion at 30 vol. % O2 as a function of particle mass. dp = 1.3 – 12.1 mm. Treactor = 1073 K.
Particle temperatures and burnout times belonging to the experiments in figure 10 are
shown in figure 12 and figure 14, respectively. Values belonging to figure 11 are shown
in figure 13 and figure 15. In figure 12 the particle temperatures increase initially with
particle mass until approximately 0.01 g after which the profiles flatten (for bituminous
char in O2/N2 there is an outlier that breaks this trend). There is no consistent difference
to be found between temperatures of bituminous char whereas the temperature of lignite
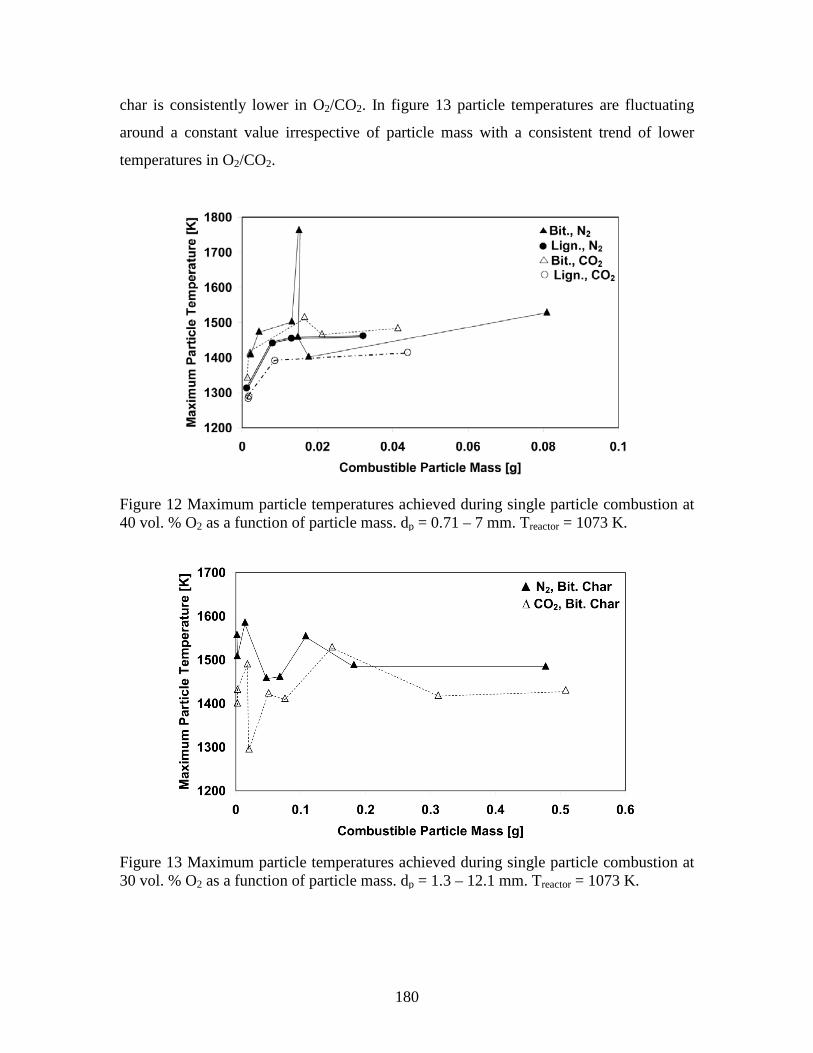
180
char is consistently lower in O2/CO2. In figure 13 particle temperatures are fluctuating
around a constant value irrespective of particle mass with a consistent trend of lower
temperatures in O2/CO2.
Figure 12 Maximum particle temperatures achieved during single particle combustion at 40 vol. % O2 as a function of particle mass. dp = 0.71 – 7 mm. Treactor = 1073 K.
Figure 13 Maximum particle temperatures achieved during single particle combustion at 30 vol. % O2 as a function of particle mass. dp = 1.3 – 12.1 mm. Treactor = 1073 K.
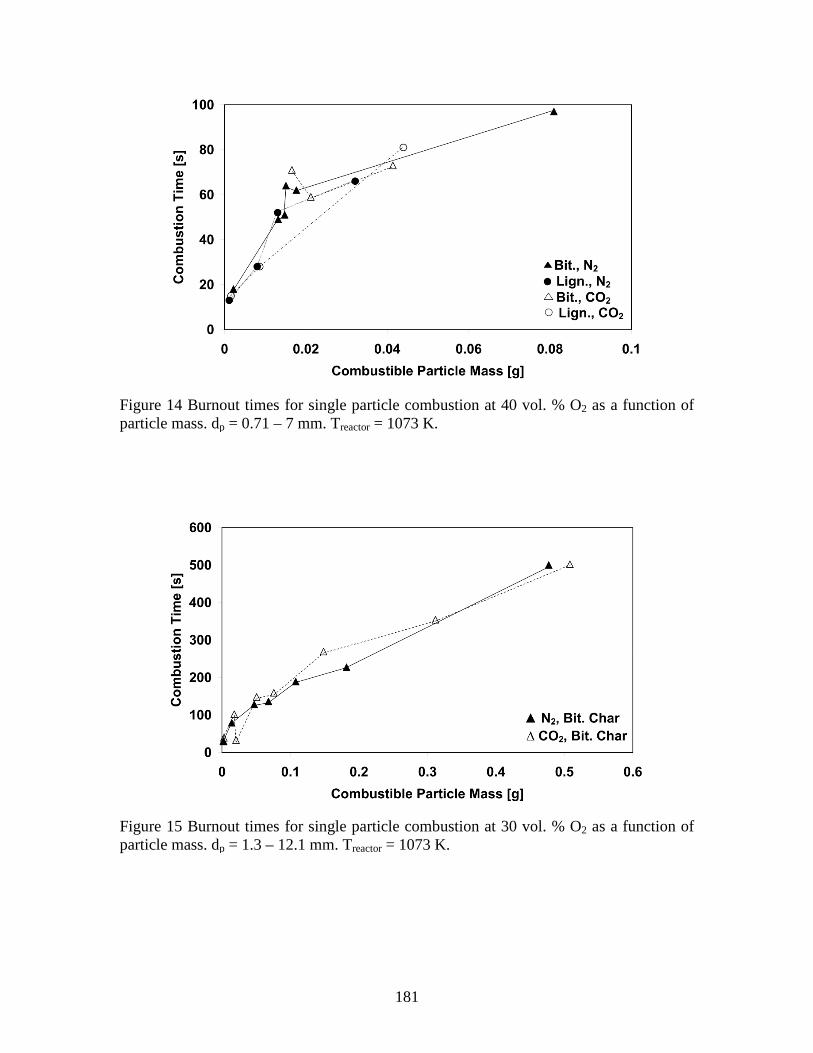
181
Figure 14 Burnout times for single particle combustion at 40 vol. % O2 as a function of particle mass. dp = 0.71 – 7 mm. Treactor = 1073 K.
Figure 15 Burnout times for single particle combustion at 30 vol. % O2 as a function of particle mass. dp = 1.3 – 12.1 mm. Treactor = 1073 K.
182
That the char-N conversion in figure 10 and figure 11 initially decreases with increases in
particle size is expected [5,15,43,49] and is caused by an increase in char surface area
available for NO reduction. It is however surprising that the NO emissions from
bituminous char increases after an initial decrease and that a peak seems to exist in figure
11. The reason for this is not obvious and the discussion to come is therefore an attempt
to elucidate phenomena that could contribute to this behavior.
In figure 14 and figure 15 burnout times can be seen to increase rapidly for both lignite
char and bituminous char as the particle size increase initially (most clearly in figure 14).
Camera recordings and visual inspection show that the ash layer remains around the
particles after each experiment, which could imply that combustion at lower particle
masses is taking place under either kinetic- or external mass transfer control as the
burnout time here and in the figures are roughly proportional to 1/30R [50]. Considering the
high particle temperatures in figure 12 and figure 13 and the trend of lower particle
temperatures in O2/CO2 in figure 13 it is more likely that external mass transfer affects
the combustion rate. This is not unambiguous though since it would then be expected that
the burnout times in O2/N2 were significantly lower than in O2/CO2, which is not
supported by figure 14 and figure 15. CO2 gasification could however contribute to char
consumption in O2/CO2 thereby lowering the observed burnout time. As the particle mass
increases further the steepness of the profiles in figure 14 and figure 15 reduces and is
roughly proportional to 2/30R , now indicating that the combustion regime is shifting to ash
diffusion control. The proportionality between burnout time and particle size has been
reported previously for similar sized particles [51]. It is also worth noticing that the shift
in proportionality in figure 14 and figure 15 takes place at the sample masses where the
minima’s in NO emissions are found in figure 10 and figure 11. If these sample masses
represents a shift from a combustion process being primarily dominated by external mass
transfer control to a combustion process dominated primarily by ash layer diffusion it
could significantly affect the NO emission from the particles.
When combustion is taking place under external mass transfer control for small to
medium particle sizes (cf. figure 10 and figure 11) the diffusion of NO through the ash
layer away from the core surface should not be inhibited since the diffusion coefficient of
NO is similar to that of O2 but the NO-char rate constant is an order of magnitude smaller
183
than for the O2-char reaction [15]. The O2 concentration in the ash layer will also be low
meaning that gaseous species such as HCN (cf. the discussion in section 3.2) will be
available for NO reduction and also have a higher possibility of escaping the particle
before oxidation. At higher particle sizes where combustion is limited by O2 diffusion in
the ash layer it is not unlikely that the thicker ash layer will cause resistance towards NO
diffusion as well and cause a higher concentration to develop at the core surface. This
increase in concentration will cause more of the NO to diffuse into the porous char core
and enhance the reduction here [15,43]. The higher average concentration of O2 in the ash
layer for the case with ash layer diffusion control will also cause a more efficient
oxidation of species such as HCN and hence a lower availability for NO reduction. The
transport phenomena discussed above would be expected to facilitate a generally lower
NO emission in O2/CO2 and an earlier shift in rate limiting step, especially when the O2
concentration decreases. This is in fact what is seen in figure 10 and figure 11. The peak
in emission observed in figure 11 would then by the reasoning above represent the shift
in rate limiting step. This explanation is not unambiguous, however, and has not been
quantified and the effect of the ash layer is further complicated due to an ash content that
decreases with increasing particle size (cf. section 2.2) wherefore further studies are
needed. These studies should also include experiments at higher reactor temperatures
using smaller particle sizes as the effect of internal mass transfer would be expected to
decrease with decreasing particle size.
4. Conclusion
Isothermal laboratory scale fixed bed combustion of millimeter sized lignite- and
bituminous char particles have been carried out in O2/N2 and O2/CO2 at a reactor
temperature of 1073 K using a Charged Coupled Device (CCD) camera to record particle
surface temperatures. Char-N to NO conversions has been investigated at inlet O2
concentrations between 5 and 80 vol. % for both single and multiple particle combustion.
Single particle combustion at O2 concentrations between 5 vol. % and 80 vol. % showed
a decrease in char-N to NO conversion from 80 % to 15 % for bituminous char burning in
O2/N2 and from 40 % to 15 % for bituminous char burning in O2/CO2. Lignite char
burning in O2/N2 and O2/CO2 showed a decrease in char-N to NO conversion similar to
184
that of bituminous char in O2/CO2 in the same range of O2 concentrations. For all these
experiments increases in particle temperatures between 550 K and 700 K were measured
as the O2 concentration increased.
The effect of increasing the particle concentration from 5 to 20 at a constant O2
concentration of 30 vol. % on char-N to NO conversion was minor even though the
temperature of the particles increased up to approximately 150 K.
Increasing the particle size/mass at constant O2 concentrations of 30 vol. % and 40 vol. %
decreased char-N to NO conversion initially for both lignite- and bituminous char, from
40 - 100 % at approximately 2 mg down to 2 - 20 % at approximately 20 mg. However
for bituminous char a minimum in char-N to NO conversion was observed after which
the conversion increased to a peak value of 40 – 60 % at app. 100 - 150 mg. For very
large particles (> 150 mg) the char-N to NO conversion decreased again. An effect on
char-N to NO conversion, when replacing N2 with CO2, was only observed for
bituminous char that showed consistently lower emissions in O2/CO2 than in O2/N2. NO
emissions from lignite char combustion was generally lower than for bituminous char
combustion.
The results of this study are difficult to explain using only transport phenomena, such as
differences in O2 diffusion rate between N2 and CO2 and changes in combustion regime,
and they suggest that further research into the quantification of ash and char catalyzed
NO reduction should be included with an analysis of the gaseous N-species that could be
present in and around the char. Especially the presence of HCN, either as a primary
oxidation product or a product of secondary pyrolysis, is important to elucidate, as its
influence on NO chemistry is changed significantly when CO2 replaces N2.
The use of the CCD camera has proven a reliable tool to measure in situ particle
temperatures and its ability to display the combustion process as film will be a valuable
tool in future modeling efforts.

185
Acknowledgement
The research leading to these results has received funding from the Danish Agency for
Science, Technology and Innovation, Energinet.dk under PSO-10069 “Advanced
Diagnostics of Oxy-Fuel Combustion Processes”, Vattenfall Research and Development
AB and ALSTOM Power Systems Gmbh. The support and funding from these entities
are greatly valued.
186
References
[1] Buhre BJP, Elliot LK, Sheng CD, Gupta RP, Wall TF. Oxy-fuel combustion
technology for coal-fired power generation. Prog Energy Combust Sci. 2005;31:283-7
[2] Toftegaard MB, Brix J, Jensen PA, Glarborg P, Jensen AD. Oxy-fuel combustion of
solid fuels. Prog Energy Combust Sci 2010;36:581-625
[3] Hu Y, Naito S, Kobayashi N, Hasatani, M. CO2, NOx and SO2 emissions from the
combustion of coal with high oxygen concentration gases. Fuel 2000;79:1925-2
[4] Liu H, Zailani R, Gibbs BM. Comparisons of pulverized coal combustion in air and in
mixtures of O2/CO2. Fuel 2005;84:833-0
[5] Ninomiya Y, Yokoi K, Arai N, Hasatani M. Characteristics of emission of char NO
during the combustion of a single particle of coal char. Int Chem Eng 1989;29:512-6
[6] Glarborg P, Jensen AD, Johnson JE. Fuel nitrogen conversion in solid fuel fired
systems. Prog Energy Combust Sci 2003;29:89-3
[7] Thomas KM. The release of nitrogen oxides during char combustion. Fuel
1997;76:457-3
[8] Miller JA, Bowman CT. Mechanism and modeling of nitrogen chemistry in
combustion. Prog Energy Combust Sci 1989;15:287-8
[9] Molina A, Murphy JJ, Winter F, Haynes BS, Blevins LG, Shaddix CR. Pathways for
conversion of char nitrogen to nitric oxide during pulverized coal combustion. Combust
Flame 2009;156:574-7
187
[10] Aarna I, Suuberg EM. A review of the kinetics of the nitric oxide-carbon reaction.
Fuel 1997;76:475-1
[11] Chambrion P, Kyotani T, Tomita A. C-NO reaction in the presence of O2. 27’th
Symposium (International) on Combustion 1998:3053-9
[12] Chambrion P, Kyotani T, Tomita A. Role of N-containing surface species on NO
reduction by carbon. Energy Fuels 1998;12:416-1
[13] Chambrion P, Suzuki T, Zhang Z-G, Kyotani T, Tomita A. XPS of nitrogen-
containing functional groups formed during the C-NO reaction. Energy Fuels
1997;11:681-5
[14] Chambrion P, Orikasa H, Suzuki T, Kyotani T, Tomita A. A study of the C-NO
reaction by using isotopically labelled C and NO. Fuel 1997;76:493-8
[15] Gupta H, Fan L-S. Reduction of nitric oxide from combustion flue gas by
bituminous coal char in the presence of oxygen. Ind Eng Chem Res 2003;42:2536-3
[16] Guo F, Hecker WC. Kinetics of NO reduction by char: Effects of coal rank. 27’th
Symposium (International) on Combustion 1998:3085-3092
[17] Orikasa H, Tomita A. NO and N2 formation behavior during the high-temperature
O2 gasification of coal char. Energy Fuels 2003;17:405-1
[18] Zhao Z, Li W, Qiu J, Wang X, Li B. Influence of Na and Ca on the emission of NOx
during coal combustion. Fuel 2006;85:601-606
[19] Zhao Z, Qiu J, Li W, Chen H, Li B. Influence of mineral matter in coal on
decomposition of NO over coal chars and emission of NO during char combustion. Fuel
2003;82:949-7
188
[20] Bueno-López A, Soriano-Mora JM, García-García A. Study of the temperature
window for selective reduction of NOx in O2-rich gas mixtures by metal-loaded carbon.
Catal Commun 2006;7:678-684
[21] Wu SL, Iisa K. Kinetics of NO reduction by black liquor char. Energy Fuels
1998;12:457-463
[22] Aarna I, Suuberg EM. The role of carbon monoxide in the NO-carbon reaction.
Energy Fuels 1999;13:1145-1153
[23] Mendiara T, Glarborg P. Ammonia chemistry in oxy-fuel combustion of methane.
Combust Flame 2009;156:1937-9
[24] Normann F, Andersson K, Leckner B, Johnsson F. Emission control of nitrogen
oxides in the oxy-fuel process. Prog Energy Combust Sci 2009;35:385-7
[25] Giménez-López J, Millera A, Bilbao R, Alzueta MU. HCN oxidation in an O2/CO2
atmosphere: An experimental and kinetic modeling study. Combust Flame 2010;157:267-
6
[26] Normann F, Andersson K, Leckner B, Johnsson F. High-temperature reduction of
nitrogen oxides in oxy-fuel combustion. Fuel 2008;87:3579-5
[27] Park J, Park JS, Kim HP, Kim JS, Kim SC, Choi JG, Cho HC, Cho KW, Park HS.
NO emission behavior in oxy-fuel combustion recirculated with carbon dioxide. Energy
Fuels 2007;21:121-129
[28] Mendiara T, Glarborg P. Reburn chemistry in oxy-fuel combustion of methane.
Energy Fuels 2009;23:3365-2
189
[29] Molina A, Eddings EG, Pershing DW, Sarofim AF. Char nitrogen conversion:
implications to emissions from coal-fired utility boilers. Prog Energy Combust Sci
2000;26:507-1
[30] Wang W, Brown SD, Hindmarsh CJ, Thomas KM. NOx release and reactivity of
chars from a wide range of coals during combustion. Fuel 1994;73:1381-1388
[31] Yu J, Lucas JA, Wall TF. Formation of the structure of chars during devolatilization
of pulverized coal and its thermoproperties: A review. Prog Energy Combust Sci
2007;33:135-0
[32] Arenillas A, Rubiera F, Parra JB, Pis JJ. Influence of char structure on reactivity and
nitric oxide emissions. Fuel Process Technol 2002;77-78:103-9
[33] Wang Z, Zhou J, Wen Z, Liu J, Cen K. Effect of mineral matter on NO reduction in
coal reburning process. Energy Fuels 2007;21:2038-3
[34] López D, Calo J. The NO-carbon reaction: The influence of potassium and CO on
reactivity and populations of oxygen surface complexes. Energy Fuels 2007;21:1872-7
[35] Johnsson JE. Formation and reduction of nitrogen oxides in fluidized-bed
combustion. Fuel 1994;73:1398-5
[36] Levy JM, Chan LK, Sarofim AF, Beér JM. NO/char reactions at pulverized coal
flame conditions. 18’th Symposium (International) on Combustion:111 – 0
[37] Chan LK, Sarofim AF, Beér JM. Kinetics of the NO-carbon reaction at fluidized bed
combustor conditions. Combust Flame 1983;52:37-5
190
[38] Fan W, Lin Z, Li, Y, Kuang J. Experimental study of the effects of CO2 on the
noncatalytic reduction reaction of NO by carbonaceous materials. Energy Fuels
2009;23:2429-6
[39] Park D-C, Day SJ, Nelson PF. Nitrogen release during reaction of coal char with O2,
CO2 and H2O. Proc. Combust. Inst. 2005;30:2169-5
[40] Orikasa H, Tomita A. A study of the HCN formation mechanism during the coal
char gasification by O2. Energy Fuels 2003;17:1536-0
[41] Winter F, Wartha C, Löffler G, Hofbauer H. The NO and N2O formation mechanism
during devolatilization and char combustion under fluidized-bed conditions. 26’th
Symposium (International) on Combustion 1996:3325-4
[42] Liu Y, Che D. Releases of NO and its precursors from coal combustion in a fixed
bed. Fuel Process Technol 2006;87:355-2
[43] Visona SP, Stanmore BR. Modeling NOx release from a single coal particle II.
Formation of NO from char-nitrogen. Combust Flame 1996;106:207-8
[44] Goel S, Zhang B, Sarofim AF. NO and N2O formation during char combustion: Is it
HCN or surface attached nitrogen. Combust Flame 1996;104:213-7
[45] Molina A, Eddings EG, Pershing DW, Sarofim AF. Nitric oxide destruction during
coal and char oxidation under pulverized-coal combustion conditions. Combust Flame
2004;136:303-2
[46] Hu YQ, Kobayashi N, Hasatani M. Effects of coal properties on recycled-NOx
reduction in coal combustion with O2/recycled flue gas. Energy Convers. Manage.
2003;44:2331-0

191
[47] Molina A, Shaddix CR. Ignition and devolatilization of pulverized bituminous coal
particles during oxygen/carbon dioxide coal combustion. Proc. Combust. Inst.
2007;31:1905-2
[48] Brix J, Jensen PA, Jensen AD. Coal devolatilization and char conversion under
suspension fired conditions in O2/N2 and O2/CO2 atmospheres. Fuel 2010;89:3373-0
[49] Hayhurst AN, Lawrence AD. The amounts of NOx and N2O formed in a fluidized
bed combustor during the burning of coal volatiles and also of char. Combust Flame
1996;105:341-7
[50] Levenspiel O. Chemical Reaction Engineering. 3rd ed. John Wiley & Sons, Inc;1999
[51] Blackham AU, Smoot LD, Yousefi P. Rates of oxidation of millimetre-sized char
particles: simple experiments. Fuel 1994;73:602-2
192
6 Conclusions
This work is divided into four parts each treated consecutive in the articles enclosed in
the thesis. The first article describes and presents experimental work carried out on
suspension fired coal combustion in O2/N2 and O2/CO2 atmospheres. Experiments in this
part of the work have been carried out in an isothermal Entrained Flow Reactor (EFR) to
determine coal conversion during devolatilization and char combustion. The second
article deals with determination of intrinsic reaction kinetics of combustion and CO2
gasification of char collected in the EFR. This part of the work is carried out in a non-
isothermal ThermoGravimetric Analyzer (TGA). Using the kinetic expressions obtained
in the second part, the data from the first part is modelled using a detailed char
conversion model in the third article. The fourth article investigates NO emission and
particle temperatures from char combustion in O2/N2 and O2/CO2 atmospheres in a
laboratory scale Fixed Bed Reactor (FBR). In the following the findings in each article
will be outlined along with their implications on the future of Oxy-Fuel Combustion
(OFC). The results will first be summarized on an article basis and their implications then
discussed at the end of the section.
Article I presents devolatilization and combustion experiments carried out in N2 or CO2
based atmospheres with bituminous El Cerrejón coal in an isothermal electrically heated
EFR at temperatures between 1173 K – 1673 K and inlet O2 concentrations between 5 –
28 vol. %. Char was sampled from just after complete devolatilization and to complete
burnout, covering residence times up to 1 s. Devolatilization experiments did not show a
noticeable change in volatile yield when N2 was replaced with CO2 under otherwise
similar conditions. Scanning Electron Microscopy (SEM) on, and Brunauer-Emmett-
Teller (BET) surface measurements of, sampled char from devolatilization experiments
in N2 and CO2 did not show differences between the two atmospheres either. These
findings suggest that the presence of high concentrations of CO2 does not influence char
properties of the investigated coal under suspension fired conditions. The char conversion
profiles, obtained from sampling during combustion, did not show differences between
N2 and CO2 based atmospheres at temperatures between 1173 K and 1373 K across the
range of investigated O2 concentrations. At the reactor temperatures 1573 K and 1673 K
and an inlet O2 concentration of 5 vol. % the experimental char conversion profiles show
193
a faster char conversion in O2/N2 than in O2/CO2. This is believed to be due to the lower
diffusion coefficient of O2 in CO2 (~ 22 %) at these conditions. At the high reactor
temperatures and low concentration of O2 char conversion takes place under significant
influence of external mass transfer control, which means that the faster O2 diffusion in N2
will enable a faster conversion rate than during combustion in CO2. None of the
experimental conversion profiles have suggested an effect of CO2 gasification on char
conversion.
Article II presents TGA reactivity profiles of EFR-char formed in both O2/N2 and O2/CO2
atmospheres. In the experiments a heating rate of 5 K/min was used to reach peak
temperatures of 1273 K and 1373 K. The O2 and CO2 concentrations were 5 vol. % and
80 vol. % in the conducted combustion and gasification experiments, respectively. From
the TGA experiments it was found that CO2 gasification did not affect char conversion in
the temperature window where the char was consumed by O2 in the TGA. Reactivity
measurements on char sampled during EFR devolatilization in O2/N2 and O2/CO2 at 1573
K and 1673 K and on partly converted EFR-char sampled at 1173 K and 1673 K at inlet
O2 concentrations of 28 vol. % and 5 vol. %, respectively, did not show any differences.
These findings are in line with, and support, the conclusions on the work of the first
article, namely that the presence of high concentrations of CO2 does not change char
conversion rate for the examined coal. The reactivity curves of char formed and partly
consumed in the EFR at 1173 K with an inlet O2 concentration of 28 vol. % in N2 or CO2
showed that two char phases of distinctively different reactivity are present. The phases
showed up as two peaks in the reactivity profiles and will be discussed further in the
context of article III. From reactivity measurements on EFR-char devolatilized at 1173 K
– 1673 K intrinsic kinetic parameters were found for combustion in O2. The kinetic
expression includes both an activation term, as is common for Arrhenius kinetics, and a
deactivation term to account for the thermal effect of devolatilization temperature on
resulting char reactivity. Intrinsic kinetics for CO2 gasification has also been found,
though using only EFR-char devolatilized at 1273 K, 1473 K and 1573 K due to a lack of
samples. It was found that the devolatilization temperature in the EFR did not affect the
char reactivity towards CO2 gasification wherefore only an Arrhenius activation term is
present in the rate constant for this reaction.
194
Article III first presents a detailed COal COmbustion MOdel (COCOMO) encompassing
the three char morphologies; cenospheres, network- and dense chars, each distributed
between six discrete particle sizes. Input to model simulations are taken from relevant
literature studies and found from measurements of Particle Size Distribution (PSD) and
BET analysis. The intrinsic kinetic expressions for combustion and gasification, found in
article II, are used to describe char conversion rate. All physical parameters relating to
mass and energy balances are calculated as temperature dependent properties of either the
particles or surrounding gas mixture.
When COCOMO was used to model the char conversion profiles from article I, a
reasonable consistency was in general found between simulations and experiments. At a
reactor temperature of 1173 K and inlet O2 concentrations of 5 vol. % and 28 vol. % the
model was found to over predict char conversion. At a reactor temperature of 1273 K and
an inlet O2 concentration of 5 vol. % the model also over predicted char conversion. The
reason for the over predictions at the low O2 concentrations at these temperatures is found
in an experimental delay in heterogeneous ignition after completed devolatilization. This
delay is not captured by COCOMO, which cause absolute deviations between calculated
and experimental degrees of char conversion. The conversion rate is however predicted
accurately by the model. At a reactor temperature of 1173 K and an inlet O2
concentration of 28 vol. % TGA experiments in article II revealed the existence of two
char phases of distinctively different reactivity. SEM images of char sampled at these
conditions showed unreacted fractions of char even at very high overall degrees of
conversion. The formation of the un-reactive fraction of the char is believed to be caused
by a fierce second devolatilization brought upon by a rapid heat release after particle
ignition at the high O2 concentration. Simulations indicate that excess particle
temperatures of 500 – 600 K are reached at heating rates as high as 20000 K/s shortly
after heterogeneous ignition. As has previously been suggested in the literature, it is
possible that the deactivation takes place due to interactions between products of
secondary devolatilization and mineral matter; though the mineral matter itself may also
promote deactivation at these conditions. Because COCOMO assumes a homogeneous
char deactivation, only depending on char particle temperature, the phenomena above is
not captured and hence the degree of char conversion is over estimated by the model.
195
Application of the intrinsic kinetic parameters from article II to predict char conversion at
suspension fired conditions has proven to work satisfactorily in the case of combustion.
At the highest reactor temperatures the effect of CO2 gasification on char conversion was
however slightly over predicted. Despite this slight over prediction simulations with
COCOMO does show that a potential contribution from gasification on char conversion
can take place in the case of high reactor temperatures and low concentrations of O2
where combustion is limited by external mass transfer resistance.
In article IV data on NO emission and particle temperature are presented for isothermal
combustion of millimeter sized bituminous and lignite char particles in O2/N2 and O2/CO2
atmospheres in a FBR. O2 concentrations were between 5 and 80 vol. % and the reactor
temperature was kept constant at 1073 K. Particle temperatures were measured and
recorded using a Charged Coupled Device (CCD) camera, operated by software
developed specifically for the setup. Within the range of O2 concentrations used during
the experiments, the char-N to NO conversion was found for both single- and multiple
particle combustion. Single particle combustion, covering the entire range of O2
concentrations, showed a decrease in the char-N to NO conversion from 80 – 15 % and
40 – 15 % for bituminous char burning in O2/N2 and O2/CO2, respectively, when the O2
concentration increased across the interval. Char-N to NO conversion for lignite char in
both O2/N2 and O2/CO2 showed a behavior nearly identical to that of bituminous char
burning in O2/CO2. Particle temperature measurements, recorded during these
experiments, showed an increasing particle excess temperature as the O2 concentration
increased with peak particle excess temperatures reaching 550 – 700 K at 80 vol. % O2.
The effect on char-N to NO conversion of increasing the particle concentration from 5 to
20 particles at 30 vol. % O2 in N2 and CO2 was only minor for O2/CO2. A drop of app. 15
% was seen in O2/N2 as the particle concentration increased. During the experiments peak
particle excess temperatures up to 150 K in O2/N2 were recorded as the particle
concentration increased. When it was the particle size/mass of single particles that was
increased at constant O2 concentrations of 30 vol. % and 40 vol. % in N2 or CO2 the
effect on char-N to NO conversion was however marked. Initially the char-N to NO
conversion decreased in both O2/N2 and O2/CO2 as the particle mass increased from app.
2 – 20 mg. The decrease in char-N to NO conversion was significant from 40 – 100 %
196
down to 2 – 20 % in the interval of applied particle masses. After this point the char-N to
NO conversion for the bituminous coal began to increase as the particle mass was
increased form app. 20 mg to app. 100 – 150 mg, where it had a second peak at values
between 40 – 60 %. After this point the char-N to NO conversion decreased again with
further increases in particle size/mass.
In all of the experiments carried out in this article it has been a general observation that
the change of atmosphere, from N2 based to CO2 based, facilitates a significant drop in
char-N to NO conversion for the bituminous coal char. In the case of lignite char
combustion the gaseous atmosphere was however not found to influence the char-N to
NO conversion, which was in general lower than that of bituminous char. This could be
due to a lower influence of CO on NO reduction over the more reactive lignite char.
When the results of this study are sought explained transport phenomena such as
differences in O2 diffusion rate and combustion regimes can not stand alone. The
behavior observed during the experiments suggests that ash and char catalysis along with
the influence of primary products such as HCN and NH3 should be subjects of further
investigation. No further attempts to quantify the influence of these parameters have been
made in this article.
During the experiments the use of the CCD camera has proven a valuable and reliable
tool for in situ measurements of particle temperature.
The four articles, the results of which are described above, allows for the following
general conclusions.
From the experimental char conversion profiles in article I and from the
reactivity profiles in article II there is not found any influence of CO2
gasification during devolatilization and char conversion in the range of reactor
temperatures and O2 concentrations used in the EFR and TGA. The only effect
of the change in gaseous atmosphere seems to be a lower char conversion rate
in O2/CO2 during combustion under external mass transfer control due to a
lower diffusion coefficient of O2 in CO2.
From the TGA experiments in article II it has been shown that the intrinsic
kinetics of combustion is not affected by the presence of high concentrations of
197
CO2 for the bituminous coal used here. When heterogeneous ignition is fierce,
under high concentrations of O2, the char may deactivate significantly thereby
forming phases of different reactivity.
Using the char conversion model COCOMO good predictions of char burnout
was obtained using kinetic parameters for combustion and gasification obtained
from TGA experiments on EFR-char in article II. At high reactor temperatures
gasification kinetics did however cause a slight over prediction of gasification
rate.
In article IV it was found that the effect of gaseous atmosphere on NO emission
is marked for bituminous coal char with significantly lower emissions in
O2/CO2 than in O2/N2. For lignite coal char there does not seem to be an effect
of gaseous atmosphere on the NO emission.
The general conclusions on the content of this thesis give rise to the following reflections
on the future of OFC with respect to fuel conversion and NO emission.
Concerns on fuel conversion in retrofitted and Greenfield OFC-plants, fuelled
with bituminous coal of reactivity similar to El Cerrejón coal, should not be
directed to reaction kinetics or devolatilization behavior but rather to the
temperature profiles of particles and gas in the boiler as it will be these
temperatures that determine the value of the rate constant for char combustion.
The contribution from gasification to char conversion and CO levels should not
be a major focus, when operation is conducted using bituminous coal of
reactivity similar to El Cerrejón coal.
Reasonably accurate model predictions of char conversion are achievable for
boiler design purposes using established kinetic expressions and physical gas
phase data already available.
If a Greenfield plant is operated at O2 concentrations that are too high there is a
risk of poor burnout efficiency due to significant thermal deactivation of the
char. However, as the EFR experiments of article I were conducted at very high
stoichiometric ratios of O2 (~ 15) the inlet O2 concentration of 28 vol. %, where
198
the present deactivation was observed, is not directly transferable to a practical
boiler where volatile combustion will lower the inlet O2 concentration
significantly at the much lower stoichiometric ratios used here.
The possibility to influence OFC plant economy positively through reductions
in NO emission is most promising for bituminous coal rather than lignite coal.
7 Future Work
This work has dealt extensively with the nature of coal conversion in O2/CO2
environments compared to O2/N2 environments. The work has been carried out using
bituminous El Cerrejón coal and conclusions on intrinsic kinetics, devolatilization
behavior and char morphology are therefore based entirely on the chemical and physical
properties of this coal. For an easy applicable evaluation of a coals combustion behavior
under industrial OFC conditions it is recommended that further experiments are
conducted using relevant coals of other properties, such as lignite- and subbituminous
coal. For this to be fruitful for industrial applications the behavior of the coals with
respect to intrinsic kinetics (for both combustion and gasification), devolatilization and
char morphology must be related to easy measurable properties such as proximate- and
ultimate analysis and/or TGA reactivity measurements under standardized conditions.
With respect to the influence of gasification this thesis only treats gasification by CO2 as
this is the most abundant reactive gaseous species in an OFC boiler. That gasification by
H2O is neglected in this work entails, however, that the results and conclusions of the
work applies to an OFC plant operating with dry recycle of flue gas. In the case of a plant
operating with wet recycle the water content in the boiler may be as high as 30 vol. %
and it will therefore not be possible to ignore a possible contribution from H2O
gasification to fuel conversion. It is therefore recommended that future investigations
include H2O in the reactive gas mixture.
The emission of NO has only been dealt with experimentally in this work and under
conditions different from those of suspension fired boilers. Even though the results on
NO emission, presented in the thesis, allow for a general discussion several future
contributions could help utilize the promise of lower NO emissions in OFC. As a direct
199
continuation of this work further FBR experiments should be carried out under well
defined, easily controllable conditions in order to quantify the effect of increased CO
levels and catalysis on NO reduction. These parameters must be encompassed in a model
used to isolate the effects of transport phenomena, ash and char catalysis and CO
enhancement in NO emission from char combustion. The possible presence of HCN and
NH3 as primary reaction products complicates the investigation as these species are
difficult to measure in experiments. Attempts could be made using advanced IR
diagnostics but the design of such experiments lies outside the expertise of this author. If
a successful model could be developed for well defined conditions, experiments carried
out at suspension fired conditions are a necessary next step. The use of a validated model
to treat the data obtained in these experiments will be essential for practical conclusions
that can be used by plant entrepreneurs.


![Combustion of Single Biomass Particles in Air and in Oxy ...digital.csic.es/.../1/Combustion_of_single_Riaza.pdf · investigation [8] revealed that biomass/coal blend combustion may](https://img.pdfslide.us/doc/110x75/5fbc93e8cbce85303d538edb/combustion-of-single-biomass-particles-in-air-and-in-oxy-investigation-8-revealed.jpg)