Embed Size (px)
Citation preview
Chapter F
Coal Availability, Recoverability, and Economic Evaluations of Coal Resources in the Colorado Plateau:Colorado, New Mexico, and Utah
By Timothy J. Rohrbacher,1 Carol L. Molnia,1 Lee M. Osmonson,1 M. Devereux Carter,2 Wynn Eakins,3 Gretchen K. Hoffman,4 David E. Tabet,5 Janet E. Schultz,3 David C. Scott,6 Dale D. Teeters,6 Glen E. Jones,4 Jeffrey C. Quick,5 Brigitte P. Hucka,5 and John A. Hanson5
U.S. Geological Survey Professional Paper 1625–B*
U.S. Department of the InteriorU.S. Geological Survey
Chapter F ofGeologic Assessment of Coal in the Colorado Plateau:Arizona, Colorado, New Mexico, and UtahEdited by M.A. Kirschbaum, L.N.R. Roberts, and L.R.H. Biewick
1 U.S. Geological Survey, Denver, Colorado 802252 U.S. Geological Survey, Reston, Virginia 201923 Colorado Geological Survey, Denver, Colorado 802034 New Mexico Bureau of Mines and Mineral Resources,
Socorro, New Mexico 878015 Utah Geological Survey, Salt Lake City, Utah 841146 DST and Associates, Lakewood, Colorado 80228* This report, although in the USGS Professional Paper series,
is available only on CD-ROM and is not available separately
National CoalResourceAssessment
Click here to return to Disc 1 Volume Table of Contents
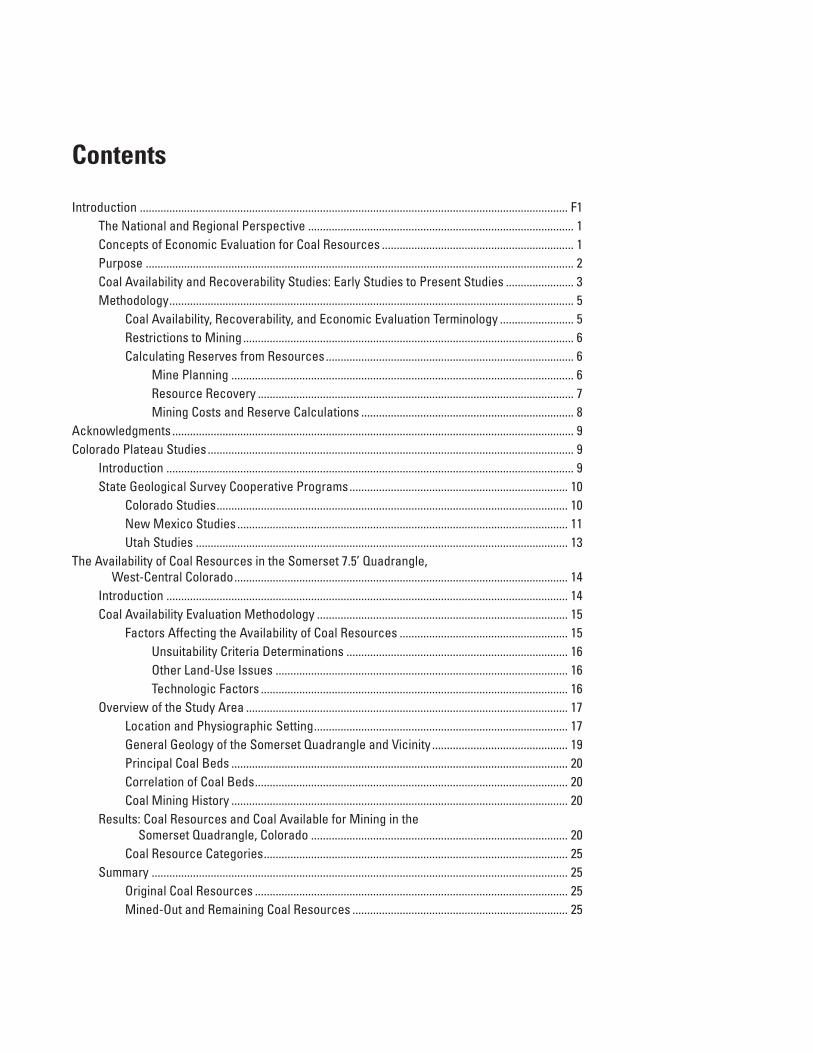
Contents
Introduction ................................................................................................................................................. F1The National and Regional Perspective .......................................................................................... 1Concepts of Economic Evaluation for Coal Resources ................................................................. 1Purpose ................................................................................................................................................. 2Coal Availability and Recoverability Studies: Early Studies to Present Studies ....................... 3Methodology......................................................................................................................................... 5
Coal Availability, Recoverability, and Economic Evaluation Terminology ......................... 5Restrictions to Mining................................................................................................................ 6Calculating Reserves from Resources.................................................................................... 6
Mine Planning .................................................................................................................... 6Resource Recovery ........................................................................................................... 7Mining Costs and Reserve Calculations ........................................................................ 8
Acknowledgments ........................................................................................................................................ 9Colorado Plateau Studies ............................................................................................................................ 9
Introduction .......................................................................................................................................... 9State Geological Survey Cooperative Programs.......................................................................... 10
Colorado Studies....................................................................................................................... 10New Mexico Studies ................................................................................................................ 11Utah Studies .............................................................................................................................. 13
The Availability of Coal Resources in the Somerset 7.5’ Quadrangle, West-Central Colorado................................................................................................................. 14
Introduction ........................................................................................................................................ 14Coal Availability Evaluation Methodology ..................................................................................... 15
Factors Affecting the Availability of Coal Resources ......................................................... 15Unsuitability Criteria Determinations ........................................................................... 16Other Land-Use Issues ................................................................................................... 16Technologic Factors ........................................................................................................ 16
Overview of the Study Area ............................................................................................................. 17Location and Physiographic Setting...................................................................................... 17General Geology of the Somerset Quadrangle and Vicinity .............................................. 19Principal Coal Beds .................................................................................................................. 20Correlation of Coal Beds.......................................................................................................... 20Coal Mining History .................................................................................................................. 20
Results: Coal Resources and Coal Available for Mining in the Somerset Quadrangle, Colorado ....................................................................................... 20
Coal Resource Categories....................................................................................................... 25Summary ............................................................................................................................................. 25
Original Coal Resources .......................................................................................................... 25Mined-Out and Remaining Coal Resources ......................................................................... 25
Restrictions and Available Coal Resources ......................................................................... 25Availability of Coal Resources in the Fruitland Formation, San Juan Basin,
Bisti Study Area, Northwest New Mexico................................................................................ 29Introduction ........................................................................................................................................ 29Geologic Setting................................................................................................................................. 29
Coal Geology.............................................................................................................................. 29Coal Quality ................................................................................................................................ 30Available Data ........................................................................................................................... 34
Coal Availability Studies in New Mexico ....................................................................................... 35Detailed Methodology.............................................................................................................. 35Review of Restrictions ............................................................................................................. 36
Technological Restrictions............................................................................................. 37Land-Use Restrictions..................................................................................................... 38Previous Mining ............................................................................................................... 40
Bisti Study Area Resources ............................................................................................................. 41Restrictions with Potential for Mitigation............................................................................. 41Other Coal-Resource Studies ................................................................................................. 42
Summary ............................................................................................................................................. 42Coal Availability in the Northern Wasatch Plateau Coal Field, Utah.................................................. 43
Abstract ............................................................................................................................................... 43Introduction ........................................................................................................................................ 43
Location and Mining History ................................................................................................... 43Geology....................................................................................................................................... 43
Methodology....................................................................................................................................... 43Past Mining ................................................................................................................................ 46Technical Restrictions.............................................................................................................. 46Land-Use Restrictions.............................................................................................................. 47
Resource Categories......................................................................................................................... 49Reliability .................................................................................................................................... 49Thickness ................................................................................................................................... 49Overburden ................................................................................................................................ 50
Results ................................................................................................................................................. 50Available Coal Resources........................................................................................................ 50Recovery Factors ...................................................................................................................... 52Future Production ..................................................................................................................... 52
Summary ............................................................................................................................................. 55Resource Recovery, Economic Evaluation of Minable Coal Resources
and Project Summary ................................................................................................................... 55Introduction ........................................................................................................................................ 55
Past Mining Methods............................................................................................................... 55Present Mining Methods—Somerset and Northern Wasatch Plateau Coal Fields...... 55Present Mining Methods—Bisti Study Area ....................................................................... 56
Resource Evaluations ....................................................................................................................... 57The Somerset Quadrangle Study Area ................................................................................. 57The Bisti Coal Field Study Area .............................................................................................. 58The Northern Wasatch Plateau Study Area......................................................................... 59
Conclusion .......................................................................................................................................... 59Selected References.................................................................................................................................. 60
Figures
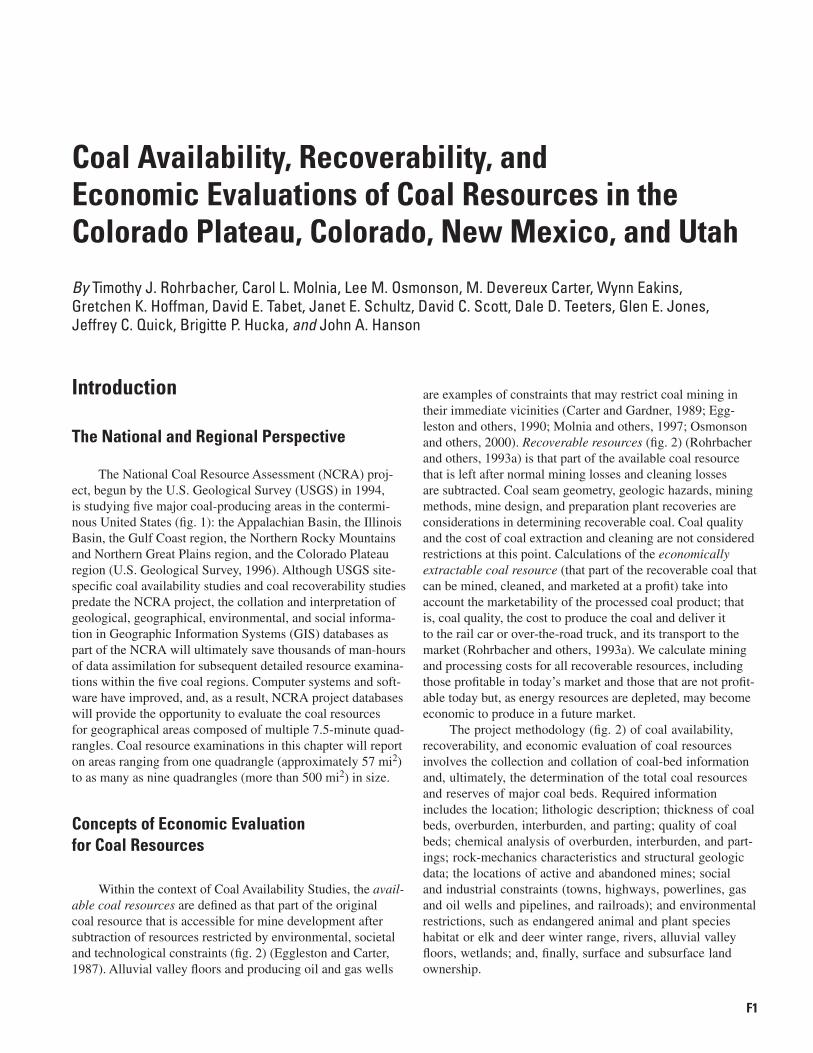
1. The Rocky Mountains and Colorado Plateau region and its relationship to other coal regions in the National Coal Resource Assessment Project ...................... F2
2. Process steps and factors considered for the calculation of available coal and economically recoverable coal resources....................................................................... 3
3. Diagram depicting the growth in size of coal availability and recoverability resource evaluation study areas, 1986 to present ........................................ 4
4. Coal availability and recoverability study areas in the Colorado Plateau: Arizona, Colorado, New Mexico, and Utah ............................................................................ 10
5. Coal mine locations in the Colorado Plateau......................................................................... 11 6. The Somerset coal field area location map showing active mines, and inset map
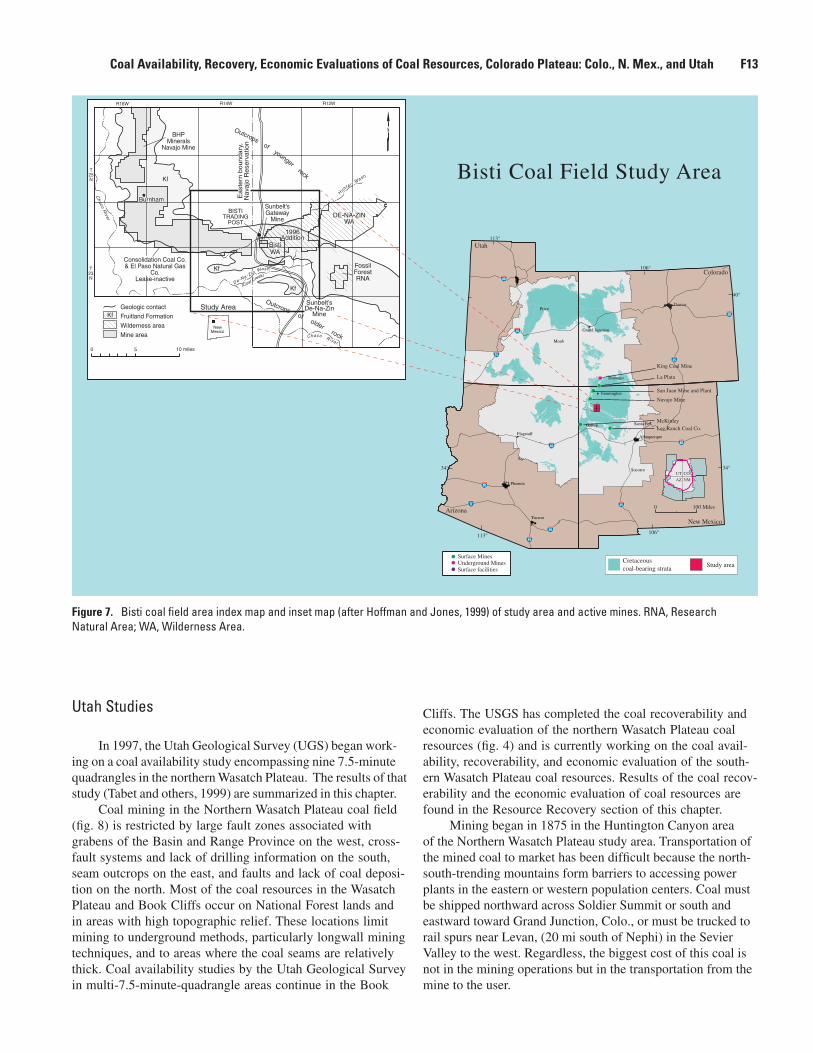
showing the Somerset quadrangle study area within the Uinta coal region................... 12 7. Bisti coal field area location map and inset map of study area and active mines.......... 13 8. The Northern Wasatch Plateau coal field area location map with local mines
and accompanying relief map delineating the nine-7.5-minute-quadrangle study area and its relation to the Wasatch Plateau and Book Cliffs coal fields, central Utah ............................................................................................................ 14
9. Simplified topographic map of the Somerset quadrangle with land ownership and mine locations ..................................................................................................................... 18
10. Generalized composite stratigraphic section showing coal beds and adjacent strata of the Somerset quadrangle, Colorado....................................................... 19
11. Data points and cross-section locations in the Somerset study area, Colorado ............ 21 12. Coal correlation cross section A-A’, drawn generally E.-W., parallel to the
North Fork of the Gunnison River............................................................................................. 22 13. Coal correlation cross section B-B’, drawn generally N.-S., perpendicular
to the North Fork of the Gunnison River ................................................................................. 23 14. Pie charts showing total original coal resources and available coal resources
for the six major coal beds in the Somerset quadrangle ..................................................... 24 15. Tectonic map of the San Juan Basin, New Mexico.............................................................. 30 16. Photograph taken near Bisti Trading Post, looking to the northeast ................................. 30 17. Photograph taken south of Bisti Trading Post, looking to the north................................... 30 18. Geologic map of Bisti study area showing the location of
drill-hole data, cross-section locations, and the Upper Cretaceous and lower Tertiary surficial geology........................................................................................ 31
19. Generalized stratigraphic column of Fruitland Formation showing coal seams in the Bisti study area, San Juan Basin, New Mexico......................................................... 32
20. Isopach map of total coal in the Red coal seam in the Bisti study area, northwest New Mexico ............................................................................................................. 32
21. Isopach map of total coal in the Green coal seam in the Bisti study area, northwest New Mexico ............................................................................................................. 32
22. Histograms comparing thickness and parting characteristics for each coal seam, northwest New Mexico .............................................................................. 33
23. Cross section along structural strike in Bisti study area..................................................... 33 24. Cross section down structural dip in western part of the Bisti study area ...................... 34 25. Cross section down structural dip in eastern part of the Bisti study area ....................... 35 26. Histograms comparing weighted average analyses of ash, sulfur, and
lb sulfur per million Btu’s for the Fruitland Formation coal by seam in the study area and in the entire Bisti coal field ........................................................................... 36
27. Map showing the thickness of overburden above the Red coal seam, Bisti study area, New Mexico .................................................................................................. 37
28. Map showing the thickness of overburden above the Green coal seam, Bisti study area, New Mexico .................................................................................................. 38
29. Mined-out areas and land-use restrictions in Bisti study area.......................................... 40 30. Histograms summarizing the calculated coal resources by seam in the
Bisti study area, New Mexico .................................................................................................. 41 31. Pie diagrams illustrating coal resources excluded by likely restrictions to mining,
Bisti study area ........................................................................................................................... 42 32. Quadrangle index map of the Northern Wasatch Plateau study area with
locations of active and abandoned mine portals .................................................................. 44 33. Coal mining areas and major grabens in the northern Wasatch Plateau, Utah .............. 45 34. Annual coal production from 1980 to 1997 for mines in the northern half of
the Wasatch Plateau coal field, Utah...................................................................................... 46 35. Idealized stratigraphic section showing named coal beds in the
Blackhawk Formation, northern Wasatch Plateau, Utah .................................................... 46 36. Pie chart showing the amount of original minable coal by coal bed,
Northern Wasatch Plateau study area, Utah......................................................................... 47 37. Location of drill holes and measured sections used to calculate coal resources
in the Blackhawk Formation, northern Wasatch Plateau, Utah ......................................... 48 38. Bar graph showing the amount of coal no longer available due to
past mining (through December 1997), northern Wasatch Plateau, Utah ........................ 49 39. Pie chart showing technical restrictions that exclude 490 million short tons
of coal from the available coal resources of the Northern Wasatch Plateau study area, Utah ........................................................................................................... 49
40. Pie chart showing land-use restrictions that exclude 146 million short tons of coal from the available coal resources of the Northern Wasatch Plateau study area, Utah.......................................................................................................................... 49
41. Data reliability of original minable coal bed tonnage estimates for nine coal beds, Northern Wasatch Plateau study area, Utah......................................................................... 49
42. Bar graph comparing coal bed thickness of the nine minable coal beds in the Northern Wasatch Plateau study area, Utah.............................................................. 50
43. Bar graph comparing the burial depth of the nine minable coal beds in the Northern Wasatch Plateau study area, Utah......................................................................... 50
44. Overburden thickness maps showing depth to the top of major coal beds, Blackhawk Formation, Northern Wasatch Plateau study area, Utah................................ 51
45. Pie charts summarizing the availability of coal resources for nine coal beds, northern Wasatch Plateau, Utah ............................................................................................. 52
46. Map showing the distribution of available coal for the Acord Lakes, Axel Anderson, Cottonwood, and Blind Canyon coal beds, northern Wasatch Plateau, Utah.................. 53
47. Map showing the distribution of available coal for the Wattis, Gordon, Castlegate A, and Castlegate D coal beds, northern Wasatch Plateau, Utah ................. 54
48. Bar graph showing the distribution of original minable coal by bed thickness compared to the percent of coal in each thickness interval that has been mined, northern Wasatch Plateau, Utah ............................................................................................. 55
Tables
1 Listing of possible environmental, societal, and technological restrictions to mining ................................................................................................................. F7
2. Mining methods considered in the Colorado Plateau region and their associated mining models and recovery rates ....................................................................... 8
3. Listing of possible restrictions to coal mining, Somerset quadrangle, Colorado ............ 15 4. Restrictions to Mining, Colorado 34-33-101, et. seq. ............................................................ 17 5. Common bed names and thickness ranges of principal coal beds,
Somerset quadrangle, Colorado .............................................................................................. 19 6. Summary of original, restricted, and available coal resources of the
Somerset quadrangle, Colorado, by bed ................................................................................ 24 7. Summary of restricted coal resources of the Somerset quadrangle,
Colorado, by bed ......................................................................................................................... 24 8. Summary of estimated original, remaining, and available coal resources of the
“B” coal bed in the Somerset 7.5-minute quadrangle, Colorado ....................................... 26 9. Summary of estimated original, remaining, and available coal resources of the
“D” coal bed in the Somerset 7.5-minute quadrangle, Colorado ....................................... 27 10. Summary of estimated original, remaining, and available coal resources of the
“E” coal bed in the Somerset 7.5-minute quadrangle, Colorado........................................ 28 11. Summary of surface- and underground-minable and available coal resources,
reported by seam, for the Bisti study area, New Mexico.................................................... 39 12. Summary of original and available coal resources and restrictions to mining,
reported by seam, for the Bisti study area, New Mexico.................................................... 39 13. Restrictions, and their associated buffers and factors that prevent mining,
in the Northern Wasatch Plateau coal field........................................................................... 47 14. Total, minable, and available coal resources, northern Wasatch Plateau, Utah ........... 56

15. Wasatch Plateau study area, Utah: as-received coal quality by bed................................ 56 16. Somerset study area, Colorado: as-received coal quality by bed .................................... 56 17. Bisti study area, New Mexico: as-received coal quality by bed........................................ 57 18. Results of Colorado Plateau coal availability studies in Colorado,
New Mexico, and Utah .............................................................................................................. 57 19. Results of Colorado Plateau coal recoverability and economic evaluation
studies in Colorado, New Mexico and Utah .......................................................................... 58 20. Recoverable coal resources, as planned by mining method, for the
Bisti study area, New Mexico .................................................................................................. 59 21. Recoverable coal resources, as planned by mining method, for the
Northern Wasatch Plateau study area, Utah......................................................................... 60
Introduction
The National and Regional Perspective
The National Coal Resource Assessment (NCRA) proj-ect, begun by the U.S. Geological Survey (USGS) in 1994, is studying fi ve major coal-producing areas in the contermi-nous United States (fi g. 1): the Appalachian Basin, the Illinois Basin, the Gulf Coast region, the Northern Rocky Mountains and Northern Great Plains region, and the Colorado Plateau region (U.S. Geological Survey, 1996). Although USGS site-specifi c coal availability studies and coal recoverability studies predate the NCRA project, the collation and interpretation of geological, geographical, environmental, and social informa-tion in Geographic Information Systems (GIS) databases as part of the NCRA will ultimately save thousands of man-hours of data assimilation for subsequent detailed resource examina-tions within the fi ve coal regions. Computer systems and soft-ware have improved, and, as a result, NCRA project databases will provide the opportunity to evaluate the coal resources for geographical areas composed of multiple 7.5-minute quad-rangles. Coal resource examinations in this chapter will report on areas ranging from one quadrangle (approximately 57 mi2) to as many as nine quadrangles (more than 500 mi2) in size.
Concepts of Economic Evaluation for Coal Resources
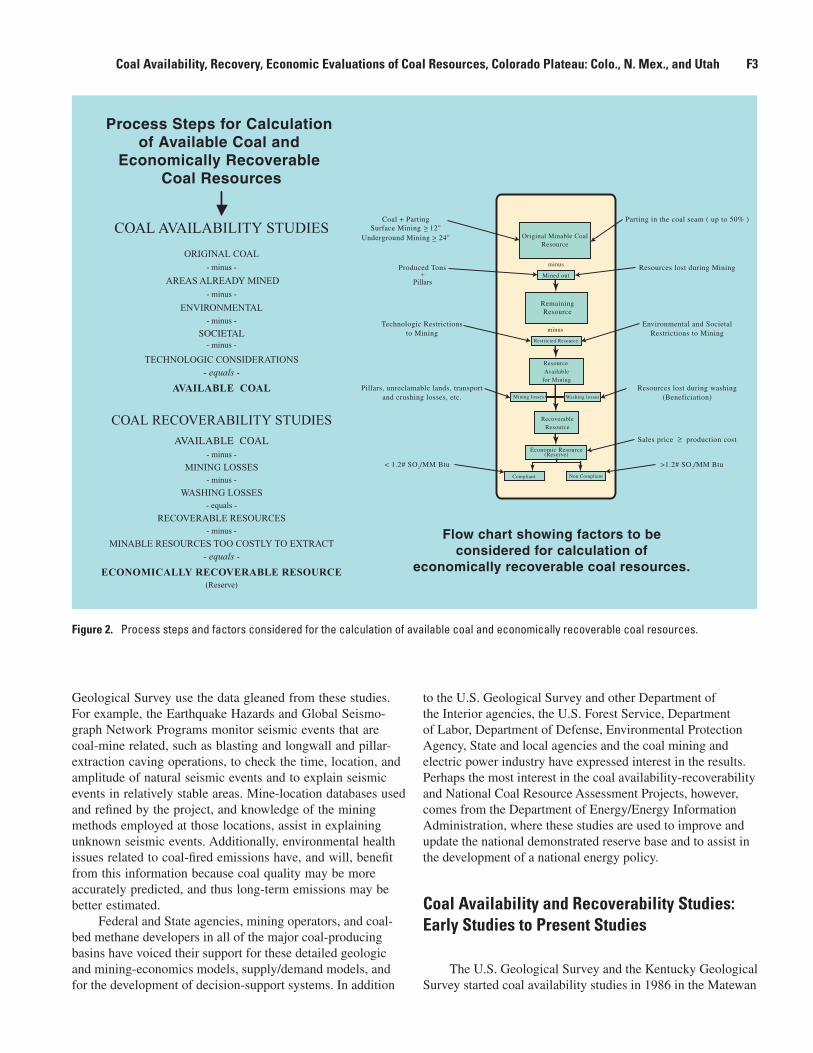
Within the context of Coal Availability Studies, the avail-able coal resources are defi ned as that part of the original coal resource that is accessible for mine development after subtraction of resources restricted by environmental, societal and technological constraints (fi g. 2) (Eggleston and Carter, 1987). Alluvial valley fl oors and producing oil and gas wells
are examples of constraints that may restrict coal mining in their immediate vicinities (Carter and Gardner, 1989; Egg-leston and others, 1990; Molnia and others, 1997; Osmonson and others, 2000). Recoverable resources (fi g. 2) (Rohrbacher and others, 1993a) is that part of the available coal resource that is left after normal mining losses and cleaning losses are subtracted. Coal seam geometry, geologic hazards, mining methods, mine design, and preparation plant recoveries are considerations in determining recoverable coal. Coal quality and the cost of coal extraction and cleaning are not considered restrictions at this point. Calculations of the economically extractable coal resource (that part of the recoverable coal that can be mined, cleaned, and marketed at a profi t) take into account the marketability of the processed coal product; that is, coal quality, the cost to produce the coal and deliver it to the rail car or over-the-road truck, and its transport to the market (Rohrbacher and others, 1993a). We calculate mining and processing costs for all recoverable resources, including those profi table in today’s market and those that are not profi t-able today but, as energy resources are depleted, may become economic to produce in a future market.
The project methodology (fi g. 2) of coal availability, recoverability, and economic evaluation of coal resources involves the collection and collation of coal-bed information and, ultimately, the determination of the total coal resources and reserves of major coal beds. Required information includes the location; lithologic description; thickness of coal beds, overburden, interburden, and parting; quality of coal beds; chemical analysis of overburden, interburden, and part-ings; rock-mechanics characteristics and structural geologic data; the locations of active and abandoned mines; social and industrial constraints (towns, highways, powerlines, gas and oil wells and pipelines, and railroads); and environmental restrictions, such as endangered animal and plant species habitat or elk and deer winter range, rivers, alluvial valley fl oors, wetlands; and, fi nally, surface and subsurface land ownership.
Coal Availability, Recoverability, and Economic Evaluations of Coal Resources in the Colorado Plateau, Colorado, New Mexico, and Utah
By Timothy J. Rohrbacher, Carol L. Molnia, Lee M. Osmonson, M. Devereux Carter, Wynn Eakins, Gretchen K. Hoffman, David E. Tabet, Janet E. Schultz, David C. Scott, Dale D. Teeters, Glen E. Jones, Jeffrey C. Quick, Brigitte P. Hucka, and John A. Hanson
F1
Purpose
Coal availability and recoverability studies (CARS) and the economic evaluation of coal resources in the Colorado Plateau region were completed in order to: 1. Produce estimates of the amount of coal that may be
mined at a profi t from Colorado Plateau coal fi elds; 2. Exchange and share information with industry and
Government agencies involved with gas (particularly coal-bed gas) and oil research and exploration;
3. Provide regional details and targets for future profi table coal extraction;
4. Provide Government agencies with scientifi cally based, sound engineering information for land-use planning;
5. Provide a means to construct better models to forecast future air emissions;
6. Produce sound, nonbiased, defensible coal-resource-availability and economics information for future energy plans of the Nation; and
7. Supplement existing databases through data collection from the Bureau of Land Management, Offi ce of Sur-face Mining, U.S. Forest Service, Environmental Pro-
tection Agency, State geological surveys, State depart-ments of taxation and planning, and from the mining industry.
The ability to produce estimates of coal mining econom-ics in specifi c areas and to integrate this information with supply/demand models in a digital decision-support system will allow planners and policy makers in Department of the Interior and Department of Energy to make educated, informed decisions concerning the environment, industry, and socio-economic well-being of the Nation. For example, when the economically extractable resources from a coal fi eld are com-pared to the present rates of mining (resource depletion) and the socio-economic base of the local and surrounding areas is examined, an estimate of local mining industry longevity may be derived. This allows local governments and industry energy planners to anticipate and to plan for alternative industry and services growth. Also, the evaluation models and methodolo-gies forged during these studies will assist in the development of other energy availability studies (uranium, oil and gas, coal-bed methane).
It is important to note that other programs in the U.S.
Illinois BasinRegion
AppalachianBasin
Region
Northern Rocky Mountainsand Northern Great Plains Region
Rocky Mountains
and ColoradoPlateau Region
Unassessed Area
Gulf Coast Region
Figure 1. The Rocky Mountains and Colorado Plateau region and its relationship to other coal regions in the National Coal Resource Assessment Project.
F2 Geologic Assessment of Coal in the Colorado Plateau: Arizona, Colorado, New Mexico, and Utah
Geological Survey use the data gleaned from these studies. For example, the Earthquake Hazards and Global Seismo-graph Network Programs monitor seismic events that are coal-mine related, such as blasting and longwall and pillar-extraction caving operations, to check the time, location, and amplitude of natural seismic events and to explain seismic events in relatively stable areas. Mine-location databases used and refi ned by the project, and knowledge of the mining methods employed at those locations, assist in explaining unknown seismic events. Additionally, environmental health issues related to coal-fi red emissions have, and will, benefi t from this information because coal quality may be more accurately predicted, and thus long-term emissions may be better estimated.
Federal and State agencies, mining operators, and coal-bed methane developers in all of the major coal-producing basins have voiced their support for these detailed geologic and mining-economics models, supply/demand models, and for the development of decision-support systems. In addition
to the U.S. Geological Survey and other Department of the Interior agencies, the U.S. Forest Service, Department of Labor, Department of Defense, Environmental Protection Agency, State and local agencies and the coal mining and electric power industry have expressed interest in the results. Perhaps the most interest in the coal availability-recoverability and National Coal Resource Assessment Projects, however, comes from the Department of Energy/Energy Information Administration, where these studies are used to improve and update the national demonstrated reserve base and to assist in the development of a national energy policy.
Coal Availability and Recoverability Studies: Early Studies to Present Studies
The U.S. Geological Survey and the Kentucky Geological Survey started coal availability studies in 1986 in the Matewan
COAL AVAILABILITY STUDIES
ORIGINAL COAL- minus -
AREAS ALREADY MINED- minus -
ENVIRONMENTAL- minus -
TECHNOLOGIC CONSIDERATIONS
AVAILABLE COAL
COAL RECOVERABILITY STUDIES
- minus -
MINING LOSSES- minus -
WASHING LOSSES- equals -
RECOVERABLE RESOURCES- minus -
MINABLE RESOURCES TOO COSTLY TO EXTRACT- equals -
ECONOMICALLY RECOVERABLE RESOURCE(Reserve)
- equals -
+Pillars
SOCIETAL- minus -
AVAILABLE COAL
Original Minable CoalResource
RemainingResource
Resource Available
for Mining
RecoverableResource
Restricted Resource
Economic Resource
Compliant Non Compliant
Mined out
Washing lossesMining losses
Coal + PartingSurface Mining 12"_>
Underground Mining 24"_>
Produced Tons
Technologic Restrictionsto Mining
Pillars, unreclamable lands, transportand crushing losses, etc.
Parting in the coal seam ( up to 50% )
Resources lost during Mining
Environmental and SocietalRestrictions to Mining
Resources lost during washing(Beneficiation)
_>Sales price production cost
>1.2# SO /MM Btu< 1.2# SO /MM Btu2 2
(Reserve)
Process Steps for Calculation of Available Coal and
Economically Recoverable Coal Resources
Flow chart showing factors to beconsidered for calculation of
economically recoverable coal resources.
minus
minus
Figure 2. Process steps and factors considered for the calculation of available coal and economically recoverable coal resources.
Coal Availability, Recovery, Economic Evaluations of Coal Resources, Colorado Plateau: Colo., N. Mex., and Utah F3
7.5-minute quadrangle (fi g. 3) in eastern Kentucky (Eggleston and Carter, 1987; Eggleston and others, 1990). Upon suc-cessful development of a program methodology to determine coal resources available for mining (Eggleston and Carter, 1987) and realistic results of the pilot study, the program was expanded to the other coal States in the central and north-ern Appalachian Basins (Carter and Gardner, 1989), then to the coal States in the Illinois Basin, and then to the western coal basins. More than 100 cooperative studies by State geo-logical surveys and the U.S. Geological Survey have been completed in the Appalachian, Illinois, Powder River, and San Juan Basins, and Colorado Plateau (Carter and others, 1999).
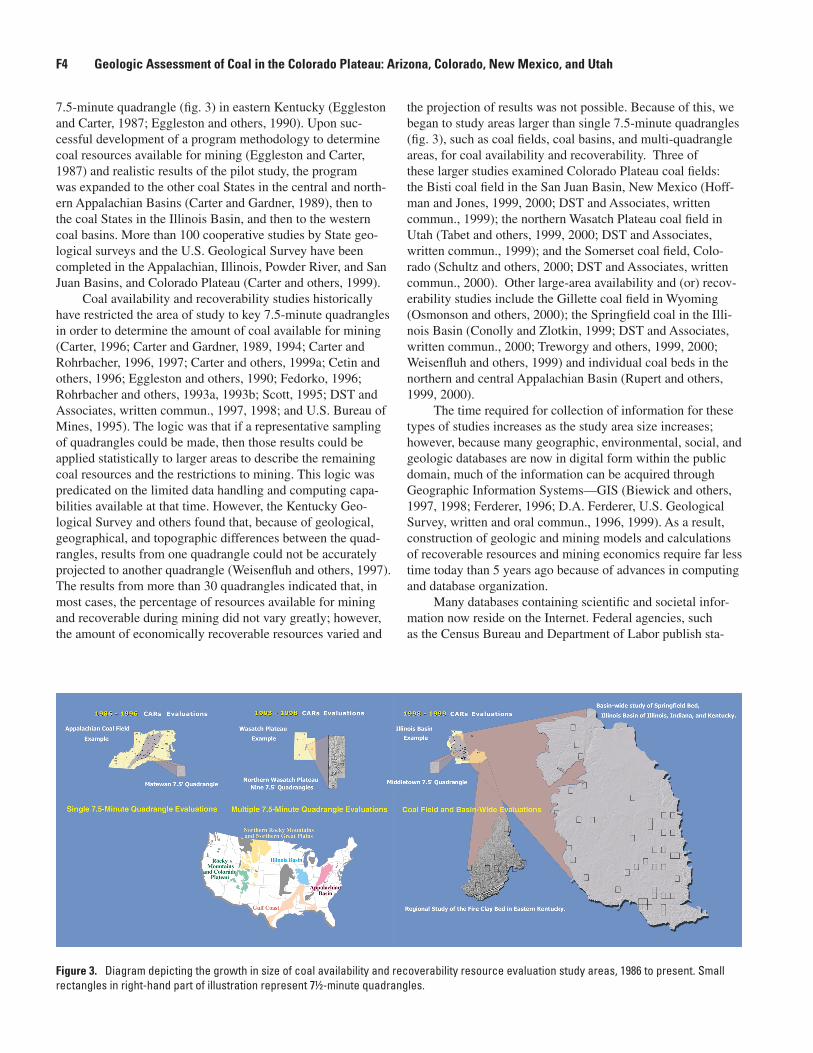
Coal availability and recoverability studies historically have restricted the area of study to key 7.5-minute quadrangles in order to determine the amount of coal available for mining (Carter, 1996; Carter and Gardner, 1989, 1994; Carter and Rohrbacher, 1996, 1997; Carter and others, 1999a; Cetin and others, 1996; Eggleston and others, 1990; Fedorko, 1996; Rohrbacher and others, 1993a, 1993b; Scott, 1995; DST and Associates, written commun., 1997, 1998; and U.S. Bureau of Mines, 1995). The logic was that if a representative sampling of quadrangles could be made, then those results could be applied statistically to larger areas to describe the remaining coal resources and the restrictions to mining. This logic was predicated on the limited data handling and computing capa-bilities available at that time. However, the Kentucky Geo-logical Survey and others found that, because of geological, geographical, and topographic differences between the quad-rangles, results from one quadrangle could not be accurately projected to another quadrangle (Weisenfl uh and others, 1997). The results from more than 30 quadrangles indicated that, in most cases, the percentage of resources available for mining and recoverable during mining did not vary greatly; however, the amount of economically recoverable resources varied and
the projection of results was not possible. Because of this, we began to study areas larger than single 7.5-minute quadrangles (fi g. 3), such as coal fi elds, coal basins, and multi-quadrangle areas, for coal availability and recoverability. Three of these larger studies examined Colorado Plateau coal fi elds: the Bisti coal fi eld in the San Juan Basin, New Mexico (Hoff-man and Jones, 1999, 2000; DST and Associates, written commun., 1999); the northern Wasatch Plateau coal fi eld in Utah (Tabet and others, 1999, 2000; DST and Associates, written commun., 1999); and the Somerset coal fi eld, Colo-rado (Schultz and others, 2000; DST and Associates, written commun., 2000). Other large-area availability and (or) recov-erability studies include the Gillette coal fi eld in Wyoming (Osmonson and others, 2000); the Springfi eld coal in the Illi-nois Basin (Conolly and Zlotkin, 1999; DST and Associates, written commun., 2000; Treworgy and others, 1999, 2000; Weisenfl uh and others, 1999) and individual coal beds in the northern and central Appalachian Basin (Rupert and others, 1999, 2000).
The time required for collection of information for these types of studies increases as the study area size increases; however, because many geographic, environmental, social, and geologic databases are now in digital form within the public domain, much of the information can be acquired through Geographic Information Systems—GIS (Biewick and others, 1997, 1998; Ferderer, 1996; D.A. Ferderer, U.S. Geological Survey, written and oral commun., 1996, 1999). As a result, construction of geologic and mining models and calculations of recoverable resources and mining economics require far less time today than 5 years ago because of advances in computing and database organization.
Many databases containing scientifi c and societal infor-mation now reside on the Internet. Federal agencies, such as the Census Bureau and Department of Labor publish sta-
Figure 3. Diagram depicting the growth in size of coal availability and recoverability resource evaluation study areas, 1986 to present. Small rectangles in right-hand part of illustration represent 7½-minute quadrangles.
F4 Geologic Assessment of Coal in the Colorado Plateau: Arizona, Colorado, New Mexico, and Utah
tistics related to population density and surface expressions (highways, roads, buildings, industrial sites, etc.). These can be supplemented with databases from the USGS database library, the ERDAS library, privately marketed databases, and research databases from colleges and universities. For more informa-tion concerning the USGS Database Library, contact D.A. Ferderer at [email protected] or visit the USGS web site at: http://www.usgs.gov. Additional information may be found at the USGS’s decision support system, called GEODE, at www:dss1.er.usgs.gov.
Methodology
Coal Availability, Recoverability, and Economic Evaluation Terminology
Coal availability and recoverability studies and economic evaluations of coal resources have been largely dependent on the State geological surveys to gather and build the required databases (Rohrbacher and others, 1993, 1994, 1995). Those databases typically contain: 1. Detailed geologic information and correlation of coal
beds, and 2. Environmental, technical, and social restrictions.Those databases have been supplemented by information gathered from the Bureau of Land Management, Offi ce of Surface Mining, U.S. Forest Service, Environmental Protection Agency, State departments of taxation and planning, and from the mining industry.
The coal availability and recoverability study methodol-ogy (Rohrbacher and others, 1993a) is summarized in fi gure 2. In this paper, the term reserve refers to any coal resource that can be legally extracted at a profi t (Abbott, 1990; U.S. Bureau of Mines, 1968). Legally extractable coal resources are deter-mined through a thorough research of land ownership, under-standing the geology and the restrictions applied to mining, and developing a best-alternative mine plan for resource recov-ery (in essence, coal availability and coal recoverability). The term profi t in this report is defi ned as the point where the income from sales of the coal is equal to or greater than the cost to produce the coal (economic analysis of coal resources). Income taxes and corporate rates of return were not included in this analysis but have been addressed in the coal resource economics chapter of the NCRA.
In coal availability studies, the net-coal thickness in coal beds was measured and summed. Partings greater than 0.25 inch thick were excluded from the resource calculation (Wood, and others, 1983; Eggleston and Carter, 1987; Eggleston and Others, 1990). It is very important to note that in recover-ability studies, the entire coal seam—coal plus parting plus dilution—is measured in the resource calculations (Rohrbacher and others, 1993a).
The term coal seam refers to the coal bed, beds, or benches and their associated parting material that must be
extracted together during the mining. Coal is a solid, more or less stratifi ed, combustible carbonaceous rock formed by partial to complete decomposition of vegetation. Coal, when dried at 100°C, should contain at least 50 percent combustible material. Parting material may be composed of combustible material, ash material, or other inorganic material in the form of carbonaceous shale, bone coal, shale, siltstone, sandstone, etc. The ash and parting composition are dependent on the type of material from which the coal was formed, the sediments carried into the coal while it was forming, ancient volcanic eruptions, and the dissolved matter brought in at the time of deposition or introduced later (U.S. Bureau of Mines, 1968; Stefanko, 1983).
The best-alternative mine plan is developed by employ-ing practical mining schemes that fi t the geology of the resource and the restrictions of the environment. Variables include the depth to the coal seam; the thickness of the coal seam; the structural complexity of the deposit; the environ-mental, social, and technical restrictions to mining; and the coal quality. Subsequently, the economic evaluation of this best-alternative plan and its associated coal resources is depen-dent on the effects of these variables to increase (or decrease) the cost of mining. Considering all of the variables, the quality of coal produced from the mine may be the single most impor-tant one. Depending on the depositional environments of the coal and the introduction of fl uids at some time after depo-sition of the strata, the coal may contain sulfur and other undesirable elements, and the parting material may contain combustible material, a high amount of noncombustible mate-rial (ash and other inorganic material), and higher amounts of sulfur and other undesirable elements than the coal. The coal may be benefi ciated (washed) to remove as much ash and hazardous elements as possible. Washing is successful when the ash material has a different density than the coal and the sulfur—generally contained as pyrite—is in a form that will wash out with the ash material. If the ash has nearly the same density as the coal and the sulfur is associated with organic constituents in the parting or coal, the coal seam may not able to be benefi ciated (Leonard, 1979) and therefore may not be economic to mine.
In underground mines, all of the in-seam material (coal and partings) must be mined together. During the mining pro-cess, some out-of-seam material (dilution) is produced with the coal seam. Occasionally, the coal quality of the under-ground-mined coal (particularly in the thick coal seams of the Colorado Plateau) is good enough to be sold directly from the mine rather than go through the costly process of coal washing. Parting material occurring in a surface-mined coal seam may be removed from the coal seam by mining the top coal bench, removing the parting bench, then mining the lower coal bench.
Washing increases the cost per short ton of produced coal and reduces the included parting and dilution material by 88–96 percent, on average, and the coal material by 4–8 percent, on average. For example, if a mine produced 5 million raw short tons per year and the product contained 20 percent
Coal Availability, Recovery, Economic Evaluations of Coal Resources, Colorado Plateau: Colo., N. Mex., and Utah F5
(1 million short tons) parting plus dilution material and 80 per-cent (4 million short tons) coal, the resulting recovered sale-able tonnage after washing would be a mixture of 80,000 short tons of parting and dilution material and 3,760,000 short tons of coal, a total of 3,840,000 short tons of washed product. If, in the worst case, the parting is 100 percent ash and inor-ganic material, 4.5 percent sulfur (80 percent of the sulfur as pyrite) and 0 Btu’s/lb (no combustible material), and the coal contained 5 percent ash, 3.5 percent sulfur (25 percent of the sulfur as pyrite) and 13,400 Btu’s/lb heating value (assume the moisture of the raw product and the washed product are the same), then the raw product from the mine would have a quality of 24 percent ash, 3.7 percent sulfur and 10,720 Btu’s—an unsaleable product in the U.S. market regardless of mining costs. However, if the raw product is washed using the above recovery rates, the 3,840,000 short tons of washed coal will have a product coal quality of 7.3 percent ash, 2.6 percent sulfur, and 13,120 Btu’s, a saleable product worth $23 to $25/short ton in the northern Appalachian coal market (depending on the distance from the mine to the power plant). For this reason it is imperative that channel and core samples collected for chemical and physical property analysis, always include parting and potential dilution material, as well as coal.
The Colorado Plateau coal availability evaluations assumed that only coal was available for mining (Eggleston and Carter, 1987 and Eggleston and others, 1990; Wood and others, 1983). Colorado Plateau coal recoverability evaluations assumed that a maximum mix of 50 percent coal and 50 percent parting plus out-of-seam dilution could be mined. By this defi nition, it is possible that the total original resource of coal (including parting and dilution) might be as much as 100 percent greater than the total original coal resource calculated with no parting included. The recoverability methodology is coal-industry-oriented and allows more coal seams to meet the minimum-mining-thickness requirements. This concept forces the technology and economics of coal extraction and coal cleaning (washing) to be the determining factors for reserve calculation. The reasoning for this difference is that the availability method is looking for geological explanations and understanding the mode of occurrence and extent of the deposit, whereas the recoverability method calculates the minability, product quality, salability, and economics of the deposit.
Restrictions to Mining
Figure 2 shows the general process steps used in coal availability and recoverability studies. After the total coal resources are modeled and calculated based on mining schemes, coal (and parting) resources that had been present within mined-out areas are determined. Environmental, soci-etal, and technologic restrictions to mining are outlined and the resources affected by these restrictions are calculated. These restrictions may vary signifi cantly from coal basin to coal basin. Table 1 is a partial listing of possible restrictions
to mining. Some restrictions are controlled by Federal law (43 CFR 3461.5), whereas others are determined on a site-by-site basis by State and Federal regulatory agencies. Coal resources in mined-out and restricted areas are then subtracted from the original resources yielding the resources available for mining. Computerized prefeasibility mine planning (Rohrbacher, 1997; and Rohrbacher and others, 1993a, 1993b) is then applied to the available resources, and the potentially minable coal ton-nage is determined for each mining method. The mine-plan-ning program, MINEPLAN (see Mining Costs and Reserve Calculations section) yields recoverable tonnages and mining losses assigned to each mining method. Dilution, based on mining method, and wash plant loss is then calculated. The total mining losses and washing losses are then subtracted from the available resources to calculate the estimated recover-able resource. The minable resource estimates are then ana-lyzed using COALVAL (see Mining Costs and Reserve Calcu-lations section), a coal resource recoverability/mine costing program (Suffredini and others, 1994). Results are summarized in tables containing estimates of total original in-place short tons, tons lost during past mining and washing operations, tons lost to mining restrictions, and recoverable tons yielded by each mining method. The costs are summarized in increments from less than $4/short ton to costs greater than $50/short ton (called cost curves) and include a break-even cost to determine reserves at a set point in time. A coal reserve as defi ned here is a recoverable coal resource that can be mined and sold at a profi t in today’s market (Abbott, 1990). All reserves are divided into compliance quality, that is less than 1.2 lb SO2/million Btu’s of heating value, and non-compliance quality, greater than 1.2 lb SO2/million Btu’s of heating value (fi gure 2). The conversion formula for percent sulfur to pounds SO2/million Btu’s may be stated: (percent sulfur × 2,000,000)/Btu’s = lb SO2/1,000,000 Btu’s, where percent sulfur is in decimals—for example, 2 percent sulfur = 0.02.
Potential restrictions are evaluated for each specifi c mining project. In some cases the potential restriction might be mitigated.
To make resource recovery and economic evaluations of potentially minable coal, individual coal seams must be cor-related. This detailed geological work usually takes place at the same time as databases containing potential mining restric-tions are compiled by the team conducting the availability, recoverability, and mining-economics study.
Calculating Reserves from Resources
Mine Planning
During the early 1990’s the former U.S. Bureau of Mines developed a mine planning program, MINEPLAN (see Mining Costs and Reserve Calculations section), using GRASS GIS scripts to plan the potential mining of available coal resources (Rohrbacher and others, 1993). Five surface-mining methods and two underground-mining methods were examined for the
F6 Geologic Assessment of Coal in the Colorado Plateau: Arizona, Colorado, New Mexico, and Utah
mining of Colorado Plateau resources. Those mining methods and their production models are listed in table 2. Contour stripping was found to be an inapplicable surface method in the Colorado Plateau due to environmental restrictions and was not considered in the mine planning. The underground methods of room and pillar mining and longwall mining were chosen because of their high productivity and widespread use. We considered local and practical mining methods and employed prefeasibility-type mine planning in this study. MINEPLAN programming priorities were set to default from one mining method to another. For example, if the topography was a gentle slope and the coal beds cropped out, then drag-line, truck and shovel, or area stripping methods were fi rst applied. These surface methods were generally planned to a stripping ratio of 10:1 for the fi nal highwall (maximum strip-ping depth); then, entry sites for underground mine access were planned; room and pillar patterns or longwall panels were modeled; and the remaining highwall was planned for auger mining, prior to planning for reclamation.
The MINE PLAN program does not require a particular map scale for planning. Most of the prefeasibility-type mine planning is done at a scale of 1 inch = 2000 ft (1:24,000). For that reason, the information that goes into the geo-model building, and from which the GIS layers are created, must be obtained from information compiled at this scale. Coal avail-ability GIS data collected by the State geological surveys are normally prepared at 1 inch = 2000 ft scale.
The methodology of Eggleston and others (1990) and Wood and others (1983) assumes that the minimum underground-minable coal bed will comprise 28 inches of coal (no parting material is included in the minimum seam thick-ness) and the minimum surface minable coal bed will comprise 14 inches of coal (again, no parting material was included in the minimum seam thickness). In recoverability studies the minimum mining thickness (hence seam thickness) used for underground mining is 24 inches, and, for surface mining, the minimum mining thickness used is 12 inches. These minimum thicknesses were agreed upon in consultation with the mining industry. The 14-inch and 28-inch minimum bed thicknesses used in previous resource assessments will be used in this report only for comparison.
Resource Recovery
The mining of a thin seam of coal, whether by surface or underground methods, requires more time per ton than mining a thick seam (economies of scale), and the equipment used to mine thin seams is different than equipment used in thick-seam mining. The production models (table 2) are based on equipment suitable for mining within the seam thickness. The thickness categories are based on present-day mining practices (U.S. Bureau of Mines, 1984–1994) as observed by engineers who evaluated the mining methods, resource recovery, staffi ng and wage rates, productivity, capital equipment, taxation, and owning and operating costs. As part of those mine evaluations, recovery rates were examined and mine maps digitized to
document the coal tonnage extracted and the tonnage left in the mine as support pillars, pillars between adjacent mines, and barrier pillars between the mine and the outcrop. Table 2 shows the mining methods, production-model categories, and associated recovery rates.
The underground mining production models also account
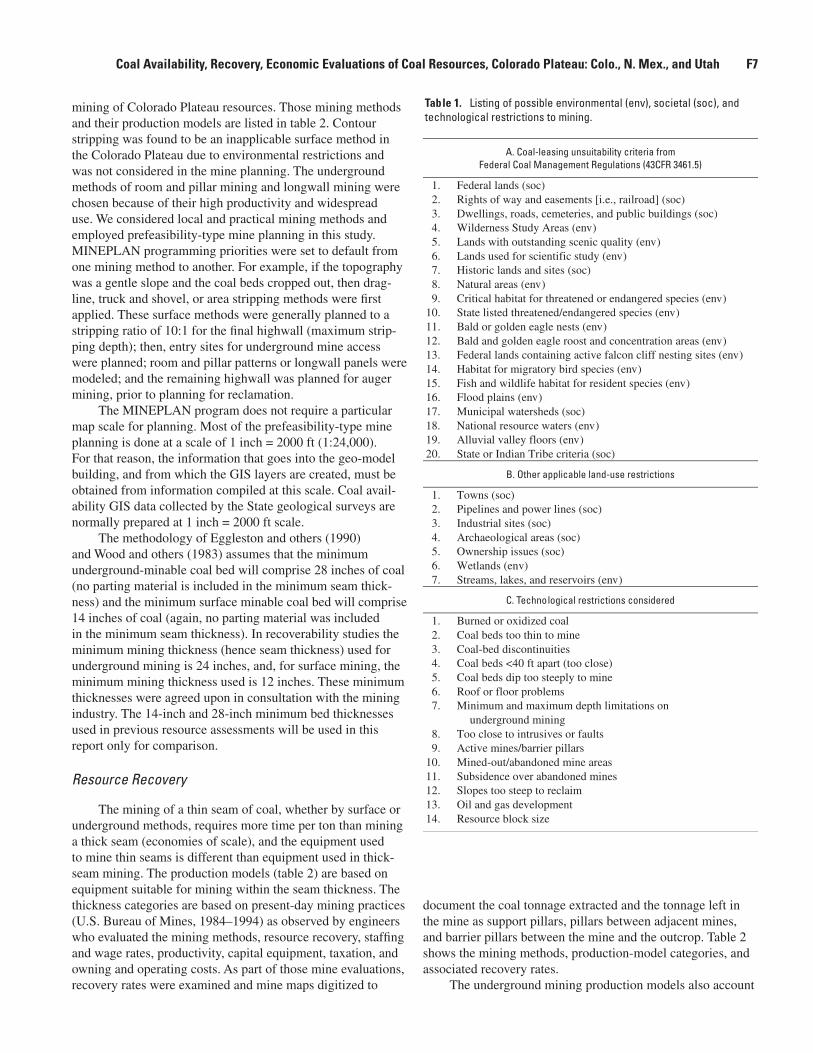
Table 1. Listing of possible environmental (env), societal (soc), and technological restrictions to mining.
A. Coal-leasing unsuitability criteria from
Federal Coal Management Regulations (43CFR 3461.5)
1. Federal lands (soc) 2. Rights of way and easements [i.e., railroad] (soc) 3. Dwellings, roads, cemeteries, and public buildings (soc) 4. Wilderness Study Areas (env) 5. Lands with outstanding scenic quality (env) 6. Lands used for scientific study (env) 7. Historic lands and sites (soc) 8. Natural areas (env) 9. Critical habitat for threatened or endangered species (env) 10. State listed threatened/endangered species (env) 11. Bald or golden eagle nests (env) 12. Bald and golden eagle roost and concentration areas (env) 13. Federal lands containing active falcon cliff nesting sites (env) 14. Habitat for migratory bird species (env) 15. Fish and wildlife habitat for resident species (env) 16. Flood plains (env) 17. Municipal watersheds (soc) 18. National resource waters (env) 19. Alluvial valley floors (env) 20. State or Indian Tribe criteria (soc)
B. Other applicable land-use restrictions
1. Towns (soc) 2. Pipelines and power lines (soc) 3. Industrial sites (soc) 4. Archaeological areas (soc) 5. Ownership issues (soc) 6. Wetlands (env) 7. Streams, lakes, and reservoirs (env)
C. Technological restrictions considered
1. Burned or oxidized coal 2. Coal beds too thin to mine 3. Coal-bed discontinuities 4. Coal beds <40 ft apart (too close) 5. Coal beds dip too steeply to mine 6. Roof or floor problems 7. Minimum and maximum depth limitations on
underground mining 8. Too close to intrusives or faults 9. Active mines/barrier pillars 10. Mined-out/abandoned mine areas 11. Subsidence over abandoned mines 12. Slopes too steep to reclaim 13. Oil and gas development 14. Resource block size
Coal Availability, Recovery, Economic Evaluations of Coal Resources, Colorado Plateau: Colo., N. Mex., and Utah F7
for material excavated from above and below the coal seam (dilution) while the seam is being removed. This dilution is added to the produced tonnage of coal plus parting material.
Mining Costs and Reserve Calculations
After the geologic and restriction information has been compiled, the resulting spatial data are then stored in digital databases accessible to Geographic Information System (GIS) programs that can produce three-dimensional geologic models, coal-quality models, and layers depicting mining-restriction information. The restrictions can be registered to the geologic model and can individually be subtracted, one layer at a time, from the geologic model. The results of these calculations are (1) an estimate of the total original coal resource; (2) an estimate of coal tonnage for each resource restriction; and (3) an estimate of tonnage remaining after restrictions to mining have been addressed.
The geologic and restriction data can be manipulated and analyzed through three different GIS computer methods. One uses a raster-based GIS program named GRASS (Geographi-cal Resources Analysis Support System), developed by the U.S. Army Corps of Engineers. GRASS is used to generate contour and isopach maps and to produce volumetric analysis of the coal beds; it also allows integration of various resource characterization and distribution coverages as previously men-tioned. The second method is the vector-based ARC/INFO program developed by Environmental Systems Research Insti-
tute, Inc. (ESRI). As part of this method, isopach and contour maps are processed using Interactive Surface Model-ing (“Earth Vision”) software developed by Dynamics Graph-ics, Inc. (Hettinger and others, 1996), and these maps are then converted to ARC/ INFO coverages to allow integration of geologic and geographical spatial data. The third GIS method uses the Spatial Analyst extension of ArcView (ESRI) to ana-lyze both raster- and vector-based data. These three methods produce comparable results.
Logical mine planning evaluations are made with the MINEPLAN program. MINEPLAN was written for GRASS using UNIX shell scripts. Assumptions concerning maximum stripping ratios, maximum depth to the coal seam, coal seams above (superjacent) and below (subjacent) the seam of interest, minimum underground and surface mining areas needed for production, restrictions to mining, best-alternative mine layout for the 18 mine models (table 2), and surface coal transporta-tion from the mine portal to the wash plant or rail loadout were incorporated into the MINEPLAN modeling program. Then a logical progression of mine development was designed; for example, surface mining would precede underground mining. When the maximum economic depth was reached in the sur-face mine, the program enables us to plan the extraction of underground-minable resources. Underground resources are fi rst planned with longwall mining methods where the resources are thick enough and extensive enough to support a longwall operation. The remaining resources are planned for room and pillar mining, with pillar extraction and retreat
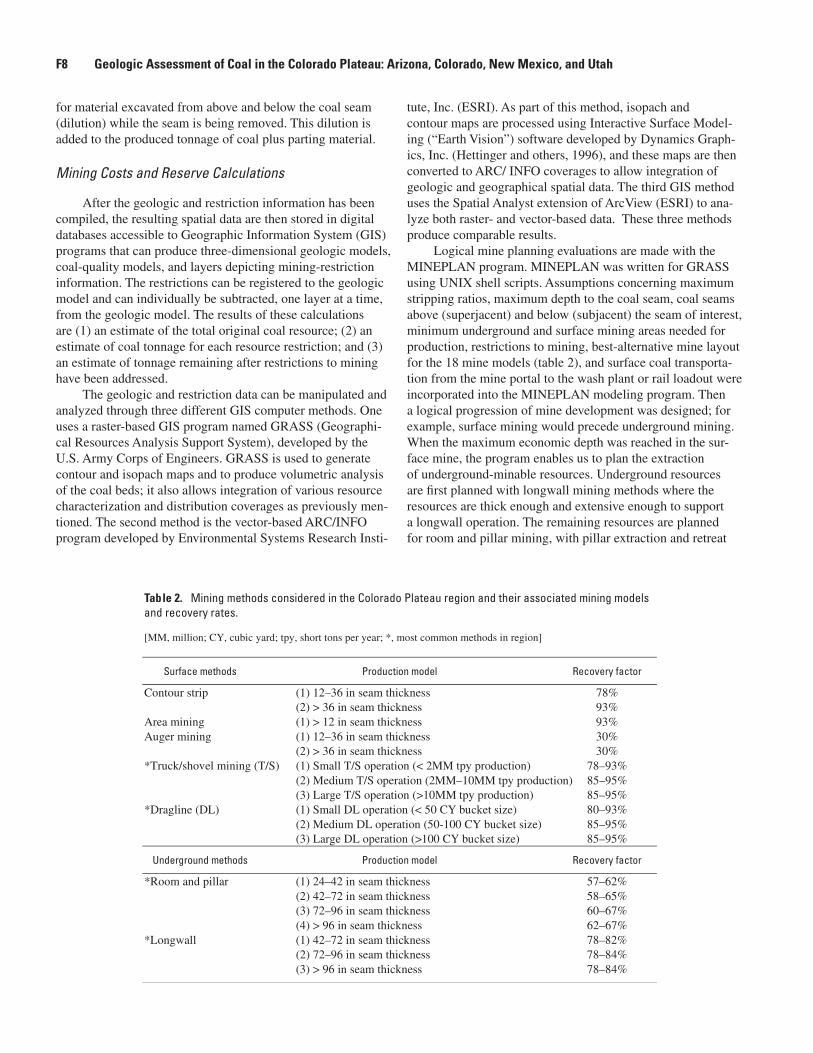
Table 2. Mining methods considered in the Colorado Plateau region and their associated mining models and recovery rates.
[MM, million; CY, cubic yard; tpy, short tons per year; *, most common methods in region]
Surface methods Production model Recovery factor
Contour strip (1) 12–36 in seam thickness 78% (2) > 36 in seam thickness 93% Area mining (1) > 12 in seam thickness 93% Auger mining (1) 12–36 in seam thickness 30% (2) > 36 in seam thickness 30% *Truck/shovel mining (T/S) (1) Small T/S operation (< 2MM tpy production) 78–93% (2) Medium T/S operation (2MM–10MM tpy production) 85–95% (3) Large T/S operation (>10MM tpy production) 85–95% *Dragline (DL) (1) Small DL operation (< 50 CY bucket size) 80–93% (2) Medium DL operation (50-100 CY bucket size) 85–95% (3) Large DL operation (>100 CY bucket size) 85–95%
Underground methods Production model Recovery factor
*Room and pillar (1) 24–42 in seam thickness 57–62% (2) 42–72 in seam thickness 58–65% (3) 72–96 in seam thickness 60–67% (4) > 96 in seam thickness 62–67% *Longwall (1) 42–72 in seam thickness 78–82% (2) 72–96 in seam thickness 78–84% (3) > 96 in seam thickness 78–84%
F8 Geologic Assessment of Coal in the Colorado Plateau: Arizona, Colorado, New Mexico, and Utah
caving operations where applicable. The MINEPLAN pro-gram enables us to identify the minable resource, plan the logical mining sequence for the 18 different mine models, and calculate the minable tonnage by mine model. The graphic output may be checked during the mine planning simulation, or the program may be run without interruption. The calcu-lated output from MINEPLAN is exported via ASCII fi les directly into the mine costing and recoverability-summarizing program, COALVAL.
COALVAL is an interactive, macro-based, program writ-ten for LOTUS software (Lotus Development Corporation), or Excel software (Microsoft, Inc.). COALVAL/Lotus was writ-ten by Plis and others (1993) and updated by Suffredini and others (1994) of the U.S. Bureau of Mines. More recently Coghlan (U.S. Geological Survey, written commun., 1999) and Rohrbacher (U.S. Geological Survey, written commun., 1999) rewrote and updated COALVAL in Excel. The program was designed to factor in production rates, optimized equip-ment and manpower requirements, and engineering cost analy-ses for typical mining methods and mine sizes. Data from U.S. Bureau of Mines economic analyses of more than 100 U.S. mining operations were categorized by geographic area, mining method, and mining confi guration. These data were then validated by comparing to mining cost estimates from the SME Mining Engineering Handbook (1973), Mining Cost Service (1999), and Western Coal Basin Supply and Demand Analysis (1988). Then, the costs and production rates were incorporated into the COALVAL program models. The COALVAL/Lotus models contain cost-of-living and Depart-ment of Labor indicators that may be updated on a regular basis. The basic output of COALVAL is estimates of recover-able short tons of clean coal by mining method. COALVAL also produces a series of cost curves showing how many of those recoverable short tons are profi table to mine in today’s coal market.
Acknowledgments
This chapter of the Colorado Plateau Resource Assess-ment was jointly researched and written by the coal geologists of the State geological surveys of Colorado, New Mexico, and Utah and the coal availability-recoverability staff at the U.S. Geological Survey. The research and published reports have been co-funded by the USGS and each cooperating State geological survey. Many State and Federal staff not men-tioned herein assisted the primary researchers. Their work is acknowledged in the State geological survey publications. The authors are also deeply indebted to many State and Federal agencies and coal mines that provided informational data, such as drill holes, mine recovery rates, and coal mine costs for these studies.
Wynn Eakins and Carol M. Tremain Ambrose, formerly of the Colorado Geological Survey (CGS), and David C. Scott and Dale D. Teeters, of DST and Associates, authored Colo-
rado Resource Series Report No. 36 (Eakins and others, 1998) on the availability of coal resources in the Somerset quad-rangle, Colorado. Wynn Eakins and Janet E. Schultz coau-thored the Somerset quadrangle discussion in this chapter.
New Mexico Bureau of Mines and Mineral Resources Open-File Report 438, concerning the available coal resources of the Bisti coal fi eld, was coauthored by Gretchen K. Hoffman and Glen E. Jones (2000). Gretchen K. Hoffman wrote the Bisti coal fi eld discussion in this chapter.
David E. Tabet, Jeffrey C. Quick, Brigitte P. Hucka, and John A. Hanson of the Utah Geological Survey wrote the coal availability paper entitled “The available coal resources for nine 7.5-minute quadrangles in the Northern Wasatch Plateau coal fi eld, Carbon and Emery Counties, Utah” (UGS Circular 100, 1999) and the Wasatch Plateau discussion in this chapter.
Finally, the senior author would like to express his grati-tude and thanks to Steve Roberts for his observations, sugges-tions, and detailed review of the manuscript and to Brenda Pierce for her organizational concepts concerning the manu-script. Both are research geologists for the U.S. Geological Survey. David Tabet of the Utah Geological Survey also crit-ically reviewed the manuscript and suggested changes that enabled the author to more closely compare coal availability results derived by different methodologies. Their help, guid-ance, and insistence on writing standards have helped produce this report.
Colorado Plateau Studies
Introduction
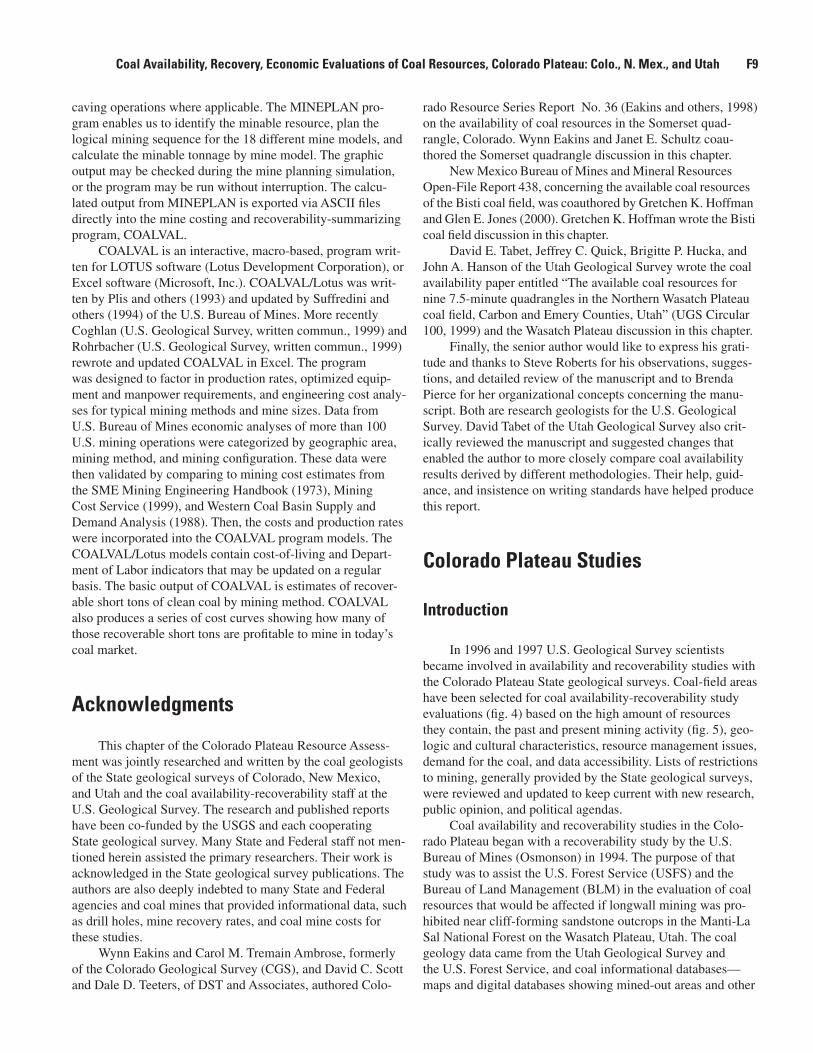
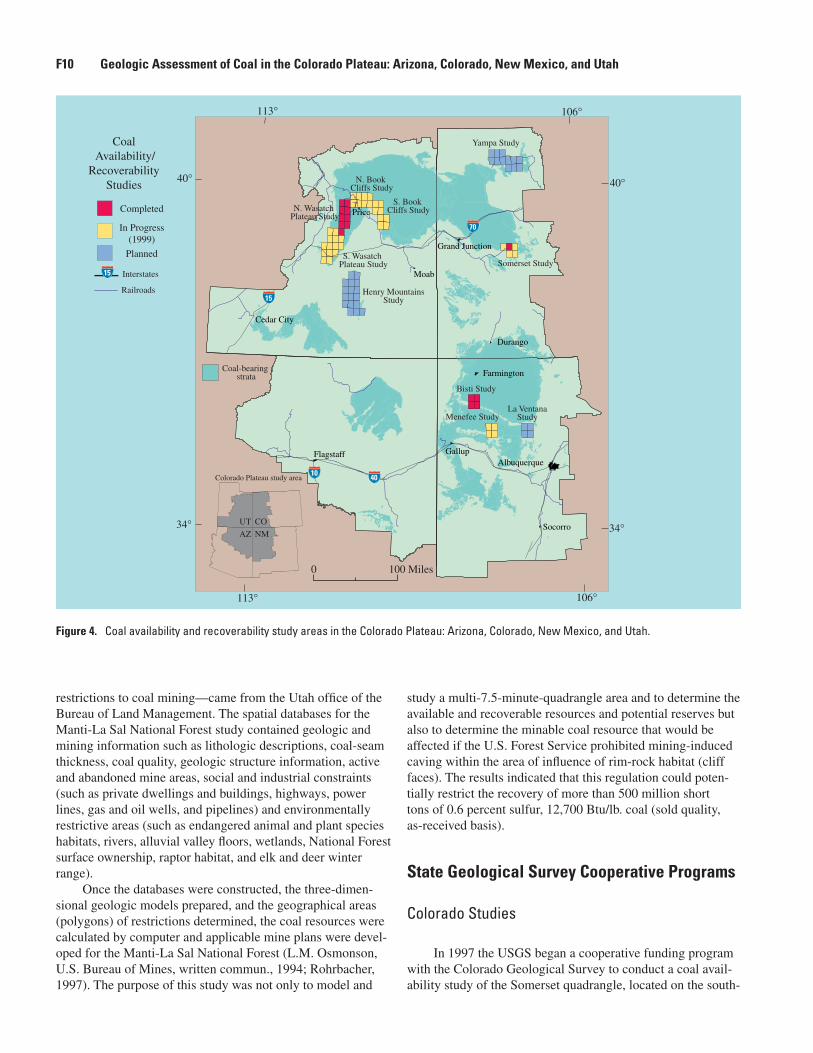
In 1996 and 1997 U.S. Geological Survey scientists became involved in availability and recoverability studies with the Colorado Plateau State geological surveys. Coal-fi eld areas have been selected for coal availability-recoverability study evaluations (fi g. 4) based on the high amount of resources they contain, the past and present mining activity (fi g. 5), geo-logic and cultural characteristics, resource management issues, demand for the coal, and data accessibility. Lists of restrictions to mining, generally provided by the State geological surveys, were reviewed and updated to keep current with new research, public opinion, and political agendas.
Coal availability and recoverability studies in the Colo-rado Plateau began with a recoverability study by the U.S. Bureau of Mines (Osmonson) in 1994. The purpose of that study was to assist the U.S. Forest Service (USFS) and the Bureau of Land Management (BLM) in the evaluation of coal resources that would be affected if longwall mining was pro-hibited near cliff-forming sandstone outcrops in the Manti-La Sal National Forest on the Wasatch Plateau, Utah. The coal geology data came from the Utah Geological Survey and the U.S. Forest Service, and coal informational databases—maps and digital databases showing mined-out areas and other
Coal Availability, Recovery, Economic Evaluations of Coal Resources, Colorado Plateau: Colo., N. Mex., and Utah F9
restrictions to coal mining—came from the Utah offi ce of the Bureau of Land Management. The spatial databases for the Manti-La Sal National Forest study contained geologic and mining information such as lithologic descriptions, coal-seam thickness, coal quality, geologic structure information, active and abandoned mine areas, social and industrial constraints (such as private dwellings and buildings, highways, power lines, gas and oil wells, and pipelines) and environmentally restrictive areas (such as endangered animal and plant species habitats, rivers, alluvial valley fl oors, wetlands, National Forest surface ownership, raptor habitat, and elk and deer winter range).
Once the databases were constructed, the three-dimen-sional geologic models prepared, and the geographical areas (polygons) of restrictions determined, the coal resources were calculated by computer and applicable mine plans were devel-oped for the Manti-La Sal National Forest (L.M. Osmonson, U.S. Bureau of Mines, written commun., 1994; Rohrbacher, 1997). The purpose of this study was not only to model and
study a multi-7.5-minute-quadrangle area and to determine the available and recoverable resources and potential reserves but also to determine the minable coal resource that would be affected if the U.S. Forest Service prohibited mining-induced caving within the area of infl uence of rim-rock habitat (cliff faces). The results indicated that this regulation could poten-tially restrict the recovery of more than 500 million short tons of 0.6 percent sulfur, 12,700 Btu/lb. coal (sold quality, as-received basis).
State Geological Survey Cooperative Programs
Colorado Studies
In 1997 the USGS began a cooperative funding program with the Colorado Geological Survey to conduct a coal avail-ability study of the Somerset quadrangle, located on the south-
Coal-bearing strata
Coal Availability/
RecoverabilityStudies
Completed
In Progress(1999)
Planned
Interstates
Railroads
N. Wasatch Plateau Study
N. Book Cliffs Study
Somerset Study
Bisti Study
Menefee Study
S. Wasatch Plateau Study
Gallup
Farmington
Durango
Cedar City
Moab
Price
Albuquerque
Socorro
Flagstaff
Grand Junction
40
15
15
70
10
113°
113°
34° 34°
40°40°
106°
106°
0 100 Miles
Colorado Plateau study area
AZ
UT
NM
CO
Henry MountainsStudy
S. Book Cliffs Study
Yampa Study
La VentanaStudy
Figure 4. Coal availability and recoverability study areas in the Colorado Plateau: Arizona, Colorado, New Mexico, and Utah.
F10 Geologic Assessment of Coal in the Colorado Plateau: Arizona, Colorado, New Mexico, and Utah
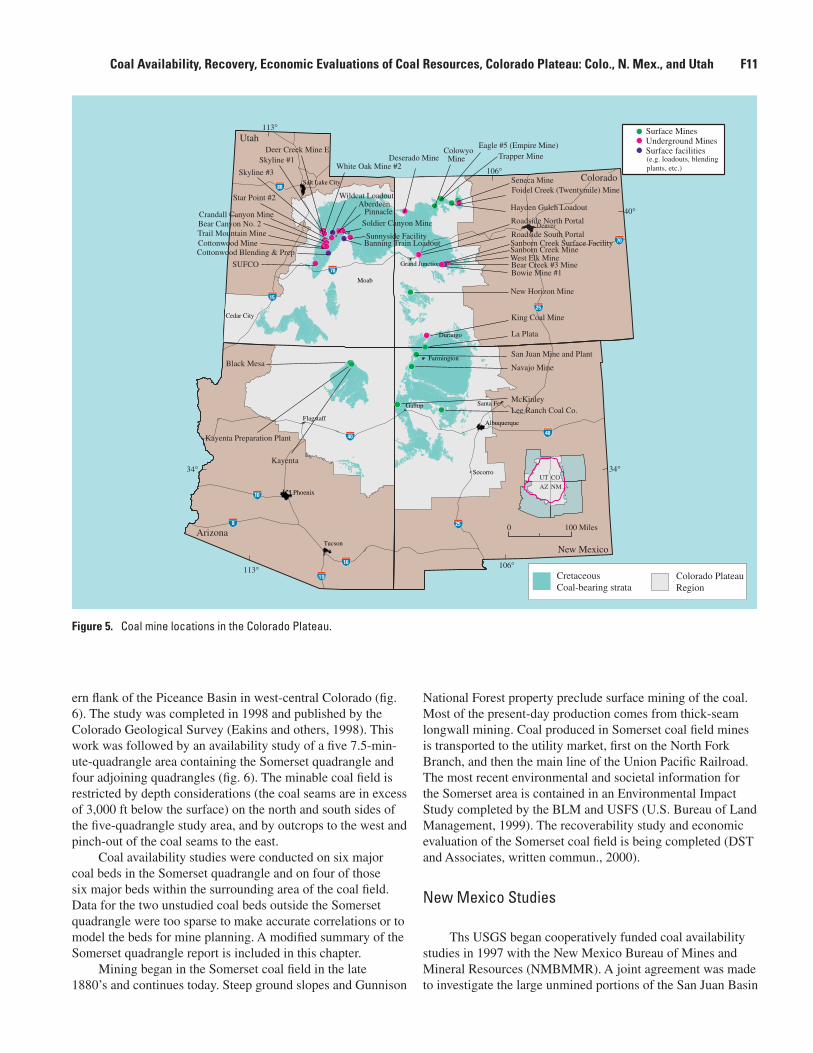
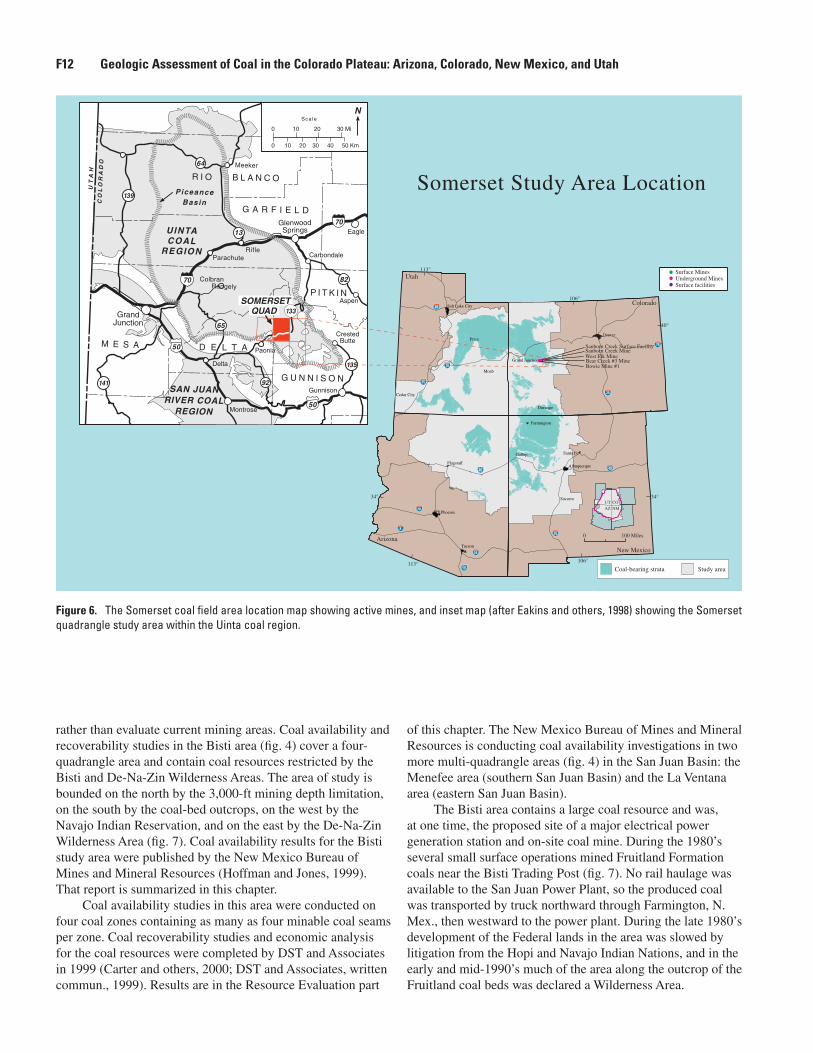
ern fl ank of the Piceance Basin in west-central Colorado (fi g. 6). The study was completed in 1998 and published by the Colorado Geological Survey (Eakins and others, 1998). This work was followed by an availability study of a fi ve 7.5-min-ute-quadrangle area containing the Somerset quadrangle and four adjoining quadrangles (fi g. 6). The minable coal fi eld is restricted by depth considerations (the coal seams are in excess of 3,000 ft below the surface) on the north and south sides of the fi ve-quadrangle study area, and by outcrops to the west and pinch-out of the coal seams to the east.
Coal availability studies were conducted on six major coal beds in the Somerset quadrangle and on four of those six major beds within the surrounding area of the coal fi eld. Data for the two unstudied coal beds outside the Somerset quadrangle were too sparse to make accurate correlations or to model the beds for mine planning. A modifi ed summary of the Somerset quadrangle report is included in this chapter.
Mining began in the Somerset coal fi eld in the late 1880’s and continues today. Steep ground slopes and Gunnison
National Forest property preclude surface mining of the coal. Most of the present-day production comes from thick-seam longwall mining. Coal produced in Somerset coal fi eld mines is transported to the utility market, fi rst on the North Fork Branch, and then the main line of the Union Pacifi c Railroad. The most recent environmental and societal information for the Somerset area is contained in an Environmental Impact Study completed by the BLM and USFS (U.S. Bureau of Land Management, 1999). The recoverability study and economic evaluation of the Somerset coal fi eld is being completed (DST and Associates, written commun., 2000).
New Mexico Studies
Ths USGS began cooperatively funded coal availability studies in 1997 with the New Mexico Bureau of Mines and Mineral Resources (NMBMMR). A joint agreement was made to investigate the large unmined portions of the San Juan Basin
Gallup
Farmington
Durango
Cedar City
Moab
Price
Albuquerque
Socorro
Flagstaff
Santa Fe
Grand Junction
Salt Lake City
Denver
Tucson
Phoenix
70
25
40
25
40
15
70
80
10
19
10
8
CretaceousCoal-bearing strata
Colorado PlateauRegion
113°
113°
106°
34°34°
40°
106°
0 100 Miles
Utah
Colorado
New Mexico
Arizona
AZ
UT
NM
CO
(e.g. loadouts, blendingplants, etc.)
Figure 5. Coal mine locations in the Colorado Plateau.
Coal Availability, Recovery, Economic Evaluations of Coal Resources, Colorado Plateau: Colo., N. Mex., and Utah F11
rather than evaluate current mining areas. Coal availability and recoverability studies in the Bisti area (fi g. 4) cover a four-quadrangle area and contain coal resources restricted by the Bisti and De-Na-Zin Wilderness Areas. The area of study is bounded on the north by the 3,000-ft mining depth limitation, on the south by the coal-bed outcrops, on the west by the Navajo Indian Reservation, and on the east by the De-Na-Zin Wilderness Area (fi g. 7). Coal availability results for the Bisti study area were published by the New Mexico Bureau of Mines and Mineral Resources (Hoffman and Jones, 1999). That report is summarized in this chapter.
Coal availability studies in this area were conducted on four coal zones containing as many as four minable coal seams per zone. Coal recoverability studies and economic analysis for the coal resources were completed by DST and Associates in 1999 (Carter and others, 2000; DST and Associates, written commun., 1999). Results are in the Resource Evaluation part
of this chapter. The New Mexico Bureau of Mines and Mineral Resources is conducting coal availability investigations in two more multi-quadrangle areas (fi g. 4) in the San Juan Basin: the Menefee area (southern San Juan Basin) and the La Ventana area (eastern San Juan Basin).
The Bisti area contains a large coal resource and was, at one time, the proposed site of a major electrical power generation station and on-site coal mine. During the 1980’s several small surface operations mined Fruitland Formation coals near the Bisti Trading Post (fi g. 7). No rail haulage was available to the San Juan Power Plant, so the produced coal was transported by truck northward through Farmington, N. Mex., then westward to the power plant. During the late 1980’s development of the Federal lands in the area was slowed by litigation from the Hopi and Navajo Indian Nations, and in the early and mid-1990’s much of the area along the outcrop of the Fruitland coal beds was declared a Wilderness Area.
Gallup
Farmington
Durango
Cedar City
Moab
Price
Albuquerque
Socorro
Flagstaff
Santa Fe
Grand Junction
Salt Lake City
Denver
Tucson
Phoenix
70
25
40
25
40
15
70
80
10
19
10
8
Coal-bearing strata Study area
113°
113°
106°
34°34°
40°
106°
0 100 Miles
Utah
Colorado
New Mexico
Arizona
AZ
UT
NM
CO
P I T K I N
D E L T A
G U N N I S O N
M E S A
QUAD
G A R F I E L D
R I O B L A N C O
UINTACOAL
REGION
SAN JUANRIVER COAL
REGION
SOMERSET
UT
AH
CO
LO
RA
DO
P iceanceBasin
139
64
13
141
65
133
92
70
70
50
50
135
82
GlenwoodSprings
Parachute
GrandJunction
Montrose
Meeker
Gunnison
Delta
Carbondale
Aspen
Eagle
CrestedButte
Paonia
Colbran
Rifle
0 10 20 30 Mi
0 10 20 30 40 50 Km
NSca le
Rangely
Somerset Study Area Location
Figure 6. The Somerset coal fi eld area location map showing active mines, and inset map (after Eakins and others, 1998) showing the Somerset quadrangle study area within the Uinta coal region.
F12 Geologic Assessment of Coal in the Colorado Plateau: Arizona, Colorado, New Mexico, and Utah
Utah Studies
In 1997, the Utah Geological Survey (UGS) began work-ing on a coal availability study encompassing nine 7.5-minute quadrangles in the northern Wasatch Plateau. The results of that study (Tabet and others, 1999) are summarized in this chapter.
Coal mining in the Northern Wasatch Plateau coal fi eld (fi g. 8) is restricted by large fault zones associated with grabens of the Basin and Range Province on the west, cross-fault systems and lack of drilling information on the south, seam outcrops on the east, and faults and lack of coal deposi-tion on the north. Most of the coal resources in the Wasatch Plateau and Book Cliffs occur on National Forest lands and in areas with high topographic relief. These locations limit mining to underground methods, particularly longwall mining techniques, and to areas where the coal seams are relatively thick. Coal availability studies by the Utah Geological Survey in multi-7.5-minute-quadrangle areas continue in the Book
Cliffs. The USGS has completed the coal recoverability and economic evaluation of the northern Wasatch Plateau coal resources (fi g. 4) and is currently working on the coal avail-ability, recoverability, and economic evaluation of the south-ern Wasatch Plateau coal resources. Results of the coal recov-erability and the economic evaluation of coal resources are found in the Resource Recovery section of this chapter.
Mining began in 1875 in the Huntington Canyon area of the Northern Wasatch Plateau study area. Transportation of the mined coal to market has been diffi cult because the north-south-trending mountains form barriers to accessing power plants in the eastern or western population centers. Coal must be shipped northward across Soldier Summit or south and eastward toward Grand Junction, Colo., or must be trucked to rail spurs near Levan, (20 mi south of Nephi) in the Sevier Valley to the west. Regardless, the biggest cost of this coal is not in the mining operations but in the transportation from the mine to the user.
Gallup
Farmington
Durango
Moab
Price
Albuquerque
Socorro
Flagstaff
Santa Fe
Grand Junction
Denver
Tucson
Phoenix
70
25
40
25
40
15
70
80
10
19
10
8
Cretaceouscoal-bearing strata Study area
113°
113°
106°
34°34°
40°
106°
0 100 Miles
Utah
Colorado
New Mexico
Arizona
AZ
UT
NM
CO
T 23 N
T 25 N
R16W R14W R12W
Study Area
NewMexico
Kf
Kf
Kf
0 5 10 miles
R iverChaco
Outcropsof
olderrock
Outcropsof
youngerrock
DE-NA-ZIN WA
BistiWA
Fossil Forest RNA
De-Na-Z in
Was h
(Coal Creek)
BISTITRADING
POST
Hunte r
Wash
Burnham
Consolidation Coal Co.& El Paso Natural Gas
Co.Lease-inactive
Ea
ste
rn b
ou
nd
ary
,N
ava
jo R
ese
rva
tion
Chaco R
iver
BHPMinerals
Navajo Mine
1996Addition
Sunbelt’sGateway
Mine
Sunbelt’sDe-Na-Zin
MineKfGeologic contactFruitland FormationWilderness areaMine area
Bisti Coal Field Study Area
Figure 7. Bisti coal fi eld area index map and inset map (after Hoffman and Jones, 1999) of study area and active mines. RNA, Research Natural Area; WA, Wilderness Area.
Coal Availability, Recovery, Economic Evaluations of Coal Resources, Colorado Plateau: Colo., N. Mex., and Utah F13
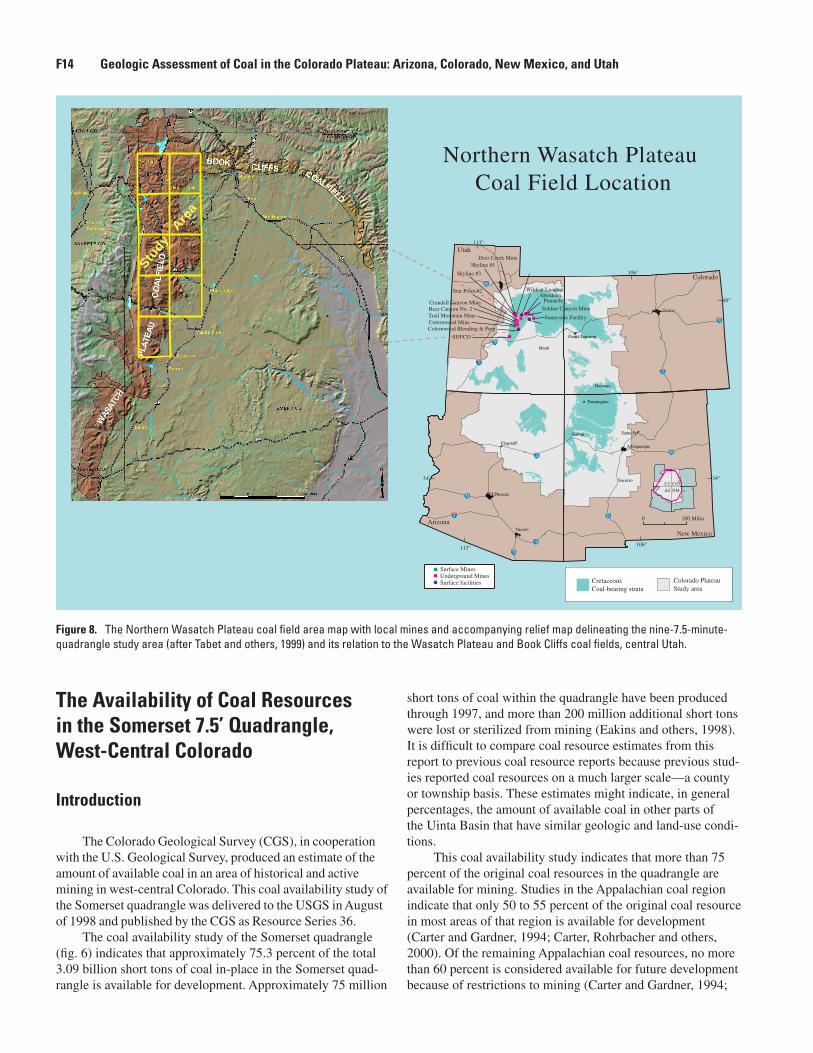
The Availability of Coal Resources in the Somerset 7.5’ Quadrangle, West-Central Colorado
Introduction
The Colorado Geological Survey (CGS), in cooperation with the U.S. Geological Survey, produced an estimate of the amount of available coal in an area of historical and active mining in west-central Colorado. This coal availability study of the Somerset quadrangle was delivered to the USGS in August of 1998 and published by the CGS as Resource Series 36.
The coal availability study of the Somerset quadrangle (fi g. 6) indicates that approximately 75.3 percent of the total 3.09 billion short tons of coal in-place in the Somerset quad-rangle is available for development. Approximately 75 million
short tons of coal within the quadrangle have been produced through 1997, and more than 200 million additional short tons were lost or sterilized from mining (Eakins and others, 1998). It is diffi cult to compare coal resource estimates from this report to previous coal resource reports because previous stud-ies reported coal resources on a much larger scale—a county or township basis. These estimates might indicate, in general percentages, the amount of available coal in other parts of the Uinta Basin that have similar geologic and land-use condi-tions.
This coal availability study indicates that more than 75 percent of the original coal resources in the quadrangle are available for mining. Studies in the Appalachian coal region indicate that only 50 to 55 percent of the original coal resource in most areas of that region is available for development (Carter and Gardner, 1994; Carter, Rohrbacher and others, 2000). Of the remaining Appalachian coal resources, no more than 60 percent is considered available for future development because of restrictions to mining (Carter and Gardner, 1994;
Gallup
Farmington
Durango
Moab
Price
Albuquerque
Socorro
Flagstaff
Santa Fe
Grand Junction
Denver
Tucson
Phoenix
70
25
40
25
40
15
70
80
10
19
10
8
CretaceousCoal-bearing strata
Colorado PlateauStudy area
113°
113°
106°
34°34°
40°
106°
0 100 Miles
Utah
Colorado
New Mexico
Arizona
AZ
UT
NM
CO
Northern Wasatch Plateau Coal Field Location
Study
A
rea
Figure 8. The Northern Wasatch Plateau coal fi eld area map with local mines and accompanying relief map delineating the nine-7.5-minute-quadrangle study area (after Tabet and others, 1999) and its relation to the Wasatch Plateau and Book Cliffs coal fi elds, central Utah.
F14 Geologic Assessment of Coal in the Colorado Plateau: Arizona, Colorado, New Mexico, and Utah
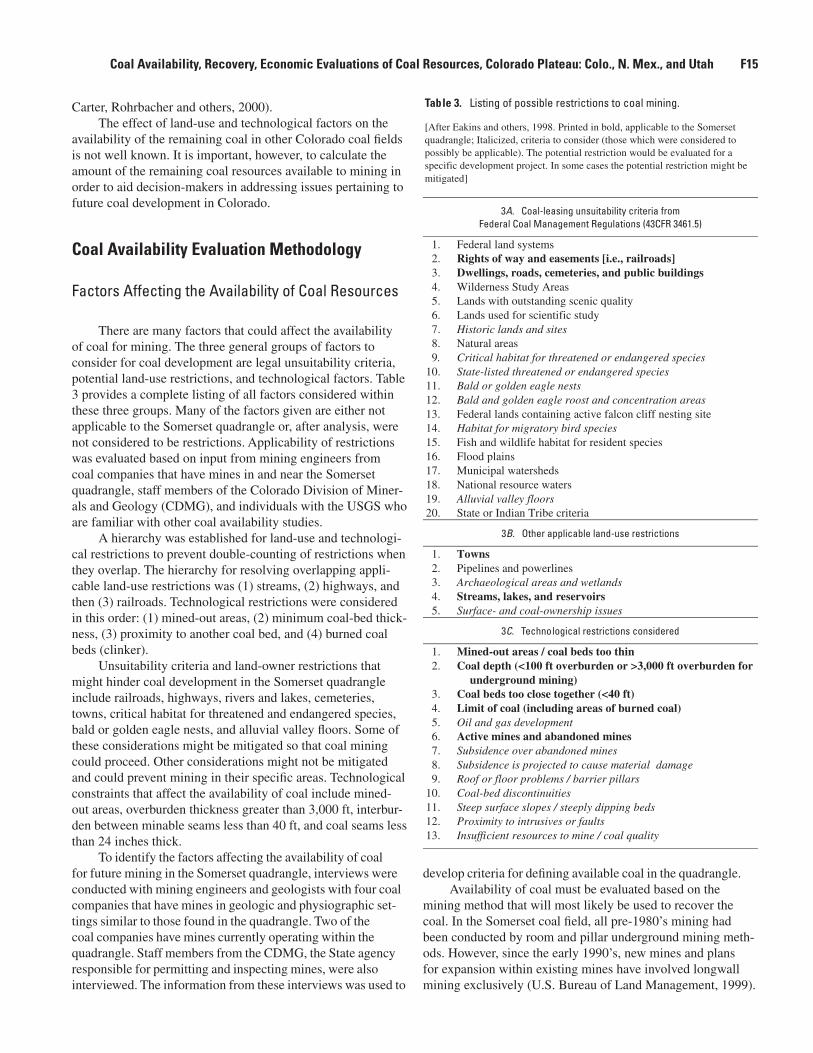
Carter, Rohrbacher and others, 2000).The effect of land-use and technological factors on the
availability of the remaining coal in other Colorado coal fi elds is not well known. It is important, however, to calculate the amount of the remaining coal resources available to mining in order to aid decision-makers in addressing issues pertaining to future coal development in Colorado.
Coal Availability Evaluation Methodology
Factors Affecting the Availability of Coal Resources
There are many factors that could affect the availability of coal for mining. The three general groups of factors to consider for coal development are legal unsuitability criteria, potential land-use restrictions, and technological factors. Table 3 provides a complete listing of all factors considered within these three groups. Many of the factors given are either not applicable to the Somerset quadrangle or, after analysis, were not considered to be restrictions. Applicability of restrictions was evaluated based on input from mining engineers from coal companies that have mines in and near the Somerset quadrangle, staff members of the Colorado Division of Miner-als and Geology (CDMG), and individuals with the USGS who are familiar with other coal availability studies.
A hierarchy was established for land-use and technologi-cal restrictions to prevent double-counting of restrictions when they overlap. The hierarchy for resolving overlapping appli-cable land-use restrictions was (1) streams, (2) highways, and then (3) railroads. Technological restrictions were considered in this order: (1) mined-out areas, (2) minimum coal-bed thick-ness, (3) proximity to another coal bed, and (4) burned coal beds (clinker).
Unsuitability criteria and land-owner restrictions that might hinder coal development in the Somerset quadrangle include railroads, highways, rivers and lakes, cemeteries, towns, critical habitat for threatened and endangered species, bald or golden eagle nests, and alluvial valley fl oors. Some of these considerations might be mitigated so that coal mining could proceed. Other considerations might not be mitigated and could prevent mining in their specifi c areas. Technological constraints that affect the availability of coal include mined-out areas, overburden thickness greater than 3,000 ft, interbur-den between minable seams less than 40 ft, and coal seams less than 24 inches thick.
To identify the factors affecting the availability of coal for future mining in the Somerset quadrangle, interviews were conducted with mining engineers and geologists with four coal companies that have mines in geologic and physiographic set-tings similar to those found in the quadrangle. Two of the coal companies have mines currently operating within the quadrangle. Staff members from the CDMG, the State agency responsible for permitting and inspecting mines, were also interviewed. The information from these interviews was used to
develop criteria for defi ning available coal in the quadrangle.Availability of coal must be evaluated based on the
mining method that will most likely be used to recover the coal. In the Somerset coal fi eld, all pre-1980’s mining had been conducted by room and pillar underground mining meth-ods. However, since the early 1990’s, new mines and plans for expansion within existing mines have involved longwall mining exclusively (U.S. Bureau of Land Management, 1999).
Table 3. Listing of possible restrictions to coal mining.
[After Eakins and others, 1998. Printed in bold, applicable to the Somerset quadrangle; Italicized, criteria to consider (those which were considered to possibly be applicable). The potential restriction would be evaluated for a specific development project. In some cases the potential restriction might be mitigated]
3A. Coal-leasing unsuitability criteria from
Federal Coal Management Regulations (43CFR 3461.5)
1. Federal land systems 2. Rights of way and easements [i.e., railroads] 3. Dwellings, roads, cemeteries, and public buildings 4. Wilderness Study Areas 5. Lands with outstanding scenic quality 6. Lands used for scientific study 7. Historic lands and sites 8. Natural areas 9. Critical habitat for threatened or endangered species 10. State-listed threatened or endangered species 11. Bald or golden eagle nests 12. Bald and golden eagle roost and concentration areas 13. Federal lands containing active falcon cliff nesting site 14. Habitat for migratory bird species 15. Fish and wildlife habitat for resident species 16. Flood plains 17. Municipal watersheds 18. National resource waters 19. Alluvial valley floors 20. State or Indian Tribe criteria
3B. Other applicable land-use restrictions
1. Towns 2. Pipelines and powerlines 3. Archaeological areas and wetlands 4. Streams, lakes, and reservoirs 5. Surface- and coal-ownership issues
3C. Technological restrictions considered
1. Mined-out areas / coal beds too thin 2. Coal depth (<100 ft overburden or >3,000 ft overburden for
underground mining) 3. Coal beds too close together (<40 ft) 4. Limit of coal (including areas of burned coal) 5. Oil and gas development 6. Active mines and abandoned mines 7. Subsidence over abandoned mines 8. Subsidence is projected to cause material damage 9. Roof or floor problems / barrier pillars 10. Coal-bed discontinuities 11. Steep surface slopes / steeply dipping beds 12. Proximity to intrusives or faults 13. Insufficient resources to mine / coal quality
Coal Availability, Recovery, Economic Evaluations of Coal Resources, Colorado Plateau: Colo., N. Mex., and Utah F15
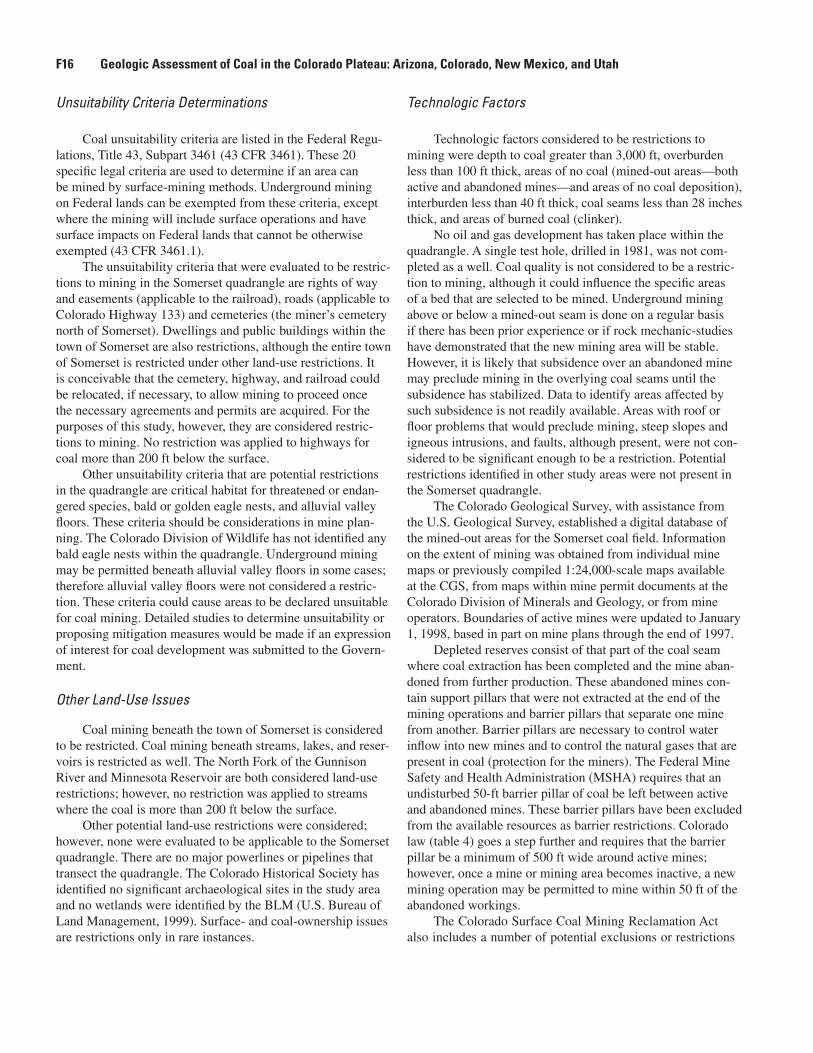
Unsuitability Criteria Determinations
Coal unsuitability criteria are listed in the Federal Regu-lations, Title 43, Subpart 3461 (43 CFR 3461). These 20 specifi c legal criteria are used to determine if an area can be mined by surface-mining methods. Underground mining on Federal lands can be exempted from these criteria, except where the mining will include surface operations and have surface impacts on Federal lands that cannot be otherwise exempted (43 CFR 3461.1).
The unsuitability criteria that were evaluated to be restric-tions to mining in the Somerset quadrangle are rights of way and easements (applicable to the railroad), roads (applicable to Colorado Highway 133) and cemeteries (the miner’s cemetery north of Somerset). Dwellings and public buildings within the town of Somerset are also restrictions, although the entire town of Somerset is restricted under other land-use restrictions. It is conceivable that the cemetery, highway, and railroad could be relocated, if necessary, to allow mining to proceed once the necessary agreements and permits are acquired. For the purposes of this study, however, they are considered restric-tions to mining. No restriction was applied to highways for coal more than 200 ft below the surface.
Other unsuitability criteria that are potential restrictions in the quadrangle are critical habitat for threatened or endan-gered species, bald or golden eagle nests, and alluvial valley fl oors. These criteria should be considerations in mine plan-ning. The Colorado Division of Wildlife has not identifi ed any bald eagle nests within the quadrangle. Underground mining may be permitted beneath alluvial valley fl oors in some cases; therefore alluvial valley fl oors were not considered a restric-tion. These criteria could cause areas to be declared unsuitable for coal mining. Detailed studies to determine unsuitability or proposing mitigation measures would be made if an expression of interest for coal development was submitted to the Govern-ment.
Other Land-Use Issues
Coal mining beneath the town of Somerset is considered to be restricted. Coal mining beneath streams, lakes, and reser-voirs is restricted as well. The North Fork of the Gunnison River and Minnesota Reservoir are both considered land-use restrictions; however, no restriction was applied to streams where the coal is more than 200 ft below the surface.
Other potential land-use restrictions were considered; however, none were evaluated to be applicable to the Somerset quadrangle. There are no major powerlines or pipelines that transect the quadrangle. The Colorado Historical Society has identifi ed no signifi cant archaeological sites in the study area and no wetlands were identifi ed by the BLM (U.S. Bureau of Land Management, 1999). Surface- and coal-ownership issues are restrictions only in rare instances.
Technologic Factors
Technologic factors considered to be restrictions to mining were depth to coal greater than 3,000 ft, overburden less than 100 ft thick, areas of no coal (mined-out areas—both active and abandoned mines—and areas of no coal deposition), interburden less than 40 ft thick, coal seams less than 28 inches thick, and areas of burned coal (clinker).
No oil and gas development has taken place within the quadrangle. A single test hole, drilled in 1981, was not com-pleted as a well. Coal quality is not considered to be a restric-tion to mining, although it could infl uence the specifi c areas of a bed that are selected to be mined. Underground mining above or below a mined-out seam is done on a regular basis if there has been prior experience or if rock mechanic-studies have demonstrated that the new mining area will be stable. However, it is likely that subsidence over an abandoned mine may preclude mining in the overlying coal seams until the subsidence has stabilized. Data to identify areas affected by such subsidence is not readily available. Areas with roof or fl oor problems that would preclude mining, steep slopes and igneous intrusions, and faults, although present, were not con-sidered to be signifi cant enough to be a restriction. Potential restrictions identifi ed in other study areas were not present in the Somerset quadrangle.
The Colorado Geological Survey, with assistance from the U.S. Geological Survey, established a digital database of the mined-out areas for the Somerset coal fi eld. Information on the extent of mining was obtained from individual mine maps or previously compiled 1:24,000-scale maps available at the CGS, from maps within mine permit documents at the Colorado Division of Minerals and Geology, or from mine operators. Boundaries of active mines were updated to January 1, 1998, based in part on mine plans through the end of 1997.
Depleted reserves consist of that part of the coal seam where coal extraction has been completed and the mine aban-doned from further production. These abandoned mines con-tain support pillars that were not extracted at the end of the mining operations and barrier pillars that separate one mine from another. Barrier pillars are necessary to control water infl ow into new mines and to control the natural gases that are present in coal (protection for the miners). The Federal Mine Safety and Health Administration (MSHA) requires that an undisturbed 50-ft barrier pillar of coal be left between active and abandoned mines. These barrier pillars have been excluded from the available resources as barrier restrictions. Colorado law (table 4) goes a step further and requires that the barrier pillar be a minimum of 500 ft wide around active mines; however, once a mine or mining area becomes inactive, a new mining operation may be permitted to mine within 50 ft of the abandoned workings.
The Colorado Surface Coal Mining Reclamation Act also includes a number of potential exclusions or restrictions
F16 Geologic Assessment of Coal in the Colorado Plateau: Arizona, Colorado, New Mexico, and Utah
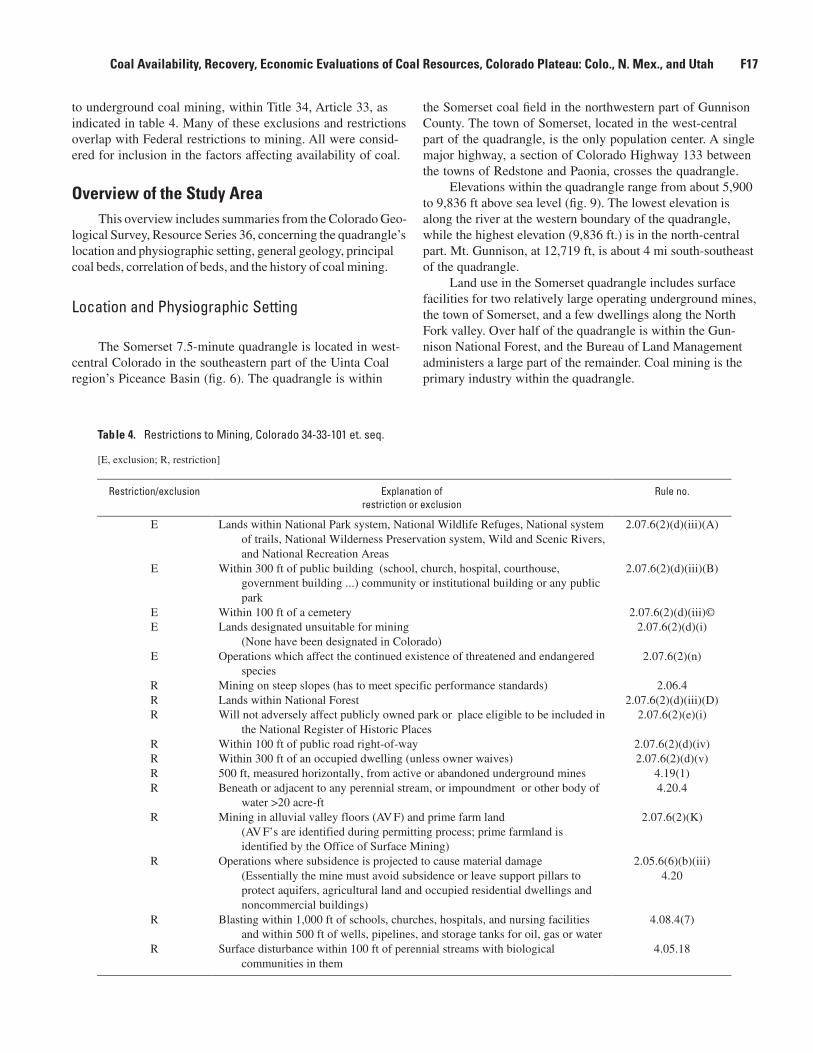
to underground coal mining, within Title 34, Article 33, as indicated in table 4. Many of these exclusions and restrictions overlap with Federal restrictions to mining. All were consid-ered for inclusion in the factors affecting availability of coal.
Overview of the Study AreaThis overview includes summaries from the Colorado Geo-
logical Survey, Resource Series 36, concerning the quadrangle’s location and physiographic setting, general geology, principal coal beds, correlation of beds, and the history of coal mining.
Location and Physiographic Setting
The Somerset 7.5-minute quadrangle is located in west-central Colorado in the southeastern part of the Uinta Coal region’s Piceance Basin (fi g. 6). The quadrangle is within
the Somerset coal fi eld in the northwestern part of Gunnison County. The town of Somerset, located in the west-central part of the quadrangle, is the only population center. A single major highway, a section of Colorado Highway 133 between the towns of Redstone and Paonia, crosses the quadrangle.
Elevations within the quadrangle range from about 5,900 to 9,836 ft above sea level (fi g. 9). The lowest elevation is along the river at the western boundary of the quadrangle, while the highest elevation (9,836 ft.) is in the north-central part. Mt. Gunnison, at 12,719 ft, is about 4 mi south-southeast of the quadrangle.
Land use in the Somerset quadrangle includes surface facilities for two relatively large operating underground mines, the town of Somerset, and a few dwellings along the North Fork valley. Over half of the quadrangle is within the Gun-nison National Forest, and the Bureau of Land Management administers a large part of the remainder. Coal mining is the primary industry within the quadrangle.
Table 4. Restrictions to Mining, Colorado 34-33-101 et. seq.
[E, exclusion; R, restriction]
Restriction/exclusion Explanation of restriction or exclusion
Rule no.
E Lands within National Park system, National Wildlife Refuges, National system of trails, National Wilderness Preservation system, Wild and Scenic Rivers, and National Recreation Areas
2.07.6(2)(d)(iii)(A)
E Within 300 ft of public building (school, church, hospital, courthouse, government building ...) community or institutional building or any public park
2.07.6(2)(d)(iii)(B)
E Within 100 ft of a cemetery 2.07.6(2)(d)(iii)© E Lands designated unsuitable for mining
(None have been designated in Colorado) 2.07.6(2)(d)(i)
E Operations which affect the continued existence of threatened and endangered species
2.07.6(2)(n)
R Mining on steep slopes (has to meet specific performance standards) 2.06.4 R Lands within National Forest 2.07.6(2)(d)(iii)(D) R Will not adversely affect publicly owned park or place eligible to be included in
the National Register of Historic Places 2.07.6(2)(e)(i)
R Within 100 ft of public road right-of-way 2.07.6(2)(d)(iv) R Within 300 ft of an occupied dwelling (unless owner waives) 2.07.6(2)(d)(v) R 500 ft, measured horizontally, from active or abandoned underground mines 4.19(1) R Beneath or adjacent to any perennial stream, or impoundment or other body of
water >20 acre-ft 4.20.4
R Mining in alluvial valley floors (AV F) and prime farm land (AV F’s are identified during permitting process; prime farmland is identified by the Office of Surface Mining)
2.07.6(2)(K)
R Operations where subsidence is projected to cause material damage (Essentially the mine must avoid subsidence or leave support pillars to protect aquifers, agricultural land and occupied residential dwellings and noncommercial buildings)
2.05.6(6)(b)(iii) 4.20
R Blasting within 1,000 ft of schools, churches, hospitals, and nursing facilities and within 500 ft of wells, pipelines, and storage tanks for oil, gas or water
4.08.4(7)
R Surface disturbance within 100 ft of perennial streams with biological communities in them
4.05.18
Coal Availability, Recovery, Economic Evaluations of Coal Resources, Colorado Plateau: Colo., N. Mex., and Utah F17
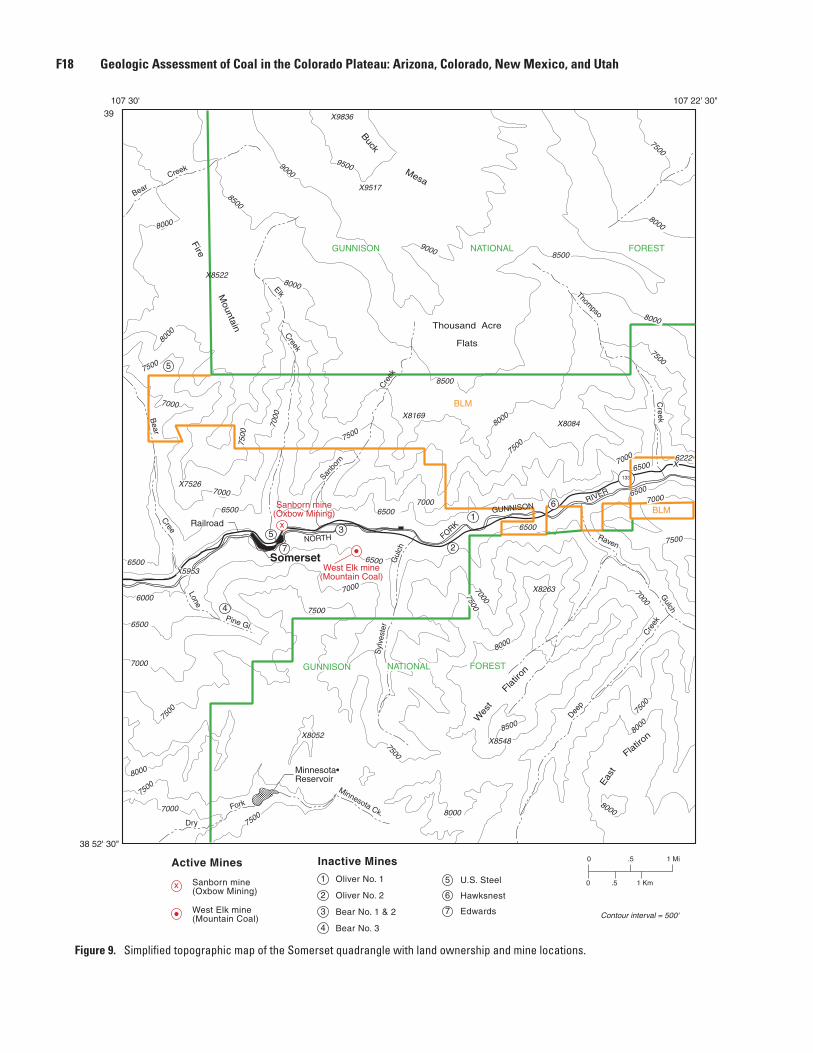
38 52' 30"
39
107 30' 107 22' 30"
IIIIIIIIIIIIIIIIIIIIIIIIIIIIIIIIIIIIIIIIIII
IIIIIIIIIIIIIIIIIIIIIIIIIIIIIIIIIIIIIIIIIIIIIIIIIIII
133
Somerset
Railroad
Minnesota•Reservoir
0 .5 1 Mi
0 .5 1 Km
5
5
4
3
2
1
6
West Elk mine(Mountain Coal)
x
Sanborn mine(Oxbow Mining)
7
x Sanborn mine(Oxbow Mining)
West Elk mine(Mountain Coal)
Active Mines Inactive Mines
1
2
3
4
5
6
7
Oliver No. 1
Oliver No. 2
Bear No. 1 & 2
Bear No. 3
U.S. Steel
Hawksnest
Edwards
X8522
8500
8000
7500
7000
8500
900075
00
7000
8500
8000
7500
90009500
8000
7500
7000
8000
7500
7000
8000
6500
6500
6000
6500
7000
7500
X8052
7500
7000
6500
6500
70007500
8000
7500
70006500
7000
7500
8000
80008000
7500
7500
65007000
7500
8000
X9517
GUNNISON NATIONAL FOREST
Thousand Acre
Flats
Bear
Creek
Thompso
Creek
Fire
Mountain
ElkC
reek
Buck
Mesa
X8169Bear
Cree
X7526
6500
Sanbo
rn
Cre
ek
X8084
X8263
Creek
Gulch
Deep
Gul
ch
Syl
vest
er
8500
X8548
8000
7500
7000
Flatiron
Eas
t
Flatir
on
Wes
t
FORK
NORTH
GUNNISONRIVER
Raven
Pine Gl.Lone
GUNNISON NATIONAL FOREST
Contour interval = 500'
X5953
6222X
X9836
Minnesota Ck.Fork
Dry
BLM
BLM
Figure 9. Simplifi ed topographic map of the Somerset quadrangle with land ownership and mine locations.
F18 Geologic Assessment of Coal in the Colorado Plateau: Arizona, Colorado, New Mexico, and Utah
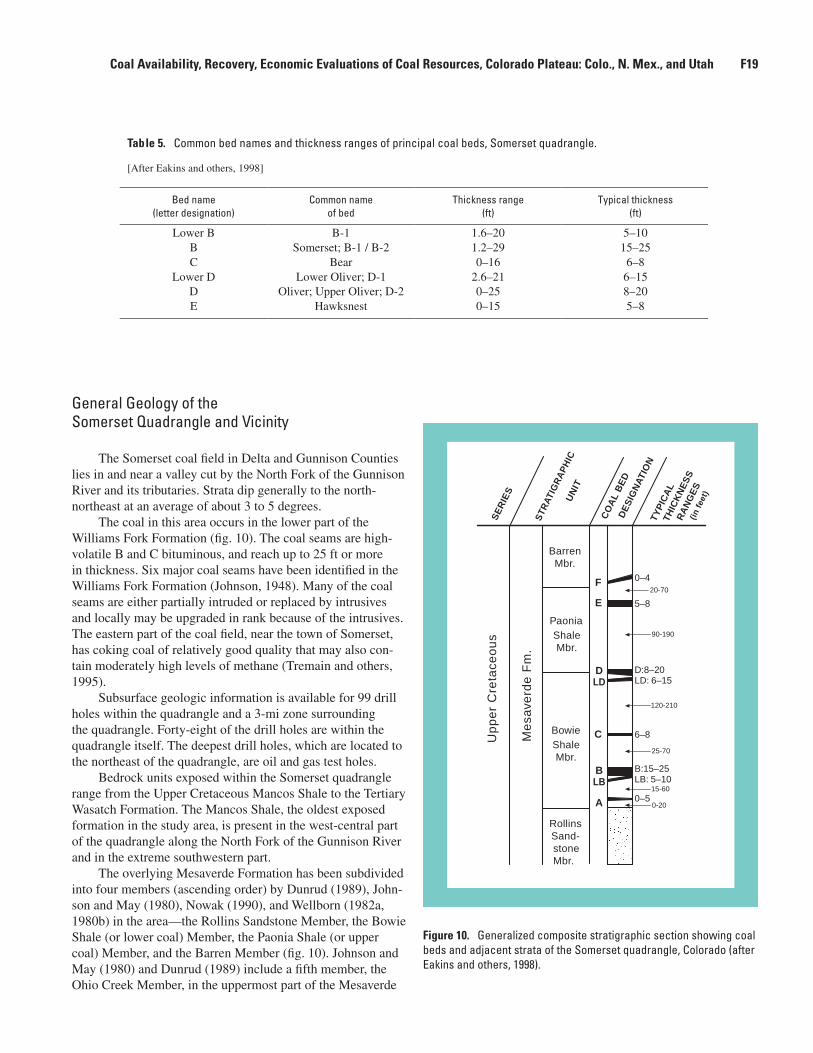
Up
pe
r C
reta
ceo
us
RollinsSand-stoneMbr.
PaoniaShaleMbr.
BarrenMbr.
BowieShaleMbr.
F 0–4
5–8
D:8–20
6–8
0–5
20-70
90-190
120-210
25-70
15-60
0-20
TYP
ICA
L T
HIC
KN
ES
S
(in
feet
)
SE
RIE
S
CO
AL
BE
D
STR
ATIG
RA
PH
ICU
NIT
LD: 6–15
C
DLD
E
A
BLB
B:15–25LB: 5–10
Me
save
rde
Fm
.
DE
SIG
NAT
ION
RA
NG
ES
Figure 10. Generalized composite stratigraphic section showing coal beds and adjacent strata of the Somerset quadrangle, Colorado (after Eakins and others, 1998).
General Geology of the Somerset Quadrangle and Vicinity
The Somerset coal fi eld in Delta and Gunnison Counties lies in and near a valley cut by the North Fork of the Gunnison River and its tributaries. Strata dip generally to the north-northeast at an average of about 3 to 5 degrees.
The coal in this area occurs in the lower part of the Williams Fork Formation (fi g. 10). The coal seams are high-volatile B and C bituminous, and reach up to 25 ft or more in thickness. Six major coal seams have been identifi ed in the Williams Fork Formation (Johnson, 1948). Many of the coal seams are either partially intruded or replaced by intrusives and locally may be upgraded in rank because of the intrusives. The eastern part of the coal fi eld, near the town of Somerset, has coking coal of relatively good quality that may also con-tain moderately high levels of methane (Tremain and others, 1995).
Subsurface geologic information is available for 99 drill holes within the quadrangle and a 3-mi zone surrounding the quadrangle. Forty-eight of the drill holes are within the quadrangle itself. The deepest drill holes, which are located to the northeast of the quadrangle, are oil and gas test holes.
Bedrock units exposed within the Somerset quadrangle range from the Upper Cretaceous Mancos Shale to the Tertiary Wasatch Formation. The Mancos Shale, the oldest exposed formation in the study area, is present in the west-central part of the quadrangle along the North Fork of the Gunnison River and in the extreme southwestern part.
The overlying Mesaverde Formation has been subdivided into four members (ascending order) by Dunrud (1989), John-son and May (1980), Nowak (1990), and Wellborn (1982a, 1980b) in the area—the Rollins Sandstone Member, the Bowie Shale (or lower coal) Member, the Paonia Shale (or upper coal) Member, and the Barren Member (fi g. 10). Johnson and May (1980) and Dunrud (1989) include a fi fth member, the Ohio Creek Member, in the uppermost part of the Mesaverde
Table 5. Common bed names and thickness ranges of principal coal beds, Somerset quadrangle.
[After Eakins and others, 1998]
Bed name (letter designation)
Common name of bed
Thickness range (ft)
Typical thickness (ft)
Lower B B-1 1.6–20 5–10 B Somerset; B-1 / B-2 1.2–29 15–25 C Bear 0–16 6–8
Lower D Lower Oliver; D-1 2.6–21 6–15 D Oliver; Upper Oliver; D-2 0–25 8–20 E Hawksnest 0–15 5–8
Coal Availability, Recovery, Economic Evaluations of Coal Resources, Colorado Plateau: Colo., N. Mex., and Utah F19
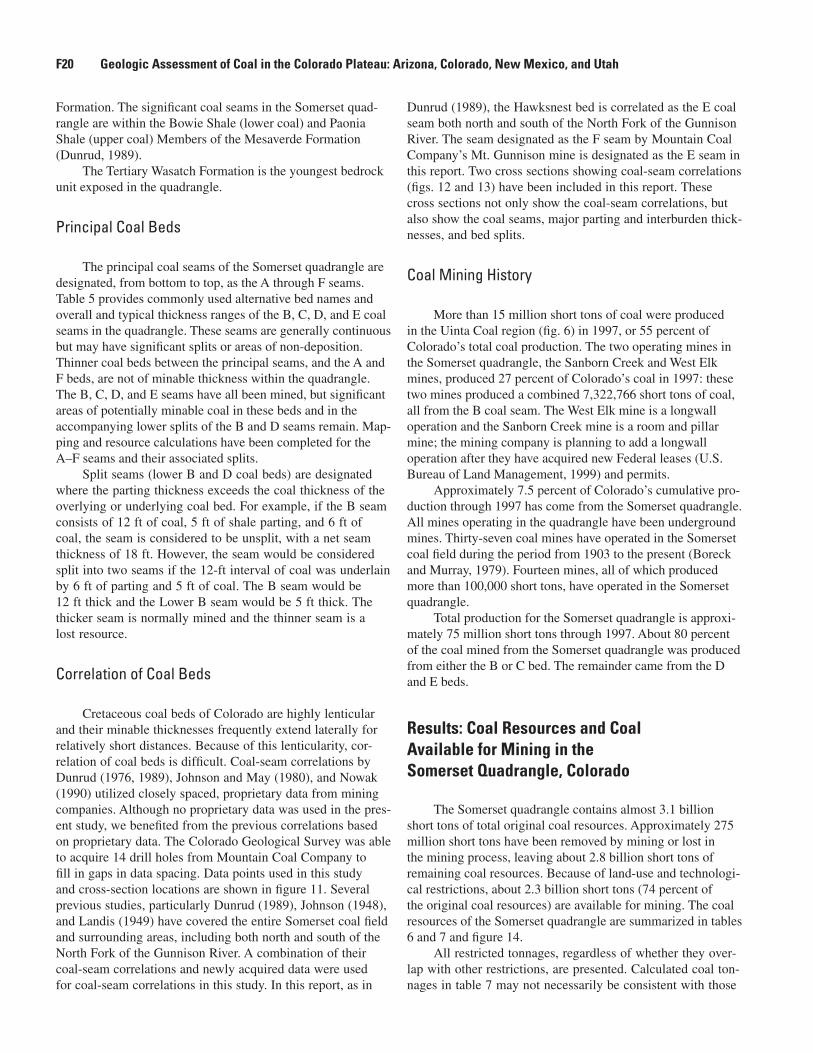
Formation. The signifi cant coal seams in the Somerset quad-rangle are within the Bowie Shale (lower coal) and Paonia Shale (upper coal) Members of the Mesaverde Formation (Dunrud, 1989).
The Tertiary Wasatch Formation is the youngest bedrock unit exposed in the quadrangle.
Principal Coal Beds
The principal coal seams of the Somerset quadrangle are designated, from bottom to top, as the A through F seams. Table 5 provides commonly used alternative bed names and overall and typical thickness ranges of the B, C, D, and E coal seams in the quadrangle. These seams are generally continuous but may have signifi cant splits or areas of non-deposition. Thinner coal beds between the principal seams, and the A and F beds, are not of minable thickness within the quadrangle. The B, C, D, and E seams have all been mined, but signifi cant areas of potentially minable coal in these beds and in the accompanying lower splits of the B and D seams remain. Map-ping and resource calculations have been completed for the A–F seams and their associated splits.
Split seams (lower B and D coal beds) are designated where the parting thickness exceeds the coal thickness of the overlying or underlying coal bed. For example, if the B seam consists of 12 ft of coal, 5 ft of shale parting, and 6 ft of coal, the seam is considered to be unsplit, with a net seam thickness of 18 ft. However, the seam would be considered split into two seams if the 12-ft interval of coal was underlain by 6 ft of parting and 5 ft of coal. The B seam would be 12 ft thick and the Lower B seam would be 5 ft thick. The thicker seam is normally mined and the thinner seam is a lost resource.
Correlation of Coal Beds
Cretaceous coal beds of Colorado are highly lenticular and their minable thicknesses frequently extend laterally for relatively short distances. Because of this lenticularity, cor-relation of coal beds is diffi cult. Coal-seam correlations by Dunrud (1976, 1989), Johnson and May (1980), and Nowak (1990) utilized closely spaced, proprietary data from mining companies. Although no proprietary data was used in the pres-ent study, we benefi ted from the previous correlations based on proprietary data. The Colorado Geological Survey was able to acquire 14 drill holes from Mountain Coal Company to fi ll in gaps in data spacing. Data points used in this study and cross-section locations are shown in fi gure 11. Several previous studies, particularly Dunrud (1989), Johnson (1948), and Landis (1949) have covered the entire Somerset coal fi eld and surrounding areas, including both north and south of the North Fork of the Gunnison River. A combination of their coal-seam correlations and newly acquired data were used for coal-seam correlations in this study. In this report, as in
Dunrud (1989), the Hawksnest bed is correlated as the E coal seam both north and south of the North Fork of the Gunnison River. The seam designated as the F seam by Mountain Coal Company’s Mt. Gunnison mine is designated as the E seam in this report. Two cross sections showing coal-seam correlations (fi gs. 12 and 13) have been included in this report. These cross sections not only show the coal-seam correlations, but also show the coal seams, major parting and interburden thick-nesses, and bed splits.
Coal Mining History
More than 15 million short tons of coal were produced in the Uinta Coal region (fi g. 6) in 1997, or 55 percent of Colorado’s total coal production. The two operating mines in the Somerset quadrangle, the Sanborn Creek and West Elk mines, produced 27 percent of Colorado’s coal in 1997: these two mines produced a combined 7,322,766 short tons of coal, all from the B coal seam. The West Elk mine is a longwall operation and the Sanborn Creek mine is a room and pillar mine; the mining company is planning to add a longwall operation after they have acquired new Federal leases (U.S. Bureau of Land Management, 1999) and permits.
Approximately 7.5 percent of Colorado’s cumulative pro-duction through 1997 has come from the Somerset quadrangle. All mines operating in the quadrangle have been underground mines. Thirty-seven coal mines have operated in the Somerset coal fi eld during the period from 1903 to the present (Boreck and Murray, 1979). Fourteen mines, all of which produced more than 100,000 short tons, have operated in the Somerset quadrangle.
Total production for the Somerset quadrangle is approxi-mately 75 million short tons through 1997. About 80 percent of the coal mined from the Somerset quadrangle was produced from either the B or C bed. The remainder came from the D and E beds.
Results: Coal Resources and Coal Available for Mining in the Somerset Quadrangle, Colorado
The Somerset quadrangle contains almost 3.1 billion short tons of total original coal resources. Approximately 275 million short tons have been removed by mining or lost in the mining process, leaving about 2.8 billion short tons of remaining coal resources. Because of land-use and technologi-cal restrictions, about 2.3 billion short tons (74 percent of the original coal resources) are available for mining. The coal resources of the Somerset quadrangle are summarized in tables 6 and 7 and fi gure 14.
All restricted tonnages, regardless of whether they over-lap with other restrictions, are presented. Calculated coal ton-nages in table 7 may not necessarily be consistent with those
F20 Geologic Assessment of Coal in the Colorado Plateau: Arizona, Colorado, New Mexico, and Utah
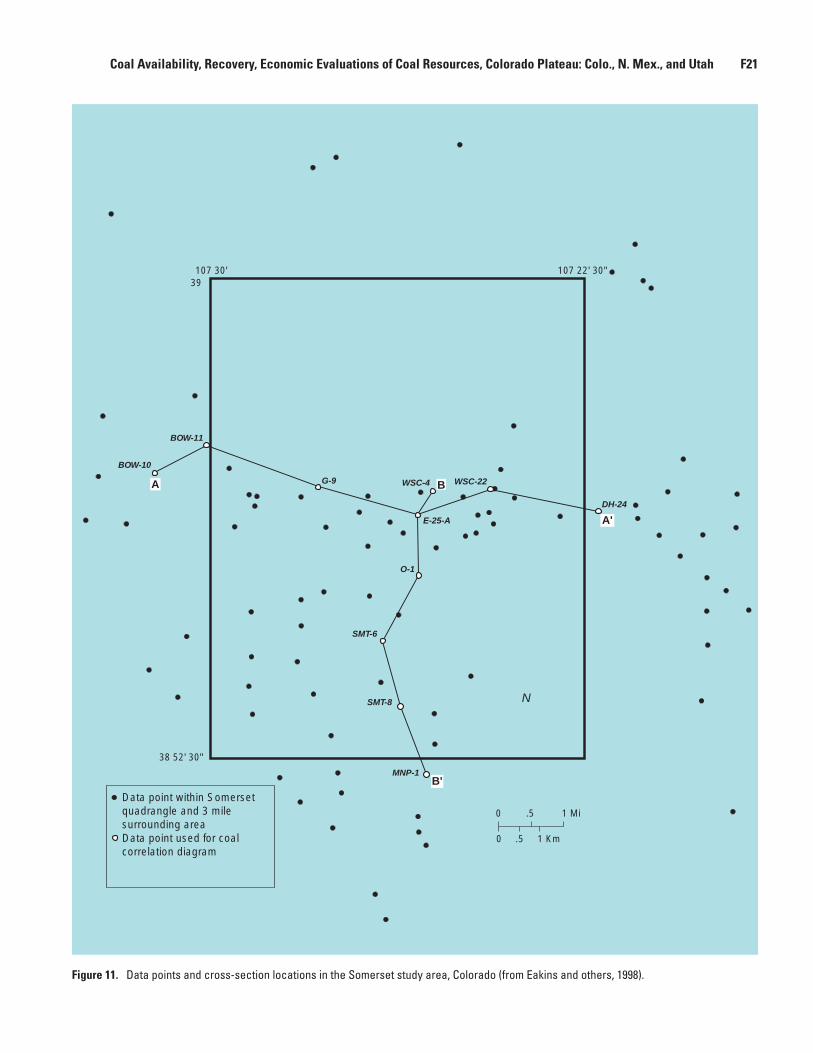
N
Data point within Somerset quadrangle and 3 mile surrounding areaData point used for coal correlation diagram
E-25-A
0 .5 1 Mi
0 .5 1 Km
38 52' 30"
39 107 30' 107 22' 30"
A
BOW-10
BOW-11
G-9 BWSC-4
O-1
SMT-6
B'
SMT-8
MNP-1
A'
DH-24
WSC-22
Figure 11. Data points and cross-section locations in the Somerset study area, Colorado (from Eakins and others, 1998).
Coal Availability, Recovery, Economic Evaluations of Coal Resources, Colorado Plateau: Colo., N. Mex., and Utah F21
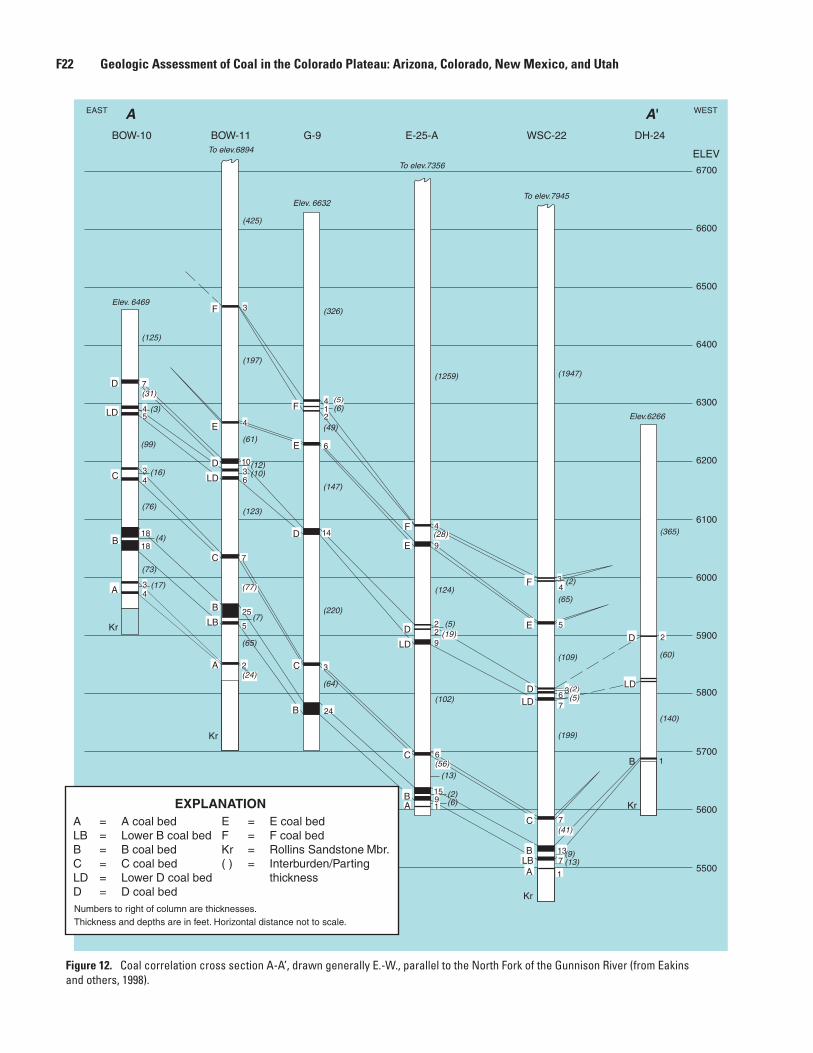
1
6700
6600
6500
6400
6300
6200
6100
6000
5900
5800
5700
5600Kr
Elev.6266
(1947)
B
(365)
(60)
To elev.7945
WSC-22 DH-24
Kr
Kr
Kr
E-25-A
To elev.7356
G-9
Elev. 6632
BOW-11
5500
To elev.6894
Elev. 6469
BOW-10
(140)
ELEV
EAST WEST
A = A coal bedLB = Lower B coal bedB = B coal bedC = C coal bedLD = Lower D coal bedD = D coal bed
E = E coal bedF = F coal bedKr = Rollins Sandstone ( ) = Interburden/Parting
thickness
Mbr.
Thickness and depths are in feet. Horizontal distance not to scale.Numbers to right of column are thicknesses.
EXPLANATION
2D
D
5
367
E
F 34
LD
(109)
(65)
(199)
7
713(9)
(13)1A
BLB
6C
15(6)
(13)
1AB
LD
(102)24B
(64)
3CA
(65)
(220)
9(19)D(5)
22
(124)
9
4(28)
(2)
E
F
(1259)
D
E
F
(147)
(49)
14
6
214
(6)(5)
4
(61)
10
7
(123)
6(10)(12)
LB 5
(77)
B 25(7)
C
18 (4)18
(17)
43 (16)
A
B
C
(73)
(76)
LD
E
F 3
(197)
(125)
D
5LD (3)
(99)
(326)
(31)
(425)
(24)
A'A
D
4
(2)9
(41)
(5)
LD
C
(56)
(2)
7
4
3
3
2
Figure 12. Coal correlation cross section A-A’, drawn generally E.-W., parallel to the North Fork of the Gunnison River (from Eakins and others, 1998).
F22 Geologic Assessment of Coal in the Colorado Plateau: Arizona, Colorado, New Mexico, and Utah
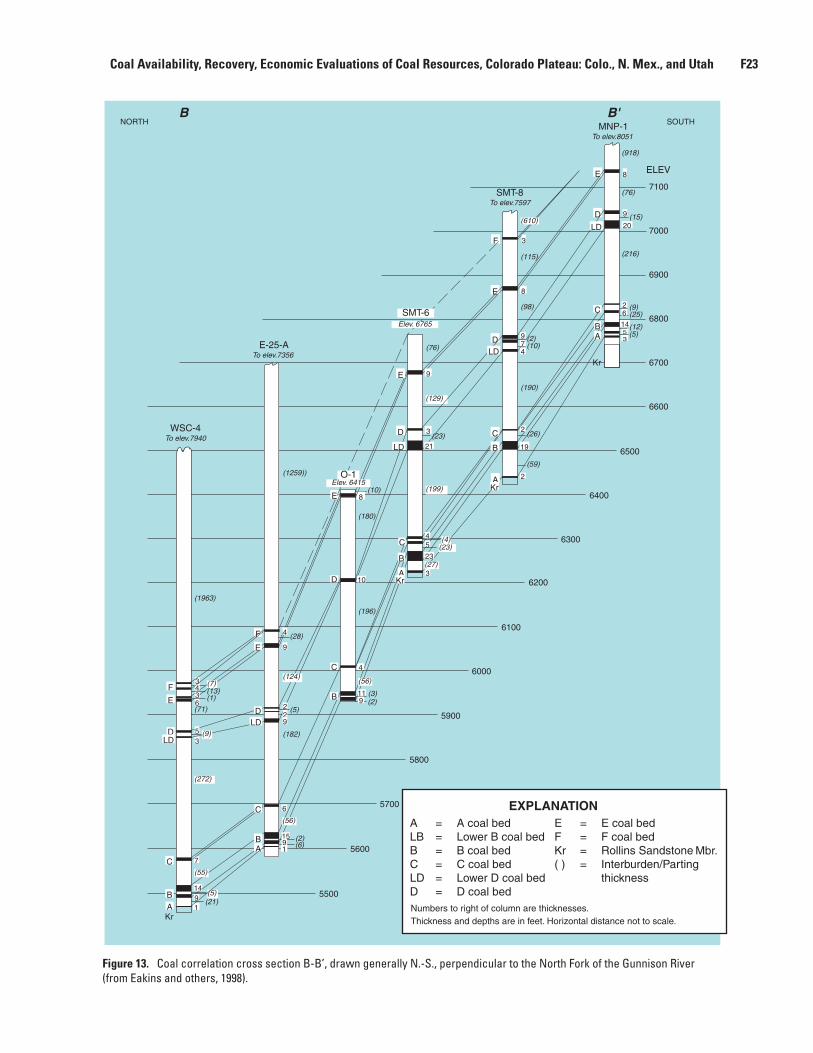
7100
7000
6900
6800
6700
6600
6500
6400
6300
6200
6100
6000
5900
5800
5700
5600
5500
NORTH SOUTH
8
(2)(10)
E
D
3(23)
(76)
A
1
(2)
(129)
D
E
(180)
8(10)
(28)
(5)
(6)
6
(2)
3
F
(71)
F
(182)
(1963)
(1259))
To elev.7597SMT-8
MNP-1
To elev.7356E-25-A
To elev.7940WSC-4
Kr
(190)
Kr
(216)
To elev.8051
514
(25)
(12)
3(5)
(9)26
20(15)D
(76)
8
9
E
3F
(115)
974
(98)
C 2
2A
(26)
(59)
9E
D
LD
(199)
5
23
310
(196)
A
C
C 4
119
(3)B
9
29
(124)
B
(56)
159
B
C
1(21)
7
(5)
(55)
149
(272)
ED
LDD
LD5 (9)
6(1)3 (13)4
3 (7)
O-1Elev. 6415
Elev. 6765SMT-6
(610)
C
21 19
Kr
Kr
4
2
B'B
LD
LD
A
(23)(4)
(56)
(27)
C
A
B
4
B
B
E
(918)
ELEV
A = A coal bedLB = Lower B coal bedB = B coal bedC = C coal bedLD = Lower D coal bedD = D coal bed
E = E coal bedF = F coal bedKr = Rollins Sandstone ( ) = Interburden/Parting
thickness
Thickness and depths are in feet. Horizontal distance not to scale.Numbers to right of column are thicknesses.
EXPLANATION
Mbr.
Figure 13. Coal correlation cross section B-B’, drawn generally N.-S., perpendicular to the North Fork of the Gunnison River (from Eakins and others, 1998).
Coal Availability, Recovery, Economic Evaluations of Coal Resources, Colorado Plateau: Colo., N. Mex., and Utah F23
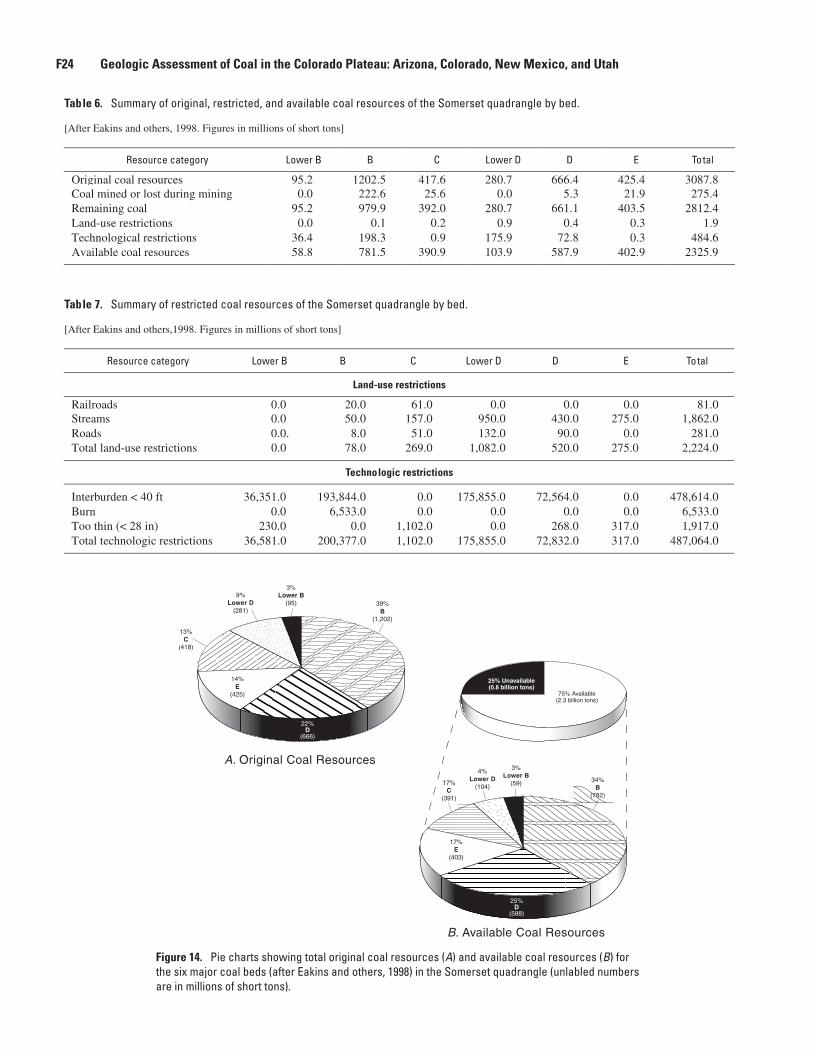
3%Lower B
(95)9%
Lower D(281)
13%C
(418)
14%E
(425)
39%B
(1,202)
22%D
(666)
25%D
(588)
3%Lower B
(59)
4%Lower D
(104)17%
C(391)
17%E
(403)
34%B
(782)
75% Available(2.3 billion tons)
25% Unavailable(0.8 billion tons)
A. Original Coal Resources
B. Available Coal Resources
Figure 14. Pie charts showing total original coal resources (A) and available coal resources (B) for the six major coal beds (after Eakins and others, 1998) in the Somerset quadrangle (unlabled numbers are in millions of short tons).
Table 6. Summary of original, restricted, and available coal resources of the Somerset quadrangle by bed.
[After Eakins and others, 1998. Figures in millions of short tons]
Resource category Lower B B C Lower D D E Total
Original coal resources 95.2 1202.5 417.6 280.7 666.4 425.4 3087.8 Coal mined or lost during mining 0.0 222.6 25.6 0.0 5.3 21.9 275.4 Remaining coal 95.2 979.9 392.0 280.7 661.1 403.5 2812.4 Land-use restrictions 0.0 0.1 0.2 0.9 0.4 0.3 1.9 Technological restrictions 36.4 198.3 0.9 175.9 72.8 0.3 484.6 Available coal resources 58.8 781.5 390.9 103.9 587.9 402.9 2325.9
Table 7. Summary of restricted coal resources of the Somerset quadrangle by bed.
[After Eakins and others,1998. Figures in millions of short tons]
Resource category Lower B B C Lower D D E Total
Land-use restrictions
Railroads 0.0 20.0 61.0 0.0 0.0 0.0 81.0 Streams 0.0 50.0 157.0 950.0 430.0 275.0 1,862.0 Roads 0.0. 8.0 51.0 132.0 90.0 0.0 281.0 Total land-use restrictions 0.0 78.0 269.0 1,082.0 520.0 275.0 2,224.0
Technologic restrictions
Interburden < 40 ft 36,351.0 193,844.0 0.0 175,855.0 72,564.0 0.0 478,614.0 Burn 0.0 6,533.0 0.0 0.0 0.0 0.0 6,533.0 Too thin (< 28 in) 230.0 0.0 1,102.0 0.0 268.0 317.0 1,917.0 Total technologic restrictions 36,581.0 200,377.0 1,102.0 175,855.0 72,832.0 317.0 487,064.0
F24 Geologic Assessment of Coal in the Colorado Plateau: Arizona, Colorado, New Mexico, and Utah
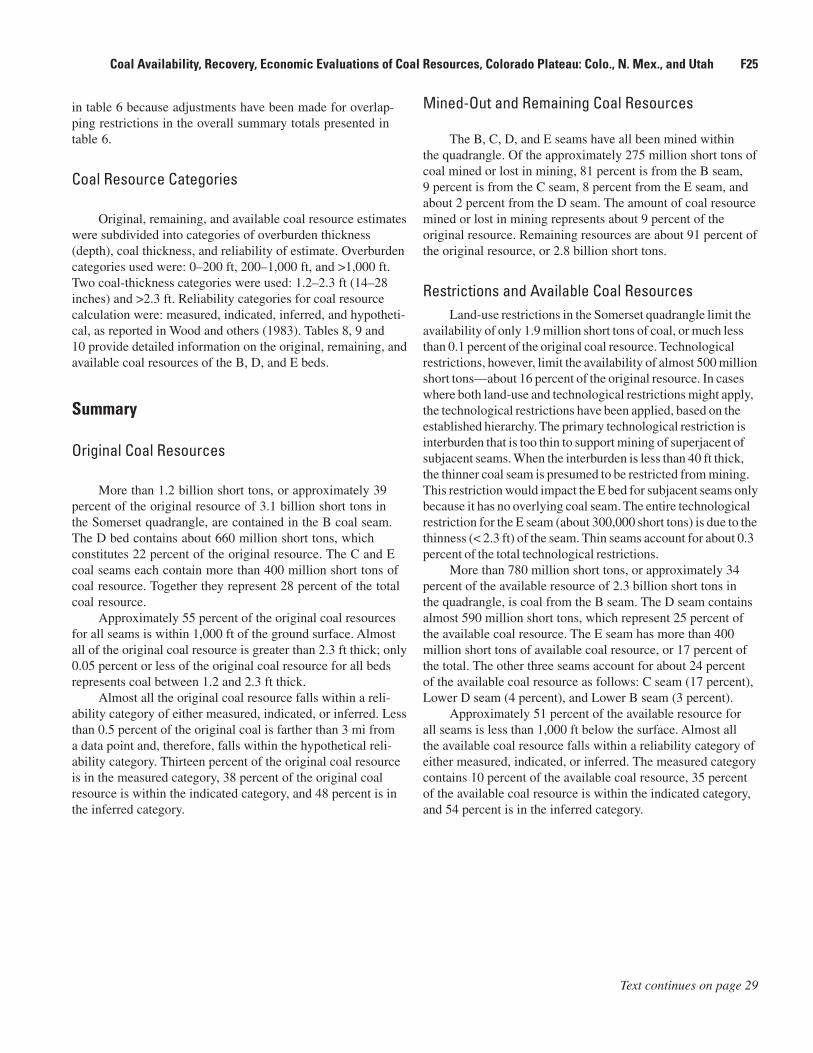
in table 6 because adjustments have been made for overlap-ping restrictions in the overall summary totals presented in table 6.
Coal Resource Categories
Original, remaining, and available coal resource estimates were subdivided into categories of overburden thickness (depth), coal thickness, and reliability of estimate. Overburden categories used were: 0–200 ft, 200–1,000 ft, and >1,000 ft. Two coal-thickness categories were used: 1.2–2.3 ft (14–28 inches) and >2.3 ft. Reliability categories for coal resource calculation were: measured, indicated, inferred, and hypotheti-cal, as reported in Wood and others (1983). Tables 8, 9 and 10 provide detailed information on the original, remaining, and available coal resources of the B, D, and E beds.
Summary
Original Coal Resources
More than 1.2 billion short tons, or approximately 39 percent of the original resource of 3.1 billion short tons in the Somerset quadrangle, are contained in the B coal seam. The D bed contains about 660 million short tons, which constitutes 22 percent of the original resource. The C and E coal seams each contain more than 400 million short tons of coal resource. Together they represent 28 percent of the total coal resource.
Approximately 55 percent of the original coal resources for all seams is within 1,000 ft of the ground surface. Almost all of the original coal resource is greater than 2.3 ft thick; only 0.05 percent or less of the original coal resource for all beds represents coal between 1.2 and 2.3 ft thick.
Almost all the original coal resource falls within a reli-ability category of either measured, indicated, or inferred. Less than 0.5 percent of the original coal is farther than 3 mi from a data point and, therefore, falls within the hypothetical reli-ability category. Thirteen percent of the original coal resource is in the measured category, 38 percent of the original coal resource is within the indicated category, and 48 percent is in the inferred category.
Mined-Out and Remaining Coal Resources
The B, C, D, and E seams have all been mined within the quadrangle. Of the approximately 275 million short tons of coal mined or lost in mining, 81 percent is from the B seam, 9 percent is from the C seam, 8 percent from the E seam, and about 2 percent from the D seam. The amount of coal resource mined or lost in mining represents about 9 percent of the original resource. Remaining resources are about 91 percent of the original resource, or 2.8 billion short tons.
Restrictions and Available Coal ResourcesLand-use restrictions in the Somerset quadrangle limit the
availability of only 1.9 million short tons of coal, or much less than 0.1 percent of the original coal resource. Technological restrictions, however, limit the availability of almost 500 million short tons—about 16 percent of the original resource. In cases where both land-use and technological restrictions might apply, the technological restrictions have been applied, based on the established hierarchy. The primary technological restriction is interburden that is too thin to support mining of superjacent of subjacent seams. When the interburden is less than 40 ft thick, the thinner coal seam is presumed to be restricted from mining. This restriction would impact the E bed for subjacent seams only because it has no overlying coal seam. The entire technological restriction for the E seam (about 300,000 short tons) is due to the thinness (< 2.3 ft) of the seam. Thin seams account for about 0.3 percent of the total technological restrictions.
More than 780 million short tons, or approximately 34 percent of the available resource of 2.3 billion short tons in the quadrangle, is coal from the B seam. The D seam contains almost 590 million short tons, which represent 25 percent of the available coal resource. The E seam has more than 400 million short tons of available coal resource, or 17 percent of the total. The other three seams account for about 24 percent of the available coal resource as follows: C seam (17 percent), Lower D seam (4 percent), and Lower B seam (3 percent).
Approximately 51 percent of the available resource for all seams is less than 1,000 ft below the surface. Almost all the available coal resource falls within a reliability category of either measured, indicated, or inferred. The measured category contains 10 percent of the available coal resource, 35 percent of the available coal resource is within the indicated category, and 54 percent is in the inferred category.
Text continues on page 29
Coal Availability, Recovery, Economic Evaluations of Coal Resources, Colorado Plateau: Colo., N. Mex., and Utah F25
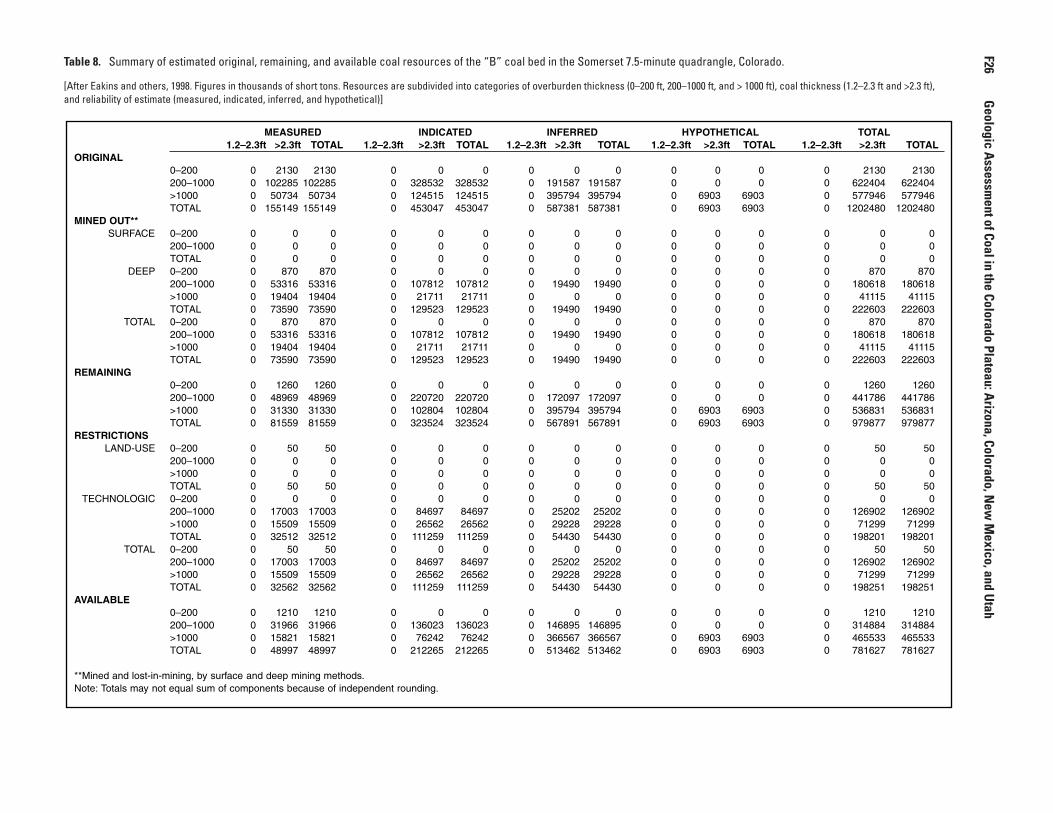
Table 8. Summary of estimated original, remaining, and available coal resources of the “B” coal bed in the Somerset 7.5-minute quadrangle, Colorado.
[After Eakins and others, 1998. Figures in thousands of short tons. Resources are subdivided into categories of overburden thickness (0–200 ft, 200–1000 ft, and > 1000 ft), coal thickness (1.2–2.3 ft and >2.3 ft), and reliability of estimate (measured, indicated, inferred, and hypothetical)]
MEASURED INDICATED INFERRED HYPOTHETICAL TOTAL1.2–2.3ft >2.3ft TOTAL 1.2–2.3ft >2.3ft TOTAL 1.2–2.3ft >2.3ft TOTAL 1.2–2.3ft >2.3ft TOTAL 1.2–2.3ft >2.3ft TOTAL
ORIGINAL0–200 0 2130 2130 0 0 0 0 0 0 0 0 0 0 2130 2130200–1000 0 102285 102285 0 328532 328532 0 191587 191587 0 0 0 0 622404 622404>1000 0 50734 50734 0 124515 124515 0 395794 395794 0 6903 6903 0 577946 577946TOTAL 0 155149 155149 0 453047 453047 0 587381 587381 0 6903 6903 0 1202480 1202480
MINED OUT**SURFACE 0–200 0 0 0 0 0 0 0 0 0 0 0 0 0 0 0
200–1000 0 0 0 0 0 0 0 0 0 0 0 0 0 0 0TOTAL 0 0 0 0 0 0 0 0 0 0 0 0 0 0 0
DEEP 0–200 0 870 870 0 0 0 0 0 0 0 0 0 0 870 870200–1000 0 53316 53316 0 107812 107812 0 19490 19490 0 0 0 0 180618 180618>1000 0 19404 19404 0 21711 21711 0 0 0 0 0 0 0 41115 41115TOTAL 0 73590 73590 0 129523 129523 0 19490 19490 0 0 0 0 222603 222603
TOTAL 0–200 0 870 870 0 0 0 0 0 0 0 0 0 0 870 870200–1000 0 53316 53316 0 107812 107812 0 19490 19490 0 0 0 0 180618 180618>1000 0 19404 19404 0 21711 21711 0 0 0 0 0 0 0 41115 41115TOTAL 0 73590 73590 0 129523 129523 0 19490 19490 0 0 0 0 222603 222603
REMAINING0–200 0 1260 1260 0 0 0 0 0 0 0 0 0 0 1260 1260200–1000 0 48969 48969 0 220720 220720 0 172097 172097 0 0 0 0 441786 441786>1000 0 31330 31330 0 102804 102804 0 395794 395794 0 6903 6903 0 536831 536831TOTAL 0 81559 81559 0 323524 323524 0 567891 567891 0 6903 6903 0 979877 979877
RESTRICTIONSLAND-USE 0–200 0 50 50 0 0 0 0 0 0 0 0 0 0 50 50
200–1000 0 0 0 0 0 0 0 0 0 0 0 0 0 0 0>1000 0 0 0 0 0 0 0 0 0 0 0 0 0 0 0TOTAL 0 50 50 0 0 0 0 0 0 0 0 0 0 50 50
TECHNOLOGIC 0–200 0 0 0 0 0 0 0 0 0 0 0 0 0 0 0200–1000 0 17003 17003 0 84697 84697 0 25202 25202 0 0 0 0 126902 126902>1000 0 15509 15509 0 26562 26562 0 29228 29228 0 0 0 0 71299 71299TOTAL 0 32512 32512 0 111259 111259 0 54430 54430 0 0 0 0 198201 198201
TOTAL 0–200 0 50 50 0 0 0 0 0 0 0 0 0 0 50 50200–1000 0 17003 17003 0 84697 84697 0 25202 25202 0 0 0 0 126902 126902>1000 0 15509 15509 0 26562 26562 0 29228 29228 0 0 0 0 71299 71299TOTAL 0 32562 32562 0 111259 111259 0 54430 54430 0 0 0 0 198251 198251
AVAILABLE0–200 0 1210 1210 0 0 0 0 0 0 0 0 0 0 1210 1210200–1000 0 31966 31966 0 136023 136023 0 146895 146895 0 0 0 0 314884 314884>1000 0 15821 15821 0 76242 76242 0 366567 366567 0 6903 6903 0 465533 465533TOTAL 0 48997 48997 0 212265 212265 0 513462 513462 0 6903 6903 0 781627 781627
**Mined and lost-in-mining, by surface and deep mining methods.Note: Totals may not equal sum of components because of independent rounding.
F26
Geologic A
ssessment of Coal in the Colorado Plateau: A
rizona, Colorado, New
Mexico, and U
tah
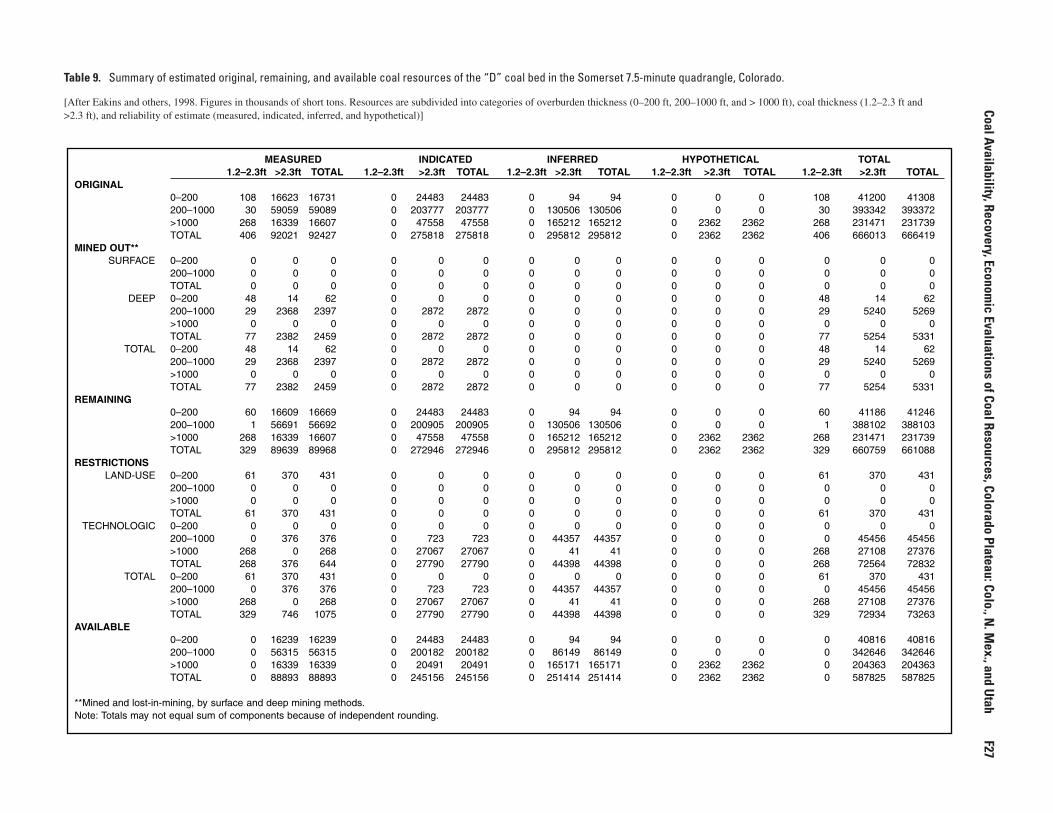
Table 9. Summary of estimated original, remaining, and available coal resources of the “D” coal bed in the Somerset 7.5-minute quadrangle, Colorado.
[After Eakins and others, 1998. Figures in thousands of short tons. Resources are subdivided into categories of overburden thickness (0–200 ft, 200–1000 ft, and > 1000 ft), coal thickness (1.2–2.3 ft and >2.3 ft), and reliability of estimate (measured, indicated, inferred, and hypothetical)]
MEASURED INDICATED INFERRED HYPOTHETICAL TOTAL1.2–2.3ft >2.3ft TOTAL 1.2–2.3ft >2.3ft TOTAL 1.2–2.3ft >2.3ft TOTAL 1.2–2.3ft >2.3ft TOTAL 1.2–2.3ft >2.3ft TOTAL
ORIGINAL0–200 108 16623 16731 0 24483 24483 0 94 94 0 0 0 108 41200 41308200–1000 30 59059 59089 0 203777 203777 0 130506 130506 0 0 0 30 393342 393372>1000 268 16339 16607 0 47558 47558 0 165212 165212 0 2362 2362 268 231471 231739TOTAL 406 92021 92427 0 275818 275818 0 295812 295812 0 2362 2362 406 666013 666419
MINED OUT**SURFACE 0–200 0 0 0 0 0 0 0 0 0 0 0 0 0 0 0
200–1000 0 0 0 0 0 0 0 0 0 0 0 0 0 0 0TOTAL 0 0 0 0 0 0 0 0 0 0 0 0 0 0 0
DEEP 0–200 48 14 62 0 0 0 0 0 0 0 0 0 48 14 62200–1000 29 2368 2397 0 2872 2872 0 0 0 0 0 0 29 5240 5269>1000 0 0 0 0 0 0 0 0 0 0 0 0 0 0 0TOTAL 77 2382 2459 0 2872 2872 0 0 0 0 0 0 77 5254 5331
TOTAL 0–200 48 14 62 0 0 0 0 0 0 0 0 0 48 14 62200–1000 29 2368 2397 0 2872 2872 0 0 0 0 0 0 29 5240 5269>1000 0 0 0 0 0 0 0 0 0 0 0 0 0 0 0TOTAL 77 2382 2459 0 2872 2872 0 0 0 0 0 0 77 5254 5331
REMAINING0–200 60 16609 16669 0 24483 24483 0 94 94 0 0 0 60 41186 41246200–1000 1 56691 56692 0 200905 200905 0 130506 130506 0 0 0 1 388102 388103>1000 268 16339 16607 0 47558 47558 0 165212 165212 0 2362 2362 268 231471 231739TOTAL 329 89639 89968 0 272946 272946 0 295812 295812 0 2362 2362 329 660759 661088
RESTRICTIONSLAND-USE 0–200 61 370 431 0 0 0 0 0 0 0 0 0 61 370 431
200–1000 0 0 0 0 0 0 0 0 0 0 0 0 0 0 0>1000 0 0 0 0 0 0 0 0 0 0 0 0 0 0 0TOTAL 61 370 431 0 0 0 0 0 0 0 0 0 61 370 431
TECHNOLOGIC 0–200 0 0 0 0 0 0 0 0 0 0 0 0 0 0 0200–1000 0 376 376 0 723 723 0 44357 44357 0 0 0 0 45456 45456>1000 268 0 268 0 27067 27067 0 41 41 0 0 0 268 27108 27376TOTAL 268 376 644 0 27790 27790 0 44398 44398 0 0 0 268 72564 72832
TOTAL 0–200 61 370 431 0 0 0 0 0 0 0 0 0 61 370 431200–1000 0 376 376 0 723 723 0 44357 44357 0 0 0 0 45456 45456>1000 268 0 268 0 27067 27067 0 41 41 0 0 0 268 27108 27376TOTAL 329 746 1075 0 27790 27790 0 44398 44398 0 0 0 329 72934 73263
AVAILABLE0–200 0 16239 16239 0 24483 24483 0 94 94 0 0 0 0 40816 40816200–1000 0 56315 56315 0 200182 200182 0 86149 86149 0 0 0 0 342646 342646>1000 0 16339 16339 0 20491 20491 0 165171 165171 0 2362 2362 0 204363 204363TOTAL 0 88893 88893 0 245156 245156 0 251414 251414 0 2362 2362 0 587825 587825
**Mined and lost-in-mining, by surface and deep mining methods.Note: Totals may not equal sum of components because of independent rounding.
Coal Availability, Recovery, Economic Evaluations of Coal Resources, Colorado Plateau: Colo., N
. Mex., and U
tah
F27
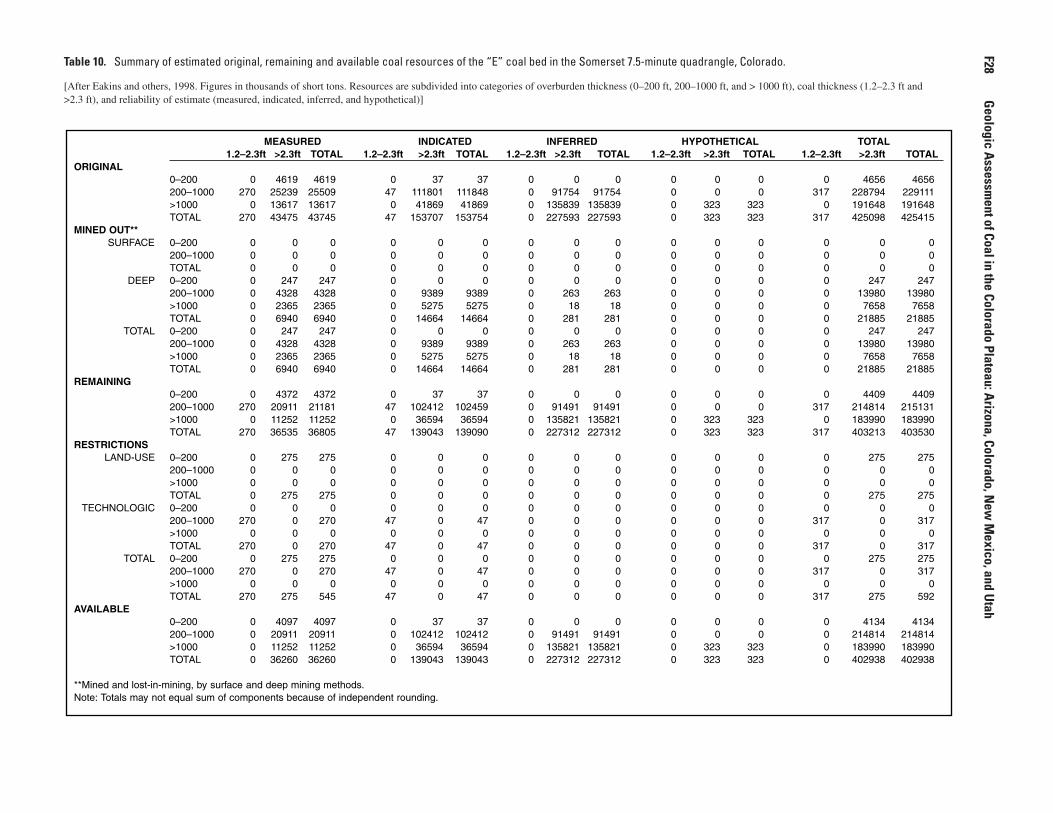
Table 10. Summary of estimated original, remaining and available coal resources of the “E” coal bed in the Somerset 7.5-minute quadrangle, Colorado.
[After Eakins and others, 1998. Figures in thousands of short tons. Resources are subdivided into categories of overburden thickness (0–200 ft, 200–1000 ft, and > 1000 ft), coal thickness (1.2–2.3 ft and >2.3 ft), and reliability of estimate (measured, indicated, inferred, and hypothetical)]
MEASURED INDICATED INFERRED HYPOTHETICAL TOTAL1.2–2.3ft >2.3ft TOTAL 1.2–2.3ft >2.3ft TOTAL 1.2–2.3ft >2.3ft TOTAL 1.2–2.3ft >2.3ft TOTAL 1.2–2.3ft >2.3ft TOTAL
ORIGINAL0–200 0 4619 4619 0 37 37 0 0 0 0 0 0 0 4656 4656200–1000 270 25239 25509 47 111801 111848 0 91754 91754 0 0 0 317 228794 229111>1000 0 13617 13617 0 41869 41869 0 135839 135839 0 323 323 0 191648 191648TOTAL 270 43475 43745 47 153707 153754 0 227593 227593 0 323 323 317 425098 425415
MINED OUT**SURFACE 0–200 0 0 0 0 0 0 0 0 0 0 0 0 0 0 0
200–1000 0 0 0 0 0 0 0 0 0 0 0 0 0 0 0TOTAL 0 0 0 0 0 0 0 0 0 0 0 0 0 0 0
DEEP 0–200 0 247 247 0 0 0 0 0 0 0 0 0 0 247 247200–1000 0 4328 4328 0 9389 9389 0 263 263 0 0 0 0 13980 13980>1000 0 2365 2365 0 5275 5275 0 18 18 0 0 0 0 7658 7658TOTAL 0 6940 6940 0 14664 14664 0 281 281 0 0 0 0 21885 21885
TOTAL 0–200 0 247 247 0 0 0 0 0 0 0 0 0 0 247 247200–1000 0 4328 4328 0 9389 9389 0 263 263 0 0 0 0 13980 13980>1000 0 2365 2365 0 5275 5275 0 18 18 0 0 0 0 7658 7658TOTAL 0 6940 6940 0 14664 14664 0 281 281 0 0 0 0 21885 21885
REMAINING0–200 0 4372 4372 0 37 37 0 0 0 0 0 0 0 4409 4409200–1000 270 20911 21181 47 102412 102459 0 91491 91491 0 0 0 317 214814 215131>1000 0 11252 11252 0 36594 36594 0 135821 135821 0 323 323 0 183990 183990TOTAL 270 36535 36805 47 139043 139090 0 227312 227312 0 323 323 317 403213 403530
RESTRICTIONSLAND-USE 0–200 0 275 275 0 0 0 0 0 0 0 0 0 0 275 275
200–1000 0 0 0 0 0 0 0 0 0 0 0 0 0 0 0>1000 0 0 0 0 0 0 0 0 0 0 0 0 0 0 0TOTAL 0 275 275 0 0 0 0 0 0 0 0 0 0 275 275
TECHNOLOGIC 0–200 0 0 0 0 0 0 0 0 0 0 0 0 0 0 0200–1000 270 0 270 47 0 47 0 0 0 0 0 0 317 0 317>1000 0 0 0 0 0 0 0 0 0 0 0 0 0 0 0TOTAL 270 0 270 47 0 47 0 0 0 0 0 0 317 0 317
TOTAL 0–200 0 275 275 0 0 0 0 0 0 0 0 0 0 275 275200–1000 270 0 270 47 0 47 0 0 0 0 0 0 317 0 317>1000 0 0 0 0 0 0 0 0 0 0 0 0 0 0 0TOTAL 270 275 545 47 0 47 0 0 0 0 0 0 317 275 592
AVAILABLE0–200 0 4097 4097 0 37 37 0 0 0 0 0 0 0 4134 4134200–1000 0 20911 20911 0 102412 102412 0 91491 91491 0 0 0 0 214814 214814>1000 0 11252 11252 0 36594 36594 0 135821 135821 0 323 323 0 183990 183990TOTAL 0 36260 36260 0 139043 139043 0 227312 227312 0 323 323 0 402938 402938
**Mined and lost-in-mining, by surface and deep mining methods.Note: Totals may not equal sum of components because of independent rounding.
F28
Geologic A
ssessment of Coal in the Colorado Plateau: A
rizona, Colorado, New
Mexico, and U
tah
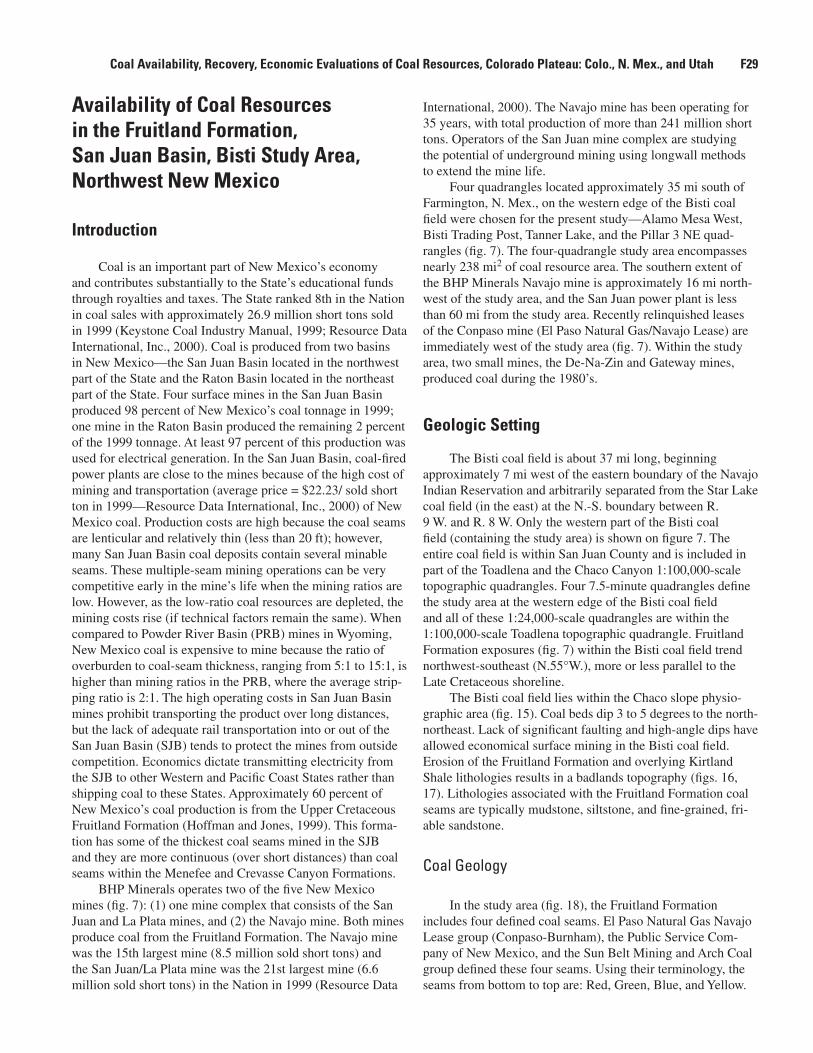
Availability of Coal Resources in the Fruitland Formation, San Juan Basin, Bisti Study Area, Northwest New Mexico
Introduction
Coal is an important part of New Mexico’s economy and contributes substantially to the State’s educational funds through royalties and taxes. The State ranked 8th in the Nation in coal sales with approximately 26.9 million short tons sold in 1999 (Keystone Coal Industry Manual, 1999; Resource Data International, Inc., 2000). Coal is produced from two basins in New Mexico—the San Juan Basin located in the northwest part of the State and the Raton Basin located in the northeast part of the State. Four surface mines in the San Juan Basin produced 98 percent of New Mexico’s coal tonnage in 1999; one mine in the Raton Basin produced the remaining 2 percent of the 1999 tonnage. At least 97 percent of this production was used for electrical generation. In the San Juan Basin, coal-fi red power plants are close to the mines because of the high cost of mining and transportation (average price = $22.23/ sold short ton in 1999—Resource Data International, Inc., 2000) of New Mexico coal. Production costs are high because the coal seams are lenticular and relatively thin (less than 20 ft); however, many San Juan Basin coal deposits contain several minable seams. These multiple-seam mining operations can be very competitive early in the mine’s life when the mining ratios are low. However, as the low-ratio coal resources are depleted, the mining costs rise (if technical factors remain the same). When compared to Powder River Basin (PRB) mines in Wyoming, New Mexico coal is expensive to mine because the ratio of overburden to coal-seam thickness, ranging from 5:1 to 15:1, is higher than mining ratios in the PRB, where the average strip-ping ratio is 2:1. The high operating costs in San Juan Basin mines prohibit transporting the product over long distances, but the lack of adequate rail transportation into or out of the San Juan Basin (SJB) tends to protect the mines from outside competition. Economics dictate transmitting electricity from the SJB to other Western and Pacifi c Coast States rather than shipping coal to these States. Approximately 60 percent of New Mexico’s coal production is from the Upper Cretaceous Fruitland Formation (Hoffman and Jones, 1999). This forma-tion has some of the thickest coal seams mined in the SJB and they are more continuous (over short distances) than coal seams within the Menefee and Crevasse Canyon Formations.
BHP Minerals operates two of the fi ve New Mexico mines (fi g. 7): (1) one mine complex that consists of the San Juan and La Plata mines, and (2) the Navajo mine. Both mines produce coal from the Fruitland Formation. The Navajo mine was the 15th largest mine (8.5 million sold short tons) and the San Juan/La Plata mine was the 21st largest mine (6.6 million sold short tons) in the Nation in 1999 (Resource Data
International, 2000). The Navajo mine has been operating for 35 years, with total production of more than 241 million short tons. Operators of the San Juan mine complex are studying the potential of underground mining using longwall methods to extend the mine life.
Four quadrangles located approximately 35 mi south of Farmington, N. Mex., on the western edge of the Bisti coal fi eld were chosen for the present study—Alamo Mesa West, Bisti Trading Post, Tanner Lake, and the Pillar 3 NE quad-rangles (fi g. 7). The four-quadrangle study area encompasses nearly 238 mi2 of coal resource area. The southern extent of the BHP Minerals Navajo mine is approximately 16 mi north-west of the study area, and the San Juan power plant is less than 60 mi from the study area. Recently relinquished leases of the Conpaso mine (El Paso Natural Gas/Navajo Lease) are immediately west of the study area (fi g. 7). Within the study area, two small mines, the De-Na-Zin and Gateway mines, produced coal during the 1980’s.
Geologic Setting
The Bisti coal fi eld is about 37 mi long, beginning approximately 7 mi west of the eastern boundary of the Navajo Indian Reservation and arbitrarily separated from the Star Lake coal fi eld (in the east) at the N.-S. boundary between R. 9 W. and R. 8 W. Only the western part of the Bisti coal fi eld (containing the study area) is shown on fi gure 7. The entire coal fi eld is within San Juan County and is included in part of the Toadlena and the Chaco Canyon 1:100,000-scale topographic quadrangles. Four 7.5-minute quadrangles defi ne the study area at the western edge of the Bisti coal fi eld and all of these 1:24,000-scale quadrangles are within the 1:100,000-scale Toadlena topographic quadrangle. Fruitland Formation exposures (fi g. 7) within the Bisti coal fi eld trend northwest-southeast (N.55°W.), more or less parallel to the Late Cretaceous shoreline.
The Bisti coal fi eld lies within the Chaco slope physio-graphic area (fi g. 15). Coal beds dip 3 to 5 degrees to the north-northeast. Lack of signifi cant faulting and high-angle dips have allowed economical surface mining in the Bisti coal fi eld. Erosion of the Fruitland Formation and overlying Kirtland Shale lithologies results in a badlands topography (fi gs. 16, 17). Lithologies associated with the Fruitland Formation coal seams are typically mudstone, siltstone, and fi ne-grained, fri-able sandstone.
Coal Geology
In the study area (fi g. 18), the Fruitland Formation includes four defi ned coal seams. El Paso Natural Gas Navajo Lease group (Conpaso-Burnham), the Public Service Com-pany of New Mexico, and the Sun Belt Mining and Arch Coal group defi ned these four seams. Using their terminology, the seams from bottom to top are: Red, Green, Blue, and Yellow.
Coal Availability, Recovery, Economic Evaluations of Coal Resources, Colorado Plateau: Colo., N. Mex., and Utah F29

of thickness in the two most laterally consistent coal seams within the study area. The Red coal seam typically includes two major and several minor coal beds, whereas the remaining coal seams generally contain one major and several minor coal beds. Major coal-bed thickness averages from 6 to 8 ft, with the thickest coal bed being in the Green coal seam (fi g. 22). In parts of the study area where the Yellow coal seam is not present, the average thickness of the coal-bearing Fruitland Formation coal zone is 102 ft. In areas where the Yellow coal seam does occur, the average thickness of the Fruitland Formation coal zone is 172 ft. Coal is present above the Yellow zone, but because these coal beds are very thin and lenticular, they were not included in this study. The lenticularity of these seams is illustrated in cross sections shown in fi gures 23–25. Cross-section locations are shown in fi gure 18. Correlation of beds on these cross sections and for resource calculation is by seam rather than by bed, meaning that one coal bed does not necessarily represent the same bed in the adjacent section but rather the same seam.
Coal Quality
The western part of the Bisti coal fi eld was considered for coal availability studies in part because the sulfur analysis (fi g. 26) indicated a potential compliance coal resource containing 0.41–0.60 lb of sulfur per million Btu (Energy Information Administration, 1993). Coal in the entire Bisti coal fi eld aver-ages 0.61 lb sulfur per million Btu, which is slightly above the 0.60-lb-sulfur-per-million-Btu compliance levels. The large coal resource, low-sulfur coal distribution, and the availability of State-owned property for an industrial site were the primary reasons for New Mexico Public Service to consider building a coal-fi red power plant in this area.
(Cretaceous outcrops)
ALBUQUERQUEGRANTS
STAR LAKE
CUBA
STANDINGROCK
GALLUP
BISTI
FARMINGTON
MILES1 54
Colorado
Ariz
ona
Puerco fault belt
Mt. Taylorvolcanics
Central basin
Four Corners platform
Chaco slope
Nacim
iento uplift
Rio
Grande
trough
Chama
embaym
ent
Archuleta
Zuniuplift
Gallup
sag Acom
a sa
g
Hog
back
mon
oclin
e
Chuska M
tns.
De
fianceuplift
arch
Figure 15. Tectonic map of the San Juan Basin, New Mexico (from Beaumont, 1982, fi gure 3, reprinted with permission of the American Association of Petroleum Geologists, courtesy of E.C. Beaumont).
Figure 16. Photograph taken near Bisti Trading Post, looking to the northeast. Foreground, badlands topography of weathered carbona-ceous shale. A knoll of red clinker (burned coal) is visible in the mid-ground adjacent to Hunter Wash. (Photograph by Tim Rohrbacher, 1998).
Figure 17. Photograph taken south of Bisti Trading Post, looking to the north. The red clinker of burned coal seams in the Fruitland Formation are prominent in the middle part of the photo north of De-Na-Zin Wash. (Photograph by Tim Rohrbacher, 1998).
A generalized stratigraphic column (fi g. 19) shows the general relationship of the seams.
The average seam thickness ranges from 11 to 14.5 ft, including parting. The average net coal within a seam varies from 7 to 9 ft thick. Total net coal and parting isopach maps for the Red and Green seams (fi gs. 20, 21) illustrate the variability
F30 Geologic Assessment of Coal in the Colorado Plateau: Arizona, Colorado, New Mexico, and Utah
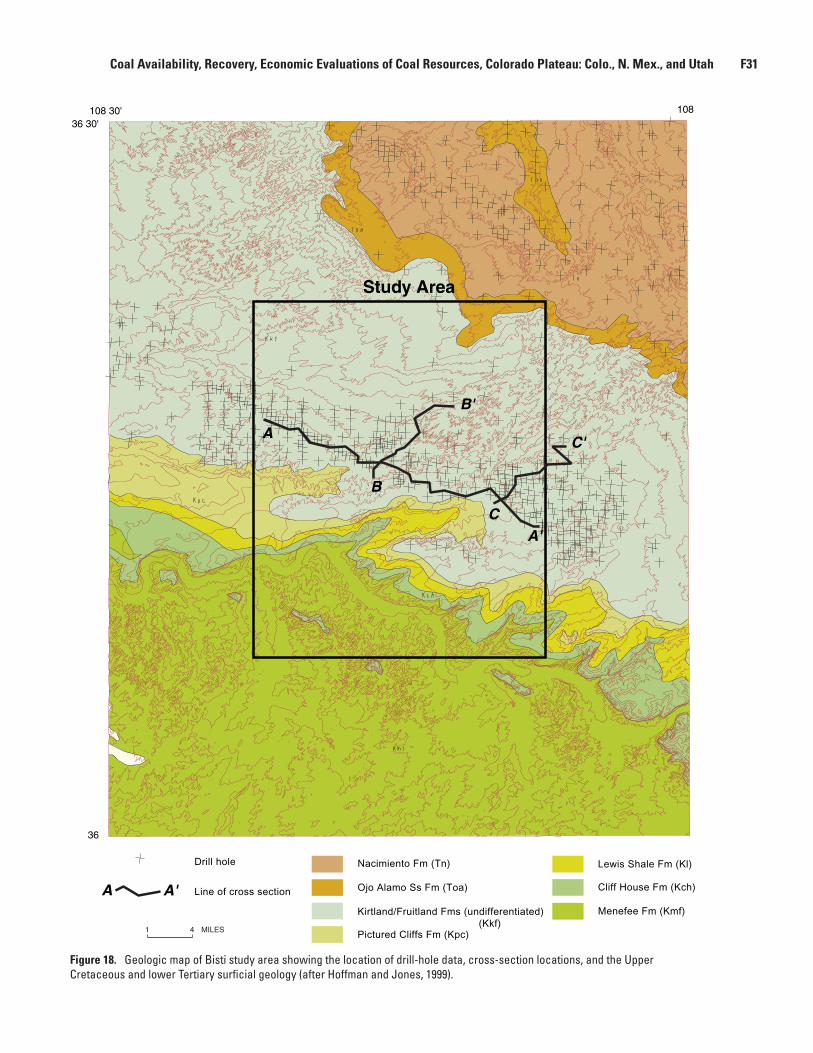
108 30' 108
36 30'
36
Study Area
B'
B
A
A'C
C'
A A'
Drill hole
Line of cross section
Nacimiento Fm (Tn)
Ojo Alamo Ss Fm (Toa)
Kirtland/Fruitland Fms (undifferentiated) (Kkf)Pictured Cliffs Fm (Kpc)
Cliff House Fm (Kch)
Menefee Fm (Kmf)
Lewis Shale Fm (Kl)
MILES1 4
Figure 18. Geologic map of Bisti study area showing the location of drill-hole data, cross-section locations, and the Upper Cretaceous and lower Tertiary surfi cial geology (after Hoffman and Jones, 1999).
Coal Availability, Recovery, Economic Evaluations of Coal Resources, Colorado Plateau: Colo., N. Mex., and Utah F31
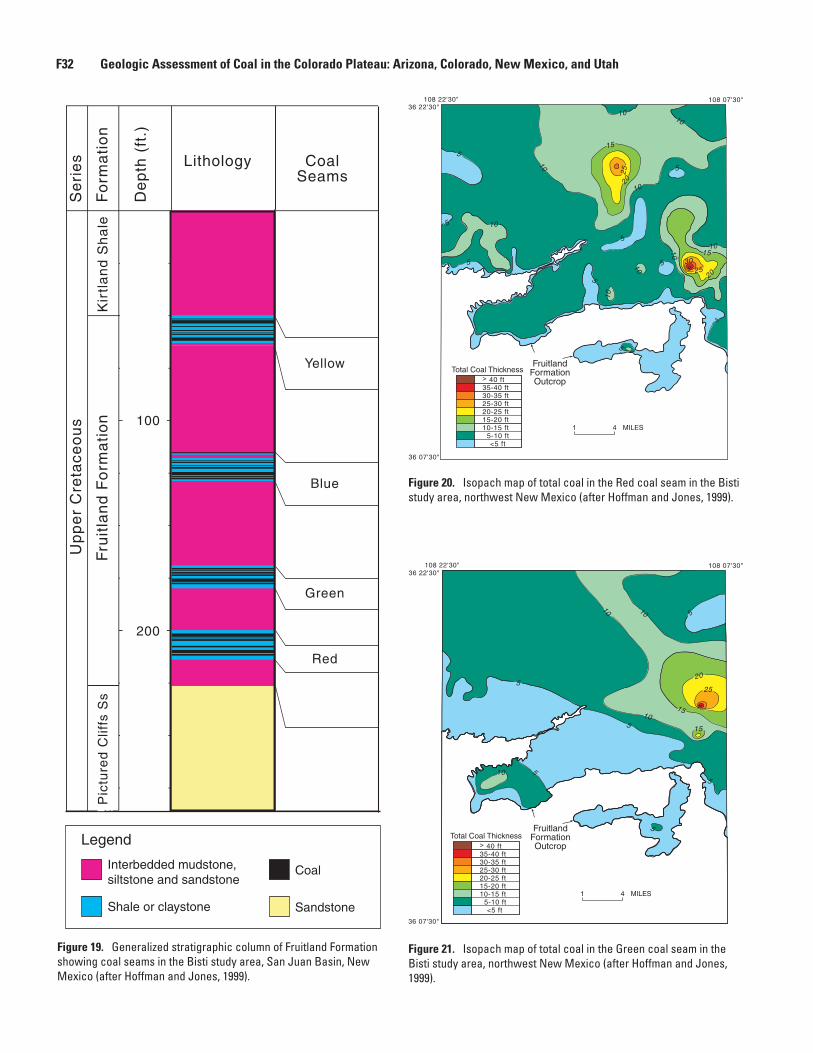
Red
Green
Blue
Yellow
CoalSeams
LithologyD
ep
th (
ft.)
Se
rie
sU
pp
er
Cre
tace
ou
s
Fo
rma
tio
nF
ruit
lan
d F
orm
ati
on
Pic
ture
d C
liffs
Ss
Kir
tla
nd
Sh
ale
200
100
Legend
Interbedded mudstone, siltstone and sandstone
Shale or claystone
Coal
Sandstone
Figure 19. Generalized stratigraphic column of Fruitland Formation showing coal seams in the Bisti study area, San Juan Basin, New Mexico (after Hoffman and Jones, 1999).
Total Coal ThicknessFruitland
FormationOutcrop> 40 ft
35-40 ft30-35 ft25-30 ft20-25 ft15-20 ft10-15 ft
5-10 ft<5 ft
36 07'30"
108 07'30"36 22'30"
108 22'30"
5
55
5
5
5
5
5
5
10
10
10
10
10
10
10
101015
15
20
20
25
2530
MILES1 4
Figure 20. Isopach map of total coal in the Red coal seam in the Bisti study area, northwest New Mexico (after Hoffman and Jones, 1999).
10 5
5
5
Total Coal ThicknessFruitland
FormationOutcrop> 40 ft
35-40 ft30-35 ft25-30 ft20-25 ft15-20 ft10-15 ft
5-10 ft<5 ft
36 07'30"
108 07'30"36 22'30"
108 22'30"
5
510
10 10
15
15
20
25
5
MILES1 4
Figure 21. Isopach map of total coal in the Green coal seam in the Bisti study area, northwest New Mexico (after Hoffman and Jones, 1999).
F32 Geologic Assessment of Coal in the Colorado Plateau: Arizona, Colorado, New Mexico, and Utah
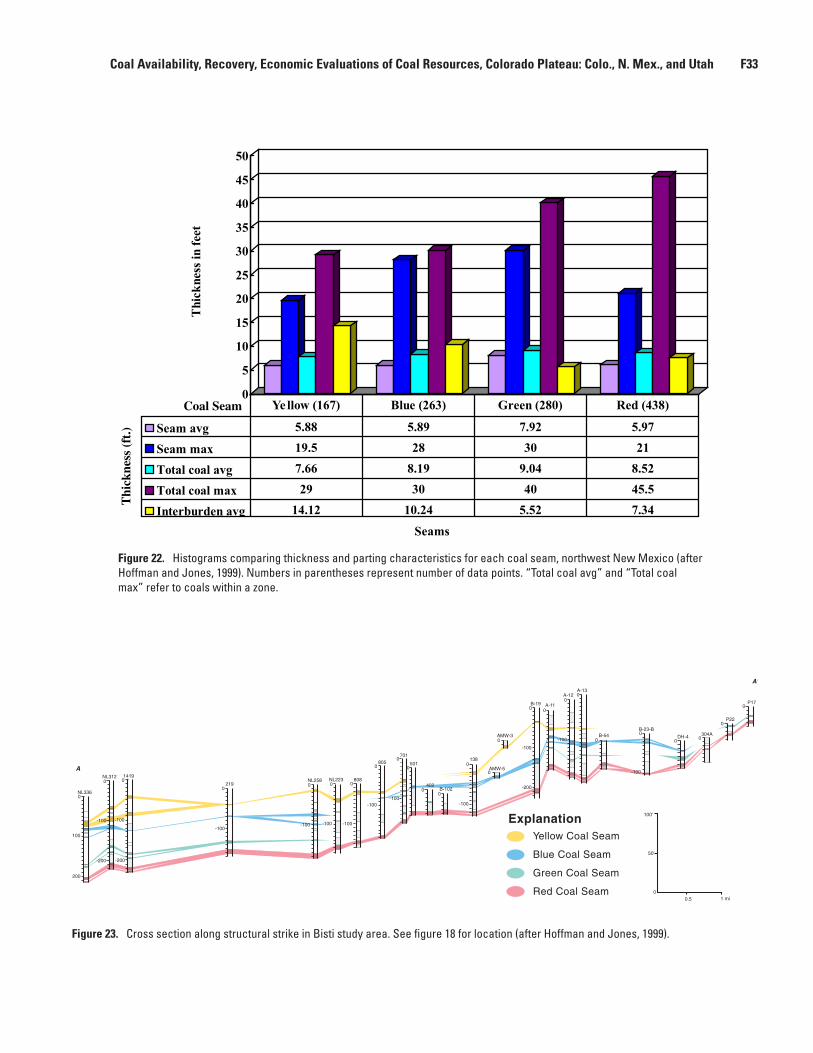
0
5
10
15
20
25
30
35
40
45
50
Thickness
infeet
Seams
Seam avg 5.88 5.89 7.92 5.97
Seam max 19.5 28 30 21
Total coal avg 7.66 8.19 9.04 8.52
Total coal max 29 30 40 45.5
Interburden avg 14.12 10.24 5.52 7.34
Yellow (167) Blue (263) Green (280) Red (438)Coal Seam
Thi
ckne
ss (
ft.)
Figure 22. Histograms comparing thickness and parting characteristics for each coal seam, northwest New Mexico (after Hoffman and Jones, 1999). Numbers in parentheses represent number of data points. “Total coal avg” and “Total coal max” refer to coals within a zone.
NL3360
-100
-200
-200
-100 -100
0 0NL312 1419
-200
0
-100
219 0
-100 -100 -100
-100
0 0
0 0
00
0
0
-100-100
B-102402
0
0701
501138
AMW-5
-200
AMW-3
-100
0B-19
0A-11
A-120
A-130
B-54-100 0
0
0 0
0P22
304ADH-4
B-23-B
P170
-100
NL258 NL223 808
805
A'
A
100'
50'
00.5 1 mi
Yellow Coal Seam
Blue Coal Seam
Green Coal Seam
Red Coal Seam
Explanation
Figure 23. Cross section along structural strike in Bisti study area. See fi gure 18 for location (after Hoffman and Jones, 1999).
Coal Availability, Recovery, Economic Evaluations of Coal Resources, Colorado Plateau: Colo., N. Mex., and Utah F33
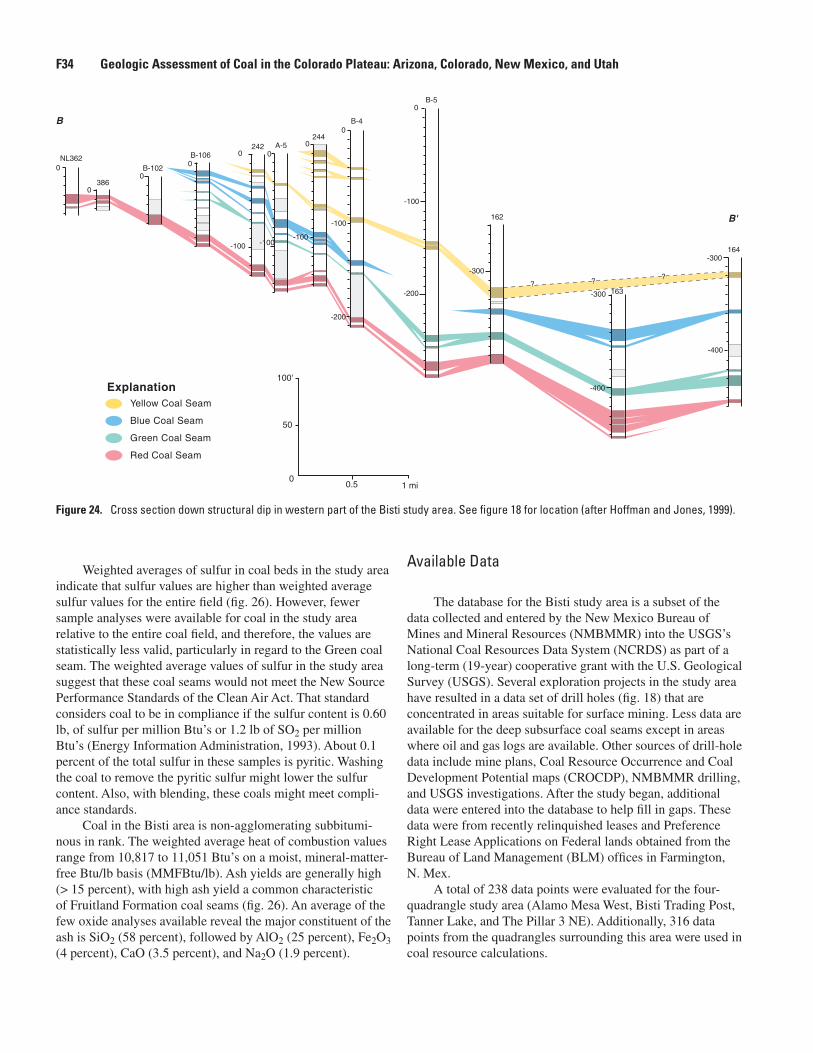
B
B'
100'
50
00.5 1 mi
NL362
386
B-102
B-106 242 A-5
244
B-4
B-5
164-300
-400
-400
-300 163
162
-300
0
-100
-200
-200
-100
0
000
0
00
0
-100 -100-100
? ? ?
Yellow Coal Seam
Blue Coal Seam
Green Coal Seam
Red Coal Seam
Explanation
Figure 24. Cross section down structural dip in western part of the Bisti study area. See fi gure 18 for location (after Hoffman and Jones, 1999).
Weighted averages of sulfur in coal beds in the study area indicate that sulfur values are higher than weighted average sulfur values for the entire fi eld (fi g. 26). However, fewer sample analyses were available for coal in the study area relative to the entire coal fi eld, and therefore, the values are statistically less valid, particularly in regard to the Green coal seam. The weighted average values of sulfur in the study area suggest that these coal seams would not meet the New Source Performance Standards of the Clean Air Act. That standard considers coal to be in compliance if the sulfur content is 0.60 lb, of sulfur per million Btu’s or 1.2 lb of SO2 per million Btu’s (Energy Information Administration, 1993). About 0.1 percent of the total sulfur in these samples is pyritic. Washing the coal to remove the pyritic sulfur might lower the sulfur content. Also, with blending, these coals might meet compli-ance standards.
Coal in the Bisti area is non-agglomerating subbitumi-nous in rank. The weighted average heat of combustion values range from 10,817 to 11,051 Btu’s on a moist, mineral-matter-free Btu/lb basis (MMFBtu/lb). Ash yields are generally high (> 15 percent), with high ash yield a common characteristic of Fruitland Formation coal seams (fi g. 26). An average of the few oxide analyses available reveal the major constituent of the ash is SiO2 (58 percent), followed by AlO2 (25 percent), Fe2O3 (4 percent), CaO (3.5 percent), and Na2O (1.9 percent).
Available Data
The database for the Bisti study area is a subset of the data collected and entered by the New Mexico Bureau of Mines and Mineral Resources (NMBMMR) into the USGS’s National Coal Resources Data System (NCRDS) as part of a long-term (19-year) cooperative grant with the U.S. Geological Survey (USGS). Several exploration projects in the study area have resulted in a data set of drill holes (fi g. 18) that are concentrated in areas suitable for surface mining. Less data are available for the deep subsurface coal seams except in areas where oil and gas logs are available. Other sources of drill-hole data include mine plans, Coal Resource Occurrence and Coal Development Potential maps (CROCDP), NMBMMR drilling, and USGS investigations. After the study began, additional data were entered into the database to help fi ll in gaps. These data were from recently relinquished leases and Preference Right Lease Applications on Federal lands obtained from the Bureau of Land Management (BLM) offi ces in Farmington, N. Mex.
A total of 238 data points were evaluated for the four-quadrangle study area (Alamo Mesa West, Bisti Trading Post, Tanner Lake, and The Pillar 3 NE). Additionally, 316 data points from the quadrangles surrounding this area were used in coal resource calculations.
F34 Geologic Assessment of Coal in the Colorado Plateau: Arizona, Colorado, New Mexico, and Utah
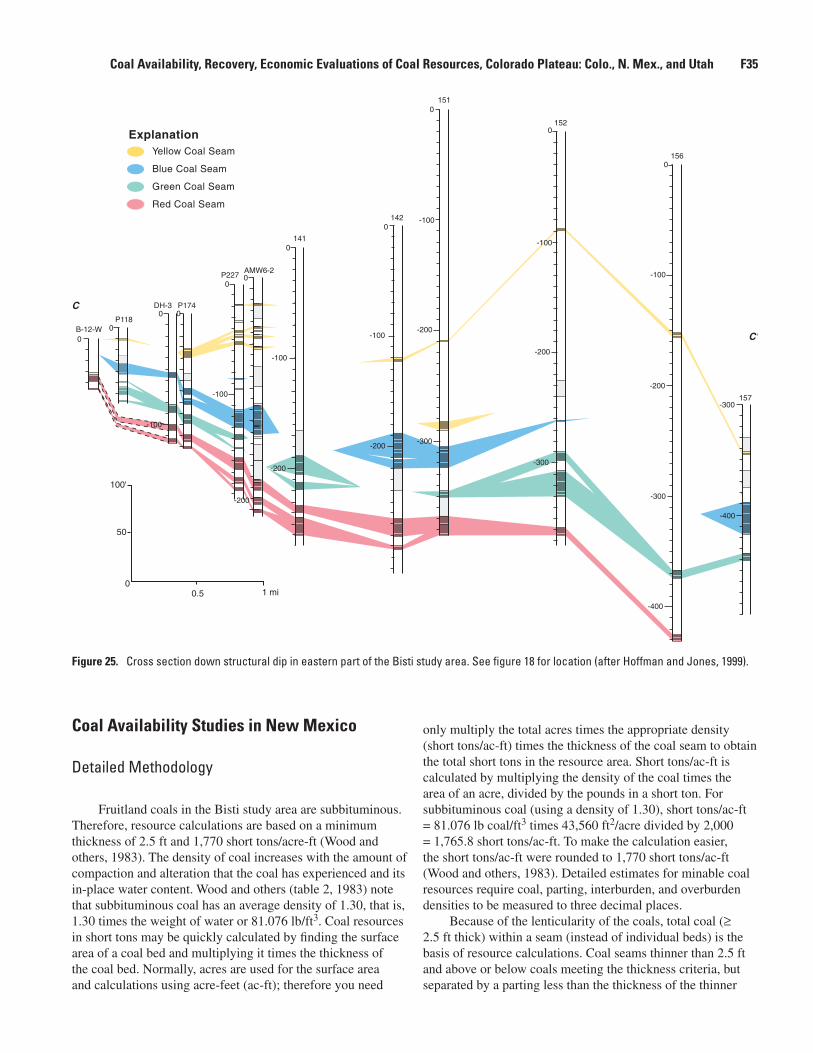
Coal Availability Studies in New Mexico
Detailed Methodology
Fruitland coals in the Bisti study area are subbituminous. Therefore, resource calculations are based on a minimum thickness of 2.5 ft and 1,770 short tons/acre-ft (Wood and others, 1983). The density of coal increases with the amount of compaction and alteration that the coal has experienced and its in-place water content. Wood and others (table 2, 1983) note that subbituminous coal has an average density of 1.30, that is, 1.30 times the weight of water or 81.076 lb/ft3. Coal resources in short tons may be quickly calculated by fi nding the surface area of a coal bed and multiplying it times the thickness of the coal bed. Normally, acres are used for the surface area and calculations using acre-feet (ac-ft); therefore you need
only multiply the total acres times the appropriate density (short tons/ac-ft) times the thickness of the coal seam to obtain the total short tons in the resource area. Short tons/ac-ft is calculated by multiplying the density of the coal times the area of an acre, divided by the pounds in a short ton. For subbituminous coal (using a density of 1.30), short tons/ac-ft = 81.076 lb coal/ft3 times 43,560 ft2/acre divided by 2,000 = 1,765.8 short tons/ac-ft. To make the calculation easier, the short tons/ac-ft were rounded to 1,770 short tons/ac-ft (Wood and others, 1983). Detailed estimates for minable coal resources require coal, parting, interburden, and overburden densities to be measured to three decimal places.
Because of the lenticularity of the coals, total coal (≥ 2.5 ft thick) within a seam (instead of individual beds) is the basis of resource calculations. Coal seams thinner than 2.5 ft and above or below coals meeting the thickness criteria, but separated by a parting less than the thickness of the thinner
C'
C
B-12-W0
0
0 0P118
DH-3 P174
00
0
0
P227AMW6-2
141
142 -100
0151
1520
1560
157-300
-400
-400
-300
-200
-100
-100
-200
-300
-300-200
-200-100
-100
-100
-200
-200
-100
0
50
100'
1 mi0.5
Yellow Coal Seam
Blue Coal Seam
Green Coal Seam
Red Coal Seam
Explanation
Figure 25. Cross section down structural dip in eastern part of the Bisti study area. See fi gure 18 for location (after Hoffman and Jones, 1999).
Coal Availability, Recovery, Economic Evaluations of Coal Resources, Colorado Plateau: Colo., N. Mex., and Utah F35
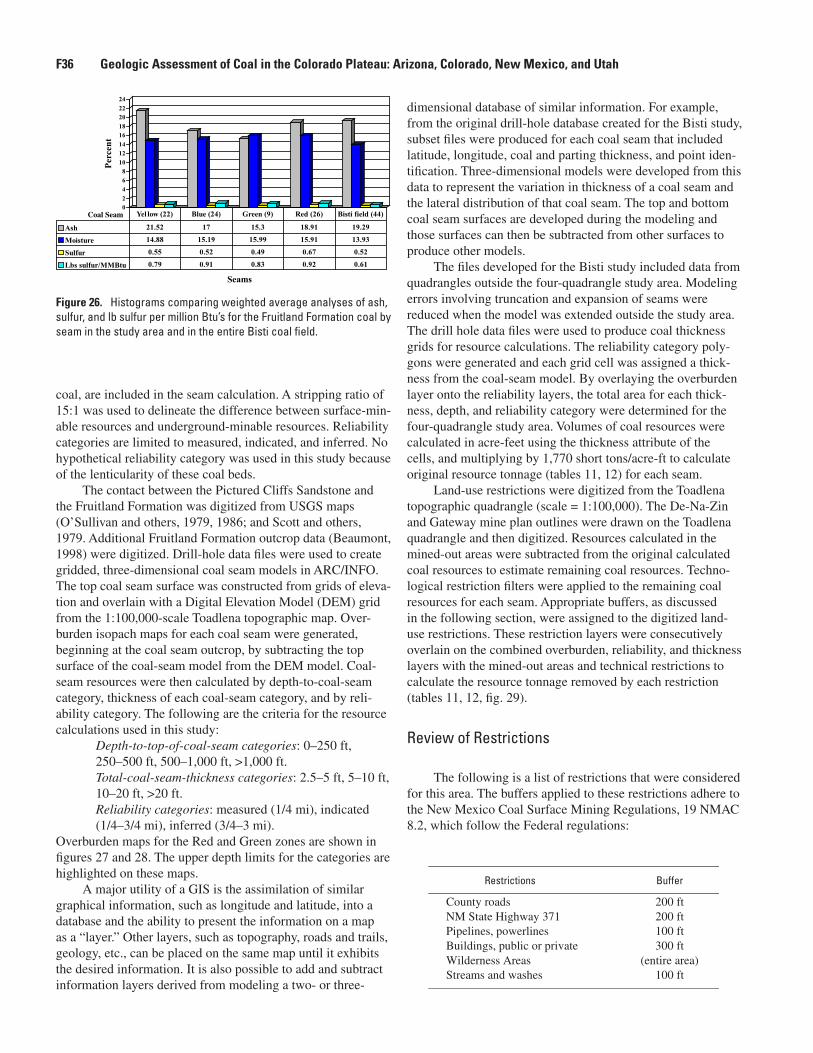
coal, are included in the seam calculation. A stripping ratio of 15:1 was used to delineate the difference between surface-min-able resources and underground-minable resources. Reliability categories are limited to measured, indicated, and inferred. No hypothetical reliability category was used in this study because of the lenticularity of these coal beds.
The contact between the Pictured Cliffs Sandstone and the Fruitland Formation was digitized from USGS maps (O’Sullivan and others, 1979, 1986; and Scott and others, 1979. Additional Fruitland Formation outcrop data (Beaumont, 1998) were digitized. Drill-hole data fi les were used to create gridded, three-dimensional coal seam models in ARC/INFO. The top coal seam surface was constructed from grids of eleva-tion and overlain with a Digital Elevation Model (DEM) grid from the 1:100,000-scale Toadlena topographic map. Over-burden isopach maps for each coal seam were generated, beginning at the coal seam outcrop, by subtracting the top surface of the coal-seam model from the DEM model. Coal-seam resources were then calculated by depth-to-coal-seam category, thickness of each coal-seam category, and by reli-ability category. The following are the criteria for the resource calculations used in this study: Depth-to-top-of-coal-seam categories: 0–250 ft,
250–500 ft, 500–1,000 ft, >1,000 ft. Total-coal-seam-thickness categories: 2.5–5 ft, 5–10 ft,
10–20 ft, >20 ft. Reliability categories: measured (1/4 mi), indicated
(1/4–3/4 mi), inferred (3/4–3 mi).Overburden maps for the Red and Green zones are shown in fi gures 27 and 28. The upper depth limits for the categories are highlighted on these maps.
A major utility of a GIS is the assimilation of similar graphical information, such as longitude and latitude, into a database and the ability to present the information on a map as a “layer.” Other layers, such as topography, roads and trails, geology, etc., can be placed on the same map until it exhibits the desired information. It is also possible to add and subtract information layers derived from modeling a two- or three-
dimensional database of similar information. For example, from the original drill-hole database created for the Bisti study, subset fi les were produced for each coal seam that included latitude, longitude, coal and parting thickness, and point iden-tifi cation. Three-dimensional models were developed from this data to represent the variation in thickness of a coal seam and the lateral distribution of that coal seam. The top and bottom coal seam surfaces are developed during the modeling and those surfaces can then be subtracted from other surfaces to produce other models.
The fi les developed for the Bisti study included data from quadrangles outside the four-quadrangle study area. Modeling errors involving truncation and expansion of seams were reduced when the model was extended outside the study area. The drill hole data fi les were used to produce coal thickness grids for resource calculations. The reliability category poly-gons were generated and each grid cell was assigned a thick-ness from the coal-seam model. By overlaying the overburden layer onto the reliability layers, the total area for each thick-ness, depth, and reliability category were determined for the four-quadrangle study area. Volumes of coal resources were calculated in acre-feet using the thickness attribute of the cells, and multiplying by 1,770 short tons/acre-ft to calculate original resource tonnage (tables 11, 12) for each seam.
Land-use restrictions were digitized from the Toadlena topographic quadrangle (scale = 1:100,000). The De-Na-Zin and Gateway mine plan outlines were drawn on the Toadlena quadrangle and then digitized. Resources calculated in the mined-out areas were subtracted from the original calculated coal resources to estimate remaining coal resources. Techno-logical restriction fi lters were applied to the remaining coal resources for each seam. Appropriate buffers, as discussed in the following section, were assigned to the digitized land-use restrictions. These restriction layers were consecutively overlain on the combined overburden, reliability, and thickness layers with the mined-out areas and technical restrictions to calculate the resource tonnage removed by each restriction (tables 11, 12, fi g. 29).
Review of Restrictions
The following is a list of restrictions that were considered for this area. The buffers applied to these restrictions adhere to the New Mexico Coal Surface Mining Regulations, 19 NMAC 8.2, which follow the Federal regulations:
0
2
4
6
8
10
12
14
16
18
20
22
24
Percent
Seams
Ash 21.52 17 15.3 18.91 19.29
Moisture 14.88 15.19 15.99 15.91 13.93
Sulfur 0.55 0.52 0.49 0.67 0.52
Lbs sulfur/MMBtu 0.79 0.91 0.83 0.92 0.61
Yel low (22) Blue (24) Green (9) Red (26) Bisti field (44)Coal Seam
Figure 26. Histograms comparing weighted average analyses of ash, sulfur, and lb sulfur per million Btu’s for the Fruitland Formation coal by seam in the study area and in the entire Bisti coal fi eld.
Restrictions Buffer
County roads 200 ft NM State Highway 371 200 ft Pipelines, powerlines 100 ft Buildings, public or private 300 ft Wilderness Areas (entire area) Streams and washes 100 ft
F36 Geologic Assessment of Coal in the Colorado Plateau: Arizona, Colorado, New Mexico, and Utah
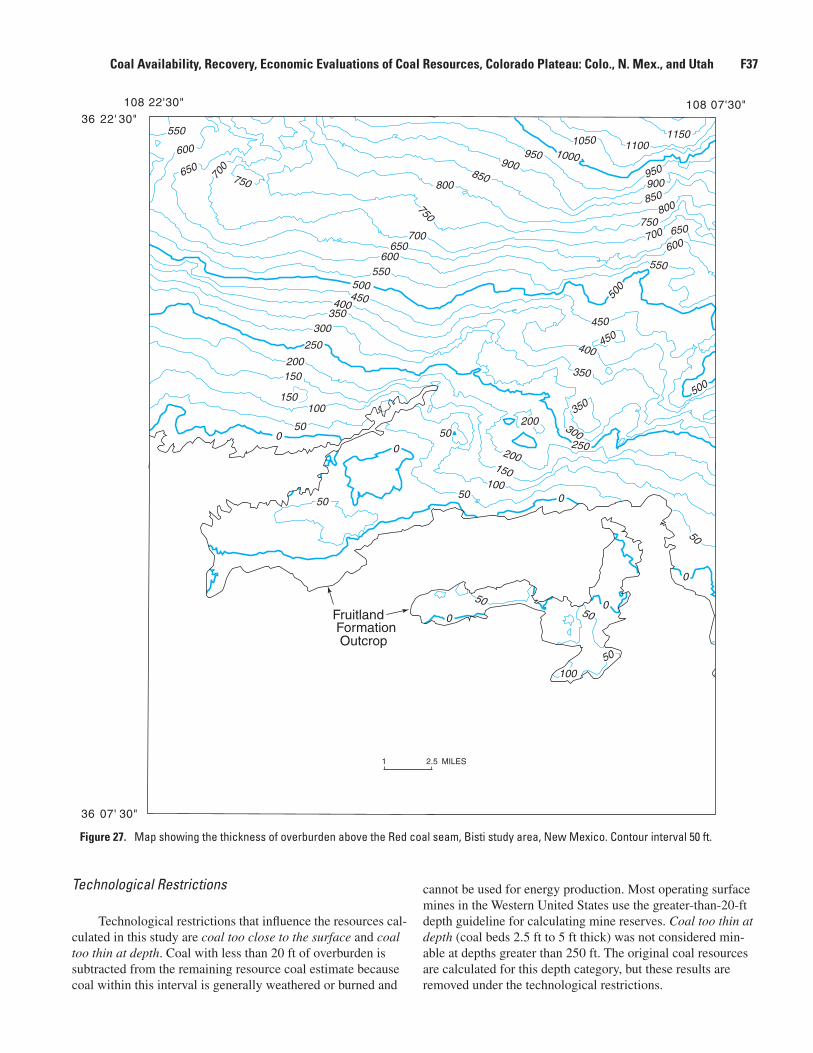
00
050
50
50
50
50
100
100
100
150
150
150
200
200
200
250
300
300
350
350
350
400
400
450
450
450
500550
550
550600
600
600650
650
650700
700
700
750
750
750
800
800
850
850
900
900
950
950
10001050 1100
1150
500
500
250
0
0
5050
50
0FruitlandFormation Outcrop
36 07' 30"
108 07'30"36 22' 30"
108 22'30"
MILES1 2.5
Figure 27. Map showing the thickness of overburden above the Red coal seam, Bisti study area, New Mexico. Contour interval 50 ft.
Technological Restrictions
Technological restrictions that infl uence the resources cal-culated in this study are coal too close to the surface and coal too thin at depth. Coal with less than 20 ft of overburden is subtracted from the remaining resource coal estimate because coal within this interval is generally weathered or burned and
cannot be used for energy production. Most operating surface mines in the Western United States use the greater-than-20-ft depth guideline for calculating mine reserves. Coal too thin at depth (coal beds 2.5 ft to 5 ft thick) was not considered min-able at depths greater than 250 ft. The original coal resources are calculated for this depth category, but these results are removed under the technological restrictions.
Coal Availability, Recovery, Economic Evaluations of Coal Resources, Colorado Plateau: Colo., N. Mex., and Utah F37

Land-Use Restrictions
Restrictions to mining in the project area are few, but some are signifi cant. The restrictions considered are those listed in the New Mexico Coal Surface Mining Regulations 19 NMAC 8. The Bisti Wilderness Area (3,946 acres) is entirely within the study area and removes a signifi cant area of surface-minable
coal. A small part of the De-Na-Zin Wilderness Area is within the study area. In 1996, the area linking the Bisti and De-Na-Zin Wilderness Areas offi cially became a Wilderness Area. This addition to the combined Bisti–De-Na-Zin Wilderness Area withdrew 16,000 acres from the resource evaluation (fi g. 29).
The De-Na-Zin and Hunter Washes cut across the Bisti study area. These are intermittent streams, but are major
0
0
0
50
50
50
50
50
100
100
150
150
200
200
250300
300
300350
350
350
450
450
350400450
500
500
550
550
600650
700750
750800
850
900
9501000
10501100
1100
0
00
0
250
500600
700
800900 850
750
650
550
400
400
FruitlandFormationOutcrop
108 07'30"108 22'30"
36 22'30"
36 07'
MILES1 2.5
Figure 28. Map showing the thickness of overburden above the Green coal seam, Bisti study area, New Mexico. Contour interval 50 ft.
F38 Geologic Assessment of Coal in the Colorado Plateau: Arizona, Colorado, New Mexico, and Utah
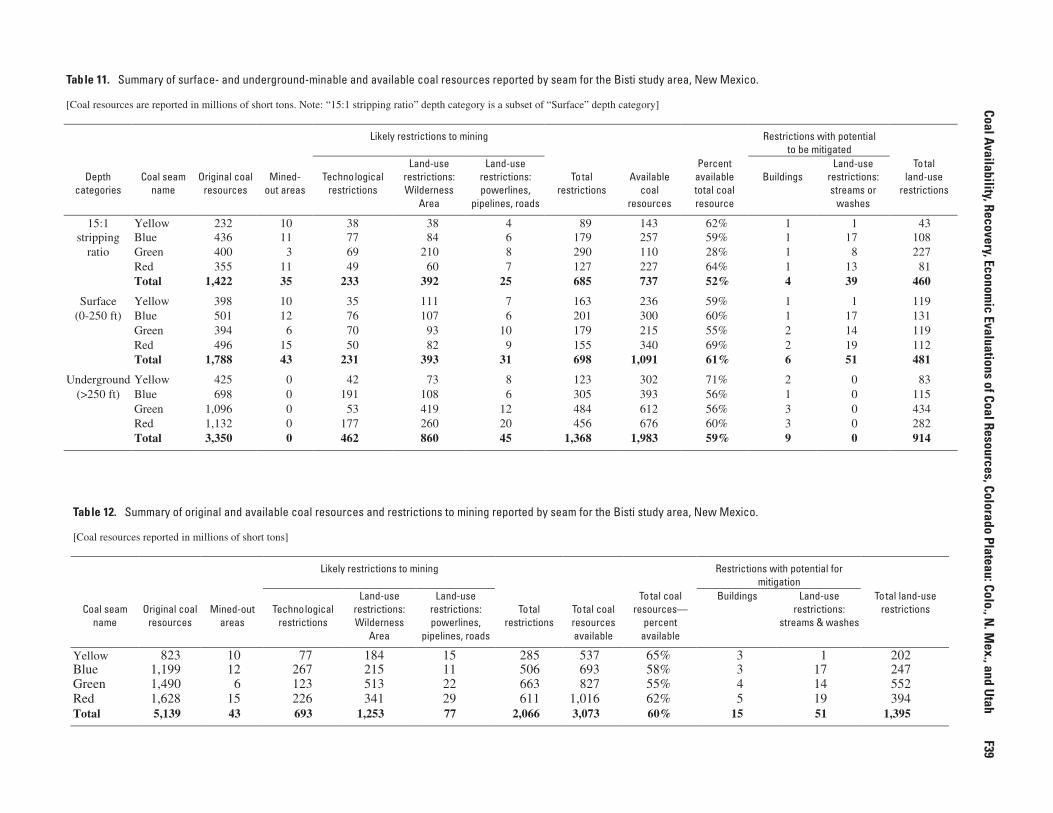
Table 11. Summary of surface- and underground-minable and available coal resources reported by seam for the Bisti study area, New Mexico.
[Coal resources are reported in millions of short tons. Note: “15:1 stripping ratio” depth category is a subset of “Surface” depth category]
Likely restrictions to mining Restrictions with potential to be mitigated
Depth
categories
Coal seam
name
Original coal
resources
Mined-
out areas
Technological
restrictions
Land-use restrictions: Wilderness
Area
Land-use restrictions: powerlines,
pipelines, roads
Total
restrictions
Available
coal resources
Percent available total coal resource
Buildings
Land-use restrictions: streams or
washes
Total land-use
restrictions
15:1 Yellow 232 10 38 38 4 89 143 62% 1 1 43 stripping Blue 436 11 77 84 6 179 257 59% 1 17 108
ratio Green 400 3 69 210 8 290 110 28% 1 8 227 Red 355 11 49 60 7 127 227 64% 1 13 81 Total 1,422 35 233 392 25 685 737 52% 4 39 460
Surface Yellow 398 10 35 111 7 163 236 59% 1 1 119
(0-250 ft) Blue 501 12 76 107 6 201 300 60% 1 17 131 Green 394 6 70 93 10 179 215 55% 2 14 119 Red 496 15 50 82 9 155 340 69% 2 19 112 Total 1,788 43 231 393 31 698 1,091 61% 6 51 481
Underground Yellow 425 0 42 73 8 123 302 71% 2 0 83 (>250 ft) Blue 698 0 191 108 6 305 393 56% 1 0 115
Green 1,096 0 53 419 12 484 612 56% 3 0 434 Red 1,132 0 177 260 20 456 676 60% 3 0 282 Total 3,350 0 462 860 45 1,368 1,983 59% 9 0 914
Table 12. Summary of original and available coal resources and restrictions to mining reported by seam for the Bisti study area, New Mexico.
[Coal resources reported in millions of short tons]
Likely restrictions to mining Restrictions with potential for mitigation
Coal seam
name
Original coal
resources
Mined-out
areas
Technological
restrictions
Land-use restrictions: Wilderness
Area
Land-use restrictions: powerlines,
pipelines, roads
Total
restrictions
Total coal resources available
Total coal resources—
percent available
Buildings Land-use restrictions:
streams & washes
Total land-use restrictions
Yellow 823 10 77 184 15 285 537 65% 3 1 202 Blue 1,199 12 267 215 11 506 693 58% 3 17 247 Green 1,490 6 123 513 22 663 827 55% 4 14 552 Red 1,628 15 226 341 29 611 1,016 62% 5 19 394 Total 5,139 43 693 1,253 77 2,066 3,073 60% 15 51 1,395
Coal Availability, Recovery, Economic Evaluations of Coal Resources, Colorado Plateau: Colo., N
. Mex., and U
tah
F39
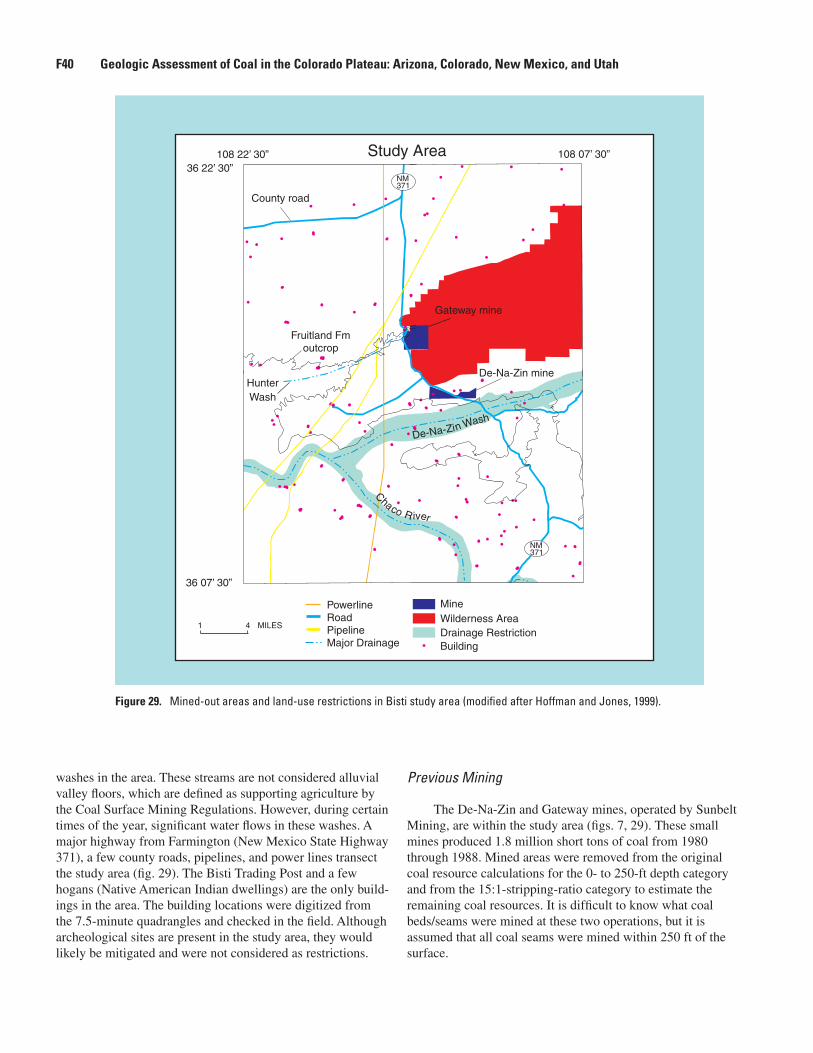
washes in the area. These streams are not considered alluvial valley fl oors, which are defi ned as supporting agriculture by the Coal Surface Mining Regulations. However, during certain times of the year, signifi cant water fl ows in these washes. A major highway from Farmington (New Mexico State Highway 371), a few county roads, pipelines, and power lines transect the study area (fi g. 29). The Bisti Trading Post and a few hogans (Native American Indian dwellings) are the only build-ings in the area. The building locations were digitized from the 7.5-minute quadrangles and checked in the fi eld. Although archeological sites are present in the study area, they would likely be mitigated and were not considered as restrictions.
Previous Mining
The De-Na-Zin and Gateway mines, operated by Sunbelt Mining, are within the study area (fi gs. 7, 29). These small mines produced 1.8 million short tons of coal from 1980 through 1988. Mined areas were removed from the original coal resource calculations for the 0- to 250-ft depth category and from the 15:1-stripping-ratio category to estimate the remaining coal resources. It is diffi cult to know what coal beds/seams were mined at these two operations, but it is assumed that all coal seams were mined within 250 ft of the surface.
36 07’ 30”
36 22’ 30”108 22’ 30” 108 07’ 30”Study Area
De-Na-Zin mine
Fruitland Fmoutcrop
PowerlineRoadPipelineMajor Drainage
Mine
County road
Gateway mine
Wilderness AreaDrainage RestrictionBuilding
HunterWash
Chaco R iver
De-Na-Zin Wash
NM371
NM371
MILES1 4
Figure 29. Mined-out areas and land-use restrictions in Bisti study area (modifi ed after Hoffman and Jones, 1999).
F40 Geologic Assessment of Coal in the Colorado Plateau: Arizona, Colorado, New Mexico, and Utah
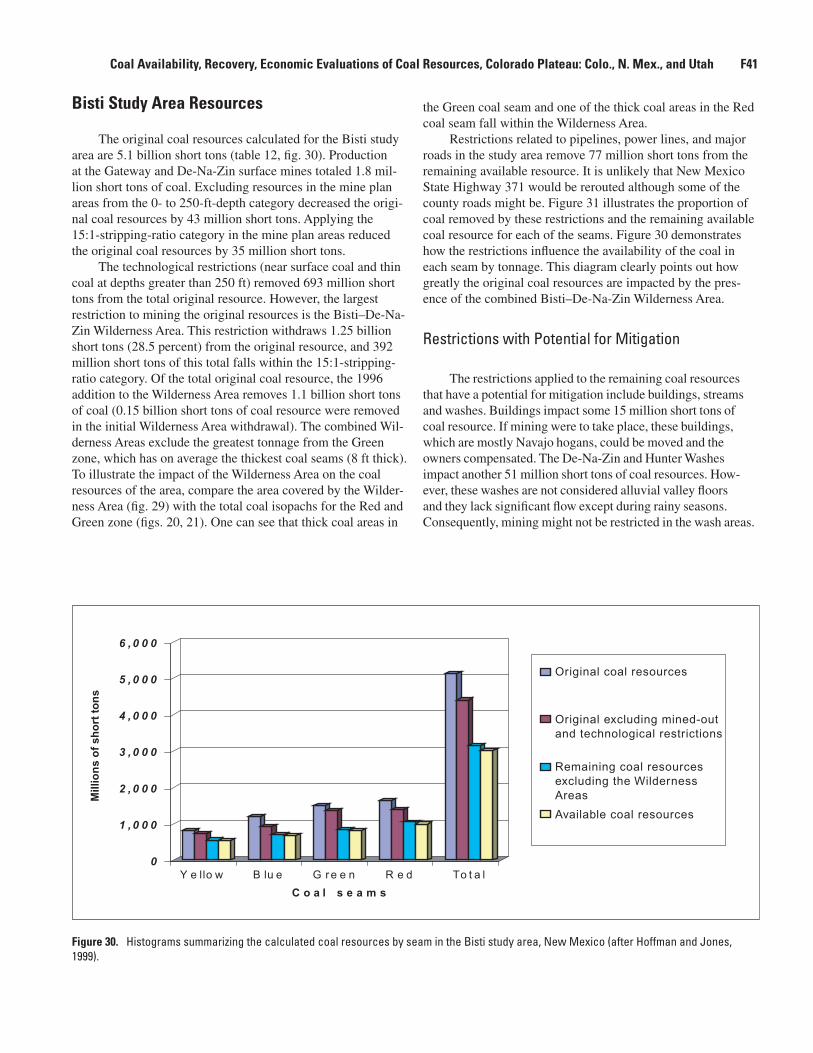
Bisti Study Area Resources
The original coal resources calculated for the Bisti study area are 5.1 billion short tons (table 12, fi g. 30). Production at the Gateway and De-Na-Zin surface mines totaled 1.8 mil-lion short tons of coal. Excluding resources in the mine plan areas from the 0- to 250-ft-depth category decreased the origi-nal coal resources by 43 million short tons. Applying the 15:1-stripping-ratio category in the mine plan areas reduced the original coal resources by 35 million short tons.
The technological restrictions (near surface coal and thin coal at depths greater than 250 ft) removed 693 million short tons from the total original resource. However, the largest restriction to mining the original resources is the Bisti–De-Na-Zin Wilderness Area. This restriction withdraws 1.25 billion short tons (28.5 percent) from the original resource, and 392 million short tons of this total falls within the 15:1-stripping-ratio category. Of the total original coal resource, the 1996 addition to the Wilderness Area removes 1.1 billion short tons of coal (0.15 billion short tons of coal resource were removed in the initial Wilderness Area withdrawal). The combined Wil-derness Areas exclude the greatest tonnage from the Green zone, which has on average the thickest coal seams (8 ft thick). To illustrate the impact of the Wilderness Area on the coal resources of the area, compare the area covered by the Wilder-ness Area (fi g. 29) with the total coal isopachs for the Red and Green zone (fi gs. 20, 21). One can see that thick coal areas in
the Green coal seam and one of the thick coal areas in the Red coal seam fall within the Wilderness Area.
Restrictions related to pipelines, power lines, and major roads in the study area remove 77 million short tons from the remaining available resource. It is unlikely that New Mexico State Highway 371 would be rerouted although some of the county roads might be. Figure 31 illustrates the proportion of coal removed by these restrictions and the remaining available coal resource for each of the seams. Figure 30 demonstrates how the restrictions infl uence the availability of the coal in each seam by tonnage. This diagram clearly points out how greatly the original coal resources are impacted by the pres-ence of the combined Bisti–De-Na-Zin Wilderness Area.
Restrictions with Potential for Mitigation
The restrictions applied to the remaining coal resources that have a potential for mitigation include buildings, streams and washes. Buildings impact some 15 million short tons of coal resource. If mining were to take place, these buildings, which are mostly Navajo hogans, could be moved and the owners compensated. The De-Na-Zin and Hunter Washes impact another 51 million short tons of coal resources. How-ever, these washes are not considered alluvial valley fl oors and they lack signifi cant fl ow except during rainy seasons. Consequently, mining might not be restricted in the wash areas.
0
1 , 0 0 0
2 , 0 0 0
3 , 0 0 0
4 , 0 0 0
5 , 0 0 0
6 , 0 0 0
Mill
ion
s o
f sh
ort
to
ns
Y e llo w B lu e G re e n R e d To t a l
C o a l s e a m s
Original coal resources
Original excluding mined-outand technological restrictions
Remaining coal resourcesexcluding the Wilderness Areas
Available coal resources
Figure 30. Histograms summarizing the calculated coal resources by seam in the Bisti study area, New Mexico (after Hoffman and Jones, 1999).
Coal Availability, Recovery, Economic Evaluations of Coal Resources, Colorado Plateau: Colo., N. Mex., and Utah F41
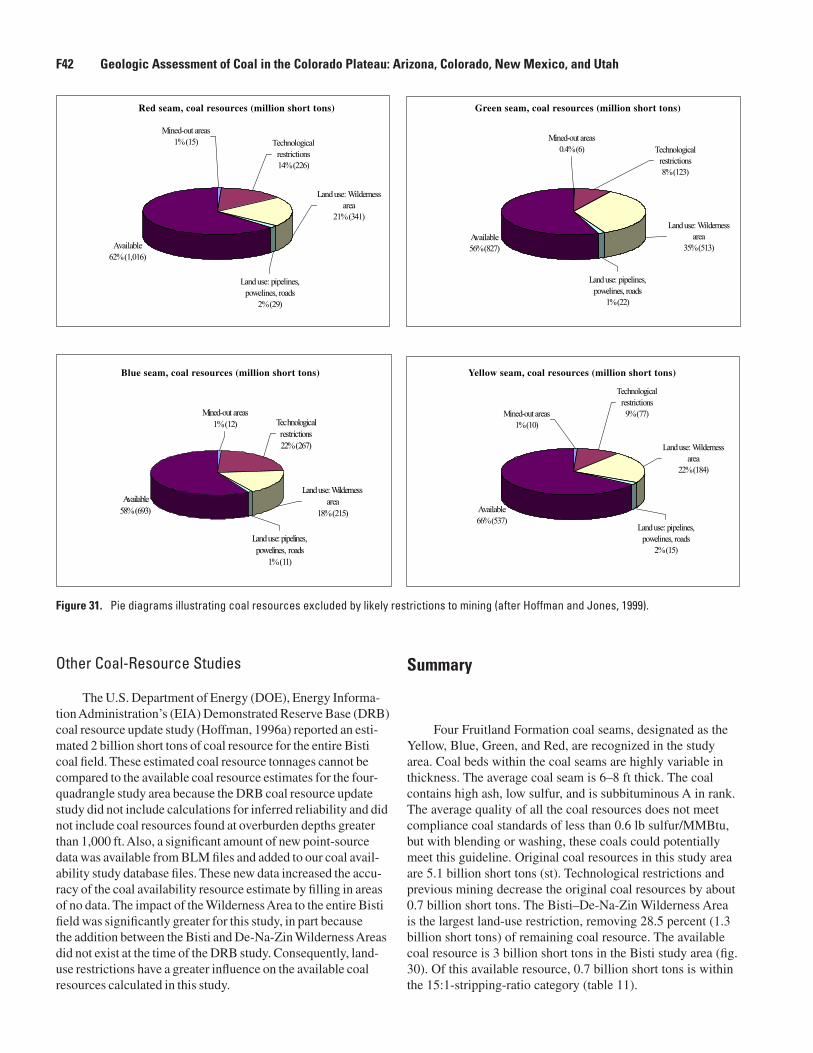
Other Coal-Resource Studies
The U.S. Department of Energy (DOE), Energy Informa-tion Administration’s (EIA) Demonstrated Reserve Base (DRB) coal resource update study (Hoffman, 1996a) reported an esti-mated 2 billion short tons of coal resource for the entire Bisti coal fi eld. These estimated coal resource tonnages cannot be compared to the available coal resource estimates for the four-quadrangle study area because the DRB coal resource update study did not include calculations for inferred reliability and did not include coal resources found at overburden depths greater than 1,000 ft. Also, a signifi cant amount of new point-source data was available from BLM fi les and added to our coal avail-ability study database fi les. These new data increased the accu-racy of the coal availability resource estimate by fi lling in areas of no data. The impact of the Wilderness Area to the entire Bisti fi eld was signifi cantly greater for this study, in part because the addition between the Bisti and De-Na-Zin Wilderness Areas did not exist at the time of the DRB study. Consequently, land-use restrictions have a greater infl uence on the available coal resources calculated in this study.
Summary
Four Fruitland Formation coal seams, designated as the Yellow, Blue, Green, and Red, are recognized in the study area. Coal beds within the coal seams are highly variable in thickness. The average coal seam is 6–8 ft thick. The coal contains high ash, low sulfur, and is subbituminous A in rank. The average quality of all the coal resources does not meet compliance coal standards of less than 0.6 lb sulfur/MMBtu, but with blending or washing, these coals could potentially meet this guideline. Original coal resources in this study area are 5.1 billion short tons (st). Technological restrictions and previous mining decrease the original coal resources by about 0.7 billion short tons. The Bisti–De-Na-Zin Wilderness Area is the largest land-use restriction, removing 28.5 percent (1.3 billion short tons) of remaining coal resource. The available coal resource is 3 billion short tons in the Bisti study area (fi g. 30). Of this available resource, 0.7 billion short tons is within the 15:1-stripping-ratio category (table 11).
Mined-out areas
1%(10)
Technological
restrictions
9%(77)
Landuse:Wilderness
area
22%(184)
Landuse: pipelines,
powelines, roads
2%(15)
Available
66%(537)
Landuse:Wilderness
area
18%(215)
Landuse:pipelines,
powelines, roads
1%(11)
Technological
restrictions
22%(267)
Mined-out areas
1%(12)
Available
58%(693)
Technological
restrictions
8%(123)
Mined-out areas
0.4%(6)
Landuse:Wilderness
area
35%(513)
Landuse: pipelines,
powelines, roads
1%(22)
Available
56%(827)
Mined-out areas
1%(15) Technological
restrictions
14%(226)
Landuse: pipelines,
powelines, roads
2%(29)
Landuse:Wilderness
area
21%(341)
Available
62%(1,016)
Red seam, coal resources (million short tons) Green seam, coal resources (million short tons)
Blue seam, coal resources (million short tons) Yellow seam, coal resources (million short tons)
Figure 31. Pie diagrams illustrating coal resources excluded by likely restrictions to mining (after Hoffman and Jones, 1999).
F42 Geologic Assessment of Coal in the Colorado Plateau: Arizona, Colorado, New Mexico, and Utah
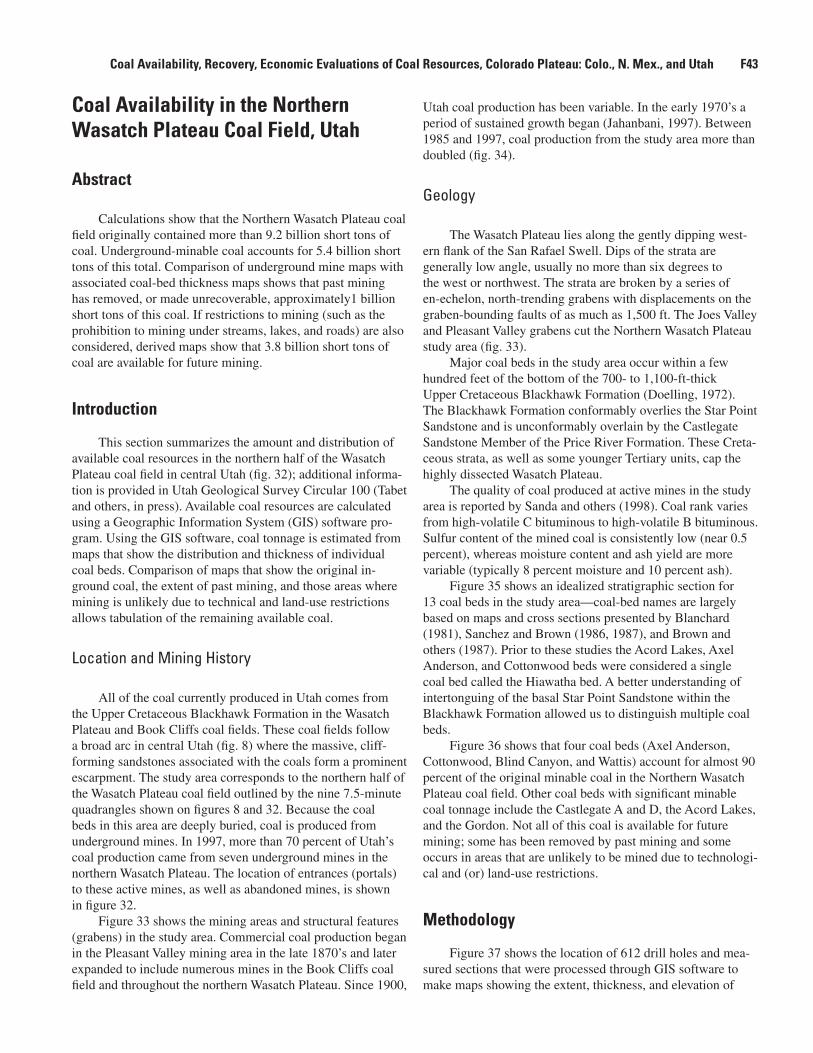
Coal Availability in the Northern Wasatch Plateau Coal Field, Utah
Abstract
Calculations show that the Northern Wasatch Plateau coal fi eld originally contained more than 9.2 billion short tons of coal. Underground-minable coal accounts for 5.4 billion short tons of this total. Comparison of underground mine maps with associated coal-bed thickness maps shows that past mining has removed, or made unrecoverable, approximately1 billion short tons of this coal. If restrictions to mining (such as the prohibition to mining under streams, lakes, and roads) are also considered, derived maps show that 3.8 billion short tons of coal are available for future mining.
Introduction
This section summarizes the amount and distribution of available coal resources in the northern half of the Wasatch Plateau coal fi eld in central Utah (fi g. 32); additional informa-tion is provided in Utah Geological Survey Circular 100 (Tabet and others, in press). Available coal resources are calculated using a Geographic Information System (GIS) software pro-gram. Using the GIS software, coal tonnage is estimated from maps that show the distribution and thickness of individual coal beds. Comparison of maps that show the original in-ground coal, the extent of past mining, and those areas where mining is unlikely due to technical and land-use restrictions allows tabulation of the remaining available coal.
Location and Mining History
All of the coal currently produced in Utah comes from the Upper Cretaceous Blackhawk Formation in the Wasatch Plateau and Book Cliffs coal fi elds. These coal fi elds follow a broad arc in central Utah (fi g. 8) where the massive, cliff-forming sandstones associated with the coals form a prominent escarpment. The study area corresponds to the northern half of the Wasatch Plateau coal fi eld outlined by the nine 7.5-minute quadrangles shown on fi gures 8 and 32. Because the coal beds in this area are deeply buried, coal is produced from underground mines. In 1997, more than 70 percent of Utah’s coal production came from seven underground mines in the northern Wasatch Plateau. The location of entrances (portals) to these active mines, as well as abandoned mines, is shown in fi gure 32.
Figure 33 shows the mining areas and structural features (grabens) in the study area. Commercial coal production began in the Pleasant Valley mining area in the late 1870’s and later expanded to include numerous mines in the Book Cliffs coal fi eld and throughout the northern Wasatch Plateau. Since 1900,
Utah coal production has been variable. In the early 1970’s a period of sustained growth began (Jahanbani, 1997). Between 1985 and 1997, coal production from the study area more than doubled (fi g. 34).
Geology
The Wasatch Plateau lies along the gently dipping west-ern fl ank of the San Rafael Swell. Dips of the strata are generally low angle, usually no more than six degrees to the west or northwest. The strata are broken by a series of en-echelon, north-trending grabens with displacements on the graben-bounding faults of as much as 1,500 ft. The Joes Valley and Pleasant Valley grabens cut the Northern Wasatch Plateau study area (fi g. 33).
Major coal beds in the study area occur within a few hundred feet of the bottom of the 700- to 1,100-ft-thick Upper Cretaceous Blackhawk Formation (Doelling, 1972). The Blackhawk Formation conformably overlies the Star Point Sandstone and is unconformably overlain by the Castlegate Sandstone Member of the Price River Formation. These Creta-ceous strata, as well as some younger Tertiary units, cap the highly dissected Wasatch Plateau.
The quality of coal produced at active mines in the study area is reported by Sanda and others (1998). Coal rank varies from high-volatile C bituminous to high-volatile B bituminous. Sulfur content of the mined coal is consistently low (near 0.5 percent), whereas moisture content and ash yield are more variable (typically 8 percent moisture and 10 percent ash).
Figure 35 shows an idealized stratigraphic section for 13 coal beds in the study area—coal-bed names are largely based on maps and cross sections presented by Blanchard (1981), Sanchez and Brown (1986, 1987), and Brown and others (1987). Prior to these studies the Acord Lakes, Axel Anderson, and Cottonwood beds were considered a single coal bed called the Hiawatha bed. A better understanding of intertonguing of the basal Star Point Sandstone within the Blackhawk Formation allowed us to distinguish multiple coal beds.
Figure 36 shows that four coal beds (Axel Anderson, Cottonwood, Blind Canyon, and Wattis) account for almost 90 percent of the original minable coal in the Northern Wasatch Plateau coal fi eld. Other coal beds with signifi cant minable coal tonnage include the Castlegate A and D, the Acord Lakes, and the Gordon. Not all of this coal is available for future mining; some has been removed by past mining and some occurs in areas that are unlikely to be mined due to technologi-cal and (or) land-use restrictions.
Methodology
Figure 37 shows the location of 612 drill holes and mea-sured sections that were processed through GIS software to make maps showing the extent, thickness, and elevation of
Coal Availability, Recovery, Economic Evaluations of Coal Resources, Colorado Plateau: Colo., N. Mex., and Utah F43
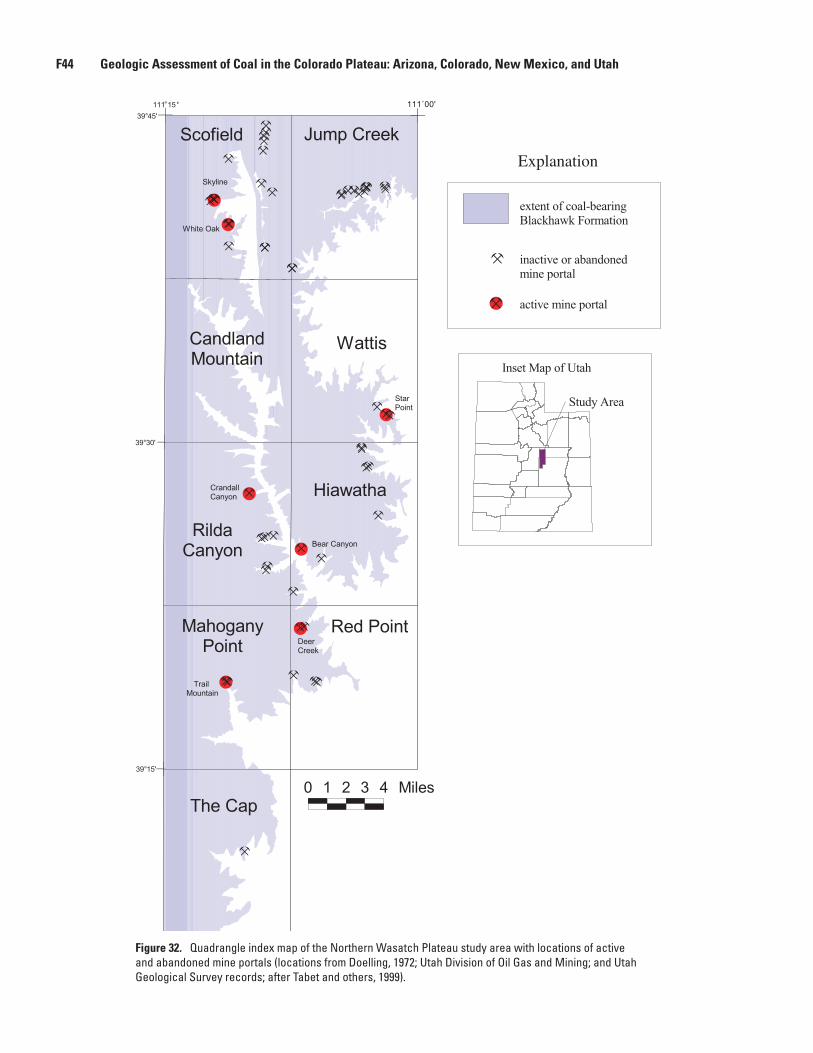
Explanation
' 111˚00'
Figure 32. Quadrangle index map of the Northern Wasatch Plateau study area with locations of active and abandoned mine portals (locations from Doelling, 1972; Utah Division of Oil Gas and Mining; and Utah Geological Survey records; after Tabet and others, 1999).
F44 Geologic Assessment of Coal in the Colorado Plateau: Arizona, Colorado, New Mexico, and Utah
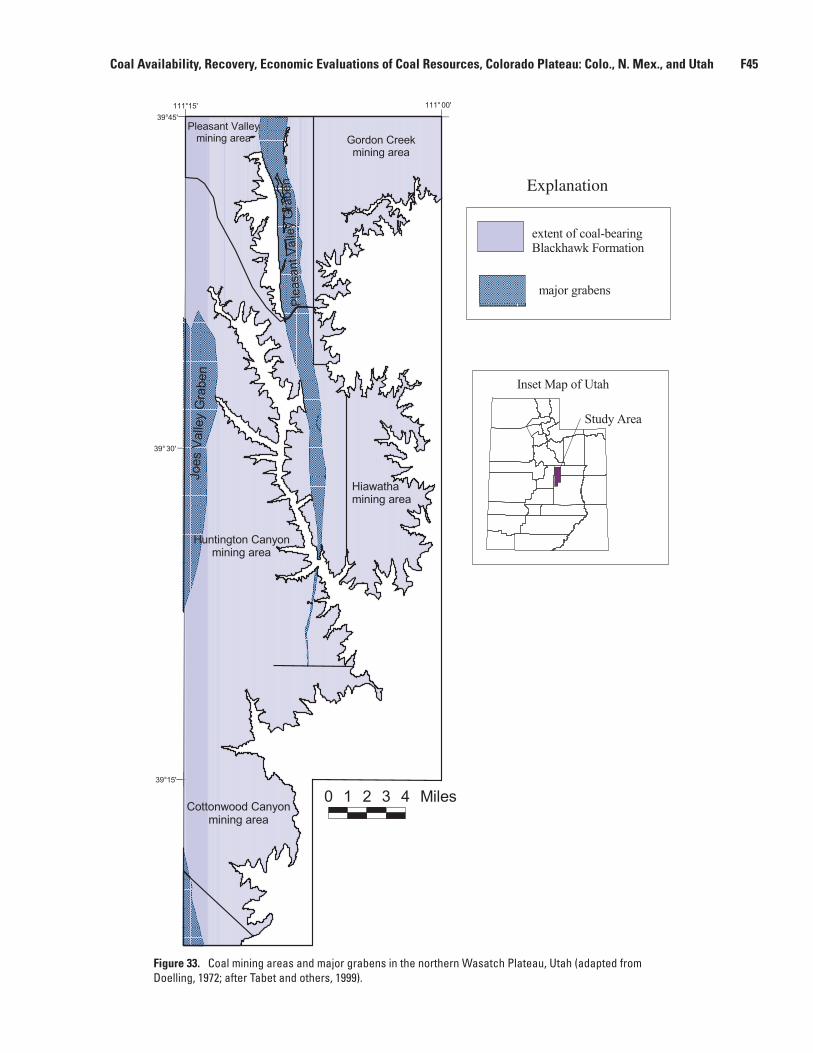
Explanation
Figure 33. Coal mining areas and major grabens in the northern Wasatch Plateau, Utah (adapted from Doelling, 1972; after Tabet and others, 1999).
Coal Availability, Recovery, Economic Evaluations of Coal Resources, Colorado Plateau: Colo., N. Mex., and Utah F45
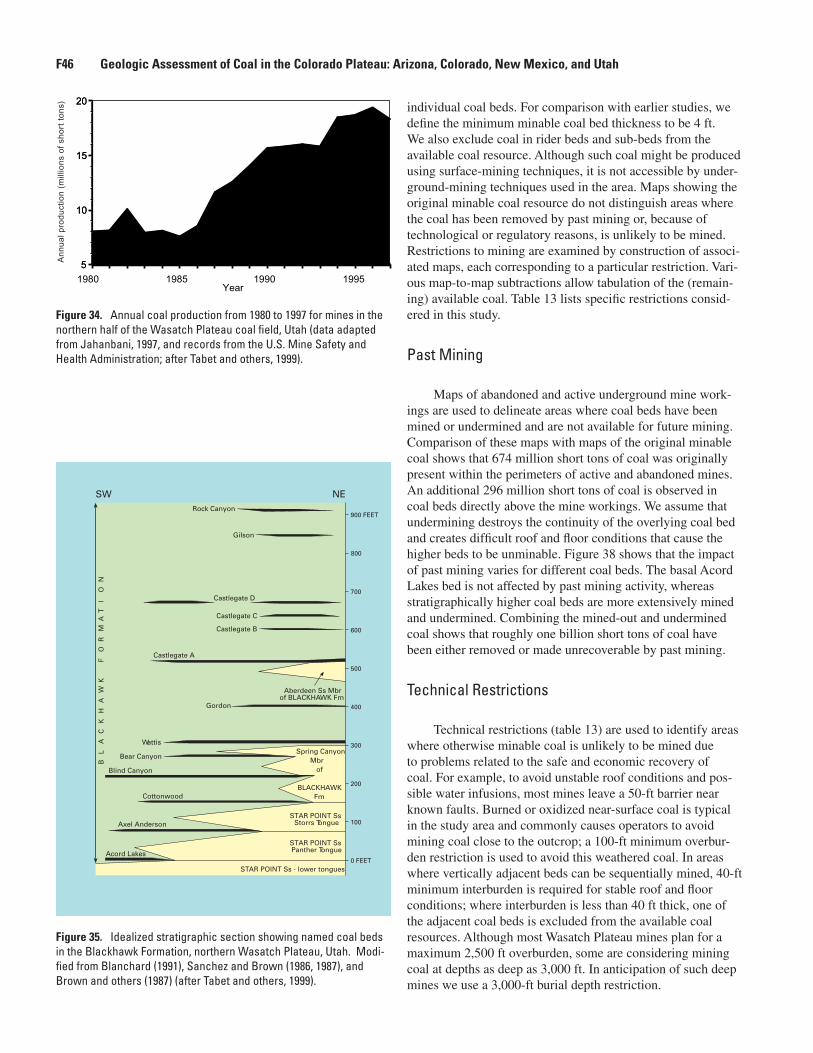
individual coal beds. For comparison with earlier studies, we defi ne the minimum minable coal bed thickness to be 4 ft. We also exclude coal in rider beds and sub-beds from the available coal resource. Although such coal might be produced using surface-mining techniques, it is not accessible by under-ground-mining techniques used in the area. Maps showing the original minable coal resource do not distinguish areas where the coal has been removed by past mining or, because of technological or regulatory reasons, is unlikely to be mined. Restrictions to mining are examined by construction of associ-ated maps, each corresponding to a particular restriction. Vari-ous map-to-map subtractions allow tabulation of the (remain-ing) available coal. Table 13 lists specifi c restrictions consid-ered in this study.
Past Mining
Maps of abandoned and active underground mine work-ings are used to delineate areas where coal beds have been mined or undermined and are not available for future mining. Comparison of these maps with maps of the original minable coal shows that 674 million short tons of coal was originally present within the perimeters of active and abandoned mines. An additional 296 million short tons of coal is observed in coal beds directly above the mine workings. We assume that undermining destroys the continuity of the overlying coal bed and creates diffi cult roof and fl oor conditions that cause the higher beds to be unminable. Figure 38 shows that the impact of past mining varies for different coal beds. The basal Acord Lakes bed is not affected by past mining activity, whereas stratigraphically higher coal beds are more extensively mined and undermined. Combining the mined-out and undermined coal shows that roughly one billion short tons of coal have been either removed or made unrecoverable by past mining.
Technical Restrictions
Technical restrictions (table 13) are used to identify areas where otherwise minable coal is unlikely to be mined due to problems related to the safe and economic recovery of coal. For example, to avoid unstable roof conditions and pos-sible water infusions, most mines leave a 50-ft barrier near known faults. Burned or oxidized near-surface coal is typical in the study area and commonly causes operators to avoid mining coal close to the outcrop; a 100-ft minimum overbur-den restriction is used to avoid this weathered coal. In areas where vertically adjacent beds can be sequentially mined, 40-ft minimum interburden is required for stable roof and fl oor conditions; where interburden is less than 40 ft thick, one of the adjacent coal beds is excluded from the available coal resources. Although most Wasatch Plateau mines plan for a maximum 2,500 ft overburden, some are considering mining coal at depths as deep as 3,000 ft. In anticipation of such deep mines we use a 3,000-ft burial depth restriction.
5
10
15
20
5
10
15
20
Year1980 1985 1990 1995
Ann
ual p
rodu
ctio
n (m
illio
ns o
f sh
ort
tons
)
Figure 34. Annual coal production from 1980 to 1997 for mines in the northern half of the Wasatch Plateau coal fi eld, Utah (data adapted from Jahanbani, 1997, and records from the U.S. Mine Safety and Health Administration; after Tabet and others, 1999).
900 FEET
800
700
600
500
400
300
200
100
0 FEET
Rock Canyon
Gilson
Castlegate D
Castlegate C
Castlegate B
Castlegate A
Gordon
Wattis
Bear Canyon
Blind Canyon
Cottonwood
Axel Anderson
Acord Lakes
Aberdeen Ss Mbrof BLACKHAWK Fm
BL
AC
KH
AW
K
FO
RM
AT
IO
N
Spring Canyon Mbr
of
BLACKHAWKFm
STAR POINT SsStorrs Tongue
STAR POINT SsPanther Tongue
STAR POINT Ss - lower tongues
NESW
Figure 35. Idealized stratigraphic section showing named coal beds in the Blackhawk Formation, northern Wasatch Plateau, Utah. Modi-fi ed from Blanchard (1991), Sanchez and Brown (1986, 1987), and Brown and others (1987) (after Tabet and others, 1999).
F46 Geologic Assessment of Coal in the Colorado Plateau: Arizona, Colorado, New Mexico, and Utah

We calculate that 490 million short tons of coal in the study area is unlikely to be mined because of technical restric-tions. The most signifi cant technical restriction (excess thick-ness) is due to weathered coal near the outcrop (fi g. 39). The second most signifi cant technical restriction occurs where coal beds are too thick for full-bed-thickness extraction using current mining equipment. This restriction affects parts of the Axel Anderson, Cottonwood, Blind Canyon, Wattis, and Gordon coal beds because they are sometimes more than 14 ft thick. The least signifi cant technical restriction is overburden depth—none of the coal is at depths that prevent underground mining. Cumulatively, technical restrictions eliminate 490 mil-lion short tons of coal from the resource available for future mining.
Land-Use Restrictions
Land-use restrictions considered in this study (table 13) prohibit mining under certain surface features to avoid damage due to ground subsidence. Minable coal under the buffered perimeters of these features is not part of the available coal resource. Cumulatively, land-use restrictions eliminate 146 million short tons of coal from the resource available for future mining. Nearly half of this total is attributed to the prohibition of mining under streams and lakes (fi g. 40).
28% Blind Canyon
24% Axel Anderson
21% Wattis
16% Cottonwood
4% Castlegate D
3% Acord Lakes
1% Gordon
1% Castlegate A
2% Other coal beds
5,376 MILLION SHORT TONS OF ORIGINAL MINABLE COAL
(1,484 million short tons)
(1,272 million short tons)
(1,140 million short tons)
(879 million short tons)
(209 million short tons)
(158 million s.t.)
(69 million short tons)
(69 million short tons)
Figure 36. Pie chart showing the amount of original minable coal by coal bed, Northern Wasatch Plateau study area, Utah (after Tabet and others, 1999).
Table 13. Restrictions, and their associated buffers and factors, that prevent mining in the Northern Wasatch Plateau coal field.
[After Tabet and others, 1999]
Past mining Factor
Barrier for abandoned mines 50 ft around margin Barrier for active mines none
Technical restrictions Factor
Minimum bed thickness 4 ft Maximum bed thickness 14 ft Minimum overburden 100 ft Maximum overburden 3,000 ft Minimum interburden 40 ft Faults 1 50 ft on either side
Land-use restrictions Buffer
Power lines 100 ft on either side Pipelines 100 ft on either side Highways 100 ft on either side Railroads 100 ft on either side Perennial streams 100 ft on either side Lakes or reservoirs 100 ft inland from shore Radio towers 100-ft radius Oil and gas wells 100-ft radius Towns or residences 300-ft perimeter
1 Includes igneous dikes.
Coal Availability, Recovery, Economic Evaluations of Coal Resources, Colorado Plateau: Colo., N. Mex., and Utah F47
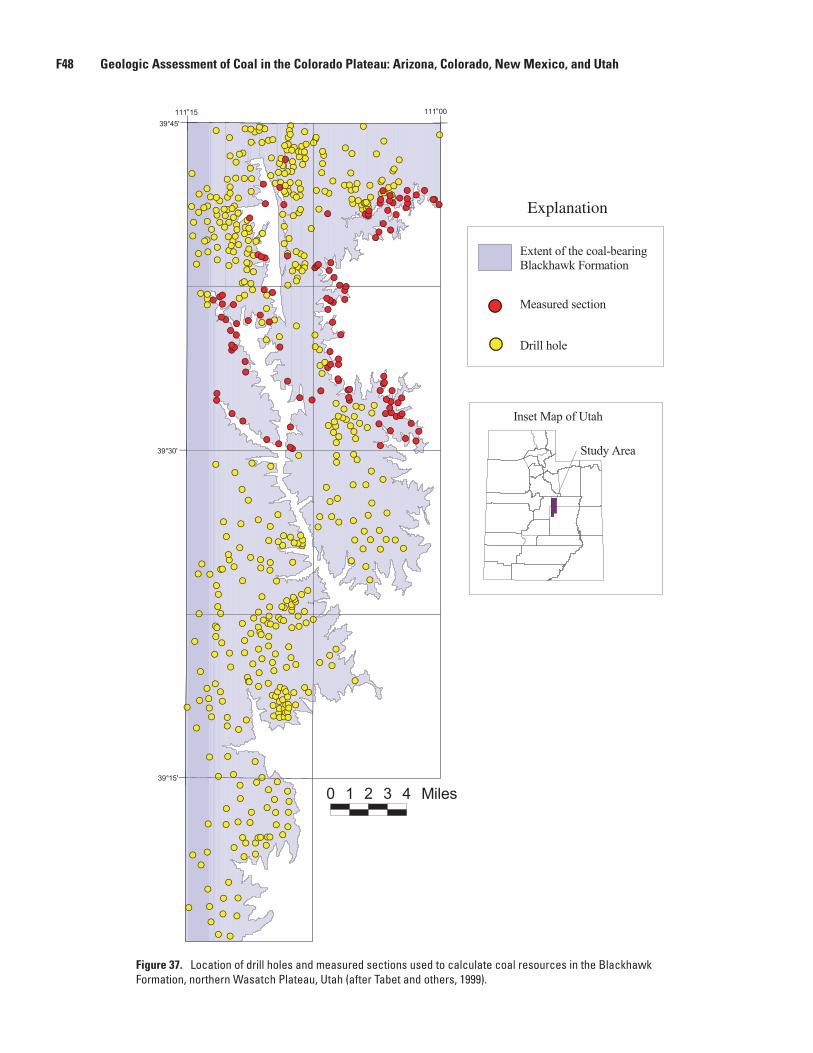
Explanation
Figure 37. Location of drill holes and measured sections used to calculate coal resources in the Blackhawk Formation, northern Wasatch Plateau, Utah (after Tabet and others, 1999).
F48 Geologic Assessment of Coal in the Colorado Plateau: Arizona, Colorado, New Mexico, and Utah
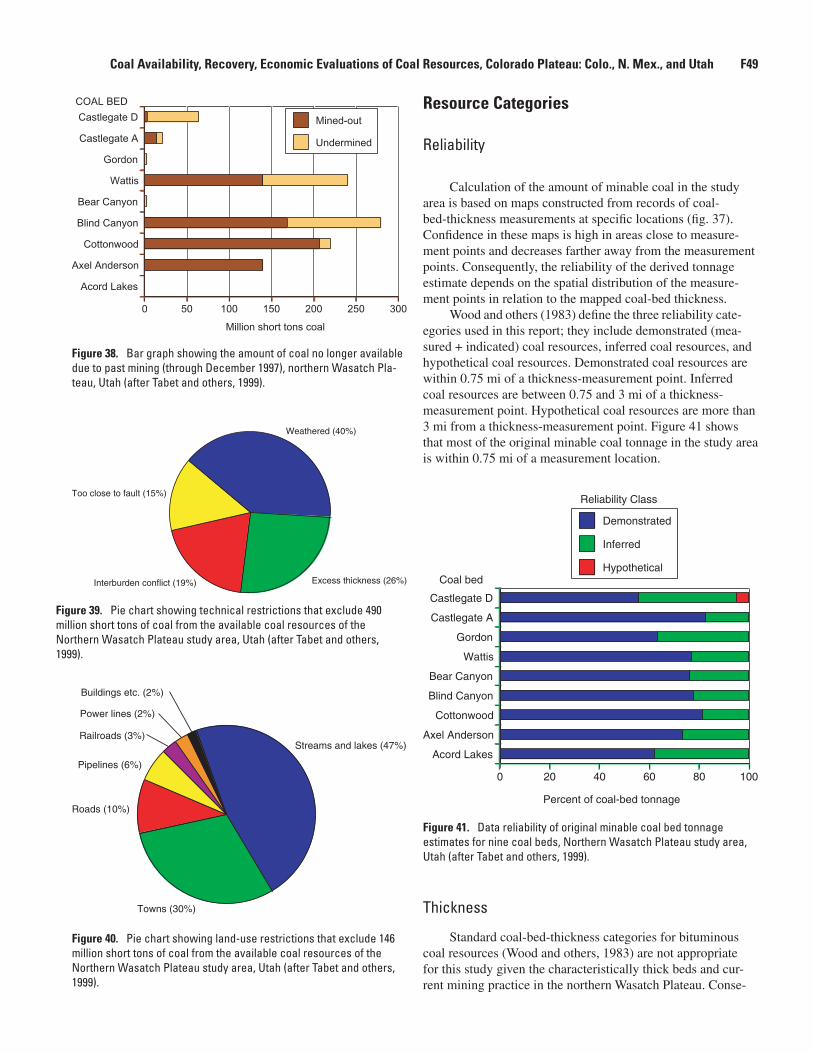
Resource Categories
Reliability
Calculation of the amount of minable coal in the study area is based on maps constructed from records of coal-bed-thickness measurements at specifi c locations (fi g. 37). Confi dence in these maps is high in areas close to measure-ment points and decreases farther away from the measurement points. Consequently, the reliability of the derived tonnage estimate depends on the spatial distribution of the measure-ment points in relation to the mapped coal-bed thickness.
Wood and others (1983) defi ne the three reliability cate-egories used in this report; they include demonstrated (mea-sured + indicated) coal resources, inferred coal resources, and hypothetical coal resources. Demonstrated coal resources are within 0.75 mi of a thickness-measurement point. Inferred coal resources are between 0.75 and 3 mi of a thickness-measurement point. Hypothetical coal resources are more than 3 mi from a thickness-measurement point. Figure 41 shows that most of the original minable coal tonnage in the study area is within 0.75 mi of a measurement location.
Acord Lakes
Axel Anderson
Cottonwood
Blind Canyon
Bear Canyon
Wattis
Gordon
Castlegate A
Castlegate D
0 50 100 150 200 250 300
Mined-out
Undermined
Million short tons coal
COAL BED
Figure 38. Bar graph showing the amount of coal no longer available due to past mining (through December 1997), northern Wasatch Pla-teau, Utah (after Tabet and others, 1999).
Weathered (40%)
Excess thickness (26%)Interburden conflict (19%)
Too close to fault (15%)
Figure 39. Pie chart showing technical restrictions that exclude 490 million short tons of coal from the available coal resources of the Northern Wasatch Plateau study area, Utah (after Tabet and others, 1999).
Streams and lakes (47%)
Towns (30%)
Roads (10%)
Pipelines (6%)
Railroads (3%)
Power lines (2%)
Buildings etc. (2%)
Figure 40. Pie chart showing land-use restrictions that exclude 146 million short tons of coal from the available coal resources of the Northern Wasatch Plateau study area, Utah (after Tabet and others, 1999).
Acord Lakes
Axel Anderson
Cottonwood
Blind Canyon
Bear Canyon
Wattis
Gordon
Castlegate A
Castlegate D
0 20 40 60 80 100
Demonstrated
Inferred
Hypothetical
Percent of coal-bed tonnage
Reliability Class
Coal bed
Figure 41. Data reliability of original minable coal bed tonnage estimates for nine coal beds, Northern Wasatch Plateau study area, Utah (after Tabet and others, 1999).
Thickness
Standard coal-bed-thickness categories for bituminous coal resources (Wood and others, 1983) are not appropriate for this study given the characteristically thick beds and cur-rent mining practice in the northern Wasatch Plateau. Conse-
Coal Availability, Recovery, Economic Evaluations of Coal Resources, Colorado Plateau: Colo., N. Mex., and Utah F49
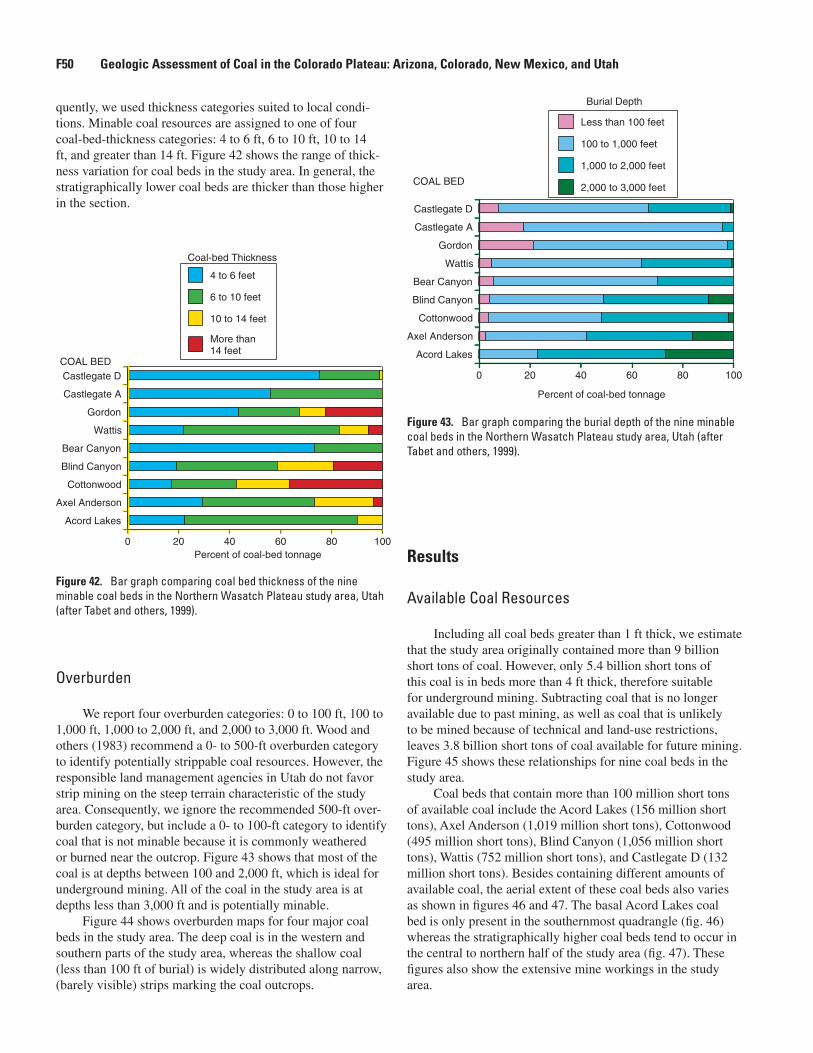
quently, we used thickness categories suited to local condi-tions. Minable coal resources are assigned to one of four coal-bed-thickness categories: 4 to 6 ft, 6 to 10 ft, 10 to 14 ft, and greater than 14 ft. Figure 42 shows the range of thick-ness variation for coal beds in the study area. In general, the stratigraphically lower coal beds are thicker than those higher in the section.
Results
Available Coal Resources
Including all coal beds greater than 1 ft thick, we estimate that the study area originally contained more than 9 billion short tons of coal. However, only 5.4 billion short tons of this coal is in beds more than 4 ft thick, therefore suitable for underground mining. Subtracting coal that is no longer available due to past mining, as well as coal that is unlikely to be mined because of technical and land-use restrictions, leaves 3.8 billion short tons of coal available for future mining. Figure 45 shows these relationships for nine coal beds in the study area.
Coal beds that contain more than 100 million short tons of available coal include the Acord Lakes (156 million short tons), Axel Anderson (1,019 million short tons), Cottonwood (495 million short tons), Blind Canyon (1,056 million short tons), Wattis (752 million short tons), and Castlegate D (132 million short tons). Besides containing different amounts of available coal, the aerial extent of these coal beds also varies as shown in fi gures 46 and 47. The basal Acord Lakes coal bed is only present in the southernmost quadrangle (fi g. 46) whereas the stratigraphically higher coal beds tend to occur in the central to northern half of the study area (fi g. 47). These fi gures also show the extensive mine workings in the study area.
Acord Lakes
Axel Anderson
Cottonwood
Blind Canyon
Bear Canyon
Wattis
Gordon
Castlegate A
Castlegate D
0 20 40 60 80 100
4 to 6 feet
6 to 10 feet
10 to 14 feet
More than 14 feet
Coal-bed Thickness
Percent of coal-bed tonnage
COAL BED
Figure 42. Bar graph comparing coal bed thickness of the nine minable coal beds in the Northern Wasatch Plateau study area, Utah (after Tabet and others, 1999).
Overburden
We report four overburden categories: 0 to 100 ft, 100 to 1,000 ft, 1,000 to 2,000 ft, and 2,000 to 3,000 ft. Wood and others (1983) recommend a 0- to 500-ft overburden category to identify potentially strippable coal resources. However, the responsible land management agencies in Utah do not favor strip mining on the steep terrain characteristic of the study area. Consequently, we ignore the recommended 500-ft over-burden category, but include a 0- to 100-ft category to identify coal that is not minable because it is commonly weathered or burned near the outcrop. Figure 43 shows that most of the coal is at depths between 100 and 2,000 ft, which is ideal for underground mining. All of the coal in the study area is at depths less than 3,000 ft and is potentially minable.
Figure 44 shows overburden maps for four major coal beds in the study area. The deep coal is in the western and southern parts of the study area, whereas the shallow coal (less than 100 ft of burial) is widely distributed along narrow, (barely visible) strips marking the coal outcrops.
Acord Lakes
Axel Anderson
Cottonwood
Blind Canyon
Bear Canyon
Wattis
Gordon
Castlegate A
Castlegate D
0 20 40 60 80 100
Less than 100 feet
100 to 1,000 feet
1,000 to 2,000 feet
2,000 to 3,000 feetCOAL BED
Percent of coal-bed tonnage
Burial Depth
Figure 43. Bar graph comparing the burial depth of the nine minable coal beds in the Northern Wasatch Plateau study area, Utah (after Tabet and others, 1999).
F50 Geologic Assessment of Coal in the Colorado Plateau: Arizona, Colorado, New Mexico, and Utah
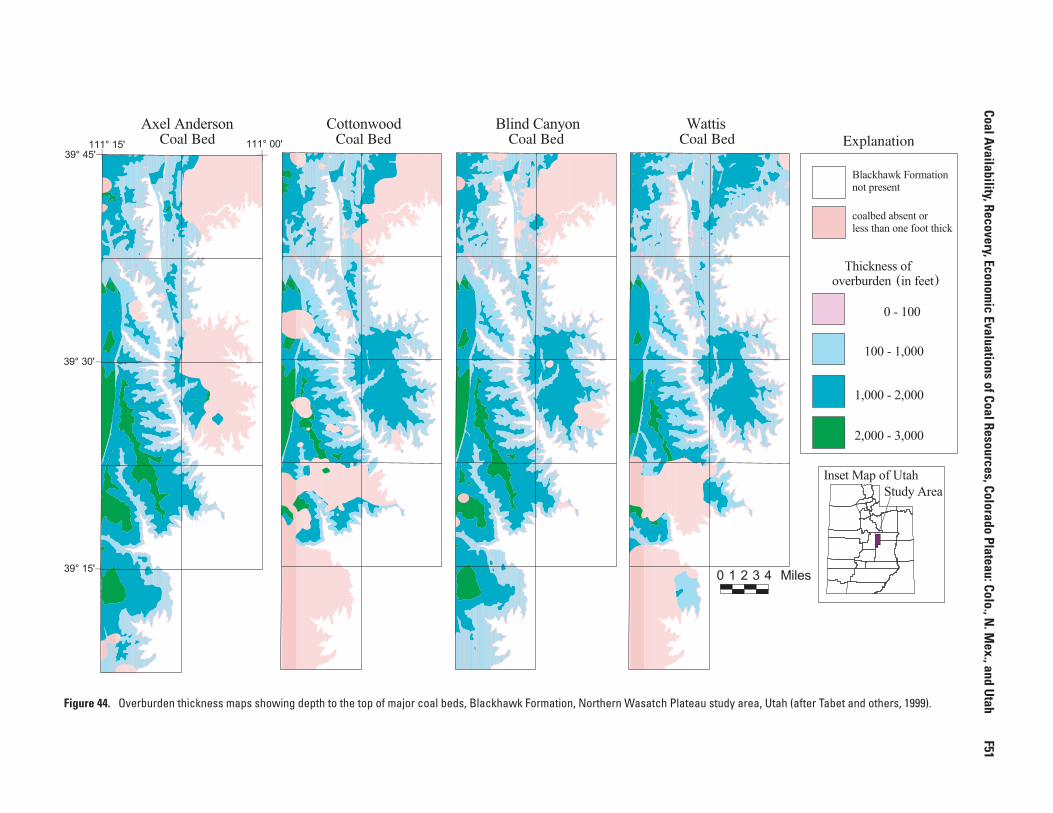
Coal Bed Coal Bed Coal Bed Coal Bed Explanation
( )
Figure 44. Overburden thickness maps showing depth to the top of major coal beds, Blackhawk Formation, Northern Wasatch Plateau study area, Utah (after Tabet and others, 1999).
Coal Availability, Recovery, Economic Evaluations of Coal Resources, Colorado Plateau: Colo., N
. Mex., and U
tah
F51
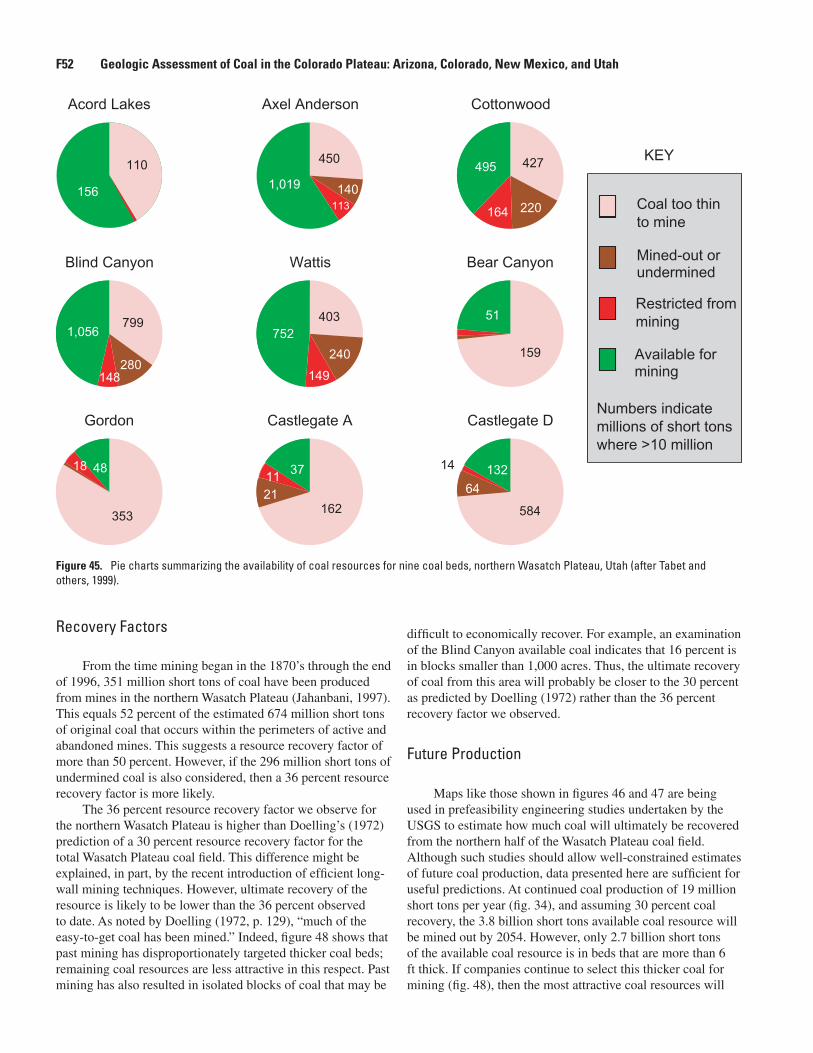
450
140113
1,019
427
220164
495
799
280148
1,056403
240
149
752
159
51
353
18 48
1622111 37
584
64
14 132
Acord Lakes Axel Anderson Cottonwood
Blind Canyon Wattis Bear Canyon
Gordon Castlegate A Castlegate D
KEY
Numbers indicatemillions of short tons where >10 million
Coal too thinto mine
Mined-out orundermined
Restricted frommining
Available formining
110
156
Figure 45. Pie charts summarizing the availability of coal resources for nine coal beds, northern Wasatch Plateau, Utah (after Tabet and others, 1999).
Recovery Factors
From the time mining began in the 1870’s through the end of 1996, 351 million short tons of coal have been produced from mines in the northern Wasatch Plateau (Jahanbani, 1997). This equals 52 percent of the estimated 674 million short tons of original coal that occurs within the perimeters of active and abandoned mines. This suggests a resource recovery factor of more than 50 percent. However, if the 296 million short tons of undermined coal is also considered, then a 36 percent resource recovery factor is more likely.
The 36 percent resource recovery factor we observe for the northern Wasatch Plateau is higher than Doelling’s (1972) prediction of a 30 percent resource recovery factor for the total Wasatch Plateau coal fi eld. This difference might be explained, in part, by the recent introduction of effi cient long-wall mining techniques. However, ultimate recovery of the resource is likely to be lower than the 36 percent observed to date. As noted by Doelling (1972, p. 129), “much of the easy-to-get coal has been mined.” Indeed, fi gure 48 shows that past mining has disproportionately targeted thicker coal beds; remaining coal resources are less attractive in this respect. Past mining has also resulted in isolated blocks of coal that may be
diffi cult to economically recover. For example, an examination of the Blind Canyon available coal indicates that 16 percent is in blocks smaller than 1,000 acres. Thus, the ultimate recovery of coal from this area will probably be closer to the 30 percent as predicted by Doelling (1972) rather than the 36 percent recovery factor we observed.
Future Production
Maps like those shown in fi gures 46 and 47 are being used in prefeasibility engineering studies undertaken by the USGS to estimate how much coal will ultimately be recovered from the northern half of the Wasatch Plateau coal fi eld. Although such studies should allow well-constrained estimates of future coal production, data presented here are suffi cient for useful predictions. At continued coal production of 19 million short tons per year (fi g. 34), and assuming 30 percent coal recovery, the 3.8 billion short tons available coal resource will be mined out by 2054. However, only 2.7 billion short tons of the available coal resource is in beds that are more than 6 ft thick. If companies continue to select this thicker coal for mining (fi g. 48), then the most attractive coal resources will
F52 Geologic Assessment of Coal in the Colorado Plateau: Arizona, Colorado, New Mexico, and Utah
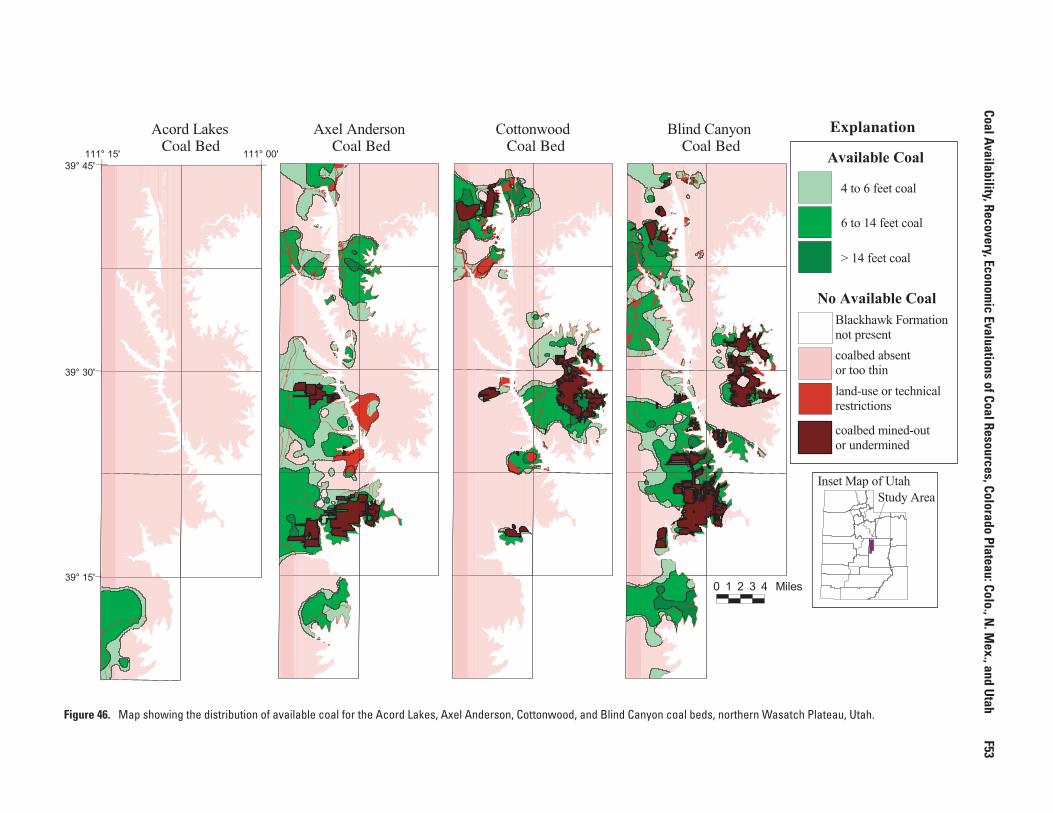
Coal Bed Coal Bed Coal Bed Coal BedExplanation
Figure 46. Map showing the distribution of available coal for the Acord Lakes, Axel Anderson, Cottonwood, and Blind Canyon coal beds, northern Wasatch Plateau, Utah.
Coal Availability, Recovery, Economic Evaluations of Coal Resources, Colorado Plateau: Colo., N
. Mex., and U
tah
F53
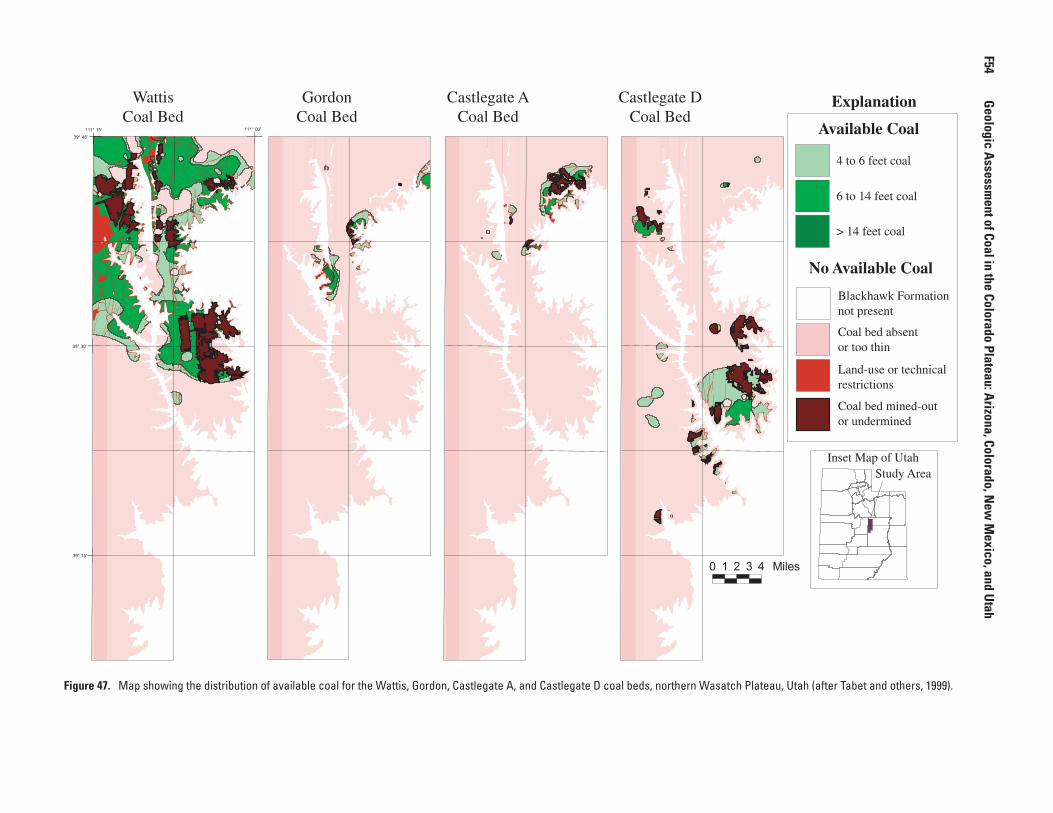
WattisCoal Bed
GordonCoal Bed
Castlegate ACoal Bed
Castlegate DCoal Bed
Explanation
Available Coal
4 to 6 feet coal
6 to 14 feet coal
> 14 feet coal
No Available Coal
Blackhawk Formationnot present
Coal bed absentor too thin
Land-use or technicalrestrictions
Coal bed mined-outor undermined
Inset Map of UtahStudy Area
Figure 47. Map showing the distribution of available coal for the Wattis, Gordon, Castlegate A, and Castlegate D coal beds, northern Wasatch Plateau, Utah (after Tabet and others, 1999).
F54
Geologic A
ssessment of Coal in the Colorado Plateau: A
rizona, Colorado, New
Mexico, and U
tah
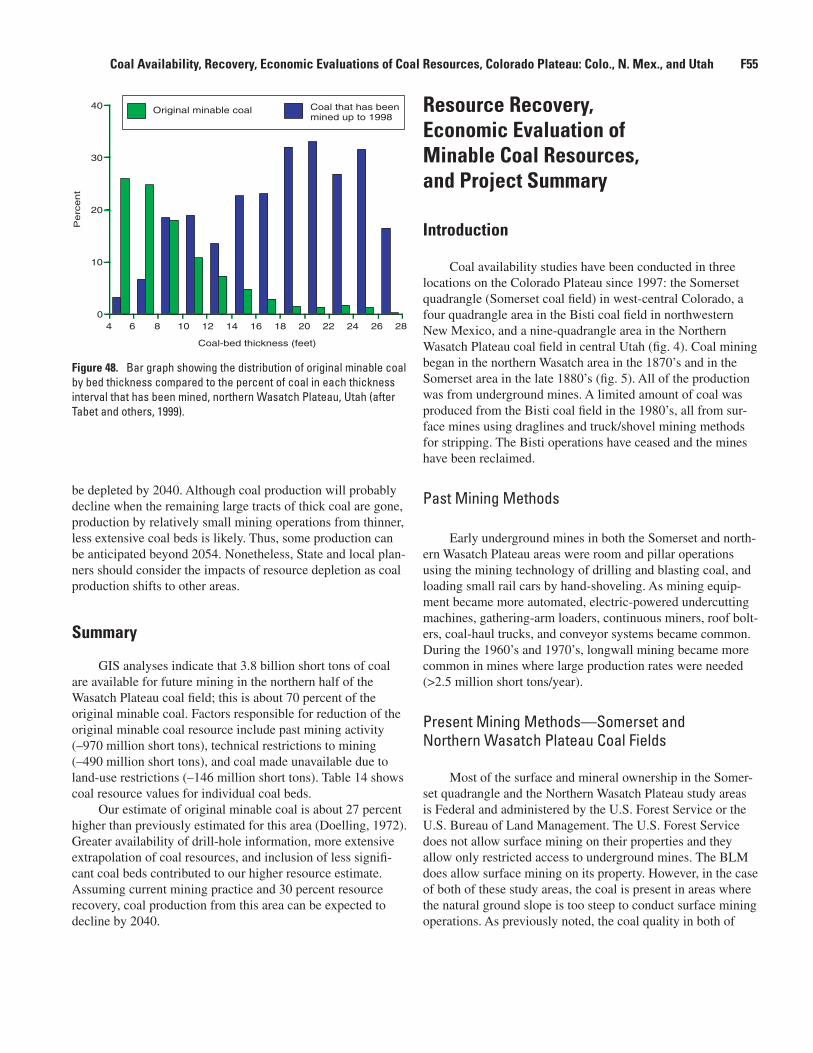
be depleted by 2040. Although coal production will probably decline when the remaining large tracts of thick coal are gone, production by relatively small mining operations from thinner, less extensive coal beds is likely. Thus, some production can be anticipated beyond 2054. Nonetheless, State and local plan-ners should consider the impacts of resource depletion as coal production shifts to other areas.
Summary
GIS analyses indicate that 3.8 billion short tons of coal are available for future mining in the northern half of the Wasatch Plateau coal fi eld; this is about 70 percent of the original minable coal. Factors responsible for reduction of the original minable coal resource include past mining activity (–970 million short tons), technical restrictions to mining (–490 million short tons), and coal made unavailable due to land-use restrictions (–146 million short tons). Table 14 shows coal resource values for individual coal beds.
Our estimate of original minable coal is about 27 percent higher than previously estimated for this area (Doelling, 1972). Greater availability of drill-hole information, more extensive extrapolation of coal resources, and inclusion of less signifi -cant coal beds contributed to our higher resource estimate. Assuming current mining practice and 30 percent resource recovery, coal production from this area can be expected to decline by 2040.
Resource Recovery, Economic Evaluation of Minable Coal Resources, and Project Summary
Introduction
Coal availability studies have been conducted in three locations on the Colorado Plateau since 1997: the Somerset quadrangle (Somerset coal fi eld) in west-central Colorado, a four quadrangle area in the Bisti coal fi eld in northwestern New Mexico, and a nine-quadrangle area in the Northern Wasatch Plateau coal fi eld in central Utah (fi g. 4). Coal mining began in the northern Wasatch area in the 1870’s and in the Somerset area in the late 1880’s (fi g. 5). All of the production was from underground mines. A limited amount of coal was produced from the Bisti coal fi eld in the 1980’s, all from sur-face mines using draglines and truck/shovel mining methods for stripping. The Bisti operations have ceased and the mines have been reclaimed.
Past Mining Methods
Early underground mines in both the Somerset and north-ern Wasatch Plateau areas were room and pillar operations using the mining technology of drilling and blasting coal, and loading small rail cars by hand-shoveling. As mining equip-ment became more automated, electric-powered undercutting machines, gathering-arm loaders, continuous miners, roof bolt-ers, coal-haul trucks, and conveyor systems became common. During the 1960’s and 1970’s, longwall mining became more common in mines where large production rates were needed (>2.5 million short tons/year).
Present Mining Methods—Somerset and Northern Wasatch Plateau Coal Fields
Most of the surface and mineral ownership in the Somer-set quadrangle and the Northern Wasatch Plateau study areas is Federal and administered by the U.S. Forest Service or the U.S. Bureau of Land Management. The U.S. Forest Service does not allow surface mining on their properties and they allow only restricted access to underground mines. The BLM does allow surface mining on its property. However, in the case of both of these study areas, the coal is present in areas where the natural ground slope is too steep to conduct surface mining operations. As previously noted, the coal quality in both of
Coal-bed thickness (feet)
Pe
rce
nt
0
10
20
30
40
64 8 10 12 14 16 18 20 22 24 26 28
Original minable coal Coal that has beenmined up to 1998
Figure 48. Bar graph showing the distribution of original minable coal by bed thickness compared to the percent of coal in each thickness interval that has been mined, northern Wasatch Plateau, Utah (after Tabet and others, 1999).
Coal Availability, Recovery, Economic Evaluations of Coal Resources, Colorado Plateau: Colo., N. Mex., and Utah F55
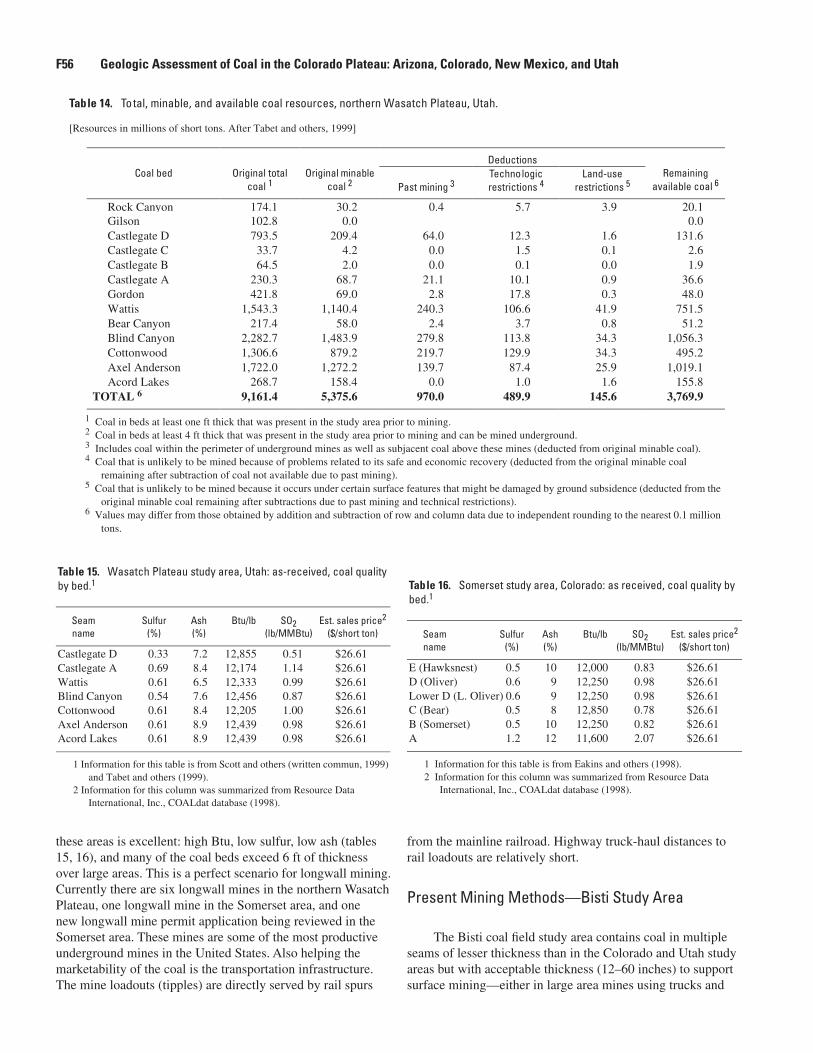
these areas is excellent: high Btu, low sulfur, low ash (tables 15, 16), and many of the coal beds exceed 6 ft of thickness over large areas. This is a perfect scenario for longwall mining. Currently there are six longwall mines in the northern Wasatch Plateau, one longwall mine in the Somerset area, and one new longwall mine permit application being reviewed in the Somerset area. These mines are some of the most productive underground mines in the United States. Also helping the marketability of the coal is the transportation infrastructure. The mine loadouts (tipples) are directly served by rail spurs
from the mainline railroad. Highway truck-haul distances to rail loadouts are relatively short.
Present Mining Methods—Bisti Study Area
The Bisti coal fi eld study area contains coal in multiple seams of lesser thickness than in the Colorado and Utah study areas but with acceptable thickness (12–60 inches) to support surface mining—either in large area mines using trucks and
Table 14. Total, minable, and available coal resources, northern Wasatch Plateau, Utah.
[Resources in millions of short tons. After Tabet and others, 1999]
Deductions Coal bed
Original total
coal 1
Original minable
coal 2
Past mining 3 Technologic restrictions 4
Land-use restrictions 5
Remaining
available coal 6 Rock Canyon 174.1 30.2 0.4 5.7 3.9 20.1 Gilson 102.8 0.0 0.0 Castlegate D 793.5 209.4 64.0 12.3 1.6 131.6 Castlegate C 33.7 4.2 0.0 1.5 0.1 2.6 Castlegate B 64.5 2.0 0.0 0.1 0.0 1.9 Castlegate A 230.3 68.7 21.1 10.1 0.9 36.6 Gordon 421.8 69.0 2.8 17.8 0.3 48.0 Wattis 1,543.3 1,140.4 240.3 106.6 41.9 751.5 Bear Canyon 217.4 58.0 2.4 3.7 0.8 51.2 Blind Canyon 2,282.7 1,483.9 279.8 113.8 34.3 1,056.3 Cottonwood 1,306.6 879.2 219.7 129.9 34.3 495.2 Axel Anderson 1,722.0 1,272.2 139.7 87.4 25.9 1,019.1 Acord Lakes 268.7 158.4 0.0 1.0 1.6 155.8 TOTAL 6 9,161.4 5,375.6 970.0 489.9 145.6 3,769.9
1 Coal in beds at least one ft thick that was present in the study area prior to mining. 2 Coal in beds at least 4 ft thick that was present in the study area prior to mining and can be mined underground. 3 Includes coal within the perimeter of underground mines as well as subjacent coal above these mines (deducted from original minable coal). 4 Coal that is unlikely to be mined because of problems related to its safe and economic recovery (deducted from the original minable coal
remaining after subtraction of coal not available due to past mining). 5 Coal that is unlikely to be mined because it occurs under certain surface features that might be damaged by ground subsidence (deducted from the
original minable coal remaining after subtractions due to past mining and technical restrictions). 6 Values may differ from those obtained by addition and subtraction of row and column data due to independent rounding to the nearest 0.1 million
tons.
Table 15. Wasatch Plateau study area, Utah: as-received, coal quality by bed.1
Seam Sulfur Ash Btu/lb SO2 Est. sales price2 name (%) (%) (lb/MMBtu) ($/short ton)
Castlegate D 0.33 7.2 12,855 0.51 $26.61 Castlegate A 0.69 8.4 12,174 1.14 $26.61 Wattis 0.61 6.5 12,333 0.99 $26.61 Blind Canyon 0.54 7.6 12,456 0.87 $26.61 Cottonwood 0.61 8.4 12,205 1.00 $26.61 Axel Anderson 0.61 8.9 12,439 0.98 $26.61 Acord Lakes 0.61 8.9 12,439 0.98 $26.61
1 Information for this table is from Scott and others (written commun, 1999) and Tabet and others (1999).
2 Information for this column was summarized from Resource Data International, Inc., COALdat database (1998).
Table 16. Somerset study area, Colorado: as received, coal quality by bed.1
Seam Sulfur Ash Btu/lb SO2 Est. sales price2 name (%) (%) (lb/MMBtu) ($/short ton)
E (Hawksnest) 0.5 10 12,000 0.83 $26.61 D (Oliver) 0.6 9 12,250 0.98 $26.61 Lower D (L. Oliver) 0.6 9 12,250 0.98 $26.61 C (Bear) 0.5 8 12,850 0.78 $26.61 B (Somerset) 0.5 10 12,250 0.82 $26.61 A 1.2 12 11,600 2.07 $26.61
1 Information for this table is from Eakins and others (1998). 2 Information for this column was summarized from Resource Data
International, Inc., COALdat database (1998).
F56 Geologic Assessment of Coal in the Colorado Plateau: Arizona, Colorado, New Mexico, and Utah
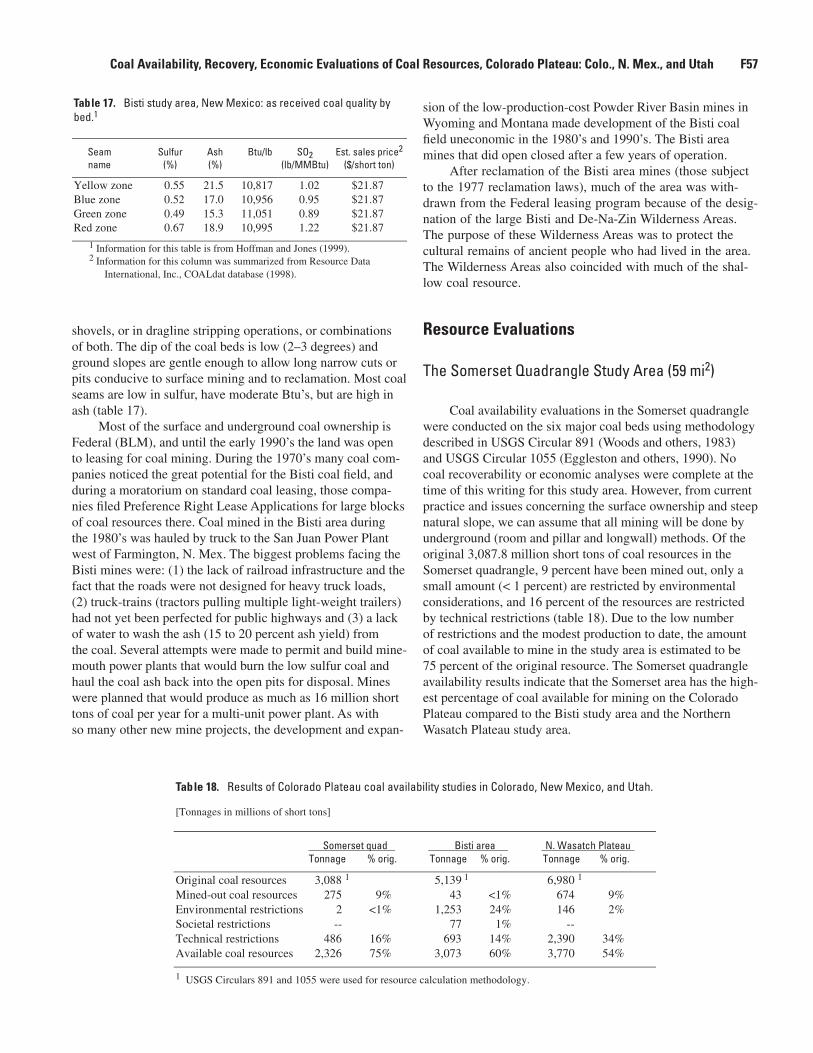
shovels, or in dragline stripping operations, or combinations of both. The dip of the coal beds is low (2–3 degrees) and ground slopes are gentle enough to allow long narrow cuts or pits conducive to surface mining and to reclamation. Most coal seams are low in sulfur, have moderate Btu’s, but are high in ash (table 17).
Most of the surface and underground coal ownership is Federal (BLM), and until the early 1990’s the land was open to leasing for coal mining. During the 1970’s many coal com-panies noticed the great potential for the Bisti coal fi eld, and during a moratorium on standard coal leasing, those compa-nies fi led Preference Right Lease Applications for large blocks of coal resources there. Coal mined in the Bisti area during the 1980’s was hauled by truck to the San Juan Power Plant west of Farmington, N. Mex. The biggest problems facing the Bisti mines were: (1) the lack of railroad infrastructure and the fact that the roads were not designed for heavy truck loads, (2) truck-trains (tractors pulling multiple light-weight trailers) had not yet been perfected for public highways and (3) a lack of water to wash the ash (15 to 20 percent ash yield) from the coal. Several attempts were made to permit and build mine-mouth power plants that would burn the low sulfur coal and haul the coal ash back into the open pits for disposal. Mines were planned that would produce as much as 16 million short tons of coal per year for a multi-unit power plant. As with so many other new mine projects, the development and expan-
sion of the low-production-cost Powder River Basin mines in Wyoming and Montana made development of the Bisti coal fi eld uneconomic in the 1980’s and 1990’s. The Bisti area mines that did open closed after a few years of operation.
After reclamation of the Bisti area mines (those subject to the 1977 reclamation laws), much of the area was with-drawn from the Federal leasing program because of the desig-nation of the large Bisti and De-Na-Zin Wilderness Areas. The purpose of these Wilderness Areas was to protect the cultural remains of ancient people who had lived in the area. The Wilderness Areas also coincided with much of the shal-low coal resource.
Resource Evaluations
The Somerset Quadrangle Study Area (59 mi2)
Coal availability evaluations in the Somerset quadrangle were conducted on the six major coal beds using methodology described in USGS Circular 891 (Woods and others, 1983) and USGS Circular 1055 (Eggleston and others, 1990). No coal recoverability or economic analyses were complete at the time of this writing for this study area. However, from current practice and issues concerning the surface ownership and steep natural slope, we can assume that all mining will be done by underground (room and pillar and longwall) methods. Of the original 3,087.8 million short tons of coal resources in the Somerset quadrangle, 9 percent have been mined out, only a small amount (< 1 percent) are restricted by environmental considerations, and 16 percent of the resources are restricted by technical restrictions (table 18). Due to the low number of restrictions and the modest production to date, the amount of coal available to mine in the study area is estimated to be 75 percent of the original resource. The Somerset quadrangle availability results indicate that the Somerset area has the high-est percentage of coal available for mining on the Colorado Plateau compared to the Bisti study area and the Northern Wasatch Plateau study area.
Table 17. Bisti study area, New Mexico: as received coal quality by bed.1
Seam Sulfur Ash Btu/lb SO2 Est. sales price2 name (%) (%) (lb/MMBtu) ($/short ton) Yellow zone 0.55 21.5 10,817 1.02 $21.87 Blue zone 0.52 17.0 10,956 0.95 $21.87 Green zone 0.49 15.3 11,051 0.89 $21.87 Red zone 0.67 18.9 10,995 1.22 $21.87
1 Information for this table is from Hoffman and Jones (1999). 2 Information for this column was summarized from Resource Data
International, Inc., COALdat database (1998).
Table 18. Results of Colorado Plateau coal availability studies in Colorado, New Mexico, and Utah.
[Tonnages in millions of short tons]
Somerset quad Bisti area N. Wasatch Plateau Tonnage % orig. Tonnage % orig. Tonnage % orig. Original coal resources 3,088 1 5,139 1 6,980 1 Mined-out coal resources 275 9% 43 <1% 674 9% Environmental restrictions 2 <1% 1,253 24% 146 2% Societal restrictions -- 77 1% -- Technical restrictions 486 16% 693 14% 2,390 34% Available coal resources 2,326 75% 3,073 60% 3,770 54% 1 USGS Circulars 891 and 1055 were used for resource calculation methodology.
Coal Availability, Recovery, Economic Evaluations of Coal Resources, Colorado Plateau: Colo., N. Mex., and Utah F57
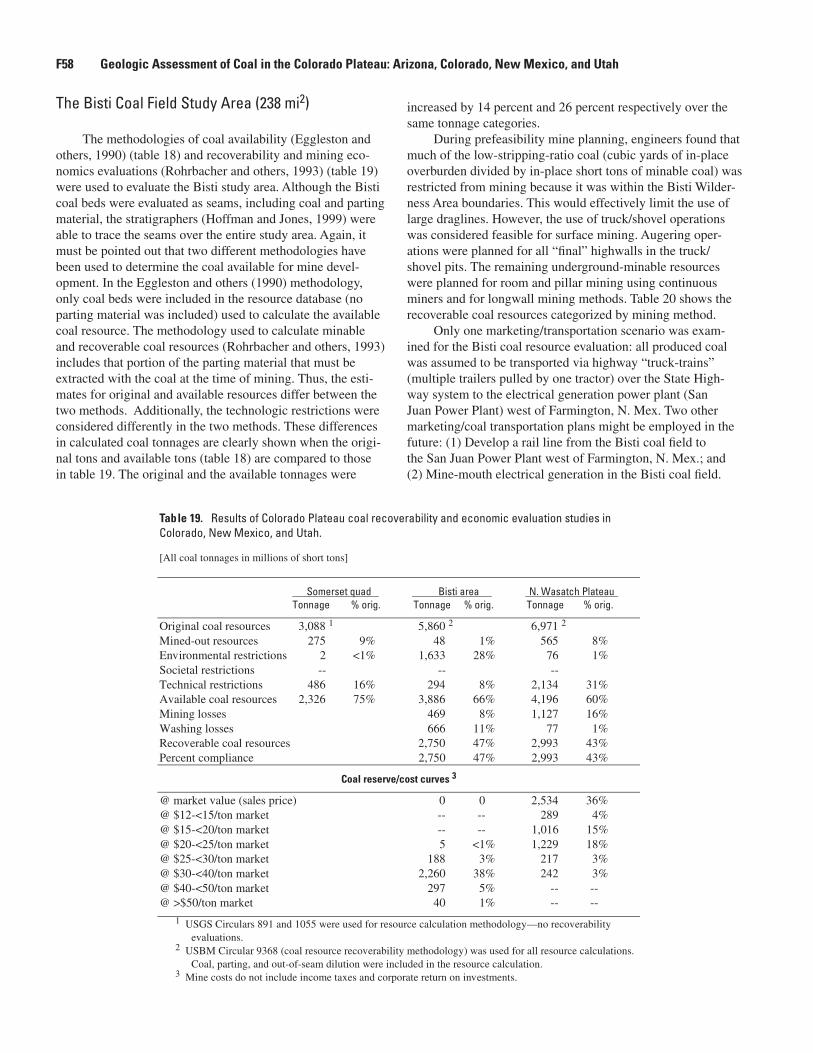
The Bisti Coal Field Study Area (238 mi2)
The methodologies of coal availability (Eggleston and others, 1990) (table 18) and recoverability and mining eco-nomics evaluations (Rohrbacher and others, 1993) (table 19) were used to evaluate the Bisti study area. Although the Bisti coal beds were evaluated as seams, including coal and parting material, the stratigraphers (Hoffman and Jones, 1999) were able to trace the seams over the entire study area. Again, it must be pointed out that two different methodologies have been used to determine the coal available for mine devel-opment. In the Eggleston and others (1990) methodology, only coal beds were included in the resource database (no parting material was included) used to calculate the available coal resource. The methodology used to calculate minable and recoverable coal resources (Rohrbacher and others, 1993) includes that portion of the parting material that must be extracted with the coal at the time of mining. Thus, the esti-mates for original and available resources differ between the two methods. Additionally, the technologic restrictions were considered differently in the two methods. These differences in calculated coal tonnages are clearly shown when the origi-nal tons and available tons (table 18) are compared to those in table 19. The original and the available tonnages were
increased by 14 percent and 26 percent respectively over the same tonnage categories.
During prefeasibility mine planning, engineers found that much of the low-stripping-ratio coal (cubic yards of in-place overburden divided by in-place short tons of minable coal) was restricted from mining because it was within the Bisti Wilder-ness Area boundaries. This would effectively limit the use of large draglines. However, the use of truck/shovel operations was considered feasible for surface mining. Augering oper-ations were planned for all “fi nal” highwalls in the truck/shovel pits. The remaining underground-minable resources were planned for room and pillar mining using continuous miners and for longwall mining methods. Table 20 shows the recoverable coal resources categorized by mining method.
Only one marketing/transportation scenario was exam-ined for the Bisti coal resource evaluation: all produced coal was assumed to be transported via highway “truck-trains” (multiple trailers pulled by one tractor) over the State High-way system to the electrical generation power plant (San Juan Power Plant) west of Farmington, N. Mex. Two other marketing/coal transportation plans might be employed in the future: (1) Develop a rail line from the Bisti coal fi eld to the San Juan Power Plant west of Farmington, N. Mex.; and (2) Mine-mouth electrical generation in the Bisti coal fi eld.
Table 19. Results of Colorado Plateau coal recoverability and economic evaluation studies in Colorado, New Mexico, and Utah.
[All coal tonnages in millions of short tons]
Somerset quad Bisti area N. Wasatch Plateau Tonnage % orig. Tonnage % orig. Tonnage % orig. Original coal resources 3,088 1 5,860 2 6,971 2 Mined-out resources 275 9% 48 1% 565 8% Environmental restrictions 2 <1% 1,633 28% 76 1% Societal restrictions -- -- -- Technical restrictions 486 16% 294 8% 2,134 31% Available coal resources 2,326 75% 3,886 66% 4,196 60% Mining losses 469 8% 1,127 16% Washing losses 666 11% 77 1% Recoverable coal resources 2,750 47% 2,993 43% Percent compliance 2,750 47% 2,993 43%
Coal reserve/cost curves 3
@ market value (sales price) 0 0 2,534 36% @ $12-<15/ton market -- -- 289 4% @ $15-<20/ton market -- -- 1,016 15% @ $20-<25/ton market 5 <1% 1,229 18% @ $25-<30/ton market 188 3% 217 3% @ $30-<40/ton market 2,260 38% 242 3% @ $40-<50/ton market 297 5% -- -- @ >$50/ton market 40 1% -- --
1 USGS Circulars 891 and 1055 were used for resource calculation methodology—no recoverability
evaluations. 2 USBM Circular 9368 (coal resource recoverability methodology) was used for all resource calculations.
Coal, parting, and out-of-seam dilution were included in the resource calculation. 3 Mine costs do not include income taxes and corporate return on investments.
F58 Geologic Assessment of Coal in the Colorado Plateau: Arizona, Colorado, New Mexico, and Utah
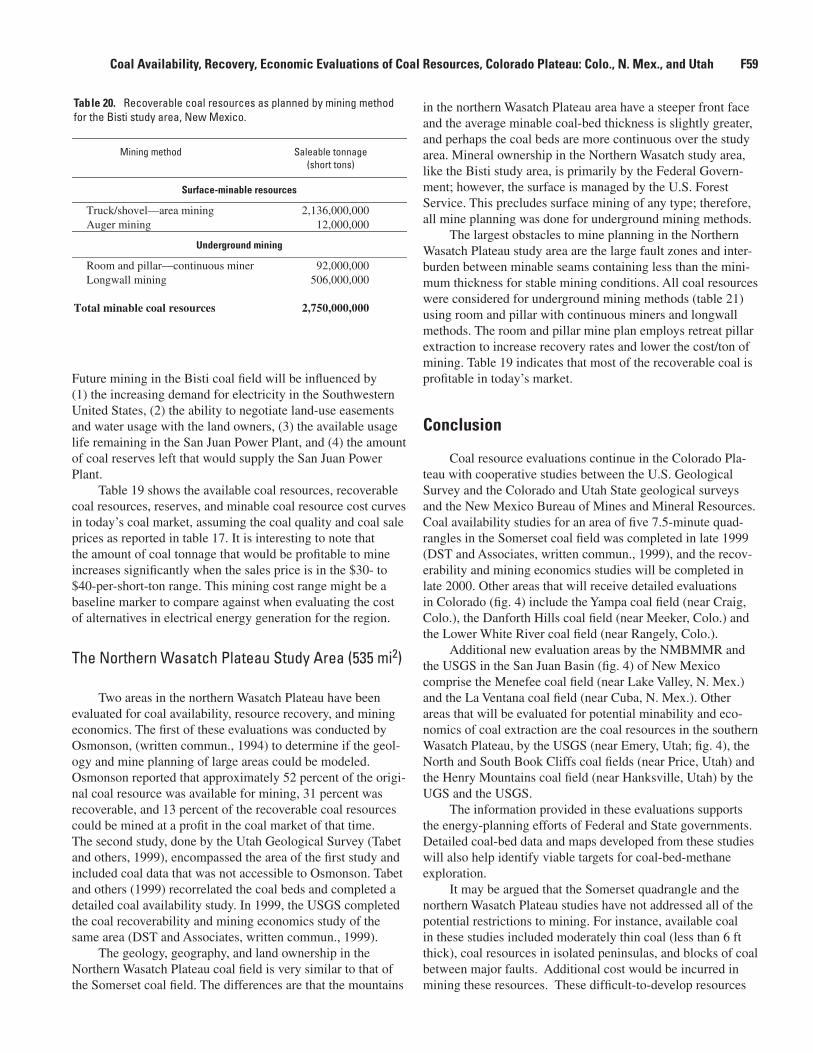
Future mining in the Bisti coal fi eld will be infl uenced by (1) the increasing demand for electricity in the Southwestern United States, (2) the ability to negotiate land-use easements and water usage with the land owners, (3) the available usage life remaining in the San Juan Power Plant, and (4) the amount of coal reserves left that would supply the San Juan Power Plant.
Table 19 shows the available coal resources, recoverable coal resources, reserves, and minable coal resource cost curves in today’s coal market, assuming the coal quality and coal sale prices as reported in table 17. It is interesting to note that the amount of coal tonnage that would be profi table to mine increases signifi cantly when the sales price is in the $30- to $40-per-short-ton range. This mining cost range might be a baseline marker to compare against when evaluating the cost of alternatives in electrical energy generation for the region.
The Northern Wasatch Plateau Study Area (535 mi2)
Two areas in the northern Wasatch Plateau have been evaluated for coal availability, resource recovery, and mining economics. The fi rst of these evaluations was conducted by Osmonson, (written commun., 1994) to determine if the geol-ogy and mine planning of large areas could be modeled. Osmonson reported that approximately 52 percent of the origi-nal coal resource was available for mining, 31 percent was recoverable, and 13 percent of the recoverable coal resources could be mined at a profi t in the coal market of that time. The second study, done by the Utah Geological Survey (Tabet and others, 1999), encompassed the area of the fi rst study and included coal data that was not accessible to Osmonson. Tabet and others (1999) recorrelated the coal beds and completed a detailed coal availability study. In 1999, the USGS completed the coal recoverability and mining economics study of the same area (DST and Associates, written commun., 1999).
The geology, geography, and land ownership in the Northern Wasatch Plateau coal fi eld is very similar to that of the Somerset coal fi eld. The differences are that the mountains
in the northern Wasatch Plateau area have a steeper front face and the average minable coal-bed thickness is slightly greater, and perhaps the coal beds are more continuous over the study area. Mineral ownership in the Northern Wasatch study area, like the Bisti study area, is primarily by the Federal Govern-ment; however, the surface is managed by the U.S. Forest Service. This precludes surface mining of any type; therefore, all mine planning was done for underground mining methods.
The largest obstacles to mine planning in the Northern Wasatch Plateau study area are the large fault zones and inter-burden between minable seams containing less than the mini-mum thickness for stable mining conditions. All coal resources were considered for underground mining methods (table 21) using room and pillar with continuous miners and longwall methods. The room and pillar mine plan employs retreat pillar extraction to increase recovery rates and lower the cost/ton of mining. Table 19 indicates that most of the recoverable coal is profi table in today’s market.
Conclusion
Coal resource evaluations continue in the Colorado Pla-teau with cooperative studies between the U.S. Geological Survey and the Colorado and Utah State geological surveys and the New Mexico Bureau of Mines and Mineral Resources. Coal availability studies for an area of fi ve 7.5-minute quad-rangles in the Somerset coal fi eld was completed in late 1999 (DST and Associates, written commun., 1999), and the recov-erability and mining economics studies will be completed in late 2000. Other areas that will receive detailed evaluations in Colorado (fi g. 4) include the Yampa coal fi eld (near Craig, Colo.), the Danforth Hills coal fi eld (near Meeker, Colo.) and the Lower White River coal fi eld (near Rangely, Colo.).
Additional new evaluation areas by the NMBMMR and the USGS in the San Juan Basin (fi g. 4) of New Mexico comprise the Menefee coal fi eld (near Lake Valley, N. Mex.) and the La Ventana coal fi eld (near Cuba, N. Mex.). Other areas that will be evaluated for potential minability and eco-nomics of coal extraction are the coal resources in the southern Wasatch Plateau, by the USGS (near Emery, Utah; fi g. 4), the North and South Book Cliffs coal fi elds (near Price, Utah) and the Henry Mountains coal fi eld (near Hanksville, Utah) by the UGS and the USGS.
The information provided in these evaluations supports the energy-planning efforts of Federal and State governments. Detailed coal-bed data and maps developed from these studies will also help identify viable targets for coal-bed-methane exploration.
It may be argued that the Somerset quadrangle and the northern Wasatch Plateau studies have not addressed all of the potential restrictions to mining. For instance, available coal in these studies included moderately thin coal (less than 6 ft thick), coal resources in isolated peninsulas, and blocks of coal between major faults. Additional cost would be incurred in mining these resources. These diffi cult-to-develop resources
Table 20. Recoverable coal resources as planned by mining method for the Bisti study area, New Mexico.
Mining method Saleable tonnage (short tons)
Surface-minable resources
Truck/shovel—area mining 2,136,000,000 Auger mining 12,000,000
Underground mining
Room and pillar—continuous miner 92,000,000 Longwall mining 506,000,000 Total minable coal resources 2,750,000,000
Coal Availability, Recovery, Economic Evaluations of Coal Resources, Colorado Plateau: Colo., N. Mex., and Utah F59
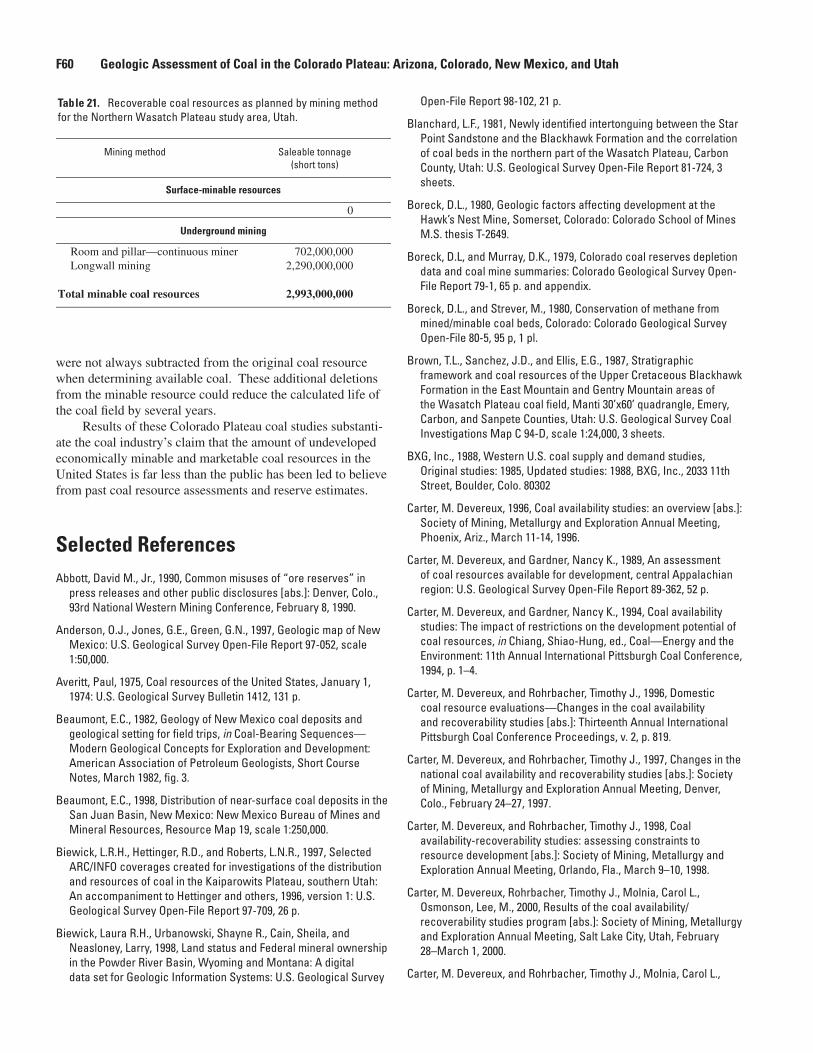
were not always subtracted from the original coal resource when determining available coal. These additional deletions from the minable resource could reduce the calculated life of the coal fi eld by several years.
Results of these Colorado Plateau coal studies substanti-ate the coal industry’s claim that the amount of undeveloped economically minable and marketable coal resources in the United States is far less than the public has been led to believe from past coal resource assessments and reserve estimates.
Selected ReferencesAbbott, David M., Jr., 1990, Common misuses of “ore reserves” in
press releases and other public disclosures [abs.]: Denver, Colo., 93rd National Western Mining Conference, February 8, 1990.
Anderson, O.J., Jones, G.E., Green, G.N., 1997, Geologic map of New Mexico: U.S. Geological Survey Open-File Report 97-052, scale 1:50,000.
Averitt, Paul, 1975, Coal resources of the United States, January 1, 1974: U.S. Geological Survey Bulletin 1412, 131 p.
Beaumont, E.C., 1982, Geology of New Mexico coal deposits and geological setting for fi eld trips, in Coal-Bearing Sequences—Modern Geological Concepts for Exploration and Development: American Association of Petroleum Geologists, Short Course Notes, March 1982, fi g. 3.
Beaumont, E.C., 1998, Distribution of near-surface coal deposits in the San Juan Basin, New Mexico: New Mexico Bureau of Mines and Mineral Resources, Resource Map 19, scale 1:250,000.
Biewick, L.R.H., Hettinger, R.D., and Roberts, L.N.R., 1997, Selected ARC/INFO coverages created for investigations of the distribution and resources of coal in the Kaiparowits Plateau, southern Utah: An accompaniment to Hettinger and others, 1996, version 1: U.S. Geological Survey Open-File Report 97-709, 26 p.
Biewick, Laura R.H., Urbanowski, Shayne R., Cain, Sheila, and Neasloney, Larry, 1998, Land status and Federal mineral ownership in the Powder River Basin, Wyoming and Montana: A digital data set for Geologic Information Systems: U.S. Geological Survey
Open-File Report 98-102, 21 p.
Blanchard, L.F., 1981, Newly identifi ed intertonguing between the Star Point Sandstone and the Blackhawk Formation and the correlation of coal beds in the northern part of the Wasatch Plateau, Carbon County, Utah: U.S. Geological Survey Open-File Report 81-724, 3 sheets.
Boreck, D.L., 1980, Geologic factors affecting development at the Hawk’s Nest Mine, Somerset, Colorado: Colorado School of Mines M.S. thesis T-2649.
Boreck, D.L, and Murray, D.K., 1979, Colorado coal reserves depletion data and coal mine summaries: Colorado Geological Survey Open-File Report 79-1, 65 p. and appendix.
Boreck, D.L., and Strever, M., 1980, Conservation of methane from mined/minable coal beds, Colorado: Colorado Geological Survey Open-File 80-5, 95 p, 1 pl.
Brown, T.L., Sanchez, J.D., and Ellis, E.G., 1987, Stratigraphic framework and coal resources of the Upper Cretaceous Blackhawk Formation in the East Mountain and Gentry Mountain areas of the Wasatch Plateau coal fi eld, Manti 30’x60’ quadrangle, Emery, Carbon, and Sanpete Counties, Utah: U.S. Geological Survey Coal Investigations Map C 94-D, scale 1:24,000, 3 sheets.
BXG, Inc., 1988, Western U.S. coal supply and demand studies, Original studies: 1985, Updated studies: 1988, BXG, Inc., 2033 11th Street, Boulder, Colo. 80302
Carter, M. Devereux, 1996, Coal availability studies: an overview [abs.]: Society of Mining, Metallurgy and Exploration Annual Meeting, Phoenix, Ariz., March 11-14, 1996.
Carter, M. Devereux, and Gardner, Nancy K., 1989, An assessment of coal resources available for development, central Appalachian region: U.S. Geological Survey Open-File Report 89-362, 52 p.
Carter, M. Devereux, and Gardner, Nancy K., 1994, Coal availability studies: The impact of restrictions on the development potential of coal resources, in Chiang, Shiao-Hung, ed., Coal—Energy and the Environment: 11th Annual International Pittsburgh Coal Conference, 1994, p. 1–4.
Carter, M. Devereux, and Rohrbacher, Timothy J., 1996, Domestic coal resource evaluations—Changes in the coal availability and recoverability studies [abs.]: Thirteenth Annual International Pittsburgh Coal Conference Proceedings, v. 2, p. 819.
Carter, M. Devereux, and Rohrbacher, Timothy J., 1997, Changes in the national coal availability and recoverability studies [abs.]: Society of Mining, Metallurgy and Exploration Annual Meeting, Denver, Colo., February 24–27, 1997.
Carter, M. Devereux, and Rohrbacher, Timothy J., 1998, Coal availability-recoverability studies: assessing constraints to resource development [abs.]: Society of Mining, Metallurgy and Exploration Annual Meeting, Orlando, Fla., March 9–10, 1998.
Carter, M. Devereux, Rohrbacher, Timothy J., Molnia, Carol L., Osmonson, Lee, M., 2000, Results of the coal availability/recoverability studies program [abs.]: Society of Mining, Metallurgy and Exploration Annual Meeting, Salt Lake City, Utah, February 28–March 1, 2000.
Carter, M. Devereux, and Rohrbacher, Timothy J., Molnia, Carol L.,
Table 21. Recoverable coal resources as planned by mining method for the Northern Wasatch Plateau study area, Utah.
Mining method Saleable tonnage (short tons)
Surface-minable resources
0
Underground mining
Room and pillar—continuous miner 702,000,000 Longwall mining 2,290,000,000 Total minable coal resources 2,993,000,000
F60 Geologic Assessment of Coal in the Colorado Plateau: Arizona, Colorado, New Mexico, and Utah
Osmonson, Lee, M., Biewick, Laura R.H., and Larson, W.S., 1999a, Coal availability/recoverability studies: modeling nears completion in the central and northern Appalachian regions [abs.]: Society of Mining, Metallurgy and Exploration Annual Meeting, Denver, Colo., March 1–3, 1999.
Carter, M. Devereux, and Rohrbacher, Timothy J., Molnia, Carol L., Osmonson, Lee, M., Biewick, Laura R.H., and Larson, W.S., 1999b, Coal availability/recoverability studies: applications of GIS to environmental/resource development issues [abs.]: U.S. Department of The Interior, Conference of the Environment, Denver, Colo., May 1999.
Carter, M. Devereux, and Rohrbacher, Timothy J., Molnia, Carol L., Osmonson, Lee, M., Biewick, Laura R.H., Larson, William S., Scott, David C., and Teeters, Dale T., 1998, U.S. coal resource evaluations utilizing availability, recoverability and economic analysis methods: Eastern results and western progress [abs.]: Geological Society of America Annual Meeting, Toronto, Canada, October, 1998.
Carter, M. Devereux, Rohrbacher, Timothy J., Molnia, Carol L., Osmonson, Lee M., Treworgy, Colin G., and Weisenfl uh, Gerald, 1999, Refi ned methods for the evaluation of coal resources, quantum leaps in productivity, in Morsi, Badie I., ed., Proceedings, Sixteenth Annual Pittsburgh Coal Conference, October 11–13, 1999. CD-ROM ISBN 1-890977-16-0, University of Pittsburgh.
Cetin, Hulluk, Conolly, Carol, and Rupp, John A., 1996, Coal availability studies in Indiana [abs.]: Society of Mining, Metallurgy and Exploration Annual Meeting, Phoenix, Ariz., March 11–14, 1996.
Collins, B.A., 1976, Coal deposits of the Carbondale, Grand Hogback, and southern Danforth Hills coal fi elds, eastern Piceance Basin, Colorado: Colorado School of Mines Quarterly, v. 71, no. 1, January, 138 p.
Collins, B.A., 1977, Geology of the Coal Basin area, Pitkin County, Colorado, in Exploration Frontiers of the Central and Southern Rockies: Rocky Mountain Association of Geologists Field Conference Guidebook, p. 363–377.
Conolly, Carol L., and Zlotin, Alex, 1999, The availability of the Springfi eld Coal Member for mining in Indiana: Indiana Geological Survey Open-File Study 99-77, August, 1999, 49 p.
Colorado State Planning Commission, 1939, State planning commission map of the West Elk Mountains coal fi elds, Somerset to Crested Butte: State of Colorado, 1 pl.
Daub, G.J., 1982, Stratigraphy and geology of some coal mines along the North Fork of the Gunnison River, Somerset coal fi eld, Colorado, in Averitt, W.R., ed., Southeastern Piceance Creek Basin: Grand Junction Geological Society—1982 Field Trip Guidebook, p. 69–77.
Doelling, H.H., 1972, Central Utah coal fi elds: Sevier-Sanpete, Wasatch Plateau, Book Cliffs, and Emery: Utah Geological and Mineralogical Survey Monograph No. 3, 571 p.
Dunrud, C.R., 1976, Some engineering geologic factors controlling coal mine subsidence in Utah and Colorado: U.S. Geological Survey Professional Paper 969, 39 p.
Dunrud, C.R., 1989, Geologic map and coal stratigraphic framework of the Paonia area, Delta and Gunnison Counties, Colorado: U.S. Geological Survey Coal Investigations Map C-115, 2 pl., scale 1:50,000.
Dunrud, C.R., 1998, Engineering geology applied to the design and operation of underground coal mines: U.S. Geological Survey Bulletin 2147, 134 p.
Eakins, Wynn, Tremain Ambrose, C.M., Scott, D.S., and Teeters, D.D., 1998, Availability of coal resources in Colorado: Somerset quadrangle, west-central Colorado: Colorado Geological Survey Resource Series 36, 87 p.
Eggleston, J.R., and Carter, M.D., 1987, A new approach to determining how much coal is available for mining: U.S. Geological Survey Yearbook, p. 57–61.
Eggleston, Jane R., Carter, M. Devereux, and Cobb, James C., 1990, Coal resources available for development—A methodology and pilot study: U.S. Geological Survey Circular 1055, 15 p.
Ellis, M.S., Gaskill, D.L., and Dunrud, C.R., 1987, Geologic map of the Paonia and Gunnison area, Delta and Gunnison Counties, Colorado: U.S. Geological Survey Coal Investigations Map C-109, scale 1:100,000.
Ellis, M.S., Freeman, V.L., and Donnell, J.R., 1988, Cross sections showing correlation of coal beds and coal zones in the Mesaverde Formation in the Carbondale 30’x60’ quadrangle, west-central Colorado: U.S. Geological Survey Coal Investigations Map C-97-B, 2 pl.
Fedorko, Nick, 1996, Coal availability studies in West Virginia overview [abs.]: Society of Mining, Metallurgy and Exploration Annual Meeting, Phoenix, Ariz., March 11–14, 1996.
Ferderer, D.A., 1996, National overview of abandoned mine land sites utilizing the minerals availability system (MAS) and geographic information systems (GIS) technology: U.S. Geological Survey Open-File Report 96-549, 26 p.
Flores, R.M., Bader, L.R., Ellis, M.S., Johnson, R.C., Keighin, C.W., Nichols, D.J., Roberts, S.B., Stricker, G.D., Warwick, P.D., Murphy, E., Cavaroc, Jr., V.V., Vogler, D., and Wilde, E., 1996, National Coal Resource Assessment: Fort Union coals of the northern Rocky Mountains and Great Plains, in Chiang, Shiao-Hung, ed., Coal-Energy and the Environment,1996:Thirteenth Annual International Pittsburgh Coal Conference Proceedings, p. 191–196.
Geroyan, R.I., and Teeters, D.D., 1995, Economic impact analysis of the coal mining industry in Boone County, West Virginia: U.S. Bureau of Mines Open-File Report 43-95, 24 p.
Goolsby, S.M., Reade, N.B.S., and Murray, D.K., 1979, Evaluation of coking coals in Colorado: Colorado Geological Survey Resources Series 7, 72 p., 3 pl.
Hettinger, R.D., Roberts, L.N.R., Biewick, L.R.H., and Kirschbaum, M.A., 1996, Preliminary investigations of the distribution and resources of coal in the Kaiparowits Plateau, southern Utah: U.S. Geological Survey Open-File Report 96-539, 72 p.
Hoffman, G.K., 1996a, Demonstrated reserve base for coal in New Mexico, modifi ed from fi nal report for cooperative agreement DE-FC0193EI23974: New Mexico Bureau of Mines and Mineral Resources Open-File report 428, 89 p.
Hoffman, G.K., 1996b, Coal resources of New Mexico: New Mexico Bureau of Mines and Mineral Resources Resource Map 20, 22 p. text, 1 sheet, scale 1:1,000,000.
Coal Availability, Recovery, Economic Evaluations of Coal Resources, Colorado Plateau: Colo., N. Mex., and Utah F61

Hoffman, Gretchen K., and Jones, Glen E., 1999, Availability of coal resources in the Fruitland Formation, San Juan Basin, northwest New Mexico: New Mexico Bureau of Mines and Mineral Resources, Open-File Report 438, 15 p.
Hoffman, Gretchen K., and Jones, Glen E., 2000, Coal availability studies, Fruitland and Menefee Formations, San Juan Basin, New Mexico [abs.]: Society of Mining, Metallurgy and Exploration Annual Meeting, Salt Lake City, Utah, February 28–March 1, 2000.
Jahanbani, F.R., 1997, The 1996 annual review and forecast of Utah coal production and distribution: Utah Offi ce of Energy and Resource Planning, 28 p., 1 appendix.
Johnson, R.C., and May, F., 1980, A study of the Cretaceous-Tertiary unconformity in the Piceance Creek Basin, Colorado: The underlying Ohio Creek Formation (Upper Cretaceous) redefi ned as a member of the Hunter Canyon or Mesaverde Formation: U.S. Geological Survey Bulletin 1481-B, 27 p.
Johnson, V.H., 1948, Geology and coal resources of the Paonia coal area, Delta and Gunnison Counties, Colorado: U.S. Geological Survey Field Notes, U.S. Geological Survey Library.
Kelso, B.S., Ladwig, L.R., and Sitowitz, L., 1981, Directory of permitted Colorado coal mines, 1981: Colorado Geological Survey Map Series 15, 130 p.
Keystone coal industry manual, 1999, Sanda, Arthur P., ed.: Chicago, Ill., Primedia Intertec Publications, 807 p.
Landis, E.D., 1959, Coal resources of Colorado: U.S. Geological Survey Bulletin 1071-C, p.131–232.
Leonard, Joseph W., 1979, ed., Coal preparation, 4th edition: New York, The American Institute of Mining, Metallurgical and Petroleum Engineers, Inc., 1175 p.
Lee, W.T., 1912, Coal fi elds of Grand Mesa and the West Elk Mountains: U.S. Geological Survey Bulletin 510, 237p, 1 pl.
Mining Cost Service, 1999, Cost models, labor, supplies and miscellaneous items, equipment, taxes, and miscellaneous costs: Western Mine Engineering, Inc., 222 W. Mission Ave., Suite 218, Spokane, WA 99201-2347, 2 v.
Molnia, C.L., Biewick, L.R.H., Blake, D., Carter, M.D., and Gaskill, C, 1995, Issues and techniques in the fi rst western coal availability study—Hilight quadrangle, Powder River Basin, Wyoming: Society of Mining Engineers, Technical Papers, 9 p.
Molnia, C.L., Biewick, L.R.H., Blake, D., Tewalt, S.J., Carter, M.D., and Gaskill, C., 1996, Results of the fi rst western coal availability study—Hilight quadrangle, Powder River Basin, Wyoming, in Chiang, Shiao-Hung, ed., Coal—Energy and the Environment, 1996: Thirteenth Annual International Pittsburgh Coal Conference Proceedings, p. 798–803.
Molnia, C.L., Biewick, L.R.H., Blake, D., Tewalt, S.J., Carter, M.D., and Gaskill, C., 1997, Coal availability in the Hilight quadrangle, Powder River Basin, Wyoming: A prototype study in a western coal fi eld: U.S. Geological Survey Open-File Report 97-469, 52 p.
Murray, D.K., Fender, H.B., and Jones, D.C., 1977, Coal and methane gas in the southeastern part of the Piceance Creek Basin, Colorado, in Exploration frontiers of the central and southern Rockies: Rocky Mountain Association of Geologists Field
Conference Guidebook, p. 379–405.
Nowak, H.C., 1990, Stratigraphy of the coal bearing part of the Mesaverde Formation, and application to coalbed methane exploration, southeast Piceance Creek Basin, Colorado: Colorado School of Mines M.S. thesis T-3743, 123 p., 4 pl.
Osmonson, L.M., Molnia, C.L., Biewick, L.R.H., and Rohrbacher, T.J., 2000, The middle pod of the Gillette coal fi eld, Powder River Basin, Wyoming: Characterizing potential mine development [abs.]: Society of Mining, Metallurgy and Exploration Annual Meeting, Salt Lake City, Utah, February 28–March 1, 2000.
Osmonson, Lee M., Rohrbacher, T.J., Molnia, C.L., and Sullivan, G.L., 2000, Coal recoverability in the Hilight quadrangle, Powder River Basin, Wyoming: A prototype study in a western coal fi eld: U.S. Geological Survey Open-File Report 00-103, 23 p.
O’Sullivan, R.B., Mytton, J.W., and, Strobell, J.D., Jr., 1986, Preliminary geologic map of the Tanner Lake quadrangle, San Juan County, New Mexico: U.S. Geological Survey Miscellaneous Field Studies Maps MF-1864, scale 1:24,000.
O’Sullivan, R.B., Scott, G.R., and Heller, J.S., 1979, Preliminary geologic map of the Bisti Trading Post quadrangle, New Mexico: U.S. Geological Survey Miscellaneous Field Studies Maps MF-1075, scale 1:24,000.
Plis, Matthew N., Rohrbacher, Timothy J., and Teeters, Dale D., 1993, COALVAL, A prefeasibility software package for evaluating coal properties using Lotus 1-2-3, release 2.2, documentation and users guide: U.S. Bureau of Mines Information Circular 1993, 93 p.
Resource Data International, Inc., 2000, COALdat database: Resource Data International, Inc., 1320 Pearl Street, Suite 300, Boulder, CO 80302
Roberts, C.A., McColly, R.A., Anderson, N.B., Gray, A.W., and Beach, R.A., 1993, Availability of federally owned minerals for exploration and development in Western States: Utah, 1988: U.S. Bureau of Mines Special Report, 46 p.
Rohrbacher, Timothy J., 1995, Coal reserves in selected study areas in the central Appalachian region [abs.]: Society of Mining, Metallurgy and Exploration Annual Meeting, Denver, Colo., March 6–9, 1995.
Rohrbacher, Timothy J., 1996, Coal resource assessments using coal availability and recoverability methods [abs.]: Illinois Mining Institute Annual Meeting, Collinsville, Ill., September 26–27, 1996.
Rohrbacher, Timothy J., 1997, Coal resource assessments using coal availability and recoverability methods: Proceedings of the Illinois Mining Institute, Illinois Mining Institute, Champaign, Ill., v. 1996, p 64–76.
Rohrbacher, Timothy J., Carter, M. Devereux, Sullivan, Gerald L., Molnia, Carol L., and Biewick, Laura R.H., 1998, New methods for coal availability, reserve evaluation and socio-economic impact analysis—Quantum leaps in project productivity [abs.]: Society of Mining, Metallurgy and Exploration Annual Meeting, Orlando, Fla., March 9–10, 1998.
Rohrbacher, Timothy J., Teeters, Dale D., Osmonson, Lee M., and Plis, Matthew, N., 1994, Coal recoverability and the defi nition of coal reserves, central Appalachian region, 1993: U.S. Bureau of Mines Open-File Report 10-94, 36 p.
F62 Geologic Assessment of Coal in the Colorado Plateau: Arizona, Colorado, New Mexico, and Utah
Rohrbacher, T.J., Teeters, D.D., Sullivan, G.L., and Osmonson, L.M., 1993a, Coal resource recoverability, a methodology: U.S. Bureau of Mines Information Circular 9368, 48 p.
Rohrbacher, T.J., Teeters, D.D., Sullivan, G.L., and Osmonson, L.M., 1993b, Coal reserves of the Matewan quadrangle, Kentucky, a coal recoverability study: U.S. Bureau of Mines Information Circular 9355, 36 p.
Ruppert, L.F., Tewalt, S., Bragg, L., Wallack, R., 1998, Digital assessments of the top-producing coal beds in the northern and central Appalachian Basin: The Upper Freeport and Pittsburgh coal beds [abs.]: Society of Mining, Metallurgy and Exploration Annual Meeting, Orlando, Fla., March 9–11, 1998.
Ruppert, L.F., Tewalt, S., Bragg, L., Wallack, R., 1999, Digital assessment of the top-producing coal beds in the northern and central Appalachian Basin coals: Mining Engineering, Society of Mining, Metallurgy and Exploration publication, p 37–43.
Ruppert, L.F., Watson, W.D., and Attanasi, E.D., 2000, The Upper Pennsylvanian Pittsburgh coal bed: Geology, mining, and economic models [abs.]: Society of Mining, Metallurgy and Exploration Annual Meeting, Salt Lake City, Utah, February 28–March 1, 2000.
Rushworth, P., Kelso, B.S., and Ladwig, L.R., 1984, Map, directory, and statistics of permitted Colorado coal mines, 1983: Colorado Geological Survey Map Series 23, scale: 1:1,000,000, 147 p.
Sanchez, J.D., and Brown, J.L., 1986, Stratigraphic framework and coal resources of the Upper Cretaceous Blackhawk Formation in the Trail Mountain and East Mountain areas of the Wasatch Plateau coal fi eld, Manti 30’x60’ quadrangle, Emery County, Utah: U.S. Geological Survey Coal Investigations Map C 94-C, scale 1:24,000, 3 sheets.
Sanchez, J.D., and Brown, J.L., 1987, Stratigraphic framework and coal resources of the Upper Cretaceous Blackhawk Formation in the Ferron Canyon and Rock Canyon areas of the Wasatch Plateau coal fi eld, Manti 30’x60’ quadrangle, Emery and Sanpete Counties, Utah: U.S. Geological Survey Coal Investigations Map C 94-B, scale 1:24,000, 3 sheets.
Sanda, A.P., Fiscor, S., and Yos, P., eds., 1999, Keystone coal industry manual: Chicago, Intertec Publishing, 818 p.
Schultz, Janet E., Eakins, Wynn, Carroll, Christopher J., Scott, David C., and Teeters, Dale D., 2000, Availability of coal resources in Colorado: Somerset coal fi eld, west-central Colorado: Colorado Geological Survey Resource Series 38, 80 p.
Scott, David C., 1995, Coal recoverability and coal reserve analysis, Appalachian Basin 1995: U.S. Bureau of Mines Open-File Report 75-95, 21 p.
Scott, G.R., O’Sullivan, R.B., and Mytton, J.W., 1979, Reconnaissance geologic map of the Alamo Mesa West quadrangle, New Mexico: U.S. Geological Survey Miscellaneous Field Studies Maps MF-1074, scale 1:24,000.
Sherer, E., 1994, A cost comparison of selected U.S. and Indonesian coal mines: U.S. Bureau of Mines Special Publication 12-94, 114 p.
Society of Mining Engineers Handbook, 1973, Given, Ivan A., ed.: New York, Society of Mining Engineers of The American Institute of Mining, Metallurgical, and Petroleum Engineers, Inc., 2 v.
Stefanko, Robert, 1983, Coal mining technology, theory and practice: Society of Mining Engineers, American Institute of Mining, Metallurgical and Petroleum Engineers, 410 p.
Strever, M., 1980, Methane drainage plan using horizontal holes at the Hawk’s Nest East mine, Paonia, Colorado: Colorado Geological Survey Open-File Report 80-7.
Stricker, G.D., and Flores, R.M., 2000, Powder River Basin and Williston Basin coal resource assessments and their relationship to coal-bed methane potential [abs.]: Society of Mining, Metallurgy and Exploration Annual Meeting, Salt Lake City, Utah, February 28–March 1, 2000.
Suffredini, Charles D., Plis, Matthew N., Rohrbacher, Timothy J., and Teeters, Dale, D., 1994, COALVAL 2.0—A prefeasibility software package for evaluating coal properties using Lotus 1-2-3, release 3.1: U.S. Bureau of Mines Open-File Report 35-94, 198 p.
Tabet, David E., Quick, Jeffrey C., Hucka, Brigitte P., and Hanson, John A., 1999, The available coal resources for nine 7.5-minute quadrangles in the Northern Wasatch Plateau coal fi eld, Carbon and Emery Counties, Utah: Utah Geological Survey Circular 100, 46 p.
Tabet, D.E., Quick, J.C., Bon, R.L., Hucka, B.P., and Hanson, J.A., 2000, Available coal resources in the western Book Cliffs and northern Wasatch Plateau coalfi elds [abs.]: Society of Mining, Metallurgy and Exploration Annual Meeting, Salt Lake City, Utah, February 28–March 1, 2000.
Toenges, A.L., Dowd, J.J., Turnbull, L.A., Davis, J.D., Smith, H.L., and Johnson, V.H., 1949, Reserves, petrographic and chemical characteristics, and carbonizing properties of coal occurring south of Dry Fork of Minnesota Creek, Gunnison County, near Paonia, Colorado, and the geology of the area: U.S. Bureau of Mines Technical Paper 721, 48 p.
Toenges, A.L., Turnbull, L.A., Davis, J.D., Reynolds, D.A., Parks, B.C., Cooper, H.M., and Abernathy, R.F., 1952, Coal deposit, Coal Creek district, Gunnison County, Colorado: Reserves, coking properties, and petrographic and chemical characteristics: U.S. Bureau of Mines Bulletin 501, 83 p.
Torres, T.F., and Kern, J., 1999, Using GIS to identify high value areas in large coal resources [abs.]: Society of Mining, Metallurgy and Exploration Annual Meeting, Denver, Colo., March 1–3, 1999.
Tremain, C.M., Hornbaker, A.L., Holt, R.D., Murray, D.K., and Ladwig, L.R., 1996; The 1995 summary of coal resources in Colorado: Colorado Geological Survey Special Publication 41, 19 p.
Tremain Ambrose, C.M., Kelso, B.S., Schultz, J.E., and Eakins, W., compilers, 1998, Colorado coal quality data: Colorado Geological Survey Open-File Report, CD-ROM.
Treworgy, Colin G., 1996, Availability of coal resources for future development in Illinois [abs.]: Illinois Mining Institute Annual Meeting, Collinsville, Ill., September 26–27, 1996.
Treworgy, Colin G., 1997, Availability of coal resources for future development in Illinois: Champaign, Ill., Proceedings of the Illinois Mining Institute, Illinois Mining Institute, v. 1996, p 78–87.
Treworgy, Colin G., and Chenoweth, Cheri A., 1997, Availability of coal in Illinois for effi cient, low-cost mining [abs.]: Society of Mining, Metallurgy and Exploration Annual Meeting, Denver, Colo.,
Coal Availability, Recovery, Economic Evaluations of Coal Resources, Colorado Plateau: Colo., N. Mex., and Utah F63
February 24–27, 1997.
Treworgy, C.G., Conolly, C.L., Korose, C.P., and Zlotin, A., 2000, Using Geographic Information Systems to assess the minability of coal over a large region: Availability of the Springfi eld coal in Illinois and Indiana [abs.]: Society of Mining, Metallurgy and Exploration Annual Meeting, Salt Lake City, Utah, February 28–March 1, 2000.
Treworgy, Colin G., Korose, Christopher P., Chenoweth, Cheri A., and North, Daniel L., 1999, Availability of the Springfi eld coal for mining in Illinois: Illinois State Geological Survey, Illinois Minerals 118, 43 p.
Tyler, R., 1996, Geologic and hydrologic controls critical to coalbed methane producibility and resource assessment: Williams Fork Formation, Piceance Basin, northwest Colorado: Gas Research Institute Topical Report GRI-95/0532, [prepared by the Bureau of Economic Geology, University of Texas at Austin], 398 p.
Tyler, R., and McMurry, R.G., 1995, Genetic stratigraphy, coal occurrence and regional cross section of the coal-bearing Williams Fork Formation, Mesaverde Group, Piceance Basin, northwestern Colorado: Colorado Geological Survey Open-File Report 95-2, [prepared by the Bureau of Economic Geology, University of Texas at Austin], 1 pl., 42 p.
U.S. Bureau of Land Management and U.S. Forest Service, 1999, Draft North Fork coal environmental impact statement, Delta and Gunnison Counties, Colorado, September 1999: BLM Colorado State Offi ce, Uncompahgre Field Offi ce; and U.S. Forest Service, Rocky Mountain Region, Grand Mesa, Uncompahgre, and Gunnison National Forests, 558 p, 58 maps.
U.S. Bureau of Mines, 1968, A dictionary of mining, mineral, and related terms, [Thrush, Paul W. ed.], 1269 p.
U.S. Bureau of Mines, 1993, A cost comparison of selected coal mines from Australia, Canada, Columbia, South Africa, and the United States: U.S. Bureau of Mines Special Publication 8-93, 65 p.
U.S. Bureau of Mines, 1995, Coal recoverability and coal reserve analyses, Appalachian and Illinois Basins, 1994: U.S. Bureau of Mines Open-File Report 02-95, 41 p.
U.S. Department of Energy, Energy Information Administration, 1993, U.S. coal reserves: An update by heat and sulfur content: Energy Information Administration DOE/EIA–0529(92), p. viii.
U.S. Department of Energy, Energy Information Administration, 1997, Coal industry annual, 1996: DOE/EIA-0584(96), 256 p.
U.S. Department of the Interior, Offi ce of Surface Mining Reclamation and Enforcement, 1985, Draft reconnaissance maps to assist in identifying alluvial valley fl oors, west-central and northwestern Colorado: OSM/TM-4/85.
U.S. Geological Survey, 1994, Coal quality (COALQUAL) database: version 1.3: U.S. Geological Survey Open-File Report 94-205, CD-ROM.
U.S. Geological Survey, 1996, Assessing the coal resources of the U.S.: U.S. Geological Survey Fact Sheet, 8 p.
Warwick, P.D., SanFilipo, J.R., Willtee, J.C., and Aubourg, C.E., 2000, Coal geology, resources and coal-bed methane potential for the U.S. Gulf Coastal Plain [abs.]: Society of Mining, Metallurgy and Exploration Annual Meeting, Salt Lake City, Utah, February
28–March 1, 2000.
Watson, William D., Medlin, A.L., Krohn, K.K., Brookshire, D.S., and Bernknoff, R.L., 1991, Economic effects of western Federal land-use restrictions on U.S. coal markets: U.S. Geological Survey Circular 1042, 197 p.
Weisenfl uh, Gerald A., 1997, Coal availability and recoverability studies in Kentucky—Implication for national coal assessment [abs.]: Society of Mining, Metallurgy and Exploration Annual Meeting, Denver, Colo., February 24–27, 1997.
Weisenfl uh, G.A., Andrews, W.M., and Hiett, J.K., 1999, Availability of coal resources for the development of coal, western Kentucky summary report: Kentucky Geological Survey, Interim report for Department of Interior, Grant 14-08-0001-A0896, 50 p.
Weisenfl uh, Gerald A., Cobb, James C., Firm, John C., and Ruthven, Carol L., 1997, Kentucky’s coal industry—Historical trends and future opportunities: Kentucky Geological Survey, 9 p.
Wellborn, J.E., 1982a, Stratigraphy of the Mesaverde Formation, Mount Gunnison coal property, Gunnison County: Colorado: Colorado School of Mines M.S. thesis T-2506.
Wellborn, J.E., 1982b, Stratigraphy of the Mesaverde Formation on the Mount Gunnison coal property, Gunnison County, Colorado, in Averitt, W.R., ed., Southeastern Piceance Creek Basin: Grand Junction Geological Society—1982 Field Trip Guidebook, p. 65–67.
Wood, Gordon H., Jr., Kehn, Thomas M., Carter, M. Devereux, and Culbertson, William C., 1983, Coal resource classifi cation system of the U.S. Geological Survey: U.S. Geological Survey Circular 891, 65 p.
Young, R.G., 1982, Stratigraphy and petroleum geology of the Mesaverde Group, southern Piceance Creek Basin, Colorado, in Averitt, W.R., ed., Southeastern Piceance Creek Basin: Grand Junction Geological Society—1982 Field Trip Guidebook, p. 45–54.
Zook, J.M., and Tremain, C.M., 1997, Directory and statistics of Colorado coal mines with distribution and electric generation map, 1995–96: Colorado Geological Survey Resource Series 32, 55 p., 1 pl., scale 1:1,000,000.
National CoalResourceAssessment
Click here to return to Disc 1 Volume Table of Contents
F64 Geologic Assessment of Coal in the Colorado Plateau: Arizona, Colorado, New Mexico, and Utah