Embed Size (px)
Citation preview

PMKT – Revista Brasileira de Pesquisas de Marketing, Opinião e Mídia
ISSN: 1983-9456 (Impressa)
ISSN: 2317-0123 (On-line)
Editor: Fauze Najib Mattar
Sistema de avaliação: Triple Blind Review
Idiomas: Português e Inglês
Publicação: ABEP – Associação Brasileira de Empresas de Pesquisa
How to Seriously Damage a Segmentation Study: Use Factor Analysis as Input for Cluster
Analysis1
Como Danificar Seriamente um Estudo de Segmentação: Use Análise Fatorial como Insumo
para Cluster Analysis
Submission: Mar./28/2014 - Approval: Apr./22/2014
Luiz Sá Lucas
Master in Mathematical Programming from the Federal University of Rio de Janeiro - UFRJ-
COPPE. Electrical Engineer - Systems from the Pontifical Catholic University of Rio de Janeiro
PUC-RJ. Technical Director at Ibope Intelligence. Board Member of the European Society of
Marketing Research - ESOMAR. He has published or presented several papers on mathematical
programming techniques in specialized journals and Congresses/Conferences in Latin America,
Europe and Asia.
E-mail: [email protected]; [email protected]
Professional Address: Rua da Assembléia - nº 98 - 12ºandar - 20011-000 - Rio de Janeiro/RJ -
Brasil.
Wagner Esteves
Master in Production Engineering from Universidade Federal Fluminense - UFF. Graduate degree
in Statistics from the National School of Statistical Sciences - ENCE / IBGE. Planning Coordinator
at Ibope Intelligence.
E-mail: [email protected]
Larissa Catalá
Postgraduate in Market Research by the School of Communication and Arts, University of São
Paulo - ECA-USP. Graduate degree in Statistics from the University of Campinas - UNICAMP.
Technologist in Statistics from IBGE.
E-mail: [email protected]; [email protected]
1 This was one of the papers presented at ABEP’s 6
th Brazilian Market, Opinion and Media Research Congress (held on
March 24 and 25, 2014), turned into an article by its author(s), submitted to PMKT, and approved for publication.

How to Seriously Damage a Segmentation Study: Use Factor Analysis as Input for Cluster Analysis
Luiz Sá Lucas/ Wagner Esteves/ Larissa Catalá
PMKT – Revista Brasileira de Pesquisas de Marketing, Opinião e Mídia (ISSN 1983-9456 Impressa e ISSN 2317-0123 On-line), São Paulo, Brasil, V. 14, pp. 132-142, Abril, 2014 - www.revistapmkt.com.br 132
ABSTRACT
Consumers are not equal. They have different needs, buying behavior, propensities, brand loyalty
etc. Hence Segmentation becomes one of the key techniques in the positioning of a brand. However,
a bad and generalized habit has crystallized in Market Research: the use of factor analysis, followed
in tandem by an application of cluster analysis on these factors. The article presents an argument to
prevent such use, in particular Principal Component Analysis as this first step. Here we present an
exercise: an extensive segmentation with both approaches (PCA and the original variables),
analyzing which of the two methods showed the best result among 720 segmentations we
performed.
KEYWORDS:
Segmentation, factor analysis, principal components analysis, cluster analysis, brand positioning.
RESUMO
Os consumidores não são iguais, eles têm diferentes necessidades, comportamentos de compra,
propensões, fidelidade à marca etc. Daí a segmentação se transformar numa das principais técnicas
para o posicionamento de uma marca. No entanto, um mau e generalizado hábito se cristalizou na
pesquisa de mercado: o uso de Análise Fatorial seguida da aplicação de Cluster Analysis aos fatores
obtidos. Este artigo apresenta uma argumentação para evitar esse uso, em particular do método da
Análise de Componentes Principais – ACP (ou Principal Component Analysis – PCA, em inglês),
como o primeiro passo. Apresenta-se como exemplo uma extensa segmentação com as duas
abordagens (ACP e as variáveis originais), analisando qual dos dois métodos apresentou melhor
resultado dentre as 720 segmentações efetuadas.
PALAVRAS-CHAVE:
Segmentação, análise fatorial, análise de componentes principais, análise de grupamento,
posicionamento de marca.

How to Seriously Damage a Segmentation Study: Use Factor Analysis as Input for Cluster Analysis
Luiz Sá Lucas/ Wagner Esteves/ Larissa Catalá
PMKT – Revista Brasileira de Pesquisas de Marketing, Opinião e Mídia (ISSN 1983-9456 Impressa e ISSN 2317-0123 On-line), São Paulo, Brasil, V. 14, pp. 132-142, Abril, 2014 - www.revistapmkt.com.br 133
1. INTRODUCTION
The title of this article brings some exaggeration. The damage is not always disastrous and, as will
be seen, there are a few cases where Principal Components Analysis - ACP is justified. However,
for the kind of problems handled in marketing the superiority of Cluster Analysis - CA, on the
original variables, becomes clear in the examples presented.
2. SEGMENTATION THROUGH TIME
The 1930s was extremely fruitful on creating different factor analysis techniques, including ACP.
Cluster Analysis algorithms only began to appear on the mid-1960s and even on the 1980s, where
the dominance of factor analysis techniques - AF was such that even the cluster analysis was
performed using AF (the so called Q Factor Analysis). An excellent description of this aspect can
be found in Myers (1996) and Stewart (1981). It is worth quoting a small excerpt from the excellent
book of Myers (1996):
Although the general concept of market segmentation has been formally introduced for the first time by
Wendell Smith (1956), markets have already been targeted by many decades and even before that.
Perhaps the earliest forms of segmentation have been based on the marketing mix (product, price,
promotion and distribution). Even before that, most likely merchants brought to markets products that
differed in terms of type and desired quality, acceptable price levels and/or distribution methods.
Myers (1996) also comments on the transition from Henry Ford´s 1900 position: “consumers can
have any car color they want provided it is black” (emphasis on producing, as demand was
sufficient to adopt this position) to Alfred Sloan´s (GM) in 1920: “a car for every budget and
purpose” (emphasis in the market). Thus, the concept of segmentation is old and based on the fact
that consumers are not equal.
Indeed, the trend in modeling in marketing today seeks to go further: choice models, such as
conjoint analysis, does not only segment costumers, but also estimate individual preferences. There
are several texts on the subject, but perhaps the most complete one is written by Wedel and
Kamakura (2000). It was on this text, and on an ESOMAR workshop with Steve Cohen, that our
attention was aroused to the difficulties associated with the use of ACP and Cluster Analysis in
tandem.
3. SEGMENTATION AND MARKETING
Gray (2013) gives a brief description of segmentation that seems quite useful. According to his text,
segmentation is one of the most important methodologies in Market Research. In many ways it
facilitates better decisions and increase profitability, as it helps to:
Understand what motivates the behavior of different consumers in a product category or service.
Reveals patterns of behavior and consumer motivation and links them to their categories
(demographics, for example).
Indicates how the various brands position themselves according to the needs of consumers
segments.
Identifies unmet needs.
Modifies existing offerings to attract a higher volume of customers.
Helps in developing new products.
Improves relationship with consumers.

How to Seriously Damage a Segmentation Study: Use Factor Analysis as Input for Cluster Analysis
Luiz Sá Lucas/ Wagner Esteves/ Larissa Catalá
PMKT – Revista Brasileira de Pesquisas de Marketing, Opinião e Mídia (ISSN 1983-9456 Impressa e ISSN 2317-0123 On-line), São Paulo, Brasil, V. 14, pp. 132-142, Abril, 2014 - www.revistapmkt.com.br 134
Gray (2013) also indicates several ways to segment the market, but here focus will be on the most
usual way: implementing methods of cluster analysis on measurements of needs, preference for
brands, lifestyles, demographics, information databases etc.2
4. SEGMENTATION AND MARKETING STRATEGY
According to strategic needs, segmentation can take different forms:
Targeting needs.
Targeting lifestyle.
Demographic segmentation.
Behavioral Targeting.
Each has specific goals, but a detailed analysis is beyond the scope of this article. For greater depth
on the subject we can suggest Kaden, Linda and Prince (2013). Other references include: Wang and
King (2007), McDonald and Dunbar (2004), Dibb and Simkin (2010; 1996) and Kamakura and
Wedel (2000).
5. WEAKNESSES OF ACP VERSUS ORIGINAL VARIABLES
At first we can present some comments on ACP. A popular approach to the weaknesses of Factor
Analysis and PCA in particular are presented in the seminal book of Stephen Jay Gould “The
Mismeasure of Men”, published in 1981. Based on the arguments presented there one must be
careful when interpreting axes on any factor analysis.
Quoting another study, currently in development but available on the Web (SHALIZI, 2014):
ACP is a very good tool when you need or try a reduction in the size of the data when you're not sure
exactly what to use. It has some interesting mathematical properties ... the dimensions found by ACP ...
can be real characteristics of the data or just reasonable and convenient fictions and abstracts. That they
are real is a hypothesis that these methods may suggest, but for which they can only suggest very weak
evidence. This matters because in the end we do data mining to discover knowledge on which we can act.
One thing is to make our action is only as a simulation that helps us adjust our models to practice, and
another is to try to act on the world based on how the parts interact with each other. To do it right, we
need to know what these parts really are.
One factor is essentially a geometric feature and not a match with real phenomenon. Adopting this
match, we could act based on what Gould (1981) called "reify, that is, to imagine that something is
real only because we can build it in an abstract way.”
5.1 ACP VERSUS ORIGINAL VARIABLES
The following comments are strongly based on a text by Rizzo and Yeung (2001). According to
these authors' approach, different clustering algorithms provide different solutions.
That leads to a question: which one is the right one? It is believed that the clustering process is an
ad-hoc technique that separates elements in groups, and provides a description of the universe
which is useful for marketing purposes (especially the discovery of niches/targets/target markets of
interest) but there is not a right answer on the subject (SÁ LUCAS, 2007) .
2 View more information on the link between research and databases Sá Lucas (2007).

How to Seriously Damage a Segmentation Study: Use Factor Analysis as Input for Cluster Analysis
Luiz Sá Lucas/ Wagner Esteves/ Larissa Catalá
PMKT – Revista Brasileira de Pesquisas de Marketing, Opinião e Mídia (ISSN 1983-9456 Impressa e ISSN 2317-0123 On-line), São Paulo, Brasil, V. 14, pp. 132-142, Abril, 2014 - www.revistapmkt.com.br 135
PCA is a dimensionality reduction technique usually applied to a data set that transforms the
original variables into new ones (principal components - CPs) in order to summarize characteristics
of data.
These components are uncorrelated (not necessarily independent) and can be arranged such that the
k-th element is one that has the k-th largest variance in the set of principal components (PCs). The
traditional approach is to use the first few PCs because they capture most of the variation in the
original data set.
In contrast, the latter CPs are regarded as the ones that catch residual noise in the data. Here it is
worth a note: in theory of random signals it is very common to use the concept of white noise,
which is nothing more than a random variable with normal distribution, zero mean and a non-zero
variance. However, white noise has no information at all and has variance.
So taking variance as the amount of information is at least rash. When taking the first PCs (the
largest variance) it is expected to extract the data clustering structure. There are rules of thumb for
the number of factors to be extracted, but these rules are informal and ad-hoc.
On the other way, according to Yeung and Ruzzo (2001), there are theoretical considerations that
indicate that the first few PCs cannot contain cluster information.
Assuming that data consists of a mixture of two multivariate normal distributions with different
means, but with the same variance-covariance matrix intracluster Chang (1983) demonstrated that
the first cluster CPs may contain less information than others with smaller variance. He even
artificially generated a solution for this case into two groups, where the better separation between
them occurred in the subspace spanned by the first and last CP.
5.2 EXAMPLE
In our example an approach similar to the one from Ruzzo and Yeung (2001) is used. We generated
from a package in R (Cluster Generation) different databases containing 3, 4 , 5, 6 , 7 and 8 groups
with three different degrees of separation between them (QIU; JOE, 2006a; 2006b).
We always take up to 20 variables in each case. In all 720 cases were calculated CPs. For selecting
the most important variables, we used an ad-hoc but very powerful technique: we took a grouping
into five clusters, and generated a predictor by Random Forest (BREIMAN, 2001).
In each case (Groups 3 through 8) we used up to targets 20 descriptors, taking in each step a new
PC and a new variable, according to the orders indicated (variance for CPs and Random Forest for
variables). The clustering algorithm was WDM (SÁ LUCAS, 2007).
As the correct solution for the clusters were known and provided by cluster generation, we
calculated the degree of accuracy of each application of the algorithm by the adjusted Rand index
(aRI) (RAND, 1971). When the algorithm perfectly reproduces the clusters, the index was equal to
1. In the worst case, the index would be equal to zero. Results are shown in Figures 1 to 9.
How to Seriously Damage a Segmentation Study: Use Factor Analysis as Input for Cluster Analysis
Luiz Sá Lucas/ Wagner Esteves/ Larissa Catalá
PMKT – Revista Brasileira de Pesquisas de Marketing, Opinião e Mídia (ISSN 1983-9456 Impressa e ISSN 2317-0123 On-line), São Paulo, Brasil, V. 14, pp. 132-142, Abril, 2014 - www.revistapmkt.com.br 136
0.0
0.2
0.4
0.6
5 10 15 20
Nvar
Ba
RI3
Metodo
1.WDM3
2.PCA3
0.0
0.2
0.4
0.6
5 10 15 20
Nvar
Ba
RI4
Metodo
1.WDM3
2.PCA3
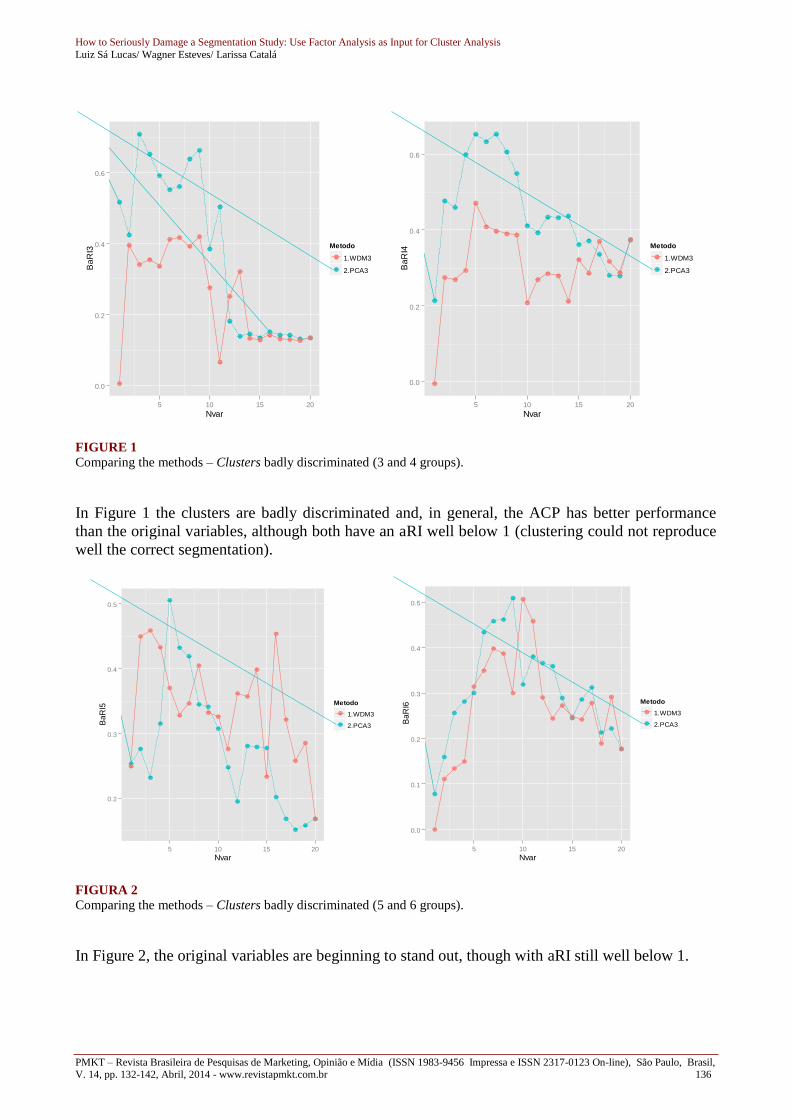
FIGURE 1
Comparing the methods – Clusters badly discriminated (3 and 4 groups).
In Figure 1 the clusters are badly discriminated and, in general, the ACP has better performance
than the original variables, although both have an aRI well below 1 (clustering could not reproduce
well the correct segmentation).
0.2
0.3
0.4
0.5
5 10 15 20
Nvar
Ba
RI5
Metodo
1.WDM3
2.PCA3
0.0
0.1
0.2
0.3
0.4
0.5
5 10 15 20
Nvar
Ba
RI6
Metodo
1.WDM3
2.PCA3
FIGURA 2
Comparing the methods – Clusters badly discriminated (5 and 6 groups).
In Figure 2, the original variables are beginning to stand out, though with aRI still well below 1.

How to Seriously Damage a Segmentation Study: Use Factor Analysis as Input for Cluster Analysis
Luiz Sá Lucas/ Wagner Esteves/ Larissa Catalá
PMKT – Revista Brasileira de Pesquisas de Marketing, Opinião e Mídia (ISSN 1983-9456 Impressa e ISSN 2317-0123 On-line), São Paulo, Brasil, V. 14, pp. 132-142, Abril, 2014 - www.revistapmkt.com.br 137
0.2
0.4
0.6
5 10 15 20
Nvar
Ba
RI8
Metodo
1.WDM3
2.PCA3
FIGURE 3
Comparing the methods – Clusters badly discriminated (7 and 8 groups).
Situation in Figure 3 is similar to Figure 2: the aRI still well below 1.
0.4
0.6
0.8
1.0
5 10 15 20
Nvar
Ma
RI3
Metodo
1.WDM3
2.PCA3
0.4
0.6
0.8
5 10 15 20
Nvar
Ma
RI4
Metodo
1.WDM3
2.PCA3
FIGURE 4
Comparing the methods - Clusters moderately discriminated (3 and 4 groups).
When discrimination increases, the original variables begin to stand out, as in Figure 4, but now
with Ari closer to 1.

How to Seriously Damage a Segmentation Study: Use Factor Analysis as Input for Cluster Analysis
Luiz Sá Lucas/ Wagner Esteves/ Larissa Catalá
PMKT – Revista Brasileira de Pesquisas de Marketing, Opinião e Mídia (ISSN 1983-9456 Impressa e ISSN 2317-0123 On-line), São Paulo, Brasil, V. 14, pp. 132-142, Abril, 2014 - www.revistapmkt.com.br 138
0.4
0.6
0.8
1.0
5 10 15 20
Nvar
Ma
RI5
Metodo
1.WDM3
2.PCA3
0.25
0.50
0.75
5 10 15 20
Nvar
Ma
RI6
Metodo
1.WDM3
2.PCA3
FIGURE 5
Comparing the methods - Clusters moderately discriminated (5 and 6 groups).
In Figure 5, with increasing discrimination, the original variables dominate, with aRI closer to 1.
0.00
0.25
0.50
0.75
5 10 15 20
Nvar
Ma
RI7
Metodo
1.WDM3
2.PCA3
0.25
0.50
0.75
5 10 15 20
Nvar
Ma
RI8
Metodo
1.WDM3
2.PCA3
FIGURE 6
Comparing the methods - Clusters moderately discriminated (7 and 8 groups).
Again, in Figure 6 the same phenomenon is repeated: with increasing discrimination, the original
variables dominate, with aRI closer to 1.

How to Seriously Damage a Segmentation Study: Use Factor Analysis as Input for Cluster Analysis
Luiz Sá Lucas/ Wagner Esteves/ Larissa Catalá
PMKT – Revista Brasileira de Pesquisas de Marketing, Opinião e Mídia (ISSN 1983-9456 Impressa e ISSN 2317-0123 On-line), São Paulo, Brasil, V. 14, pp. 132-142, Abril, 2014 - www.revistapmkt.com.br 139
0.25
0.50
0.75
1.00
5 10 15 20
Nvar
Aa
RI3
Metodo
1.WDM3
2.PCA3
0.4
0.6
0.8
1.0
5 10 15 20
Nvar
Aa
RI4
Metodo
1.WDM3
2.PCA3
FIGURE 7
Comparing the methods - Clusters highly discriminated (3 and 4 groups).
When discrimination increases, as shown in Figure 7, the original variables dominate with aRI
getting even to be equal to 1.
0.6
0.8
1.0
5 10 15 20
Nvar
Aa
RI5
Metodo
1.WDM3
2.PCA3
0.4
0.6
0.8
1.0
5 10 15 20
Nvar
Aa
RI6
Metodo
1.WDM3
2.PCA3
FIGURE 8
Comparing the methods - Clusters highly discriminated (5 and 6 groups).
Everything is repeated in Figure 8: as discrimination increases the original variables dominate with
aRI getting to be equal to 1.

How to Seriously Damage a Segmentation Study: Use Factor Analysis as Input for Cluster Analysis
Luiz Sá Lucas/ Wagner Esteves/ Larissa Catalá
PMKT – Revista Brasileira de Pesquisas de Marketing, Opinião e Mídia (ISSN 1983-9456 Impressa e ISSN 2317-0123 On-line), São Paulo, Brasil, V. 14, pp. 132-142, Abril, 2014 - www.revistapmkt.com.br 140
0.25
0.50
0.75
1.00
5 10 15 20
Nvar
Aa
RI7
Metodo
1.WDM3
2.PCA3
0.25
0.50
0.75
1.00
5 10 15 20
NvarA
aR
I8
Metodo
1.WDM3
2.PCA3
FIGURA 9
Comparing the methods - Clusters highly discriminated (7 and 8 groups).
Even in this case (Figure 9), with increased discrimination, the original variables dominate with aRI
getting to be equal to 1.
6. CONCLUSION
We notice that, as the discrimination between groups increase (better segmentation), dominance
using the original variables increases. In fact, if there is no discrimination between groups,
segmentation is done badly. In these cases, segmenting via ACP can minimize distortion.
The Heatmaps shown in Figure 10 summarize the performance of the methods. Percentages indicate
that the use of the original variables was better than or equal to that of CPs (ACP), as discrimination
among groups increases.
FIGURE 10
Heatmaps as discrimination among groups increases.

How to Seriously Damage a Segmentation Study: Use Factor Analysis as Input for Cluster Analysis
Luiz Sá Lucas/ Wagner Esteves/ Larissa Catalá
PMKT – Revista Brasileira de Pesquisas de Marketing, Opinião e Mídia (ISSN 1983-9456 Impressa e ISSN 2317-0123 On-line), São Paulo, Brasil, V. 14, pp. 132-142, Abril, 2014 - www.revistapmkt.com.br 141
As discrimination among groups get higher, the degree of discrimination increases. Moreover, the
percentage of use of variables becomes more blatant: light blue represents the points where the
original variables have equal or better performance than the principal components.
Furthermore, the use of too few or all the variables affect performance (see Figures 3 and 8). So we
can suggest as a general criterion the adoption of the original variables to a medium level (about
25% to 75%). Besides, the use of principal components would be justified only if we knew we had
an unclear grouping.
7. REFERENCES
BREIMAN, L. Random Forests, Machine Learning, 45, (1) pp. 5-32, 2001.
CHANG, W. On using principal components before separating a mixture of two multivariate
normal distributions, Applied Statistics, 32, pp. 267-275, 1983.
DHILLON, I.; MODHA, D.; SPANGLER, W. Class Visualization of High-Dimensional Data with
Applications, Computational Statistics and Data Analysis, 41, pp. 59-90, 2002.
DIBB, S.; SIMKIN, L. Target segment strategy. In: BAKER, M.; SAREN, M. (Org.). Marketing
Theory, 2010.
DIBB, S.; SIMKIN, L. The Market Segmentation Workbook. London: Routledge, 1996.
GOULD, S. J. The mismeasure of man. New York: W.W. Norton & Company, 1981.
GRAY, K. Think you Know Segmentation? Think Again! A Close Look at 4 Core Analysis. Quirk´s
marketing research media e-newsletter, 2013. in: <www.quirks.com/articles/2013/20131225-
2.aspx>. Accessed in: feb, 5, 2014.
HUBERT, L.; ARABIE, P. Comparing Partitions. Journal of Classification, 1985, pp. 193-218.
KADEN, R.; LINDA, G.; PRINCE, M. Leading edge marketing research. Los Angeles: Sage
Publications. 2013.
KING, D.; WANG, F. Time to Re-think Segmentation, 2007. Disponível em:
<http://www.dmnews.com/time-to-re-think-segmentation/article/98990/>. Accessed in: jan, 6,
2014.
MCDONALD, M.; DUNBAR, I. Market Segmentation – How to do it, How to profit from it.
Oxford: Elsevier, 2004.
MYERS, J. H. Segmentation and positioning for strategic marketing decisions, Chicago: American
Marketing Association, 1996.
QIU, W.; JOE, H. Generation of Random Clusters with Specified Degree of Separation. Journal of
Classification, 23 (2), 2006a, pp. 315-334.

How to Seriously Damage a Segmentation Study: Use Factor Analysis as Input for Cluster Analysis
Luiz Sá Lucas/ Wagner Esteves/ Larissa Catalá
PMKT – Revista Brasileira de Pesquisas de Marketing, Opinião e Mídia (ISSN 1983-9456 Impressa e ISSN 2317-0123 On-line), São Paulo, Brasil, V. 14, pp. 132-142, Abril, 2014 - www.revistapmkt.com.br 142
QIU, W.; JOE, H. Separation Index and Membership Partial for Clustering. Computation Statistics
and Data Analysis, 50, 2006b, pp. 585-603.
RAND, W. Objective Criteria for the Evaluation of Clustering Methods. Journal of the American
Statistical Association, 66, 1971, pp. 846-850.
SÁ LUCAS, L., Joint segmenting consumers using both behavioral and attitudinal data.
Proceedings of the Sawtooth Software Conference, 2007, pp. 199-218.
SHALIZI, C. The Truth about Principal Components and Factor Analysis. Advanced Data Analysis
from an Elementary Point of View, 2014. In:
<http://www.stat.cmu.edu/~cshalizi/ADAfaEPoV/ADAfaEPoV.pdf>. Accessed in: feb, 4, 2014.
SMITH, W. Product Differentiation and Market Segmentaion as Alternative Marketing Strategies.
Journal of Marketing, 21 (July), 1956, pp. 3-8.
STEWART, D. The Application and Misapplication of Factor Analysis in Marketing Research.
Journal of Marketing Research, 18 (February), 1981, pp.51-62.
WEDEL, M.; KAMAKURA, W. Market Segmentation – Conceptual and Methodological
Foundations, International Series in Quantitative Marketing, Boston: Kluwer Academic Publishers,
2000.
YEUNG, K.; RUZZO, W. An Empirical study of Principal Component Analysis for Clustering
Gene Expression Data, Bioinformatics, 2001.
Note: Authors are solely responsible for the translation of their articles from Portuguese to English.