Embed Size (px)
Citation preview

Cluster Analysis of Air Quality Data for CCOS Study Domain
Scott BeaverAhmet Palazoglu, P.I.University of California, Davis
Dept. Chemical Engineering & Materials Science
CCOS Technical Committee MeetingCal/EPA Building, 1001 I St., Sacramento, CA
Thursday 31 March 2007
Department of Chemical Engineering and Materials Science

Overview• Project: Cluster Analysis for CCOS Domain
I. Intra-basin analyses: wind patterns & synoptic regimesII. Inter-basin meteorological response of O3 levels
• Intra-basin analyses:– Completed Bay Area analysis
• Strong synoptic influence; seabreeze cycles
– Preliminary North SJV wind field clustering• Synoptic & ventilation effects
– Preliminary Central SJV wind field clustering• Synoptic & mesoscale (Fresno eddy) effects
– Preliminary South SJV wind field clustering• Synoptic effects; mesoscale variability difficult to capture
– Initial Sacramento Valley & Mountain Counties analysis
• Future work and recommendations
Department of Chemical Engineering and Materials Science

Cluster Analysis for CCOS• Scope of 2-year project
I. Intra-basin wind field cluster analyses– Requires continuous, hourly surface wind data– Days grouped by diurnal wind field patterns– Reveals synoptic and mesoscale flow regimes
II. Inter-basin analysis
• Study Domain– 6 CCOS air basins
• San Francisco Bay Area• SJV: split into North, Central, & South• Sacramento Valley• Mountain Counties
– 1996-2004 ozone seasons (1 May – 31 October)
Department of Chemical Engineering and Materials Science
Department of Chemical Engineering and Materials Science
San Francisco Bay Area
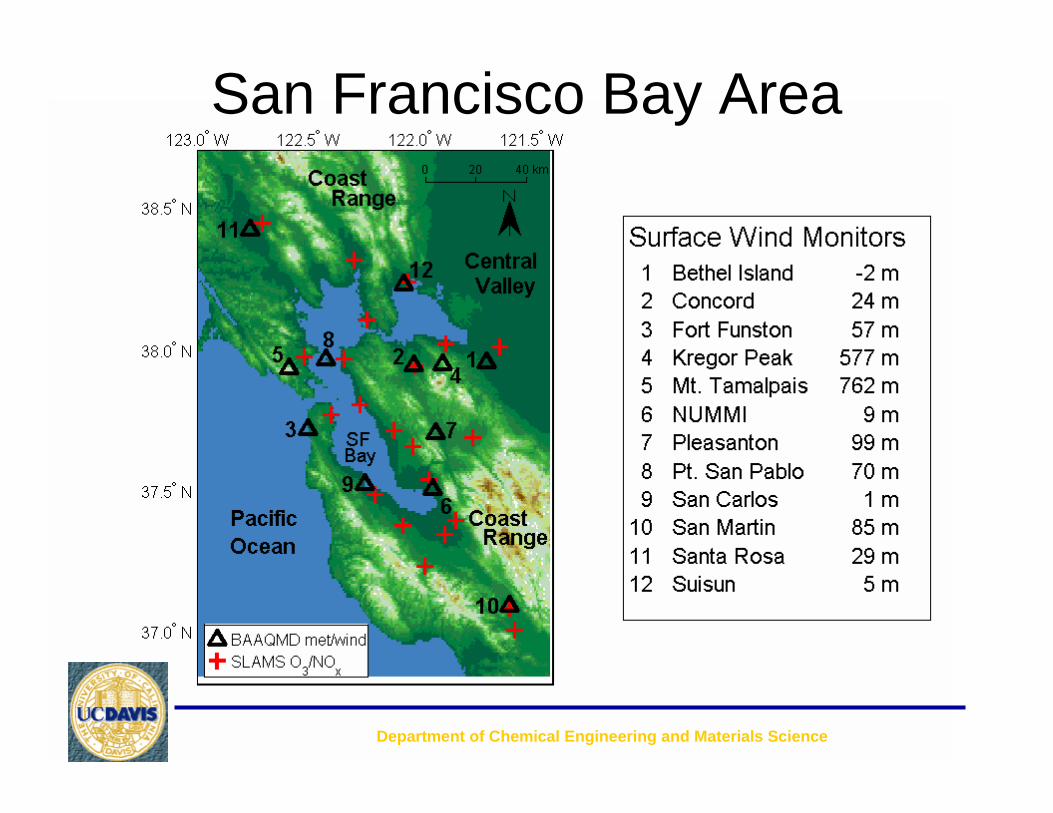
SFBA: 4 clusters for 976 days1
996
199
719
9819
9920
0020
0120
02
Jun 01 Jun 15 Jul 01 Jul 15 Aug 01 Aug 15 Sep 01 Sep 15 Sep 30
200
3
Department of Chemical Engineering and Materials Science
*Beaver and Palazoglu, 2006: Cluster analysis of hourly wind measurements to reveal synoptic regimes affecting air quality. Journal of Applied Meteorology and Climatology, 45, 1710—26.
5600
5600
5650
5650
5700
5700
57505750
5800
5800
5850
5850
5900
5900
165° W 150° W 135° W 120° W 105° W 90° W
30° N
45° N
60° N
5550
5550
5600
5600
5650 5650
5700 57005750 57505800
58005850
5850
165° W 150° W 135° W 120° W 105° W 90° W
30° N
45° N
60° N
5600
5600
5650
5650
5700
5700
5750
5750
58005800
5850
5850
5900
165° W 150° W 135° W 120° W 105° W 90° W
30° N
45° N
60° N
5550
5600
5600
56505650
5700 57005750 5750
5800 5800
58505850
5900
165° W 150° W 135° W 120° W 105° W 90° W
30° N
45° N
60° N
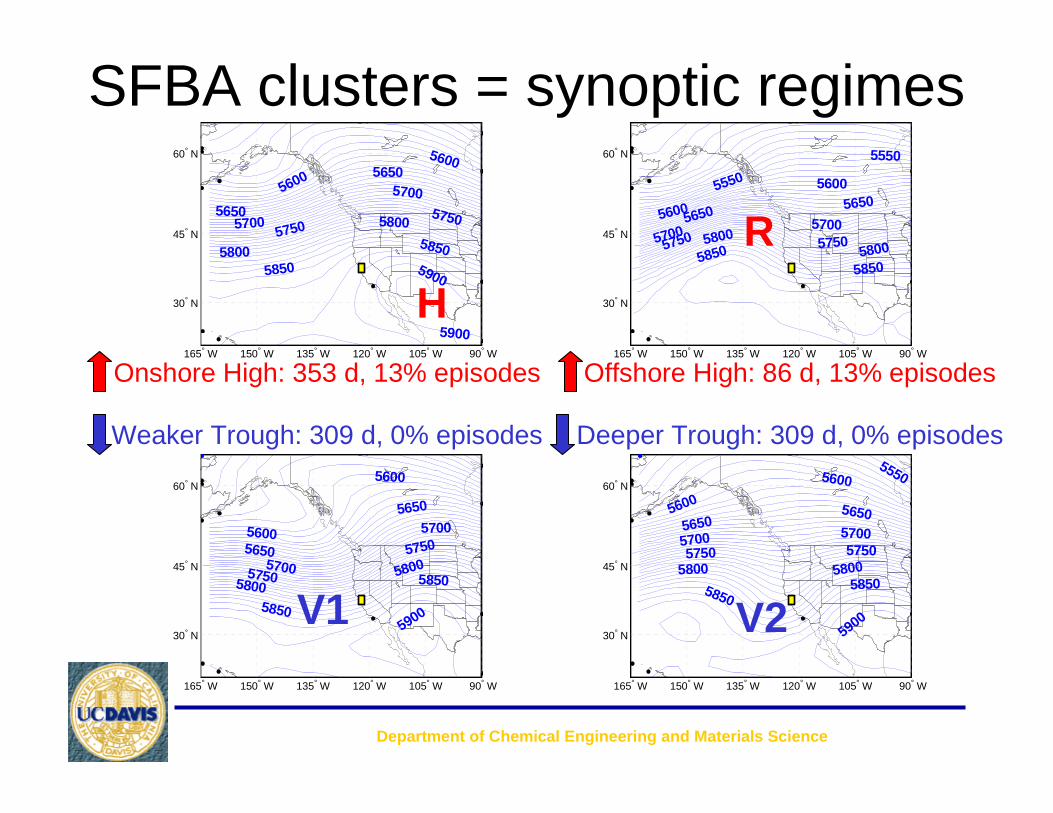
SFBA clusters = synoptic regimes
Department of Chemical Engineering and Materials Science
H
R
V2V1
Onshore High: 353 d, 13% episodes Offshore High: 86 d, 13% episodes
Weaker Trough: 309 d, 0% episodes Deeper Trough: 309 d, 0% episodes

*Beaver, Palazoglu and Tanrikulu, 2007: Cluster sequencing to analyze synoptic transitions affecting regional ozone. Journal of Applied Meteorology and Climatology, in press.
Synoptic Transition Probabilities• R transitions rapidly to H
– Severe, multi-day episodes– Reverse H�R does not occur– Polar low may “save” SFBA from episode
• Persistence of H indicates stability– Displaced by sufficiently deep trough (e.g. V2)– Bulk of episodes during persistent H
• Transitions from V1 & V2 driven by global met.– Troughs may persist for long periods; low O3 levels– Transition to H or R will occur unless O3 season ends
Department of Chemical Engineering and Materials Science
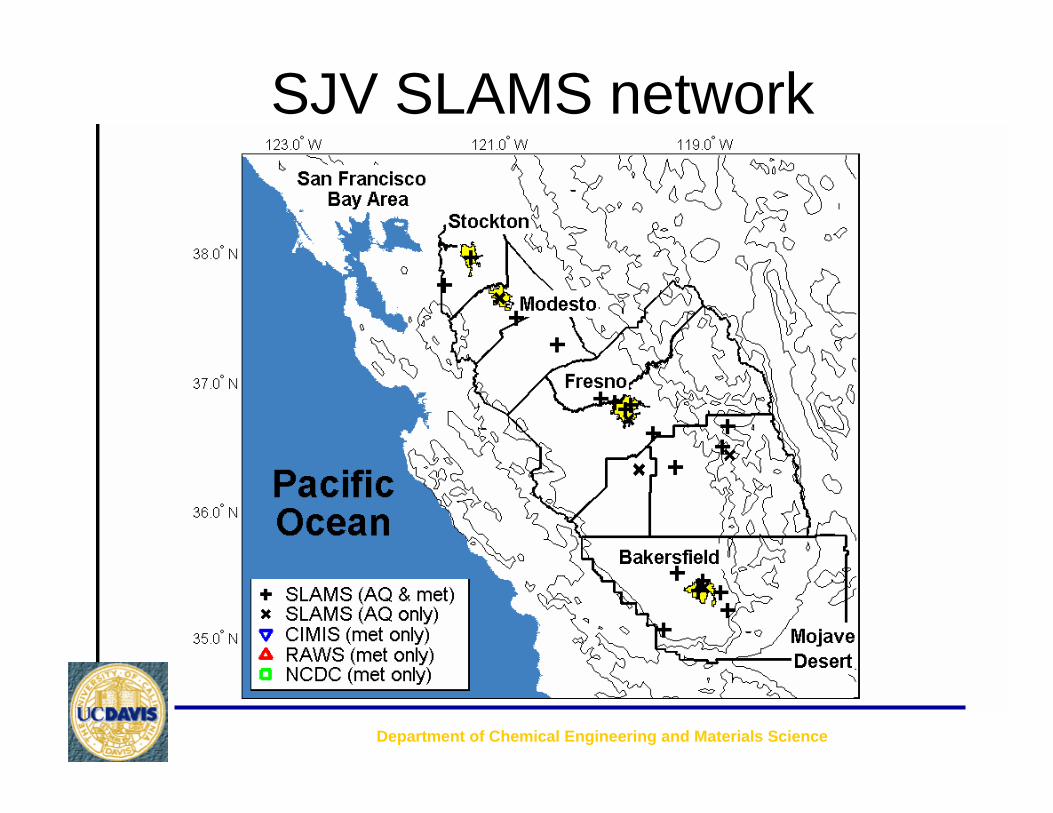
SJV SLAMS network
Department of Chemical Engineering and Materials Science

SLAMS, CIMIS, RAWS & NCDC
Department of Chemical Engineering and Materials Science

North SJV Wind Monitors
Department of Chemical Engineering and Materials Science

Wind Speed Errors at Tracy
Department of Chemical Engineering and Materials Science
1996—1999 are similar to 2001—2004.
05
1015
Tracy-Patterson Rd. -- Wind Speed
2000
05
1015
2001
05
1015
2002
05
1015
2003
May01 Jun01 Jul01 Aug01 Sep01 Oct01 Nov0105
1015
2004

Tracy-Patterson Rd. -- Wind Direction Hourly Distribution
2000
2001
2002
2003
1 2 3 4 5 6 7 8 9 10 11 12 13 14 15 16 17 18 19 20 21 22 23 24Hour of Day
2004
Wind Direction Errors at Tracy
Department of Chemical Engineering and Materials Science
1996—1999 are similar to 2001—2003.

Gantt chart for N-SJV
Department of Chemical Engineering and Materials Science
Yellow = 1 Nov—30 Apr winter data (not clustered)Blue = clustered stations (included in Total)Red = non-clustered stations (excluded from Total)

55005550
5550
56005650
57005750
58005850
165° W 150° W 135° W 120° W 105° W 90° W
30° N
45° N
60° N
555056005650
57005750
5800
5850
5900
165° W 150° W 135° W 120° W 105° W 90° W
30° N
45° N
60° N
54505500
5550
5600 5650 570057505800
5850
165° W 150° W 135° W 120° W 105° W 90° W
30° N
45° N
60° N
5550
5600
5600
56505700
57505800
5850 5900
165° W 150° W 135° W 120° W 105° W 90° W
30° N
45° N
60° N
5500
5550
560056505700
575058005850
165° W 150° W 135° W 120° W 105° W 90° W
30° N
45° N
60° N
Department of Chemical Engineering and Materials Science
H: 179 days, 42%
H H
R
V2V1
V
R: 264 days, 19%H/V: 212 days, 25%
V2: 108 days, 6%V1: 299 days, 12%

N-SJV 0900 PST Wind Field
Department of Chemical Engineering and Materials Science
Magenta: Carquinez Strait— Ft. Funston, Pt. San Pablo, Suisun, Bethel Is.
Blue: Altamont Pass— Kregor Peak, TracyRed: Pacheco Pass— Los BanosBlack: SJV floor
H H/VR V1 V2Increasing marine ventilation: R < H < H/V < V1 < V2

N-SJV Seasonal Distribution
Department of Chemical Engineering and Materials Science
0
1
Black: Probability a Cluster is Realized Within 5 Days of Any Day of YearRed: Probability a Cluster is Realized as Exceedance Within 5 Days of Any Day of Year
0
1
0
1
0
1
01 May 01 Jun 01 Jul 01 Aug 01 Sep 01 Oct0
1
Day of Year
H
H/V
R
V1
V2

N-SJV Ventilation
Department of Chemical Engineering and Materials Science
10
20
30
40
50Tracy Stockton Merced
1500 PST Temperature (oC)
-5
0
5
10
15
1000 PST Westerly Speed (m/s)
Bethel Island Tracy Los Banos
H H/V V1
V2 R H H/V V1
V2 R H H/V V1
V2 R

Altamont Pass Wind Distribution
Department of Chemical Engineering and Materials Science
0800PST Wind Distribution
H (164 d)
Tra
cy
H/V (189 d) V1 (281 d) V2 (89 d) R (245 d)
Ple
asan
ton
Kre
gor
Pea
k
0 0.25 0.5 0.75 1

N-SJV Synoptic Sequencing
• α = 0.05– R H/V disfavored– Clusters occur in different seasons (trivial result)
• α = 0.15– R H favored
– H H/V favored
– H/ V V favored
– V R favored
• Compare to Bay Area– Transitions significant at α < 0.02– Stronger synoptic influence than N-SJV

Central SJV Wind Monitors
Department of Chemical Engineering and Materials Science

Annual Biases in Wind Direction
Department of Chemical Engineering and Materials Science
090
180270360
1999
Dir
Clovis-N Villa Wind Direction
090
180270360
2000
Dir
090
180270360
2001
Dir
090
180270360
2002
Dir
01 May 01 Jun 01 Jul 01 Aug 01 Sep 01 Oct 01 Nov0
90180270360
2003
Dir
2000—02 are ~15o more westerly than other years.

Upslope/Downslope Cycle
30 Jul 05 Aug 10 Aug 15 Aug0
90
180
270
360
2003
Dir
Department of Chemical Engineering and Materials Science
Wind direction at SLAMS Sequoia monitor for 20 days during 2003.
Flow switches from easterly to westerly.
Daytime upslope flows; nighttime drainage flows
Diurnal cycle largely captures local effects.
Signal is not well modeled by clustering algorithm.

Gantt chart for C-SJV
Department of Chemical Engineering and Materials Science
Magenta: stations with annual biases
5600
5600
565057005750
5800
5850
5900 165° W 150° W 135° W 120° W 105° W 90° W
30° N
45° N
60° N
5650 57005750
58005850
5900 165° W 150° W 135° W 120° W 105° W 90° W
30° N
45° N
60° N
5450
5500
55505600
5650 57005750
58005850
165° W 150° W 135° W 120° W 105° W 90° W
30° N
45° N
60° N
5550 56005650
57005750
58005850
165° W 150° W 135° W 120° W 105° W 90° W
30° N
45° N
60° N
5550
56005650
5700575058005850
165° W 150° W 135° W 120° W 105° W 90° W
30° N
45° N
60° N
Department of Chemical Engineering and Materials Science
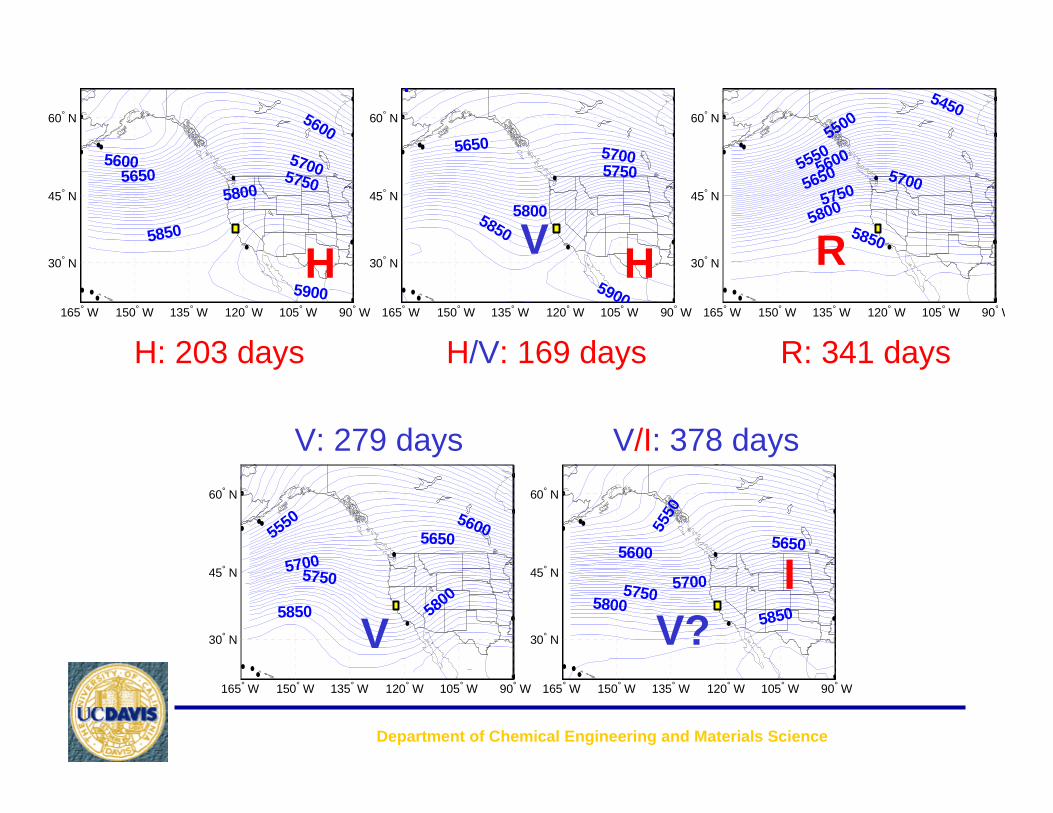
H: 203 days
H H R
V
V
R: 341 daysH/V: 169 days
V/I: 378 daysV: 279 days
IV?

C-SJV 8-hr O3 Exceedances
Department of Chemical Engineering and Materials Science
H RH/VV/IV
Ventilated regime episodes favor Sequoia.
Anti-cyclonic regime episodes favor SJV floor.
Percentage of days in each cluster that are 8-hr O3 exceedances
279 d 378 d 169 d 203 d 341 dTotal 40% 32% 64% 92% 59%SJV floor 29% 17% 34% 84% 52% Parlier 20% 15% 28% 73% 43% Clovis 18% 6% 12% 62% 33%
Sequoia 25% 25% 57% 64% 33%SJV floor & Sequoia 14% 10% 27% 56% 26%

C-SJV Seasonal Distribution
0
1
Black: Probability a Cluster is Realized Within 5 Days of Any Day of YearRed: Probability a Cluster is Realized as Exceedance Within 5 Days of Any Day of Year
0
1
0
1
0
1
01 May 01 Jun 01 Jul 01 Aug 01 Sep 01 Oct0
1
Day of Year
Department of Chemical Engineering and Materials Science
H
H/V
R
V/I
V

C-SJV Synoptic Sequencing
• Direct transitions between H, R, and Voccur infrequently
• H/V and V/I are “intermediate” states– C-SJV is buffered from synoptic effects
– Synoptic transitions have less effect on O3levels than for N-SJV (than for Bay Area)
• Mesoscale effects important for C-SJV
Department of Chemical Engineering and Materials Science
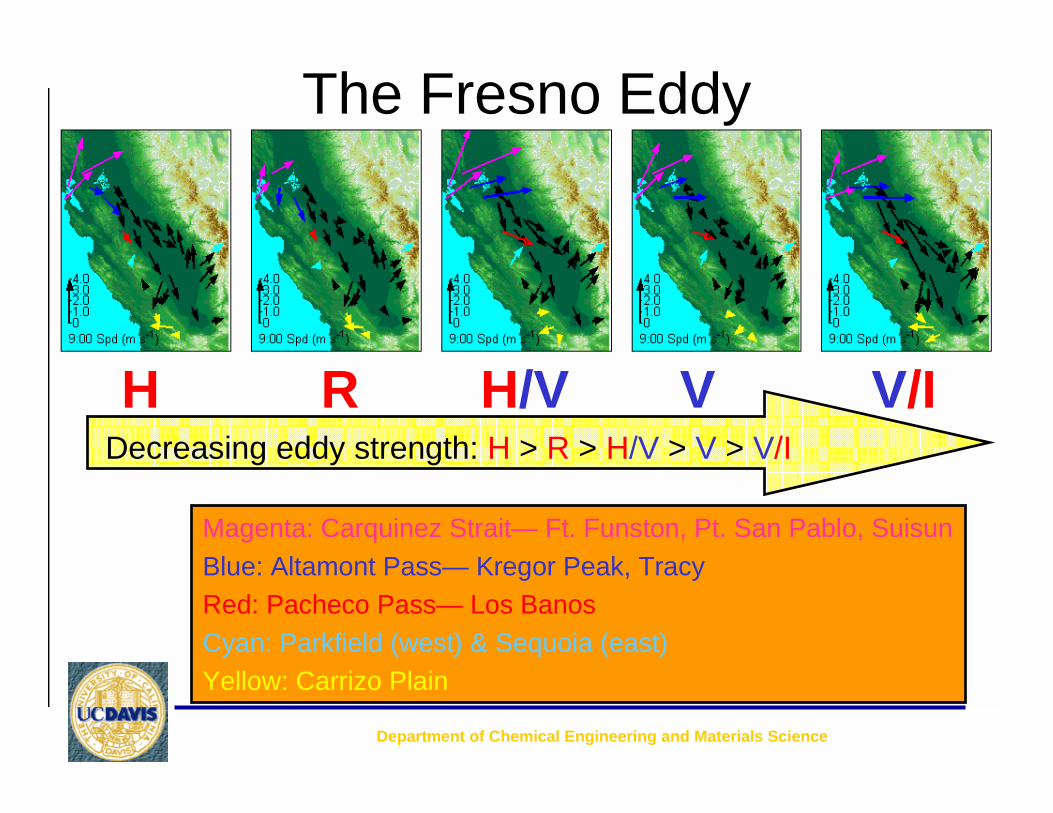
The Fresno Eddy
Department of Chemical Engineering and Materials Science
Magenta: Carquinez Strait— Ft. Funston, Pt. San Pablo, SuisunBlue: Altamont Pass— Kregor Peak, TracyRed: Pacheco Pass— Los BanosCyan: Parkfield (west) & Sequoia (east)Yellow: Carrizo Plain
R H/VH V V/IDecreasing eddy strength: H > R > H/V > V > V/I

Eddy Strength and O3 Levels
Department of Chemical Engineering and Materials Science
Strong eddyNo/weak eddy
406080
100120
WeekdaysWeekends
406080
100120
406080
100120
Da
ily M
axi
mu
m 8
-hr
O 3 leve
l at P
arli
er
406080
100120
-6 -4 -2 0 2 4 6
406080
100120
Parlier southerly wind component at 0900 PST (m/s)
R
H/V
H
V
V/I
?

Department of Chemical Engineering and Materials Science
5650
57005750 5800
5850
5900
Eddy (133 d)
5550 5600
565057005750
5800
5850
Eddy (188 d)
5500
55505600
5650 5700
57505800 5850
Eddy (207 d)
54505500
5550 560056505700575058005850
Stagnant (21 d)5600
5650
5700
57505800
5850
5900
Stagnant (19 d)
555056005650
5700
5750
58005850
5900
Stagnant (15 d)
5550
56005650
57005750
5800
5850
Stagnant (43 d)
56005650
57005750
5800
5850
5900
No eddy (14 d)55005550
5600
56505700 5750
58005850
No eddy (60 d)5550
56005650
57005750
5800
5850
No eddy (118 d)
56005650
57005750
5800
585059
00
Eddy (193 d)5450
5500 5550
56005650 57005750
58005850
Eddy (296 d)R H/V V V/IH
Eddy Strength & Marine Ventilation
Within each regime, enhanced marine ventilation can suppress eddy formation

South SJV Wind Monitors
Department of Chemical Engineering and Materials Science

Gantt chart for S-SJV
Department of Chemical Engineering and Materials Science

56005650
5700
5750
5800 5850
5900
165° W 150° W 135° W 120° W 105° W 90° W
30° N
45° N
60° N 5600
56505700
575058005850
5900
165° W 150° W 135° W 120° W 105° W 90° W
30° N
45° N
60° N
545055005550
5600 5650
57005750
5800
5850
165° W 150° W 135° W 120° W 105° W 90° W
30° N
45° N
60° N
5500
55505600
5650 57005750
58005850
165° W 150° W 135° W 120° W 105° W 90° W
30° N
45° N
60° N
5500
5550
5600 5650
57005750
5800
5850
165° W 150° W 135° W 120° W 105° W 90° W
30° N
45° N
60° N
Department of Chemical Engineering and Materials Science
H/V: 206 days, 64%
H H R
V
V
R: 373 days, 62%H: 354 days, 58%
V/I: 317 days, 22%V: 160 days, 36%
I?V

Department of Chemical Engineering and Materials Science
H
H/V
R
V
V/I
0
1
Black: Probability a Cluster is Realized Within 5 Days of Any Day of YearRed: Probability a Cluster is Realized as Exceedance Within 5 Days of Any Day of Year
0
1
0
1
0
1
01 May 01 Jun 01 Jul 01 Aug 01 Sep 01 Oct0
1
Day of Year
S-SJV Seasonal Distribution

Progress
Department of Chemical Engineering and Materials Science
Non-contracted quality assurance is a critical but time consuming step which has delayed Phase I progress.
Obt
ain
data
Qua
lity
assu
ranc
e
Win
d fie
ld c
lust
erin
g
Ozo
ne c
lust
erin
g
Intr
a-ba
sin
repo
rt
Syn
optic
seq
uenc
ing
Rel
ate
win
d an
d oz
one
clus
ters
Inte
r-ba
sin
syno
ptic
an
alys
is
Inte
r-ba
sin
tem
pora
l an
alys
is
San Francisco Bay Area X X X X X X XSJV North X X X \ \ XSJV Central X X X \ \ XSJV South X X \ \Sacramento Valley XMountain Counties X
Phase I Phase II

Recommendations• Transport analysis for identified met regimes using a
(back-trajectory) transport model.– Transport through gaps in Coastal Range– Transport patterns from major source areas
• NOx/VOC ratio and O3 sensitivity– Role of meteorology
• El Nino effects• Wild fire analysis• Vertical analysis
– Visalia profiler– Limited soundings?
• AQM performance evaluation• … and others from project work plan ???
Department of Chemical Engineering and Materials Science