Embed Size (px)
Citation preview
1
Climate Study for Learning, Living,
and Working
September 15, 2017
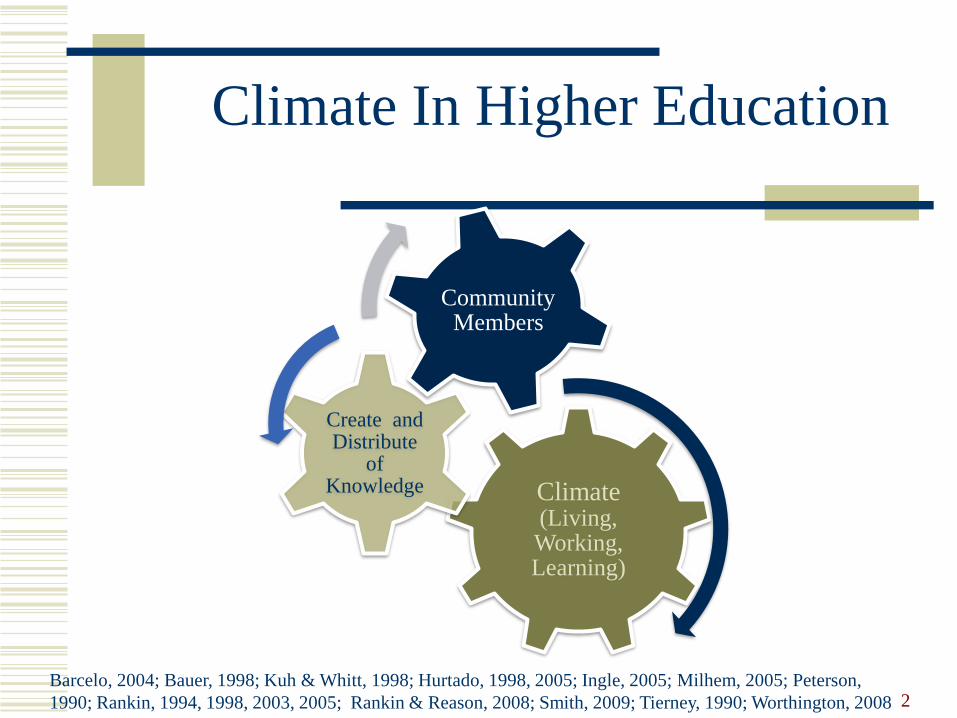
Climate In Higher Education
Climate (Living, Working, Learning)
Create and Distribute
of Knowledge
Community Members
2Barcelo, 2004; Bauer, 1998; Kuh & Whitt, 1998; Hurtado, 1998, 2005; Ingle, 2005; Milhem, 2005; Peterson,
1990; Rankin, 1994, 1998, 2003, 2005; Rankin & Reason, 2008; Smith, 2009; Tierney, 1990; Worthington, 2008
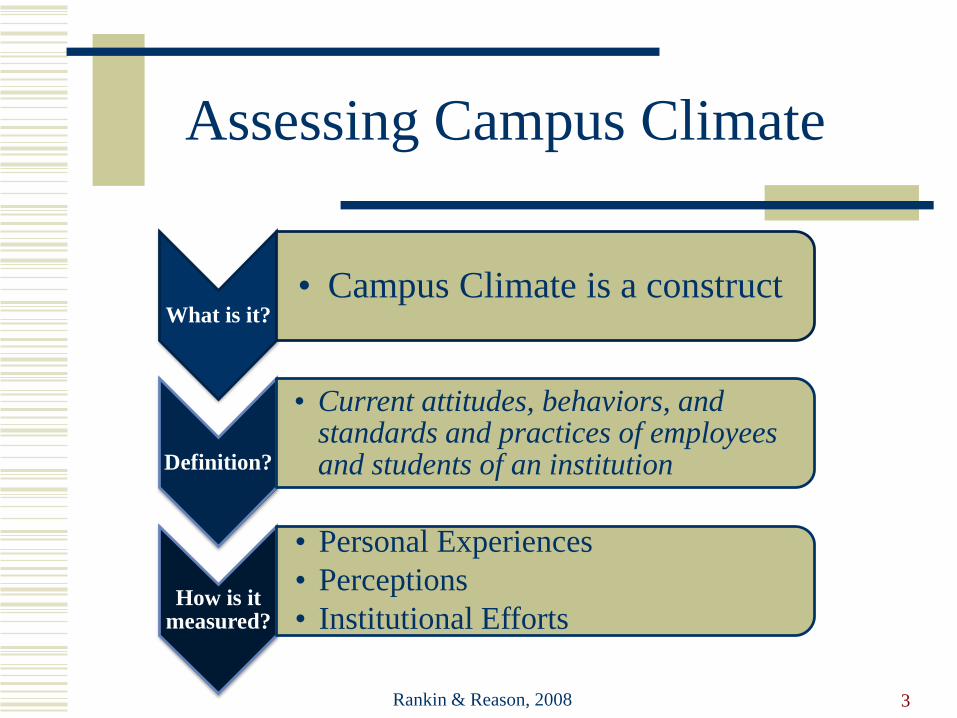
Assessing Campus Climate
3Rankin & Reason, 2008
What is it?• Campus Climate is a construct
Definition?
• Current attitudes, behaviors, and standards and practices of employees and students of an institution
How is it measured?
• Personal Experiences
• Perceptions
• Institutional Efforts
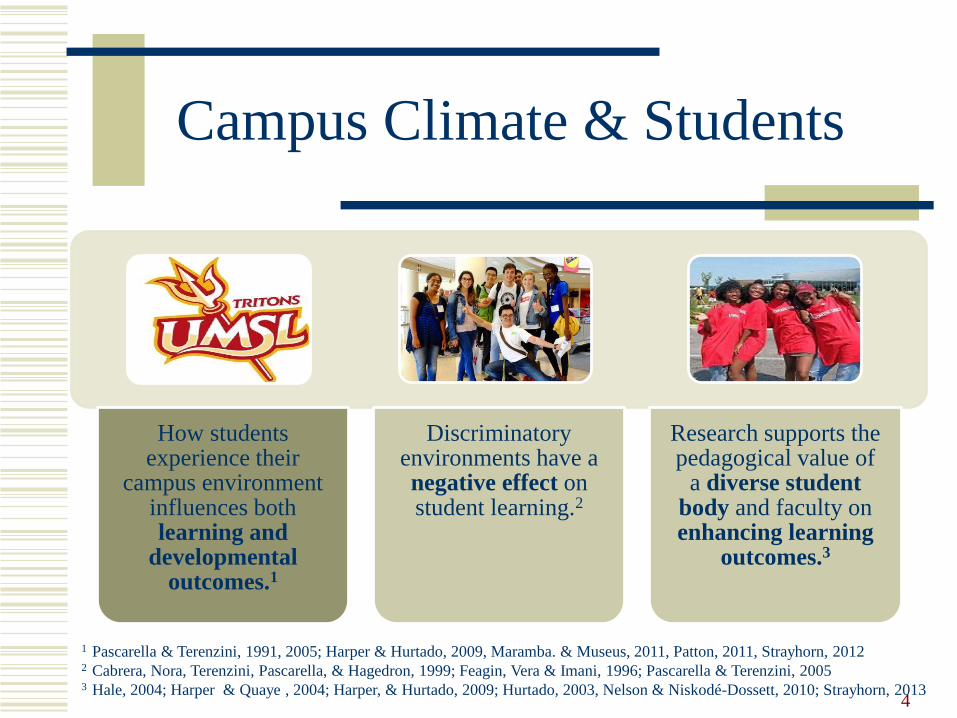
Campus Climate & Students
How students experience their
campus environment influences both learning and
developmental outcomes.1
Discriminatory environments have a negative effect on student learning.2
Research supports the pedagogical value of
a diverse student body and faculty on enhancing learning
outcomes.3
4
1 Pascarella & Terenzini, 1991, 2005; Harper & Hurtado, 2009, Maramba. & Museus, 2011, Patton, 2011, Strayhorn, 20122 Cabrera, Nora, Terenzini, Pascarella, & Hagedron, 1999; Feagin, Vera & Imani, 1996; Pascarella & Terenzini, 2005 3 Hale, 2004; Harper & Quaye , 2004; Harper, & Hurtado, 2009; Hurtado, 2003, Nelson & Niskodé-Dossett, 2010; Strayhorn, 2013
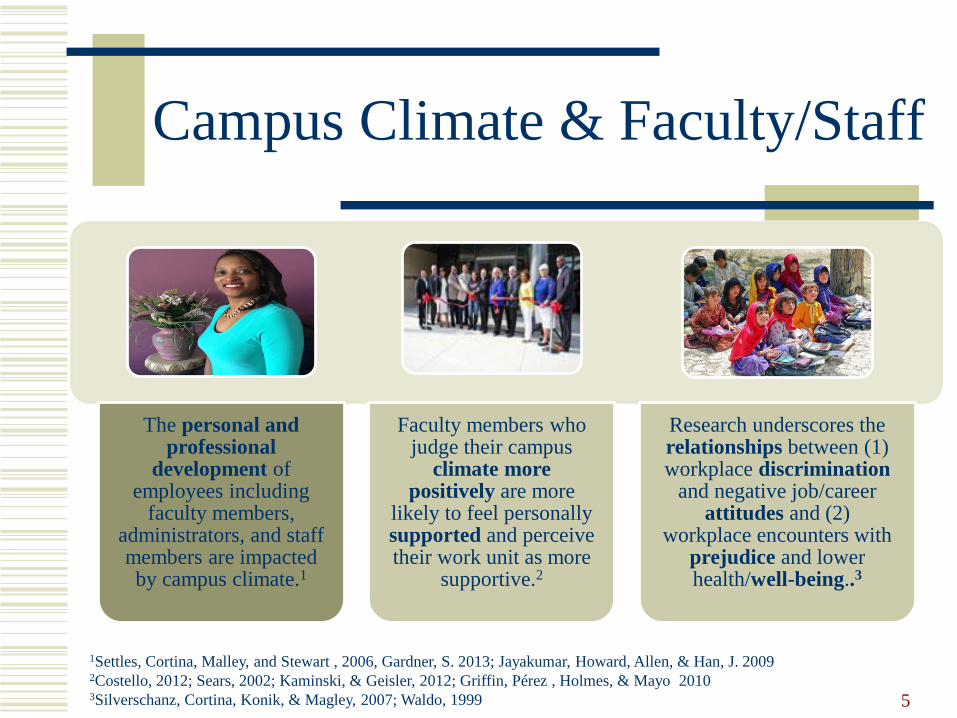
Campus Climate & Faculty/Staff
The personal and professional
development of employees including
faculty members, administrators, and staff members are impacted by campus climate.1
Faculty members who judge their campus
climate more positively are more
likely to feel personally supported and perceive their work unit as more
supportive.2
Research underscores the relationships between (1) workplace discrimination
and negative job/career attitudes and (2)
workplace encounters with prejudice and lower health/well-being..3
5
1Settles, Cortina, Malley, and Stewart , 2006, Gardner, S. 2013; Jayakumar, Howard, Allen, & Han, J. 2009 2Costello, 2012; Sears, 2002; Kaminski, & Geisler, 2012; Griffin, Pérez , Holmes, & Mayo 20103Silverschanz, Cortina, Konik, & Magley, 2007; Waldo, 1999
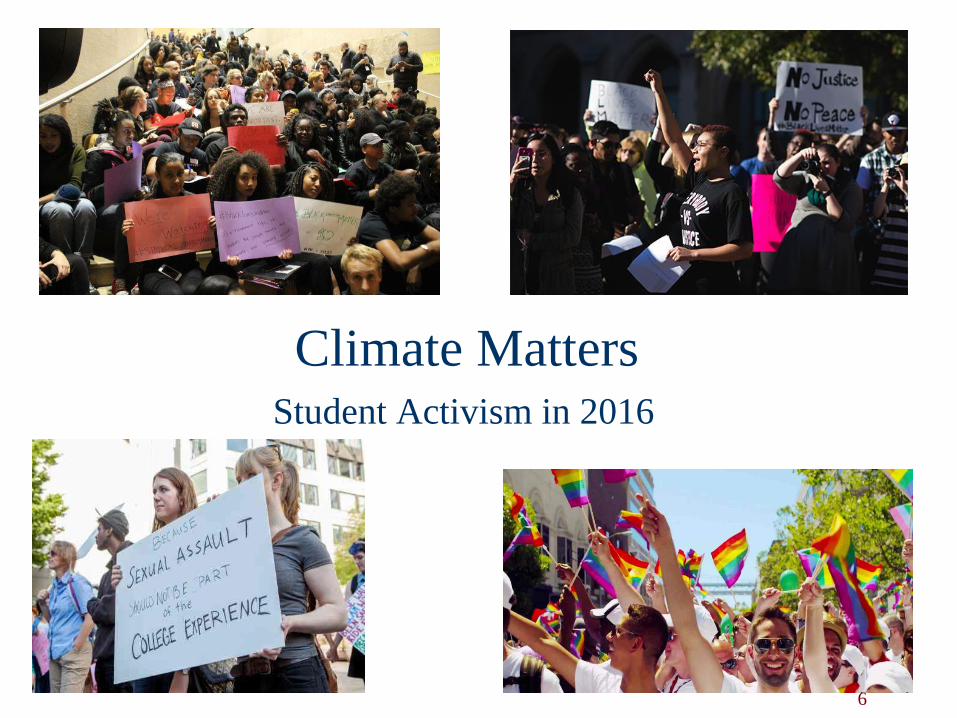
Climate MattersStudent Activism in 2016
6
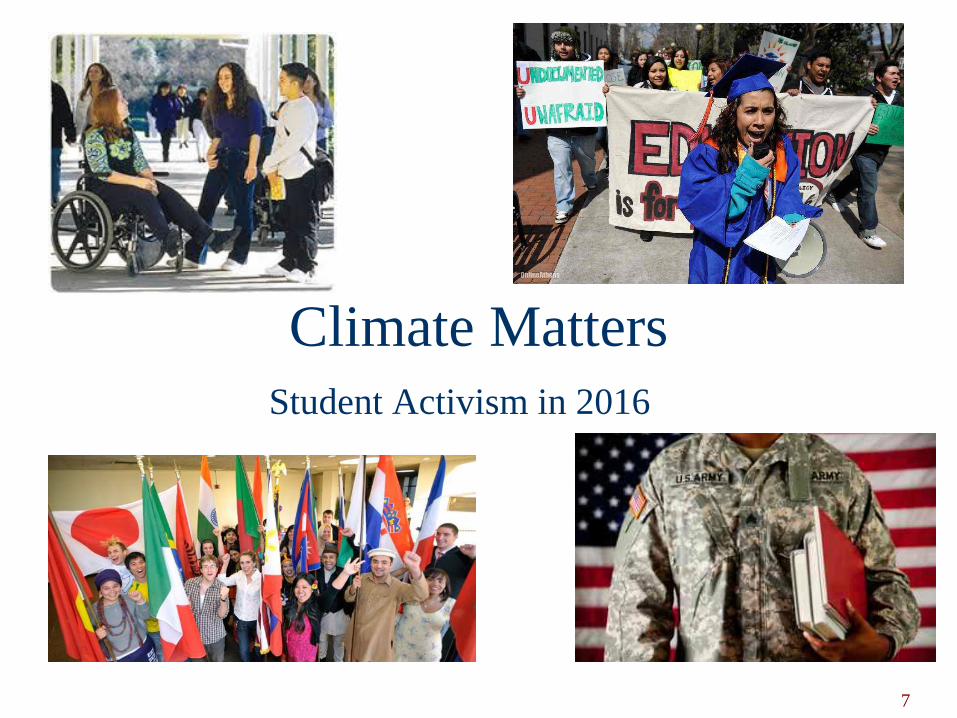
Climate Matters
Student Activism in 2016
7
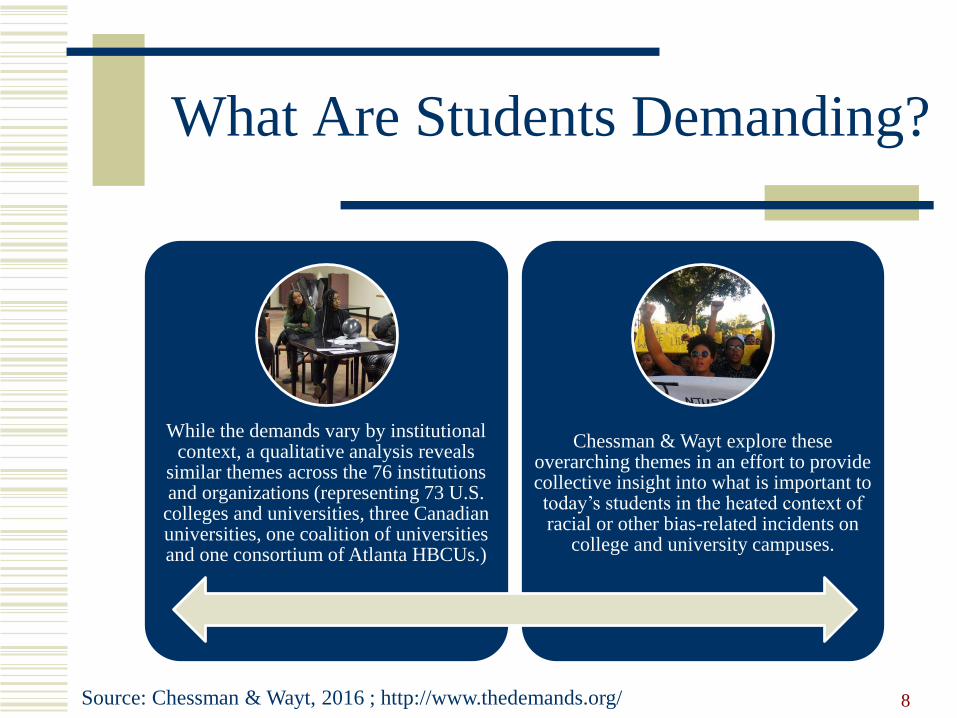
While the demands vary by institutional context, a qualitative analysis reveals
similar themes across the 76 institutions and organizations (representing 73 U.S. colleges and universities, three Canadian universities, one coalition of universities and one consortium of Atlanta HBCUs.)
Chessman & Wayt explore these overarching themes in an effort to provide collective insight into what is important to today’s students in the heated context of racial or other bias-related incidents on
college and university campuses.
What Are Students Demanding?
Source: Chessman & Wayt, 2016 ; http://www.thedemands.org/ 8
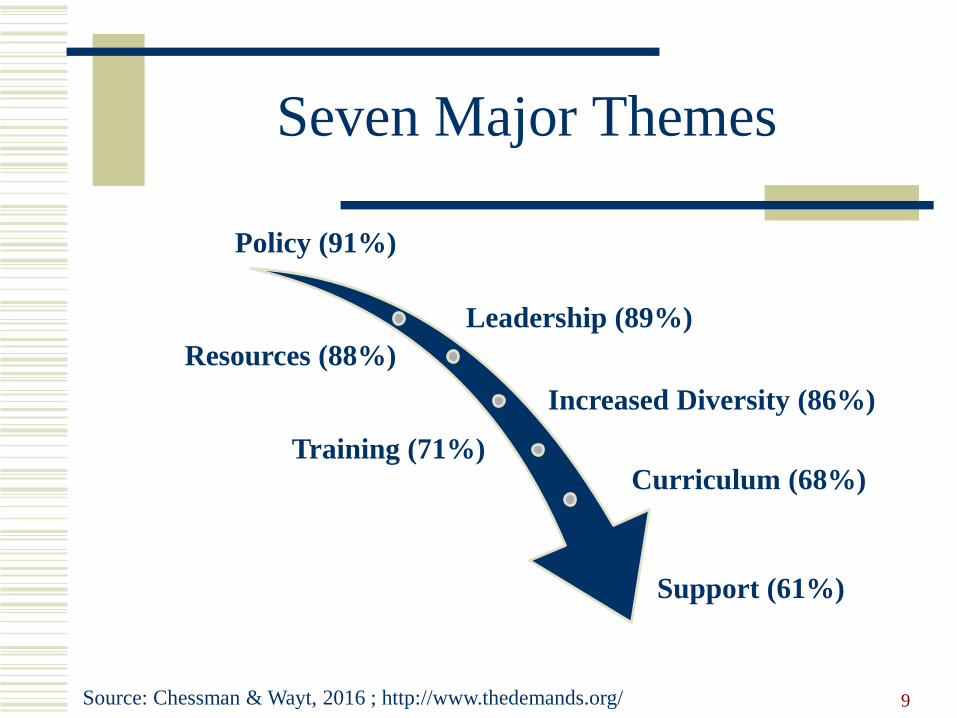
Policy (91%)
Leadership (89%)
Resources (88%)
Increased Diversity (86%)
Training (71%)Curriculum (68%)
Support (61%)
Seven Major Themes
Source: Chessman & Wayt, 2016 ; http://www.thedemands.org/ 9

What are students’ behavioral
responses?
Responses to Unwelcoming Campus Climates
10
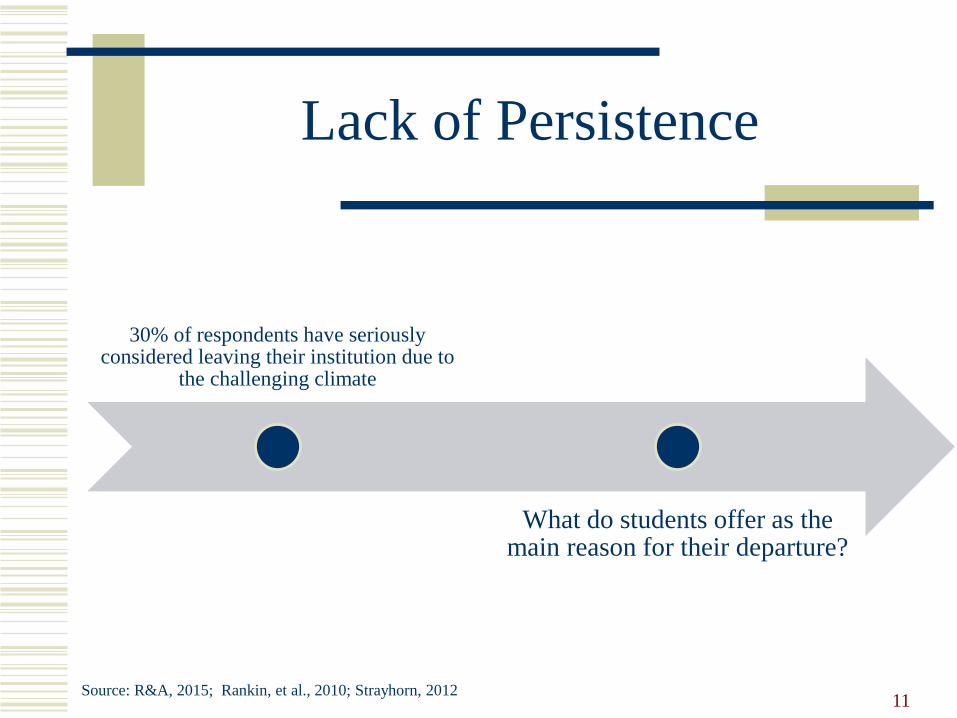
30% of respondents have seriously considered leaving their institution due to
the challenging climate
What do students offer as the main reason for their departure?
Lack of Persistence
Source: R&A, 2015; Rankin, et al., 2010; Strayhorn, 201211
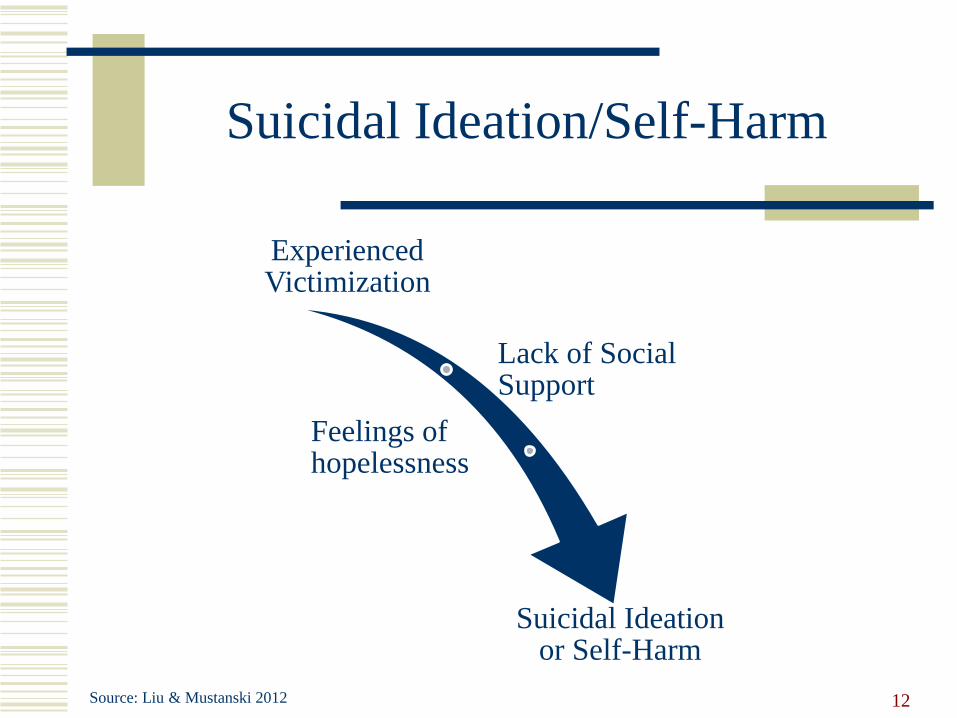
Suicidal Ideation/Self-Harm
Experienced Victimization
Lack of Social Support
Feelings of hopelessness
Suicidal Ideation or Self-Harm
Source: Liu & Mustanski 2012 12
Projected Outcomes
13
UMSL will add to their knowledge base with regard to how constituent groups currently feel about their particular campus climate and how the community responds to them (e.g., work-life issues, curricular integration, inter-group/intra-group relations, respect issues).
UMSL will use the results of the assessment to inform current/on-going work.
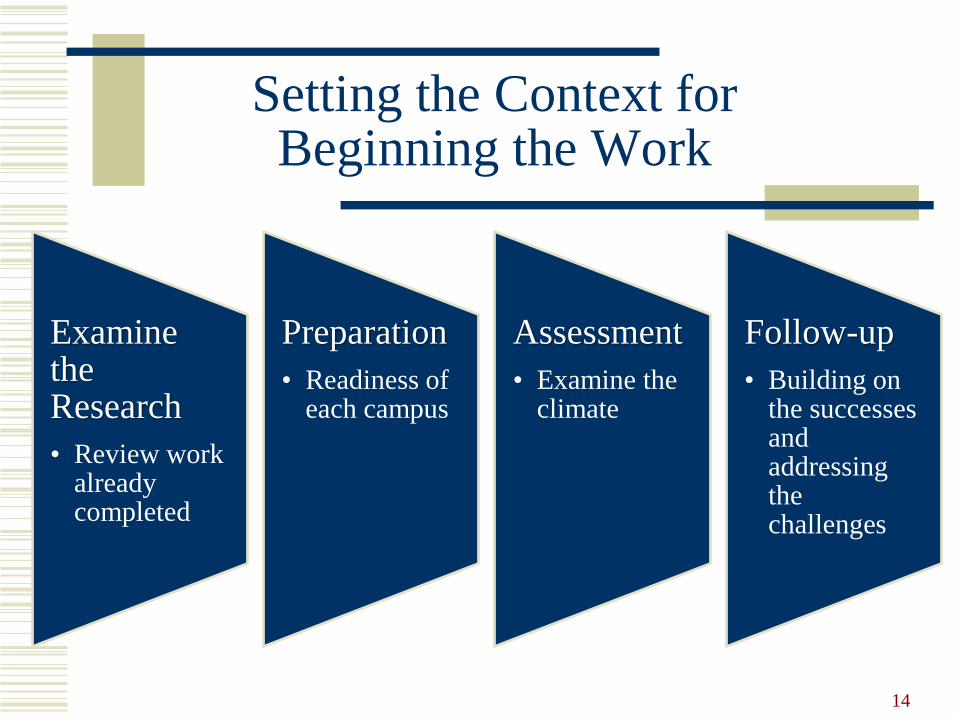
Setting the Context for Beginning the Work
Examine the Research
• Review work already completed
Preparation
• Readiness of each campus
Assessment
• Examine the climate
Follow-up
• Building on the successes and addressing the challenges
14
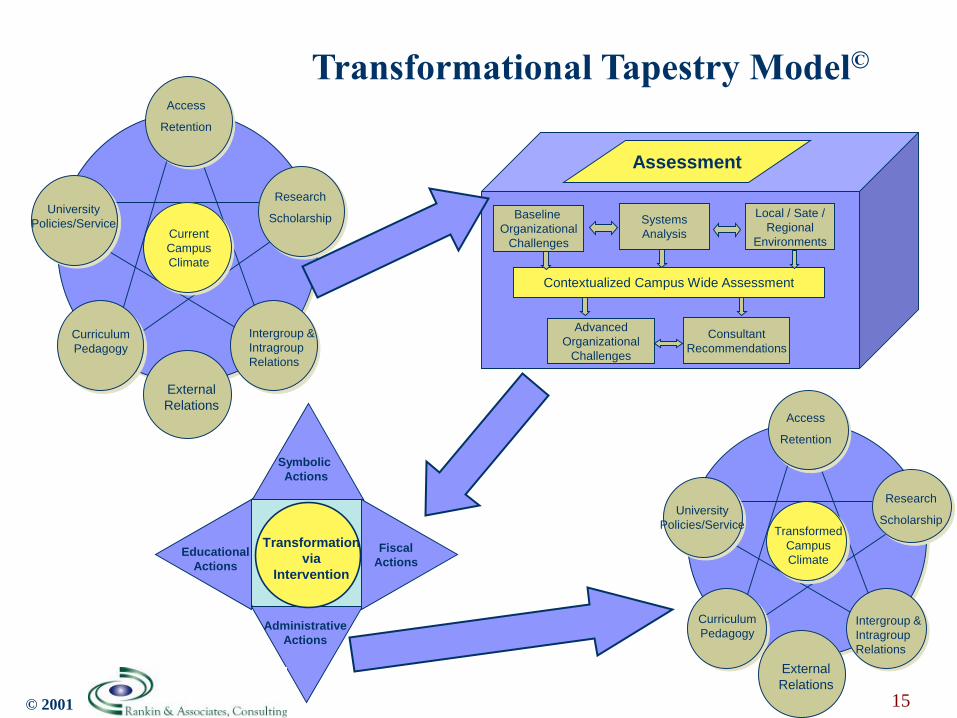
Current
Campus
Climate
Access
Retention
Research
Scholarship
Curriculum
Pedagogy
University
Policies/Service
Intergroup &
Intragroup
Relations
Transformational Tapestry Model©
Baseline
Organizational
Challenges
Systems
Analysis
Local / Sate /
Regional
Environments
Contextualized Campus Wide Assessment
Advanced
Organizational
Challenges
Consultant
Recommendations
Assessment
Transformation
via
Intervention
Fiscal
Actions
Symbolic
Actions
Administrative
Actions
Educational
Actions
Transformed
Campus
Climate
Access
Retention
Research
Scholarship
Curriculum
Pedagogy
University
Policies/Service
Intergroup &
Intragroup
Relations
© 2001
External
Relations
External
Relations
15

16
Project Overview
• Review of Institutional Data
• Assessment Tool Development and Implementation
Phase I
• Data Analysis
Phase II
• Final Report and Presentation
Phase III
17
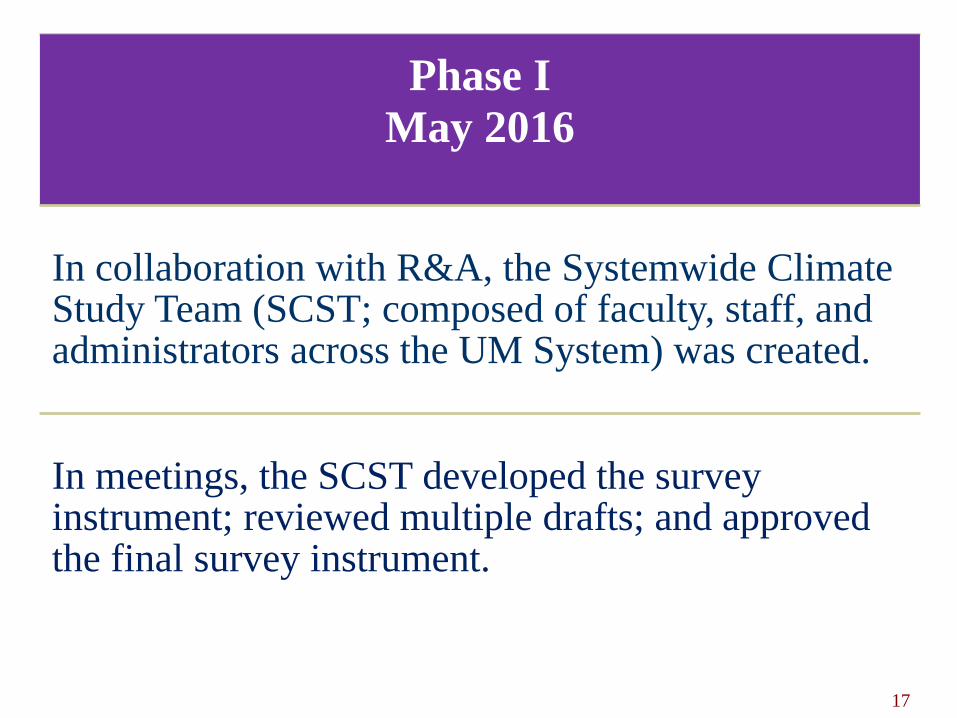
Process to DatePhase I
May 2016
In collaboration with R&A, the Systemwide Climate Study Team (SCST; composed of faculty, staff, and administrators across the UM System) was created.
In meetings, the SCST developed the survey instrument; reviewed multiple drafts; and approved the final survey instrument.
18
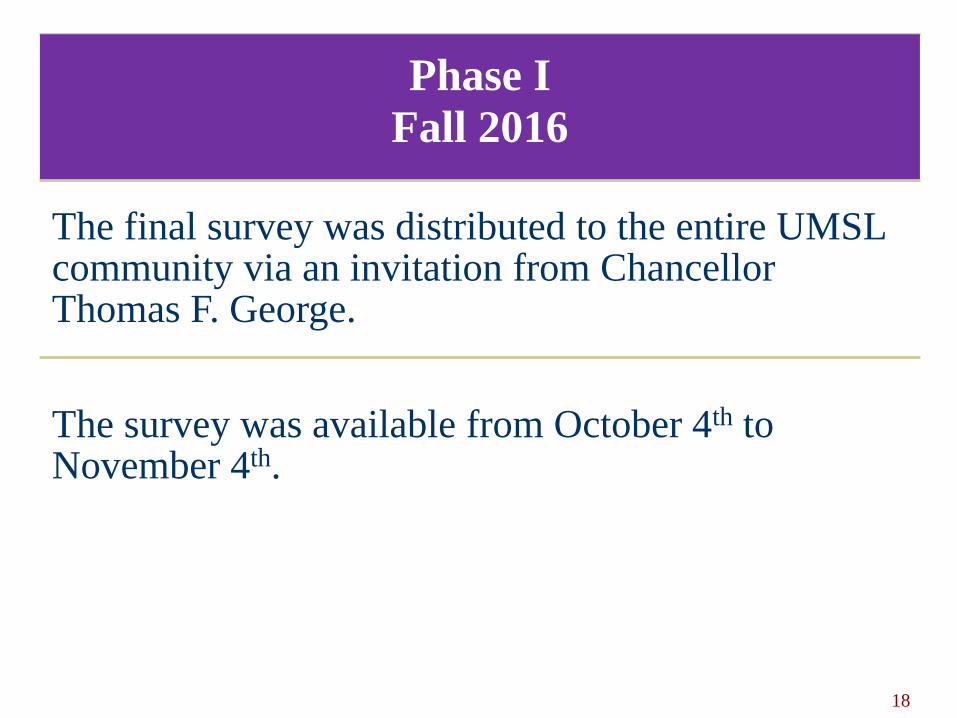
Process to DatePhase I
Fall 2016
The final survey was distributed to the entire UMSL community via an invitation from Chancellor Thomas F. George.
The survey was available from October 4th to November 4th.
19
Process to DatePhase II
Spring 2017
Quantitative and qualitative analyses conducted

20
Phase III
Summer/Fall 2017
Report draft reviewed by the Local Campus Study Team (LCST) at UMSL
Final report submitted to UMSL
Presentation to UMSL campus community
Instrument/Sample
21
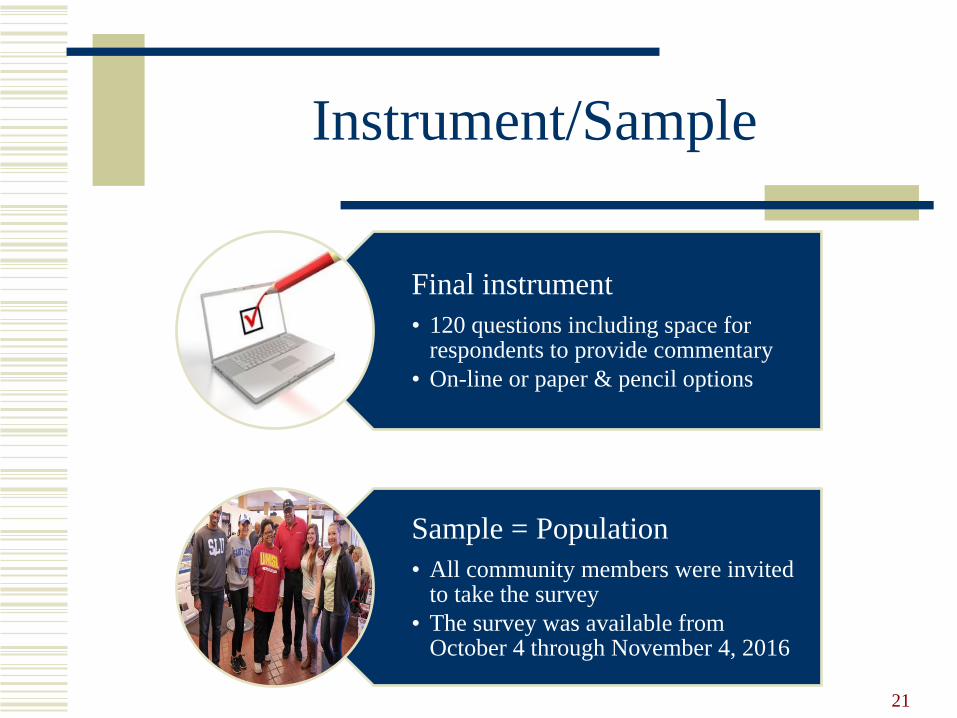
Final instrument
• 120 questions including space for respondents to provide commentary
• On-line or paper & pencil options
Sample = Population
• All community members were invited to take the survey
• The survey was available from October 4 through November 4, 2016
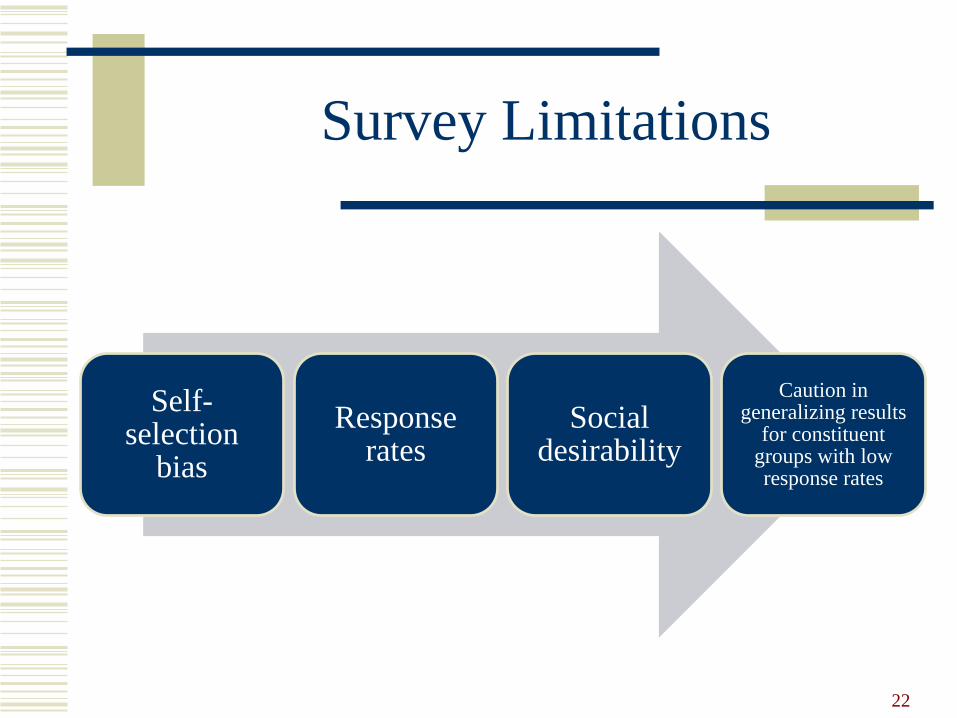
Survey Limitations
Self-selection
bias
Response rates
Social desirability
Caution in generalizing results
for constituent groups with low response rates
22
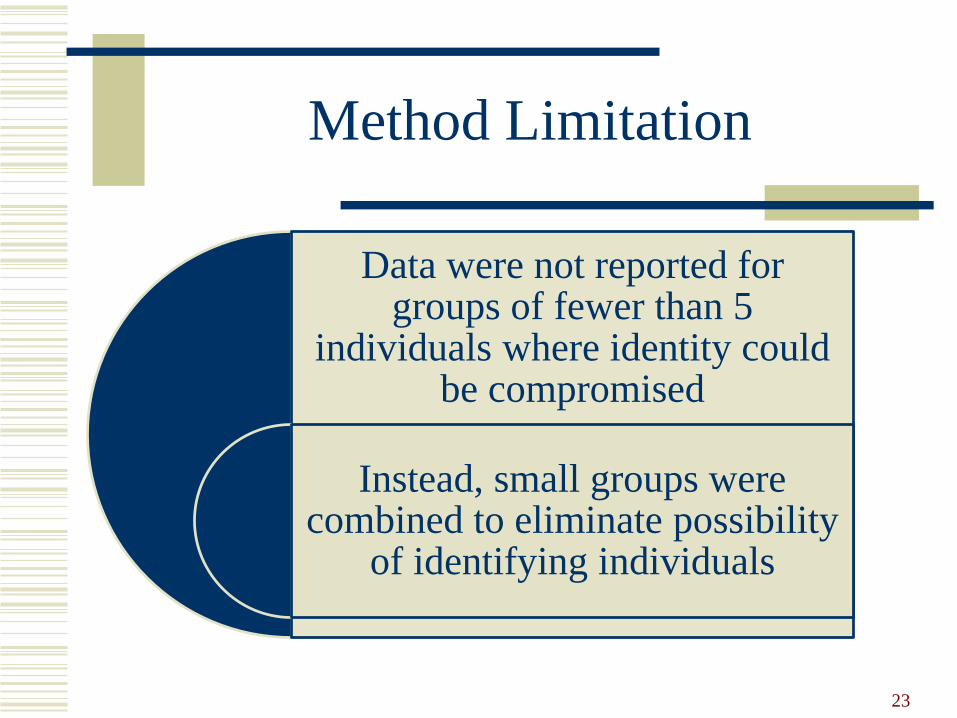
Method Limitation
Data were not reported for groups of fewer than 5
individuals where identity could be compromised
Instead, small groups were combined to eliminate possibility
of identifying individuals
23
Results: Response Rates
24
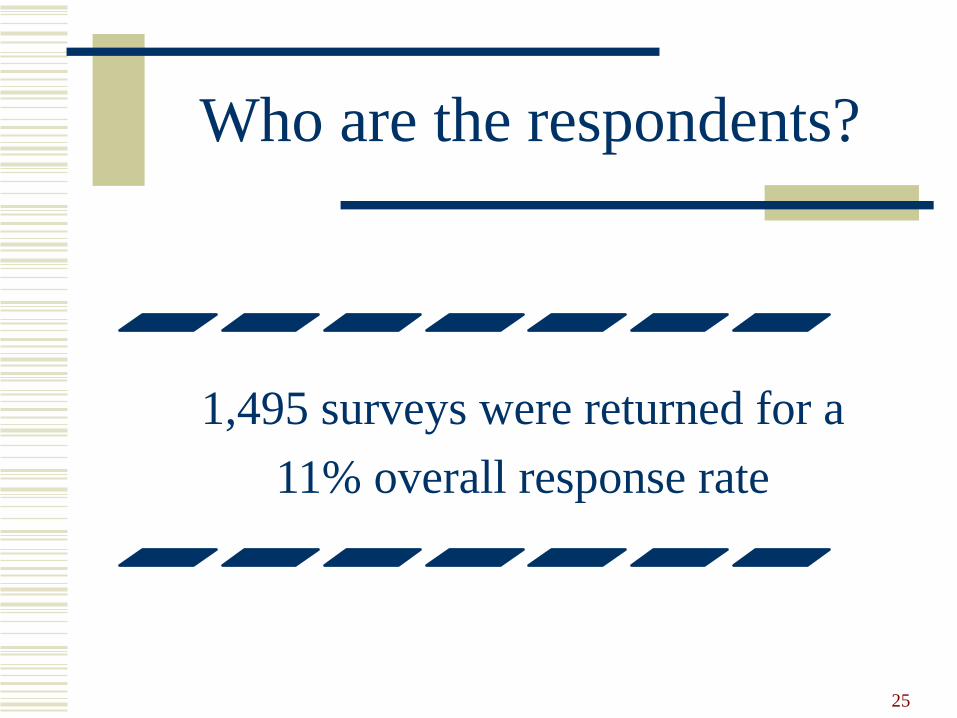
Who are the respondents?
1,495 surveys were returned for a
11% overall response rate
25

Response Rates by Employee Position
26
27%
• Faculty (including Administrator with Faculty Rank) (n = 302)
18%
• Staff (including Administrator without Faculty Rank) (n = 391)
12%• Emeritus Faculty (n = 8)
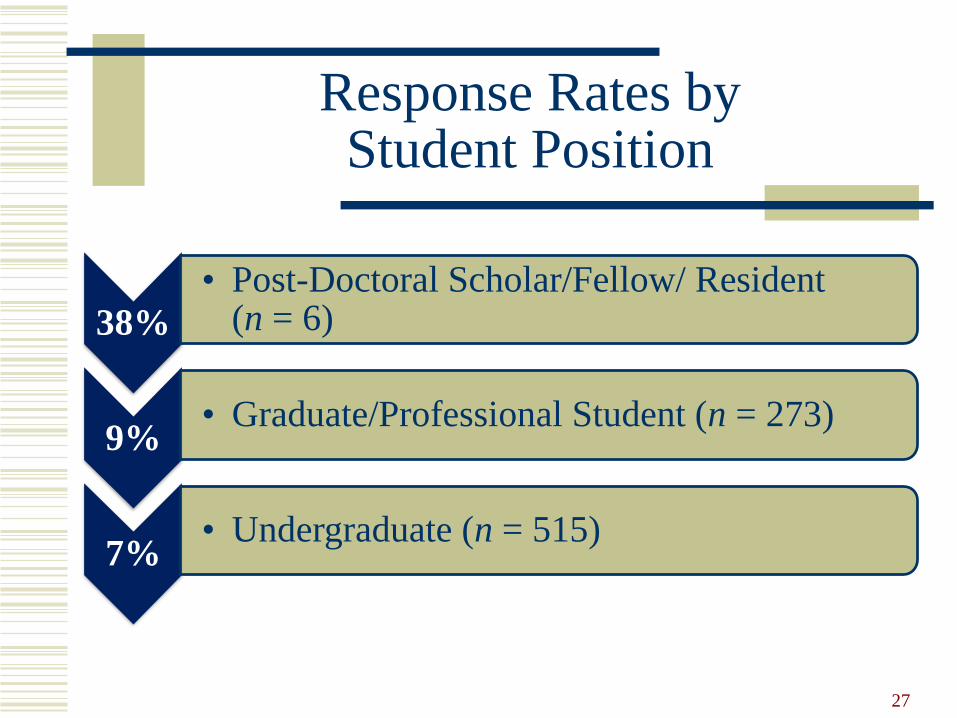
Response Rates by Student Position
27
38%
• Post-Doctoral Scholar/Fellow/ Resident (n = 6)
9%• Graduate/Professional Student (n = 273)
7%• Undergraduate (n = 515)
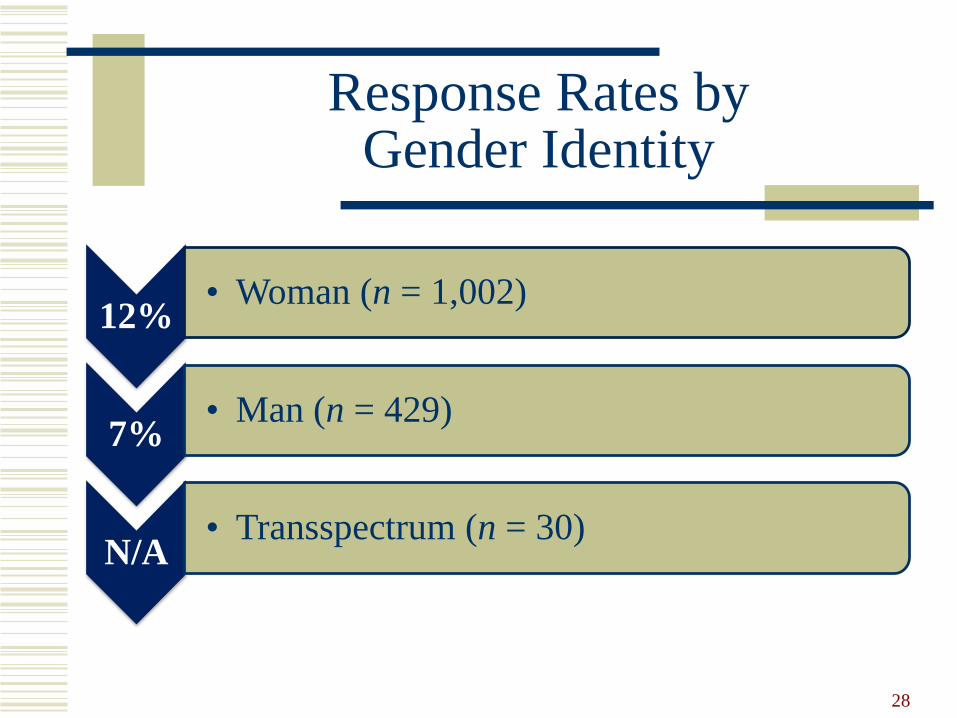
Response Rates by Gender Identity
28
12%• Woman (n = 1,002)
7%• Man (n = 429)
N/A• Transspectrum (n = 30)
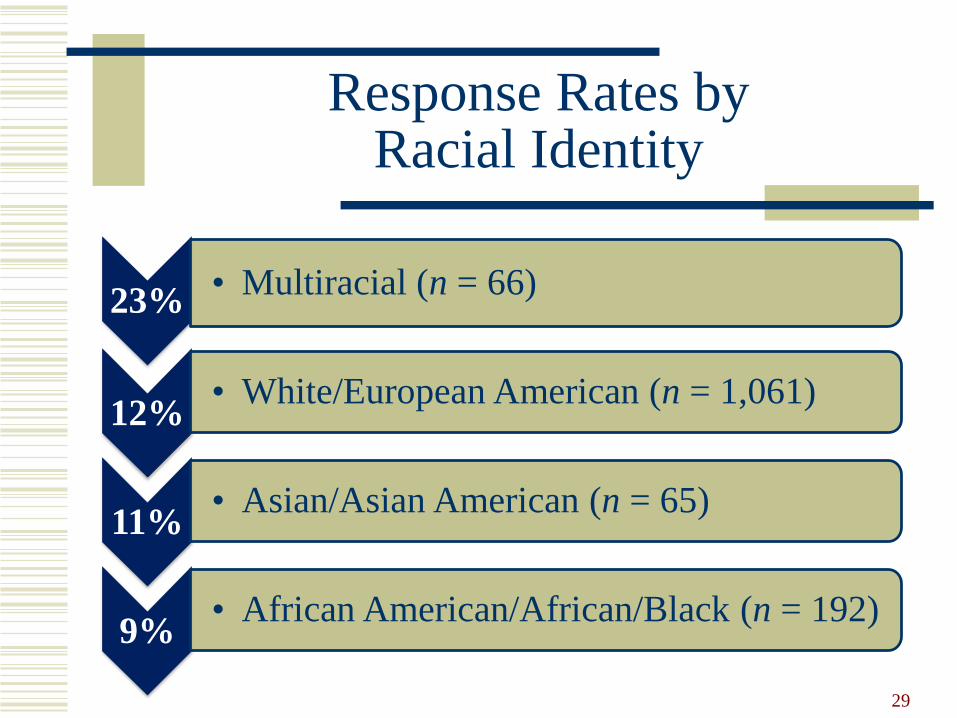
Response Rates by Racial Identity
29
23%• Multiracial (n = 66)
12%• White/European American (n = 1,061)
11%• Asian/Asian American (n = 65)
9%• African American/African/Black (n = 192)
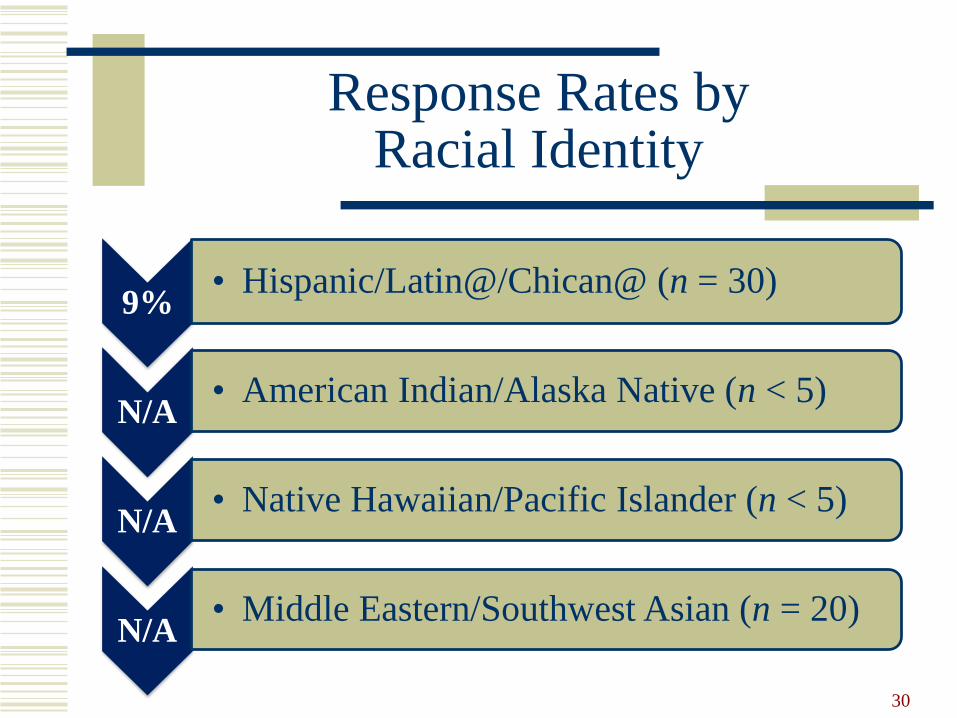
Response Rates by Racial Identity
30
9%• Hispanic/Latin@/Chican@ (n = 30)
N/A• American Indian/Alaska Native (n < 5)
N/A• Native Hawaiian/Pacific Islander (n < 5)
N/A• Middle Eastern/Southwest Asian (n = 20)
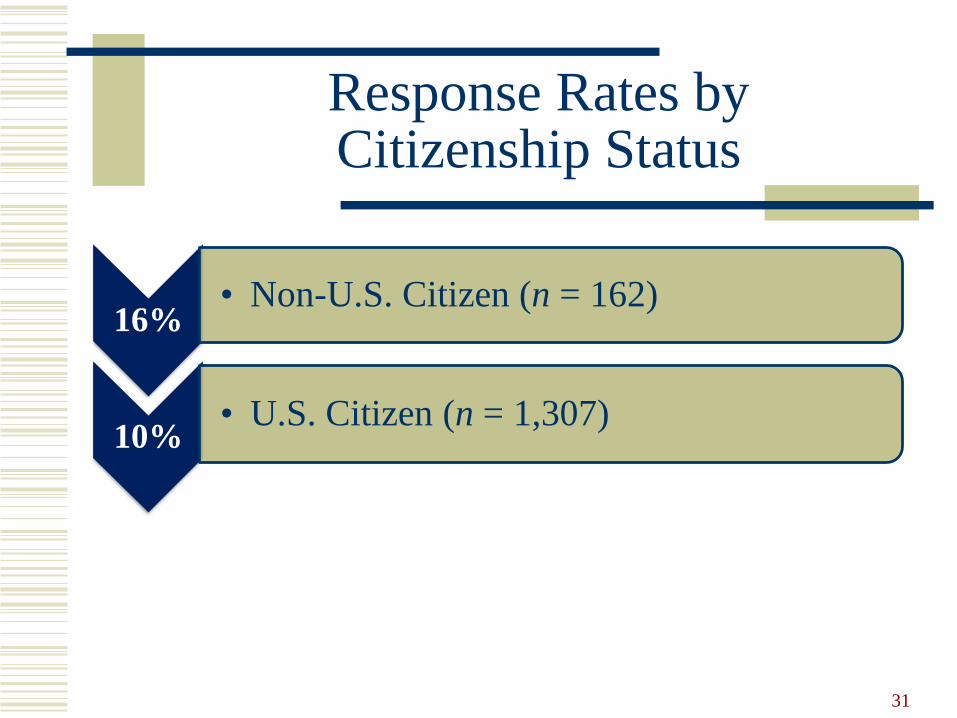
Response Rates by Citizenship Status
31
16%• Non-U.S. Citizen (n = 162)
10%• U.S. Citizen (n = 1,307)
Additional Demographic Characteristics
32
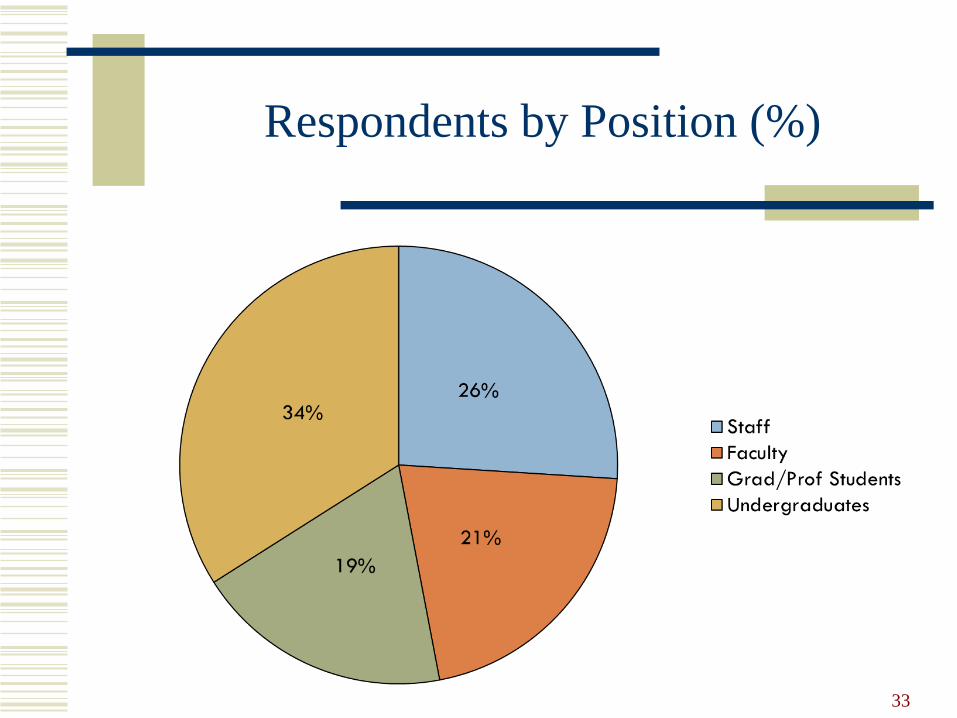
Respondents by Position (%)
33
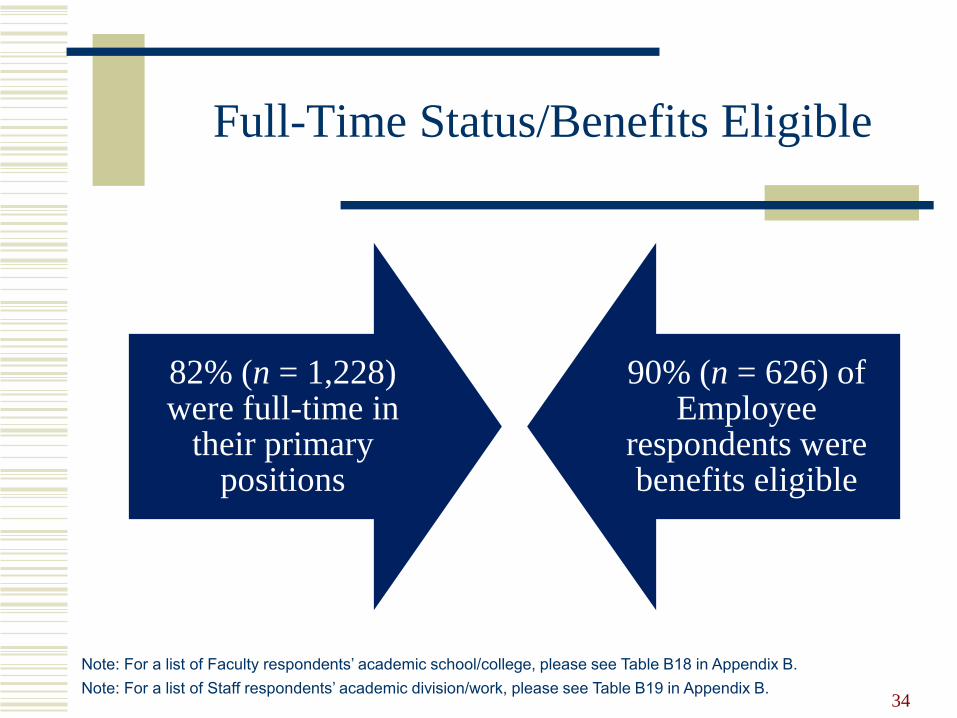
Full-Time Status/Benefits Eligible
34
82% (n = 1,228) were full-time in
their primary positions
90% (n = 626) of Employee
respondents were benefits eligible
Note: For a list of Faculty respondents’ academic school/college, please see Table B18 in Appendix B.
Note: For a list of Staff respondents’ academic division/work, please see Table B19 in Appendix B.
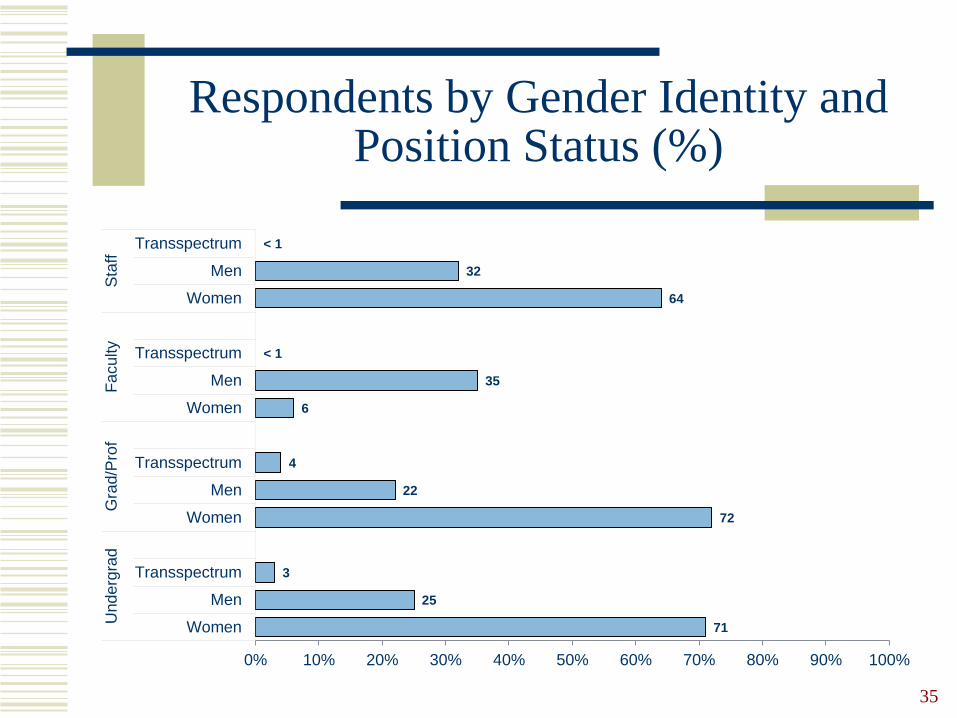
Respondents by Gender Identity and Position Status (%)
35
71
25
3
72
22
4
6
35
< 1
64
32
< 1
0% 10% 20% 30% 40% 50% 60% 70% 80% 90% 100%
Women
Men
Transspectrum
Women
Men
Transspectrum
Women
Men
Transspectrum
Women
Men
Transspectrum
Underg
rad
Gra
d/P
rof
Faculty
Sta
ff

Respondents by Sexual Identity and Position Status (n)
36
80
410
633
229
< 522
259
0
28
338
0
LGBQ Heterosexual Asexual
Undergraduate
Grad/Prof Student
Faculty
Staff
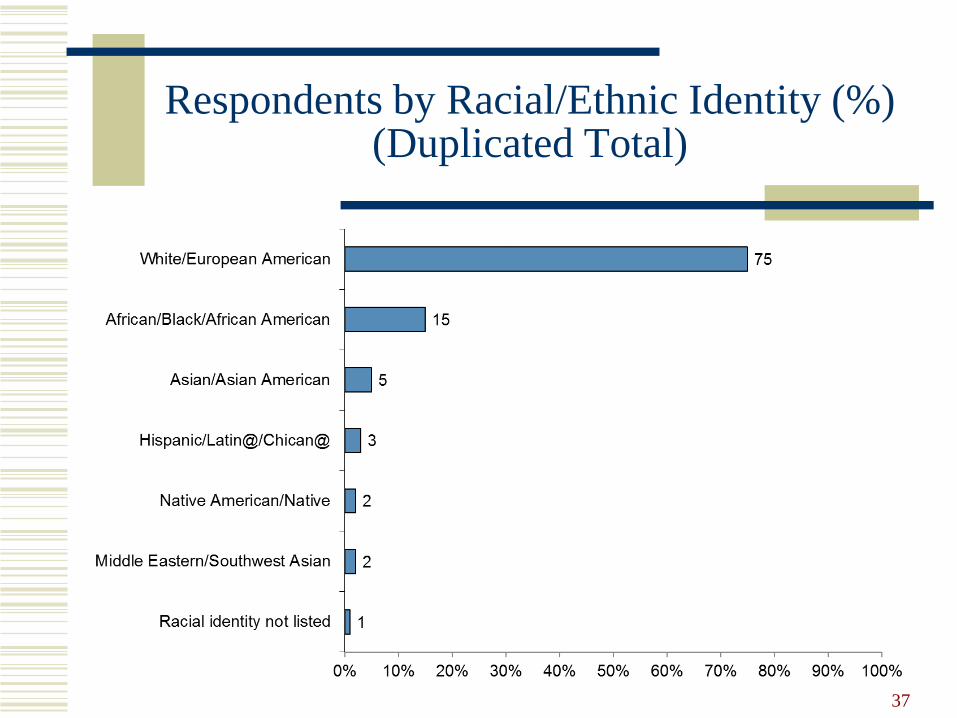
Respondents by Racial/Ethnic Identity (%)(Duplicated Total)
37
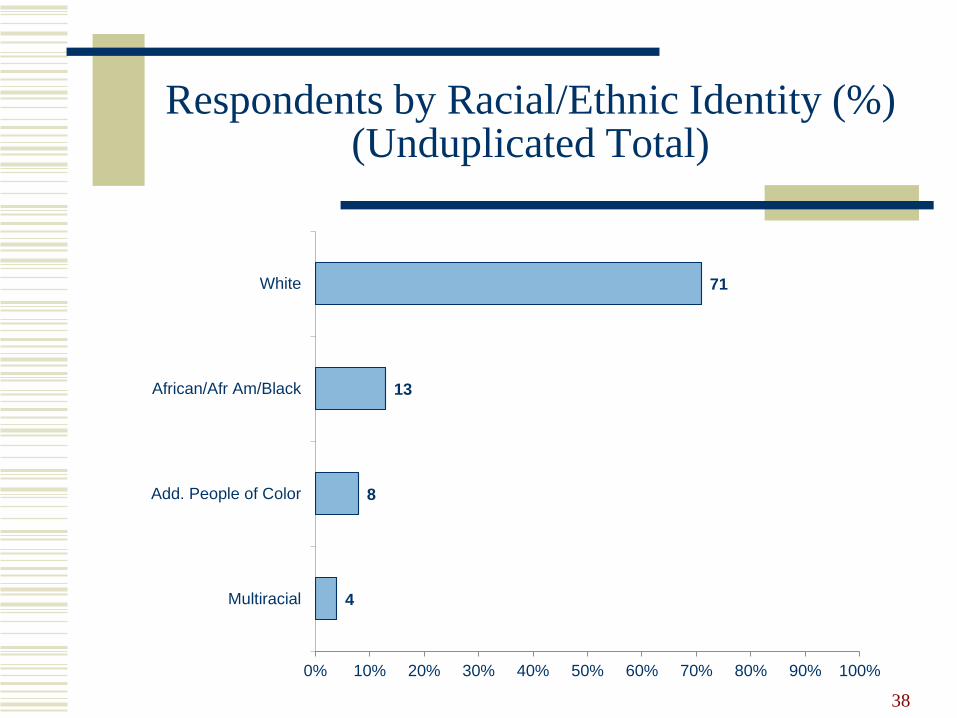
Respondents by Racial/Ethnic Identity (%) (Unduplicated Total)
38
4
8
13
71
0% 10% 20% 30% 40% 50% 60% 70% 80% 90% 100%
Multiracial
Add. People of Color
African/Afr Am/Black
White
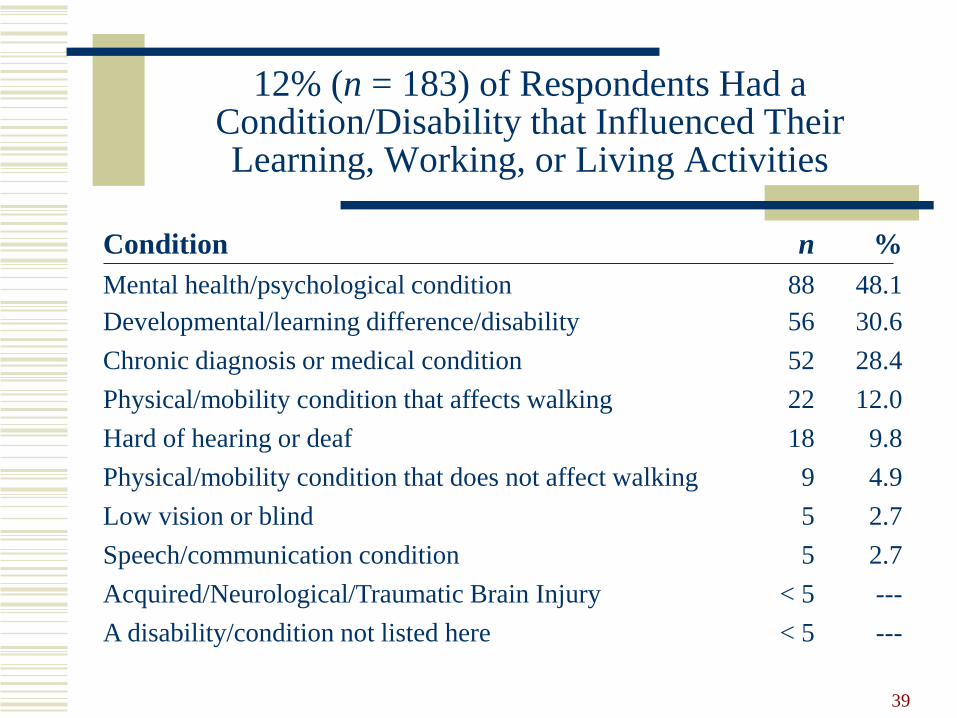
12% (n = 183) of Respondents Had a Condition/Disability that Influenced Their Learning, Working, or Living Activities
39
Condition n %
Mental health/psychological condition 88 48.1
Developmental/learning difference/disability 56 30.6
Chronic diagnosis or medical condition 52 28.4
Physical/mobility condition that affects walking 22 12.0
Hard of hearing or deaf 18 9.8
Physical/mobility condition that does not affect walking 9 4.9
Low vision or blind 5 2.7
Speech/communication condition 5 2.7
Acquired/Neurological/Traumatic Brain Injury < 5 ---
A disability/condition not listed here < 5 ---
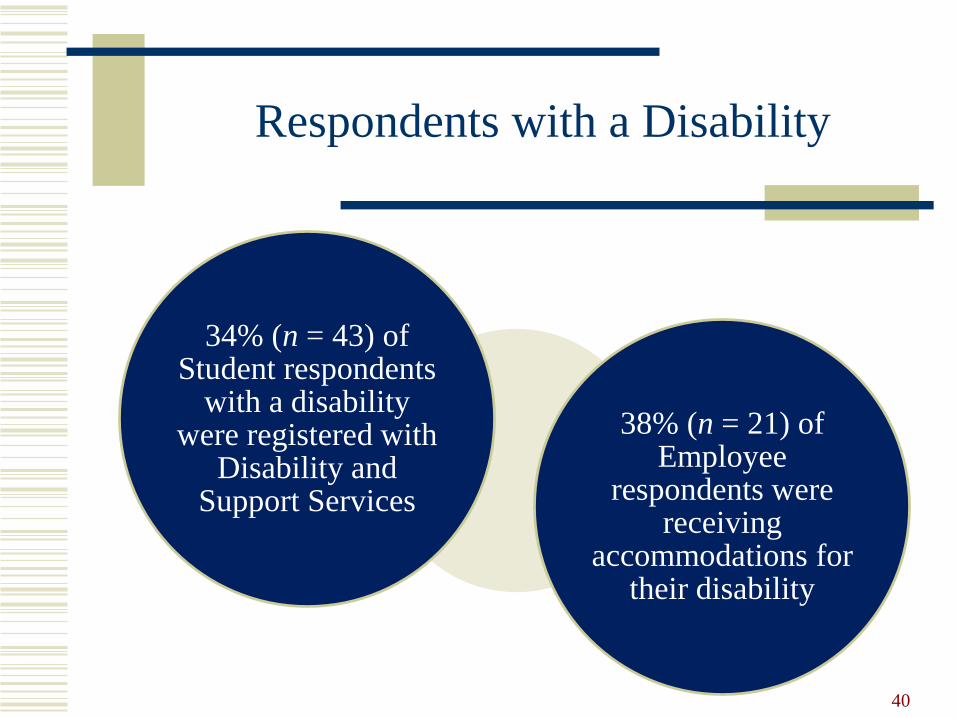
Respondents with a Disability
40
38% (n = 21) of Employee
respondents were receiving
accommodations for their disability
34% (n = 43) of Student respondents
with a disability were registered with
Disability and Support Services
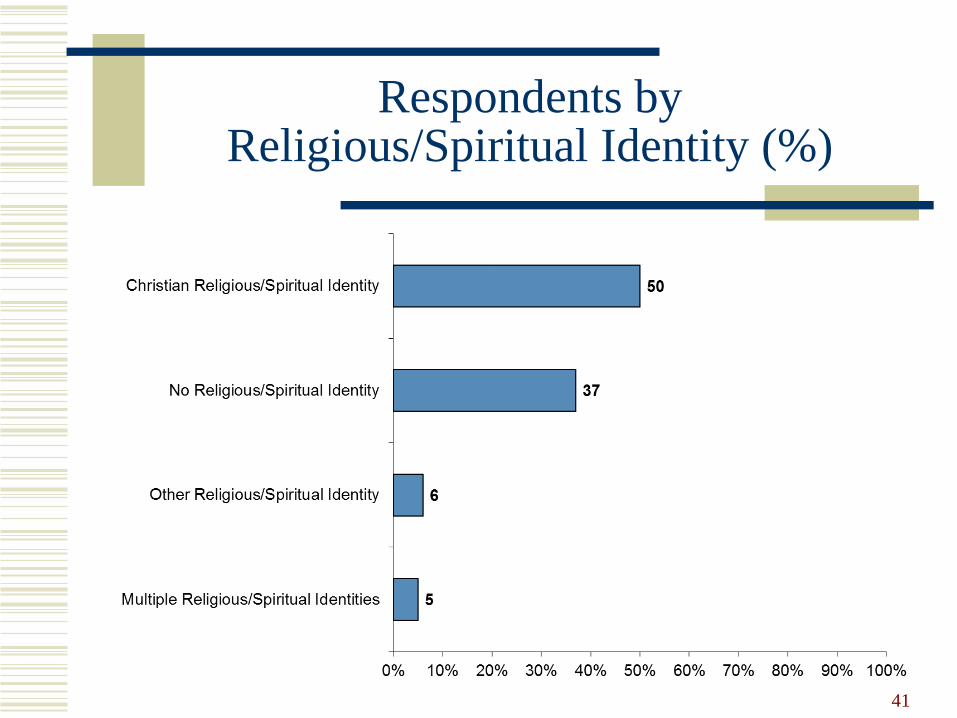
Respondents byReligious/Spiritual Identity (%)
41
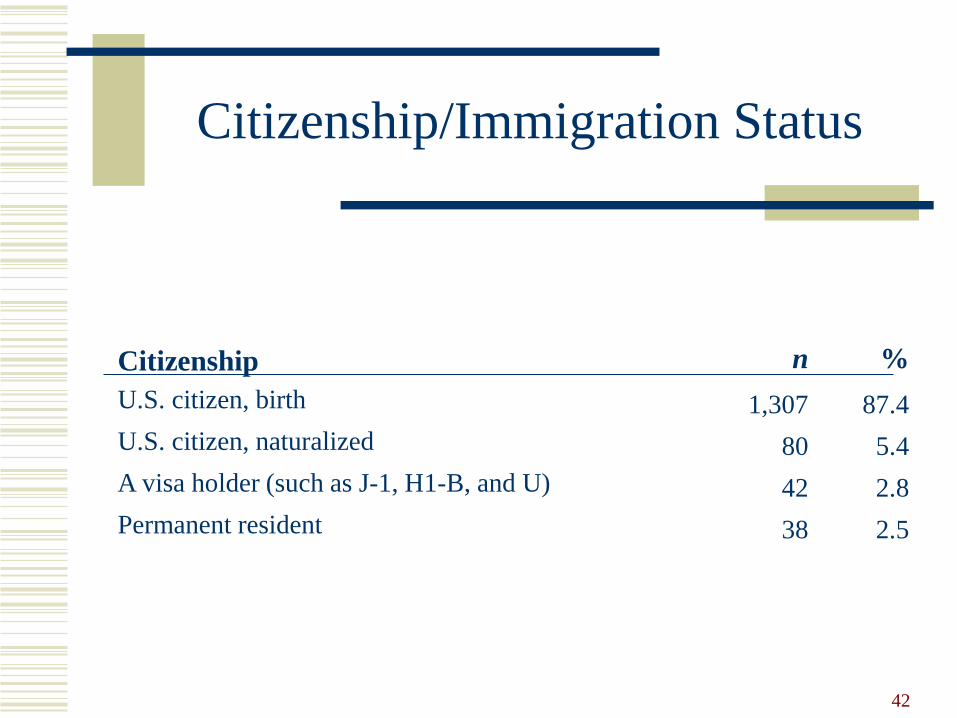
Citizenship/Immigration Status
42
Citizenship n %
U.S. citizen, birth 1,307 87.4
U.S. citizen, naturalized 80 5.4
A visa holder (such as J-1, H1-B, and U) 42 2.8
Permanent resident 38 2.5
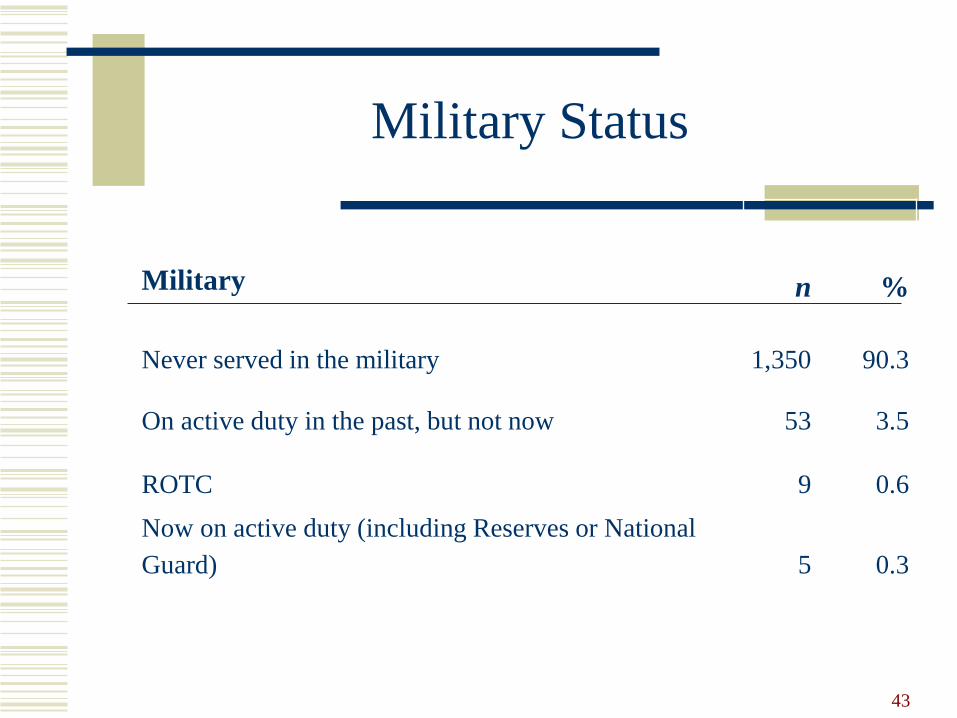
Military Status
43
Military n %
Never served in the military 1,350 90.3
On active duty in the past, but not now 53 3.5
ROTC 9 0.6
Now on active duty (including Reserves or National
Guard) 5 0.3
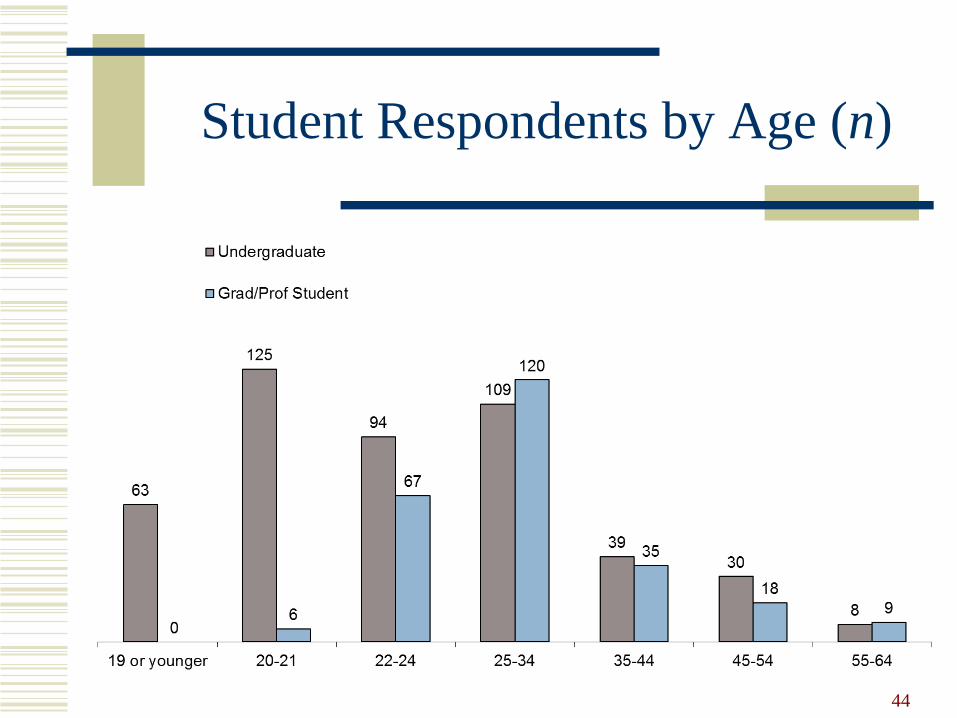
Student Respondents by Age (n)
44
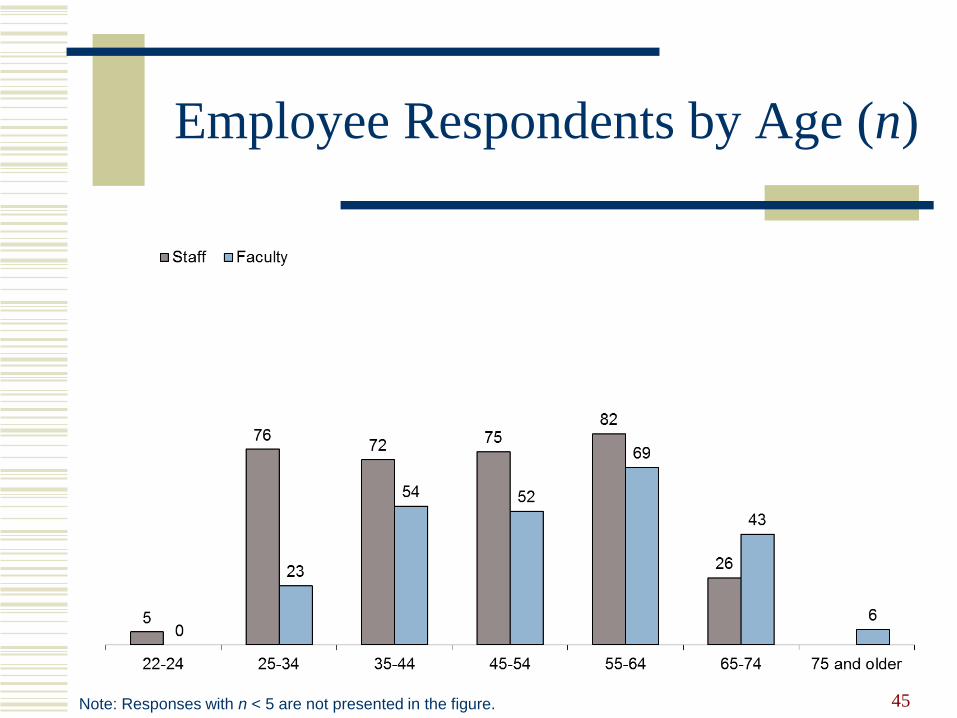
Employee Respondents by Age (n)
45Note: Responses with n < 5 are not presented in the figure.

Student Respondents by Caregiving Responsibilities (%)
46
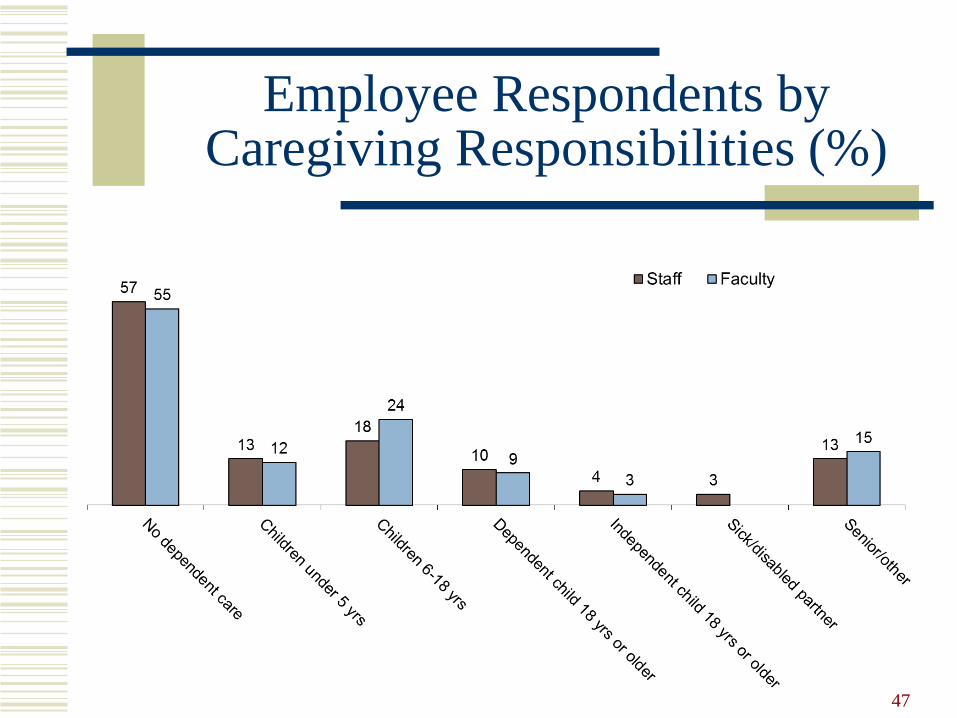
Employee Respondents by Caregiving Responsibilities (%)
47

37% (n = 262) of Employee respondents experienced financial hardship…
48
Financial hardship n %
Affording housing 112 42.7
Affording professional development 112 42.7
Affording health care 88 33.6
Affording benefits 67 25.6
Affording food 56 21.4
Affording childcare 56 21.4
Affording travel to and from UMSL 40 15.3
Affording other campus fees (e.g., parking) 5 1.9
Note: Table includes Student respondents who reported having experienced financial hardship (n = 400) only.
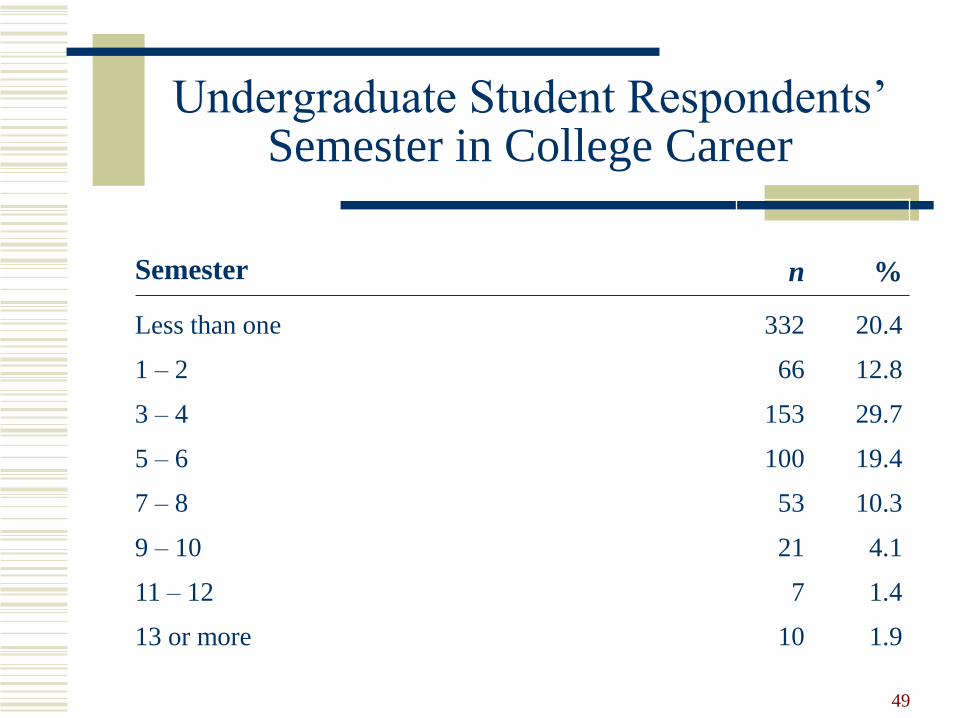
Undergraduate Student Respondents’ Semester in College Career
49
Semester n %
Less than one 332 20.4
1 – 2 66 12.8
3 – 4 153 29.7
5 – 6 100 19.4
7 – 8 53 10.3
9 – 10 21 4.1
11 – 12 7 1.4
13 or more 10 1.9
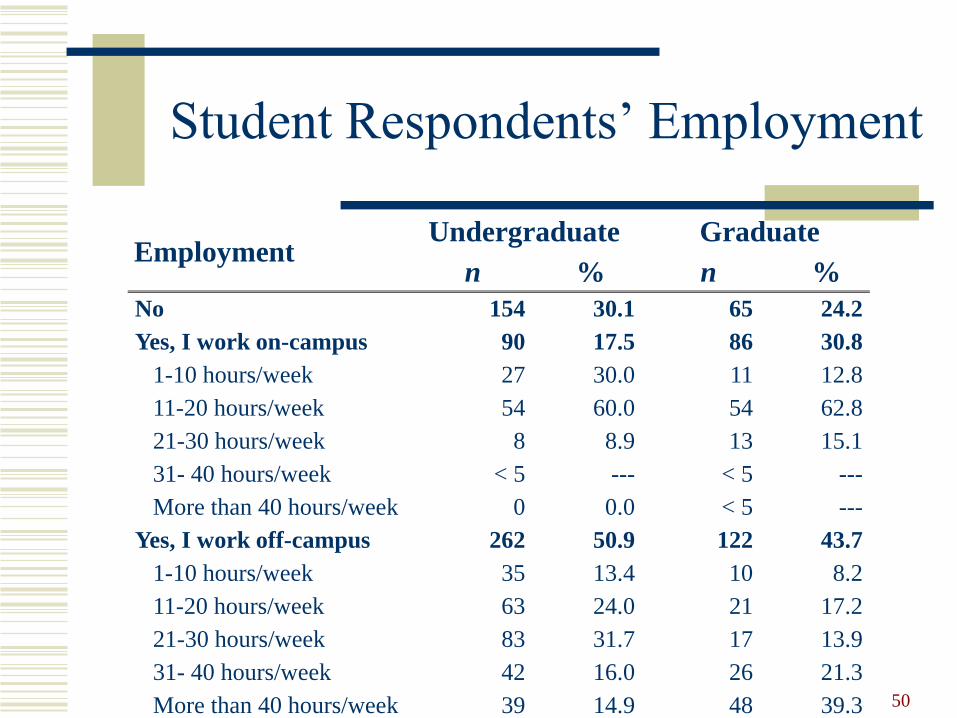
Student Respondents’ Employment
50
EmploymentUndergraduate
n %
Graduate
n %
No 154 30.1 65 24.2
Yes, I work on-campus 90 17.5 86 30.8
1-10 hours/week 27 30.0 11 12.8
11-20 hours/week 54 60.0 54 62.8
21-30 hours/week 8 8.9 13 15.1
31- 40 hours/week < 5 --- < 5 ---
More than 40 hours/week 0 0.0 < 5 ---
Yes, I work off-campus 262 50.9 122 43.7
1-10 hours/week 35 13.4 10 8.2
11-20 hours/week 63 24.0 21 17.2
21-30 hours/week 83 31.7 17 13.9
31- 40 hours/week 42 16.0 26 21.3
More than 40 hours/week 39 14.9 48 39.3
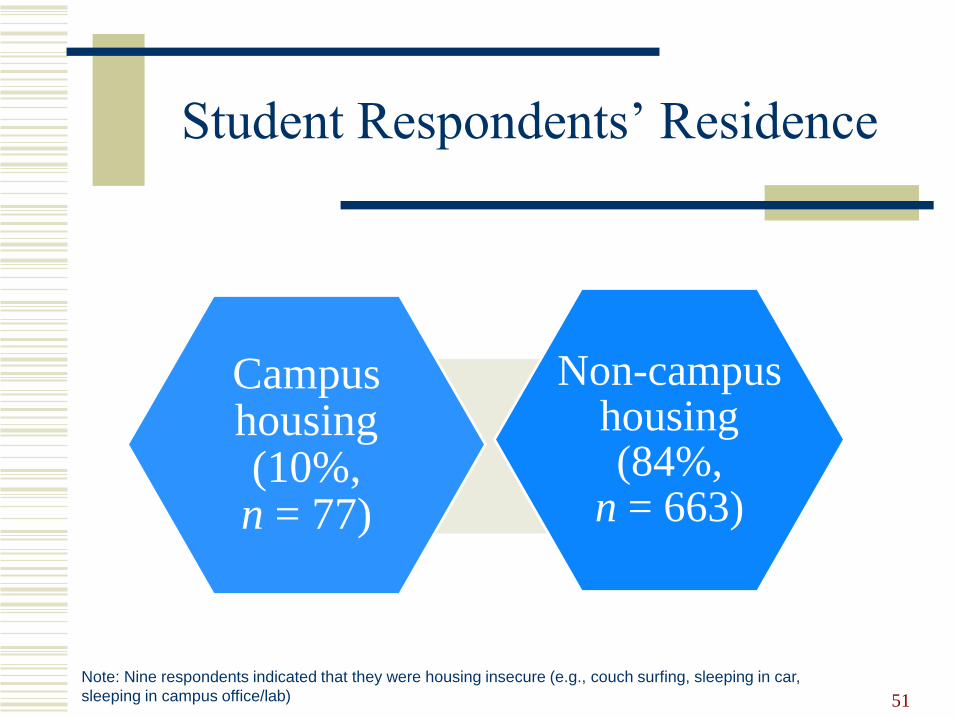
Student Respondents’ Residence
51
Campus housing (10%, n = 77)
Non-campus housing (84%,
n = 663)
Note: Nine respondents indicated that they were housing insecure (e.g., couch surfing, sleeping in car,
sleeping in campus office/lab)
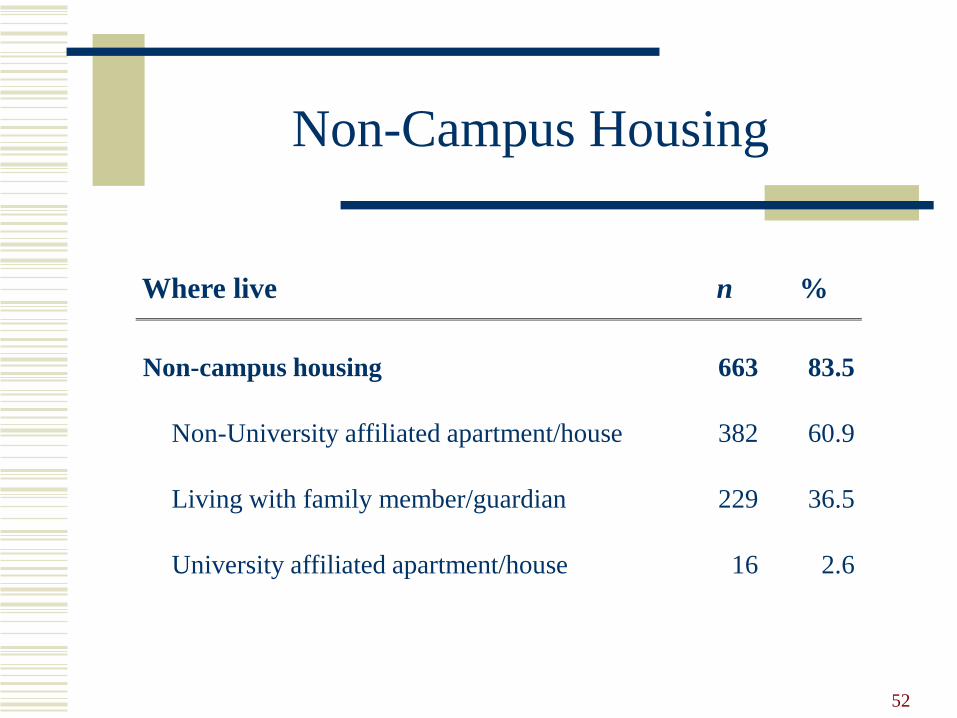
Non-Campus Housing
52
Where live n %
Non-campus housing 663 83.5
Non-University affiliated apartment/house 382 60.9
Living with family member/guardian 229 36.5
University affiliated apartment/house 16 2.6
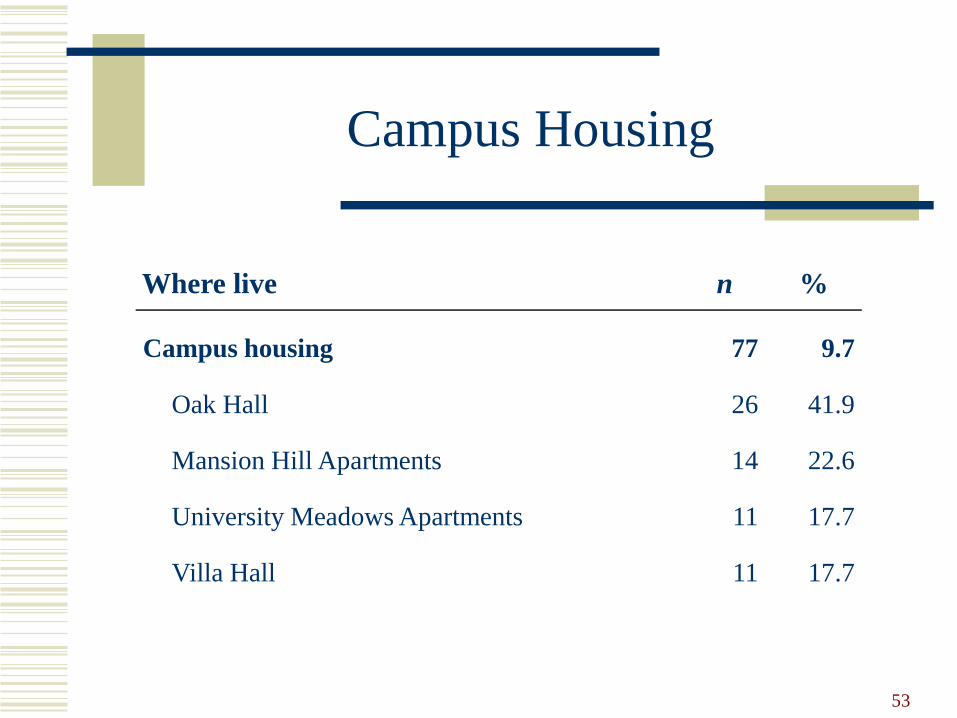
Campus Housing
53
Where live n %
Campus housing 77 9.7
Oak Hall 26 41.9
Mansion Hill Apartments 14 22.6
University Meadows Apartments 11 17.7
Villa Hall 11 17.7
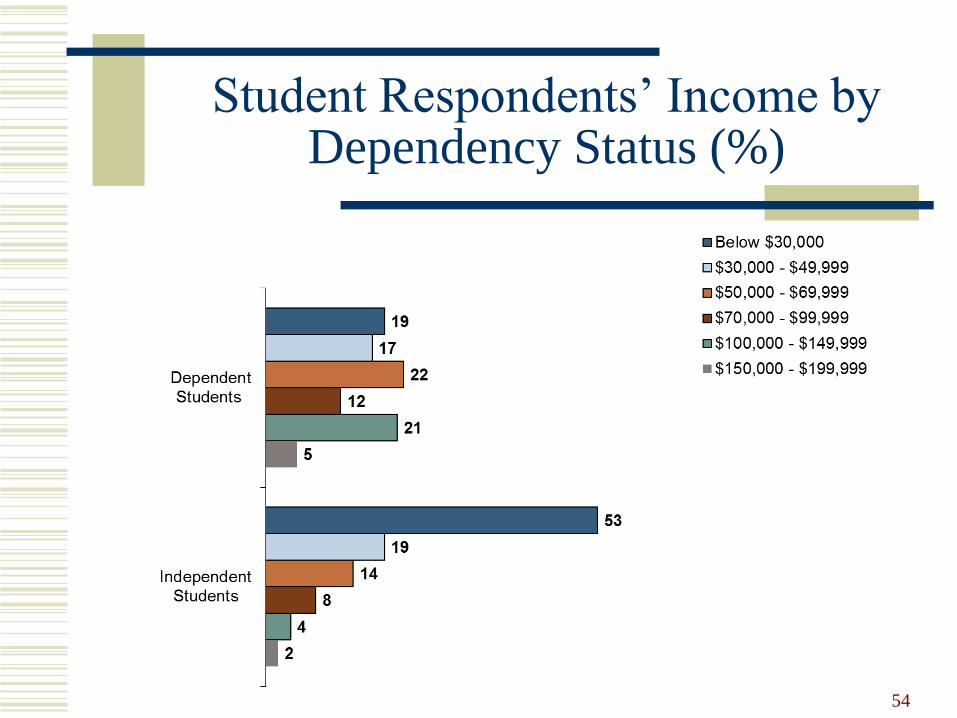
Student Respondents’ Income by Dependency Status (%)
54
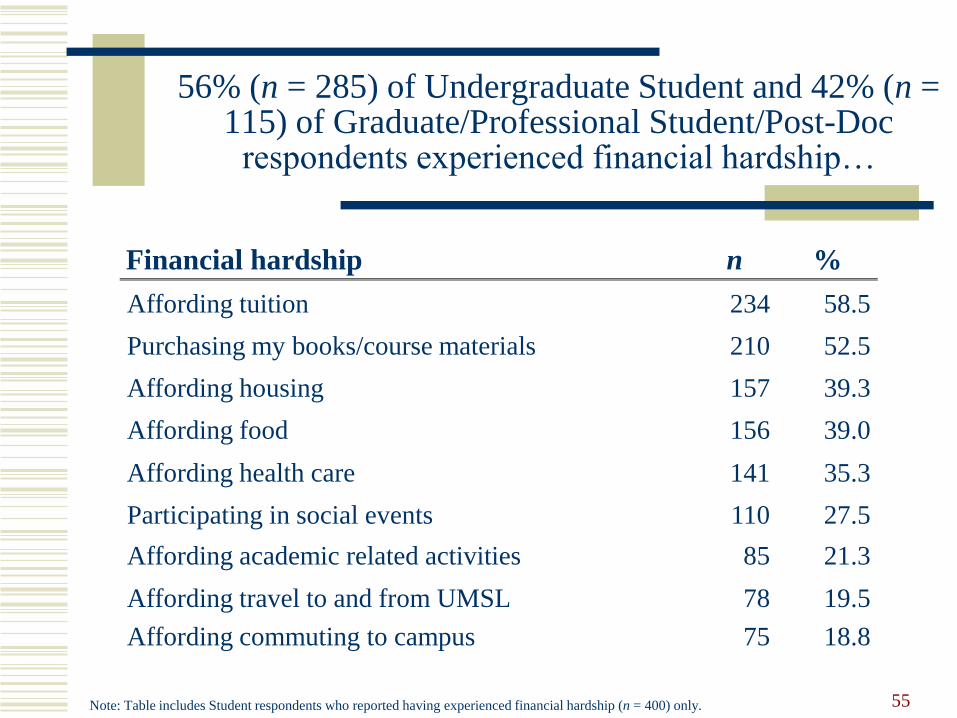
56% (n = 285) of Undergraduate Student and 42% (n = 115) of Graduate/Professional Student/Post-Doc
respondents experienced financial hardship…
55
Financial hardship n %
Affording tuition 234 58.5
Purchasing my books/course materials 210 52.5
Affording housing 157 39.3
Affording food 156 39.0
Affording health care 141 35.3
Participating in social events 110 27.5
Affording academic related activities 85 21.3
Affording travel to and from UMSL 78 19.5
Affording commuting to campus 75 18.8
Note: Table includes Student respondents who reported having experienced financial hardship (n = 400) only.

Financial Hardship Cont’d…
56
Financial hardship n %
Finding employment 69 17.3
Affording unpaid internships/research
opportunities 64 16.0
Affording other campus fees 58 14.5
Affording co-curricular events or activities 52 13.0
Affording alternative spring breaks 48 12.0
Affording childcare 33 8.3
A financial hardship not listed here 29 7.2
Note: Table includes Student respondents who reported having experienced financial hardship (n = 400) only.
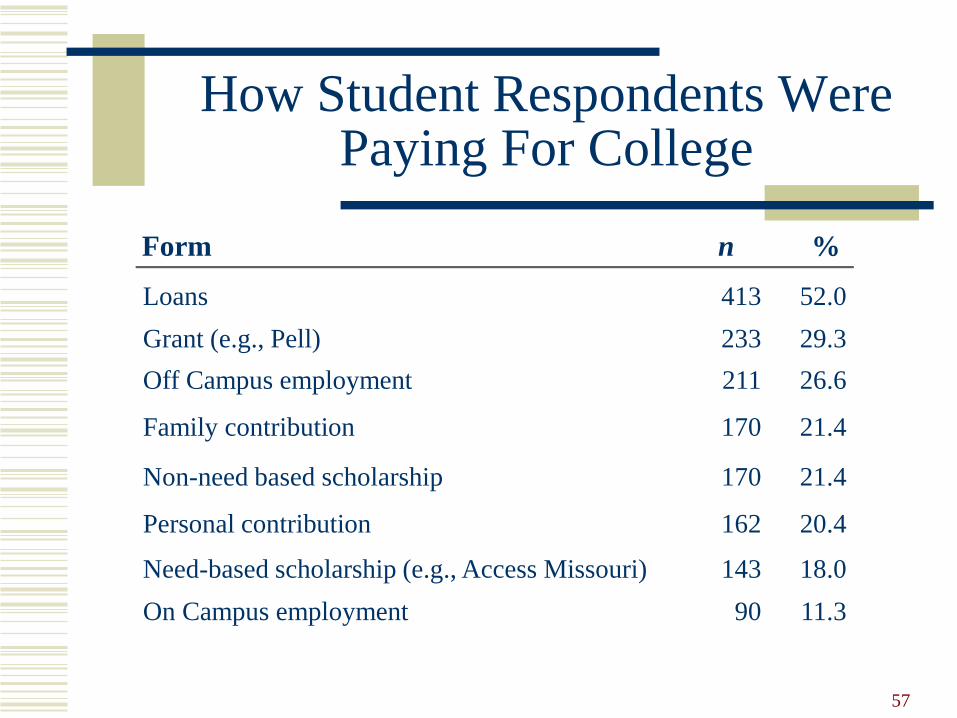
How Student Respondents Were Paying For College
57
Form n %
Loans 413 52.0
Grant (e.g., Pell) 233 29.3
Off Campus employment 211 26.6
Family contribution 170 21.4
Non-need based scholarship 170 21.4
Personal contribution 162 20.4
Need-based scholarship (e.g., Access Missouri) 143 18.0
On Campus employment 90 11.3
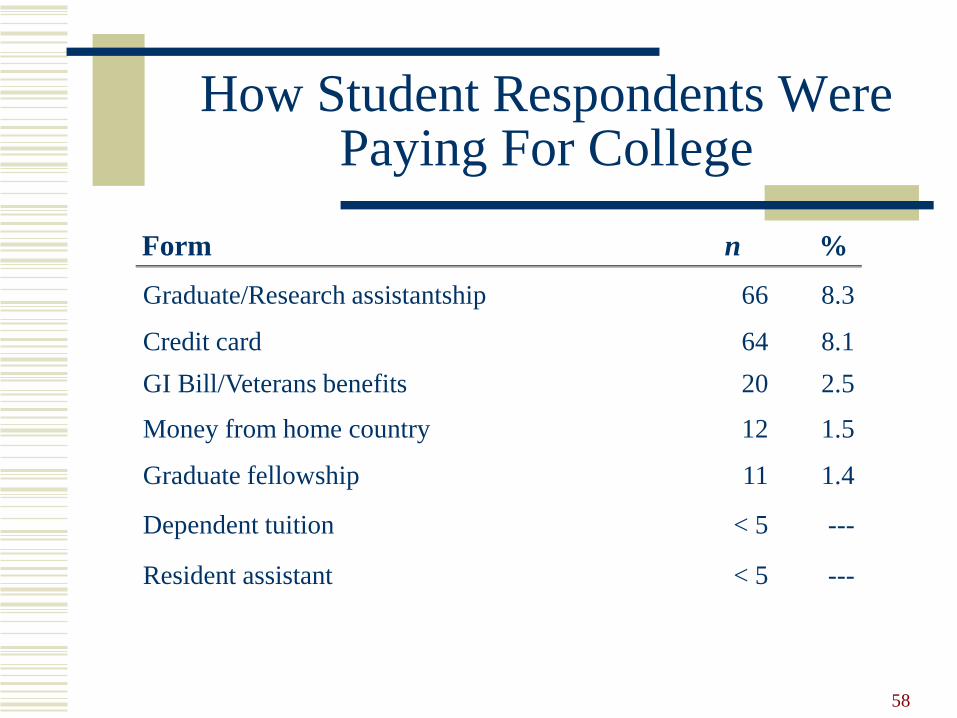
How Student Respondents Were Paying For College
58
Form n %
Graduate/Research assistantship 66 8.3
Credit card 64 8.1
GI Bill/Veterans benefits 20 2.5
Money from home country 12 1.5
Graduate fellowship 11 1.4
Dependent tuition < 5 ---
Resident assistant < 5 ---
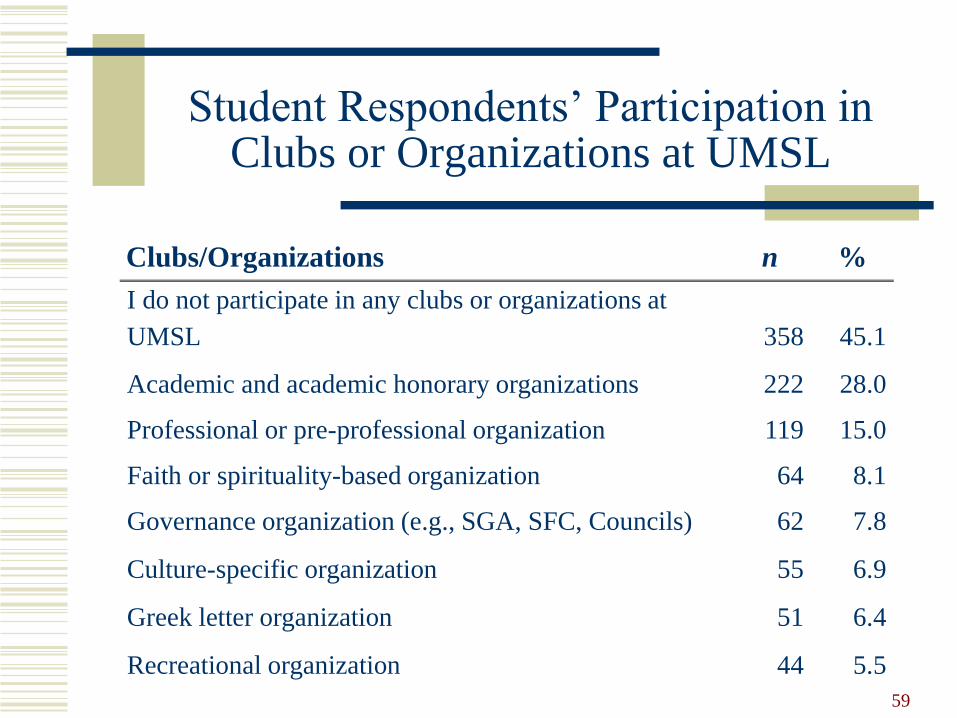
Student Respondents’ Participation in Clubs or Organizations at UMSL
59
Clubs/Organizations n %
I do not participate in any clubs or organizations at
UMSL 358 45.1
Academic and academic honorary organizations 222 28.0
Professional or pre-professional organization 119 15.0
Faith or spirituality-based organization 64 8.1
Governance organization (e.g., SGA, SFC, Councils) 62 7.8
Culture-specific organization 55 6.9
Greek letter organization 51 6.4
Recreational organization 44 5.5

Student Respondents’ Participation in Clubs or Organizations at UMSL
60
Clubs/Organizations n %
Service or philanthropic organization 43 5.4
Political or issue-oriented organization 25 3.1
Health and wellness organization 24 3.0
Intercollegiate athletic team 20 2.5
Publication/media organization 19 2.4
A student organization not listed above 39 4.9
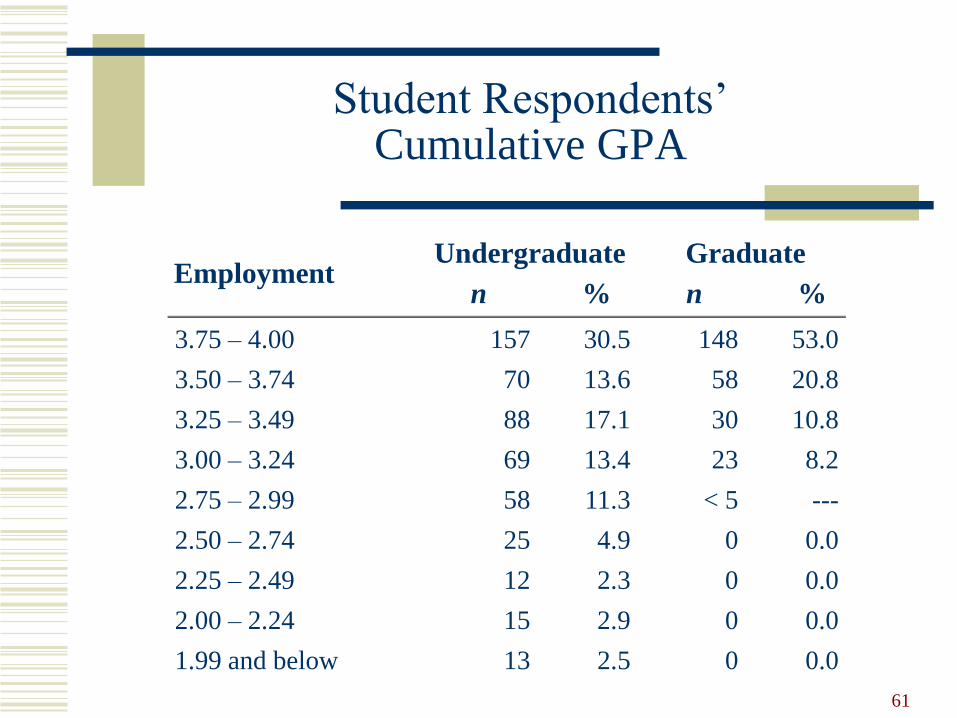
Student Respondents’ Cumulative GPA
61
EmploymentUndergraduate
n %
Graduate
n %
3.75 – 4.00 157 30.5 148 53.0
3.50 – 3.74 70 13.6 58 20.8
3.25 – 3.49 88 17.1 30 10.8
3.00 – 3.24 69 13.4 23 8.2
2.75 – 2.99 58 11.3 < 5 ---
2.50 – 2.74 25 4.9 0 0.0
2.25 – 2.49 12 2.3 0 0.0
2.00 – 2.24 15 2.9 0 0.0
1.99 and below 13 2.5 0 0.0
Findings
62
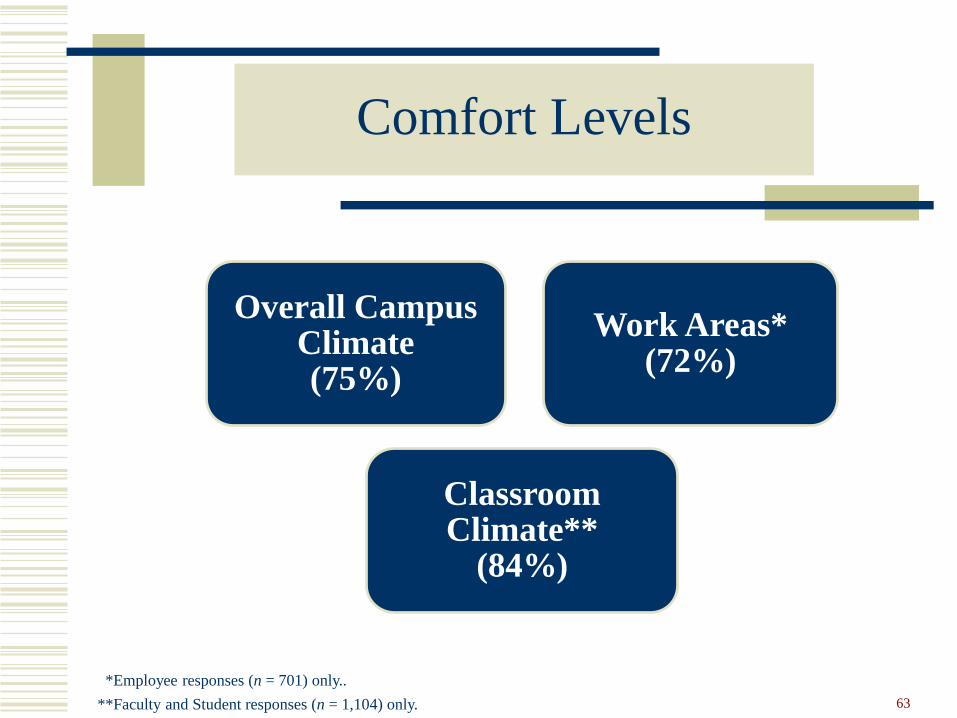
Comfort Levels
Overall Campus Climate (75%)
Work Areas* (72%)
Classroom Climate**
(84%)
63
*Employee responses (n = 701) only..
**Faculty and Student responses (n = 1,104) only.
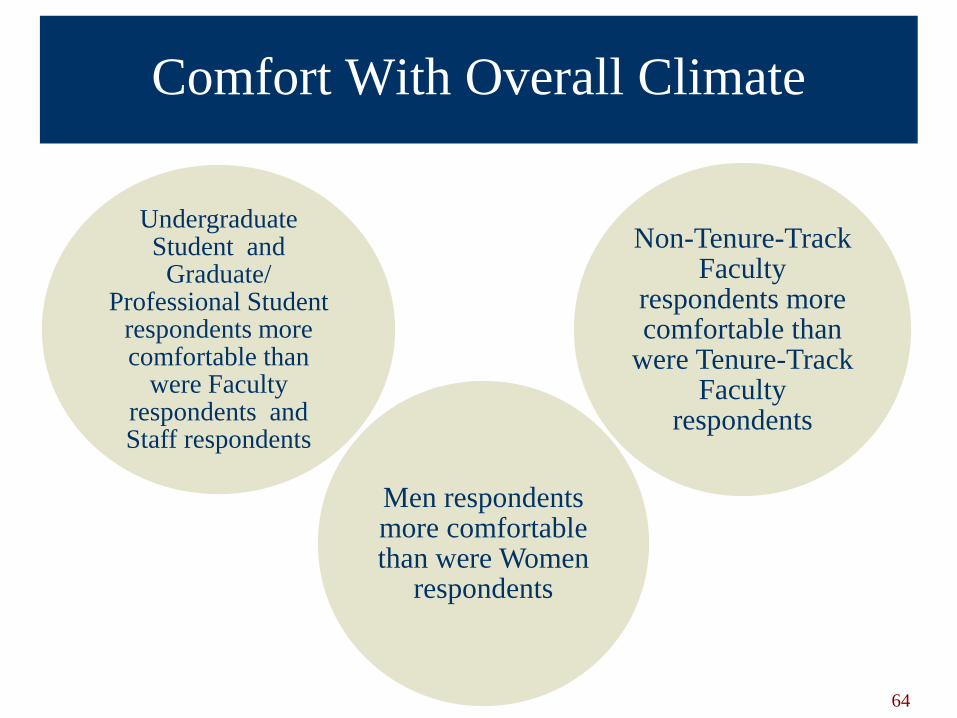
Comfort With Overall Climate
64
Undergraduate Student and
Graduate/ Professional Student
respondents more comfortable than
were Faculty respondents and Staff respondents
Men respondents more comfortable than were Women
respondents
Non-Tenure-Track Faculty
respondents more comfortable than
were Tenure-Track Faculty
respondents
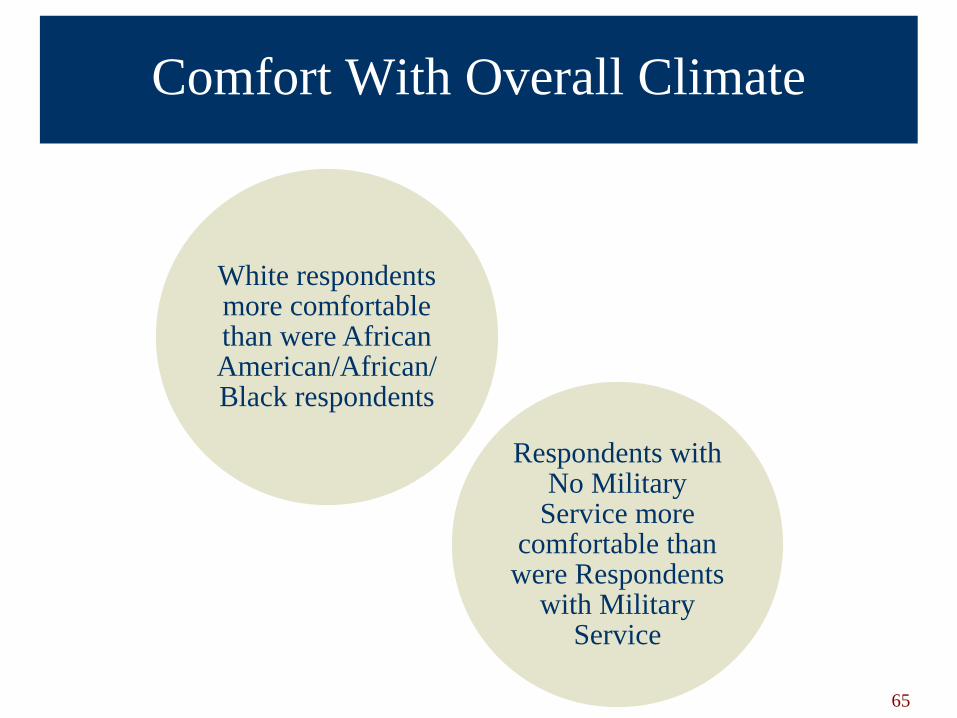
Comfort With Overall Climate
65
White respondents more comfortable than were African American/African/Black respondents
Respondents with No Military
Service more comfortable than
were Respondents with Military
Service

Comfort With Primary Work Areas
66
Non-Tenure-Track Faculty
respondents more comfortable than
were Tenure-Track Faculty
respondents White Faculty and Staff respondents more comfortable than were Faculty
and Staff Respondents of
Color
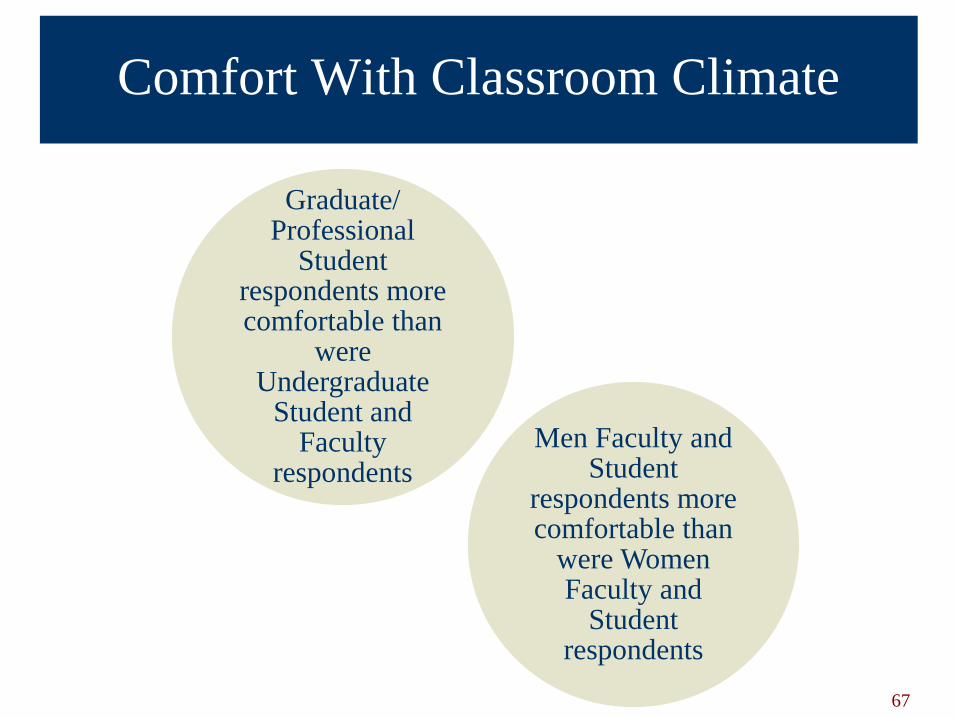
Comfort With Classroom Climate
67
Graduate/ Professional
Student respondents more comfortable than
were Undergraduate
Student and Faculty
respondents
Men Faculty and Student
respondents more comfortable than
were Women Faculty and
Student respondents
Challenges and Opportunities
68

Personal Experiences of Exclusionary, Intimidating, Offensive or Hostile Conduct
69
• 272 respondents indicated that they had personally experienced exclusionary (e.g., shunned, ignored), intimidating, offensive and/or hostile (bullied, harassed) conduct at UMSL within the past year
18%
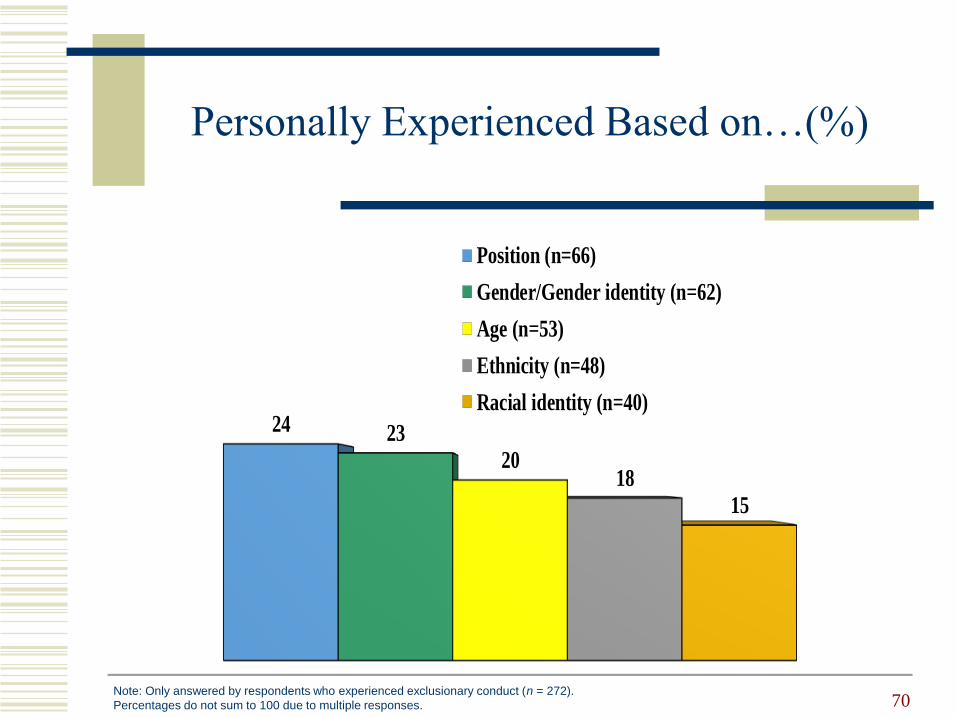
Personally Experienced Based on…(%)
70Note: Only answered by respondents who experienced exclusionary conduct (n = 272).
Percentages do not sum to 100 due to multiple responses.
24 23
2018
15
Position (n=66)
Gender/Gender identity (n=62)
Age (n=53)
Ethnicity (n=48)
Racial identity (n=40)

Top Forms of Experienced Exclusionary Conduct
71
Form n %
I was ignored or excluded 117 43.0
I was intimidated/bullied 96 35.3
I was isolated or left out 95 34.9
I experienced a hostile work environment 94 34.6
I was the target of derogatory verbal remarks 73 26.8
I was the target of workplace incivility 57 21.0
Note: Only answered by respondents who experienced exclusionary conduct (n = 272).
Percentages do not sum to 100 due to multiple responses.
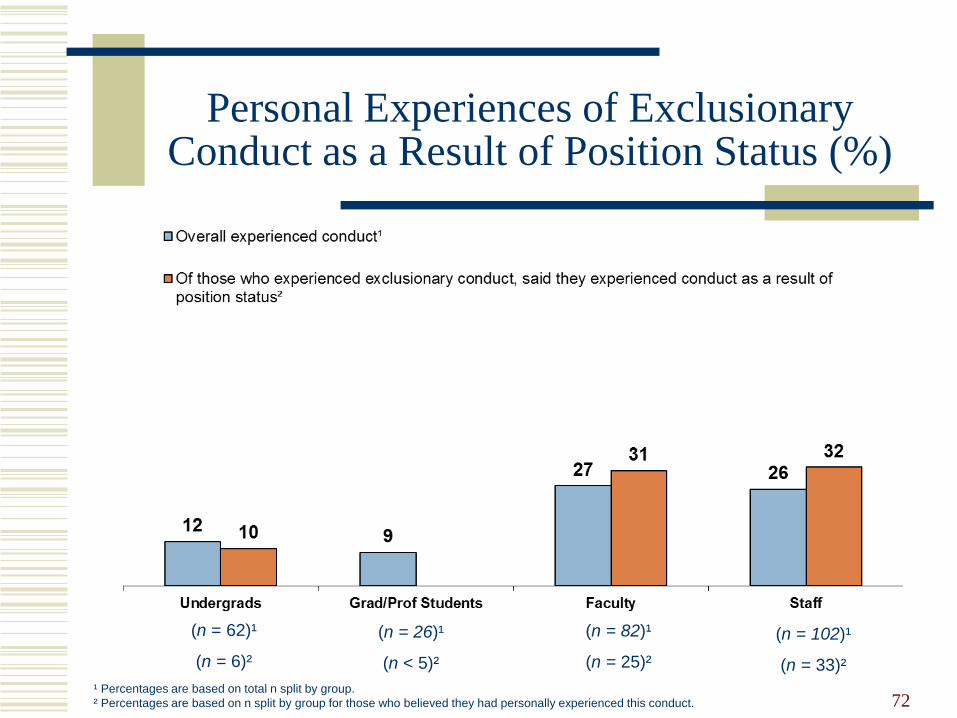
Personal Experiences of Exclusionary Conduct as a Result of Position Status (%)
72¹ Percentages are based on total n split by group.
² Percentages are based on n split by group for those who believed they had personally experienced this conduct.
(n = 62)¹
(n = 6)²
(n = 26)¹
(n < 5)²
(n = 102)¹
(n = 33)²
(n = 82)¹
(n = 25)²
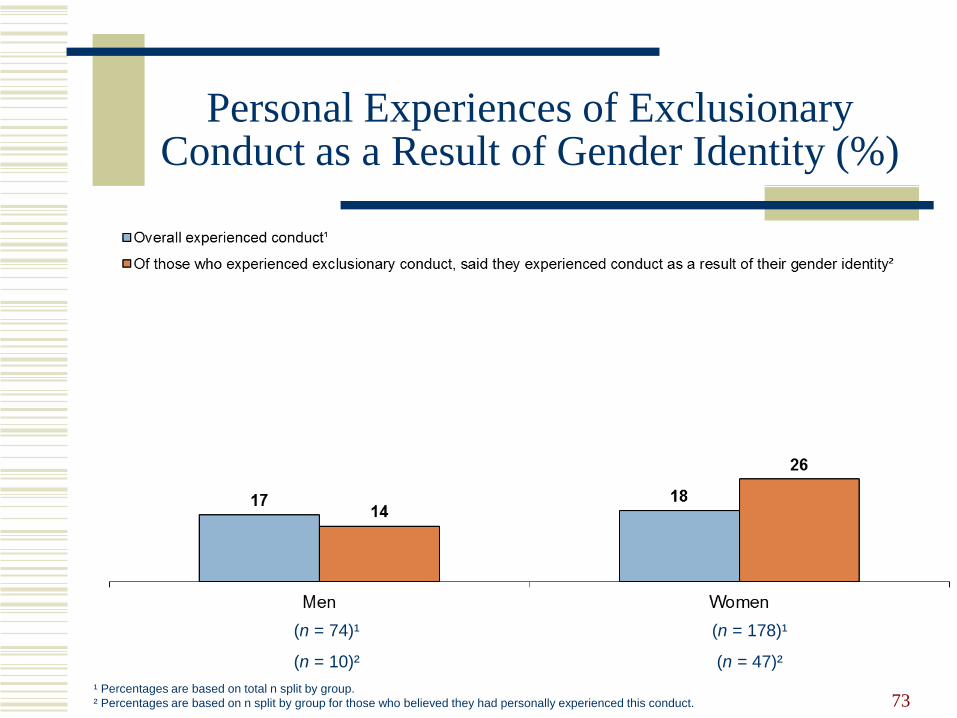
Personal Experiences of Exclusionary Conduct as a Result of Gender Identity (%)
73¹ Percentages are based on total n split by group.
² Percentages are based on n split by group for those who believed they had personally experienced this conduct.
(n = 74)¹
(n = 10)²
(n = 178)¹
(n = 47)²
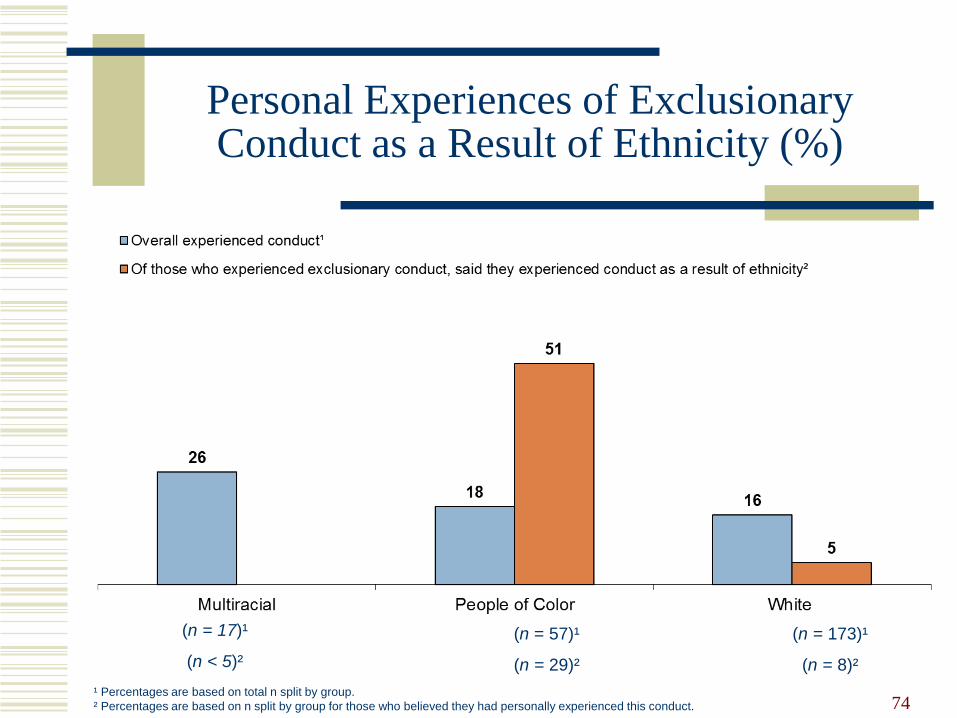
Personal Experiences of Exclusionary Conduct as a Result of Ethnicity (%)
74¹ Percentages are based on total n split by group.
² Percentages are based on n split by group for those who believed they had personally experienced this conduct.
(n = 173)¹
(n = 8)²
(n = 17)¹
(n < 5)²
(n = 57)¹
(n = 29)²
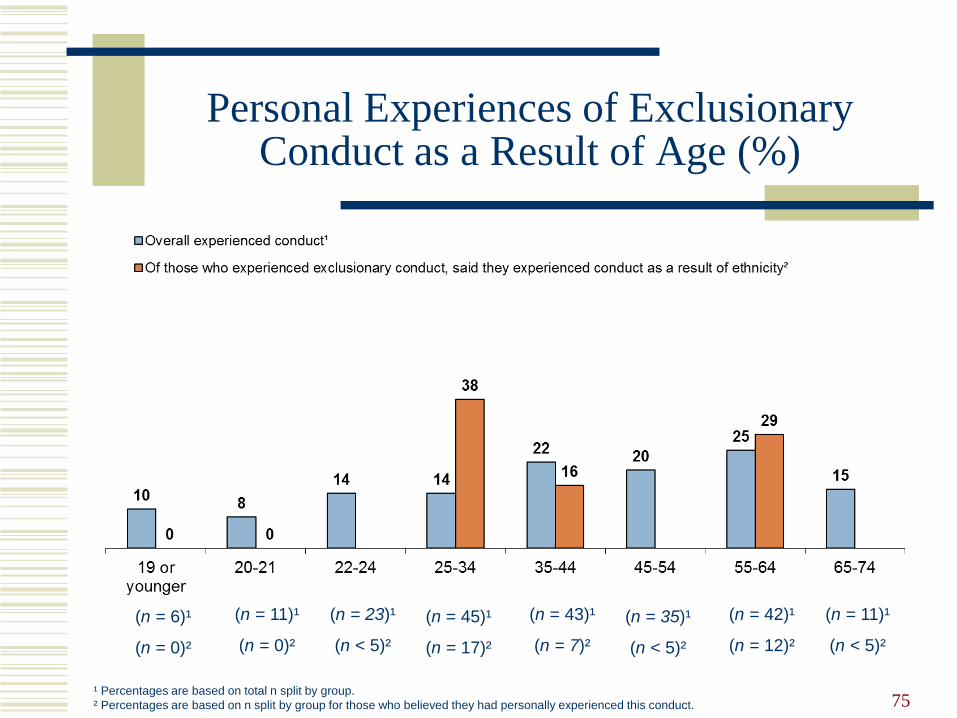
Personal Experiences of Exclusionary Conduct as a Result of Age (%)
75¹ Percentages are based on total n split by group.
² Percentages are based on n split by group for those who believed they had personally experienced this conduct.
(n = 6)¹
(n = 0)²
(n = 11)¹
(n < 5)²
(n = 45)¹
(n = 17)²
(n = 23)¹
(n < 5)²
(n = 43)¹
(n = 7)²
(n = 11)¹
(n = 0)²
(n = 35)¹
(n < 5)²
(n = 42)¹
(n = 12)²
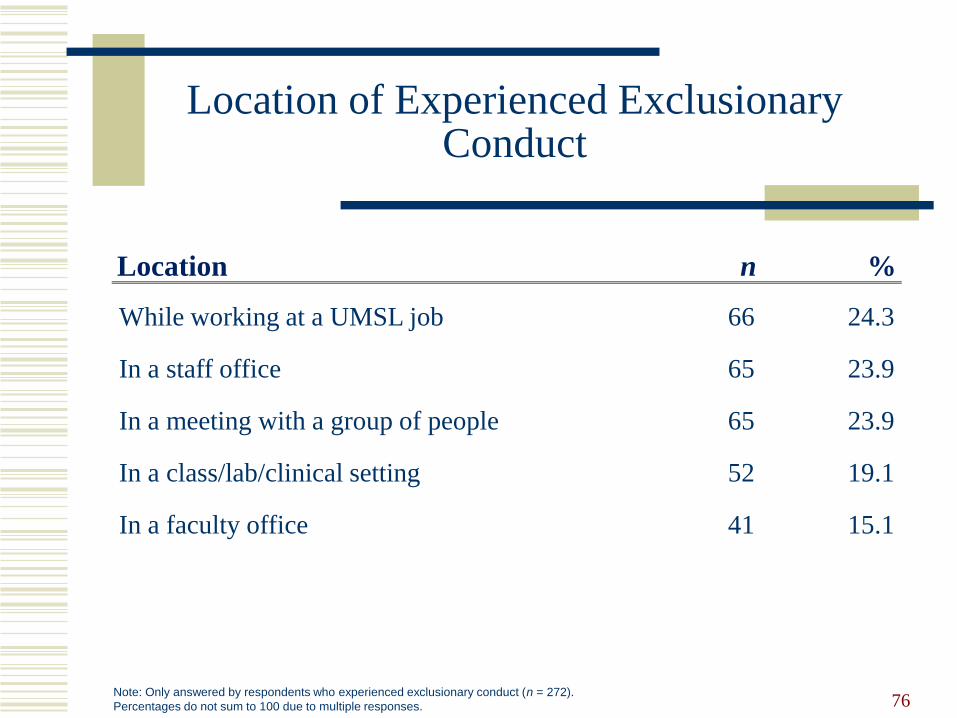
Location of Experienced Exclusionary Conduct
76
Location n %
While working at a UMSL job 66 24.3
In a staff office 65 23.9
In a meeting with a group of people 65 23.9
In a class/lab/clinical setting 52 19.1
In a faculty office 41 15.1
Note: Only answered by respondents who experienced exclusionary conduct (n = 272).
Percentages do not sum to 100 due to multiple responses.
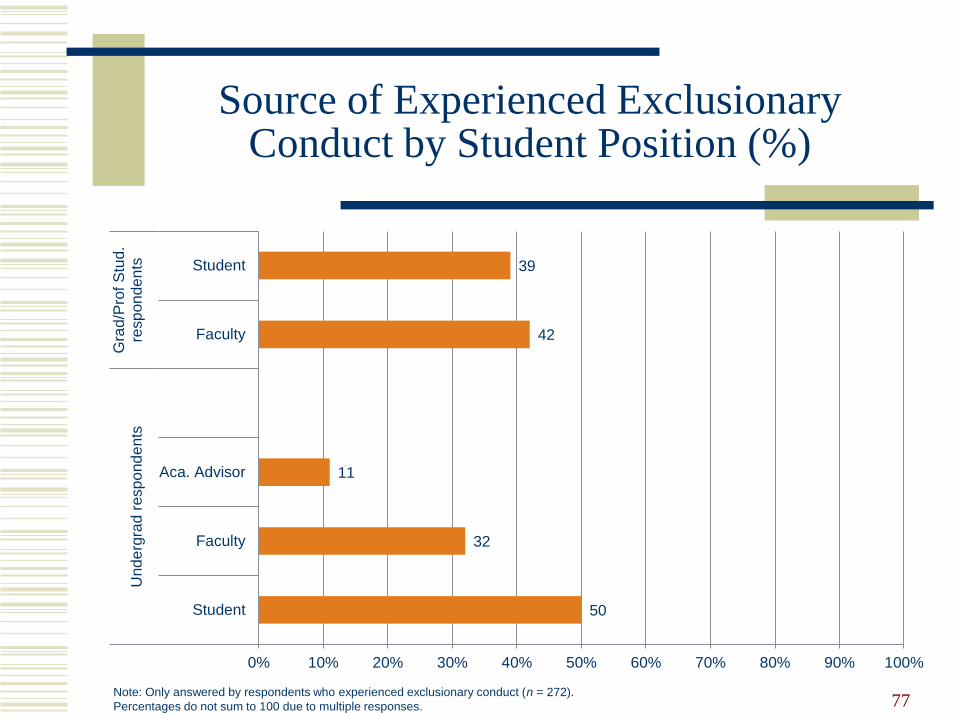
Source of Experienced Exclusionary Conduct by Student Position (%)
77Note: Only answered by respondents who experienced exclusionary conduct (n = 272).
Percentages do not sum to 100 due to multiple responses.
50
32
11
42
39
0% 10% 20% 30% 40% 50% 60% 70% 80% 90% 100%
Student
Faculty
Aca. Advisor
Faculty
Student
Und
erg
rad
resp
ond
ents
Gra
d/P
rof
Stu
d.
resp
on
de
nts
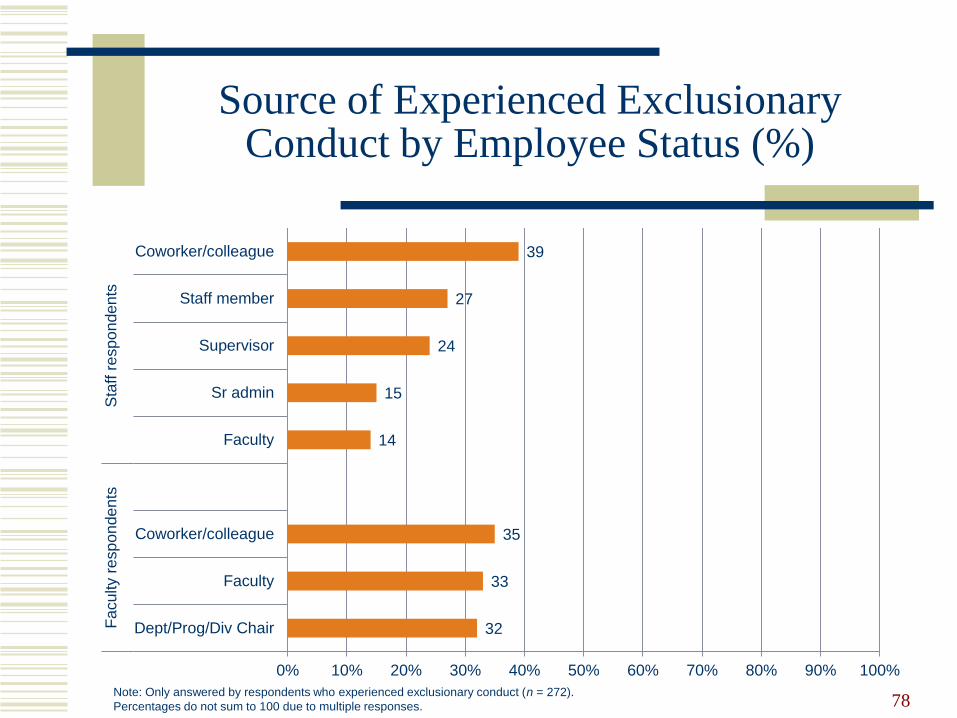
Source of Experienced Exclusionary Conduct by Employee Status (%)
78Note: Only answered by respondents who experienced exclusionary conduct (n = 272).
Percentages do not sum to 100 due to multiple responses.
32
33
35
14
15
24
27
39
0% 10% 20% 30% 40% 50% 60% 70% 80% 90% 100%
Dept/Prog/Div Chair
Faculty
Coworker/colleague
Faculty
Sr admin
Supervisor
Staff member
Coworker/colleague
Fa
cu
lty r
esp
on
de
nts
Sta
ff r
esp
on
de
nts
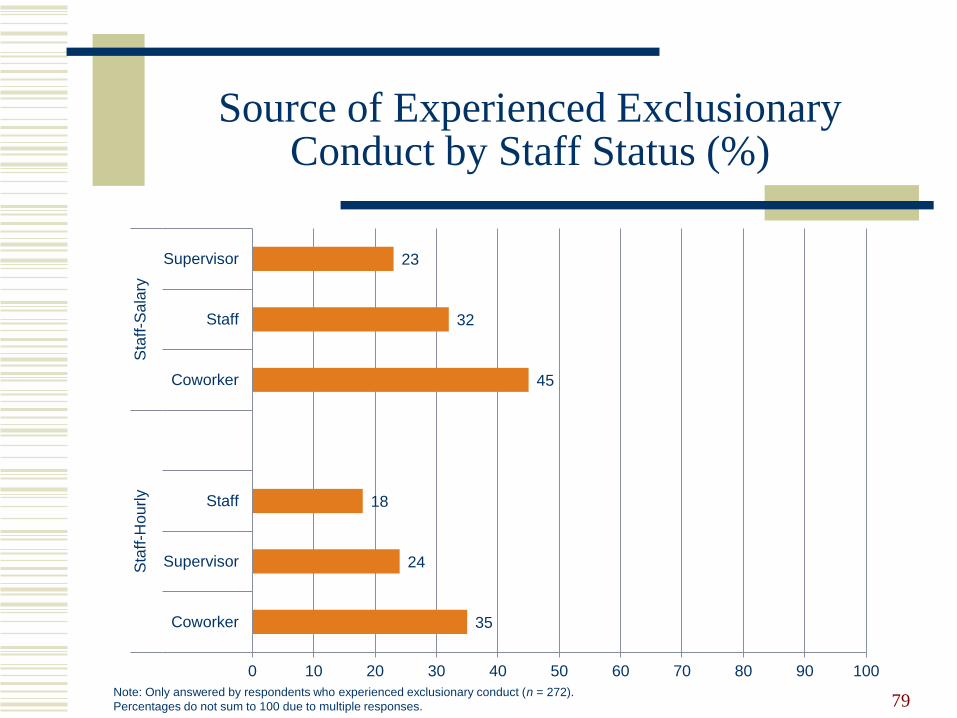
Source of Experienced Exclusionary Conduct by Staff Status (%)
79Note: Only answered by respondents who experienced exclusionary conduct (n = 272).
Percentages do not sum to 100 due to multiple responses.
35
24
18
45
32
23
0 10 20 30 40 50 60 70 80 90 100
Coworker
Supervisor
Staff
Coworker
Staff
Supervisor
Sta
ff-H
ou
rly
Sta
ff-S
ala
ry
What did you do?Emotional Responses
Felt angry (70%)
Felt embarrassed (40%)
Was afraid (22%)
Ignored it (21%)
Felt somehow responsible (13%)
80Note: Only answered by respondents who experienced exclusionary conduct (n = 272).
Percentages do not sum to 100 due to multiple responses.
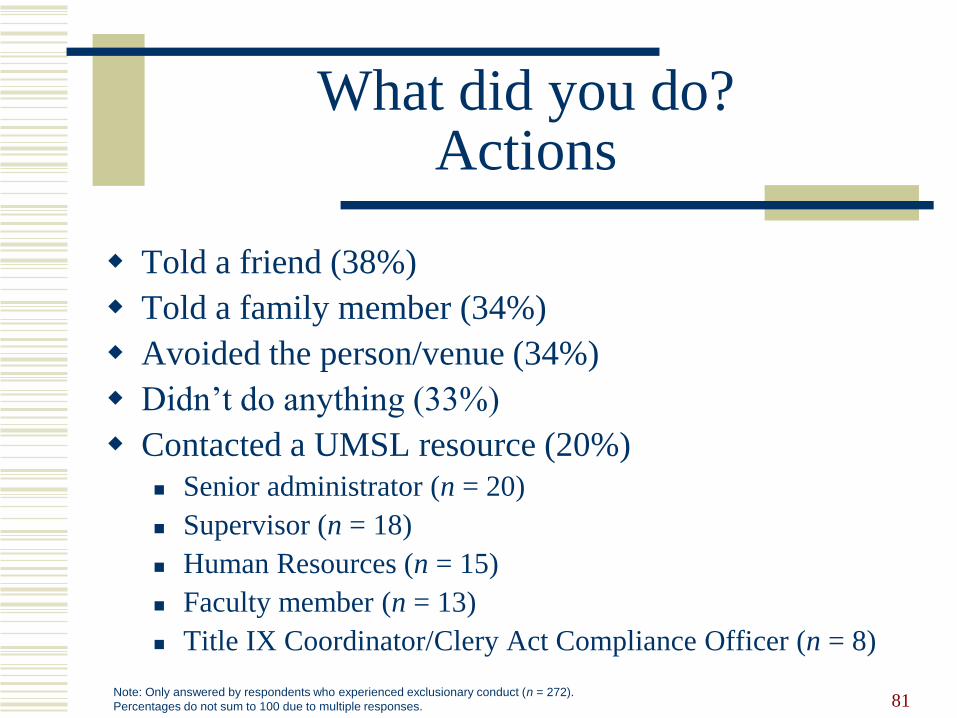
What did you do?Actions
Told a friend (38%)
Told a family member (34%)
Avoided the person/venue (34%)
Didn’t do anything (33%)
Contacted a UMSL resource (20%)
Senior administrator (n = 20)
Supervisor (n = 18)
Human Resources (n = 15)
Faculty member (n = 13)
Title IX Coordinator/Clery Act Compliance Officer (n = 8)
81Note: Only answered by respondents who experienced exclusionary conduct (n = 272).
Percentages do not sum to 100 due to multiple responses.
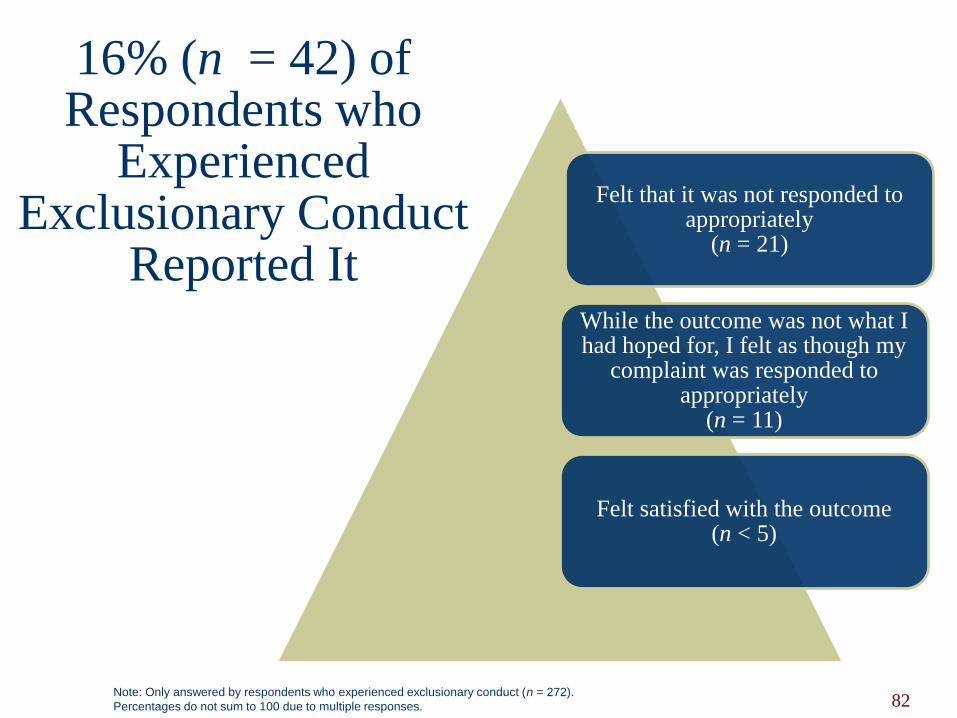
16% (n = 42) of Respondents who
Experienced Exclusionary Conduct
Reported It
82
Felt that it was not responded to appropriately
(n = 21)
While the outcome was not what I had hoped for, I felt as though my
complaint was responded to appropriately
(n = 11)
Felt satisfied with the outcome (n < 5)
Note: Only answered by respondents who experienced exclusionary conduct (n = 272).
Percentages do not sum to 100 due to multiple responses.
Qualitative Themes
Experienced Exclusionary Conduct
83
Hostile environment
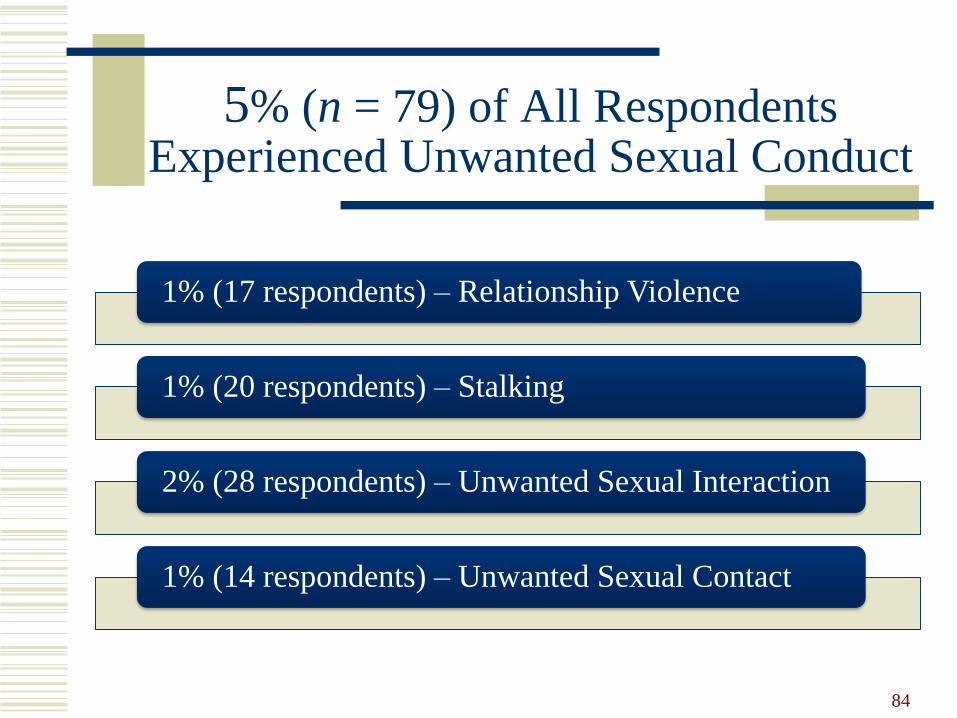
5% (n = 79) of All Respondents Experienced Unwanted Sexual Conduct
84
1% (17 respondents) – Relationship Violence
1% (20 respondents) – Stalking
2% (28 respondents) – Unwanted Sexual Interaction
1% (14 respondents) – Unwanted Sexual Contact
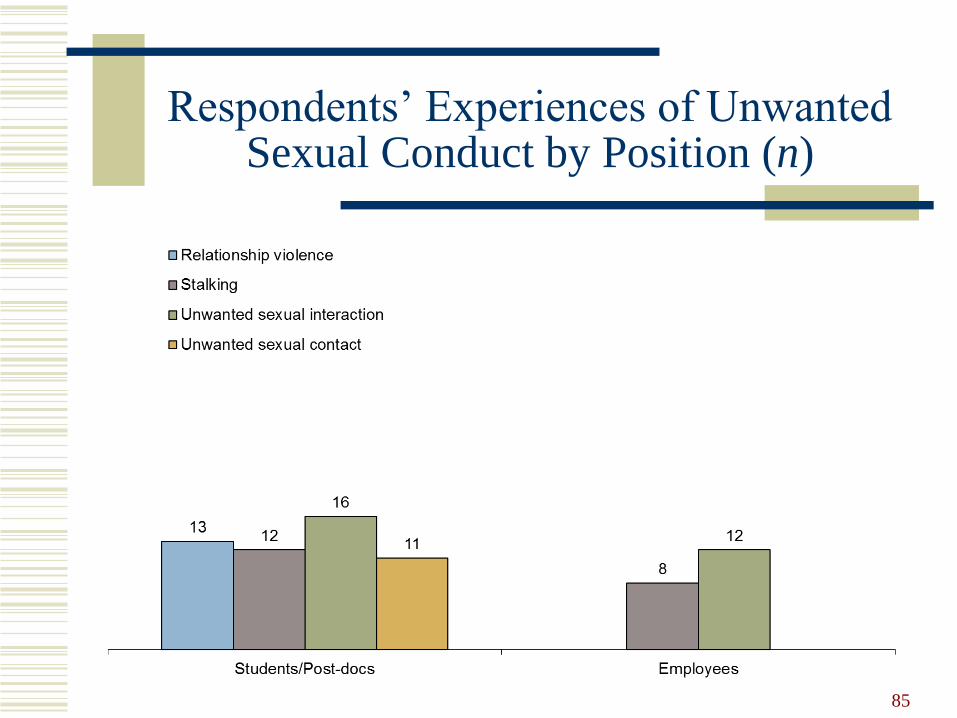
Respondents’ Experiences of Unwanted Sexual Conduct by Position (n)
85

When Relationship Violence Occurred
86
Time n %
Within the last year 8 47.1
2-4 years ago 7 41.2
5-10 years ago < 5 ---
11-20 years 0 0.0
More than 20 years ago 0 0.0
Note: Only answered by respondents who indicated on the survey that they experienced relationship violence (n = 17).
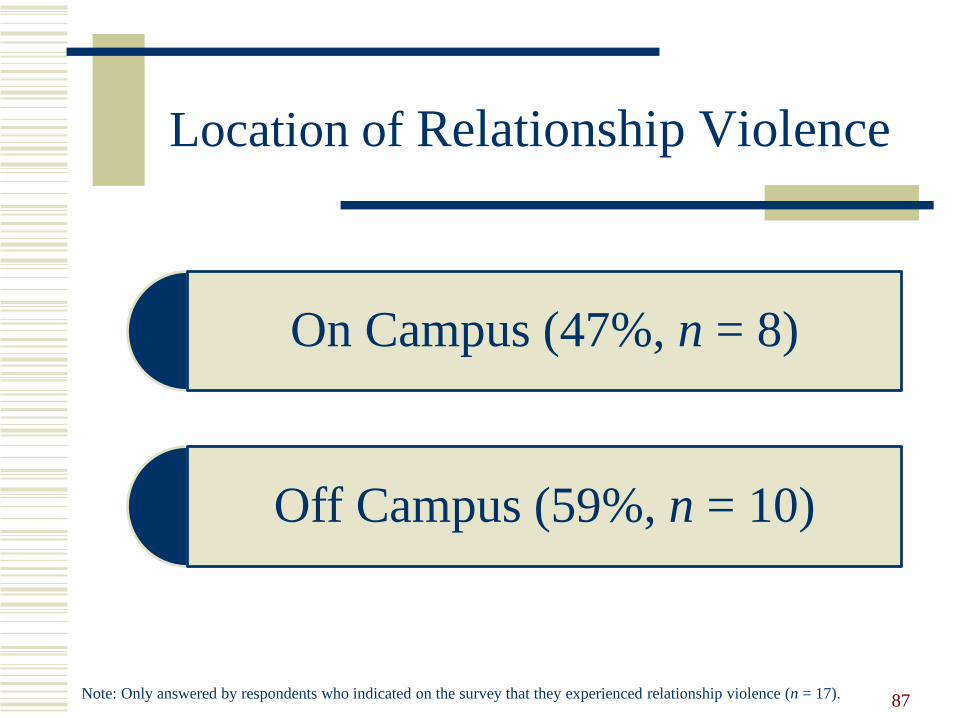
Location of Relationship Violence
On Campus (47%, n = 8)
87
Off Campus (59%, n = 10)
Note: Only answered by respondents who indicated on the survey that they experienced relationship violence (n = 17).
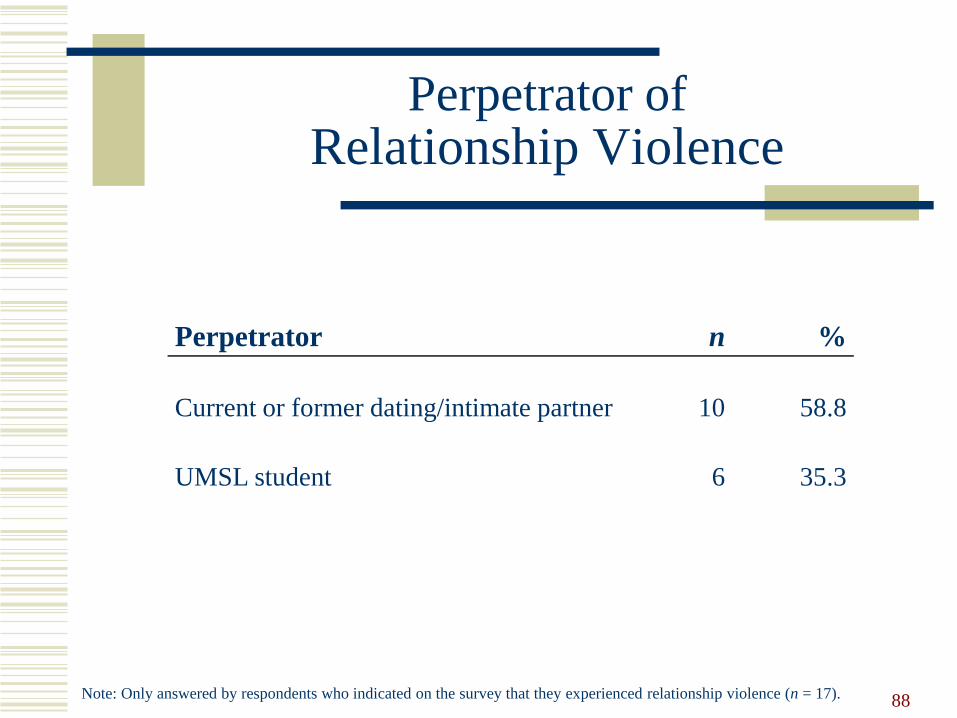
Perpetrator of Relationship Violence
88
Perpetrator n %
Current or former dating/intimate partner 10 58.8
UMSL student 6 35.3
Note: Only answered by respondents who indicated on the survey that they experienced relationship violence (n = 17).
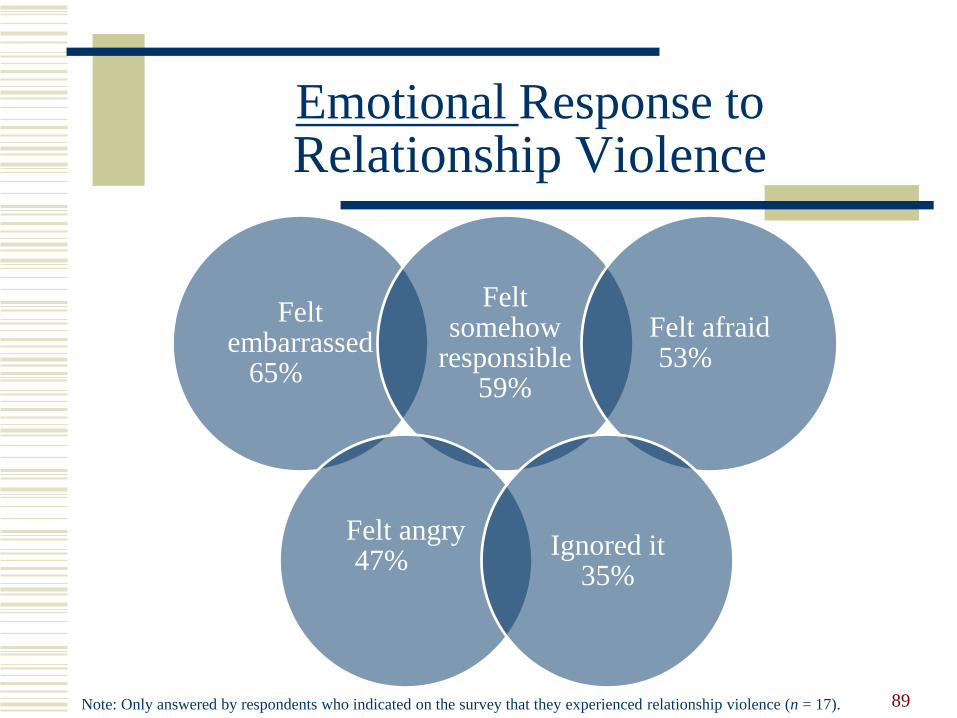
Emotional Response toRelationship Violence
89
Felt embarrassed
65%
Felt somehow
responsible 59%
Felt afraid 53%
Note: Only answered by respondents who indicated on the survey that they experienced relationship violence (n = 17).
Felt angry 47%
Ignored it 35%
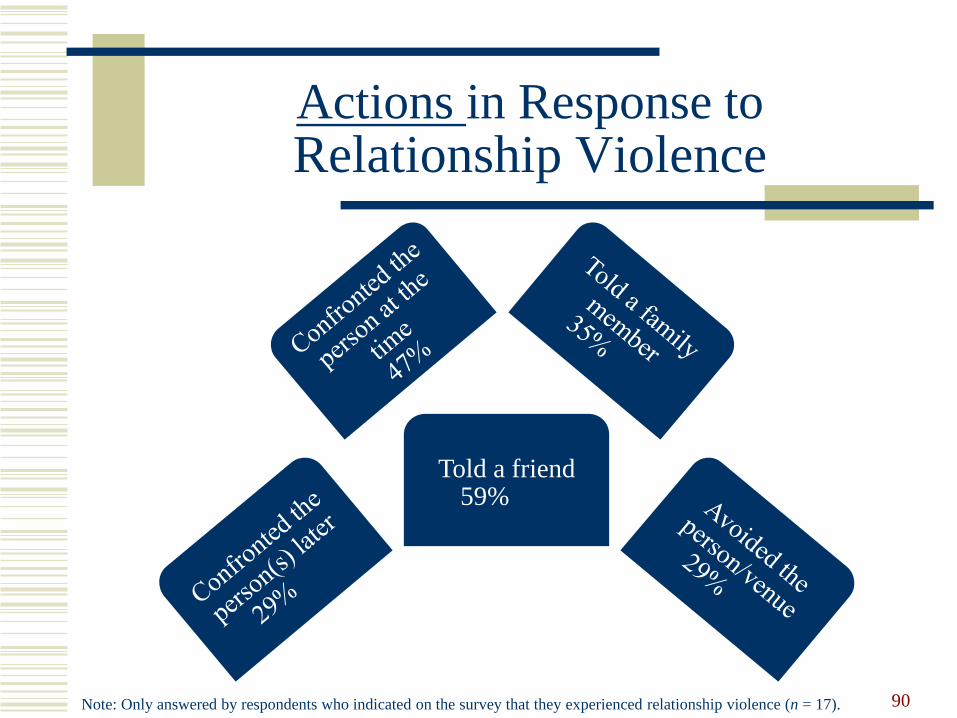
Actions in Response toRelationship Violence
90Note: Only answered by respondents who indicated on the survey that they experienced relationship violence (n = 17).
Told a friend 59%
Qualitative Themes for Undergraduate Student Respondents:Relationship Violence
91
Uncertainty that conduct was reportable/unaware where to report

When Stalking Occurred
92
Time n %
Within the last year 8 40.0
2-4 years ago 7 35.0
5-10 years ago < 5 ---
11-20 years < 5 ---
More than 20 years ago 0 0.0
Note: Only answered by respondents who indicated on the survey that they experienced stalking (n = 20).
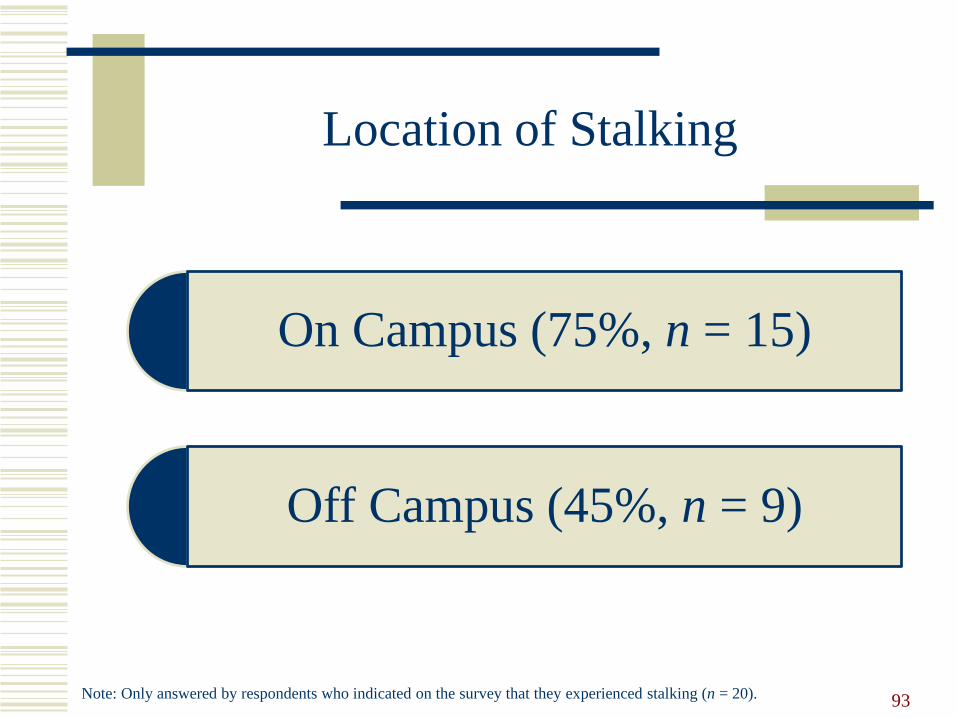
Location of Stalking
On Campus (75%, n = 15)
93
Off Campus (45%, n = 9)
Note: Only answered by respondents who indicated on the survey that they experienced stalking (n = 20).
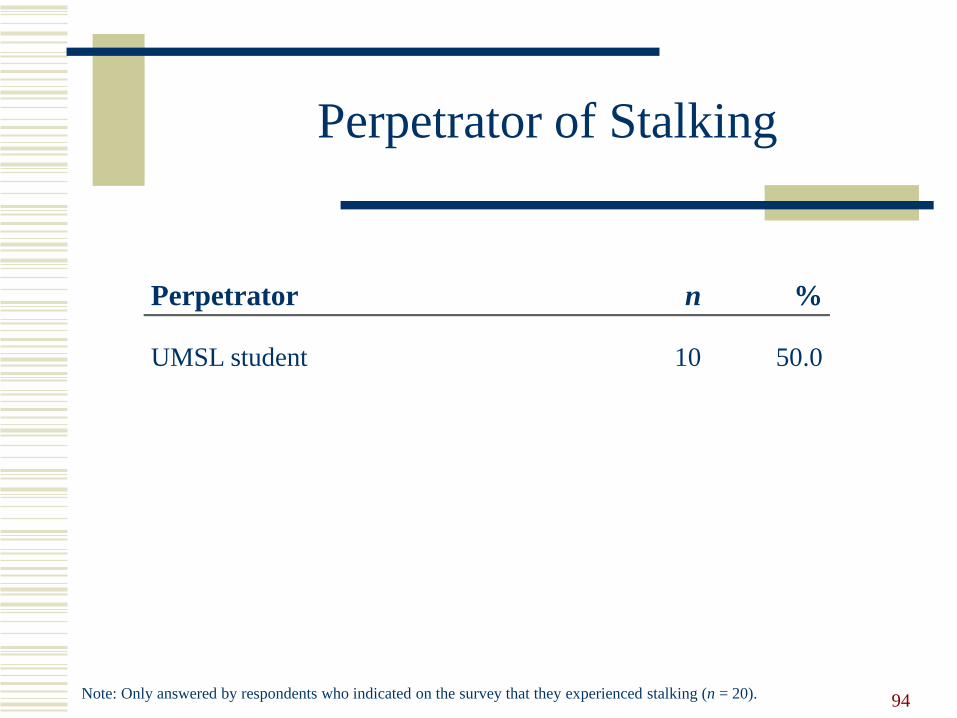
Perpetrator of Stalking
94
Perpetrator n %
UMSL student 10 50.0
Note: Only answered by respondents who indicated on the survey that they experienced stalking (n = 20).
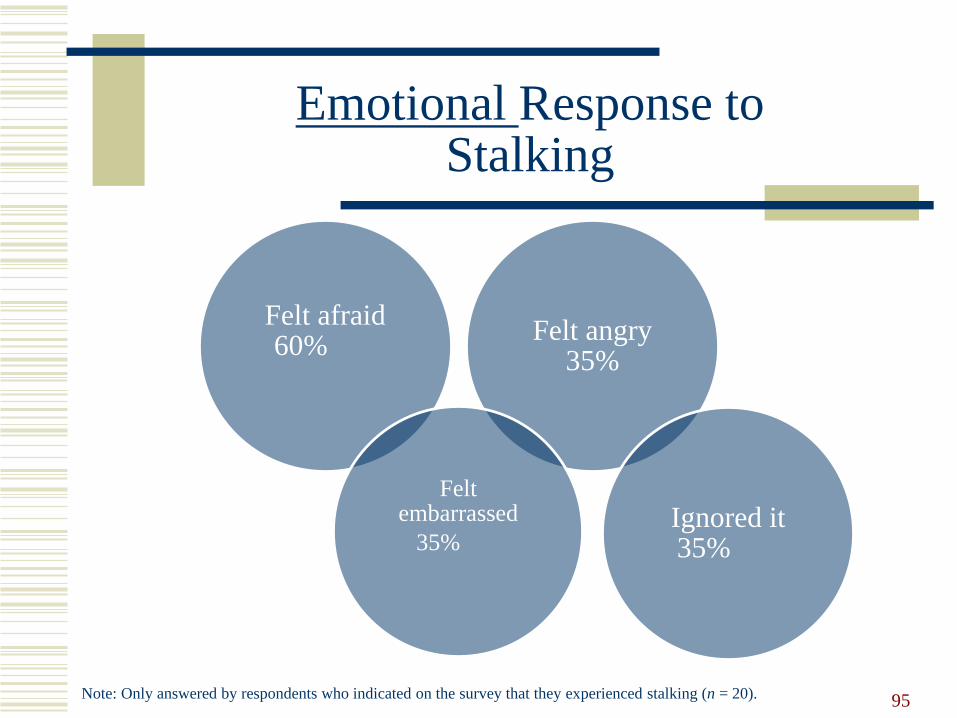
Emotional Response toStalking
95Note: Only answered by respondents who indicated on the survey that they experienced stalking (n = 20).
Felt afraid 60%
Felt angry 35%
Ignored it 35%
Felt embarrassed
35%
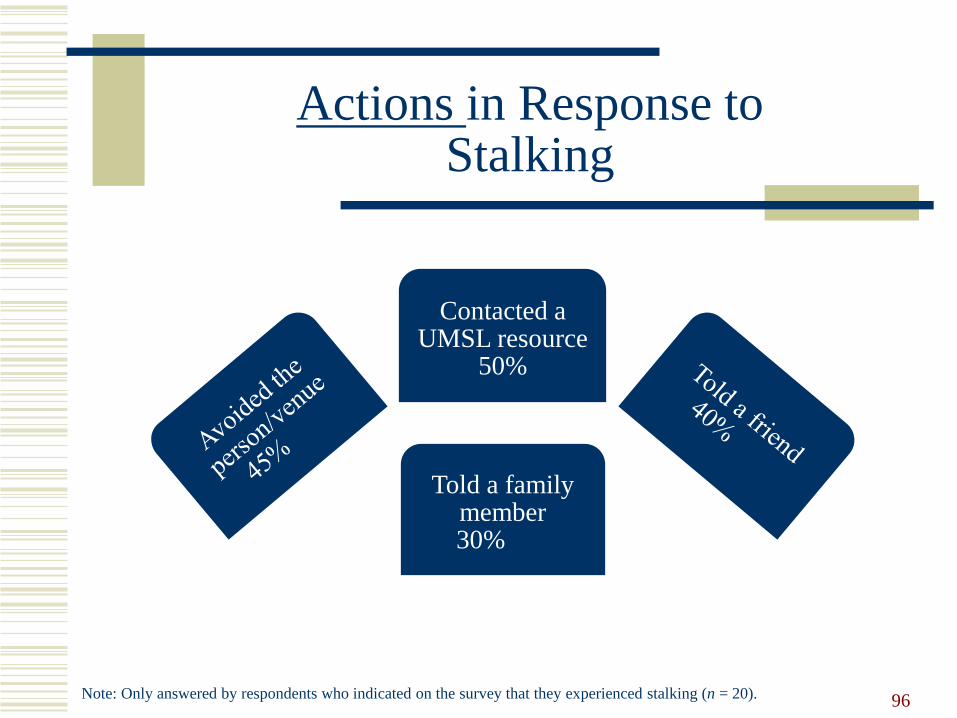
Actions in Response toStalking
96Note: Only answered by respondents who indicated on the survey that they experienced stalking (n = 20).
Contacted a UMSL resource
50%
Told a family member 30%

35% (n = 7) of Respondents who
Experienced Stalking Reported It
97
Felt that it was not responded to appropriately
(n < 5)
While the outcome was not what I had hoped for, I felt as though my
complaint was responded to appropriately
(n < 5)
Felt satisfied with the outcome (n = 5)
Note: Only answered by respondents who indicated on the survey that they experienced unwanted sexual interaction (n = 20).
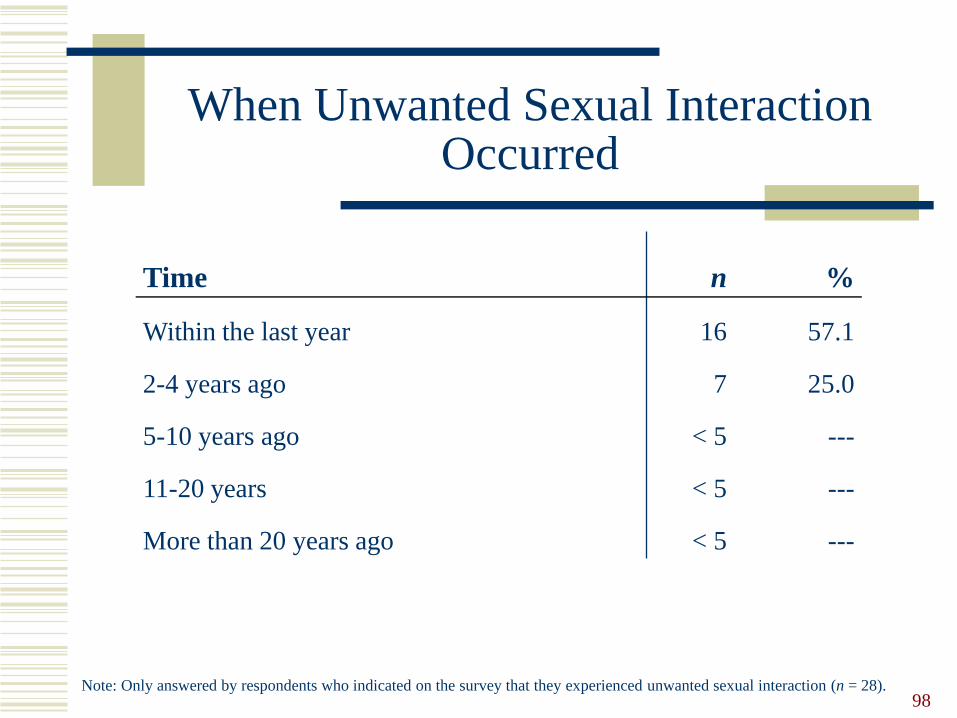
When Unwanted Sexual Interaction Occurred
98
Time n %
Within the last year 16 57.1
2-4 years ago 7 25.0
5-10 years ago < 5 ---
11-20 years < 5 ---
More than 20 years ago < 5 ---
Note: Only answered by respondents who indicated on the survey that they experienced unwanted sexual interaction (n = 28).
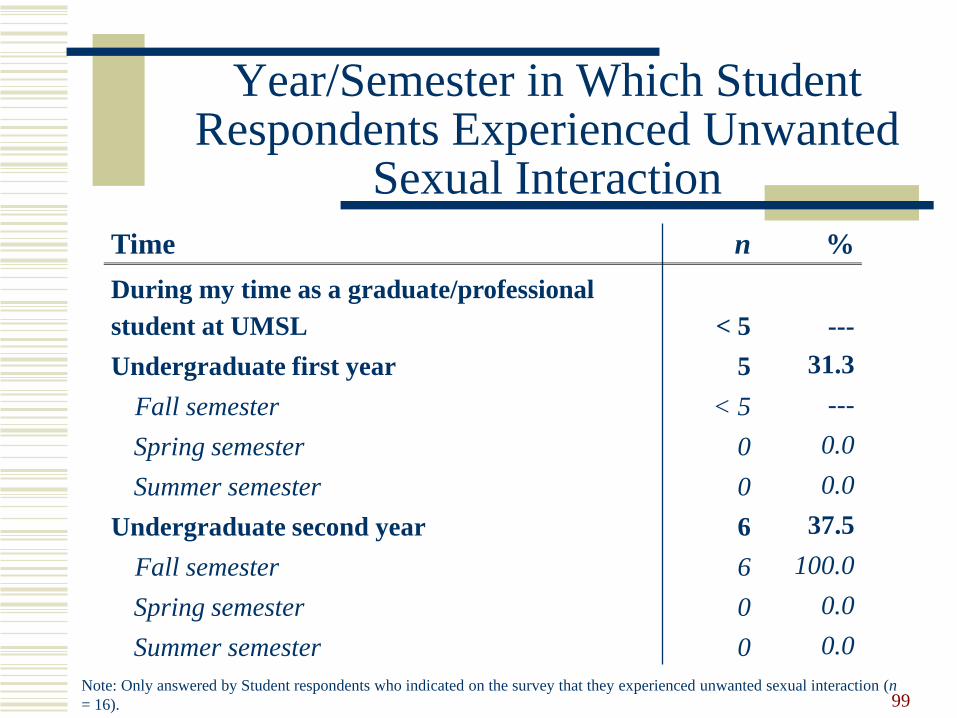
Year/Semester in Which Student Respondents Experienced Unwanted
Sexual Interaction
99Note: Only answered by Student respondents who indicated on the survey that they experienced unwanted sexual interaction (n
= 16).
Time n %
During my time as a graduate/professional
student at UMSL < 5 ---
Undergraduate first year 5 31.3
Fall semester < 5 ---
Spring semester 0 0.0
Summer semester 0 0.0
Undergraduate second year 6 37.5
Fall semester 6 100.0
Spring semester 0 0.0
Summer semester 0 0.0
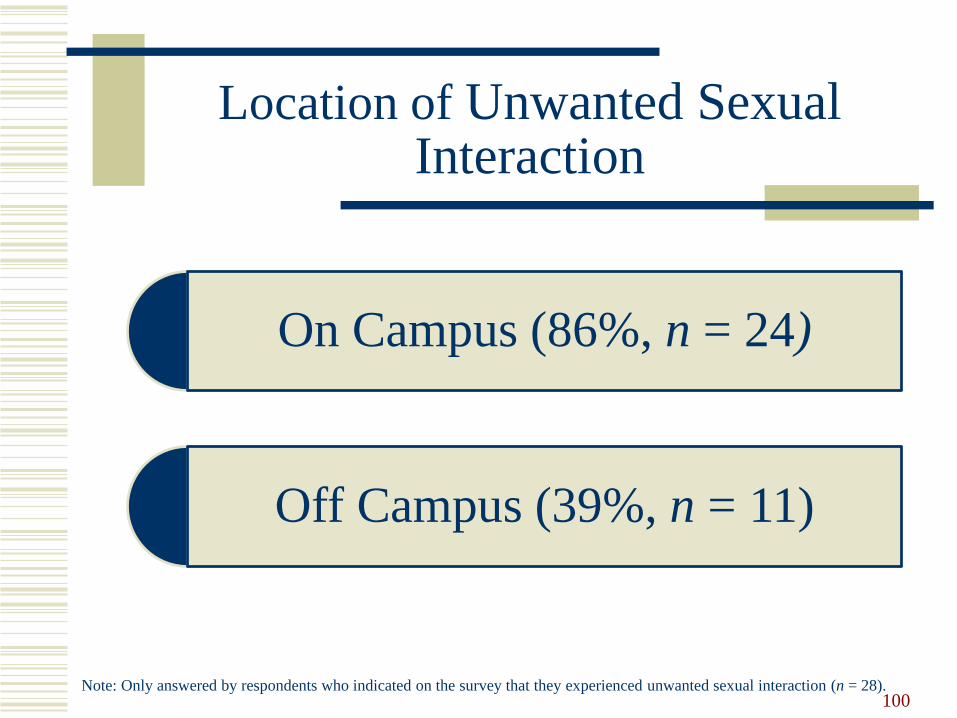
Location of Unwanted Sexual Interaction
On Campus (86%, n = 24)
100
Off Campus (39%, n = 11)
Note: Only answered by respondents who indicated on the survey that they experienced unwanted sexual interaction (n = 28).
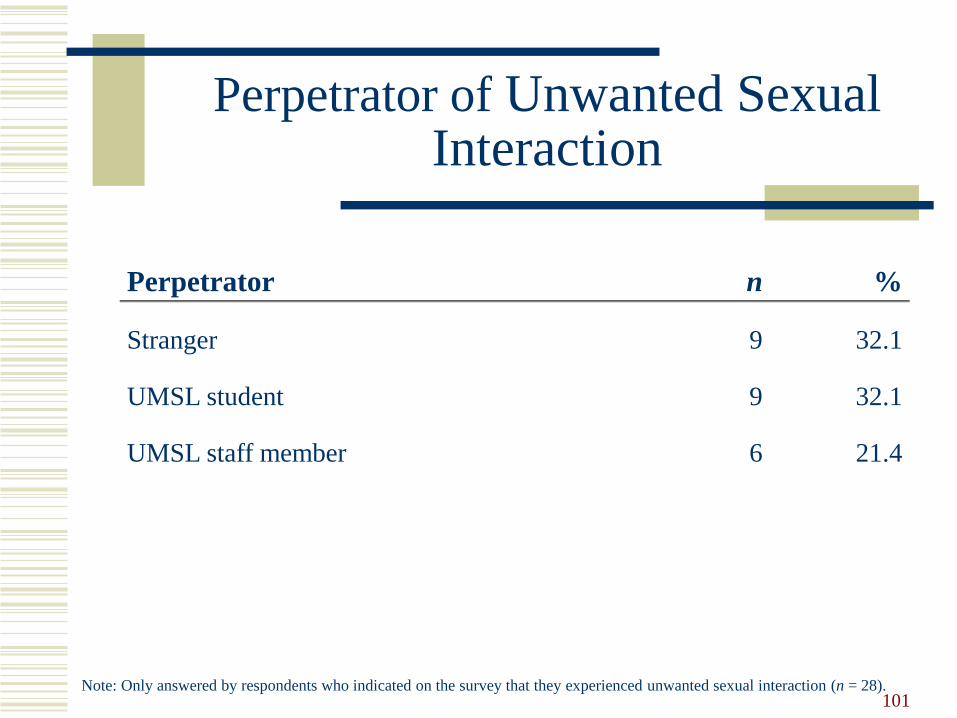
Perpetrator of Unwanted Sexual Interaction
101
Perpetrator n %
Stranger 9 32.1
UMSL student 9 32.1
UMSL staff member 6 21.4
Note: Only answered by respondents who indicated on the survey that they experienced unwanted sexual interaction (n = 28).
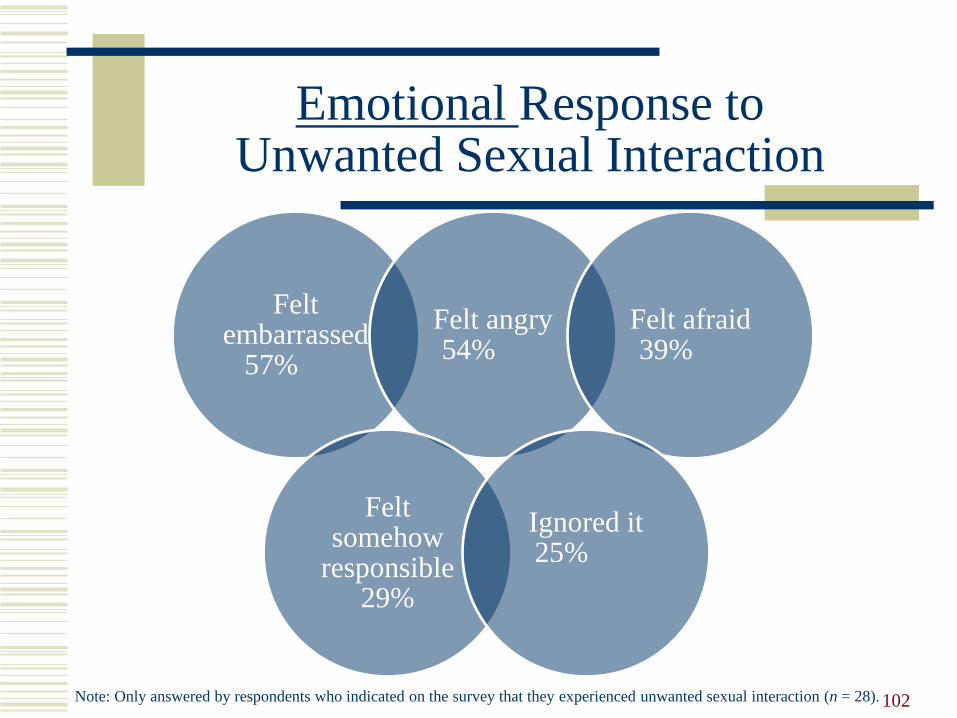
Emotional Response toUnwanted Sexual Interaction
102Note: Only answered by respondents who indicated on the survey that they experienced unwanted sexual interaction (n = 28).
Felt embarrassed
57%
Felt angry 54%
Felt afraid 39%
Felt somehow
responsible 29%
Ignored it 25%

Actions in Response toUnwanted Sexual Interaction
103Note: Only answered by respondents who indicated on the survey that they experienced unwanted sexual interaction (n = 28).
Told a friend 61%
Avoided the person/venue
46%
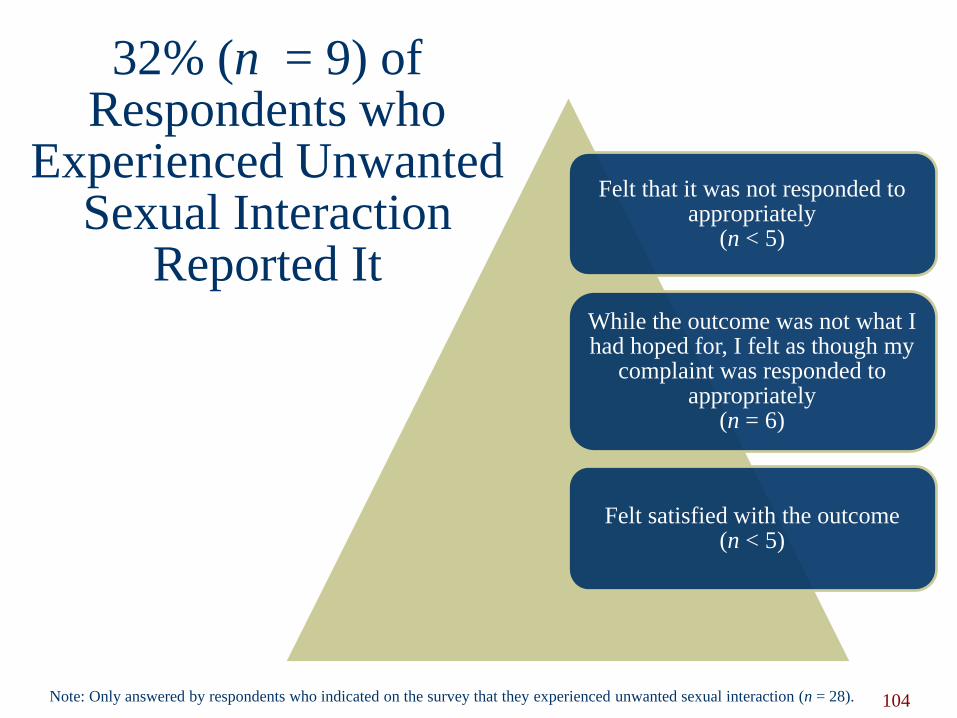
32% (n = 9) of Respondents who
Experienced Unwanted Sexual Interaction
Reported It
104
Felt that it was not responded to appropriately
(n < 5)
While the outcome was not what I had hoped for, I felt as though my
complaint was responded to appropriately
(n = 6)
Felt satisfied with the outcome (n < 5)
Note: Only answered by respondents who indicated on the survey that they experienced unwanted sexual interaction (n = 28).
Qualitative Themes for Respondents:Unwanted Sexual Interaction
105
Reporting not necessary
No consequence for behavior
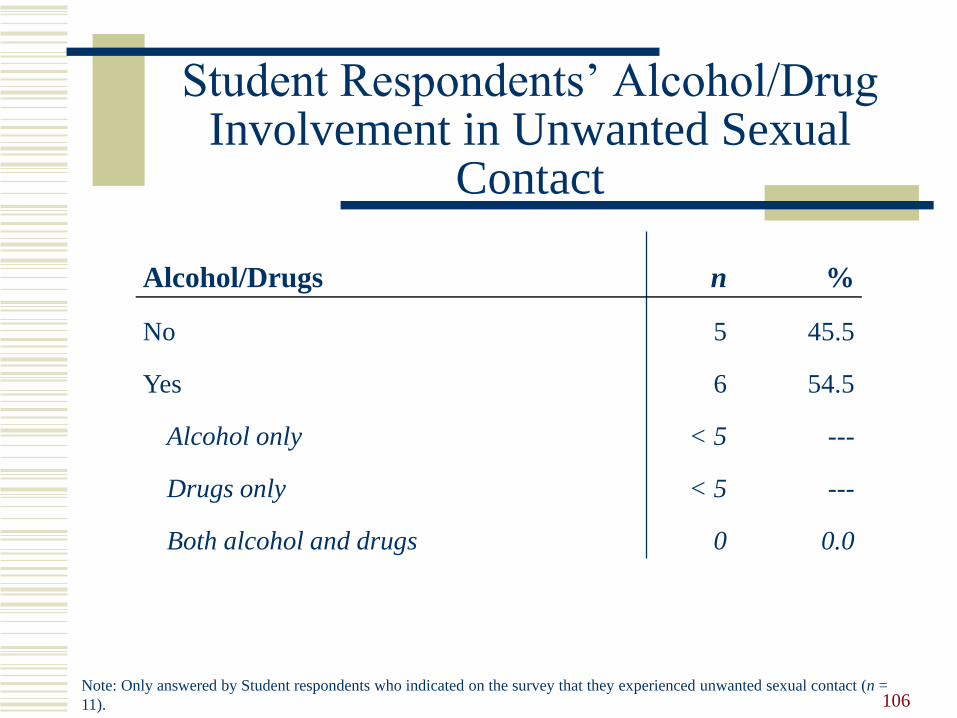
Student Respondents’ Alcohol/Drug Involvement in Unwanted Sexual
Contact
106
Alcohol/Drugs n %
No 5 45.5
Yes 6 54.5
Alcohol only < 5 ---
Drugs only < 5 ---
Both alcohol and drugs 0 0.0
Note: Only answered by Student respondents who indicated on the survey that they experienced unwanted sexual contact (n =
11).

When Unwanted Sexual Contact Occurred
107
Time n %
Within the last year 6 42.9
2-4 years ago 5 35.7
5-10 years ago < 5 ---
11-20 years 0 0.0
More than 20 years ago 0 0.0
Note: Only answered by respondents who indicated on the survey that they experienced unwanted sexual contact (n = 14).
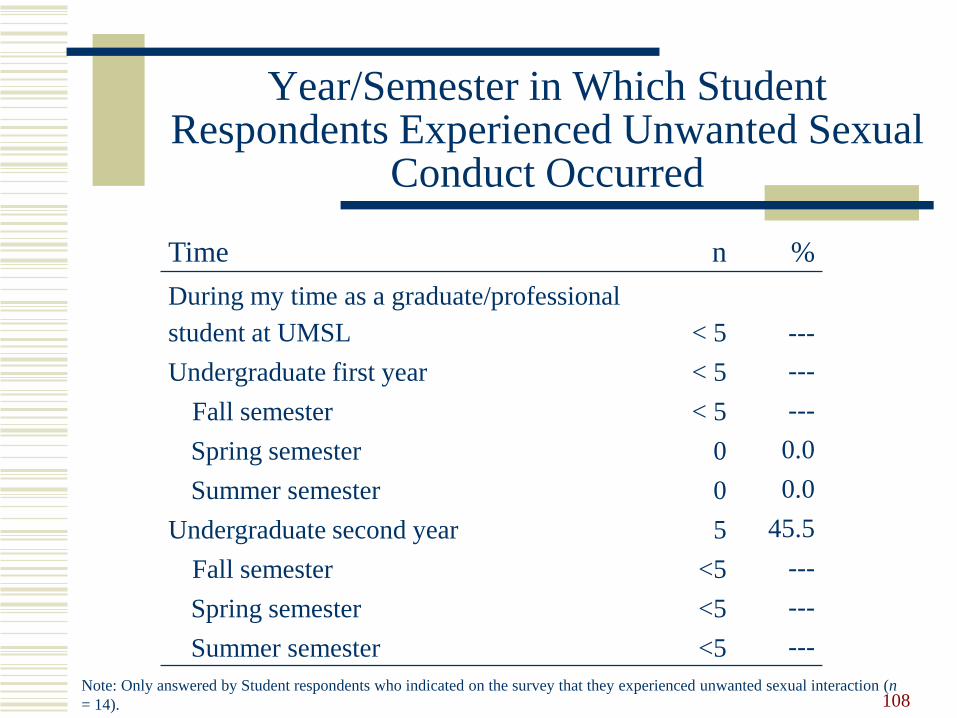
Year/Semester in Which Student Respondents Experienced Unwanted Sexual
Conduct Occurred
108Note: Only answered by Student respondents who indicated on the survey that they experienced unwanted sexual interaction (n
= 14).
Time n %
During my time as a graduate/professional
student at UMSL < 5 ---
Undergraduate first year < 5 ---
Fall semester < 5 ---
Spring semester 0 0.0
Summer semester 0 0.0
Undergraduate second year 5 45.5
Fall semester <5 ---
Spring semester <5 ---
Summer semester <5 ---
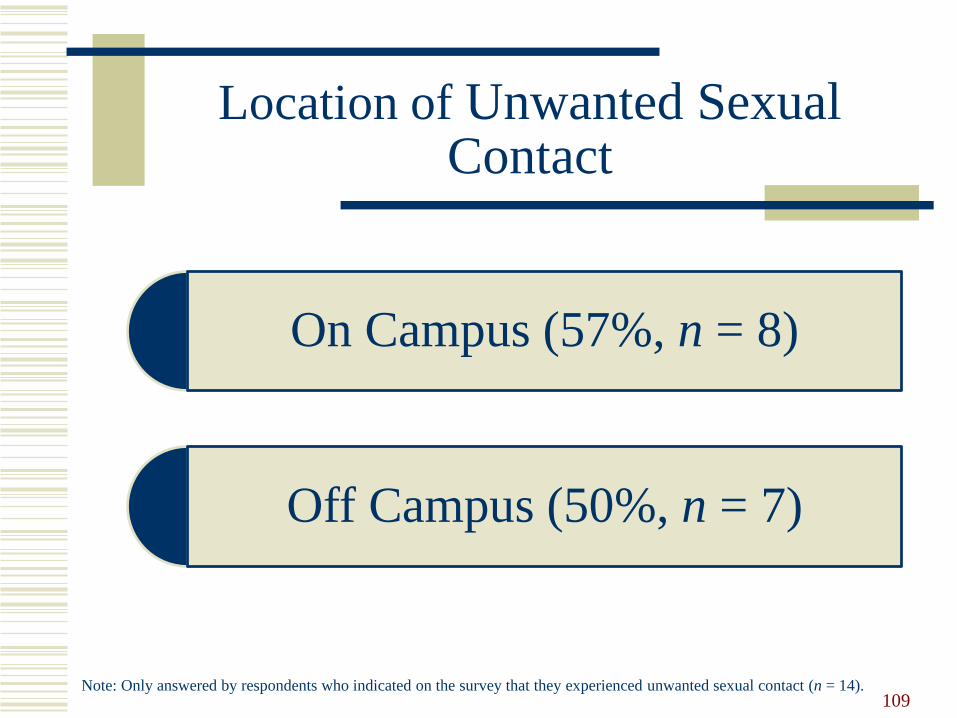
Location of Unwanted Sexual Contact
On Campus (57%, n = 8)
109
Off Campus (50%, n = 7)
Note: Only answered by respondents who indicated on the survey that they experienced unwanted sexual contact (n = 14).

Perpetrator of Unwanted Sexual Contact
110
Perpetrator n %
UMSL student 8 57.1
Acquaintance/friend 6 42.9
Note: Only answered by respondents who indicated on the survey that they experienced unwanted sexual contact (n = 14).
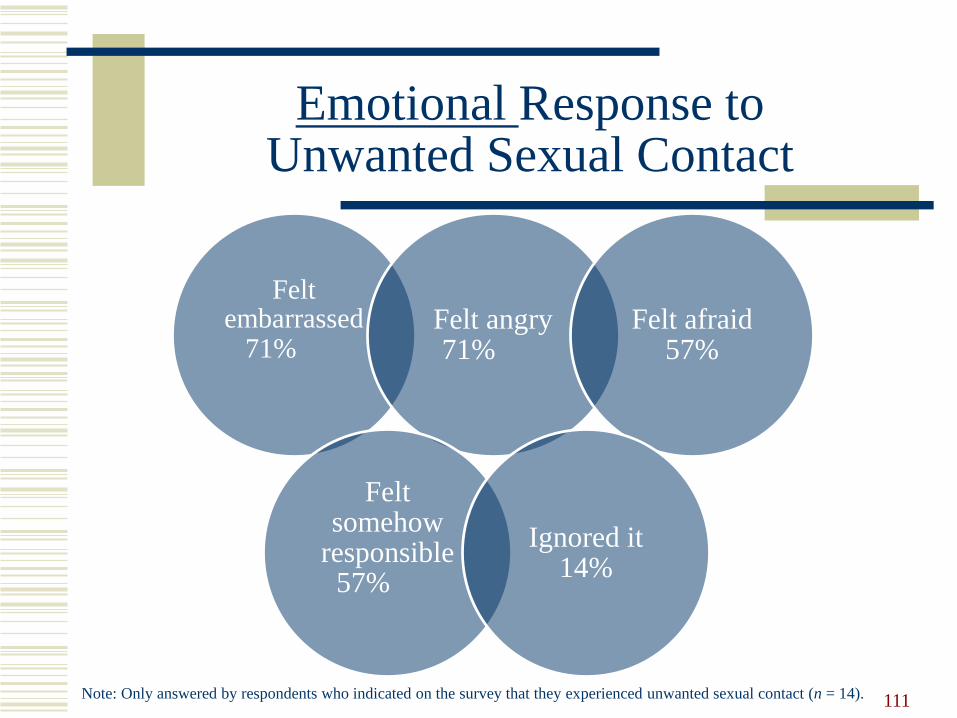
Emotional Response toUnwanted Sexual Contact
111Note: Only answered by respondents who indicated on the survey that they experienced unwanted sexual contact (n = 14).
Felt embarrassed
71% Felt angry 71%
Felt afraid 57%
Felt somehow
responsible 57%
Ignored it 14%
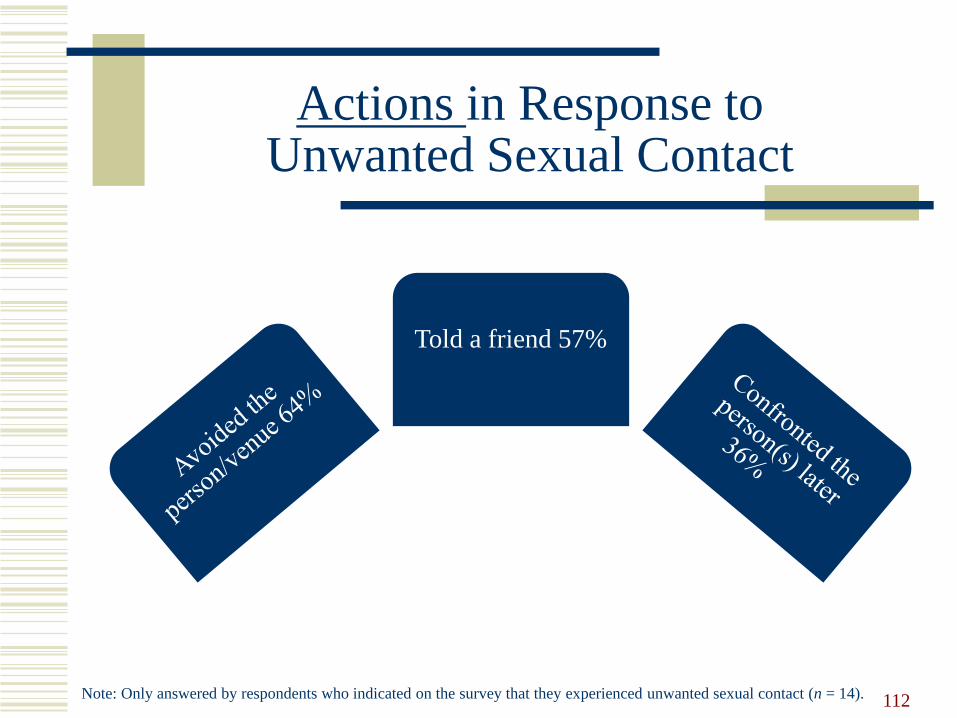
Actions in Response toUnwanted Sexual Contact
112Note: Only answered by respondents who indicated on the survey that they experienced unwanted sexual contact (n = 14).
Told a friend 57%
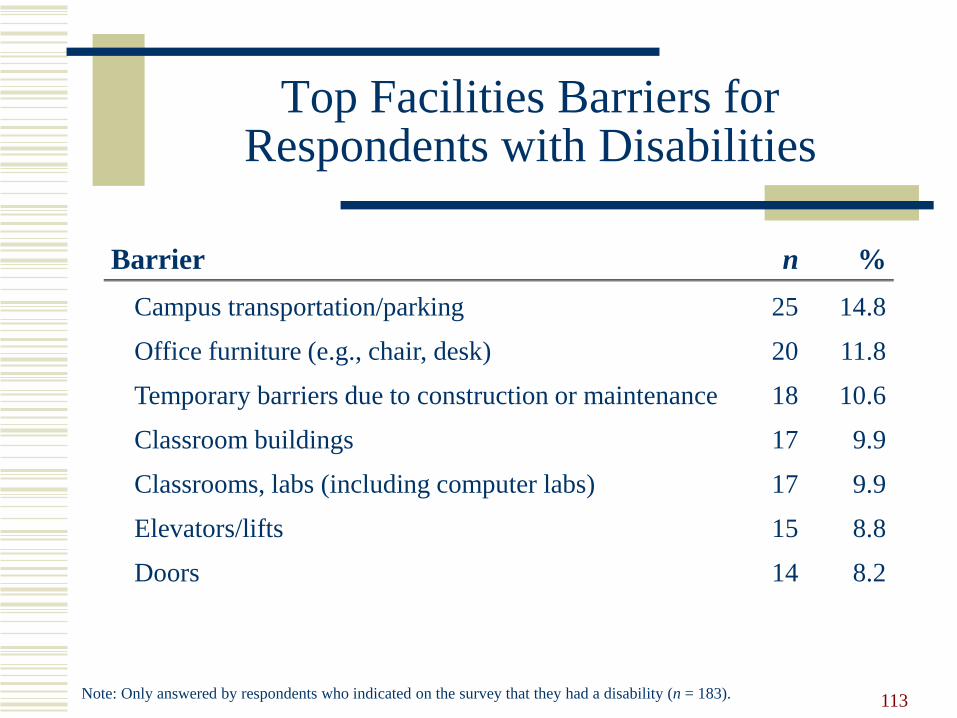
Top Facilities Barriers for Respondents with Disabilities
Barrier n %
Campus transportation/parking 25 14.8
Office furniture (e.g., chair, desk) 20 11.8
Temporary barriers due to construction or maintenance 18 10.6
Classroom buildings 17 9.9
Classrooms, labs (including computer labs) 17 9.9
Elevators/lifts 15 8.8
Doors 14 8.2
113Note: Only answered by respondents who indicated on the survey that they had a disability (n = 183).
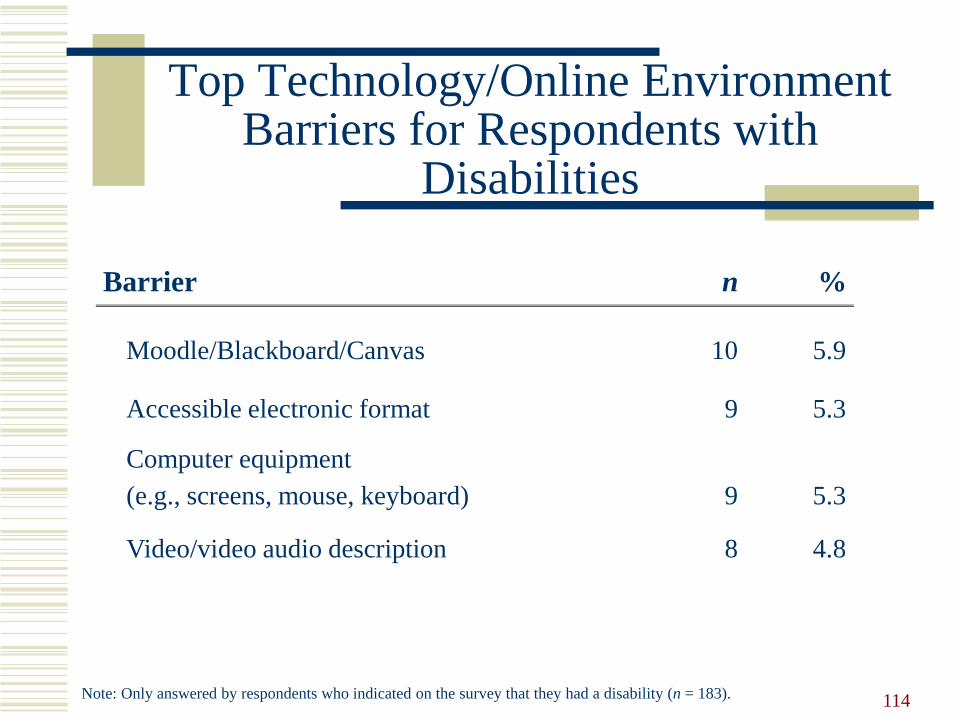
Top Technology/Online Environment Barriers for Respondents with
Disabilities
Barrier n %
Moodle/Blackboard/Canvas 10 5.9
Accessible electronic format 9 5.3
Computer equipment
(e.g., screens, mouse, keyboard) 9 5.3
Video/video audio description 8 4.8
114Note: Only answered by respondents who indicated on the survey that they had a disability (n = 183).
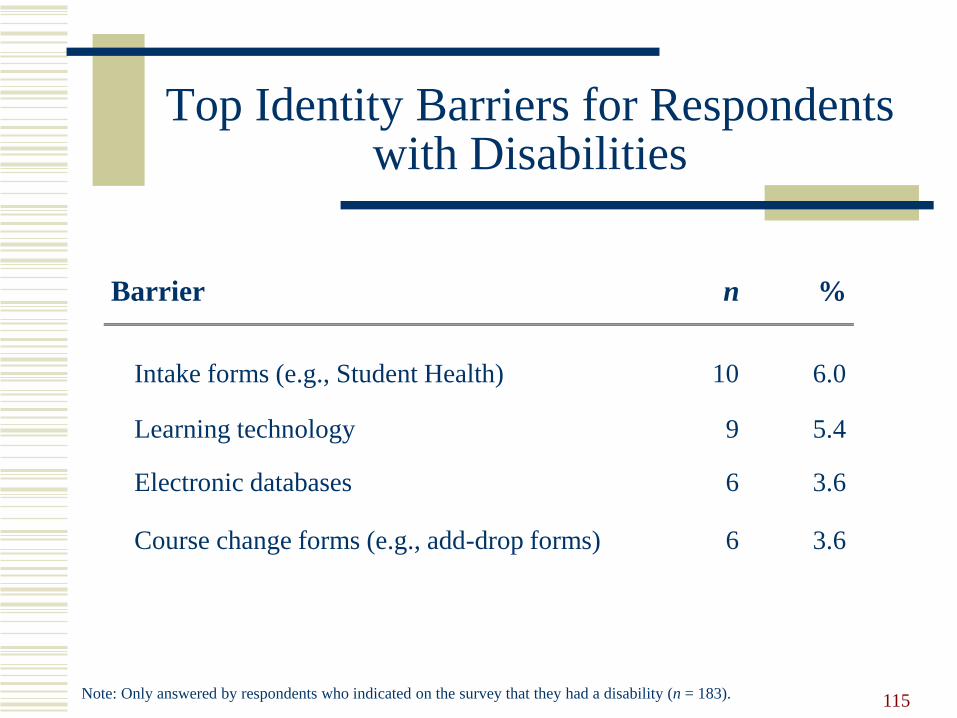
Top Identity Barriers for Respondents with Disabilities
Barrier n %
Intake forms (e.g., Student Health) 10 6.0
Learning technology 9 5.4
Electronic databases 6 3.6
Course change forms (e.g., add-drop forms) 6 3.6
115Note: Only answered by respondents who indicated on the survey that they had a disability (n = 183).
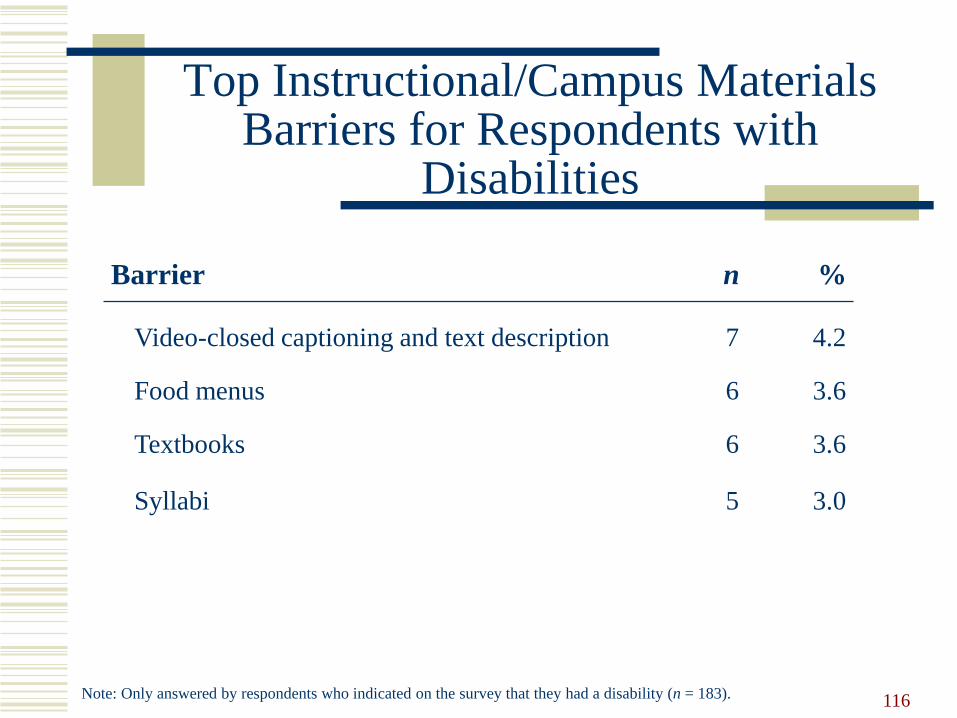
Top Instructional/Campus Materials Barriers for Respondents with
Disabilities
Barrier n %
Video-closed captioning and text description 7 4.2
Food menus 6 3.6
Textbooks 6 3.6
Syllabi 5 3.0
116Note: Only answered by respondents who indicated on the survey that they had a disability (n = 183).
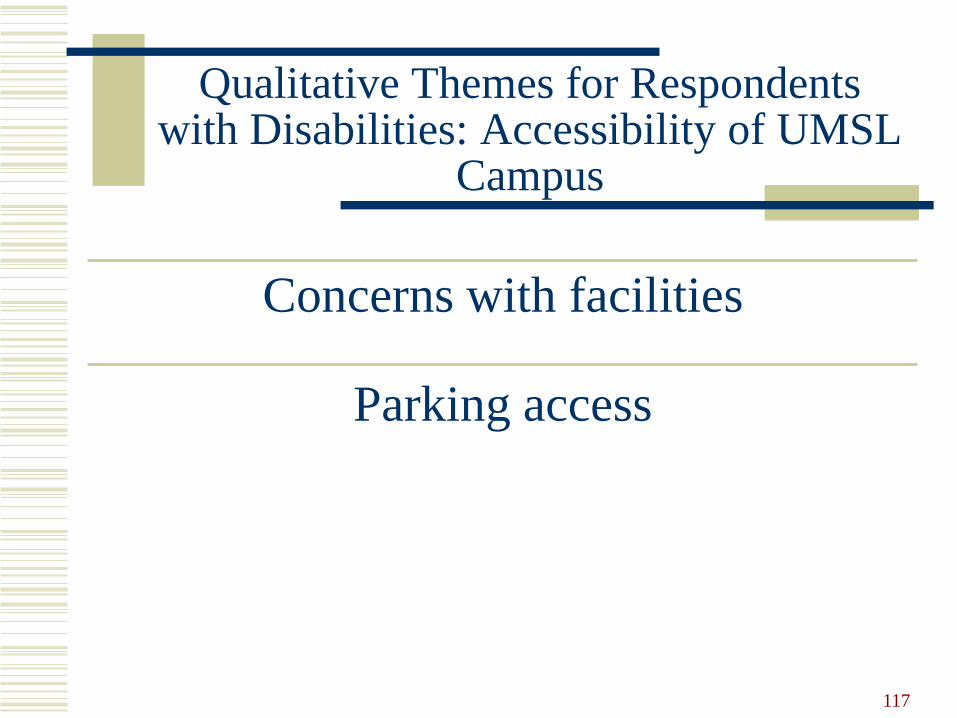
Qualitative Themes for Respondents with Disabilities: Accessibility of UMSL
Campus
117
Concerns with facilities
Parking access
Intent to Persist
118
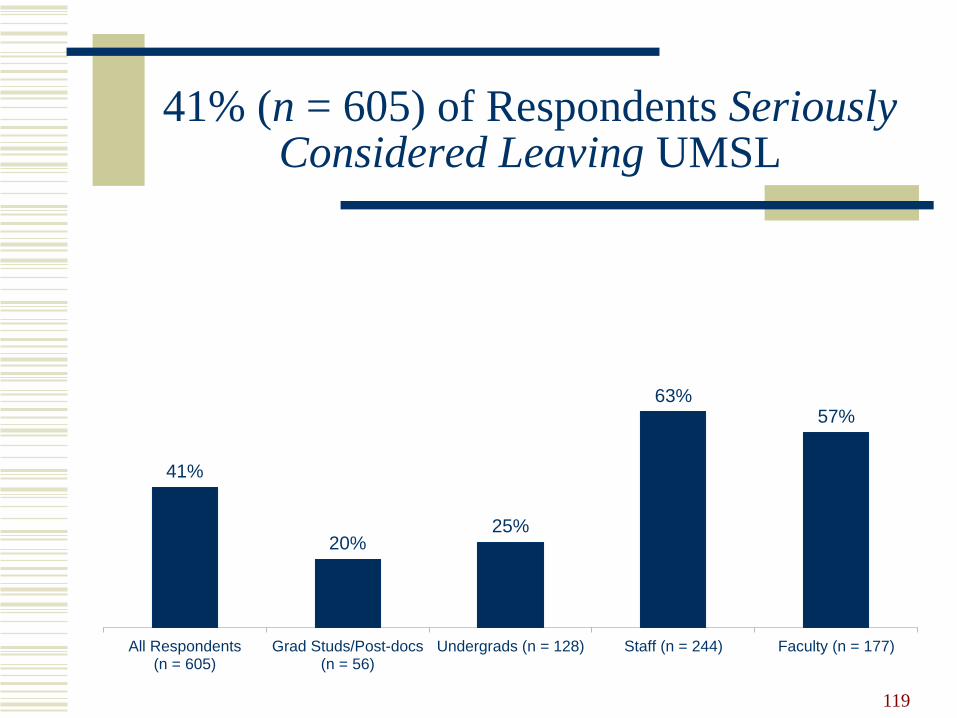
41% (n = 605) of Respondents Seriously Considered Leaving UMSL
119
41%
20%25%
63%57%
All Respondents(n = 605)
Grad Studs/Post-docs(n = 56)
Undergrads (n = 128) Staff (n = 244) Faculty (n = 177)
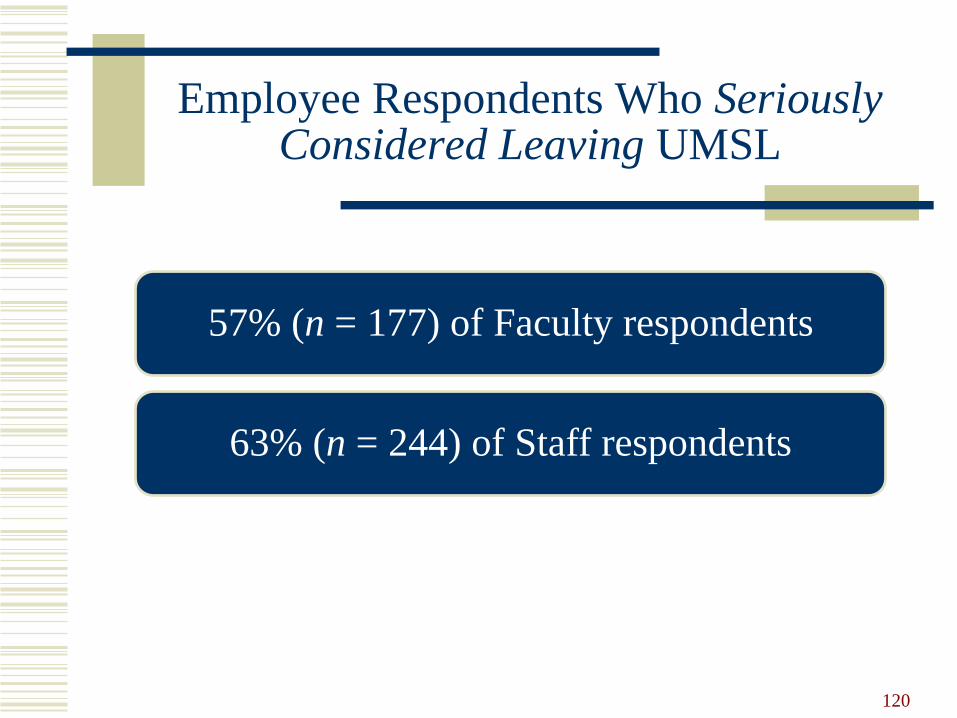
Employee Respondents Who Seriously Considered Leaving UMSL
57% (n = 177) of Faculty respondents
63% (n = 244) of Staff respondents
120

Top Reasons Faculty Respondents Seriously Considered Leaving UMSL
121Note: Table includes answers from only those Faculty respondents who indicated that they considered leaving (n = 177).
Reason n %
Low salary/pay rate 121 68.4
Lack of institutional support 67 37.9
Increased workload 65 36.7
Interested in a position at another institution 63 35.6
Limited opportunities for advancement 60 33.9
Tension with supervisor/manager 50 28.2
Lack of a sense of belonging 50 28.2
Recruited or offered a position at another institution 43 24.3
Lack of professional development opportunities 33 16.6
Climate not welcoming 33 16.6
Tension with co-workers 29 16.4
Lack of benefits 22 12.4
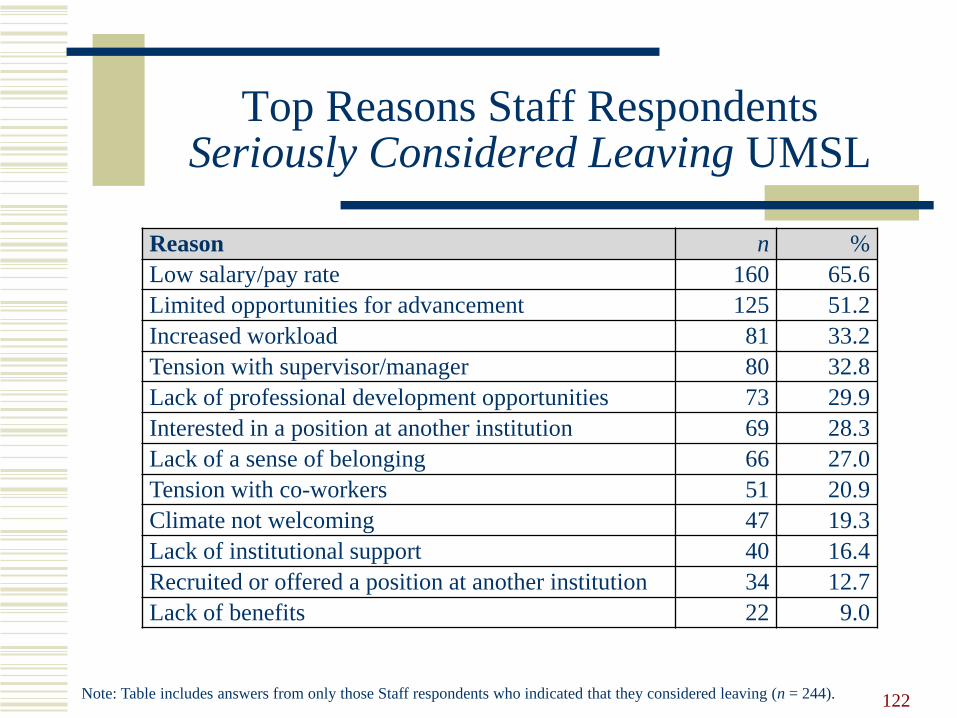
Top Reasons Staff Respondents Seriously Considered Leaving UMSL
122Note: Table includes answers from only those Staff respondents who indicated that they considered leaving (n = 244).
Reason n %
Low salary/pay rate 160 65.6
Limited opportunities for advancement 125 51.2
Increased workload 81 33.2
Tension with supervisor/manager 80 32.8
Lack of professional development opportunities 73 29.9
Interested in a position at another institution 69 28.3
Lack of a sense of belonging 66 27.0
Tension with co-workers 51 20.9
Climate not welcoming 47 19.3
Lack of institutional support 40 16.4
Recruited or offered a position at another institution 34 12.7
Lack of benefits 22 9.0
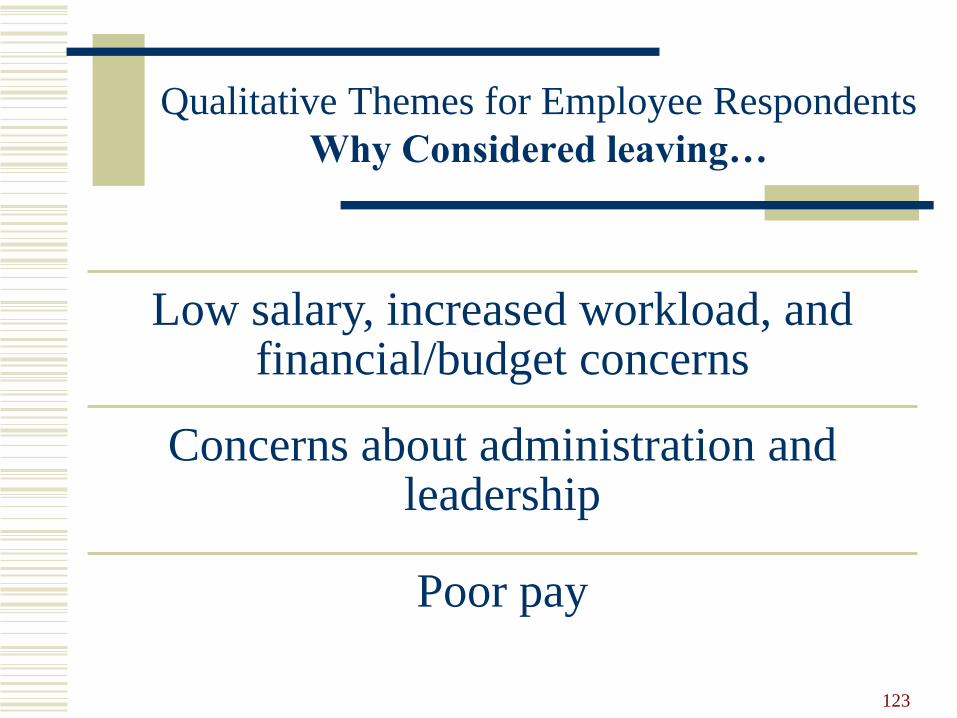
Qualitative Themes for Employee Respondents
Why Considered leaving…
123
Low salary, increased workload, and financial/budget concerns
Concerns about administration and leadership
Poor pay
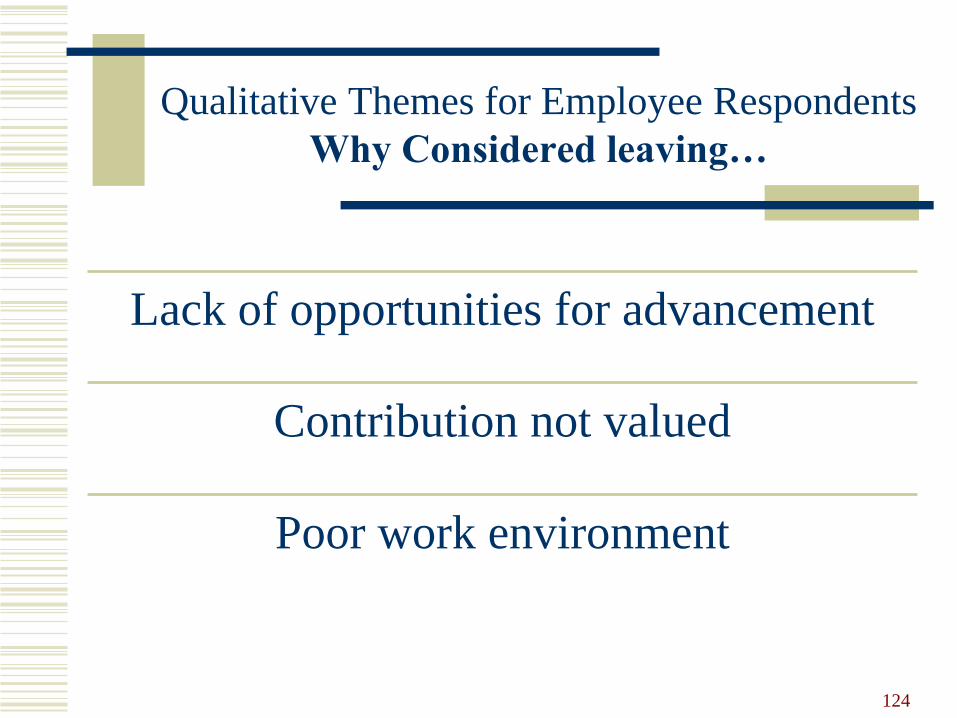
Qualitative Themes for Employee Respondents
Why Considered leaving…
124
Lack of opportunities for advancement
Contribution not valued
Poor work environment
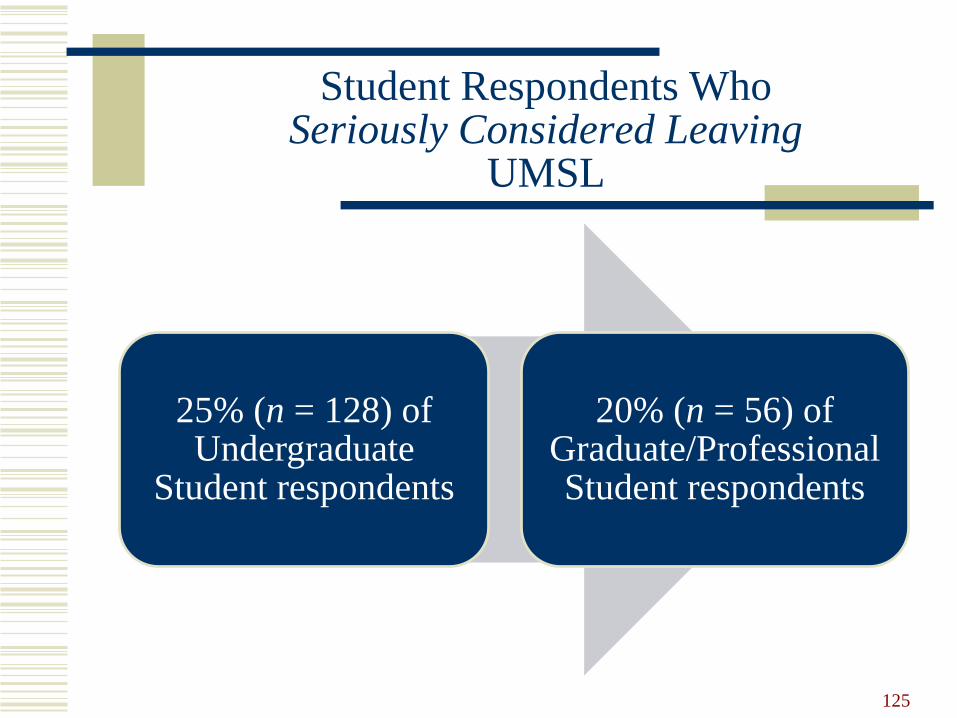
Student Respondents WhoSeriously Considered Leaving
UMSL
25% (n = 128) of Undergraduate
Student respondents
20% (n = 56) of Graduate/Professional Student respondents
125
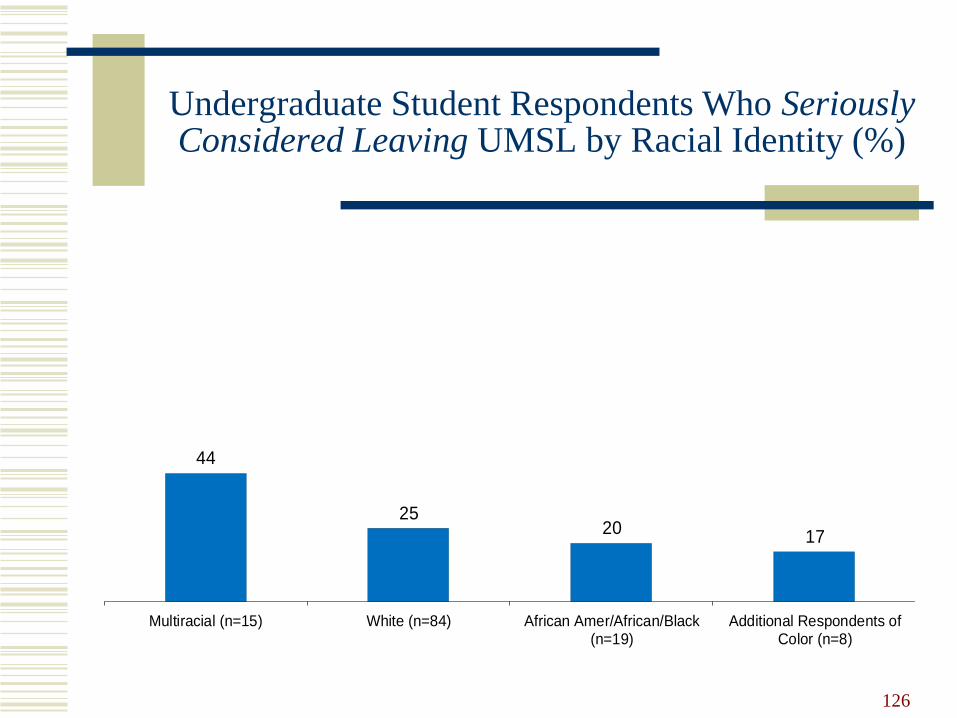
Undergraduate Student Respondents Who Seriously Considered Leaving UMSL by Racial Identity (%)
126
44
2520
17
Multiracial (n=15) White (n=84) African Amer/African/Black(n=19)
Additional Respondents ofColor (n=8)
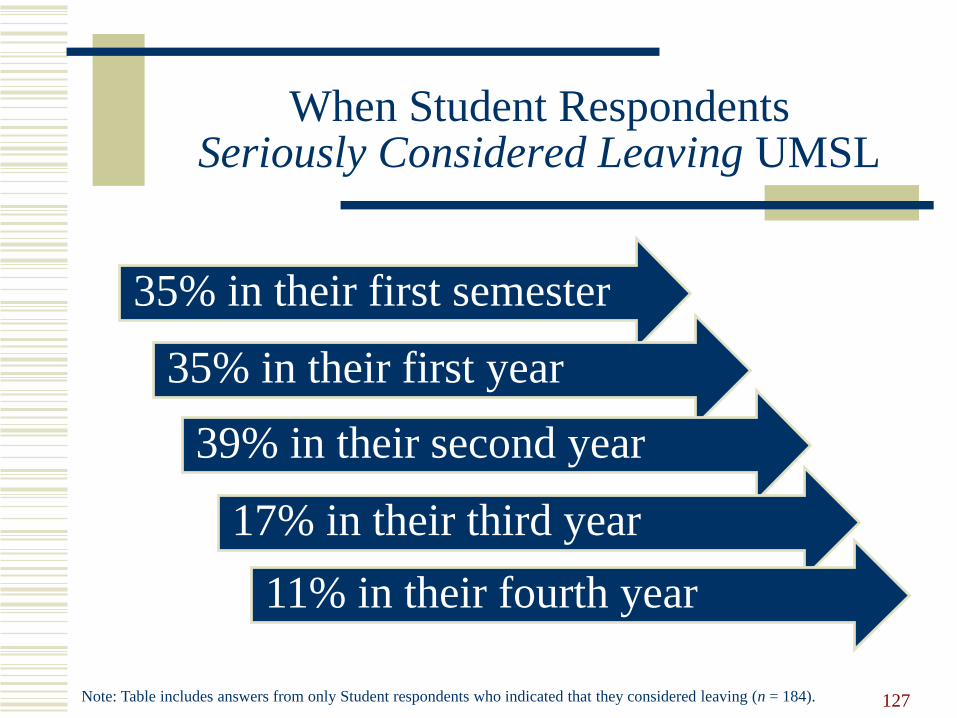
When Student RespondentsSeriously Considered Leaving UMSL
127Note: Table includes answers from only Student respondents who indicated that they considered leaving (n = 184).
35% in their first semester
35% in their first year
39% in their second year
17% in their third year
11% in their fourth year

Top Reasons Why Undergraduate Student Respondents Seriously Considered
Leaving UMSL
128
Reason n %
Lack of a sense of belonging 43 33.6
Lack of social life 40 31.3
Financial reasons 31 24.2
Personal reasons 30 23.4
Climate was not welcoming 27 21.1
Academic advancement opportunities elsewhere 26 20.3
Lack of support group 24 18.8
Note: Table includes answers from only Undergraduate Student respondents who indicated that they considered leaving (n = 128).

Top Reasons Why Graduate/Professional Student Respondents Seriously
Considered Leaving UMSL
129
Reason n %
Lack of a sense of belonging 13 23.2
Financial reasons 13 23.2
Lack of social life 9 16.1
Lack of support services 8 14.3
Coursework not challenging enough 8 14.3
Climate was not welcoming 7 12.5
Academic advancement opportunities elsewhere 7 12.5
Lack of support group 7 12.5
Personal reasons 6 10.7
Note: Table includes answers from only Graduate/Professional Student respondents who indicated that they considered
leaving (n = 56).
Qualitative Themes for Student Respondents
Why Considered leaving…
130
Concerns about academics
Community and campus activities
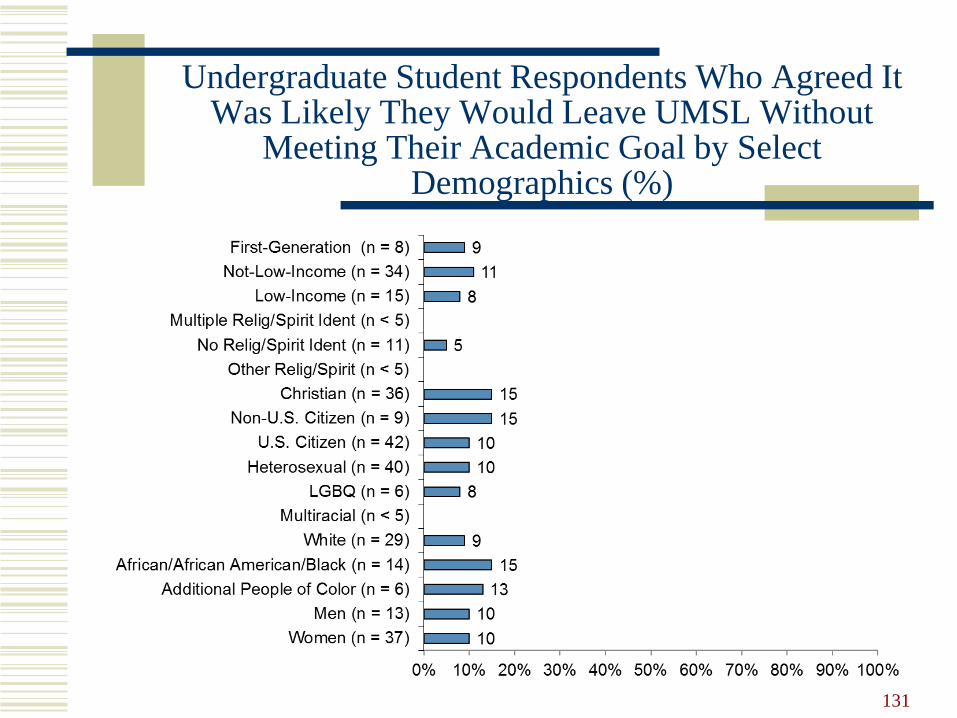
Undergraduate Student Respondents Who Agreed It Was Likely They Would Leave UMSL Without
Meeting Their Academic Goal by Select Demographics (%)
131
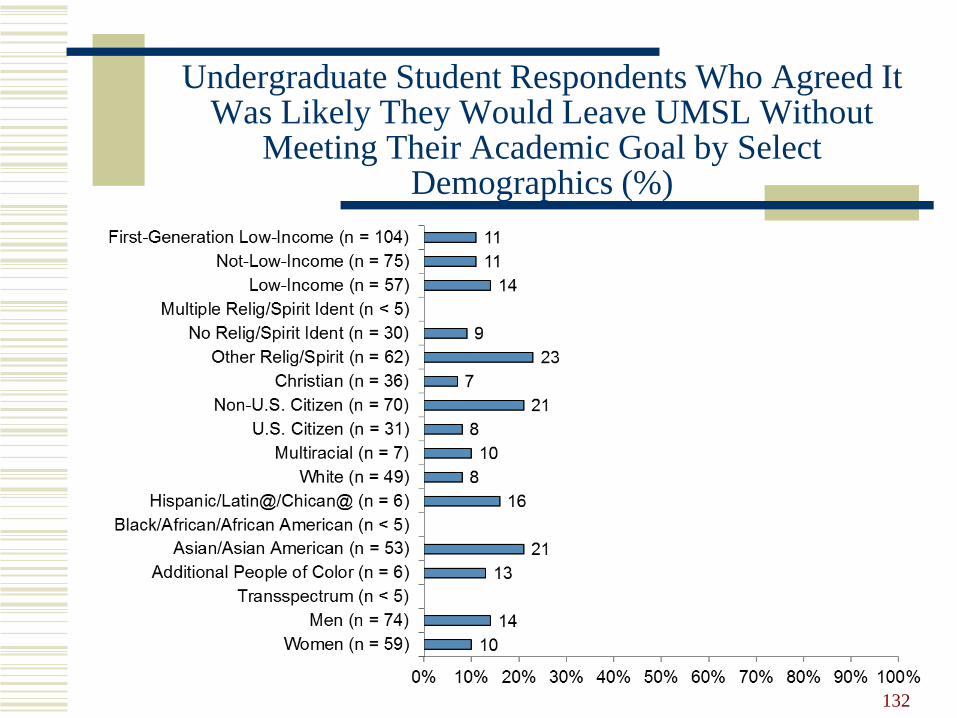
Undergraduate Student Respondents Who Agreed It Was Likely They Would Leave UMSL Without
Meeting Their Academic Goal by Select Demographics (%)
132
Perceptions
133
Respondents who observed conduct or communications directed towards a person/group of people that created an
exclusionary, intimidating, offensive and/or hostile working or learning environment…
134
21% (n = 316)
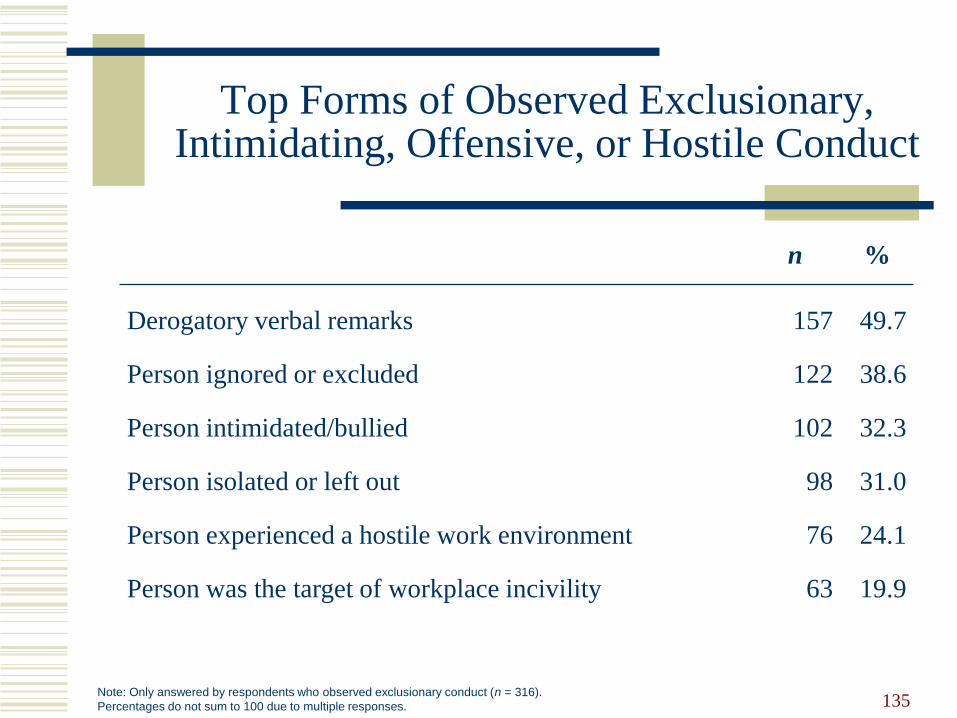
Top Forms of Observed Exclusionary, Intimidating, Offensive, or Hostile Conduct
135
n %
Derogatory verbal remarks 157 49.7
Person ignored or excluded 122 38.6
Person intimidated/bullied 102 32.3
Person isolated or left out 98 31.0
Person experienced a hostile work environment 76 24.1
Person was the target of workplace incivility 63 19.9
Note: Only answered by respondents who observed exclusionary conduct (n = 316).
Percentages do not sum to 100 due to multiple responses.
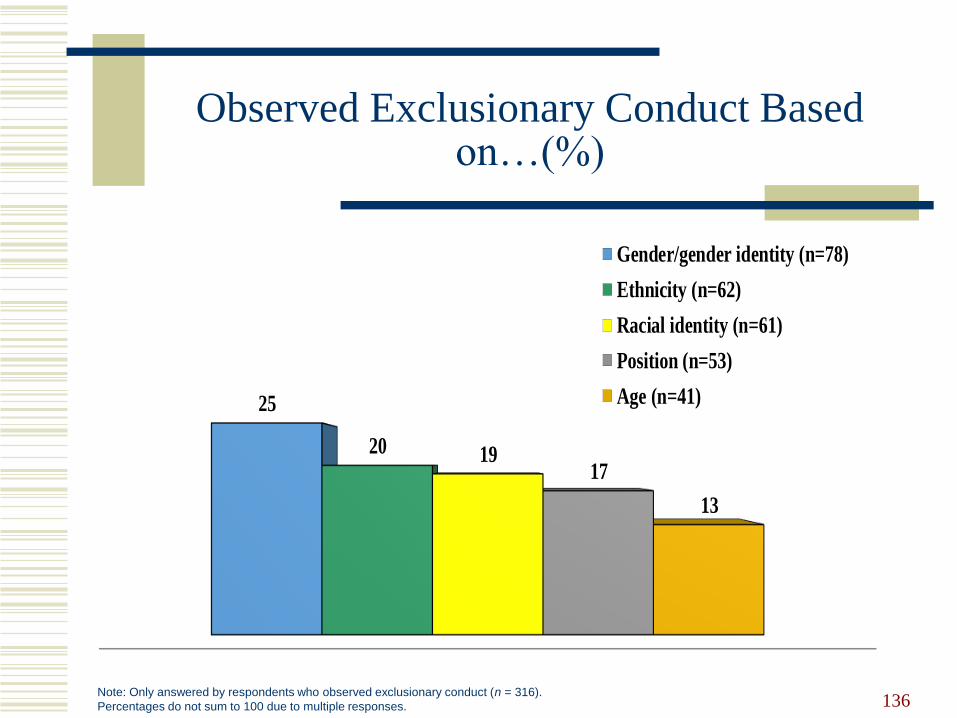
Observed Exclusionary Conduct Based on…(%)
136
25
20 1917
13
Gender/gender identity (n=78)
Ethnicity (n=62)
Racial identity (n=61)
Position (n=53)
Age (n=41)
Note: Only answered by respondents who observed exclusionary conduct (n = 316).
Percentages do not sum to 100 due to multiple responses.
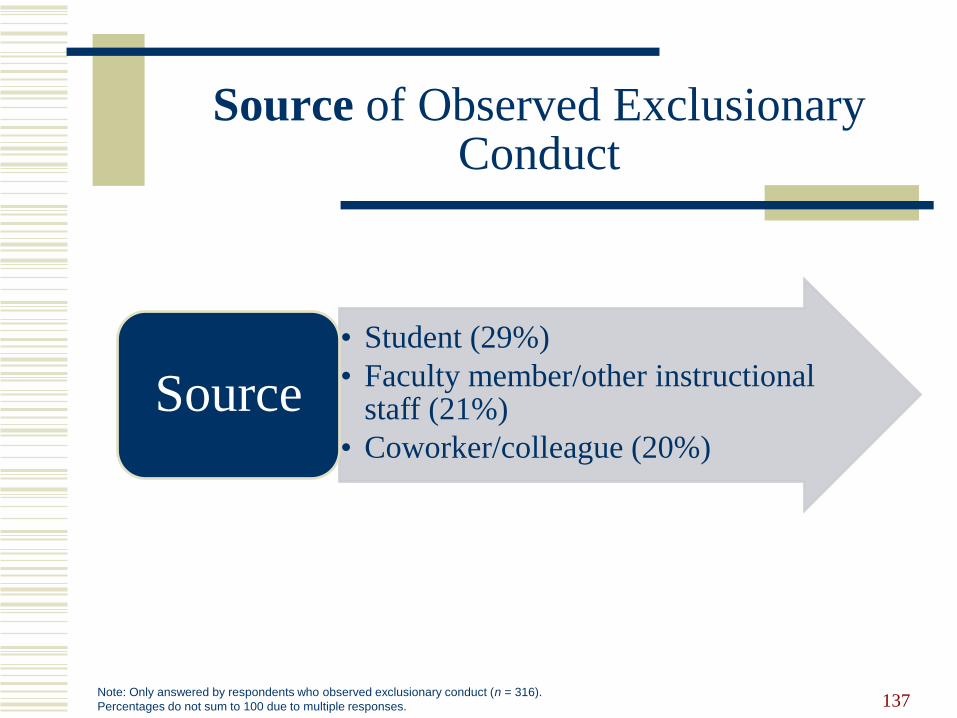
Source of Observed Exclusionary Conduct
137
• Student (29%)
• Faculty member/other instructional staff (21%)
• Coworker/colleague (20%)
Source
Note: Only answered by respondents who observed exclusionary conduct (n = 316).
Percentages do not sum to 100 due to multiple responses.
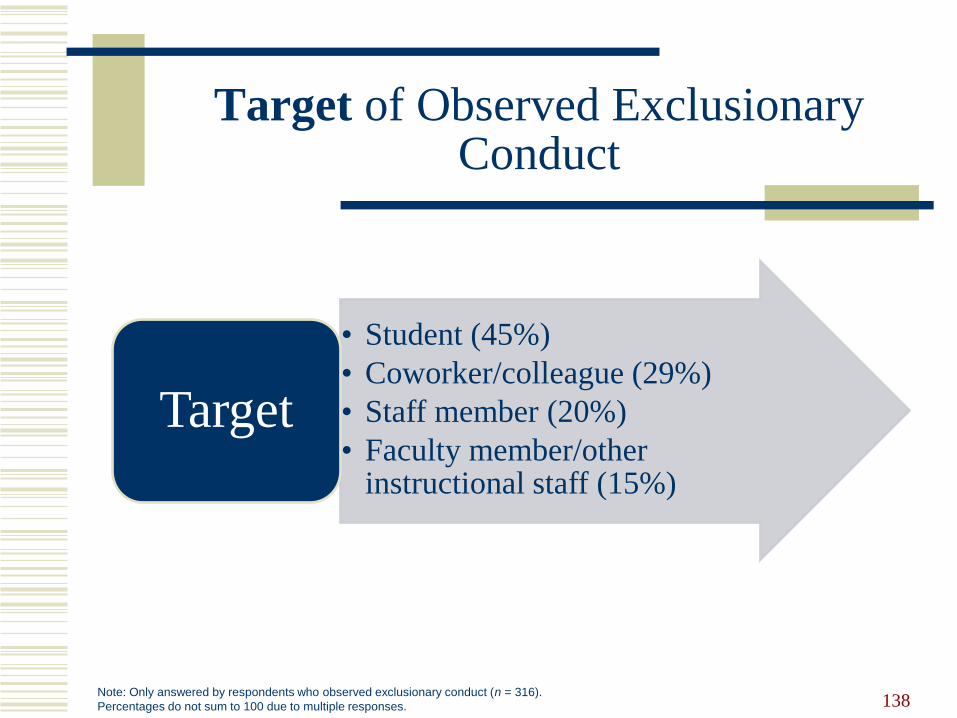
Target of Observed Exclusionary Conduct
138
• Student (45%)
• Coworker/colleague (29%)
• Staff member (20%)
• Faculty member/other instructional staff (15%)
Target
Note: Only answered by respondents who observed exclusionary conduct (n = 316).
Percentages do not sum to 100 due to multiple responses.
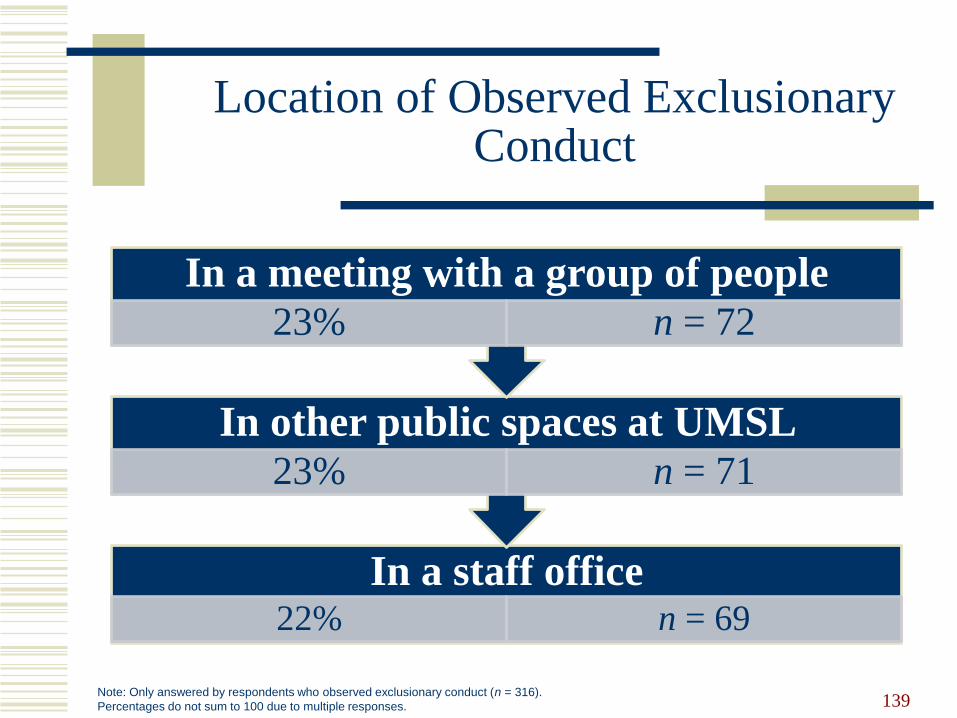
Location of Observed Exclusionary Conduct
139
In a staff office22% n = 69
In other public spaces at UMSL
23% n = 71
In a meeting with a group of people
23% n = 72
Note: Only answered by respondents who observed exclusionary conduct (n = 316).
Percentages do not sum to 100 due to multiple responses.
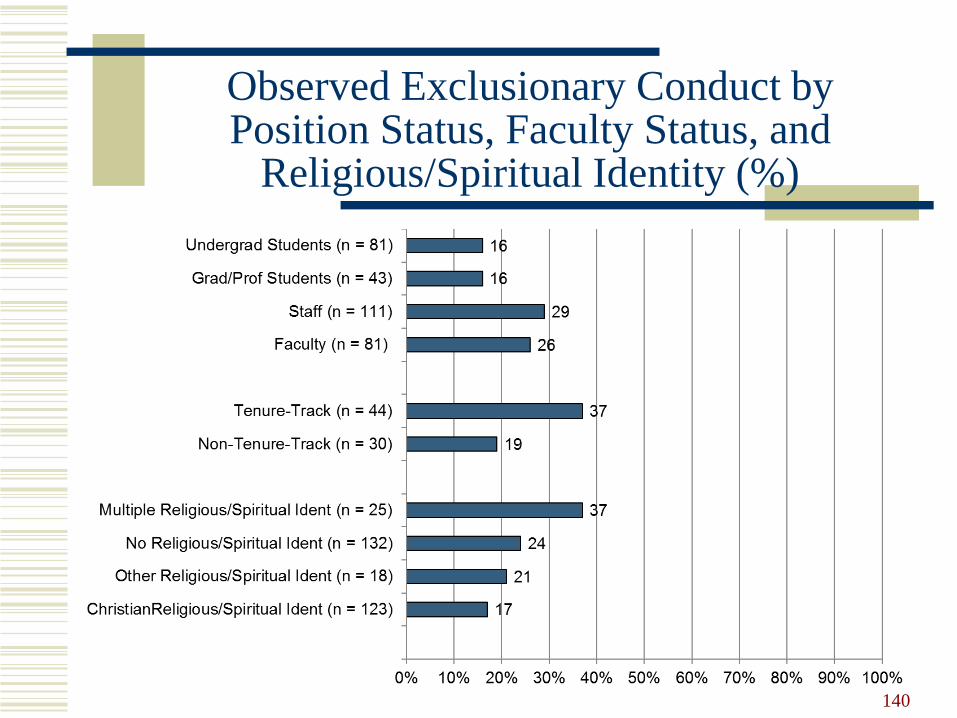
Observed Exclusionary Conduct by Position Status, Faculty Status, and
Religious/Spiritual Identity (%)
140
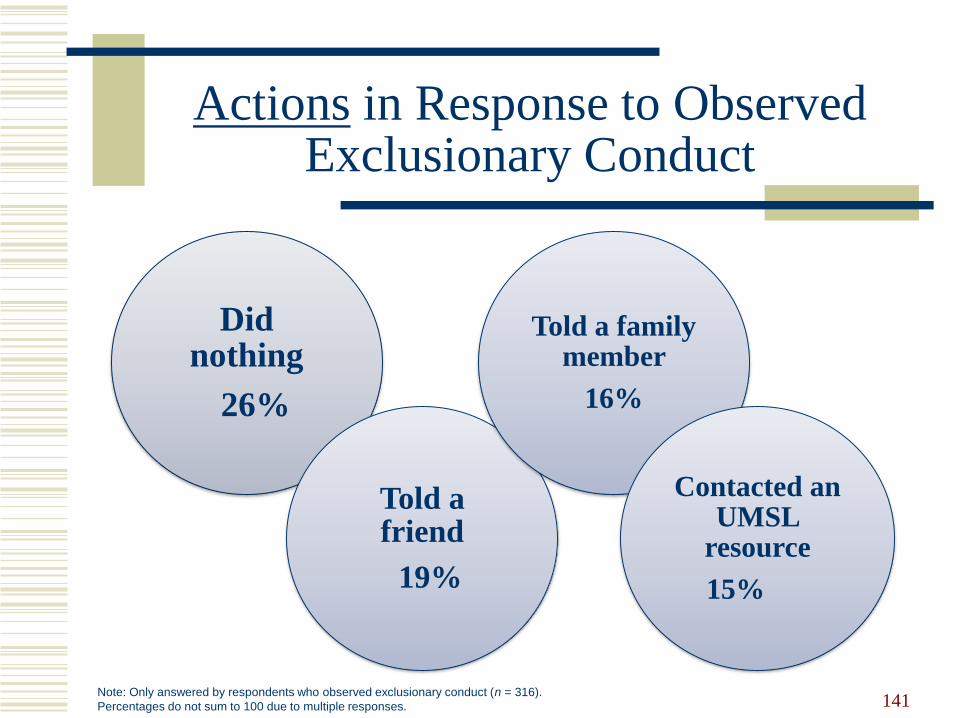
Actions in Response to Observed Exclusionary Conduct
141
Did nothing
26%
Told a friend
19%
Told a family member
16%
Contacted an UMSL
resource
15%
Note: Only answered by respondents who observed exclusionary conduct (n = 316).
Percentages do not sum to 100 due to multiple responses.
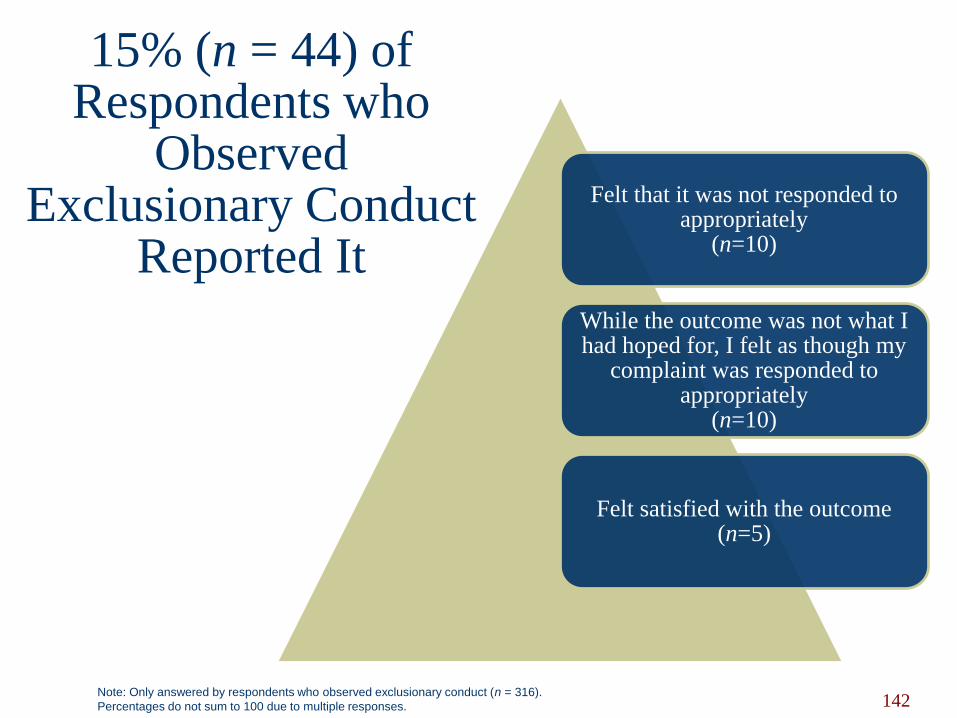
15% (n = 44) of Respondents who
Observed Exclusionary Conduct
Reported It
142
Felt that it was not responded to appropriately
(n=10)
While the outcome was not what I had hoped for, I felt as though my
complaint was responded to appropriately
(n=10)
Felt satisfied with the outcome (n=5)
Note: Only answered by respondents who observed exclusionary conduct (n = 316).
Percentages do not sum to 100 due to multiple responses.
Qualitative Themes
Observed Exclusionary Conduct
143
Conduct based on race and religion
Bullying and harassment
Employee Perceptions
144
145
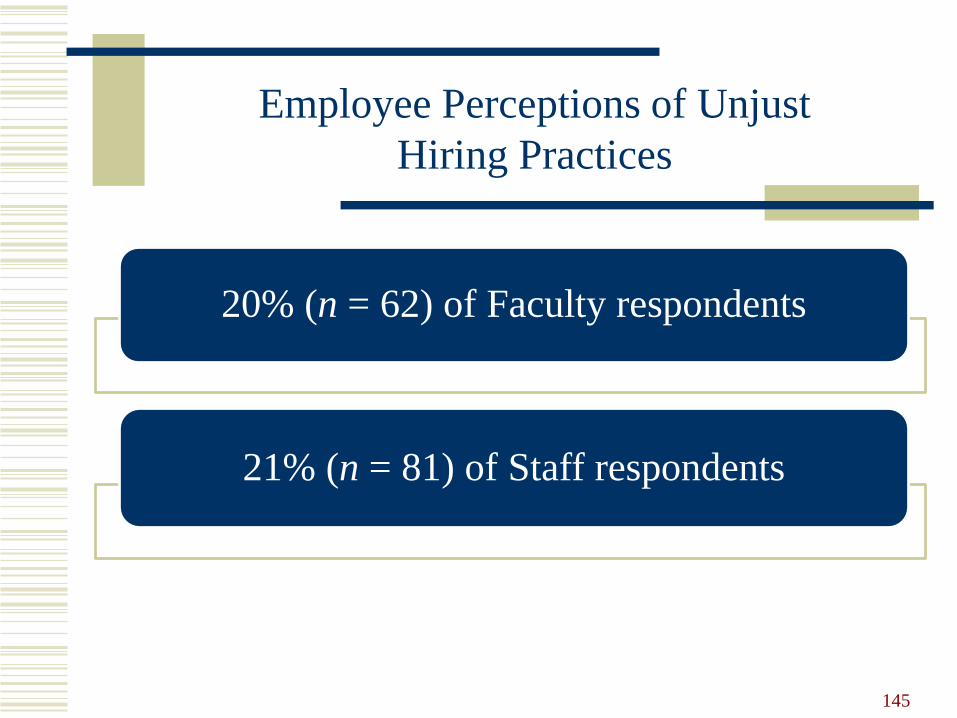
Employee Perceptions of Unjust
Hiring Practices
20% (n = 62) of Faculty respondents
21% (n = 81) of Staff respondents
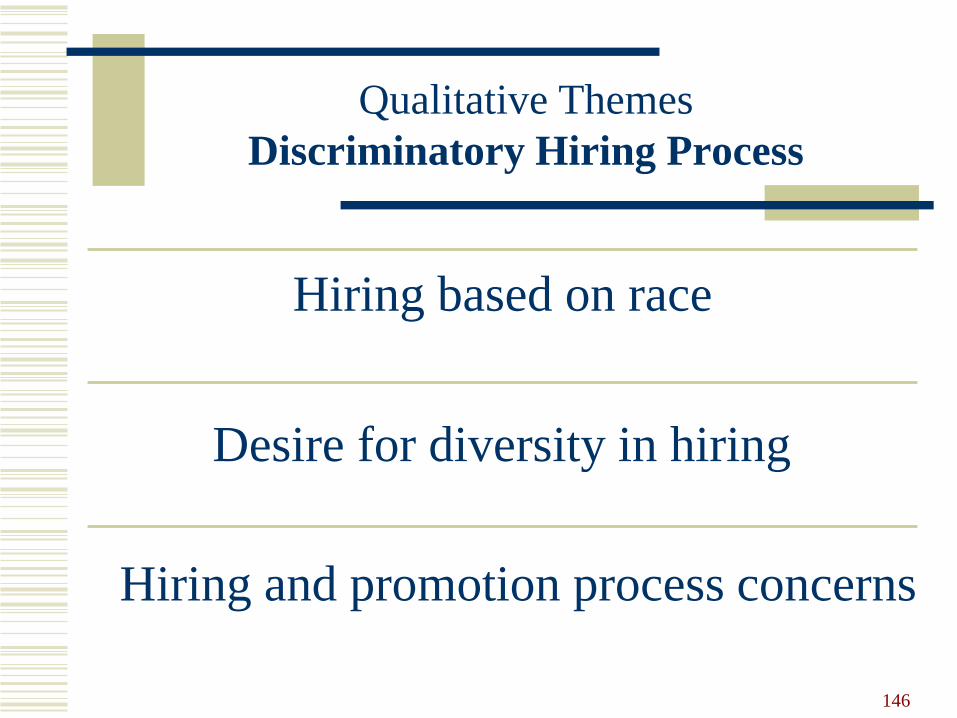
Qualitative Themes
Discriminatory Hiring Process
Hiring based on race
Desire for diversity in hiring
146
Hiring and promotion process concerns

147
Employee Perceptions of Unjust Employment-Related Disciplinary Actions
14% (n = 44) of Faculty respondents
16% (n = 60) of Staff respondents
Qualitative Themes
Discriminatory Employment-Related
Disciplinary Actions
148
Specific incidents of discriminatory behavior
149
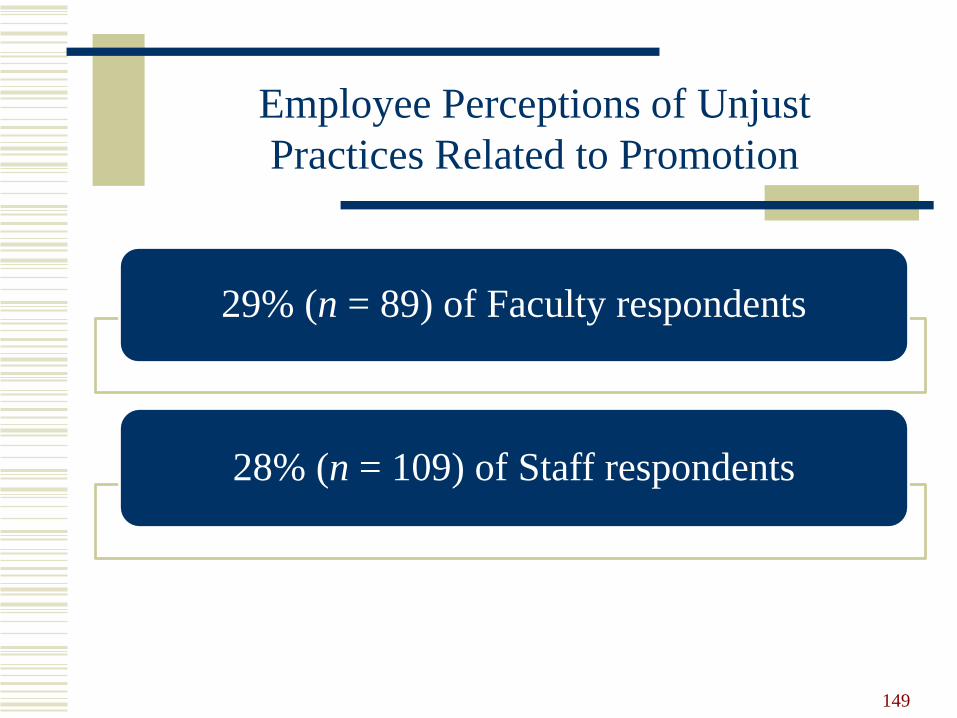
Employee Perceptions of Unjust
Practices Related to Promotion
29% (n = 89) of Faculty respondents
28% (n = 109) of Staff respondents

Qualitative Themes
Discriminatory Practices Related to
Promotion
150
Favoritism
Race and gender
Promotion
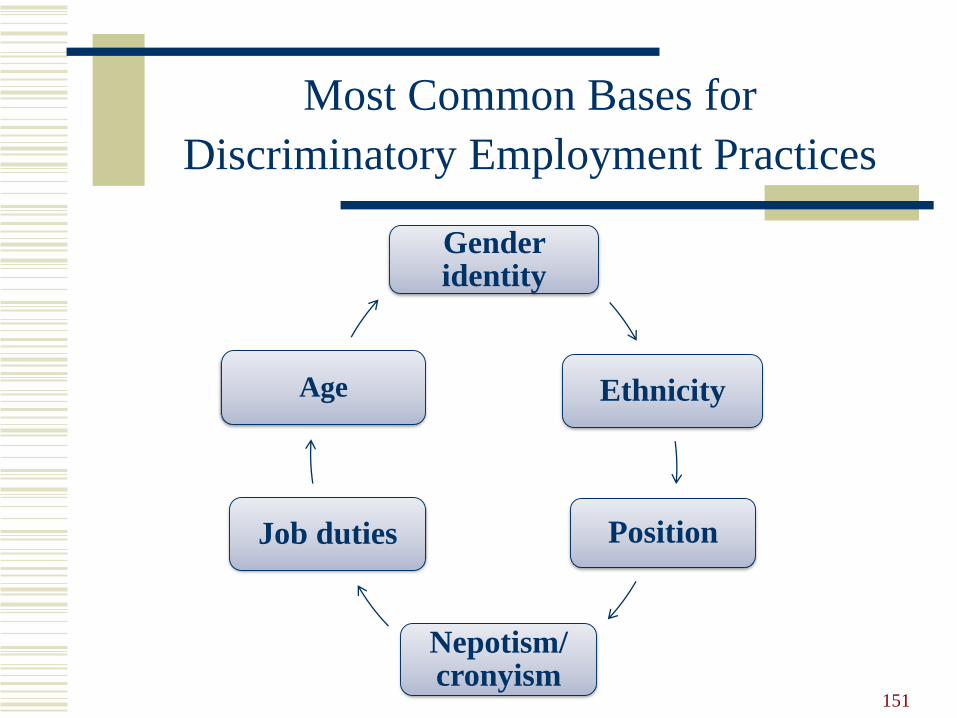
Most Common Bases for
Discriminatory Employment Practices
Gender identity
Ethnicity
Position
Nepotism/ cronyism
Job duties
Age
151
Work-Life IssuesSUCCESSES & CHALLENGES
The majority of employee respondents expressed
positive views of campus climate.
152
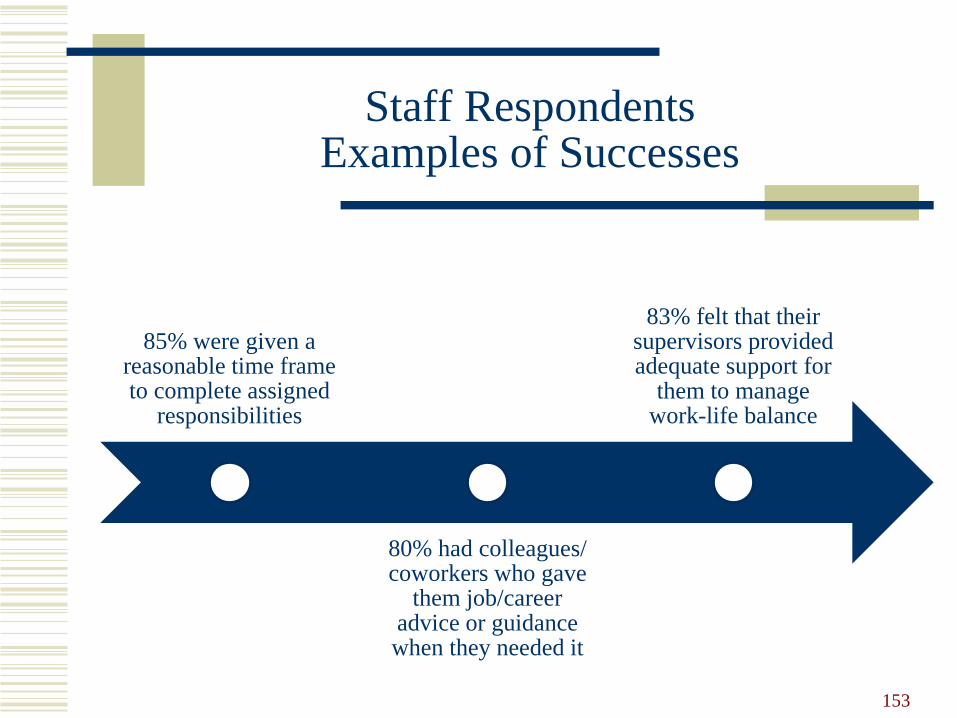
Staff RespondentsExamples of Successes
85% were given a reasonable time frame to complete assigned
responsibilities
80% had colleagues/ coworkers who gave
them job/career advice or guidance when they needed it
83% felt that their supervisors provided adequate support for
them to manage work-life balance
153
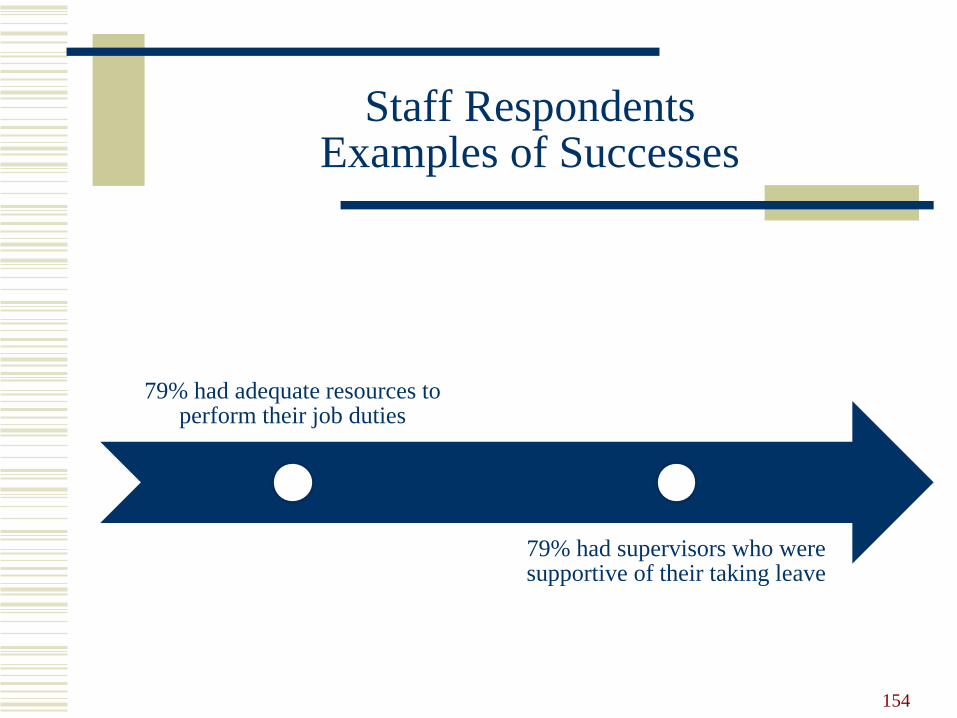
Staff RespondentsExamples of Successes
79% had adequate resources to perform their job duties
79% had supervisors who were supportive of their taking leave
154

Staff RespondentsExamples of Successes
Majority felt valued by coworkers in their department (82%), coworkers outside their
department (74%), and their supervisors/managers (76%)
155
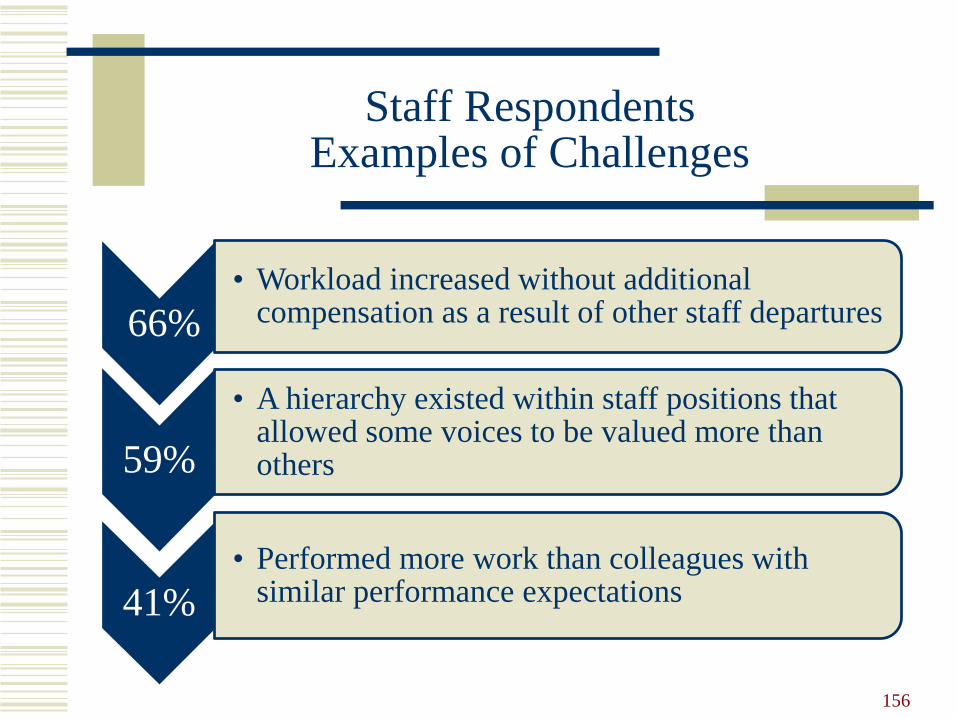
Staff RespondentsExamples of Challenges
156
66%
• Workload increased without additional compensation as a result of other staff departures
59%
• A hierarchy existed within staff positions that allowed some voices to be valued more than others
41%
• Performed more work than colleagues with similar performance expectations
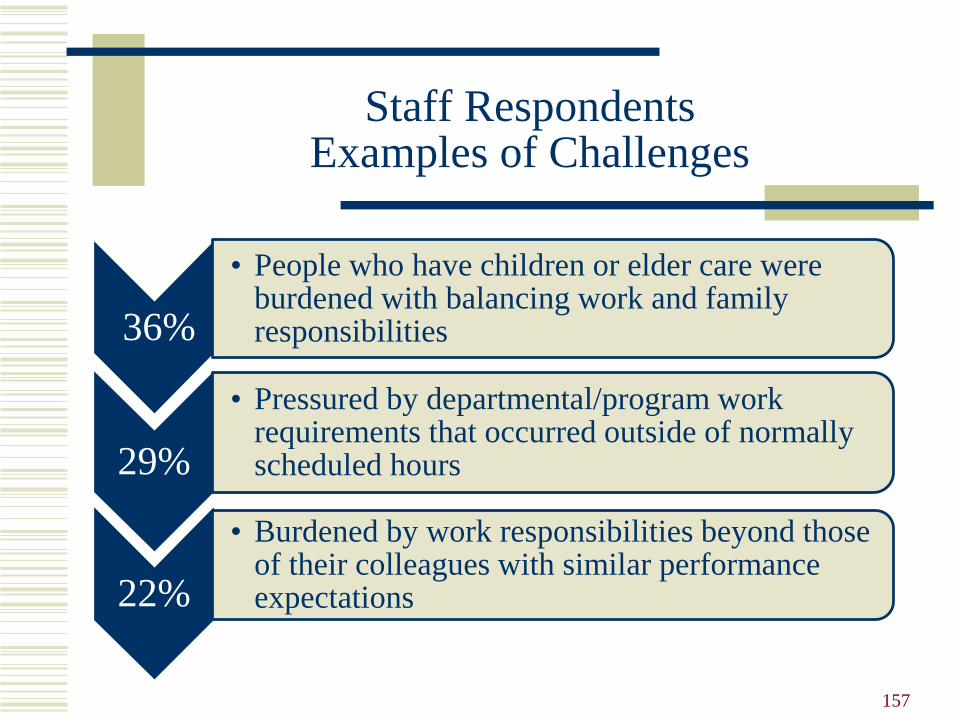
Staff Respondents Examples of Challenges
157
36%
• People who have children or elder care were burdened with balancing work and family responsibilities
29%
• Pressured by departmental/program work requirements that occurred outside of normally scheduled hours
22%
• Burdened by work responsibilities beyond those of their colleagues with similar performance expectations

Staff RespondentsExamples of Challenges
158
20%• Staff salaries were competitive
23%• Staff opinions were valued by UMSL faculty
30%
• Felt positive about their career opportunities at UMSL
Qualitative Themes
Staff Respondents
Work-Life Attitudes
159
Career enhancement
Workload
Performance reviews
Qualitative Themes
Staff/Administrator without Faculty Rank Respondents
Professional Development, Leave, Flexible Work
Schedule, Salary, Benefits
160
Job security
Career advancement/professional development
Salary and benefits
Qualitative Themes
Staff/Administrator without Faculty Rank Respondents
Sense of Value
161
Not addressing needs of at-risk/underserved students
Respect and value for staff overall
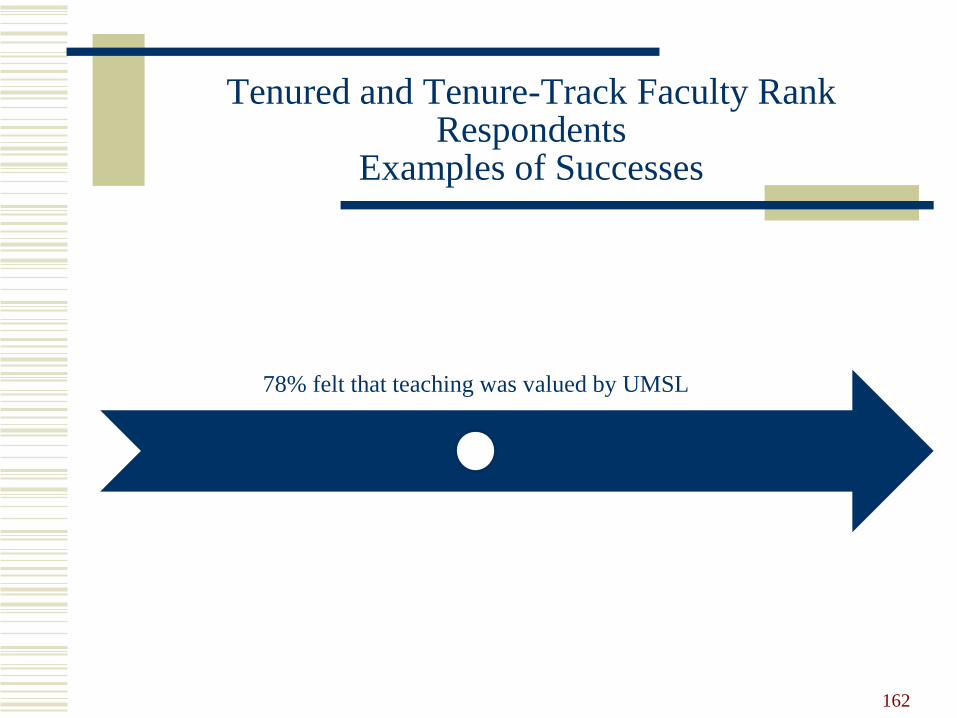
Tenured and Tenure-Track Faculty Rank Respondents
Examples of Successes
162
78% felt that teaching was valued by UMSL
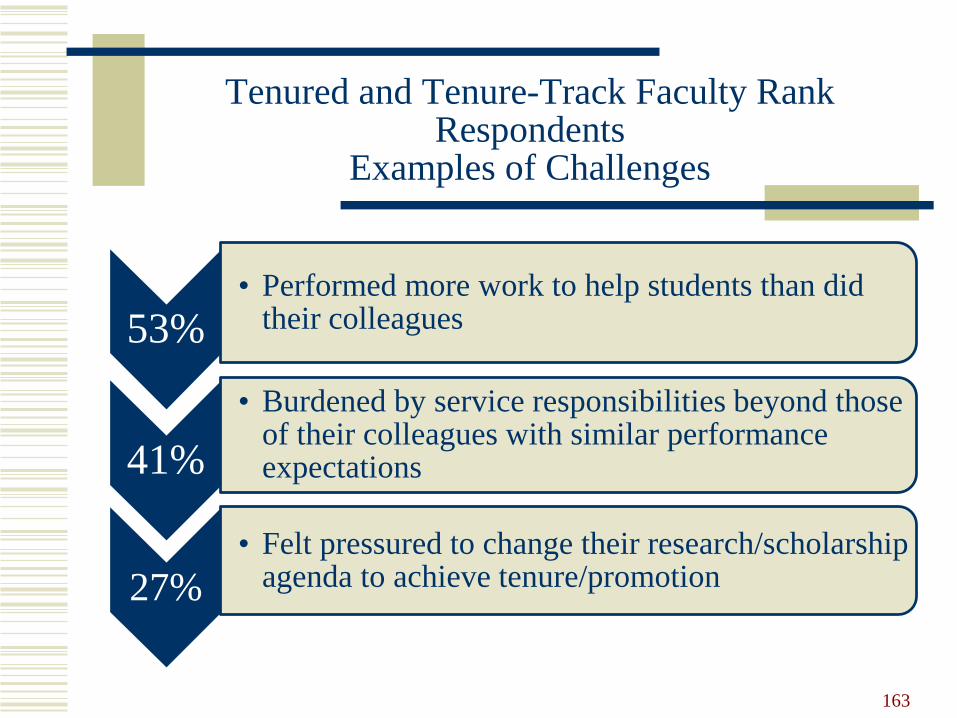
Tenured and Tenure-Track Faculty Rank Respondents
Examples of Challenges
163
53%• Performed more work to help students than did
their colleagues
41%
• Burdened by service responsibilities beyond those of their colleagues with similar performance expectations
27%
• Felt pressured to change their research/scholarship agenda to achieve tenure/promotion
Qualitative Themes Tenured and Tenure-Track Faculty Rank Respondents
Work-Life Attitudes
Shared governance concerns
Tenure process concerns
164

Non-Tenure-Track Faculty RespondentsExamples of Successes
165
Majority felt that research (86%), teaching (83%), and service (79%) were valued by UMSL
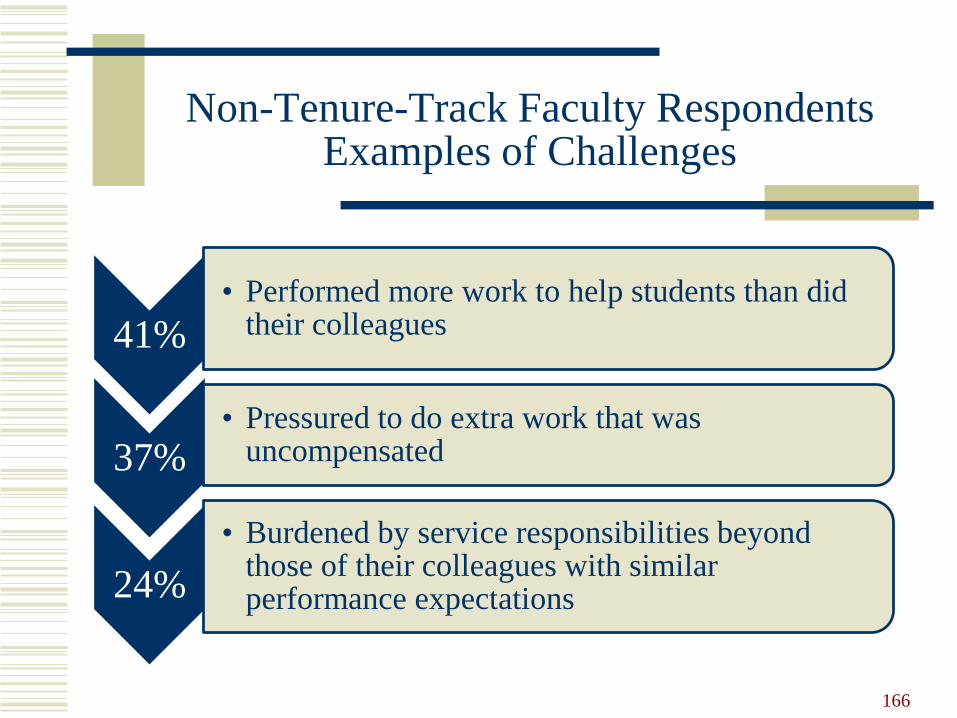
Non-Tenure-Track Faculty RespondentsExamples of Challenges
166
41%
• Performed more work to help students than did their colleagues
37%• Pressured to do extra work that was
uncompensated
24%
• Burdened by service responsibilities beyond those of their colleagues with similar performance expectations
Qualitative Themes
Non-Tenure-Track Faculty Respondents
Work-Life Attitudes
167
Job security
Workload and uncompensated service
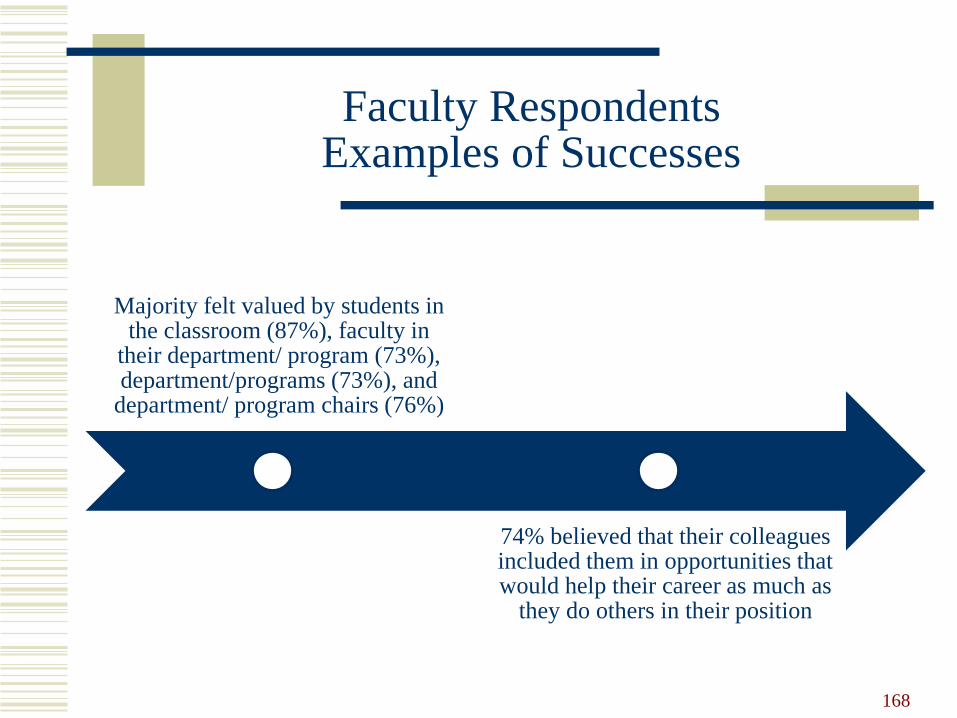
Faculty RespondentsExamples of Successes
Majority felt valued by students in the classroom (87%), faculty in
their department/ program (73%), department/programs (73%), and
department/ program chairs (76%)
74% believed that their colleagues included them in opportunities that would help their career as much as
they do others in their position
168
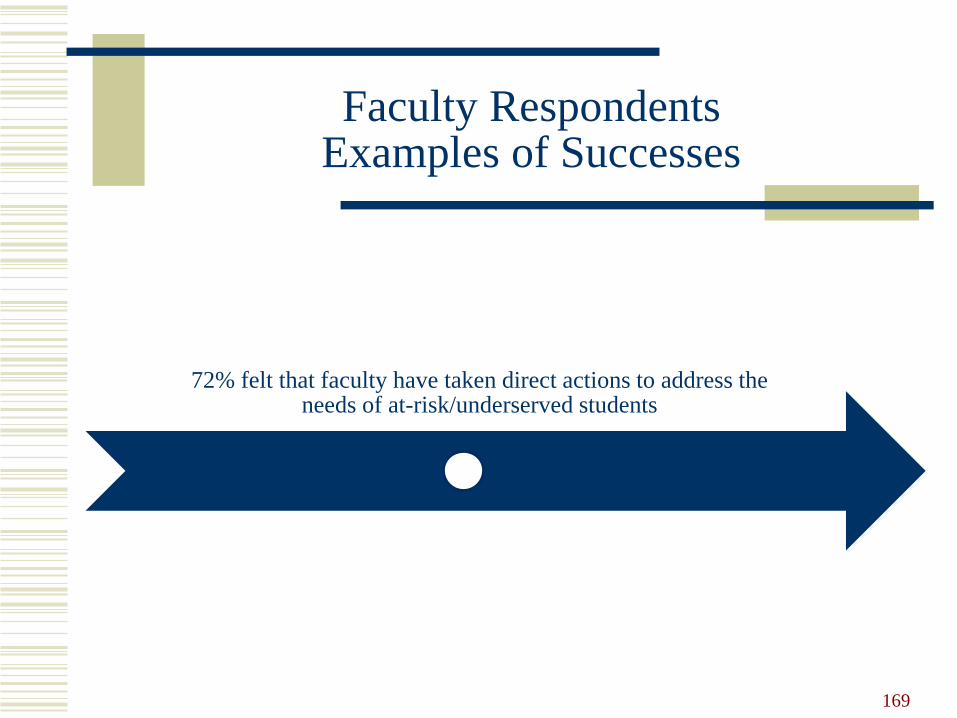
Faculty RespondentsExamples of Successes
72% felt that faculty have taken direct actions to address the needs of at-risk/underserved students
169
170
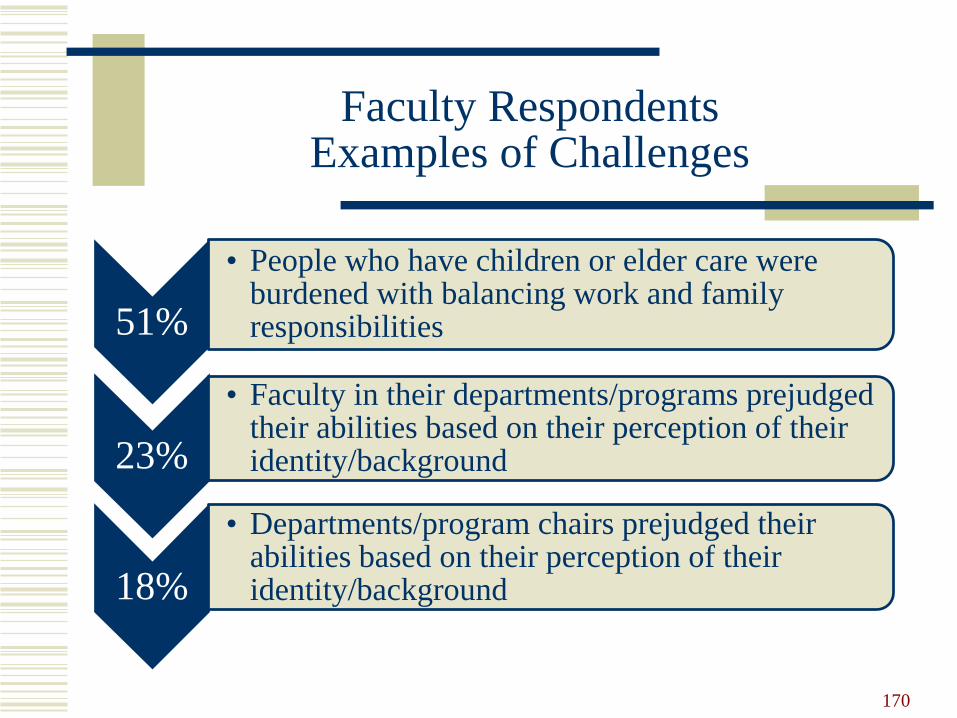
51%
• People who have children or elder care were burdened with balancing work and family responsibilities
23%
• Faculty in their departments/programs prejudged their abilities based on their perception of their identity/background
18%
• Departments/program chairs prejudged their abilities based on their perception of their identity/background
Faculty RespondentsExamples of Challenges
Qualitative Themes
Faculty Respondents
Work-Life Attitudes
Leadership and shared governance
171
Student Respondents’ Perceptions
172

Student Respondents’ Perceptions of Campus Climate
173
51% felt valued by UMSL senior administrators
Majority felt valued by UMSL faculty in the classroom (80%), other students in the classroom (74%), and less by
students outside of the classroom (63%)
Many felt valued by UMSL faculty (78%)
and staff (72%)

Student Respondents’ Perceptions of Campus Climate
174
70% felt that campus climate encourages free and open discussion of difficult topics
One-quarter felt faculty (27%) and staff (25%) pre-judged their abilities based on their perception of their
identities/backgrounds
Many had faculty (74%) but less had other students (64%), or staff (55%) whom they perceived as role models
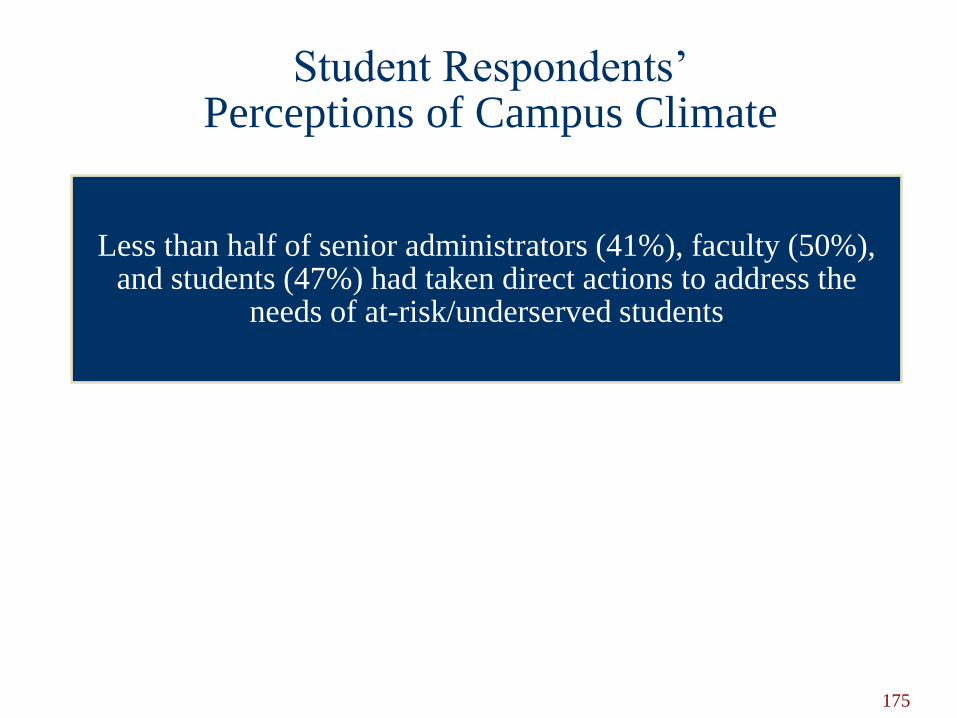
Student Respondents’ Perceptions of Campus Climate
175
Less than half of senior administrators (41%), faculty (50%), and students (47%) had taken direct actions to address the
needs of at-risk/underserved students
Qualitative Themes
Student Respondents
Sense of Value
Leadership concerns
176
Opportunities for community engagement
Graduate Student Respondents’ Views on Advising and Departmental Support
177
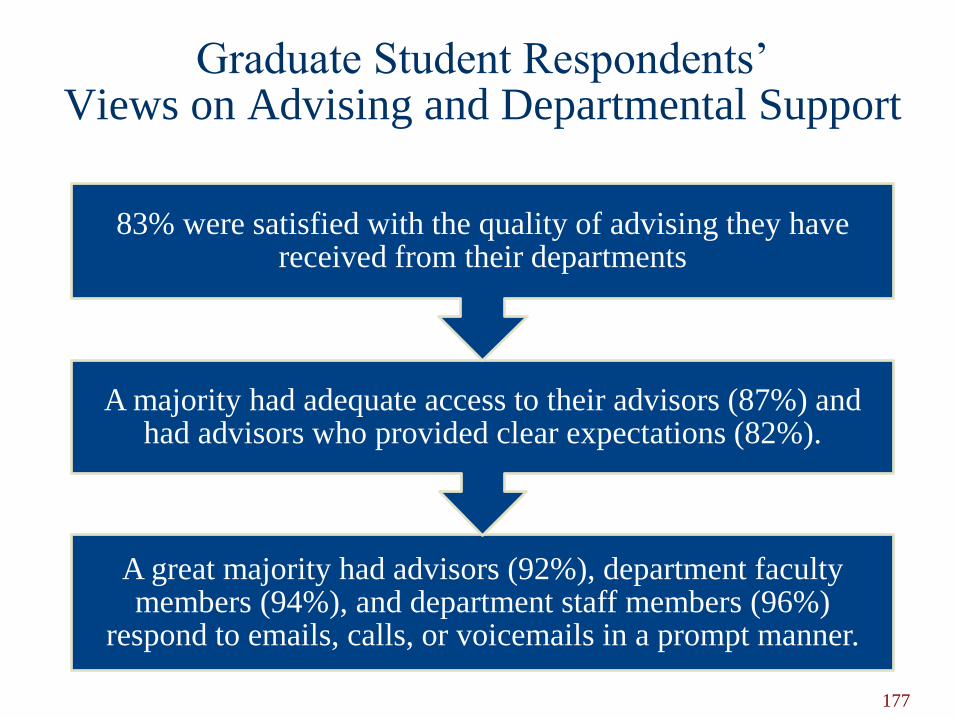
A great majority had advisors (92%), department faculty members (94%), and department staff members (96%)
respond to emails, calls, or voicemails in a prompt manner.
A majority had adequate access to their advisors (87%) and had advisors who provided clear expectations (82%).
83% were satisfied with the quality of advising they have received from their departments
Graduate Student Respondents’ Views on Advising and Departmental Support
178
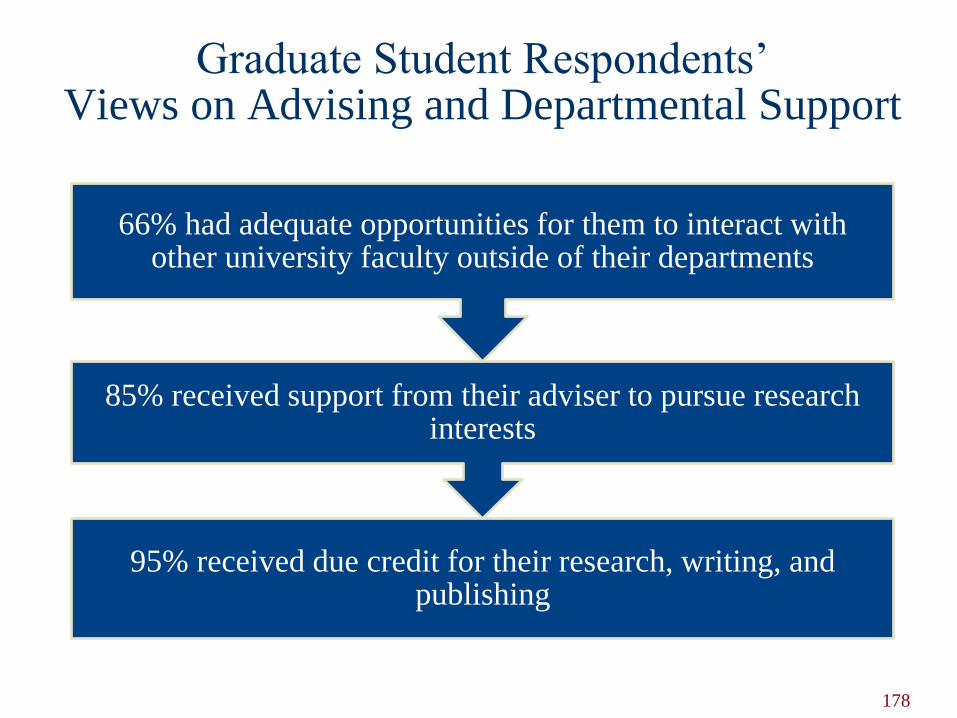
95% received due credit for their research, writing, and publishing
85% received support from their adviser to pursue research interests
66% had adequate opportunities for them to interact with other university faculty outside of their departments
Graduate Student Respondents’ Views on Advising and Departmental Support
179
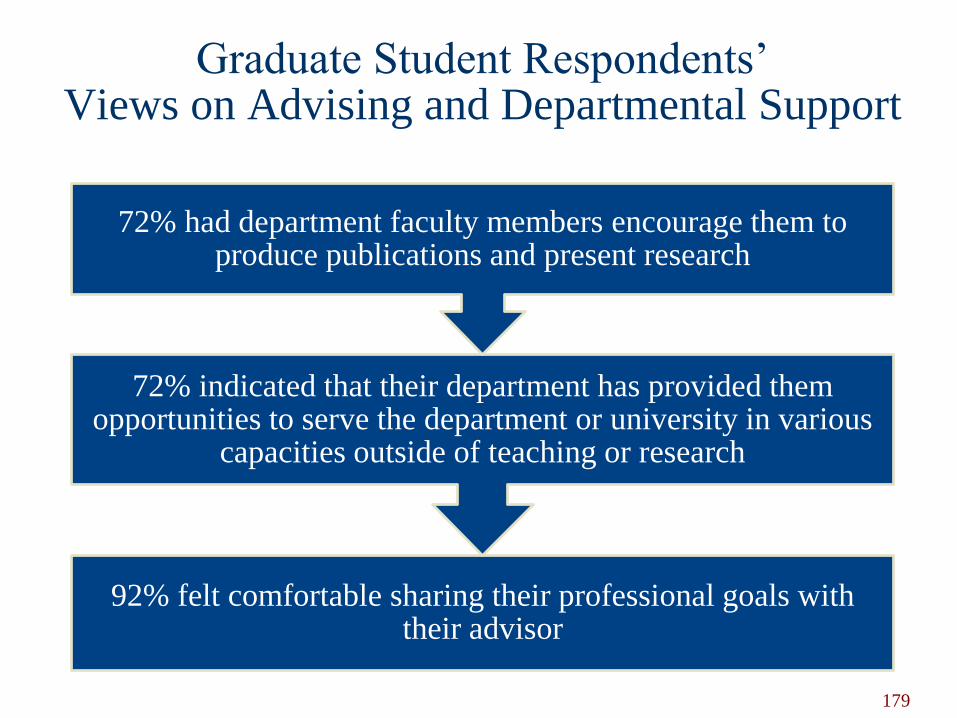
92% felt comfortable sharing their professional goals with their advisor
72% indicated that their department has provided them opportunities to serve the department or university in various
capacities outside of teaching or research
72% had department faculty members encourage them to produce publications and present research
Qualitative Themes
Graduate Student Respondents
Experiences with Faculty, Advising, Teaching, and Research
Advising concerns
180
Valuable experience overall
Institutional Actions
181
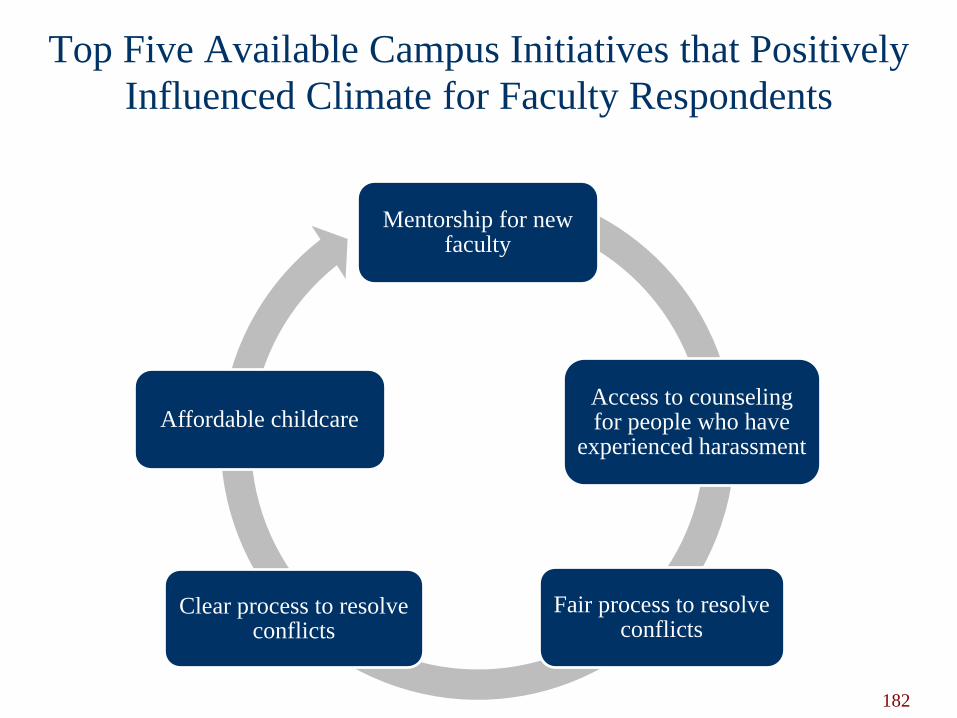
Top Five Available Campus Initiatives that Positively
Influenced Climate for Faculty Respondents
182
Mentorship for new faculty
Access to counseling for people who have
experienced harassment
Fair process to resolve conflicts
Clear process to resolve conflicts
Affordable childcare
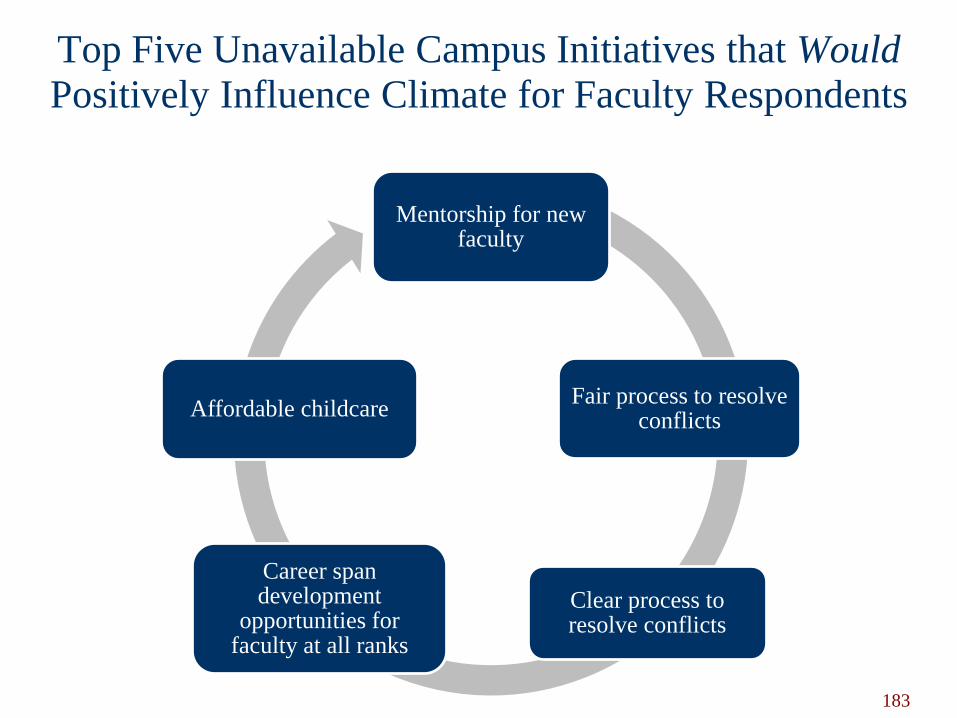
Top Five Unavailable Campus Initiatives that Would Positively Influence Climate for Faculty Respondents
183
Mentorship for new faculty
Fair process to resolve conflicts
Clear process to resolve conflicts
Career span development
opportunities for faculty at all ranks
Affordable childcare
Qualitative Themes
Campus Initiatives – Faculty Respondents
184
Mandatory training initiatives
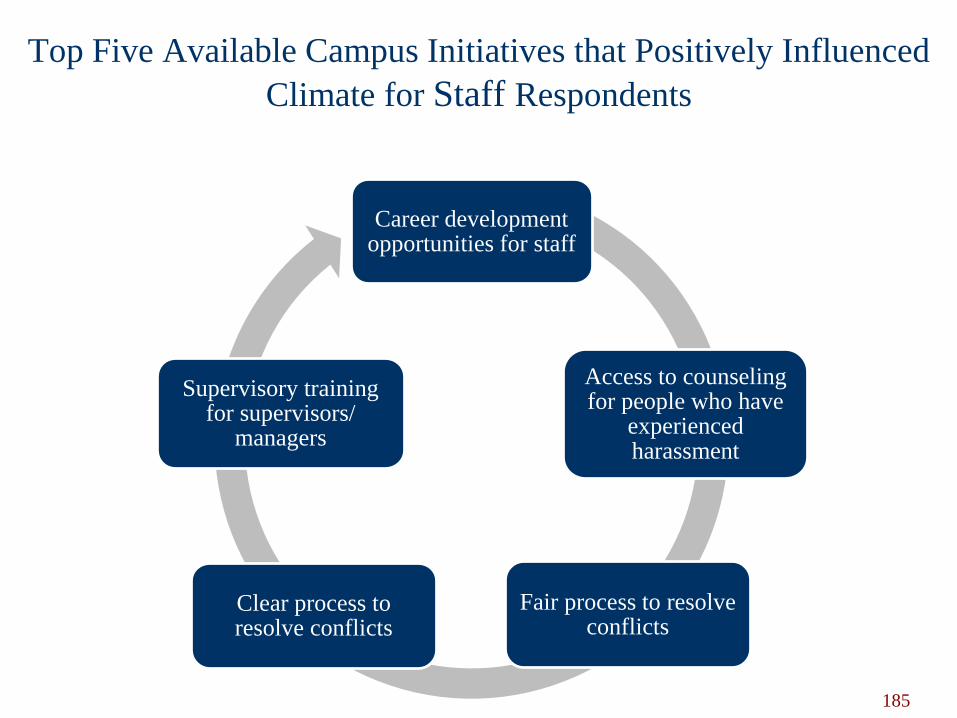
Top Five Available Campus Initiatives that Positively Influenced
Climate for Staff Respondents
185
Career development opportunities for staff
Access to counseling for people who have
experienced harassment
Fair process to resolve conflicts
Clear process to resolve conflicts
Supervisory training for supervisors/
managers
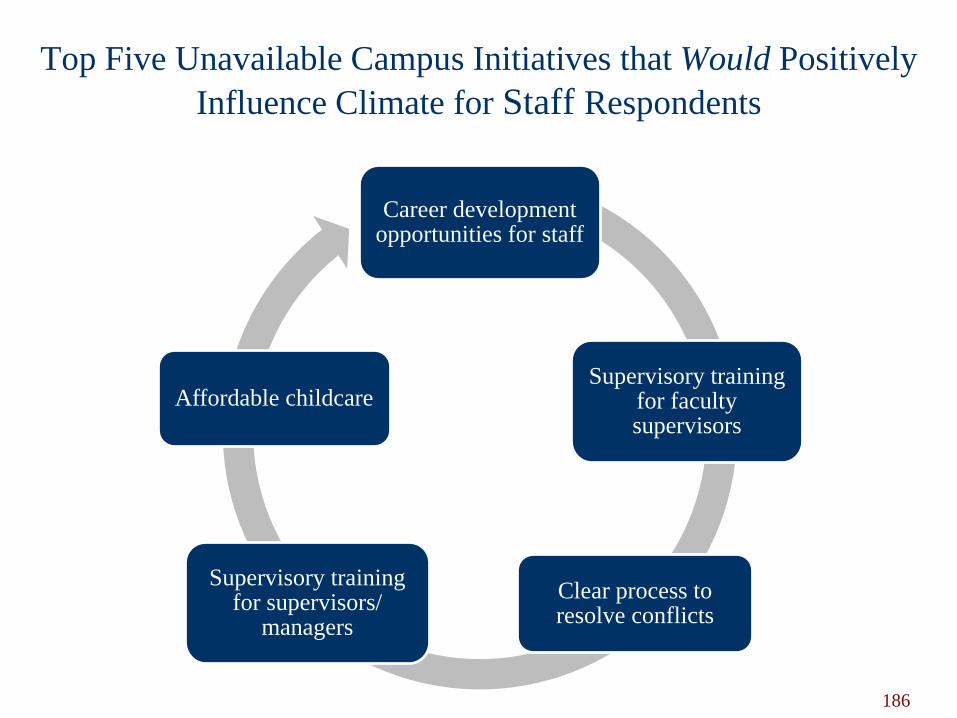
Top Five Unavailable Campus Initiatives that Would Positively
Influence Climate for Staff Respondents
186
Career development opportunities for staff
Supervisory training for faculty supervisors
Clear process to resolve conflicts
Supervisory training for supervisors/
managers
Affordable childcare
Qualitative Themes
Campus Initiatives – Staff Respondents
187
Diversity and inclusion concerns
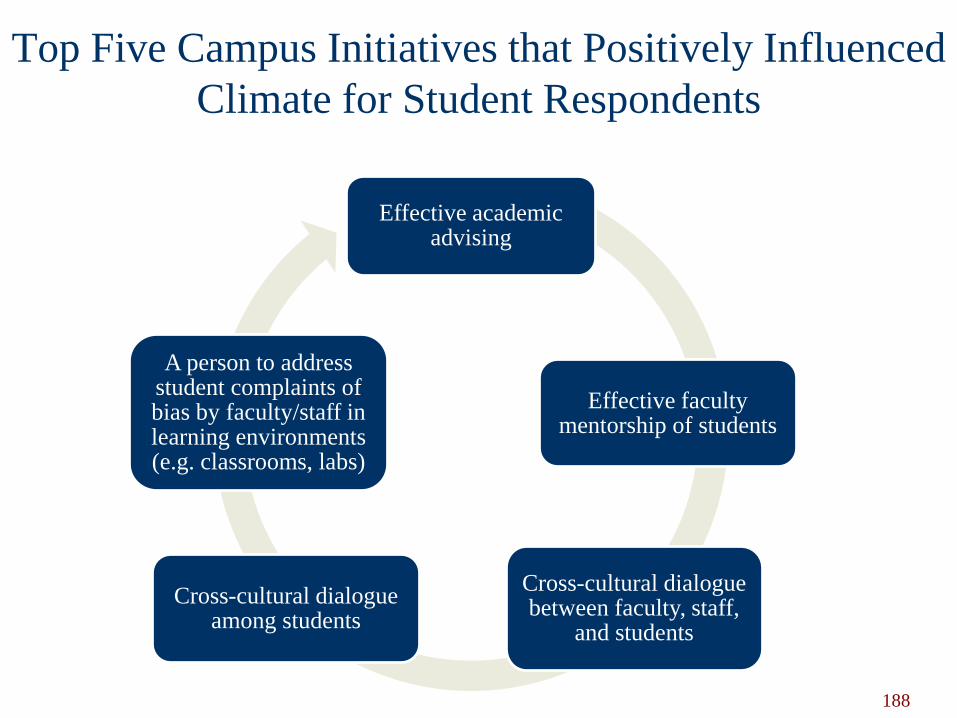
188
Effective academic advising
Effective faculty mentorship of students
Cross-cultural dialogue between faculty, staff,
and students
Cross-cultural dialogue among students
A person to address student complaints of bias by faculty/staff in learning environments (e.g. classrooms, labs)
Top Five Campus Initiatives that Positively Influenced
Climate for Student Respondents
189
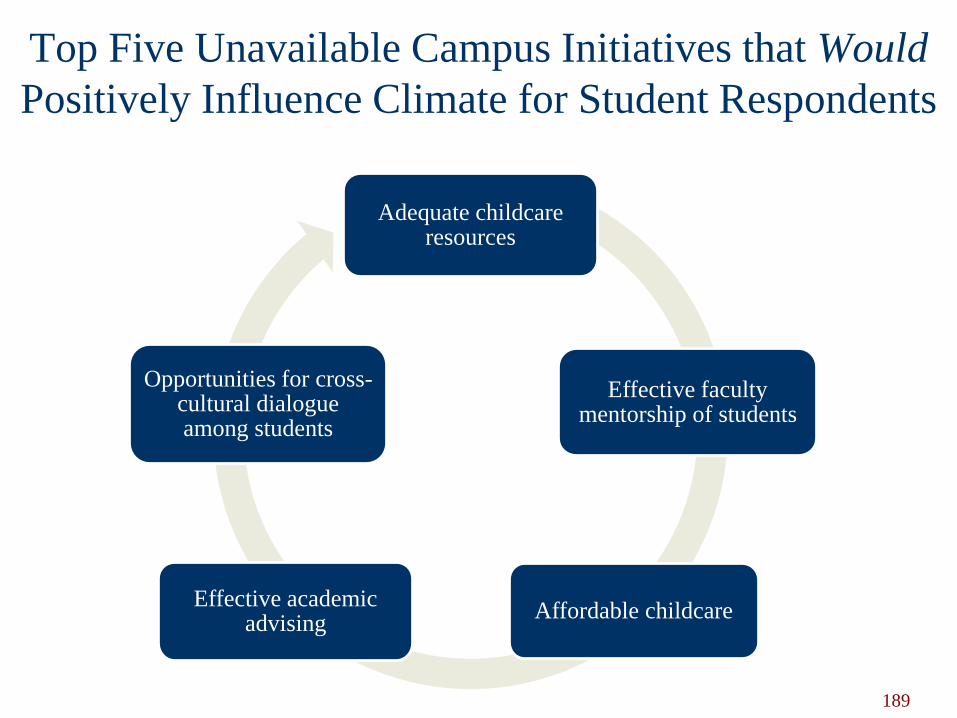
Top Five Unavailable Campus Initiatives that Would
Positively Influence Climate for Student Respondents
Adequate childcare resources
Effective faculty mentorship of students
Affordable childcareEffective academic
advising
Opportunities for cross-cultural dialogue among students
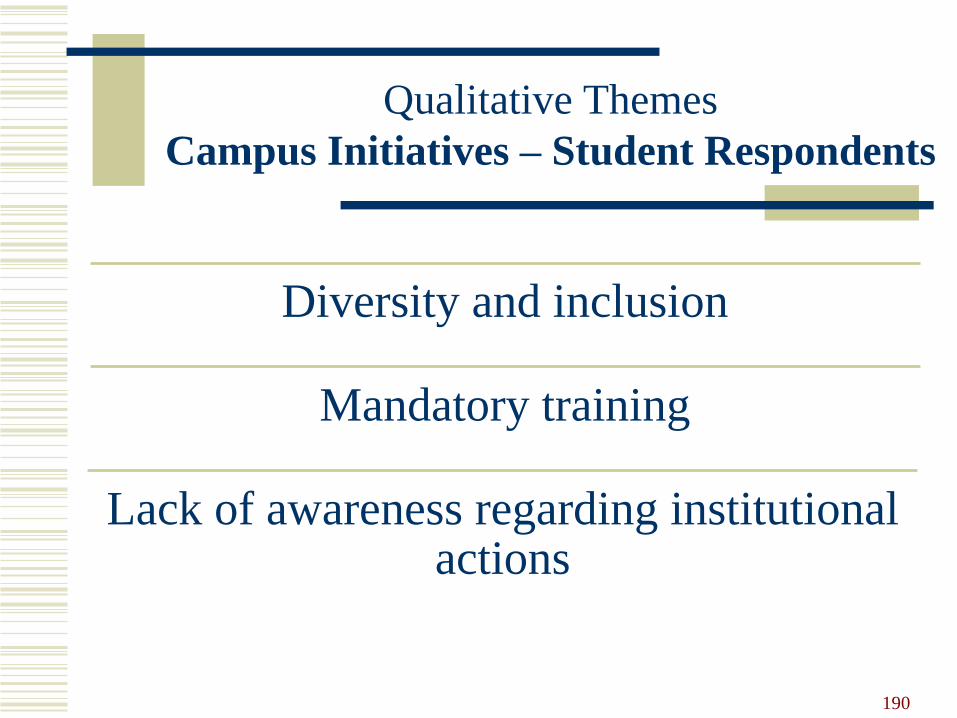
Qualitative Themes
Campus Initiatives – Student Respondents
Diversity and inclusion
190
Mandatory training
Lack of awareness regarding institutional actions
Summary
Strengths and Successes
Opportunities for Improvement
191
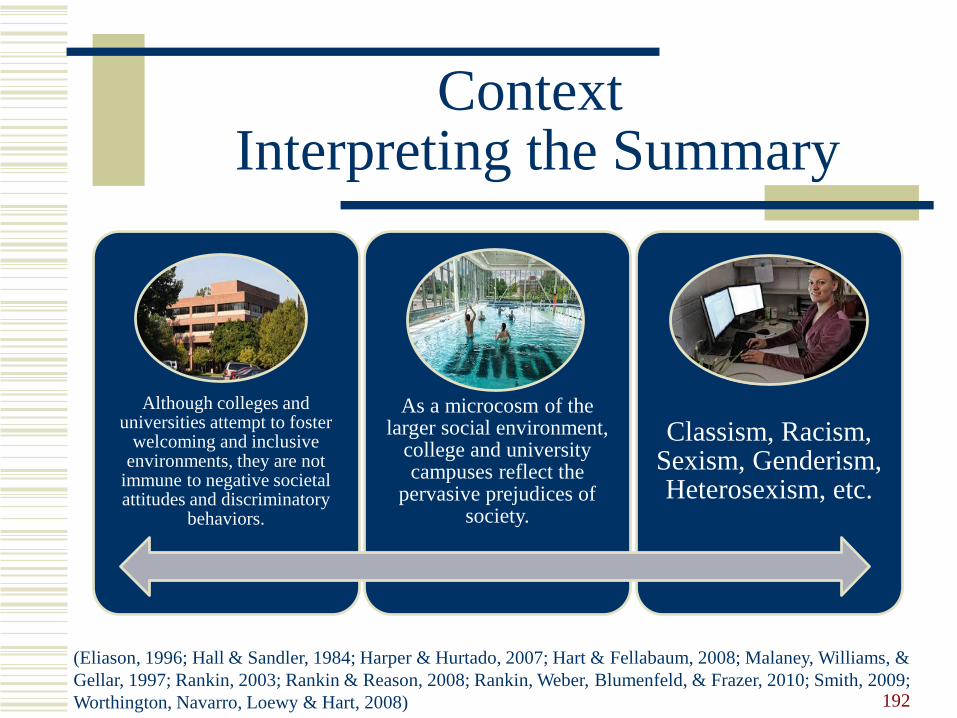
Context Interpreting the Summary
Although colleges and universities attempt to foster
welcoming and inclusive environments, they are not
immune to negative societal attitudes and discriminatory
behaviors.
As a microcosm of the larger social environment,
college and university campuses reflect the
pervasive prejudices of society.
Classism, Racism, Sexism, Genderism, Heterosexism, etc.
192
(Eliason, 1996; Hall & Sandler, 1984; Harper & Hurtado, 2007; Hart & Fellabaum, 2008; Malaney, Williams, &
Gellar, 1997; Rankin, 2003; Rankin & Reason, 2008; Rankin, Weber, Blumenfeld, & Frazer, 2010; Smith, 2009;
Worthington, Navarro, Loewy & Hart, 2008)
193
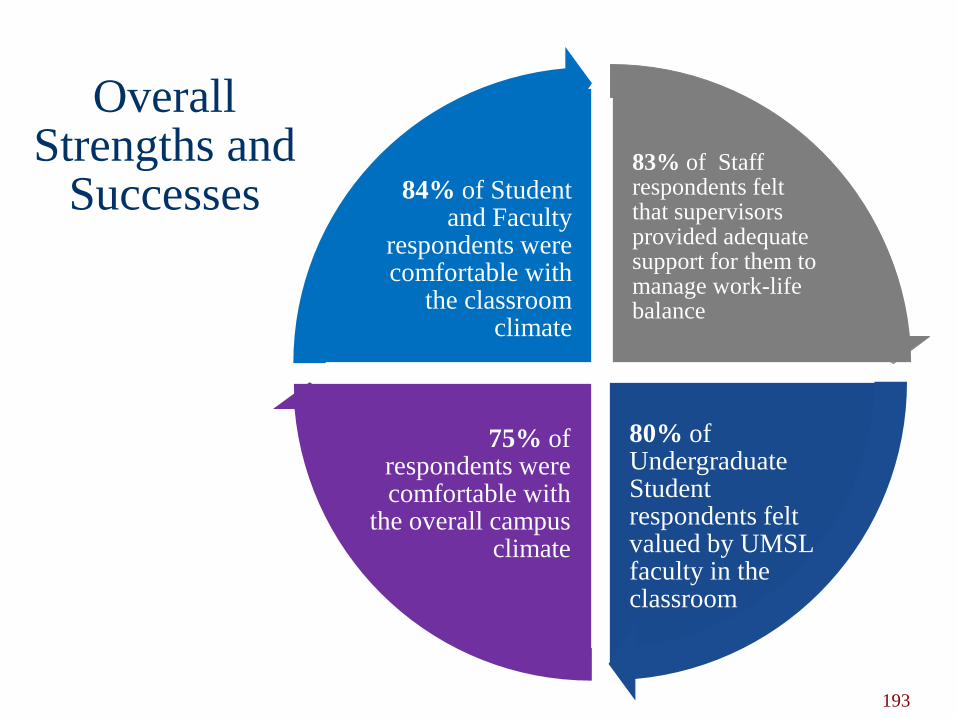
Overall Strengths and
Successes83% of Staff respondents felt that supervisors provided adequate support for them to manage work-life balance
80% of Undergraduate Student respondents felt valued by UMSL faculty in the classroom
.
75% of respondents were comfortable with
the overall campus climate
84% of Student and Faculty
respondents were comfortable with
the classroom climate
194
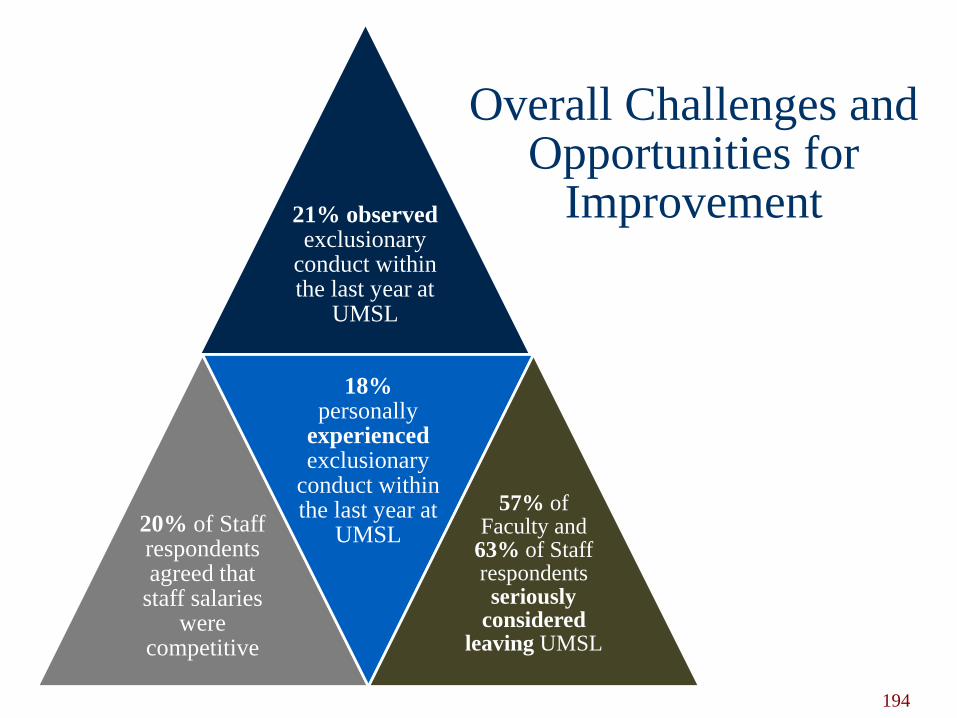
Overall Challenges and Opportunities for
Improvement21% observedexclusionary
conduct within the last year at
UMSL
20% of Staff respondents agreed that
staff salaries were
competitive
18% personally
experiencedexclusionary
conduct within the last year at
UMSL
57% of Faculty and
63% of Staff respondents seriously
considered leaving UMSL
Sharing the Report with the Community
Executive Summary, Full Report, and Power Point will be available at:
http://www.umsl.edu/climate/
195
Questions and Discussion
196