Embed Size (px)
Citation preview
CMUG Phase 2 Deliverable Reference: D2.3: Technical report on product assessment Due date: December 2014 Submission date: May 2015 Version: 0.6
1 of 29
Climate Modelling User Group Deliverable 2.3 Technical report on product assessment Centres providing input: Met Office, MPI-M, ECMWF, MétéoFrance,
IPSL, SMHI, DLR
Version nr. Date Status 0.1 16 Dec 2014 Initial draft with input on Aerosol, SST, OC, SSH, LC,
Fire, SM 0.2 14 Jan 2015 Ozone and GHG added 0.3 02 Feb 2015 Sea Ice and Clouds added 0.4 25 Feb 2015 Submit to ESA 0.5 23 Apr 2015 Version addressing ESA comments 0.6 22 May 2015 CMUG input

CMUG Phase 2 Deliverable Reference: D2.3: Technical report on product assessment Due date: December 2014 Submission date: May 2015 Version: 0.6
2 of 29
CMUG Phase 2 Deliverable 2.3 Technical report on product assessment Table of Contents
1. Purpose and scope of the Technical Report .......................................................................................... 3
2. Comments on CCI validation and user assessment reports .................................................................. 3
2.1 Sea Surface Temperature ...................................................................................................................5
2.2 Ocean Colour ....................................................................................................................................7
2.3 Sea Surface Height ............................................................................................................................9
2.4 Sea Ice .............................................................................................................................................11
2.5 Clouds ..............................................................................................................................................14
2.6 Aerosols ...........................................................................................................................................16
2.7 Greenhouse gases ............................................................................................................................18
2.8 Ozone ...............................................................................................................................................18
2.9 Land cover .......................................................................................................................................20
2.10 Fire ..................................................................................................................................................22
2.11 Soil moisture ....................................................................................................................................25
3. Summary of CMUG assessment of Quality, Uncertainty and Maturity in ECVs .............................. 27
4. References ............................................................................................................................................ 29

CMUG Phase 2 Deliverable Reference: D2.3: Technical report on product assessment Due date: December 2014 Submission date: May 2015 Version: 0.6
3 of 29
Technical report on product assessment
1. Purpose and scope of the Technical Report The purpose of this document is to review the product assessments of each CCI team and give feedback to ESA and the CCI teams. It provides comments and technical advice on some of the CCI Project deliverables, including the “Product Validation and Inter-comparison Report”, “Climate Assessment Report” and “Uncertainty Characterisation Report”. Other CCI project reports were also assessed when found to be relevant. This document is intended as user feedback to CCI Projects (but is not part of a formal review). This report also compares the CCI ECV products with the specifications described in the GCOS products guidelines1 to assess their compliancy. Some of the issues to be addressed in this document are:
• Is the validation of the products adequate? • Are the error characteristics provided by CCI Projects adequate? • What are the different components of the uncertainty? • What is the anticipated impact of the CCI data on the climate research community? • Is the user assessment complete and representative of the wider community? • Does the product meet (where feasible/applicable) GCOS requirements for satellite ECVs?
The structure of the report is that each ECV is assessed in its own section and within this there are sub-sections for Quality (covers PVIR and PVP), Uncertainty (covers UCR), and Maturity of data (covers CAR and GCOS requirements).
2. Comments on CCI validation and user assessment reports
The comments in this report refer to the relevant documents available to CMUG at the start of Phase 2 (December 2014). The documents reviewed are listed in Table 1. A general comment applicable to all ECVs is although there are good ATBDs (Algorithm Theoretical Basline Document) for all ECVs before the round robin comparisons there isn’t an ATBD of the finally selected product. It may of course be the same as the original ATBD, but not necessarily, and it would help the users if there is a clear ATBD to reference with only the chosen product. It is recommended by CMUG to address this before the end of phase 2. It is also noted that in accessing documents from CCI project websites the directory structures and naming conventions for the files is not always consistent. Where this was so it had the potential for delaying access or accessing an incorrect file.
1 2011 update available at http://www.wmo.int/pages/prog/gcos/Publications/gcos-154.pdf

CMUG Phase 2 Deliverable Reference: D2.3: Technical report on product assessment Due date: December 2014 Submission date: May 2015 Version: 0.6
4 of 29
ECV Product Validation
Climate Assessment
Uncertainty Characterisation
Other Docs (e.g. PVP, ATBD)
SST PVIR v1.0 (22.01.14)
CAR v1.0 reviewed in Phase 1
UCR v3 04.12.13 PVP v2.0 (04.02.14) Climate Data Research Package v1.0 (30.09.13)
Ocean Colour PVIR v1.0.2 (20.05.14)
CAR v1.01 (20.05.14)
Uncertainty Characterisation Document (UCD) v1.1 (30.11.11)
PVASR (The PVP was reviewed in Phase 1)
Sea Level PVIR v1.1 (02.09.14)
SLCCI_CAR-035-1-1 15 Dec 2013
Error Report v1.1 (9.4.13)
(The PVP was reviewed in Phase 1)
Sea Ice PVIR v1.0 25.11.2014
CAR v1.0 26.11.2014
CECR v1.1 (20.08.12)
PUG (The PVP was reviewed in Phase 1)
Clouds PVIR v2.1 (09.12.13)
CAR v1.0 (08.11.13)
CECR V1.1 (11.09.12)
PVP V2.0 (12.06.13)
Aerosol PVIR v1.4 (14.3.14)
CAR v1.2 (21.03.14)
UCR v1.2 (11.02.13) reviewed in Phase 1
(The PVP v1.5 was reviewed in Phase 1)
Greenhouse Gases
(PVIR-GHG-CCI-v2 (4 Nov 2013) reviewed in Phase 1)
(GHGCCI_CAR_V1.1 (18 Nov 2013) reviewed in Phase 1)
Not available (ATBD v1.0 (15.03.12) was reviewed in Phase 1)
Ozone PVIR v1.0 (03.10.14)
CAR v1.0 reviewed in Phase 1
Uncertainty doc does not exist, but uncertainty information sourced from other docs (ATBD, CAR, PVP).
PVP v1.0 reviewed in Phase 1
Land cover IPVR v1.2 (17.12.12.)
CAR v1.1 (04.07.14)
Not available
(The PVP v1.3 was reviewed in Phase 1)
Fire PVR-II v1.3 (24.10.14)
CAR v2.1 (31.10.14)
CECR v2 (13.12.12)
(The PVP was reviewed in Phase 1)
Soil moisture Not available Not available CECR v0.7 (21.05.12)
PVASR v1.0 (27.06.13) (The PVP v1.1 was reviewed in Phase 1)
Ice Sheets Not available Not available CECR v1.2 (13.06.13)
PVP v1.2.1 (18.10.12)
Glaciers Not available CAR v0.5 (28.05.14)
UCR v0.5 (08.11.14)
None
Table 1. Version of documents available for review.
CMUG Phase 2 Deliverable Reference: D2.3: Technical report on product assessment Due date: December 2014 Submission date: May 2015 Version: 0.6
5 of 29
2.1 Sea Surface Temperature
Quality Most of the relevant material is in chapters 7 to 9 in the Product Validation Plan (the PVP assessed here is a newer version than that assessed in CMUG Phase 1). There is also relevant material in the PVIR (Product Validation and Intercomparison Report, CAR (Climate Assessment Report) and UCR (Uncertainty Characterisation Report). For the Product Validation Plan the methods to be adopted are those approved by the GHRSST science team and conform to the guidelines under the QA4EO framework under the CEOS-WGCV. This international oversight of the validation plans is to be encouraged by all CCI teams. The validation criteria for in-situ measurements of being within 2 hours of the satellite overpass is rather relaxed especially during the day when diurnal thermoclines are present. However it is recognized that with current matchup datasets this has to be a compromise. The concept of validation confirmation levels is proposed which is an attempt to validate the uncertainty in the in-situ data as well as the product. This is an interesting proposal. CMUG have requested access to these maps but to date they are not available. It is not clear why other satellite SST datasets (IR and MW) were not used for the validation. In particular the ARC dataset is an excellent precursor dataset for the CCI SST level 2 and 3 products. The CMUG analysis has concentrated on the comparison with ARC and in-situ data. The microwave SST datasets (TMI, AMSR-E) in particular covered a period (from 1998) when the buoy coverage was still sub-optimal and give good coverage well away from landmasses. However the analyses listed in Table 8-1 of the PVP are probably a better way to do this. In section 9.2 of the PVP the validation of the level 4 product in a climate modeling framework is proposed. Both the time means (monthly and annual 20 years) and the variability is assessed using HADGEM3. Also engagement with the CMUG is proposed which has been possible through the CMUG assessment of the CCI level 2 ATSR SSTs. The PVIR describes the validation of the SST product at the end of phase 1 using both in-situ data from buoys and also ship borne radiometers. A lot of comparisons are shown to demonstrate the accuracy of the CCI SST product. The CMUG did a rather more limited assessment of the CCI SST products with similar results in the CMUG phase 1 D3.1v2 report. An important conclusion of the PVIR is that the assessment of the CCI SST product improves from 1991 to 2010 as the buoy coverage improves during this time. An assessment of the CCI data in the early 90’s is more challenging when the sampling of the buoy network was sparser. The PVIR confirms the CMUG results of the slightly higher bias of the CCI SST relative to the buoys compared with ARC except for ATSR-1. The PVIR also includes validation results for the AVHRR CCI SST CDR, which CMUG did not assess, and a dedicated section examining data quality for polar latitudes and showing a better performance of all the products in the Southern Ocean, compared to the Arctic Ocean. The PVIR also compares various SST analyses (level 4) including the OSTIA_CCI with ARGO measurements and shows it compares favourably with other SST analyses. One metric is the ‘sharpness’ of the gradients in the different SST analyses and the OSTIA_CCI does well in this respect.

CMUG Phase 2 Deliverable Reference: D2.3: Technical report on product assessment Due date: December 2014 Submission date: May 2015 Version: 0.6
6 of 29
Uncertainty For the uncertainty characterization report this is a useful reference document for all ECVs and how to treat the uncertainties. It describes all the different contributions to consider for a complete error budget for satellite datasets. It would be useful to publish this report more widely for the community in general. However this document does not address the validation of the SST uncertainties provided in the dataset even though the underlying principles on how it is derived are sound but this is provided in the PVIR. Useful maps of the confidence in the SST uncertainty validation are shown. The CMUG have also provided an assessment of the uncertainties (see D3.1v2).
Maturity of data The Climate Assessment Report was made available in January 2014 and is a comprehensive assessment of the SST CCI products. It is a good model for all other ECV teams. There is a detailed investigation of the stability of the CCI SST products by comparison with the tropical buoy array and also the GHRSST ensemble of products. The GCOS stability requirement is met in the tropical Pacific and comparable to that of ARC data. The only surprise is the comparison with ARC. A section on using the CCI data to assess the Met Office HadGEM3 climate model is also presented showing it is a suitable dataset for the evaluation of coupled model mean states. The AVHRR data is shown to suffer from intermittent biases possibly due to desert dust contaminating the retrieval. There were also reports by 9 “trail blazers” who used the CCI data. All gave promising assessments of the CCI datasets. Finally a case study compared the consistency of the CCI SST product with ocean colour in one case study showing a comparison of fronts in the ocean off the coast of Mexico. They concluded the data were consistent on daily and 4km scales in the regions of the fronts. A section on feedback from users was given with an issue of data download speeds being highlighted several users. Also several minor issues with reading the data and treatment of associated flags. CMUG in D3.1v2 have highlighted problems with the time associated with the data which is different according to which depth of the data you are interested in. The SST CCI team is now extending the SST CDR by processing the AVHRR radiances to derive SSTs prior to the launch of the ATSR instruments in 1991. These data are not available for assessment yet but will not have the accuracy of the ATSR data record. Also work is continuing on improving the ATSR SST CDR developed in phase 1 and a new dataset will be available before the end of CDOP-2. Validation methods approved by the GHRSST science team and conforming to the guidelines under the QA4EO framework under the CEOS-WGCV will be adopted. This international oversight of the validation plans is to be encouraged by all CCI teams. The GCOS stability requirement is met in the tropical Pacific and comparable to that of the pre-cursor ARC data. However in general for regions of 100km scale an accuracy of 0.1K with the CCI data is not quite achieved being closer to 0.15K. Areas with persistent cloud cover are particularly challenging in terms of achieving accuracy requirements. There is a document on the Climate Data Research Package which provides an overview of the data produced by the ESA SST CCI project. This gives users a description of the data archive which has a ‘Long Term Product’ and ‘Demonstration Products’. It also gives climate users the links to the data archive2 from which the data can be downloaded. This is a clear web page addressing formats, citation, documents for users and contact details. There are also a range of related datasets available which can be used for validation of the CCI and other products. It would be good from an integrated CCI perspective that the web site provides direct links to the related CCI datasets such as ocean colour and sea-ice. This would encourage users interested in SST to also look at these.
2 http://catalogue.ceda.ac.uk/uuid/1dc189bbf94209b48ed446c0e9a078af
CMUG Phase 2 Deliverable Reference: D2.3: Technical report on product assessment Due date: December 2014 Submission date: May 2015 Version: 0.6
7 of 29
2.2 Ocean Colour
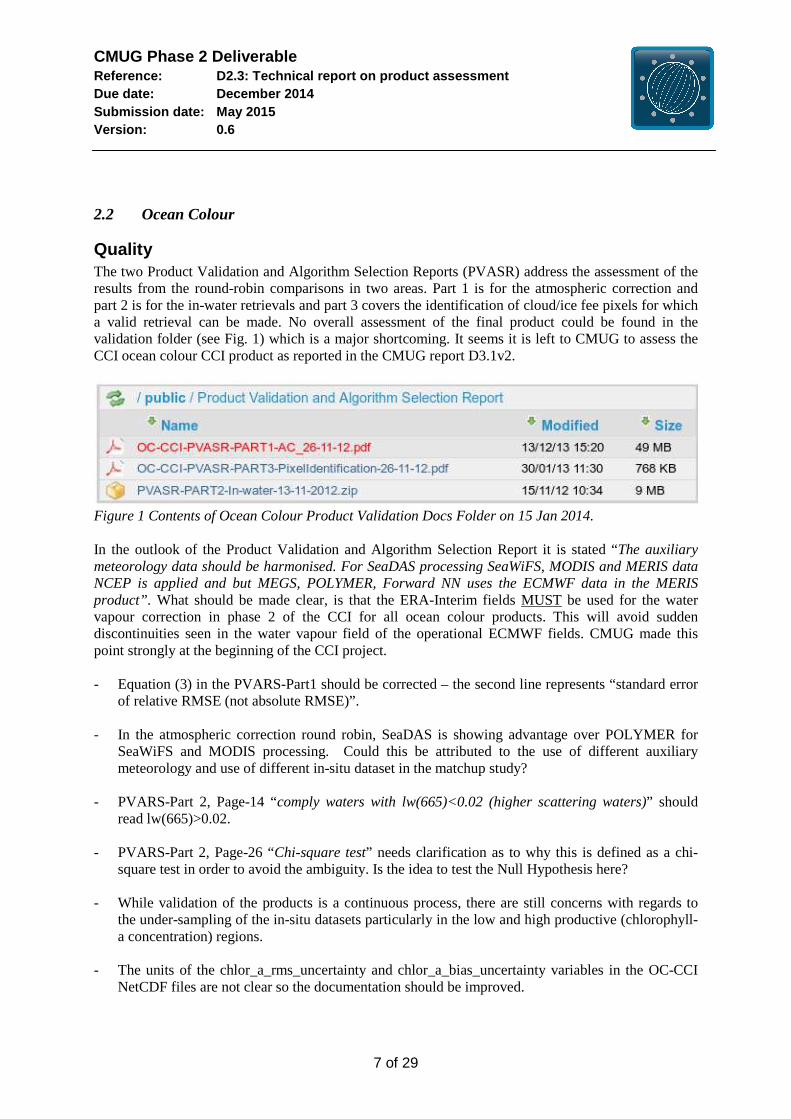
Quality The two Product Validation and Algorithm Selection Reports (PVASR) address the assessment of the results from the round-robin comparisons in two areas. Part 1 is for the atmospheric correction and part 2 is for the in-water retrievals and part 3 covers the identification of cloud/ice fee pixels for which a valid retrieval can be made. No overall assessment of the final product could be found in the validation folder (see Fig. 1) which is a major shortcoming. It seems it is left to CMUG to assess the CCI ocean colour CCI product as reported in the CMUG report D3.1v2.
Figure 1 Contents of Ocean Colour Product Validation Docs Folder on 15 Jan 2014. In the outlook of the Product Validation and Algorithm Selection Report it is stated “The auxiliary meteorology data should be harmonised. For SeaDAS processing SeaWiFS, MODIS and MERIS data NCEP is applied and but MEGS, POLYMER, Forward NN uses the ECMWF data in the MERIS product”. What should be made clear, is that the ERA-Interim fields MUST be used for the water vapour correction in phase 2 of the CCI for all ocean colour products. This will avoid sudden discontinuities seen in the water vapour field of the operational ECMWF fields. CMUG made this point strongly at the beginning of the CCI project. - Equation (3) in the PVARS-Part1 should be corrected – the second line represents “standard error
of relative RMSE (not absolute RMSE)”. - In the atmospheric correction round robin, SeaDAS is showing advantage over POLYMER for
SeaWiFS and MODIS processing. Could this be attributed to the use of different auxiliary meteorology and use of different in-situ dataset in the matchup study?
- PVARS-Part 2, Page-14 “comply waters with lw(665)<0.02 (higher scattering waters)” should
read lw(665)>0.02. - PVARS-Part 2, Page-26 “Chi-square test” needs clarification as to why this is defined as a chi-
square test in order to avoid the ambiguity. Is the idea to test the Null Hypothesis here? - While validation of the products is a continuous process, there are still concerns with regards to
the under-sampling of the in-situ datasets particularly in the low and high productive (chlorophyll-a concentration) regions.
- The units of the chlor_a_rms_uncertainty and chlor_a_bias_uncertainty variables in the OC-CCI
NetCDF files are not clear so the documentation should be improved.
CMUG Phase 2 Deliverable Reference: D2.3: Technical report on product assessment Due date: December 2014 Submission date: May 2015 Version: 0.6
8 of 29
The OC-CCI team’s proposition for periodic comparisons of algorithms when there is a significant changes to either in-situ observations or retrieval methods, followed by mission re-processing, is commendable (Ref: UCD). However, there should also be a system (perhaps to be considered by ESA) to archive the previous version(s) with corresponding training and validation dataset to maintain backward compatibility and traceability. The Product Validation and Inter-comparison Report (PVIR) was made available in May 2014. It comprises a thorough assessment of the data sets used for validation of the newly generated OC-CCI datasets, which included in situ observations as well as merged, satellite-derived data sets like GlobColour and MEASURES. Most of the assessment focused on chlorophyll-a concentration, because of the lack of observations available for the assessment of other CCI products. An important caveat is that the assessment was partly based on an interim OC-CCI dataset (V0.95), which was an earlier version of the official OC-CCI v1.0 released in December 2013, because of time constraints. The only assessment to include the OC-CCI v1.0 data was the trend analysis, primarily a qualitative evaluation of the CCI data across the global ocean as well as in biogeochemical Longhurst provinces. The latter is a relatively novel and useful approach. The OC-CCI team implemented a bias correction scheme, that used SeaWiFS as the reference data set, in order to remove biases between sensor-specific data, for each grid point of the global domain and for each band of remote sensing reflectance. The CCI team found there were no obvious biases in the merged, monthly products, due to spurious signals associated with the merging of different missions. The OC-CCI v1.0 dataset appears to be consistent with its precursors. The OC-CCI v1.0 data set was found to be most similar to SeaWiFS derived data, although generally, data records derived from single missions were closer to OC-CCI v1.0 than other merged mission initiatives, and less biased by the inclusion of data from new OC sensors. The report highlighted trend signals in the OC-CCI that were (in some cases, but not always) identified in previous scientific studies and called for modelling studies to support the investigation of their spatial and temporal evolution. Particularly large scale, positive trends are seen stretching from the Equatorial Western Pacific to South America and then moving west through the South Pacific and also from the Eastern tropical Pacific to the western Equatorial Pacific. Large scale, negative trends are evident in the North Pacific and in the subtropical Eastern North Atlantic.
Uncertainty The OC uncertainty characterisation report was assessed in CMUG Phase 1 and the report has not been updated by the project since then.
Maturity of data Monthly OC products have been added since the release of OC-CCI v1.0, in December 2013, in Phase 1. No scientifically or technically updates have been provided since Phase 1. The Climate Assessment Report (CAR) was made available in March 2014. It covered aspects of the algorithm development process, the validation of OC-CCI products (largely covered by the PVIR) and a number of studies on ocean colour decadal variability and applications, such as data assimilation and model skill assessment. The latter studies were based on a combination of precursor ocean colour data (individual SeaWiFS or MODIS products) and no attempt was made to utilise the GlobColour merged data. This is a significant shortcoming as such a comparison would have been a true benchmark of the

CMUG Phase 2 Deliverable Reference: D2.3: Technical report on product assessment Due date: December 2014 Submission date: May 2015 Version: 0.6
9 of 29
OC-CCI products (both in terms of reproducing climate variability and exploitation of the data via data assimilation techniques) and highly relevant to the CCI project. The studies presented in this report that used OC-CCI data were based, like mentioned before for the PVIR report, on interim versions (either OC-CCI v0.95 or v0.95.1) not publicly released. Despite the OC-CCI products being specifically developed for Case 1 waters, the data assimilation sections mostly focus on Case 2 water studies, despite publicly available scientific literature (i.e. papers , CCI reports, etc.) for Case1 waters. This is an important gap in the analysis. On the other hand, it is encouraging to see the utilisation of the error characteristics of OC-CCI data in data assimilation studies. The OC-CCI v1.0 dataset includes two GCOS variables: chlorophyll-a concentration and water-leaving radiances. The GCOS requirements for these two variables, as stated in the update to the satellite supplement to the GCOS Implementation Plan (GCOS, 2011), is for an accuracy of 30% for chlorophyll-a concentration and of 5% for water-leaving radiances. In terms stability, GCOS set their requirements as 3% for chlorophyll-a concentration and 0.5% for water-leaving radiances. The validation of these two OC-CCI v1.0 data products, against in situ observations, concluded that the GCOS requirement is met for most of the range in chlorophyll concentrations (except for concentrations lower than 0.1 mg Chl.m-3) and for most water leaving radiances (with best results for the shortest wavelength of 412 nm), but slightly missing the GCOS target at longer wavelengths, as the frequency of higher relative errors increases with increasing wavelengths. The subtropical gyres, where chlorophyll concentration is typically very low, and the highly productive coastal waters, where chlorophyll tends to be very high, are the geographical regions that exhibit the largest relative errors. This is despite the removal of the bottom 5 percentile and the top 5 percentile in relative errors prior to the calculation of the CCI products’ accuracy. Al though the PVIR and CAR mention that, compared to its precursors, the OC-CCI data sets shows no significant drifts, it appears there has been no attempt to formally quantify the stability of the CCI products. The CCI team should be encouraged to do so during Phase 2.
2.3 Sea Surface Height
Quality Two documents are addressing the quality and uncertainties of the SL CCI products. In the PVIR the authors certify the end-to-end quality of ECVs and analyse the total contribution of improvements done in the final products by comparison with the products existing before the beginning of the project (from AVISO). The comparison to in-situ observations (tide gauges and ARGO) reveals the differences of variability between satellite and in-situ observation at different time scales, but also the some improvements achieved with the new products (in particular for interannual variability). An east-west difference of trends between the Sea Level Anomalies derived from the two satellite datasets over the 2003-2010 period, attributed to a change in the used orbit model, remains however intriguing for a non-specialist. However the impact of the orbit is well addressed in the error report document (see below the “Uncertainty “ sub-section). One interesting addition to the PVIR compared to the one published at the end of phase 1 (v1.0 dated from the 18th of September 2013), is a list of recommendations aiming at improving the overall quality of the SL CCI. The final version of the SL PVP was already examined in the CMUG Phase 1 D2.2 deliverable (Technical Note on CCI System Requirements). One comment suggested a more regional (basins and latitudinal bands) evaluation and ocean-process based evaluation to complement the aggregated
CMUG Phase 2 Deliverable Reference: D2.3: Technical report on product assessment Due date: December 2014 Submission date: May 2015 Version: 0.6
10 of 29
diagnostics proposed in the PVP document. This is achieved in the CAR which presents a set of scientific evaluation of the products, several of them being focussed on regional assessments (regional mean sea level trends,…) and process-oriented (steric mean sea level, …).
Uncertainty The error report document allows to have a clear view of the impact of the orbit model on the trends and on its errors. The improvement of the hemispheric trends is well established and the contribution of the orbit model to the uncertainty is evaluated through a clear reasoning (comparison of different orbit solutions). This report also deal in the same way with the other sources of uncertainties giving the main basis of the estimates for each contribution: comparison between microwave radiometers on-board altimetric satellites and analyses from atmospheric models for the contribution of wet troposphere corrections; cross-comparison between global mean wind speed derived from altimetry with atmospheric reanalysis for the altimeter instrumental parameters contribution; the analysis of overlapping periods of measurements when available to estimate the contribution of the biases linked to the altimeter missions. The mention of published references allow to go further in the understanding of the uncertainty evaluation process. The hypothesis that are done to combine the different sources of uncertainties are also well stated. The authors highlight the fact that the resulting errors, at the global and at the regional scales, are often higher than the user requirements identified at the beginning of the project. This concerns more precisely the long-term trend total error (stability) that is estimated to be lower than 0.5mm/yr for the global mean sea level and lower than 3mm/yr for the regional mean seal level. The corresponding GCOS (and CMUG) requirements are respectively lower than 0.3mm/yr and lower than 1mm/yr. However, it appears that this was not a limitation in the analysis done by CMUG over the Mediterranean basin at least on average over the whole basin (the spatial variability within the basin is under study). In addition, several ways of progress are suggested in the error report to improve the stability.
Maturity of data The user assessment presented in the CAR is a representative illustration of the use of the data by the scientific community. It covers its common use for ocean model assimilation and for trend analysis. It also covers the emerging use of the data to evaluate the ability of climate system models to simulate the observed sea level trends over the last decades. This last application is of particular interest to make this data more widely used by the climate modelling community.
The comparison between the SL-CCI dataset and the SL AVISO dataset is done all along the document. The results show that the largest differences in interannual variability are located along the sea-ice edge, in the ITCZ region and in regions of large eddy activity like in the western boundary currents, but with very good agreement elsewhere. Trends over the last decades are different at the hemispheric scale and in some specific regions like in the equatorial Pacific. The analyses conducted by the CMUG group over the Mediterranean area are consistent with these findings with closer agreement between the two products over this specific region. The improvement over Phase 1 is described in the last paragraph of the section on Quality, and the ways in which GCOS requirements are met are described in the last part of the Uncertainty section.

CMUG Phase 2 Deliverable Reference: D2.3: Technical report on product assessment Due date: December 2014 Submission date: May 2015 Version: 0.6
11 of 29
2.4 Sea Ice
Quality The Product Validation & Intercomparison Report (PVIR), the Product User Guide (PUG) and the Climate Assessment Report (CAR) of this CCI’s activity all contain an assessment of the quality of this data record. In general, however, this CCI provides a far more detailed discussion and quantification of error sources than comparable projects did before. This is obviously highly relevant for the climate research community, where quantitative estimates of observational uncertainties are necessary for any meaningful use of observational data. As part of the sea ice CCI, climate data record of both sea-ice thickness (SIT) and sea-ice concentration (SIC) have been developed. The former record is only available for the Northern hemisphere during winter, while the latter is available for both hemispheres all year round. Both records have a relatively large number of sources for observational uncertainty that are very coherently discussed in the PUG. For sea-ice thickness, there are four main error sources as summarized in the PUG: First, for the transformation from freeboard (i.e. the amount of snow and ice above the water level) to actual ice thickness, the snow thickness must be known. Since this information is currently not available from measurements, instead a climatology is used that no longer seems to be valid in many places. Second, it is unclear whether the radar signal actually stems always from the snow-ice interface, as assumed for the calculation of ice thickness, or whether it sometimes primarily stems from within the snow pack. Third, there is speckle whose influence can be reduced by averaging over a larger number of measurements, which then of course reduces both spatial and temporal resolution of the record. And fourth, the large footprint of the radar which might cause a mis-representation of actual ice-thickness distribution. The PVIR contains an extensive quantification of possible biases of the CCI SIT product relative to independent products. Compared to ground-based in-situ measurements and EM measurements, the CCI SIT product over-estimates ice thickness by typical 0.5 m to 1 m, and even more in extreme cases. The root-mean square error relative to airplane measurements during the Operation Ice Bridge is typically close to 1 m, too. Compared to this data record, the biases are however both positive and negative, in contrast to the EM and in-situ measurements, where CCI SIT data usually shows too large ice thickness. Compared to data from upward looking sonar (ULS)Th, the SIT record overestimates ice thickness by typically about 0.75 m and does not show the significant thinning of the ice that is displayed by the ULS data. There is no systematic description of the individual contributions of the possible error sources to these discrepancies, which would be very helpful for any user of the data. The very large biases shown by this SIT record make the record currently not suitable for standardized use for either model evaluation or model initialization. Hence, the usefulness of this data for the climate-research community is currently somewhat limited. A respective warning should possibly be included more clearly in the user guide. A better characterization of the most
CMUG Phase 2 Deliverable Reference: D2.3: Technical report on product assessment Due date: December 2014 Submission date: May 2015 Version: 0.6
12 of 29
likely underlying error sources is also desirable. Nevertheless, the fact that these uncertainties are quantified as part of the sea-ice CCI is very advantageous for any user of the data. For sea-ice concentration (SIC), there’s also a very nice description of possible error sources in the PUG. During summer, the main limitation of the accuracy of this record is related to melt ponds that form on the sea-ice surface. These ponds are always seen as open water by any passive microwave (PM) instrument, which causes a systematic underestimation of sea-ice concentration during summer. The accuracy of PM retrievals is also limited for thin ice of less than 30 cm thickness, because then a significant amount of the retrieved PM signature stems from the underlying water, which then causes an estimate of SIC that is lower than the actual value. The influence of land pixels also deteriorates the PM signature of sea ice, which is why near-land pixels are excluded from the entire record, in contrast to other existing records. The PM signature is also influenced by the atmosphere, which hence is an additional error source. Other systematic errors are caused by smearing out of the retrieved signature on scales smaller than the satellite footprint.
Uncertainty During phase I of SICCI, a Comprehensive Error Characterisation Report (CECR) was compiled that summarizes the main sources of uncertainty in remotely-sensed sea-ice concentration and sea-ice thickness.
For sea-ice concentration, the report gives a comprehensive overview of errors that are caused by physical limitations of the retrieval method and of errors caused by the numerical analysis of retrieved physical parameters. It does primarily summarize previously known results for a variety of different sensors and does not put these into the concrete context of SICCI. As such, the report is of somewhat limited use in assessing the overall uncertainty of the sea-ice concentration that is derived from this particular project, and is primarily useful as an overview of pros and cons of various sensors that can be used for estimating sea-ice concentration.
For sea-ice thickness, in contrast, the report provides some new estimates of uncertainties for the various methods that can be used to assess sea-ice thickness from space. As such, the report goes beyond published work, but again there is no direct reference to the sea-ice thickness work that has been carried out within SICCI, which again limits the usefulness of this report for the end-user of SICCI data. One would have wished for a concrete discussion of how the sea-ice thickness product that has been compiled within SICCI is limited by the various factors that are discussed here.
In reading the entire CECR, a clear imbalance between the treatment of SIC and SIT is apparent, with the former not even being mentioned in the conclusion section. It is obvious that both main authors of this report were primarily concerned with SIT during phase one of SICCI, which is why almost three times as many pages of this report are dedicated to SIT compared to SIC.
The uncertainty estimate that is contained in the actual SIC product itself provided by the SIC record only contains an estimate of those uncertainties that can be quantified for example by estimating differences between several over passes of the satellite. They do, however, not
CMUG Phase 2 Deliverable Reference: D2.3: Technical report on product assessment Due date: December 2014 Submission date: May 2015 Version: 0.6
13 of 29
contain estimates of the uncertainty of sea-ice coverage caused by the existence of melt ponds, which is the main error source during summer. It would be very helpful for users of this record if at least a rough estimate of this uncertainty was provided, for example based on a climatological record of melt-pond occurrence from MODIS data.
For the uncertainties that can be quantified, the quality of the SICCI record is very high. In particular, the detailed description of the various error sources through the year and their inclusion into the actual record is a clear advantage of this record over existing ones. The quantifiable uncertainty of retrieved sea-ice concentration for 100 % ice coverage and for open water are usually below 3 %, which is clearly an acceptable value for climate research, in particular given the much larger influence of the unknown error sources such as melt ponds and the thin ice fraction. Roughly the same value is obtained for thick ice of intermediate concentration by comparison with high-resolution Landsat images. Including thin ice gives twice as large an uncertainty of around 6 %, which can be too large for some applications, in particular those related to very low sea-ice concentration and initial ice formation.
In the Southern hemisphere, the SICCI record provides good agreement with the ASPeCt data set, though the Comiso Bootstrap algorithm performs slightly better.
The description of these uncertainties in the PVIR is sufficient and very helpful. No other existing satellite product has an even remotely similarly extensive assessment of quality. It might be helpful to summarize these findings briefly in the PUG such that users get a short quantitative overview of possible error sources.
In addition, the sole inclusion of the quantifiable uncertainties might pretend a smaller uncertainty than there actually is. This should clearly be mentioned in the PUG. Otherwise there’s a chance that users underestimate the possible error range of sea-ice concentration based on the uncertainty estimate that’s included in the record, which does not include the sometimes large impact from melt ponds and thin sea ice on the total error.
Maturity of data For sea-ice CCI, the available data of sea-ice concentration and of sea-ice thickness have been compared to existing products to assess the maturity of the data. These exercises are described comprehensively in the projects Climate Assessment Report (CAR). For sea-ice thickness, the estimates of SICCI have a clear bias compared to existing remotely-sensed data sets and also compared to existing in-situ data. For the modal and for the median ice thickness, SICCI estimates of ice thickness are on average around one meter larger compared to existing data. Since a similar bias exists similar to independent in-situ data, it is very likely that this bias primarily stems from the SICCI product itself. Hence, this data is not mature for usage in climate-related applications. For sea-ice concentration, the anomalies of both main integrated quantities sea-ice extent and sea-ice area agree extremely well with existing estimates. However, regionally substantial differences of more than 20 % of ice concentration are not unusual, which are, primarily, a reflection of the different philosophies that are taken to compensate for physical limits on the retrievals. For example, while SICCI sea-ice concentration only describes the concentration of
CMUG Phase 2 Deliverable Reference: D2.3: Technical report on product assessment Due date: December 2014 Submission date: May 2015 Version: 0.6
14 of 29
melt-pond free sea ice, other algorithms attempt to use an ad-hoc bias correction to compensate for the melt-pond covered sea-ice in their estimate of sea-ice concentration. Since these corrections cannot be physically based, their usefulness for climate-related applications is limited and the approach taken by SICCI is much preferred. The accuracy of SICCI retrievals against the independent data of the Round Robin data package is extremely high, and matches the independent data to better than 1 % in open water and to usually better than 3 % for 100 % sea-ice coverage. Regarding GCOS requirements, both SICCI SIC and SIT only meet the requirements partly. Regarding resolution, neither SIC nor SIT meet GCOS-requirements. These are for SIC 10-15 km, which, however, is simply not possible with the passive-microwave frequencies used within SICCI that limit spatial resolution to 25 km. For SIT, GCOS requires 25 km resolution, which again is a higher resolution than the 100 km resolution delivered by SICCI. The GCOS-required accuracy of 5 % for SIC is met by SICCI, at least if one accepts that melt-pond covered sea-ice simply cannot be detected as sea ice from passive microwave. For SIT, a bias of around 1 m is clearly incompatible with the GCOS requirement of 0.1 m accuracy. The temporal resolution as required by GCOS is met by SIT with its monthly resolution, and exceeded by SIC, where GCOS requires weekly data while SICCI delivers daily data. There is no analysis of long-term stability of either SIC or SIT within SICCI, which should be addressed in phase II of that project.
2.5 Clouds The Comprehensive Error Characterisation Document and the Product Validation Plan (PVP) have been assessed in Phase 1. Here, we assess the updated version of the PVP from June 2013, the Product Validation and Inter-comparison Report (PVIR) from December 2013 and the Climate Assessment Report (CAR) from November 2013.
Quality The PVP contain detailed summary of the different validation datasets and a general outline of the comparisons. The updated report includes additional validation datasets, the SSM/I LWP dataset and ground based station data, the Alpine Surface Radiation Budget (ASRB) and Baseline Surface Radiation Network (BSRN) for polar stations. This can improve the validation over high altitudes and snow covered regions. In PVIR extensive validations of the two Cloud-cci retrieval algorithms, the Community optimal estimation Cloud retrieval For Climate (CC4CL) for Modis, AVHRR and AATSR and the FUB AATSR MERIS Cloud retrieval (FAME-C) have been made. The data was compared to measurements from geostationary satellites (MSG-SEVIRI) and active sensors (CloudSat-CPR, CALIPSO-CALIOP) and to existing cloud climatologies (CM-SAF CLARA A1, MODIS, UWisc MWR). For the level-2 comparisons, the active A-Train sensors were used to validate the CC4CL cloud mask. The algorithm performs similarly well as comparable existing algorithms. However, CC4CL
CMUG Phase 2 Deliverable Reference: D2.3: Technical report on product assessment Due date: December 2014 Submission date: May 2015 Version: 0.6
15 of 29
overestimate clouds in twilight conditions, underestimate cloud amount in tropical regions and underestimate Cloud Top Height (CTH). These issues need to be addressed, does e.g. the twilight problem affect the observed diurnal cycle? For FAME-C collocation of ENVISAT and A-train data is only possible at high latitudes, case studies showed that FAME-C also tend to underestimate CTH. A summary table for the level 2 data with the validation results organized according to “external” parameters such as surface type, solar zenith angle as described in the PVP would be useful. This would complement the risk flags for the retrievals that include information about underlying surfaces, sun glint, cirrus and multilayer cloud occurrences as described at the end of the PVIR. The level-3 results are well summarized in Table1.1 with colour codes indicating if the bias and std fulfil the GCOS goals. The data was compared to SYNOP and existing cloud climatologies (CM-SAF CLARA A1, MODIS, UWisc MWR LWP).For cloud cover and CTH both algorithms, CC4CL and FAME-C perform well on a global average scale. For cloud water paths the values are outside the GCOS thresholds. As pointed out in the text, the Cloud CCI three year of data can overestimate the variability, which in addition to some known issues and bugs that were found in phase 1 affects the results. In phase 2 some of these issues should have disappeared. In addition to Table1.1, summary geographical maps showing the regional variation in bias, std and uncertainties would give useful information for developers and users.
Uncertainty The Comprehensive Error Characterisation Document was assessed in Phase 1, it provides a description of how the errors are determined (e.g. it outlines the relevant equation from the ORAC algorithm). Alternative ways to derive the uncertainty for level 3 products from L2 error are discussed in the CECD/CECR(?). An update on which method that was chosen would be of interests. Quantitative information on the errors of the CCI cloud products are given in PVIR. For phase 1 problems were detected for the cloud water path, it was found that the error/uncertainty on a global scale is beyond the GCOS requirements for all datasets, with positive biases between 0 and 80 g/m2 and bias-corrected rmse values between 50 to 100 g/m2 (CC4CL datasets) and up to 140 g/m2 (FAME-C). Problem regions, such as the Arctic was also noted in the uncertainties with increasing values polewards of +/-65°Lat. According to the PVP, the CCI Cloud uncertainties were planned to be used in the validation activities. This should be pursued in the phase 2 validation exercises investigating if the differences compared to other datasets are reflected in the uncertainties. The uncertainties as described in the CECD/CECR(?) are for the optimal estimation retrieval, but uncertainties associated with the cloud mask are not discussed. Are there any plans or ideas how they can be considered too?
Maturity of data The Cloud-CCI L3 datasets fulfillment of the GCOS requirements are reported in PVIR (Table 1-1) as summarizes of the results of the L3 validation of the datasets compared to the GCOS accuracy requirements. Cloud cover and cloud top height meet the requirements for bias for three out of four instrument groups and partly fulfill them for the standard deviations. For cloud water path, most values are outside the GCOS thresholds. As stated in the PVIR a number of improvements of the retrievals have to be investigated in Cloud_cci phase 2. “In particular the correct identification of aerosol and cloud contaminated pixels and improved assignment of the cloud phase would greatly improve the results. An IR only retrieval to

CMUG Phase 2 Deliverable Reference: D2.3: Technical report on product assessment Due date: December 2014 Submission date: May 2015 Version: 0.6
16 of 29
improve cloud top height could also be investigated.” Additionally, it is noted in the PVIR that the GCOS requirements are goals for long-time climatologies and in Cloud CCI only three demonstrator data sets have been produced. Once phase 2 decadal data is available, a new assessment can determine the maturity of the data. An important point made in the PVIR is that validation of cloud (or any other) properties should not be based on a single dataset of in situ observations, but on a collection of data sources (i.e. SYNOP, APCADA, and active remote sensing), which would allow to provide the estimation of the uncertainty of the validation data, similar ideas as put forward by CCI SST for in-situ data. In the Cloud CAR, the data products for 2007-2009 have been compared to existing global satellite datasets, reanalysis data and regional and global climate model simulations. The GEWEX Cloud Assessment cloud products global datasets (Stubenrauch et al. 2013) and ERA-Interim data (Dee et al 2011) have been used to assess the cloud-cci level 3 data. The results for phase 1 show that the regional and seasonal variations in the cloud-cci data correlate well with GEWEX Cloud Assessment data base and with ERA-Interim reanalysis data. However, there are problems detecting high cirrus and some issues over challenging surface property regions (mountain and sea-ice), similar problem regions exit for many other satellite datasets (Stubenrauch et al 2013). These issues still need to be addressed in phase 2. The Cloud CCI data sets have also been used for evaluating regional and global climate model simulations. The regional climate model, COSMO, have optically thicker clouds compared to cloud-cci data. Sensitivity experiments changing the ice sedimentation in COMSO reduced this bias. However, due to the Cloud CCI phase 1 problem detecting high clouds, these experiments should be repeated for the re-processed data and using several satellite datasets. For the global climate model EC-Earth, sensitivity experiments were made w.r.t. mixed-phase clouds. The results were compared to Cloud CCI data including the uncertainties, which were useful in showing larger values over problem surfaces, thereby guiding the user on the quality of the data. The exercises in CAR summarised above should be repeated once longer data-series are available in phase 2 and in addition, extended use of the uncertainties are encouraged. To have an impact on the climate modelling community outside CCI, longer data-series are a requisite. The processes for achieving the climate-based goals are identified, the products partly meet the GOCS requirements but due to the short time-series we judge the maturity of the Cloud-CCI data to be partly fulfilled (Table 2).
2.6 Aerosols The Product Validation Plan (PVP v1.5) and the Uncertainty Characterisation Report (UCR v 1.2) were assessed in Phase 1 of CMUG. The Product Validation and Inter-comparison Report (PVIR) and the Aerosol Climate Assessment Report (CAR) were released by the Aerosol_cci team in March 2014 at the time when the CMUG Phase 1 Technical note on Validation and User Assessment was submitted. The PVIR and CAR are therefore assessed here.
Quality In Phase 1 of ESA CCI, the Aerosol CCI project focused on algorithm improvement and comparisons of different algorithms. Eight algorithms for aerosol optical depth (AOD) went
CMUG Phase 2 Deliverable Reference: D2.3: Technical report on product assessment Due date: December 2014 Submission date: May 2015 Version: 0.6
17 of 29
through a three-step process: algorithm experiments (Holzer-Popp, et al., 2013), round robin exercise (de Leeuw, et al., 2013), and ECV production and validation (paper in preparation). The extensive efforts on algorithm development, testing, and comparison have been a major step forward in Phase 1. The PVIR summarizes the validation results of product datasets that were produced with the various algorithms participating in the ESA Aerosol_cci. Several algorithms were considered mature in the round robin exercise. The mature algorithms were then applied to a full year of global data for each sensor. In one case a 10 year time series was produced and validated, which is also discussed in the PVIR. At the end of Phase 1 the Climate Research Data Package (CRDP) was produced which contains the latest / best and most complete + validated datasets of Aerosol_cci. The CRDP is openly available at http://www.icare.univ-lille1.fr/archive/?dir=CCI-Aerosols, with datasets covering at least the golden year 2008.
Uncertainty The Uncertainty Characterisation Report (UCR v 1.2) were assessed in Phase 1 of CMUG.
Maturity of data Aerosol_cci data for AOD generally meet the GCOS target requirements. The horizontal resolution of 10x10 km2 is in line with the requirements, although the provided daily temporal resolution is coarser than the requested 4 hours. The validation of satellite AOD products against the ground-based AERONET data shows an accuracy up to 1% over land, which is far better than the GCOS requirement of 10%. The accuracy over oceans is lower, around 20%, but the validation in this case is more difficult due to the limited amount of ground stations over the oceans. Additional products were provided for the Angstrom parameter, the aerosol absorption index, aerosol types, mixing fractions and effective radius, and stratospheric extinction. The latter is provided at 0.5 km vertical resolution (well within the GCOS requirements of 1-2 km) and 2.5°x10° (lat, lon) horizontal resolution, which is close to the 100-500 km requirement. The accuracy has been quantified by validation against OSIRIS and SAGE-II, resulting in a height-dependent bias of 10-25%, again close to the required target of 10%. Currently, there is no effort on aerosol precursors (e.g., SO2). This would be a valuable addition for climate studies, in particular concerning the estimate of emissions. More recently, a 17-year (1996-2012) ATSR aerosol climate data record has been provided by the Aerosol_cci. This new data record for mid-visible AOD (550nm) and Angstrom parameter is competitive to commonly used data records of NASA sensors (e.g. MODIS, MISR, SeaWIFs) but goes further back in time until 1996 (note that Angstrom parameters from all ESA and NASA datasets show major weaknesses). For this dataset, the ATSR retrieval of the University of Swansea group was chosen to process the entire data record (which was slightly better than the two other ATSR algorithms, so that three algorithms with similar quality are available). The data are released in netCDF format and are freely available through the Aerosol_cci website (http://www.esa-aerosol-cci.org/). The data record involves data from two similar sensors on two consecutive platforms (ATSR2 1996-2003 on ERS2 and AATSR 2002-2012 on ENVISAT). The global annual average AOD (at 550nm) is estimated at 0.15 and annual Angstrom parameter is near 0.77. Global averages of both parameters have not changed significantly over the entire record, despite regional shifts of maxima. Most significant are AOD increases over Arabia (dust) and both southern and eastern Asia (pollution) and AOD decreases over South America (biomass) and dust outflow off Northern Africa into the Atlantic (Kinne et al., 2014).
CMUG Phase 2 Deliverable Reference: D2.3: Technical report on product assessment Due date: December 2014 Submission date: May 2015 Version: 0.6
18 of 29
In addition, the consistency between the cloud masks used by the Aerosol_cci and the Cloud_cci projects has been analysed in the ESA Climate Change Initiative Aerosol_cci / Cloud_cci Cloud Mask Consistency Analysis Report: “Overall 0.3% of observations have been found to be inconsistent while about 21% are not used for aerosol or cloud retrievals at all owing to missing reliability. Over land 1% of observations are inconsistent while inconsistency is practically absent over ocean. On the other hand over ocean only 5% of observations are definitely cloud-free and thus used for aerosol retrieval, strongly impacting on the coverage of aerosol data over ocean. Remaining open issues are especially the 1% inconsistent observations over land, where thick aerosol plumes and broken cloud fields have been identified as possible reasons. Moreover the analysis so far contains five days in September 2008, which have been selected mainly to especially cover difficult scenes (with high aerosol loads or complicated mixtures between aerosol and clouds). Thus it has not yet been proven that the results are representative globally for all seasons.”
2.7 Greenhouse gases The GHG Product Validation Plan (PVP) document, the Product Validation and Inter-comparison Report (PVIR) and the GHG CRG Climate Assessment Report (CAR) have already been assessed in Phase 1 of CMUG, and no update has been made to the CCI project documents to date.
2.8 Ozone The Ozone Product Validation Plan document and the GHG CRG Climate Assessment Report (CAR) have already been assessed in Phase 1 of CMUG. Quality The Product Validation and Inter-comparison Report (PVIR) - published in October 2014 - presents an in depth summary of the assessment of the various core O3 products (total column ozone, and nadir and limb-instrument based ozone profiles). The assessment was performed bearing in mind the O3 User Requirements (URs) that concerned with three main points: 1) accuracy of the error bars (consisting in the random and systematic components); 2) temporal and spatial domain and resolutions met by the data, including long-term stability; and 3) other user requirements (e.g. on format, metadata, and visualization tools). The last two points can be verified by inspecting the data and the ftp-server. As for point 1 above, data were assessed against similar ozone products from in-situ and in some cases other satellite sensors. The assessment shows that the URs were generally met for the (L2 and L3) total column ozone products. The assessment of the L3 total column ozone revealed that, albeit the good agreement with ground based observations in the mean, the CCI product clearly showed some patterns, possibly as a consequence of the data merging. The URs are also often met in the UTLS region and partly fulfilled in the troposphere and middle atmosphere for nadir profiles. In the case of the limb profiles, and with the exception of Odin SMR,

CMUG Phase 2 Deliverable Reference: D2.3: Technical report on product assessment Due date: December 2014 Submission date: May 2015 Version: 0.6
19 of 29
the URs were mostly met in the stratosphere down to about 50 hPa, and in some cases in the lower stratosphere. The upper troposphere still remains a major challenge with limb viewing instruments. One limitation is that the assessment heavily relies on comparisons with in-situ observations, which are generally sparse and can offer good coverage generally over Europe and the USA. It is also acknowledged that in some cases a unit conversion was needed that had to rely on external datasets (e.g. pressure and temperature) that may have altered the data characteristics. Although it is recognized that it is not always possible, it is desirable to make use of consistent auxiliary datasets. Uncertainty No UCR exists, but the PVP (as assessed in Phase 1 and worth repeating here) reports that the uncertainty estimates can include estimates of the bias and precision of the data with respect to reference data, and identification of the temporal and spatial domains over which those estimates are valid. Different components (measurement noise, a priori uncertainty, smoothing error) characterize the retrieval errors provided at pixel level. A thorough description of the error budget is provided in the two ATBDs (one for the GODFIT total column ozone, and one for both the nadir and limb profiles). As for the error assessment, neither the PVP nor the ATBDs provide a detailed discussion of the protocol to be followed, but in the PVP a remark is made according to which this “has to be assessed and expressed as the percent relative ozone difference with respect to correlative measurements of reference”. Maturity of data The CAR was assessed in CMUG Phase 1. Compared with the status of development at the end of Phase 1, the O3-CCI team has worked at extending the temporal coverage of some of the products that during P1 were only available over a limited period of time, for instance the ozone profile retrievals from both nadir and limb sensors. This is a major and timely achievement in view of forthcoming reanalysis activities (e.g. the start of the ERA5 production at ECMWF that will replace ERA-Interim) where these observations are expected to give an important contribution. Additionally, they have extended the O3-CCI parterre of available L2 products with the addition of the L2 total column ozone product retrieved from the Aura OMI measurements not yet available in P1 CCI. Also the merged monthly zonal mean data product (Level 3) is being extended to cover the full ENVISAT period. Finally, it is worth noticing that a better treatment of cloud and aerosol effects has also led to improved quality of the HARMOZ data product in the UTLS region. All total column ozone products comply with the user requirement of a long-term stability better than 1% / decade, and thus meet also the GCOS requirement of a long-term stability <1%. Comparisons with ground based observations show an agreement typically better than 1% and only sporadically, especially at high latitudes, the differences are within 2%. If this is used as an indication of the data accuracy, the data fulfils the GCOS requirement for the TCO3 given at 2%. Also the data along-track horizontal resolution of up to 40km is complaint with the 20-50km requirement of GCOS. It is important to notice that the GCOS requirements do not distinguish between nadir and limb profiles as done by O3-CCI, and it should be appreciated that meeting some of the requirements might be limited by instrument design and characteristics. The nadir profiles

CMUG Phase 2 Deliverable Reference: D2.3: Technical report on product assessment Due date: December 2014 Submission date: May 2015 Version: 0.6
20 of 29
show an agreement with in-situ data within 10% in the UTLS region, complaint with the GCOS requirement, while in the lower troposphere for ERS-2 GOME measurements the agreement is within 30% (the GCOS requirement for the tropospheric ozone accuracy is given within 10-15%). In the upper stratosphere and mesosphere, the nadir profile show an accuracy within 3-18% better than the 5-20% set by GCOS. The GCOS horizontal resolution requirements are met for GOME-2 and along-track for GOME, while instrument design limitation makes it impossible to meet that requirement across-track. For the limb products, the GCOS vertical resolution requirement of 3km in the upper stratosphere and mesosphere (US/M) is met, while the more stringent 1-2km resolution for the UTLS region is not. Also the stability requirement is generally met in the middle stratosphere and in the US/M, but not yet in the UTLS region.
2.9 Land cover There are two CCI Land Cover products:
• The global surface reflectance (SR) time series • The CCI Global Land Cover map V1
The CCI Land Cover products validation plan was reviewed in CMUG Phase 1. The following sub-sections will thus not elaborate further on this validation plan. However, it is worth noting that even if the validation plan of the SR refers to the validation of both the SR composites and the global SR time series, only the latter has been achieved for the time being. More specifically only the computation of the temporal variance at the pixel level for the various spectral reflectance values has been achieved for the time being. The obtained values were compared to other reflectance values originating from other sensors (e.g., SPOT-VGT). For the CCI Global Land Cover Map V1, both qualitative and quantitative assessments were performed. Quality Global surface reflectance (SR) time series Following an analysis, the authors of the report draw the following conclusions:
• the number of pixels which contribute to the analysis of the time series is very variable whereby this is caused by the data availability or by the cloud coverage;
• the impact of undetected clouds is visible in the time series and influences the statistical parameter estimate;
• the standard deviation values reach an order of magnitude from 1.6 through 65 % (mean 22%)
In addition to the quality assessment described above, a visual quality assessment of the LC CCI global SR-7day composites has been performed. 5 different issues were identified:
• Issue 1: striped pattern • Issue 2: blurred inland band along coast lines and lake/river outlines • Issue 3: pixelized coast lines and lake/ river outlines • Issue 4: missing lakes and islands • Issue 5: NoData (NaN value) in the desert over bright areas
CMUG Phase 2 Deliverable Reference: D2.3: Technical report on product assessment Due date: December 2014 Submission date: May 2015 Version: 0.6
21 of 29
Overall the quality of the global surface reflectance (SR) 7-day composite time series product was considered satisfactory for use in current applications. The issues identified do not constitute a critical road block on the path forward. CCI Global Land Cover map V1 The Land Cover map results from a processing chain which uses the MERIS Full Resolution (FR) and Reduced Resolution (RR) multispectral SR 7-day composites as inputs. The map is a Level 4 product according to the CEOS definition. More specifically, the MERIS RR and SPOT-VGT data were used when needed to compensate for the lack of MERIS FR acquisitions. CCI Global Land Cover Map V1 Parameters Sensors Spatial
coverage Spatial grid Temporal
coverage Temporal resolution
Total data volume
Land cover MERIS SPOT-VGT
Global 300m*300m 2008-2012 1 product over 5 years
~350MB
The qualitative assessment enabled to identify a certain number of issues. However for all of them the potential solutions for their resolution have also been identified.
• Two types of spatial inconsistencies were identified: tiles limits and low resolution patterns in landscapes. The former mostly pertains to the classification process and algorithm while the latter mostly pertains to the use of lower resolution data (MERIS RR or SPOT-VGT).
• The classification of urban areas is sometimes incorrect. • Occurrences of misclassification of the larger land cover classes exist. Similarly water
is sometimes misclassified as another LC class. • Also, certain small islands appeared to have been classified as water.
Uncertainty No Uncertainty Characterisation Report is available for assessment. Maturity of data The CAR was assessed in CMUG Phase 1. In Phase 1 the climate users evaluated the impact of the new Land Cover maps on the carbon, water and energy budgets using three different land surface models (LSMs). In addition, a new procedure for converting the land cover class fractions to the Plant Functional Types (PFTs) used in the LSMs was implemented following Poulter et al. (2015). However, an inter-comparison between these models was difficult due to the fact that different reference maps were used for each model. In Phase 2 this evaluation is being extended further by assessing the impact of the uncertainty in the land cover map, as well as in the LC to PFT conversion. This will also facilitate the model inter-comparison, as the same reference map from Phase 1 of the project will be used. To that end the LC_CCI team has provided the climate users with
CMUG Phase 2 Deliverable Reference: D2.3: Technical report on product assessment Due date: December 2014 Submission date: May 2015 Version: 0.6
22 of 29
two alternative maps of the maximum and minimum “likely” biomass based on likelihood information from the classification procedure. The individual climate user groups have performed more specific assessments based on research priorities at each laboratory. At LSCE the NDVI condition was used to evaluate the leaf phenology (seasonal cycle of vegetation) before and after the ORCHIDEE LSM parameters had been calibrated with another satellite NDVI dataset. This enabled an independent verification of the optimisation performance, as the posterior simulations match the LC CCI data more closely than the prior. This demonstrates an alternative, and very beneficial, use of the NDVI condition derived by the LC CCI project. The Max Planck Institute for Meteorology (MPI-M) have used the LC_CCI Phase 1 maps to facilitate the development and implementation of new processes into the land surface scheme of the JSBACH LSM and its evaluation. The plant functional types (PFT) definition has been changed according to the new LC product and a new wetland extend dynamics (WEED) scheme has been implemented into JSBACH. The LC water body (WB) product is used as a prescribed boundary of wetland extent (JSBACH-ESA), but also for the evaluation of JSBACH-WEED. A further improvement in Phase 2 will be the provision of yearly land cover maps, and an improved characterization of land cover changes. This will enable more robust climate change simulations that include land cover and land use changes over the past 15-20 years than are possible at present. However, this work will only start in the 2nd year of Phase 2.
2.10 Fire
Quality Fire CCI summarizes the validation protocol to test the performance of the algorithms including the round-robin protocol for inter-comparison of improved and data merging algorithms in the Product Validation Plan (PVP). The validation approach follows the guidelines of the CEOS Land Product Validation subgroup (LPVS). The BA validation builds on cross-tabulation, regression analysis and the number of burned land patches detected, or variations on these. Most reference data for validation within the fire_cci project is generated by the consortium itself, but information is also gathered from other sources of data. The PVP defines therefore the requirement for reference data. The validation exercise is separated into two parts (i) use pre-selected study areas to test the performance of the BA algorithm (ii) validation of the global BA product. For the validation of the global BA product a probability sampling procedure is introduced based on spatial stratification to ensure sufficient sampling in each biomes, with a focus on regions with high BA. The study sited are validated in the Product Validation Report I (PVR I). The product validation for the global product is still ongoing. The product validation addresses requirements defined in the user requirement document (URD):
− Global accuracy, understood as the agreement between the global product and reference datasets.
− Error balance of BA estimates, understood as the level of over or underestimation of BA.
CMUG Phase 2 Deliverable Reference: D2.3: Technical report on product assessment Due date: December 2014 Submission date: May 2015 Version: 0.6
23 of 29
− Temporal stability, understood as the homogeneity of accuracy over time.
Special emphasis is given to the temporal stability of the product, a parameter which hasn’t been assessed for a BA product so far. Validated are the single fire CCI products for ten selected study sites for the different sensors applied (ATSR, AATSR, VGT, MERIS) and the final merged product. In addition previously released BA products were applied in the validation exercise to compare the performance of the fire cci products with those that are being already used by different communities. The validation report concludes that the BA products derived from MERIS show significantly better results in terms of overall accuracy than those derived from VGT and ATSR. The merging product performs significantly better than others in terms of omission errors and with similar commission errors than other European BA products. In terms of temporal stability all products showed stable validation parameters with highest values for AATSR. The fire CCI products showed medium to high values for VGT and MERIS in terms of overall accuracy, omission error and dice coefficient, with lower values for the commission error. Two measures are used to validate the temporal stability. Both test were applied in the PVR. It is not clear from the PVP or the PVR which measures should be the preferred one to assess the temporal stability of the BA product, nor are the different results discussed in the PVR. The temporal stability is assessed for the composite of study sites. This could be further separated into temporal stabilities for different land cover classes, similar to the analysis of the other accuracy measures. Overall, the PVP provides a good framework for the validation of the fire CCI product. The PVR applies this framework in its part I for the validation of the study sites. Measures and metrics are defined and explained in the PVP. The PVR could do, however, a much better job in linking to those, citing specific paragraphs and equations. What is missing is a description of the reference data used in the validation exercise. While the PVP states the requirements for reference data, none of the documents gives details on the actual reference dataset used. The Product Validation Plan misses to link to the user requirement document (URD), in which specific requirements for a validation combining different user interests are combined. The Product Validation Report (PVR) does actually link to the URD. This should, however, also be part of the PVP. In addition, it is unclear how the PVP or the PVR links to the uncertainty assessment for the BA estimates (Fire_cci_Ph2_UAH_D1_2_2_CECR_v2). The PVR Part II (Fire_cci Ph3_UAH_D4_1_1_PVR_II_v1_3) validates the global fire CCI products (MERIS_cci, VGT_cci, MERGED_cci) for the year 2008 based on 103 non-overlapping Thiessen Scene Areas (TSA) with reference fire perimeters determined from two multi-temporal Landsat TM/ETM+ images. The PVR assesses the accuracy and the error balance using six accuracy measures. In addition previously released BA products were applied in the validation exercise to compare the performance of the fire cci products with those that are being already used by different communities. In line with the local study site assessment MERIS_cci is the most accurate product of those produced by the fire_cci project (overall accuracy: 99.6 %, a Dice of Coefficient (DC) for the burned category of 28 % and errors of commission (Ce) and Omission (Oe) of 64 % and 77 % respectively). VGT_cci and the MERGED_cci product accuracy levels are lower. In comparison the MCD64 product results in: overall accuracy: 99.6 %, a Dice of Coefficient (DC) for the burned category of 42
CMUG Phase 2 Deliverable Reference: D2.3: Technical report on product assessment Due date: December 2014 Submission date: May 2015 Version: 0.6
24 of 29
% and errors of commission (Ce) and Omission (Oe) of 42 % and 68 % respectively. The PVR does not find any biome specific differences in terms of accuracy between the different assessed products. The PVR misses to intercompare the single global products beyond the single test sites. To be used in climate application users of the product will require a comparison of the product to the ones already used in various applications in climate research. At this stage no uncertainty characteristics of the fire cci products were used in the validation exercise and as the validation is limited to the year 2008 no stability measure was assessed. The Product Validation Plan misses to link to the user requirement document (URD), in which specific requirements for a validation combining different user interests are combined. The Product Validation Report (PVR) does actually link to the URD. This should, however, also be part of the PVP. In addition, it is unclear how the PVP or the PVR links to the uncertainty assessment for the BA estimates (Fire_cci_Ph2_UAH_D1_2_2_CECR_v2). Uncertainty Fire_cci compiled in phase one a Comprehensive Error Characterisation Report (Fire_cci_Ph2_UAH_D1_2_2_CECR_v2_0). The CECR summarizes potential errors related to data acquisition, data processing, and landscape characteristics in the pre-processing phase as well as errors in the burned area detection algorithm and errors related to the merging algorithm. It is documented how uncertainties will be documented for the pre-processing of the data and the burned area detection algorithm. This documentation is, however, missing for the merging algorithm. The CECR announces a guideline, that will be prepared for the users both for the pixel based and gridded product on how to use the reported quality levels of the product. Maturity of data The climate assessment report (CAR, Fire_cci_Ph3_LSCE_D4_2_CAR_v2_1) summarizes first applications of the fire_cci products and gives an idea about the maturity of the data for climate applications. Assessed are the pixel-based and gridded product for the year 2006-2008 for cci_meris and cci_merged. The cci_veg product was not applied. Compared to regional and national statistics the fire cci products underestimate burned area in line with other remote sensing based burned area products such as GFEDv4. This underestimation is related in the CAR to the omission of small fires. The pixel based product was successfully applied to derive fire patch size information. This will provide valuable information for fire model development. The gridded fire cci products were used to benchmark the fire model in ORCHIDEE. The information on landcover type burned provided by fire_cci was used to further disentangle the discrepancies. In addition, the fire_cci data were compared to other commonly used burned area products. This comparison was limited to the spatial distribution and did not address seasonal or inter-annual behavior. Furthermore, the fire_cci data was used as boundary condition in the ORCHIDEE model to derive fire CO and CO2 emissions, which compared reasonable well with earlier estimates based on a similar approach reported in GFEDv3. Overall the CAR concludes that the cci_meris product is in close agreement with the MODIS based GFEDv4 product and outperforms previous burned area data based on ESA products (GLOBCARBON, L3JRC). To further assess the maturity of the data fire_cci will have to combine their uncertainty characteristic as well as their detailed site level validation
CMUG Phase 2 Deliverable Reference: D2.3: Technical report on product assessment Due date: December 2014 Submission date: May 2015 Version: 0.6
25 of 29
with the applications performed in the climate research group to ensure that the full potential of the new product will be used.
2.11 Soil moisture Quality The overall validation approach for the CCI soil moisture product is outlined in the Product Validation Plan (PVP) which was assessed by CMUG in Phase 1. Further details on the validation results from the Round Robin Exercise are provided in the Product Validation and Algorithm Selection Report (PVASR) as well as in the Product Validation and Intercomparison Report (PVIR, v1.0). The reports provide a comprehensive overview about the product validation approaches. The PVP proposes a hierarchy of different product validation approaches with the following major components:
• Validation at point scale using in situ station data • Validation at the regional to global using cross comparisons of the ECV SM product
with other soil moisture products (e.g. SAR), precipitation records, terrestrial water storage records, data assimilation experiments and the so called R-metric. The latter quantifies the skill of a soil moisture product to compensate for known precipitation errors and provides a measure on the representation of short term precipitation anomalies by means of soil moisture anomalies.
• Analysis of long term trends of various variables (NDVI, precipitation, tree rings, runoff) and their consistency with CCI SM trends.
Different metrics for the comparison of the CCI SM product with other reference data are introduced in the PVP (e.g. correlation, bias, triple collocation error) and successfully applied in the evaluation of the round robin exercise. The PVP also provides a comprehensive overview about the required datasets for the validation. As the provided documents are overall of excellent information content, CMUG has only a few comments on aspects that were not fully covered in the available documents so far: Validation of long term product stability: The CCI SM team envisages to compare their product against a variety of different other long term EO datasets and compare the consistency of trends among these different datasets. Results published by the ECV SM team (e.g. Dorigo et al, 2012 doi: 10.1029/2012GL052988) have shown large potential of this approach. However, these kind of cross-comparison studies do not provide a means for the validation of the actual temporal stability of the data record. It is recommended that the ECV SM adopt similar measures of temporal stability like defined in the CCI SST Uncertainty characterization document (SST_CCI-UCR-UOE-001) and to develop more stringent approaches to quantify the temporal stability of the ECV SM record if possible. Unclear temporal scale for validation: The PVP remains unclear in many cases on which temporal scales the comparison with reference data will be made. For cross-comparison with

CMUG Phase 2 Deliverable Reference: D2.3: Technical report on product assessment Due date: December 2014 Submission date: May 2015 Version: 0.6
26 of 29
precipitation datasets, the ECV SM team plans for instance cross comparison with the Global Precipitation Climatology Center (GPCC) data products. These products are currently only available on monthly timescales and it remains unclear if this would be suitable for the evaluation of the CCI soil moisture product. On climatological timescales such a comparison could be useful and it has been shown by Loew et al, 2013 that the first version of the CCI SM data product shows good skill in capturing monthly precipitation anomalies at the global scale. Validation of uncertainties: the available documents lack a description of how the ECV SM team plans to validate the accuracy of their product uncertainty estimates (if planned and possible). Uncertainty & Quality The ESA CCI soil moisture project has produced a Comprehensive Error Characterization Report (v. 0.7). This provides an excellent reference document describing uncertainties in the generation of an ECV soil moisture record from either passive or active microwave observations. It also deals in details with additional uncertainty sources related to the validation of the coarse scale soil moisture products and the merging of soil moisture information from different data sources. The document provides a thorough analysis of the uncertainty terms in the ECV SM production chain. Different metrics for validation of the data products like triple collocation, R.metric and data assimilation are discussed. An assessment of an initial version of the ECV SM dataset has been made by Brocca et al. (2011) showing good correlation of the soil moisture data with in situ observations. Dorigo et al. (2014) provide a very comprehensive analysis of the uncertainties of the first version of the ESA CCI SM dataset compared against a global network of in situ observations from the International Soil Moisture Network. In general good agreement between ECV SM and in situ observations is found when using correlation as a measure for the product skill. The PVIR provides a similar thorough assessment of the ECV SM v01 and ECV SM v01 products against reference observations. Correlation ranges between 0.4 and 0.7 for different climate zones. It is found that the v02 dataset has slightly higher correlations with in situ data than the v01 dataset. A thorough assessment and cross comparison of the different data versions was however not made so far and will be subject of the Phase 2 activities of the project. The findings in the PVIR indicate nevertheless that the soil moisture data from reanalysis (ERA) shows in general a better performance than the ESA CCI products. This is not astonishing, as the ERA products incorporates a lot more of information, like e.g. precipitation, radiation, evapotranspiration, which should in principle allow to better reproduce the soil moisture dynamics. However, as the ECV SM data product is not using any additional meteorological information, it might be therefore considered as an independent data source. Maturity of data No CAR is available for assessment at the time of writing. It is expected that the next version(s) of the ECV SM product will further increase the accuracy of the data. However it will be in general difficult to quantify if the final product will meet the GCOS accuracy and stability requirements. The reason is that GCOS defines an absolute accuracy level of 0.04 [m³/m³] with the rationale of an accuracy of 10% of the typical
CMUG Phase 2 Deliverable Reference: D2.3: Technical report on product assessment Due date: December 2014 Submission date: May 2015 Version: 0.6
27 of 29
soil moisture dynamics. However, remote sensing as well as in situ measurements are often biased compared to the soil moisture of a larger area (representativeness error). Thus, while the absolute values might differ, the relative dynamics is often quite well captured by in situ and remote sensing techniques. Thus using correlation and anomaly correlations as a measure for skill is a good approach, but not implemented in the GCOS requirements. CMUG therefore recommends to revise the definition of the GCOS soil moisture requirements by including also relative accuracy measures, like it is done also for other ECV’s (e.g. albedo). The ECV soil moisture team should be encouraged to take an active role in this revision.
3. Summary of CMUG assessment of Quality, Uncertainty and Maturity in ECVs
It is challenging to summarise the assessments made in this report on the Quality, Uncertainty and Maturity in ECVs as taken from the CCI ECV project documents and other sources (GCOS 2011) for
many reasons. Firstly each CCI project is addressing its own set of issues unique to its ECV in remote
Earth system observations and data processing, secondly not all project reports are available for
assessment, and lastly the assessment is made against a wide base of potential users and applications.
However, adopting the ‘maturity index’ approach shown in Table 2 allows an overview and summary.
Table 2 shows clearly that although there are many CCI projects which have successfully tackled the
issues around producing high quality mature data with good uncertainty characterisation there are still
some that have yet to do so.
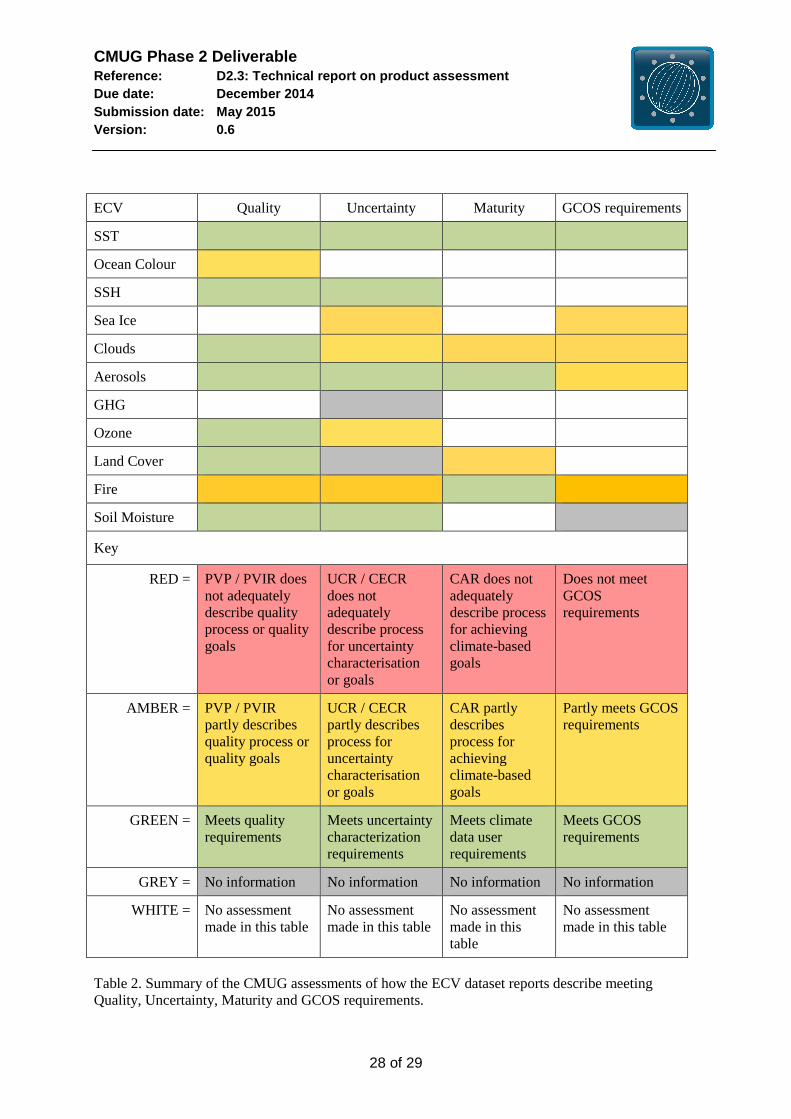
CMUG Phase 2 Deliverable Reference: D2.3: Technical report on product assessment Due date: December 2014 Submission date: May 2015 Version: 0.6
28 of 29
ECV Quality Uncertainty Maturity GCOS requirements
SST
Ocean Colour
SSH
Sea Ice
Clouds
Aerosols
GHG
Ozone
Land Cover
Fire
Soil Moisture
Key
RED = PVP / PVIR does not adequately describe quality process or quality goals
UCR / CECR does not adequately describe process for uncertainty characterisation or goals
CAR does not adequately describe process for achieving climate-based goals
Does not meet GCOS requirements
AMBER = PVP / PVIR partly describes quality process or quality goals
UCR / CECR partly describes process for uncertainty characterisation or goals
CAR partly describes process for achieving climate-based goals
Partly meets GCOS requirements
GREEN = Meets quality requirements
Meets uncertainty characterization requirements
Meets climate data user requirements
Meets GCOS requirements
GREY = No information No information No information No information
WHITE = No assessment made in this table
No assessment made in this table
No assessment made in this table
No assessment made in this table
Table 2. Summary of the CMUG assessments of how the ECV dataset reports describe meeting Quality, Uncertainty, Maturity and GCOS requirements.
CMUG Phase 2 Deliverable Reference: D2.3: Technical report on product assessment Due date: December 2014 Submission date: May 2015 Version: 0.6
29 of 29
4. References Brocca, L., S. Hasenauer, et al. (2011). "Soil moisture estimation through ASCAT and
AMSR-E sensors: An intercomparison and validation study across Europe." Remote Sensing of Environment
CMUG, 2013: Demonstration of CMF functionality for the assessment of ozone, aerosol and soil moisture. Technical Note/Deliverable 3.1v_1d, September 2013.
Dorigo, W.A., Gruber, A., De Jeu, R.A.M., Wagner, W., Stacke, T. Loew, A., Albergel, C., Brocca, L., Chung, D., Parinussa, R., Kidd, R. (2014): Evaluation of the ESA CCI soil moisture product using ground-based observations. Remote Sensing of Environment. doi: 10.1016/j.rse.2014.07.023
GCOS, 2011: Systematic observation requirements for satellite-based data products for climate (2011 Update). Supplemental details to the satellite-based component of the “Implementation Plan for the Global Observing System for Climate in Support of the UNFCCC (2010 Update)” GCOS – 154
Rodgers, C. D., 2000: Inverse methods for atmospheric sounding – Theory and practice, World Scientific Series on Atmospheric, Ocean and Planetary Physics Vol. 2.
de Leeuw, G., T. Holzer-Popp, S. Bevan, W. Davies, J. Descloitres, R.G. Grainger, J. Griesfeller, A. Heckel, S. Kinne, L. Klüser, P. Kolmonen, P. Litvinov, D. Martynenko, P.J.R. North, B. Ovigneur, N. Pascal, C. Poulsen, D. Ramon, M. Schulz, R.Siddans, L. Sogacheva, D. Tanré, G.E. Thomas, T.H. Virtanen, W. von Hoyningen Huene, M.Vountas, S. Pinnock (2013). Evaluation of seven European aerosol optical depth retrieval algorithms for climate analysis, Remote Sensing of Environment (2013), http://dx.doi.org/10.1016/j.rse.2013.04.023
Holzer-Popp, T., de Leeuw, G., Martynenko, D., Klüser, L., Bevan, S., Davies, W., Ducos, F., Deuzé, J. L., Graigner, R. G., Heckel, A., von Hoyningen-Hüne, W., Kolmonen, P., Litvinov, P., North, P., Poulsen, C. A., Ramon, D., Siddans, R., Sogacheva, L., Tanre, D., Thomas, G. E., Vountas, M., Descloitres, J., Griesfeller, J., Kinne, S., Schulz, M., and Pinnock, S., Aerosol retrieval experiments in the ESA Aerosol_cci project, Atmos. Meas. Tech., 6, 1919 - 1957, doi:10.5194/amt-6-1919-2013, 2013.
Kinne, S. & the entire aerosol CCI-team, ESA’s new 17 year ATSR climate data record, ESA internal document, 2014.


![ESA [ECV] CCI Newsletter - Met Officeensembles-eu.metoffice.com/cmug/06_CMUG_web.pdf · 2016-01-26 · CMUG CCI Newsletter | Issue n. 6 | Jan 2016 The next cmug@metoffice.gov.uk Met](https://img.pdfslide.us/doc/110x75/5f3e774154e648248c07c6ad/esa-ecv-cci-newsletter-met-officeensembles-eu-2016-01-26-cmug-cci-newsletter.jpg)