Embed Size (px)
Citation preview
CLIMATE IN MEDIEVAL IRELAND
AD 500-1600
IAN CANTWELL (BA.HON.)
Submitted to the Department of Archaeology and Paleoecology for an MSc. Degree
AD 2000

PREFACE
The genesis of this dissertation grew out of a seminar paper for an undergraduate
course on Climate Change taught by Pete Coxon in Trinity College, Dublin. Through
the obscure workings of fate this was given as a lecture to the Association of Young
Irish Archaeologists and published in a somewhat mangled form the same year under
the title 'Climate Change and the Gaelic Annals' (Cantwell 1998 15-20).
At that time, given the quantity of entries in the Annals and the general interest in
Climate History it was somewhat surprising to find that the literature, with the
exception of a few works such as Wilde (1856), Britton (1937), and Lyons (1989), the
field was completely unexplored. After a review of the possible sources the
conclusion was drawn that these Annals and the Dendrochronological record were the
only data sets that continuously covered the medieval period of AD 500-1600. At the
time of writing (1998) the available Dendrochronological record was kindly given to
me by Mike Baillie in indices form. At that time I had neither the expertise or training
to make any headway with the exception of the realisation that they do not contain
long term changes and that it was also difficult to make any correlation between
indices and volcanic activity.
This work continues the research of this neglected subject
I wish to thank Mike Baillie for providing me with the data and for guiding me
through the process as well as for his support and discussions throughout the year.
I would like also to thank Christian Pfister and Jurgen Luterbacher for useful
discussions of the work in progress in July of this year.
My appreciation also goes to Fiona Fitzsimons who read some of the chapters and
taught me lessons on editing, clarity and style.
To Cathy Dunne for our friendship.
To my children, Tadeusz and Jasmin, for permission to flee the nest and to them I
dedicate this work.
"It may be a lie, but it will do 'til a bigger one comes along".
On Broadway, Damon Runyon (1928)
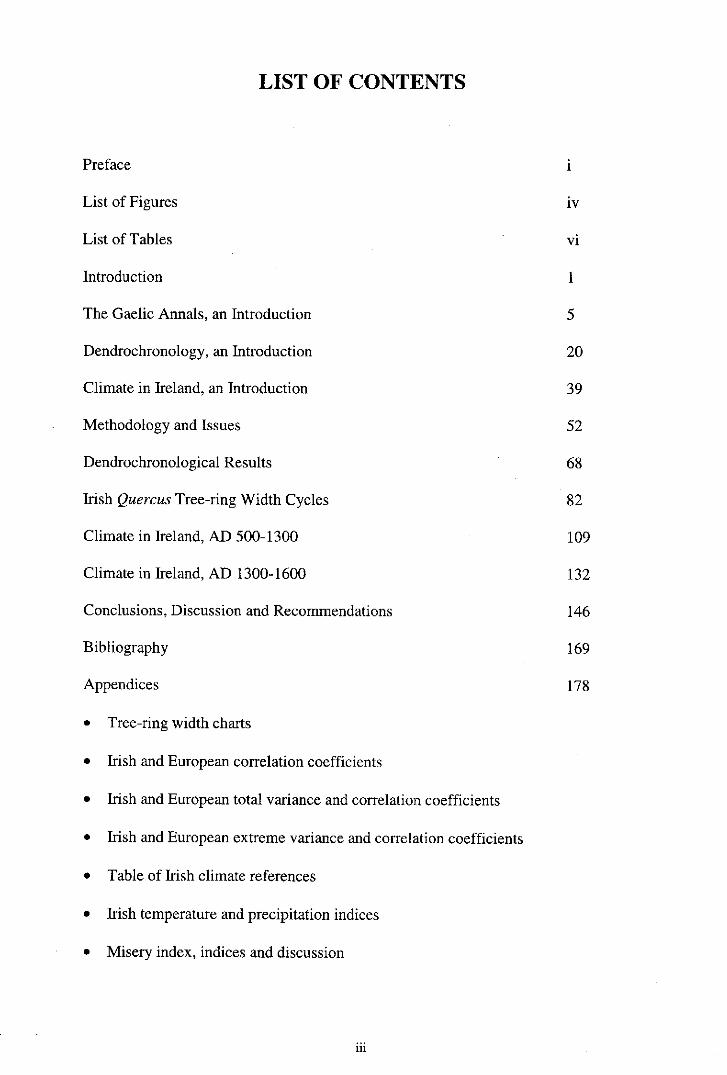
LIST OF CONTENTS
Preface i
List of Figures iv
List of Tables vi
Introduction 1
The Gaelic Annals, an Introduction 5
Dendrochronology, an Introduction 20
Climate in Ireland, an Introduction 39
Methodology and Issues 52
Dendrochronological Results 68
Irish Quercus Tree-ring Width Cycles 82
Climate in Ireland, AD 500-1300 109
Climate in Ireland, AD 1300-1600 132
Conclusions, Discussion and Recommendations 146
Bibliography 169
Appendices 178
• Tree-ring width charts
• Irish and European correlation coefficients
• Irish and European total variance and correlation coefficients
• Irish and European extreme variance and correlation coefficients
• Table of Irish climate references
• Irish temperature and precipitation indices
• Misery index, indices and discussion
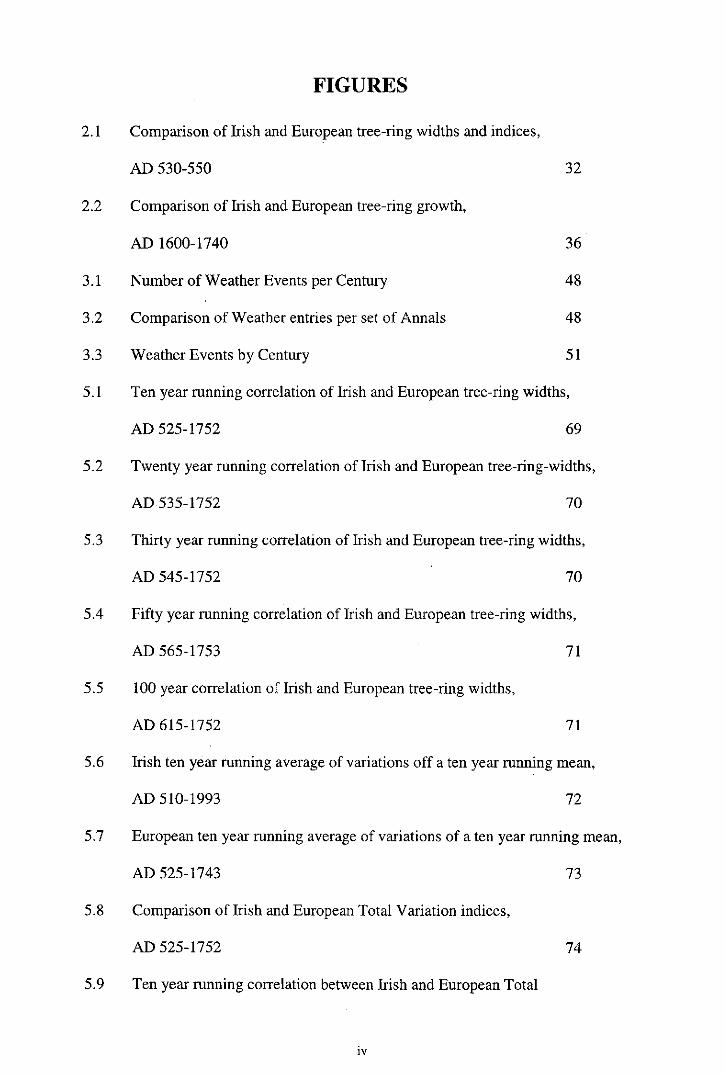
FIGURES
2.1 Comparison of Irish and European tree-ring widths and indices,
AD 530-550 32
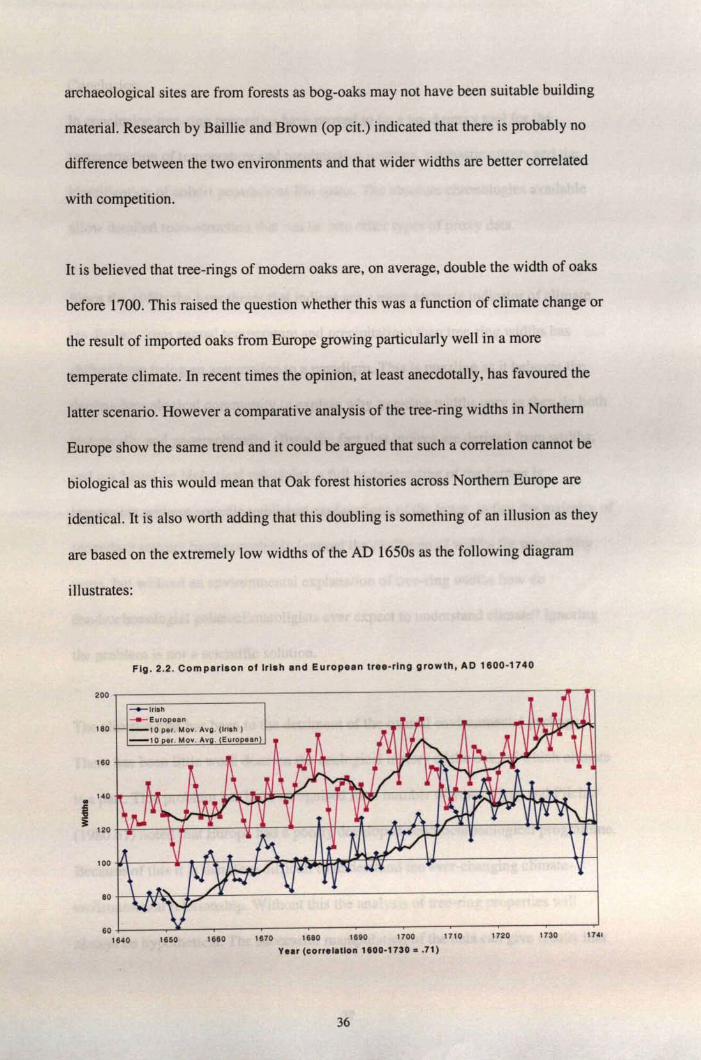
2.2 Comparison of Irish and European tree-ring growth,
AD 1600-1740 36
3.1 Number of Weather Events per Century 48
3.2 Comparison of Weather entries per set of Annals 48
3.3 Weather Events by Century 51
5.1 Ten year running correlation of Irish and European tree-ring widths,
AD 525-1752 69
5.2 Twenty year running correlation of Irish and European tree-ring-widths,
AD535-1752 70
5.3 Thirty year running correlation of Irish and European tree-ring widths,
AD 545-1752 70
5.4 Fifty year running correlation of Irish and European tree-ring widths,
AD 565-1753 71
5.5 100 year correlation of Irish and European tree-ring widths,
AD 615-1752 71
5.6 Irish ten year running average of variations off a ten year running mean,
AD 510-1993 72
5.7 European ten year running average of variations of a ten year running mean,
AD 525-1743 73
5.8 Comparison of Irish and European Total Variation indices,
AD 525-1752 74
5.9 Ten year running correlation between Irish and European Total
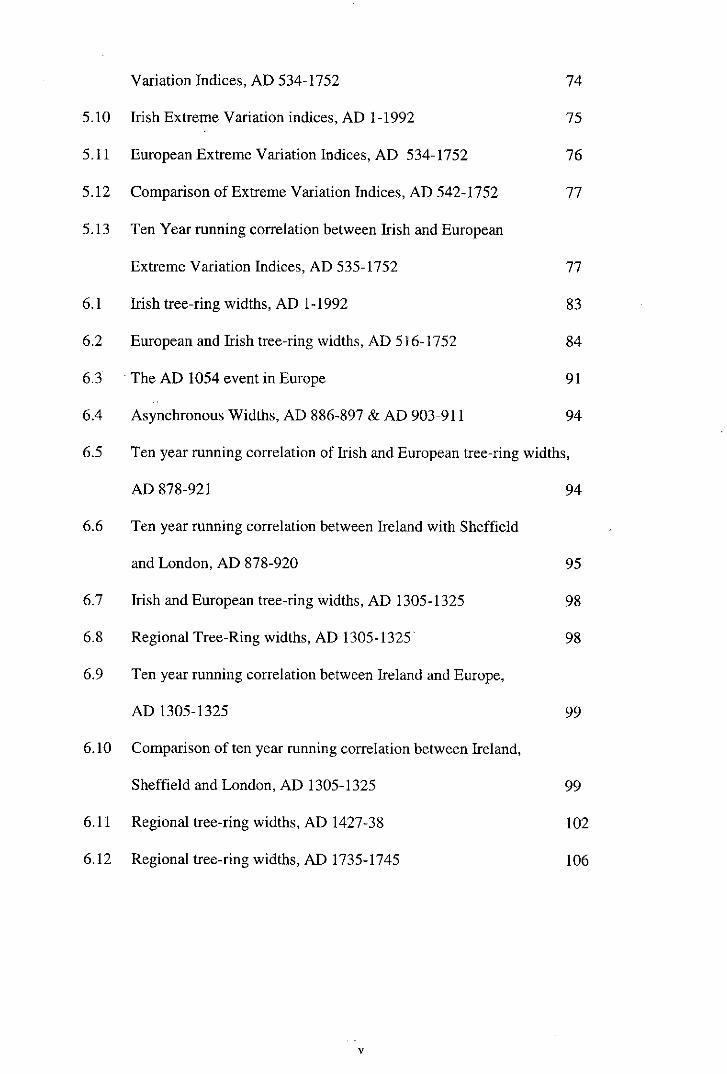
Variation Indices, AD 534-1752 74
5.10 Irish Extreme Variation indices, AD 1-1992 75
5.11 European Extreme Variation Indices, AD 534-1752 76
5.12 Comparison of Extreme Variation Indices, AD 542-1752 77
5.13 Ten Year running correlation between Irish and European
Extreme Variation Indices, AD 535-1752 77
6.1 Irish tree-ring widths, AD 1-1992 83
6.2 European and Irish tree-ring widths, AD 516-1752 84
6.3 The AD 1054 event in Europe 91
6.4 Asynchronous Widths, AD 886-897 & AD 903-911 94
6.5 Ten year running correlation of Irish and European tree-ring widths,
AD 878-921 94
6.6 Ten year running correlation between Ireland with Sheffield
and London, AD 878-920 95
6.7 Irish and European tree-ring widths, AD 1305-1325 98
6.8 Regional Tree-Ring widths, AD 1305-1325 98
6.9 Ten year running correlation between Ireland and Europe,
AD 1305-1325 99
6.10 Comparison of ten year running correlation between Ireland,
Sheffield and London, AD 1305-1325 99
6.11 Regional tree-ring widths, AD 1427-38 102
6.12 Regional tree-ring widths, AD 1735-1745 106
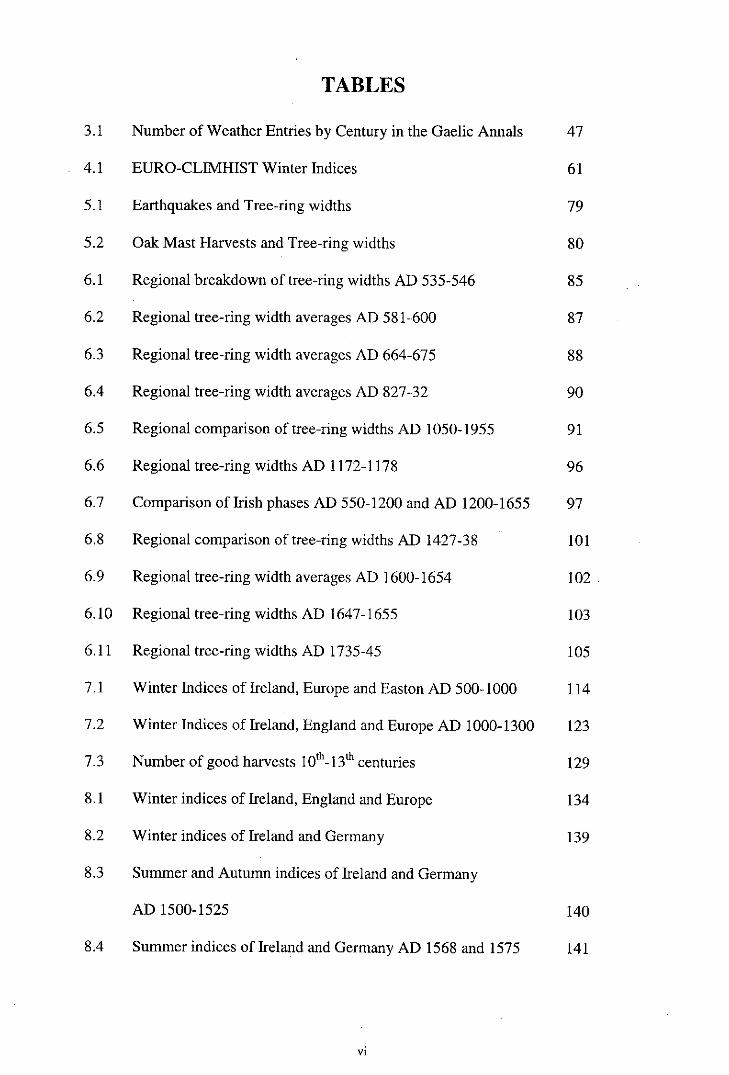
TABLES
3.1 Number of Weather Entries by Century in the Gaelic Annals 47
4.1 EURO-CLIMHIST Winter Indices 61
5.1 Earthquakes and Tree-ring widths 79
5.2 Oak Mast Harvests and Tree-ring widths 80
6.1 Regional breakdown of tree-ring widths AD 535-546 85
6.2 Regional tree-ring width averages AD 581-600 87
6.3 Regional tree-ring width averages AD 664-675 88
6.4 Regional tree-ring width averages AD 827-32 90
6.5 Regional comparison of tree-ring widths AD 1050-1955 91
6.6 Regional tree-ring widths AD 1172-1178 96
6.7 Comparison of Irish phases AD 550-1200 and AD 1200-1655 97
6.8 Regional comparison of tree-ring widths AD 1427-38 101
6.9 Regional tree-ring width averages AD 1600-1654 102
6.10 Regional tree-ring widths AD 1647-1655 103
6.11 Regional tree-ring widths AD 1735-45 105
7.1 Winter Indices of Ireland, Europe and Easton AD 500-1000 114
7.2 Winter Indices of Ireland, England and Europe AD 1000-1300 123
7.3 Number of good harvests 10 t h -13 t h centuries 129
8.1 Winter indices of Ireland, England and Europe 134
8.2 Winter indices of Ireland and Germany 139
8.3 Summer and Autumn indices of Ireland and Germany
AD 1500-1525 140
8.4 Summer indices of Ireland and Germany AD 1568 and 1575 141
INTRODUCTION
The aim of the dissertation is to reconstruct climate in Medieval Ireland using
documentary and dendrochronological proxy data from Ireland and Northern Europe.
There is no comprehensive explanation for climatic change in either the long or short
term. The overall external motor is solar forcing and other important influences are
oceanic currents, atmospheric systems and the interplay between them. Other
contributory factors are the earth's magnetic field and tectonic activity. None of these
can be taken in isolation as all create feedback, either positive or negative, into the
planetary climatic systems. It is important not to see the planet as a passive receptor of
influences with predicable outcomes but a dynamic open system with inputs and
feedback of varying magnitudes that can result in gradual or instantaneous change.
The potential changes are unpredictable and developing research into Chaos theory
may give further insight into some of the past and present climatic dynamics. Further
complicating factors are stochastic terrestrial and extra-terrestrial events, which can
influence climate by blocking out solar radiation for a number of years depending on
the event's strength and global coverage.
The issue of regional climate change in the historic period is of importance because
regional variations of climatic cycles have only begun to be researched in the last
twenty years in Europe. Before 1980, historical climatologists tended to treat Europe
as a homogenous region with uniform climatic periods. When European climate is
compared to what can be deduced about Irish climate, in terms of the relative
importance of oceanic and continental weather systems, it should be possible to a
develop a regional synthesis relevant to Ireland. It was decided that rather than
attempt to fit Ireland, 52-55°N and 6-10°W, into the continental region, i.e. Northern
Europe or Western Europe, it was reasonable to posit a region called the North West
Atlantic Region, as a perspective for researching the primary influence of oceanic
weather systems.
Since the 18 t h century instrumentation has become the standard methodology for the
measurement of climatic parameters. Before then a wide number of proxy records
have to be used, all of which have advantages and disadvantages. Within an Irish
context the most complete in terms of coverage are documentary sources, Quercus
tree-ring widths and palynological records from lacustrine and peat sources. The
sources used in this dissertation are the Gaelic Annals and Quercus tree-ring widths,
Other proxy record types, where they survive, do not have the requisite temporal
definition for annual reconstruction.
Climate in Medieval Ireland is examined using two different methodologies. The first
is the methodology of seasonal weather analysis pioneered by Pfister and the EURO-
CLIMHIST programme for the scientific analysis of documentary sources and is
supplemented by Lamb's similar research methodology on English climate. The
second methodology is the analysis of Quercus tree-ring widths from Ireland and
northern Europe. Both approaches are experimental though in the former
methodology there is a ten-year publication record with which to make comparisons
unlike the latter for which there is minimal literature and published methodologies.
Pfister (1995 332) states that the best climatic reconstructions are conducted by
scholars who are:
• Native speakers of the language in which the sources are written
• Trained to distinguish between reliable contemporary and unreliable non-
contemporary information
• Familiar with the economic and natural properties of the particular natural, social
and institutional environment, in which the documents were created.
To which may be added:
• Familiar with the particular sciences involved in data interpretation and putting
them into their environmental, historical and geographical contexts.
This author does not qualify as a native speaker of Gaelic (Primitive, Old, Middle or
Early Modern) or Latin. The second point is not an issue as, according to the strict
criteria laid down by the EURO-CLIMHIST programme there are no 'reliable
contemporary' annals for Ireland and they are therefore not suitable for climatic
reconstruction. The dissertation argues that they are reasonably consistent with each
other and chronologically reliable. It would be unreasonable to ignore this wealth of
data from a region for which there is no other information, especially when the focus
of modern climatic research is an understanding of regional patterns. As for the third
and fourth points, readers may make their own judgment.
The format of the dissertation is as follows: the first three chapters are introductory
reviews of the Gaelic Annals, dendrochronology and climate in Ireland. The fourth
chapter is a description and discussion of the research methodologies used. The next
two chapters discuss the dendrochronological results and the following three offer a
climatic reconstruction of the medieval period. Where possible links between
dendrochronological and documentary results are noted. The last chapter concludes
with conclusions, a discussion of the relevance of the findings to Irish social history
and research recommendations.
Dating conventions
The calendar year, from 1 s t January to 31 s t December in the standard historic BC/AD
classification, is the chronological format. When winter events began in December
and continued into January, February and/or March, they have been counted once in
the second year. All BP (before present i.e. 1950) dates are standard calibrated
radiocarbon years.
For the purposes of the dissertation the Medieval Period is taken to be from AD 500
to AD 1600. The traditional historic dates for the same period are c. AD 500-1534,
which is followed by the Early Modern Period.
Dendrochronological data
All tree-ring widths in charts and tables are given as whole numbers where 100
represent 1mm. The agreement of 100 (1mm) with standard indices based on a value
of 100 is a coincidence.
GAELIC ANNALS: AN INTRODUCTION
The potential of the Gaelic Annals as a source of data for the research of the history of
climate change in North Western Europe during the medieval period has not been
adequately appreciated. Firstly a discussion of what the annals are and how they came
to be compiled would be useful. This is followed by an examination of their place in
the overall context of Irish and European literature in the medieval period as well as a
review of how these sources have been used for climatic reconstruction.
Origins
The annals are believed to have originated from written calculations for the date of
Easter. These paschal tables were introduced into Ireland at least by the development
of the monastic period in the late 7 t h and early 8 t h centuries but may have been here
earlier with the introduction of Christianity in the 4 century. The methodology for
computing accurate Paschal tables caused ongoing controversies in Europe at this
time. Irish monks, in the early 7 t h century, based their calculations on an 84 year cycle
derived from the Galician church of the 4-5th century. These computations were
superseded by a work known as 'Cunniam's letter' (written c. AD 633) and a related
text by the same author, De ratione compuntandi (O'Croinin 1995 201). It has been
argued that from c. AD 700 monks got into the habit of writing some of the major
events of the year onto the table's margins under the influence of European
chroniclers from Antiquity, such as Eusabius and Jerome, (O'Croinin 1983 pp.74-86).
These occasional entries developed into regular compilations, were expanded over the
centuries and continued until the end of the AD 1500s; though with one major hiatus
at the end of the 12 t h century.
It is likely that by the 12 century most major monasteries had an ongoing
compilation as part of scriptrorial policy. However the course of Irish history has
resulted in the destruction of all original annals. All that has survived is a number of
copies and one translation, made in the late medieval and early modern periods. These
collections are in Irish, Latin and Stuart English and have been published over the last
150 years, sometimes with translations of variable quality. The material is primarily
necrologies, church and secular events and includes weather and other miscellanea
(Mac Niocaill 1975 335-75).
The history of each particular compilation can be found within the introductions of
published editions and in a number of secondary works. Suffice to say their origins
are subject to continuos research and a partial picture of their respective histories and
'genealogies' is now emerging. It is now possible to say where they were compiled, in
what periods, as well as argue how a particular political bias can indicate within
which area of the island the annals, or part of, were compiled or copied. This has led
to the realisation that these compilations do not necessarily have one point in origin
but can come from several different monasteries and have been added together or
copied at later periods. The terms 'original' and 'contemporary' have to be used
cautiously as these concepts were not deemed important by medieval monks.
As all sets of Gaelic Annals are copies, consideration has to be given to possible
editorial biases. It is now argued that most Irish literature went through a continuos
process of copying. Internal examination of the literature shows how the process of
redaction reflects the changing nature of political life and of the monasteries' role in
perpetual political power struggles. A comparison of the subtle changes in the copies
over time allows historical reconstruction.
History
It is possible to discern three major cultural periods with there own trends and these
can be roughly dated as AD 500-1100, AD 1100-1500 and AD 1500-1600. These are
not coterminous with the evolution of the Gaelic Language defined and roughly dated
as Primitive Irish before AD 600; Early Irish AD 600-900; Middle Irish AD 900-1200
and Early Modern Irish AD 1200-1500.
The first period, AD 500-1100 includes the establishment of Christianity into Ireland.
Annalistic entries are usually short and not very informative, mythology and poetry is
common. After about 700AD-800AD the quality of the information, from a 20 t h -21 s t
century perspective, improves though care has to be taken with interpretation, given
the considerable cultural differences of the last 1,000-1,500 years. From the middle
11 t h century the Church Reform movement started to influence the organisation and
literary output of Christianity on the island. The reform process was accelerated by
the arrival of Richard fitz Gilbert de Clare at the end of the 12 t h century as it
inaugurated a major series of invasions and conquests, which led to the ultimate
colonisation of most of the island by the end of the 17 t h century.
The combination of Church Reform and conquest caused a major hiatus in the
keeping of Annals and the practice was temporarily abandoned in many of those
monastic foundations that survived. After about AD 1250-1300 the practice was
reintroduced in some monasteries from both cultural traditions though the Gaelic
predominates. Within the context of the period it was not the Annals that were
considered wrong but it was the 'primitive' and 'superstitious' entries that caused
offense to 12 t h century European intellectuals. Entries, from c. AD 1250, show a
greater attention to detail and their accuracy and dating is more to modern research
tastes though care still has to be taken in understanding the political and cultural
context of any particular entry.
After about AD 1550 the impact of the Reformation and the Renaissance began to
influence the Annals and they make a transition to narrative chronicles, particularly in
the Annals of the Four Masters.
It is also worth noting that two of the major compilations, viz. Annals of the Four
Masters and Annals of Clonmacnoise, date from the 17 t h century. The first is the
result of a literary rescue operation set up when it was recognized that the very nature
of Gaelic society was under threat from Tudor political expansion and Church
Reformation. In the case of the Annals of Clonmacnoise the translation is in Stuart
English and is not overly trusted as the original is missing. Again great care has to be
taken with these two compilations in the former case with interpretation, as one has to
appreciate that what we have are Renaissance perspectives of medieval history and
mythology (Simms 1987 1-3). These are not necessarily sympathetic and this can be
seen from the introductions of Michael O'Cleirigh and Conell Mac Geoghegan.
Interpretation
Overall the content of the annals have to be used with caution. Any interpretation
must be in tune with the significant changes of the structure and expression of Gaelic
culture over the period, notwithstanding the impression given by medieval literature
of an unchanging society. The modern interpreter must also be aware that the
medieval concept of history was based on a providential perspective, i.e. that history
reflects God's plan before the Second Coming of Christ. It is also worth noting that
the last famine was over 150 years, or five generations, ago and this is the longest
period between famines in recorded history. Historians forget the insecurity and
uncertainty created by famine, plague and endemic violence, both real and potential,
at their peril.
Weather events are unlikely to have suffered from editorial manipulation over this
period, as there would be little advantage in doing so. There are, however, a number
of other problems. Without recourse to the originals it is impossible to say whether
the copying was complete or accurate. It is possible that when the entries were
subsequently rewritten it was not necessarily in the same way, and this can lead to
distortion, misinterpretation and, sometimes, total loss of meaning. Other problems
include piecemeal destruction as described by Mac Geoghegan:
".. . Taylors to cutt the leaves of said Book & sliece them in long peeces to
make theire measures off." (Annals of Clonmacnoise, translators introduction)
Chronology
Chronological issues are important and can be subdivided into the overall temporal
framework and the dating of any particular entry. Though the period of literacy dates
from the AD 700s the monastic communities inherited oral histories and these
chronologies are believed to have been re-calculated to fit in with Biblical
chronology. The reason for this is related to the early Christian Church's search for
their origins and how they fitted Irish history into Post-Flood migrations as described
by the Old Testament. Historians now believe that Iron Age oral history and traditions
were heavily reworked and fairly reliable dating starts about 500AD, material before
then has to be used with extreme caution (reviewed by McCarthy 1998 98-116).
It must be noted that this assessment of chronology is based on the accepted historical
models of the transmission of literacy and spread of Church literature, but there is no
independent research from other academic disciplines. An interdisciplinary research
programme would be useful here. McCarthy's recent article (McCarthy 1998 98-152)
on the chronological apparatus of the Pre-Patrician Annals is a convenient starting
though it focuses exclusively on the non-Irish material and has no discussion on how
this may compare to the Irish material. It has to be said that it is easier to compare the
non-Irish material with other European sources because the Irish material is rarely
comparable with non-Irish literature. The influence of Christian chronology on the
traditional oral chronology is not yet fully understood.
It is possible that significant natural events were important 'architectural' features in
the chronological framework of oral traditions into which human events were then
inserted. If this is the case natural events were less likely to suffer from 'loss of
memory' unlike obituaries of early church founders, such as St. Patrick, who appears
four times in the Annals of Ulster (O'Croinin 1995 26). This type of duplication is not
found for natural events. Since the middle of the last century the issue of chronology
has been explored in some detail and historians appear to be reasonably happy with
the calibrations of the individual sets of Annals though they might dispute the dating

of any one particular event. A recent article that used astronomical data as a control
found that the Annals of Ulster are accurate back to AD 773 with only a two year
error before then back to the 5 t h century (McCarthy & Breen 1997 1-43).
There are sometimes differences of up to five years between the reporting of the same
event in the different annals, particularly before AD 950, after about c. AD 1200 there
is almost complete agreement. These differences are probably due to 'slippage' while
copying, and this gives rise to the problem of chronological control of any particular
entry. In general terms the Annals of Ulster are deemed to be the most accurate and
the standard by which other sets of Annals are calibrated. An allied problem is the
duplication of events in the Annals. It has been argued that this duplication has been
has caused European climate historians to misinterpret the data by suggesting that
certain periods were worse than they actually were (Pfister et al 1998 537). This is
rarely seen in the Gaelic Annals.
Irish literature in a European context
These compilations can also be discussed within the context of European literature.
Up to the 6 t h century the most important European historic sources are the
Mediterranean Civil and Christian authors, based mostly in Rome and Constantinople.
Literacy was principally a church profession after the collapse of the Roman Empire
and was used mostly, if we exclude theological and related works, for writing history
and developing the administrative apparatus for the Papal territories and the nascent
Frank Empire. Over time there was an expansion in the number of manuscripts, about
7,000 manuscripts survive from the Carolingian period as compared with 500 from
the Merovingian Court before AD 750. There was a decline of manuscript production
in AD 900-1000 believed to be due to the combined impacts of invading Hungarians,
Vikings and Slavs. Manuscript production increased significantly thereafter due to the
combined influences of the expanding Ottonian empire; foundation of Universities;
and influence of the Latin and Greek scholars with texts who came to Italy after the
fall of Byzantine empire (Pfister et al 1998 536-7). Literacy began to be used more
within civil society particularly in relation to the control and administration of land
and feudal relationships. A further major expansion occurred in the 15 century when
the Church lost exclusive control of literacy because of Humanism and the first
stirrings of scientific investigation.
In Ireland all early literature was imported from Antiquity, via France and Spain, and
became the basis for future literary endeavors though this was influenced by
established Iron Age oral traditions. The Early Medieval corpus contains the Annals
and a large quantity of Law texts (Seanchas or Peritia); Latin and Gaelic educational
texts; hagiographies; poetry; mythology and pseudo-history; as well as copies of the
most important theological and associated works. The earliest manuscripts are from
the late 5 t h century and production significantly increased after the foundation of
monastic schools in the middle of the 6 t h century. Ireland also has the oldest
vernacular literature in Europe dating from the 7 t h century at the latest (O'Croinin
1995 169-95). Most of this vast corpus is still in manuscript form or appears in
published editions of varying quality over the last 150 years.
In comparison with the rest of Northern Europe, Gaelic literature represents a culture
without a centralised kingship with associated court administration and is unique
because Ireland was never directly affected by the expansion of the Roman Empire.
However, the original belief that Ireland single-handedly dragged Europe out of the
'Dark Ages' is now not accepted by Irish historians (O'Croinin 1995 196-232). In
terms of quantity and coverage Irish literature is far superior to any other collections
in Northern Europe until the 9 t h century.
Thereafter there appears to be a literary decline in Ireland and by the 11 t h century the
number of Irish manuscripts were a small fraction of the European total. According to
Pfister (1998 537) the combined total of Irish and British references to climate
amounted to 2% of the total in AD 700-1300, though it is unclear whether any of the
Gaelic material has been included due to it's non-contemporary nature. It would be
useful to have these analysed by century as Ireland and Great Britain may show
higher proportions for earlier centuries.
There are only a few, but essential, medieval works dealing with environmental topics
in Ireland. These include an early 7 t h century description of Ireland by an anonymous
author who used the pen name Augustine, entitled De mirabibilus sacrae scripturae;
the itnran, Navigatio Sancti Brendani Abbatis (about 120 known versions); and Liber
de mensura orbis terrae, written c. AD 825 by Dicuil, a monk attached to the
Carolingian Court. It is likely that a research programme into such Irish sources
would provide complementary proxy climatic information for the early medieval
period. A similar project is being currently carried out at the University of Ioannina,
Greece, into Greek and Byzantine sources (Telelis & Chryros 1992 19-20).
From the 12 t h century there was a temporary decline in Gaelic literature until the mid-
13 t h century but this is somewhat compensated by the introduction of Royal, estate,

legal, urban and local administrative records though these mostly only cover areas
under Anglo-Norman control. From the mid-13th century there is a resurgence of
Gaelic literature in competition with Anglo-Norman literature, though acculturation
processes were a major influence. In the 16 century Renaissance, Humanism and the
Counter Reformation inspired modernised monasteries, such as the Franciscan Order
of Donegal, who were responsible for the Annals of the Four Masters and the copying
of other Gaelic literature: The continuos literary tradition compares very well with the
rest of Northern Europe, outside of the core Roman Empire, for example east of the
Oder River literacy was not introduced until the 10-11 t h century.
Obviously it would be ideal to compare the Irish Annals with European literature.
However this is a difficult task as they are dispersed widely and quantity of critical
texts with adequate translations is limited. A major exception is the collection known
as Monumenta Germaniae Historica Scriptores consisting of 33 volumes (Pfister et al
1998 536).
European Literature as a proxy source for climate research
There is a long tradition among a small number of historians and scientists who have
used documentary data for the purposes of climatic reconstruction over the last 100
years, from northern Europe in particular. Their research publications have been
critically reviewed over the last twenty years and have been found wanting. Modern
researchers now criticize earlier researchers for having an uncritical approach to their
source material by not fully discriminating between contemporary and non-
contemporary sources. They also argue that earlier researchers often misunderstood
the various styles of Calendars, mis-dated events, multiplied extreme events and
constructed incorrect climate chronologies (Pfister 1998 538 and Grove 1988 3). For
instance Grove argues that this imprecision has caused scientists to have negative or
agnostic attitudes to documentary sources (ibid, quoting Bell & Oglivie 1978 331-48).
Modern authors therefore advise caution in interpretation and their present focus is on
meticulous scientific exactitude where possible. However literary climatic research
still remains controversial and some researchers question the validity of using such
data (Landsberg 1985 28-30). This type of, possibly, extreme opinion has now been
largely rejected as further progress in documentary analysis has been made in the last
twenty years.
In some countries the scientific community tends to avoid the historic period, due to
unpredictable anthropogenic influences, and the optimistic belief that historic sources
will provide enough data to build environmental recontructions, as distinct from
climatic history, (i.e. Edwards 1985 215). However many sources are ambiguous and
not easily datable, which this gives problems of interpretation.
Lone researchers until about the 1960s have usually conducted historical climate
research when some Universities began to specialise in the subject. In England under
the influence of Manly and Lamb the University of East Anglia set up a Climatic
Research Unit. Lamb developed historic climate research as an academic discipline in
England and though his ideas are being criticised he is still the inspiration and
benchmark of modern research. One of his major contributions was the development
of synoptic maps of barometric pressure, which give geographical coverage of a time
period as distinct from a time-transgressive series. This provides new insights into the
regional variations of extreme climatic events.
The next major development was the founding of the EURO-CLIMHIST project in
1990 with three main aims (Pfister et al 1994 330):
• As a means to investigate the causes of climatic variation on two fundamental
time-scales: decedal and century
• As a means to investigate the relationship between climatic variability and
changes in the frequency and severity of anomalies
• As a tool to assess impacts of climatic changes on pre-industrial economies and
societies both in the short and long-term.
Their major contribution has been the development of indices for the measurement of
temperature and precipitation. The idea of indices is not new and have been
experimented with since the 1920s by such researchers as Easton, Brooks and
Vanderlinden and more recently by Lamb, Manley, Alexandre, Buisman & van
Engleman and Pfister etc. (Glaser et al 1999 170 & Pfister et al 1998 536).
Pfister's indices have been integrated into the EURO-CLIMHIST project and have
since been standardised and computerised and form the basis of their research some of
which is in conjunction with PAGES (Past Global Change) under the auspices of the
IGBP (International Geosphere-Biosphere Programme). This database has
approximately 600,000 pieces of data from AD 750 of which 8,850 are for the period
before AD 1300. Primary work was done on verification by contrasting Pfister's
indices with instrumental data. European studies now include work on the Maunder
Minimum, AD 1675-1715; the 16 t h century; the 14 t h century; and the early medieval
period. These studies cover seasonal weather patterns for the 16 -18 centuries and
before then concentrate mostly on winter temperatures. At this stage there is a year by
year understanding of the major atmospheric system patterns back to c. AD 1500,
excluding Ireland (Pfister pers. com.).
The source material in Europe used for the indices are Annals; Chronicles; estate
records; administrative records relating to the timing, amount and quality of
agricultural produce; financial records of rents, prices, tithes and taxes; cultural events
such as rogation ceremonies; ship's logs and weather diaries. Annals and Chronicles
are extant for northern Europe back to 8 century and the vast majority of other
record types survive from the late AD 1400s.
Medieval climate research in Ireland
Medieval climatic research is practically non existent in Ireland though some research
has been published, particularly by Wilde in the late 1840s, Britton in the 1930s, and
Lyons in the 1980s (see bibliography). In them climate is primarily a backdrop to the
exploration of famine and disease on the island. The secondary literature on the
history of medieval Irish climate is very poor, if not completely non-existent.
Unfortunately there is no interdisciplinary research between historians and scientists
in Ireland unlike Europe or the positive relationship that currently exists between
archaeologists and palaeoecologists. This has had a knock on effect in the rest of
Europe where the Gaelic sources are largely unknown, rarely appearing in
Bibliographies and lists of Source Material (i.e. Lamb 1982). According to the
EURO-CLIMHIST programme Irish climate history is largely unknown (Pfister pers.
comm.).
It is worth noting that Ireland lacks most of the above mentioned late medieval and
early modern documentary types because there was a poorly developed central and
local government, and therefore few records were kept. During the period AD 1450-
1680 the political situation was too unstable for the development of a Renaissance
literature. There are some surviving Court, Administrative, Legal and Administrative
records, AD 1200-1600, but these are patchy and from the climate historian's
perspective not very informative. One example of the use of Estate records was by
Lyons (1989) who attempted to quantify the effects of the Black Death but found that
the records were so fragmentary that only tentative conclusions could be drawn. Many
medieval manuscripts were unfortunately lost in 1922 when the Public Record Office
of Ireland was destroyed during the Irish Civil War.
Historians have mostly ignored the data with some exceptions. By and large the
tendency is to pick weather entries as part of the backdrop to their expositions and use
Lamb (1977, 1982 & 1995) as a general source, notwithstanding the fact that he rarely
refers to Ireland. Generally they don't appear to rate climate or climatic change of
being of any particular importance. In this they are not alone as many European
historians share the same ideology of political and cultural determinism. Recently
scientists have used them as a source for catastrophic events, which have short or
long-term effects on the environment and human population (i.e. Baillie 1995 &
1999). In both cases the entries, while of potential significance, are missing the
overall climatic context.
In conclusion the Irish Annals have not been used as a source for the reconstruction of
climate and climatic change for the medieval period. This however is only part of the
problem because, compared to the rest of Europe, climatic research is undeveloped in
Ireland by nearly all academic disciplines.
DENDROCHRONOLOGY: AN INTRODUCTION
This chapter will discuss the origins, nature and applications of dendrochronology and
the advantages and disadvantages of the science as an analytic tool for climatic and
environmental reconstruction.
Dendrochronology was developed in the early part of the 20th century and was
quickly adopted as an analytic tool for chronological, solar cycle and climatic
research, most notably among pioneers such as Douglass and Shvedov (Robinson et
al 1989, 1-21). Since it's initial foundation the basic principles of dendrochronology
have been established and the science of measurement and art of interpretation of tree
rings has expanded. The practical applications of the science are widespread and
range from the reconstruction of temperature and precipitation as a proxy for climate;
absolute dating and social reconstruction within archaeological contexts; radiocarbon
calibration; and the dating and scaling of stochastic environmental events.
The first major principle to be established was that different trees of the same species
could be cross-dated. Research has shown that it is possible to develop absolute
comparisons over a wide geographical area. This has allowed the construction of
chronologies for a number of different species, of which the most notable are Pinus
and Quercus. However there is not global coverage, for example hardwoods in
Tropical Rain forests are difficult to analyse and environments, with extreme
climates, there is a lack of vegetation suitable for this type of research.
The second principle is that response to climate signals, particularly, temperature and
precipitation, is measurable and standard not only across any one species but is
broadly comparable between species and that the mean chronology is the climate
minus local signal (Baillie 1980 7-8). However measurements made for chronological
purposes are not necessarily suitable for this type of analysis, as they are not
necessarily climatically sensitive to the same degree (Pilcher 1980 148-50).
The research literature over the last twenty years has been largely exploratory with
status reports on the development and applications of dendrochronological data from
around the world. There have been advances in the statistical analysis of tree ring
widths; ring densities; cell size; earlywood to latewood ratios; heavy metals and
isotopes. The role of data standardisation is now an accepted part of the analytic
research procedures, particularly in climatic research. This has resulted in a shift in
emphasis as methodologies are now designed for the best analysis of specific
questions relating to climatic signals and other environmental influences (Cooke &
Briffa 1989 161). Statistical procedures are becoming increasingly sophisticated
especially with the growth of computing power.
The International Tree-Ring Data Bank, University of Arizona, collect all known data
sets and research publications. By 1996 they had 3,275 tree-ring chronologies and
2,804 tree-ring data sets from over 1,500 sites representing over 100 tree and bush
species contributed by 139 researchers (Grissino-Mayer & Fritts 1997 235-8).
Information on this collection can be accessed through Grissino-Mayer's web site
([email protected]) though the above statistics remain the same, as they have
not been updated since 1996. It is now possible to access chronologies through the
World Wide Web in lieu of published sets, though some dendrochronologists have
reservations about making their work freely available because of possible
misinterpretation and commercial considerations.
Methodology
The formula for determining the influences for any individual tree is:
Rt = A t + Ct + 8Dlt + 5D2 t + E t
This states that a ring-width (R t) series equals the combined influences of age related
biological (A), climatic (C), endogenous (Dl), exogenous (D2), and other random (E)
factors over time. The growth trend of any particular tree is a function of its age,
environmental milieu, combined climatic factors and stochastic processes. It is
therefore necessary to sample a number of trees to find the mean growth trend as this
allows the separation of the climatic signal from other 'noise' (Cook 1989 98-104).
The sampling procedure of trees is determined by the research to be undertaken and is
covered in most methodologies (Schwenbruber & Kairiukstis 1989).
A site is chosen and a sample number of trees are cored and the tree-ring widths
measured. The measurements within one location are then aggregated; the mean is
calculated and is called the site mean. The aggregate of a number of site means will
give a regional mean and is often called the master chronology. This procedure has
the benefit of eliminating biological and other local random endogenous and
exogenous factors (Baillie 1982 pp. 68-92). Differences in local chronologies are
thought to be due to site differences and not geographical distance (ibid. 101). The
implication of this latter hypothesis is that the definition of a region cannot be
geographically determined.
Tree-ring influences
The contributing complex and interrelated factors that make up a tree-ring are
discussed next. The main biological factor is ageing. In theory tree-rings are wide
when the tree is young and narrow as it ages but this is rarely seen in Nature due to
other influences.
The main interconnected climatic factors are temperature, precipitation and wind.
Temperature is a function of the solar output absorbed by the atmosphere. In some
locations there is a strong correlation between ring-widths and solar cycles, such as
sunspot activity and cosmic ray fluctuations (Bitvinkas 1989 333 & Kocharov 1989
295-6). The relationship between solar cycles and the heat budget in trees from
temperate areas is unknown.
Precipitation is a more complicated variable as trees respond to water availability,
which is the sum of precipitation; soil moisture qualities; drainage patterns and water
table levels. Soil undergoes complicated chemical changes over time and this can
have a knock on effect on drainage, which can then influence water table levels.
Water availability is also influenced by changes in underground topography
particularly in karstic areas, changing sea levels and isostatic rebound. A calendar or
hydrological year, therefore, does not necessarily have a high correlation with
precipitation because the combined effects can last for a number of years. It is
possible that response can lag up to five years as recent unpublished research
indicates that if Palmer's Drought Index is inverted and shifted forward for five years
there is a very good visual match with 20th century tree-ring indices (Baillie pers.
com.).
Wind provides its own unique events and in Ireland is usually related to the strength
and direction of the prevailing wind. On exposed maritime locations salt laden winds
add an extra burden to local vegetation.
Endogenous factors are the internal biological and chemical influences unrelated to
ageing. The main exogenous factors include environmental characteristics and
competition. Environmental factors include the whole mix of geological and
geomorphologic contexts and processes in the short, medium and long-term.
Competition between trees have a major influence, for example a tree on its own
usually has wider tree-rings than a tree surrounded by others of a similar age or size.
Random factors are caused by many types of stochastic events and originate from
atmospheric, biological, geological, geomorphological, astrophysical and
anthropogenic processes. Their impacts can vary from a narrow ring for a year to the
death of a tree.
None of these biological, climatic or environmental factors stand alone in the tree's
ecosystem, a complex series of physical, chemical and biological inter-relationships
create positive and negative feedback. These inputs affect the tree on a number of
different time-scales, seasonally, annually, or diffused over a longer time period. The
widths of tree-rings are the result of these interactions and reflect the totality of a
tree's reaction to its specific environmental history, in its broadest sense.
Analysis
For the purposes of climatic research tree-ring widths must be manipulated
statistically to eliminate environmental and biological factors by the process of
standardisation. This is a purely statistical procedure, achieved by fitting a curve to
the data, which then computes all variations from standard 100 indicia, expressed as a
straight line. Many types of curves are used, i.e. oaks are polynomial and conifers are
exponential, and can either be loose or tight depending on the time-scale of
information to be presented. Tight curves give short-term information while loose
curves are better for longer time-scales. However in all such procedures long term
changes in the overall trend are eliminated. It is also important to note that all indices
are purely statistical and are not based on the biology of trees.
Ideally it would be possible to compute growth indices, i.e. to give the expected
growth in any given year based on the tree's biology alone. The actual widths could
then be 'corrected' and thus long-term trends could be preserved. However in practise
this has proved impossible for Quercus though some attempts have been made to use
exponential curves with conifers (Baillie 1982 86-91). A methodology that, therefore,
excludes biological and other factors but keeps long-term trends has not yet been
developed.
Dendrochronologists generally use these statistically derived indices for all their
research programmes. Statistics and computer programmes have become increasingly
sophisticated and there is a lot of exploratory published work on the use of these
techniques from this perspective. The basic procedure consists of the following steps:
compute a statistical formula that best fits independent instrumental data and then
verify the model by testing it against instrumental data from the same place but a
different time period. If there is a good correlation, temperature or precipitation can
then be estimated for the pre-instrumentation period and cross-checked with results
from other research disciplines. There are pitfalls, for instance a recent article has
claimed that current standardisation techniques are biased and recommends a specific
corrective remedy (Cook & Peters 1997 361-70). The procedure of correlating derived
indices with the original widths is not common or at least not commonly published. A
bibliography that covers these research issues, up to 1996, is available on Grissino-
Mayer's web page {op. ciu\
In recent decades research has moved from tree-ring width indices to the analysis of
other properties such as tree-ring densities, cell size, earlywood to latewood ratios,
and isotopes or combinations thereof. Researchers have mainly used similar types of
statistical techniques for data analysis, but detailed discussion of these is outside the
scope of this dissertation. Recently a number of researchers have set up of grids on a
continental scale, particularly in Fennoscandia, which makes it possible to plot
summer precipitation and temperature variations over large areas (Briffa et al 1992
111-119). At present grids are regionally oriented but in the future will probably be on
a global basis. An example of this type of trend is the creation of synoptic maps
(Baillie 1995 141) and further development of these climatic maps should prove to be
important as it will be possible to compare these maps with those derived
independently.
One recent example has been the use of combined ring-widths and ring-densities
sampled using grid points in Fennoscandia (Briffa et al 1992 111-119). This research
reconstructed summer temperatures in the area from 500AD. The researchers were of
the opinion that there was a low correlation between Fennoscandia and other areas but
offered the caveat that the statistical techniques were still at an experimental stage.
They concluded that there was evidence to show warm periods in the 8 t h , 10-11 t h , and
late 12 t h centuries, bracketed by cold periods. They also argued that there is little
evidence of climatic deterioration in the 14 t h century and that the 15 t h was as warm as
the so-called Medieval Warm Period, thus casting into doubt the ubiquity of the Little
Ice Age. The authors argue that there was a '...probable spatial diversity of climate
change, across Europe through the last millennium' (ibid. 119). It is worth noting that
the seasonal temperatures and precipitation patterns do not necessarily correlate with
annual patterns. In other words just because there has been a particular type of
summer does not necessarily predicate a particular type of winter.
However not all tree-rings are of equal value. From the perspective of climate
reconstruction it has been found that the most statistically significant results come
from tree species in marginal areas because they are most likely to reflect climatic
stress as distinct from local environmental factors (Fritts 1976 17 & 395-400). It has
therefore been concluded, as a general rule, that trees from temperate areas, such as
Western Europe, are not good climatic indicators. Their value lies elsewhere in other
avenues of research.
It is worth noting that attempts have been made using Quercus from Great Britain and
Ireland to reconstruct climate over the last 200 years (Pilcher & Gray 1982 297-304,
Briffa et al 1983 233-42, & 1986 1-15). They were able to correlate tree-ring widths
with temperature and precipitation measured instrumentally. They concluded that high
rainfall in the growing season and high temperatures favoured growth, though high
temperatures in the previous winter were detrimental to the following year's growth
due to a loss of food reservoirs. However very wet years did not correlate as
distinctly. The conclusion was that the basic statistical techniques provided a reliable
year by year reconstruction but that these should not be over-interpreted, as
significant results do not necessarily imply a causal relationship.
There are other problems with this approach because it is difficult to interpret
measurements from different ecologies on macro and micro biogeographical scales
(Baillie 1982 136-7). One example is the different responses of oaks from bogs,
woodland, and riverine locations, which may reflect environmental factors and make
interpretation problematical due to 'noise' in the overall data (ibid. 29).
It is worth adding that a tree-ring in fact represents a two-year period because spring
vessels use food stores from the previous year (ibid. 46). Therefore the resulting
widths, or derived indices, are not fully representative of one year's summer weather.
The assumption appears to be that spring growth is always of the same width and that
the previous year's weather has therefore no influence on it.
Another assumption appears to be that there are no longer response trends greater than
one or two years, i.e. that the tree responds only to seasonal or annual time-scales and
is discussed above. Other interpretative problems include the variable production of
mast, which appears to be biological rather than climatic though temperature must be
a factor; the increase of carbon dioxide in the atmosphere, and industrially derived
heavy metals, which have an unclear effect on growth patterns.
Applications
In the early days it was fortuitous that dendrochronologists concentrated their efforts
on stress-sensitive trees otherwise the science might never have been developed. This
appears to have bred optimism that the analysis of trees of all species from all biomes
would provide historic climatic information. In recent times this has proved to be a lot
more difficult than expected and the results do not appear to give other
palaeoclimatologists confidence. This is perhaps the reason the EURO-CLIMHIST
programme insists that dendrochonologically data is provided as temperatures, etc.,
and not as tree-ring values. It is instructive to compare the optimism of the early
1980s with the pessimism of the 1990s (Baillie 1982 250 & 1995 136).
Research is now concentrated in following specific areas:
• The research of conifers such as Pinus, Picea, Abies, Cedrus, Thuja from
ecologically marginal areas proximate to North American glaciers and ice-fields,
Kashmir, Tasmania and Tierra Del Fuego (i.e. The Holocene, 1991-99, all ten
articles). These have been primarily used to reconstruct temperature and
precipitation.
• The use of grids to re-construct seasonal temperatures in ecologically marginal
areas such as the sub-Arctic (i.e. Briffa et al 1992 111-9)
• The identification of regional and planetary catastrophic events with deductions as
to their overall climatic impacts and resultant effects on human society (i.e. Baillie
1995 & 1999).
• The analysis of issues relating to the calibration of the Radiocarbon curve, such as
changing Carbon dioxide levels during the Holocene.
The first two relate to climatic research and are discussed above. The third area of
research is the identification of stochastic events. The main trend of this direction is
the development of catostrophism as a complementary perspective to
uniformitarianism. There are two scales by which these are measured, the first local
and the second global.
In terms of local events the evidence has been used to examine environmental
changes caused by the expansion of glaciers, changes in soil moisture, rising lake and
sea levels etc. It is worth noting that these are usually caused by changes in climate or
the environment, though catastrophic events can also be significant. The type of
information found depends on the region. Extreme mountain areas are different to
temperate areas, for instance, glacial advances can be informative as the clustering of
kill dates are usually chronologically secure and provide good evidence of glacial
cycles. It is also possible to measure the life spans of sub-fossil trees, as this will
provide the chronology of glacial retreats. The combination of life spans and kill dates
can give a complete glacial history as in Alaska (Wiles et al 1999 163-174), though
the technique has to be used with caution (Grove 1988 8).

Marginal areas occur in many other environmental settings, particularly where
extreme natural events and processes of different scales are catastrophic. Trees in
these areas provide different climatic and environmental perspectives to other biomes.
Interpretative problems occur when narrow widths continue long after the event has
taken place. This may reflect a continuation of poor weather during later growing
seasons or the time needed for trees to recover from the event. In the latter case is the
tree's environment may be a factor, for instance a tree's response in a bog or forest
make be different (Baillie 1999 79-80). Another problem is the chronological gaps
that are environmentally caused due to changes in the local biome. It has been found
that bogs, that preserve trees in large quantities, only do so when the moisture levels
are conducive to the species in question. Worth noting are variations in the responses
of various species such as oak and pine as these can behave either synchronously or
asynchronously depending on moisture content (ibid. 27-8).
While such events are not uncommon on a local or regional level there is always the
doubt that declines in tree-ring width values reflects the event or has some other
specific local cause. Therefore, another focus is on the comparison of tree-ring widths
and values on a global scale. One of the first publications was the classic article by Le
Marche & Hirschboeck (1984 121-6) that discussed the probability that volcanic
events depressed tree-ring widths in bristlecone pine and were related to frost events.
This has since been expanded to the analysis of tree-ring widths and indices elsewhere
and there is now agreement that such events can be identified from nearly all
continents (Baillie 1999 48-61). The chronology and possible effects of these events

Other researchers are developing environmental histories, though these still tend to be
event led, i.e. the explanations are of the 'boring' periods linking the moments of high
drama. There are exceptions and one is Ireland due to the inter-disciplinary approach
of palynology, dendrochronology and radiocarbon dating, particularly in Queen's
University in Belfast and their active links with the archaeological community in
Great Britain and Ireland.
One illustrative example is the link between Archaeologists and Dendrochronologists.
Apart from the dating of specific sites, the analysis of archaeological sample dates has
shown that these are not randomly spread over time but cluster within specific time
frames. In Europe, as well, it has been found that there are periods where there are
few dendrochronologically dated archaeological sites (Baillie 1995 42). These have
been interpreted as periods of building hiatus and are believed to occur after severe
environmental downturns that caused major human mortality. It is also possible to
analyse the clustering of oak population cohorts, as this can indicate woodland
regeneration of either abandoned farmland or managed woodland as distinct from
purely non-anthropogenic factors. Additionally palynological research provides
complementary evidence on the fate of other plant species in these periods. Over all it
is possible to infer, independently of archaeological cultural artefacts and historical
sources, periods when there were downturns in human societies.
The Irish oak chronology has gaps in the dendrochronological record, which are very
difficult to bridge. Further research has indicated that this was due to a mix of
environmental and anthropogenic reasons and this low replication rate is found in the
rest of Europe for many of the same time periods.
The oak in Ireland
At this point a short history of the oak in Ireland would be appropriate and is based on
Birks (1989), Baillie (1982 & 1995), Baillie & Brown (1995) and Mitchell & Ryan
(1998). At the end of the Younger Dryas, c. 10,000 BP, conditions improved and this
resulted in the spread of many plant species Ireland. Quercus arrived in southern
Ireland in 9000 BP and spread north reaching Cos. Mayo and Co. Down 500 years
later. The general speed of travel was 350-500m@year_ 1 until 8000 BP when it
slowed down to 50m@year _ 1. Consequently it did not reach north West of Ireland until
c. 7500 BP.
Quercus was successful and became the major canopy tree largely due to the absence
of its main competitor, the beech. By 3,500 BC it had reached its fullest extent
particularly in the midlands and areas under 300m altitude. Around this date there
were a number of major events, the transition from Mesolithic to Neolithic farming,
the Elm decline and extinction of bog oaks and these, combined, are believed to have
had a major effect on natural woodland regeneration. There is a hiatus in the
dendrochronological record around this time and it has been argued that there was
general environmental down turn that affected the oak and caused major extinction
and later regeneration of the species in peat bogs. The effect on parkland oaks is
unknown because there are no surviving trees from this type of environment for most
of the pre-historic period.
Similar gaps also appear in 4,000 BC, 947-9 BC, 220-13 BC, indicating severe
environmental events that caused local extinction of oaks in bogs. Other gaps of the
historic period appear in, the early 9 t h century and the middle of the 14 t h and 17 t h
centuries. These gaps however are not climatic. The first is related to population
pressure and related land clearances when oak became uncommon. The second is due
to the lack of archaeological timbers because one of the effects of the Black Death
was to halt the construction of new buildings. The third because of the building hiatus
caused by the Cromwellian and Williamite wars. There is a further gap in the
construction of new buildings in AD 648-720 due to the occurrence of plague.
From the Neolithic period mankind used woodland as a source of agricultural land
and building material and over time they shifted from natural to managed. Every new
wave of agricultural innovation and colonisation resulted in the clearance of more
land and by the medieval period the landscape was mostly agricultural with some
large areas of managed natural forestry. These were jealously guarded as a major
source of food, pannage, animal products, wood and timber. Most oak disappeared in
the major woodland wipe-out of the 17 t h century leaving marginalised specimens,
allegedly of poor genetic stock. Canopy trees were replaced by imported seedlings
from the mid 18th century.
Oak samples usually come from bogs in the pre-historic period or archaeological sites
up to about AD 1700, in the modern period they come from parkland without major
competition. This raises the question whether oaks from bogs or ancient wild native
forests have different characteristics, as it is possible that the oaks from
Conclusion
In conclusion tree-ring properties have proved to be a good proxy tool for the
reconstruction of temperature and precipitation patterns, stochastic events and the
identification of cohort populations life spans. The absolute chronologies available
allow detailed reconstruction that can tie into other types of proxy data.
Since the 1950s the hypothesis that indices are a more accurate indicator of climate
(as distinct from annual temperature and precipitation) than tree-ring widths has
shifted from being an assumption to a paradigm. This is puzzling as it behoves the
dendrochronological community to explain why tree-ring widths vary as they do both
historically and geographically. Given the fact that indices are derived from widths,
and not based on biological principles, a full understanding of the former is
impossible without specific published explanations of the latter. In fact the majority of
secondary sources have completely ignored the challenge of widths for maybe fifty
years, but without an environmental explanation of tree-ring widths how do
dendrochonologial palaeoclimatoligists ever expect to understand climate? Ignoring
the problem is not a scientific solution.
The climatic bias has been to the detriment of the overall environmental package.
There has been little work done on the ecological history of the oak, of which climate
is a part. This problem has been recognised for a number of years, Gray and Pilcher
(1980 61) noted that Europe had a poorly developed dendrochronological programme.
Because of this it is therefore difficult to understand the ever-changing climate-
environmental relationship. Without this the analysis of tree-ring properties will
always be hypothetical. The successful manipulation of the data can give results that
mirror specific inputs such as temperature and/or precipitation with some degree of
confidence. The developers of the North Atlantic Oscillation Index confirm this
opinion but they do not use indices for their Index. They argue that while there is a
fairly good correlation between the two sets of indices they are of the opinion that
tree-ring indices do not predicate circulation patterns, due to biological or other
random factors (Luterbacher pers. comm.).
Overall there have been major advances in the science since the days of Douglass and
an understanding of the relationship between trees and their environment in the
broadest sense has progressed considerably. The results can be seen in the areas of
climatic research, solar activity, pollution, anthropogenic influences, and extreme
global events to name but a few. However an explanation that explains the
multifaceted response of trees to their total environment on all biological and
ecological scales has not yet been developed.

CLIMATE IN IRELAND: AN INTRODUCTION
Before discussing historic climate is first necessary to describe the origins and types
of weather systems that make up Irish climatic. This will be followed by a discussion
on issues relating to previous research on historic climate and the Gaelic Annals.
Modern climate in Ireland
Climate is a function of solar radiation, atmospheric systems and ocean currents. In
the northern Atlantic region these are particularly important because the island is at
the interface between the Atlantic Ocean and the European sub-continent. In terms of
understanding the island's climate it is easiest to think in terms of cyclonic and anti-
cyclonic systems.
Weather systems affect Ireland to varying degrees depending on the season and, in the
long term, on the climate in surrounding parts of the region. Ireland is an area where
the boundaries of these systems meet. These boundaries are, of course, not constant
and shift across Europe depending on the relative strengths of the competing weather
systems at any one time. It does, however, appear that the island is in a significant
geographical location and may be likened to 'frontier' country. The advantage of the
metaphor is that at times when there are competing weather systems the boundaries
often have unstable weather conditions.
In a recent work, Sweeney (1997 254-75), describes weather in Ireland, over the last
one hundred years, as a 'struggle' between tropical and polar air masses. He argues
that the island is a 'battleground' of these air masses who conquer and reconquer with
great speed and that it is these 'skirmishes' that determine the 'climatic fingerprints'
of the European climate. These constant alterations create a climate that is highly
variable i.e. the euphemistic 'four seasons in one day'. As a general point care has to
be taken not overuse military metaphors when past or present Irish climate is
described.
He also argues that the Irish temperature regime is determined by changes in the
thermal characteristics of the North Atlantic Drift and precipitation determined by the
origin of weather systems. In the former case land temperatures are highly correlated
with sea temperatures and in the latter case two-thirds of Irish rainfall come from
westerly cyclonic systems. He describes Ireland as 'England's shelter belt' and this is
particularly true for southern England where most of the historic documentary sources
originate. It could be argued that there is a positive relationship between the climatic *
shelter-belt region and documentary sources.
While these westerly systems have a major influence in mainland Europe they are
heavily modified by the time they arrive there due to a number of reasons. These
include loss of moisture; a warming of the air due to reflected radiation plus increased
dust from the land mass; the homogenisation of the system through the loss of chaotic
wind variability; the influences of other northern and eastern weather systems and the
influence of Alpine topography.
A particular feature of anti-cyclones is the blocked system. This is caused by the
closing of a circumpolar meander loop through complicated interactions with jet
streams and results in the system becoming stationary or 'blocked' (Lamb 1995 36-7).
They are found in all seasons but are mostly a spring/early summer feature between
150°-15°W longitude, i.e. west of Ireland (Daniels et al 1997 24). Summer blocking
anti-cyclones can often divert westerly wind systems in a northern loop and bring rain
to continental Europe while Ireland is experiences hot and dry weather.
It would be useful to consider the main weather systems that make up Irish climate at
the present time. There are five main types of systems, viz. The Oceanic maritime
lows, the Polar maritime lows, the Continental Arctic highs, the Oceanic maritime
highs, and the Continental African highs. These, with a description, can be ranked in
importance as follows:
• Oceanic maritime low-pressure systems are the most important in Ireland. They
are primarily of western or north-western origin and bring cool and wet conditions
and are responsible for most of the precipitation on the island. It is worth noting
that of the five types, they show the greatest variation in strength and intensity.
This is presumably due to the fact that they border on the more turbulent
Caribbean weather systems and it is likely that there is a relationship between
turbulence there and in Ireland. Geographical variations also occur in the amount
of precipitation as the west coast receives higher levels of rainfall than the east. In
very wet years flooding can occur in river basins. Overall the predominance of
these systems generate a relatively mild climate without large seasonal variations.
• Polar maritime lows are cold and wet and are primarily a winter phenomenon.
They bring cold wet snow, sleet and hail; these do not have any lasting power due
to continuing precipitation.
Continental Arctic Highs are the primary winter system for much of continental
Europe. It is mainly a winter phenomenon though the chances of it impacting in
Ireland in this time are low, as it appears that they do not have the strength to
move this far west or compete with westerly low pressure systems. They are
associated with blizzards and frosts that freeze water bodies and at particular
periods are intense from the human perspective. Spring melt can occasionally
cause flooding.
A variant are Polar maritime highs, these are similar to continental Arctic highs.
The Polar High is not described as a separate climate systems type as only the
direction of origin is different. Their separate point of origin is possibly due to
abnormalities in the northern circumpolar vortex and the positioning of
anticyclones (Lamb 1995 30-35). For instance if they are centered over Iceland
they bring heavy snows but over Scandinavia they bring severe frosts (Daniels et
al 1997 27). In the period 1961-1990 they have become less frequent with about
5-6 snow days per annum in Ireland with the exception of the extreme north west
which receives about 8-12 snow days per annum (Barrow & Hulme 1997 46).
Oceanic maritime highs come from the southwest and are characterised by warm
and damp conditions. They are a common summer weather system and often
alternate with Oceanic Lows. A combination of both types often brings intense
short storms and powerful lightning due to the mixing of air of unequal
temperatures.
• Continental African Highs bring hot dry weather in the summer and in extreme
cases can cause droughts (as well as dustings of Saharan sand). They are
uncommon at this time.
Occasionally hurricanes of Caribbean origin break through and sweep through the
islands with wind speeds of up to 11ms"1 causing considerable destruction. Recent
examples have included Hurricane Debbie in 1961, Hurricane Charlie in 1986, and
Hurricane Isadore plus Hurricane Gustav in 1990. In some circumstances they are
diverted to Ireland away from their normal western Atlantic track. Otherwise it is
believed that remnant pockets of warm air from dying hurricanes are absorbed by
cyclonic systems. These pockets intensify the low pressure and the strengthened
system then follows the normal westerly track to Ireland. These have always been a
part of Irish weather patterns though there is usually not enough detail to say whether
historic storm events are hurricanes or very powerful gales.
These systems make up our climate and it is the variations of long-term patterns on
which climatic reconstruction in Europe has been based and it is to these that the
discussion will now turn.
Climate Reconstruction in Europe
Notwithstanding the difficulties of reconstruction, up till recently, there was a general
consensus regarding climate change in Europe over the last 2,000 years. This
consensus was that after the Iron Age lull, 500BC-AD 300, there was a slow
warming, with some intense variability, to about AD 900-1000. This was followed by
a benign period to about AD 1250, called the Medieval Warm Period, followed by a
deterioration into wetter and colder weather. From AD 1570s there was an increase in
cold conditions, called the little Ice Age, that lasted to about 1850.
Recent research, particularly over the last ten years, has queried this consensus.
Regional studies in Europe and other parts of the world have shown that it is
impossible to classify global weather into periods with specific weather patterns. It is
now argued that shifting atmospheric patterns affect different parts of the world in
dissimilar ways and that these changes are not synchronous in time. However the
labels 'Medieval Warm Period' and 'Little Ice Age' have remained because no
alternative definitions are acceptable.
Climatic research over the last 100 years has used an interdisciplinary approach to
documentary, biological and glacial proxy records. Significantly this research has
primarily been conducted on mainland Europe where the climate is mainly continental
with high-pressure systems predominating. Researchers focus on the 'Medieval Warm
Period' and the later 'Little Ice Age', which is not surprising given the topography of
the mainland and the wide variety of different records that became available from the
16 t h century. In the modern period, particularly from AD 1850, instrumental records
are used to define climatic parameters. Instrumental records now provide the
verification of models used in historic climatic reconstruction.
The general assumption is that Ireland is part of the European climatic region. This
assumption is questionable because oceanic maritime weather is predominant with a
strong bias towards low-pressure systems. A further point is that published research
has never clearly stated whether Ireland is in Western Europe or Northern Europe.
There may be a geographical bias in the literature, as the tendency is for French and
German researchers to assume that Ireland is in either Western Europe or Northern
Europe respectively.
Unfortunately there has been very little research done on Ireland and this may be due
to two factors. The first is that the most important author from this region, Lamb,
appears to have a continental bias as most of his sources come from mainland Europe
and he uses Irish sources rarely, with the exception of Bourke who discussed the mid
19 t h century Irish famine (Lamb 1995 pp. 393-411). It is worth noting that Lamb
cannot be overly criticised, as there has been no published research carried out in
Ireland for this period and most Irish authors use Lamb uncritically. It is also not clear
whether he, or other writers, consider this island to be worthy of independent study
for the purpose of providing complementary data on historic climate change given the
fact that most analysis is done for much larger regions.
However he is a source worth listening to because his climatic and historic erudition
has set the standard for the study of climate history, his theories are those whom
everyone seeks to prove or disprove. He has concentrated on the 'big picture' as a
necessary pre-condition for more detailed regional research.
This continental bias can create some curious interpretations. Consider his map of
north west Europe (Lamb 1995 164) plotting coastal changes caused by sea flooding
for the period AD 400-1100 where Ireland is completely missing. Obviously he is not
arguing that Ireland was completely covered in water at this time but it indicates that
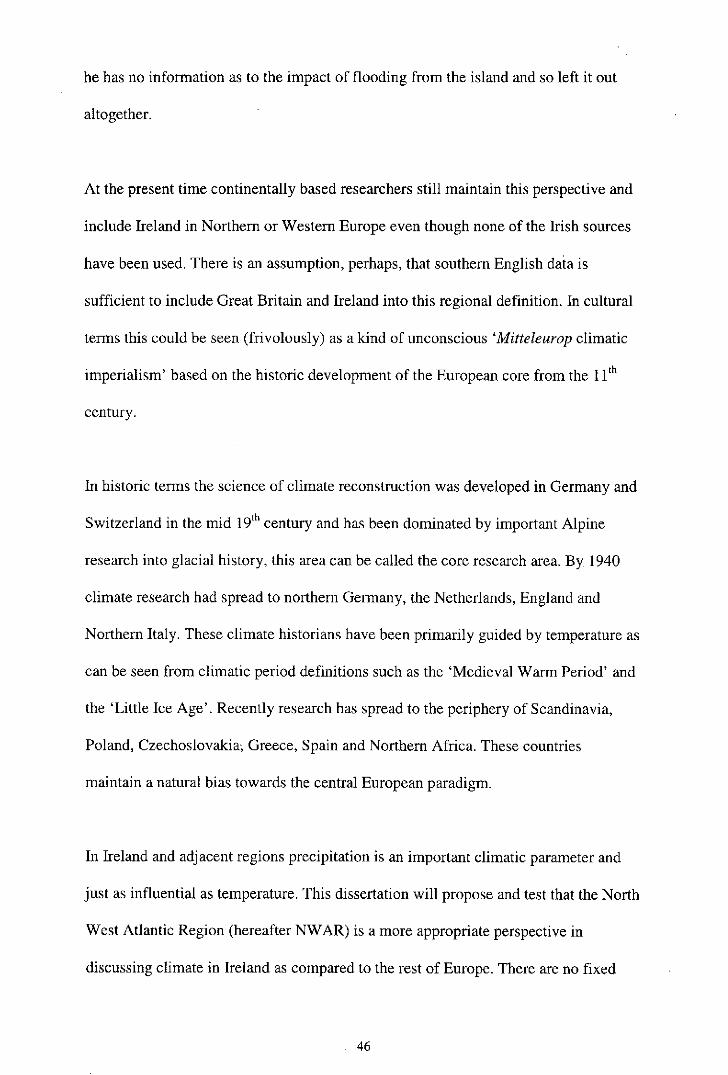
he has no information as to the impact of flooding from the island and so left it out
altogether.
At the present time continentally based researchers still maintain this perspective and
include Ireland in Northern or Western Europe even though none of the Irish sources
have been used. There is an assumption, perhaps, that southern English data is
sufficient to include Great Britain and Ireland into this regional definition. In cultural
terms this could be seen (frivolously) as a kind of unconscious 'Mitteleurop climatic
imperialism' based on the historic development of the European core from the 11 t h
century.
In historic terms the science of climate reconstruction was developed in Germany and
Switzerland in the mid 19 t h century and has been dominated by important Alpine
research into glacial history, this area can be called the core research area. By 1940
climate research had spread to northern Germany, the Netherlands, England and
Northern Italy. These climate historians have been primarily guided by temperature as
can be seen from climatic period definitions such as the 'Medieval Warm Period' and
the 'Little Ice Age'. Recently research has spread to the periphery of Scandinavia,
Poland, Czechoslovakia; Greece, Spain and Northern Africa. These countries
maintain a natural bias towards the central European paradigm.
In Ireland and adjacent regions precipitation is an important climatic parameter and
just as influential as temperature. This dissertation will propose and test that the North
West Atlantic Region (hereafter NWAR) is a more appropriate perspective in
discussing climate in Ireland as compared to the rest of Europe. There are no fixed
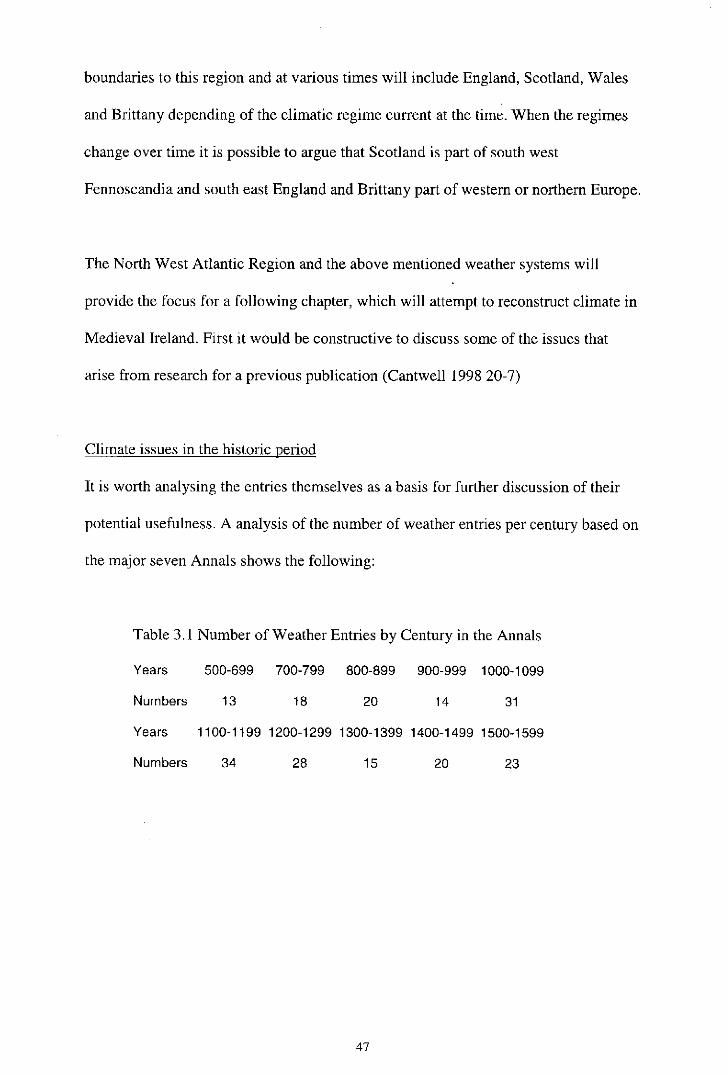
boundaries to this region and at various times will include England, Scotland, Wales
and Brittany depending of the climatic regime current at the time. When the regimes
change over time it is possible to argue that Scotland is part of south west
Fennoscandia and south east England and Brittany part of western or northern Europe.
The North West Atlantic Region and the above mentioned weather systems will
provide the focus for a following chapter, which will attempt to reconstruct climate in
Medieval Ireland. First it would be constructive to discuss some of the issues that
arise from research for a previous publication (Cantwell 1998 20-7)
Climate issues in the historic period
It is worth analysing the entries themselves as a basis for further discussion of their
potential usefulness. A analysis of the number of weather entries per century based on
the major seven Annals shows the following:
Table 3.1 Number of Weather Entries by Century in the Annals
Years 500-699 700-799 800-899 900-999 1000-1099
Numbers 13 18 20 14 31
Years 1100-1199 1200-1299 1300-1399 1400-1499 1500-1599
Numbers 34 28 15 20 23
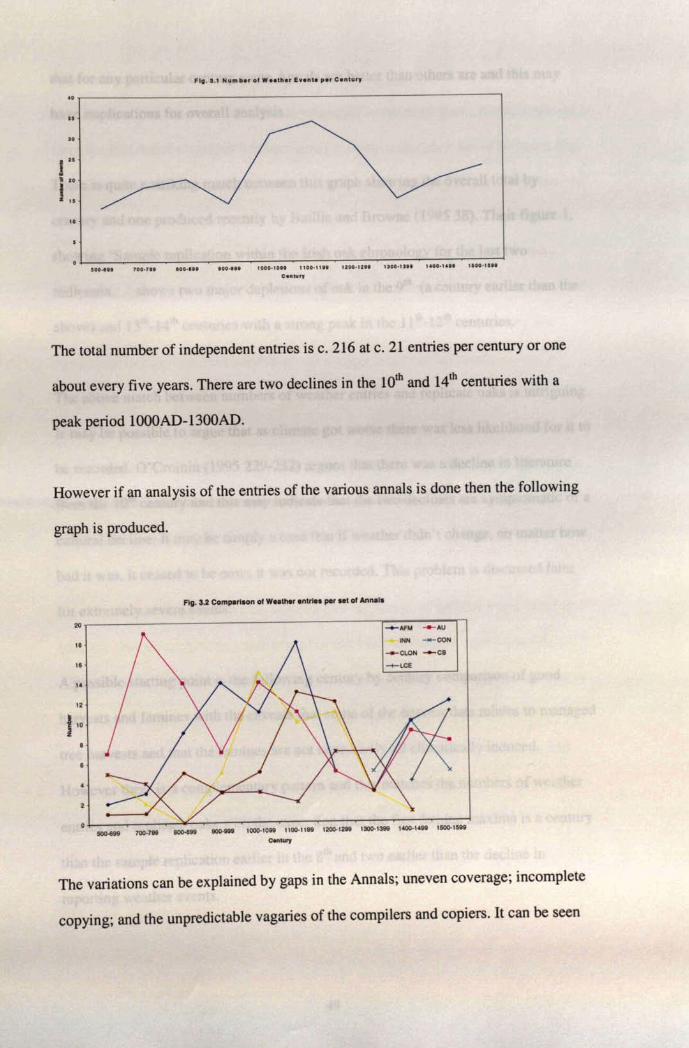
that for any particular century some Annals are better than others are and this may
have implications for overall analysis.
There is quite a striking match between this graph showing the overall total by
century and one produced recently by Baillie and Browne (1995 38). Their figure 1,
showing 'Sample replication within the Irish oak chronology for the last two
millennia...' shows two major depletions of oak in the 9 t h (a century earlier than the
above) and 13 -14 centuries with a strong peak in the 11 -12 centuries.
The above match between numbers of weather entries and replicate oaks is intriguing.
Is may be possible to argue that as climate got worse there was less likelihood for it to
be recorded. O'Croinin (1995 229-232) argues that there was a decline in literature
from the 10 t h century and this may indicate that the two declines are symptomatic of a
cultural decline. It may be simply a case that if weather didn't change, no matter how
bad it was, it ceased to be news it was not recorded. This problem is discussed later
for extremely severe events.
A possible starting point is the following century by century comparison of good
harvests and famines with the caveats that some of the harvest data relates to managed
tree harvests and that the famines are not necessarily all climatically induced.
However there is a complementary pattern and this matches the numbers of weather
entries and replicate oaks with the exception that the first famine maxima is a century
than the sample replication earlier in the 8 t h and two earlier than the decline in
reporting weather events.

In general negative events far outweigh the positive by 80% to 20%, with some
references to good harvests of field and managed forest crops (mast, hazel, apple etc.).
Here the fact that the weather has been good is implied though it has to be noted that
tree yield cycles do not necessarily correspond to clement times. Other interpretations
of implied data are difficult to prove one way or another. For example references to
'putrid black fish' coming out of mountains is suggestive of bog bursts, this may
therefore imply increased rainfall over the previous number of years. A reference to a
'Fire from Heaven' burning up the mountains of Connaught may imply very dry
conditions that provided the conditions for a major bog conflagration.
It is important to note that there are no references to patterns of change and this is
typical of Annals. There are occasional references to the worst/best since a particular
year but these are rarely over one generation, i.e. c. 30 years, apart and primarily
relate to domesticated and managed wild harvests.
The importance of the data is that one can plot sequences of weather event types and
look for change; such an example would be the climatic decline from around the AD
1270s that can be seen from the increased references to high winds and heavy storms.
This is certainly a lot more useful than knowing that there was a particular storm in a
particular year. Trends can be plotted and then compared to European climate and
other types of Irish proxy climate data; though published research of the latter does
not exist in any large quantities for the period.
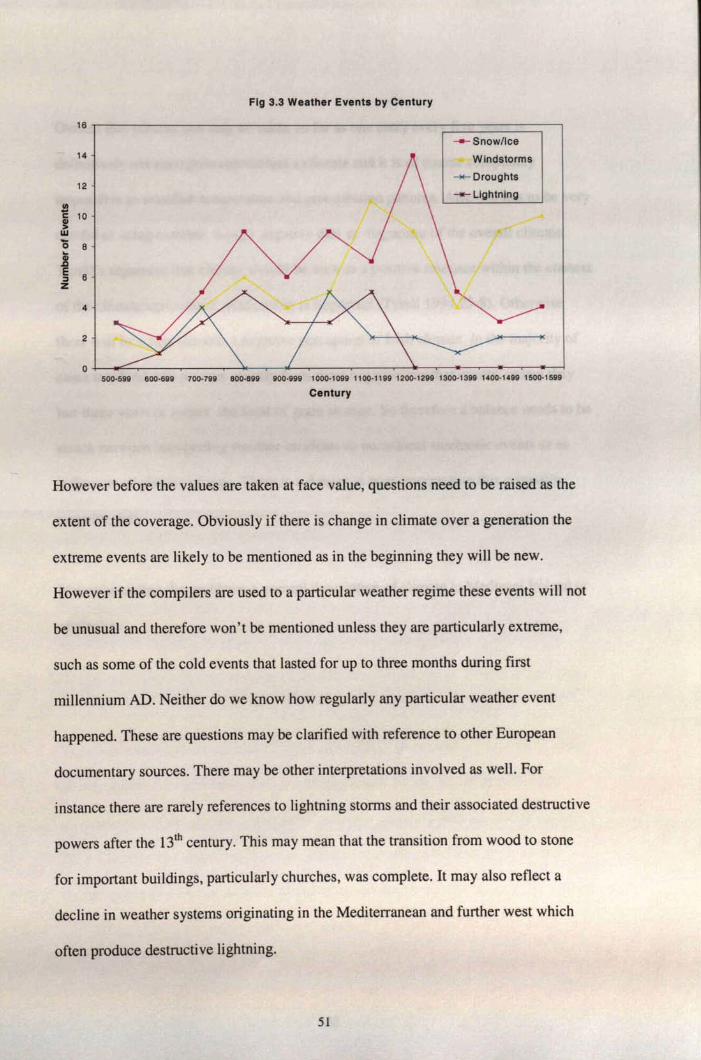
Overall this process can only be taken so far as one entry every five years is
definitively not enough to reconstruct a climate and it is of course completely
impossible to establish temperature and precipitation patterns. Also one has to be very
careful in using extreme, mostly negative data as diagnostic of the overall climate.
Tyrell's argument that climate should be seen as a positive resource within the context
of the climate/agricultural relationship is important (Tyrell 1994 25-8). Otherwise
there will be a bias towards a negative perception of Irish climate. In the majority of
cases mankind will recover quickly from most negative weather events, unless they
last three years or longer, the limit of grain storage. So therefore a balance needs to be
struck between interpreting weather incidents as occasional stochastic events or as
indicators of climate change. There is a danger in over-interpreting this primarily
negative data.
Notwithstanding the problems a general description of climate in Medieval Ireland is
attainable.
METHODOLOGIES AND ISSUES
The research of dendrochronological and annalistic data can be broken down into two
specific methodologies and is therefore discussed separately:
DENDROCHRONOLOGY
Correlation
The tree-ring widths of Ireland, as compiled by the Department of Palaeoecology,
Queen's University, Belfast, was entered into Windows Excel (1998) with the mean
tree-ring widths of seven different locations from Northern Europe, viz. Sheffield,
London, Netherlands, Denmark, Hamburg, Gottingen, and Poland, which had been
averaged to create a Northern European mean.
The Irish tree-ring widths were made into linear charts on a number of different scales
i.e. 100 years, before and after AD 1000, etc. and an attempt was made to offer a
comparative interpretative analysis of correlation coefficients of Ireland and Europe.
Correlation between the Irish and European averages were plotted on the basis of ten,
twenty, thirty, fifty and one hundred running curves. While the application of the
statistical functions was straightforward, problems occurred with the interpretations.
This is largely due to the fact that there are no established methodologies for the
interpretation of tree-ring width correlation curves due to the difficulties of separating
climatic and biological inputs; discussed earlier.
While a complete analysis of correlation was beyond the scope of this dissertation a
number of cameos were chosen for further analysis based on their asynchronous
nature or their lack of correlation.
Variation
A second methodology was devised to study variations since it was thought that
certain periods would show higher variability with others. The procedure was to:
• Compute a ten year running average
• Subtract the tree ring widths from the running average for yearly variations
• Square and square root these to remove minus values
• Compute a ten year running average to obtain decadal figures
• A linear and polynomial (6 t h order) trend line was then added to the chart.
The decadal figures can be called a Variance Index. Periods with higher variations
may indicate instability whereas low variations may indicate stable conditions. These
are not all necessarily climatic, as other environmental influences can be significant.
The same procedure was carried out with the European average. It would be expected
that the mean of seven chronologies would significantly dampen variability however
there are periods where variability was high for all parts of Europe.
Finally a ten year running correlation curve was fitted to the Irish and European
average.
The above procedure measured total variation. An alternative procedure was not to
remove negative values at step three and compute an average by where positive and
negative canceled each other out. This left extreme values that were plotted. Steps
four and five were repeated and a correlation curve fitted with a polynomial (6
order) trend line.
Other Methodologies
Other cameos were chosen based on their interest in the development of stochastic
events and the dates chosen are years or periods arising from the Annals or from
Baillie (1995 and 1999). The general methodology was to compare the average tree
ring widths, five years before the event, with the width during the event itself and are
explained in the text.
Finally an interpretive narrative analysis was attempted for the Irish tree-ring widths
over the last 2,000 years
DOCUMENTARY SOURCES
This section deals with the sources and methodology used in compiling data from the
Annals followed by a description and discussion of the EURO-CLIMHIST project's
indices with reference to Ireland.
There is no complete set of weather entries for Ireland. The best and earliest is Wilde
(1856). He was a surgeon by training who was employed as a statistician during the
1841 and 1851 Census enumeration. In the latter his responsibility was to collate and

analyse data on mortality between the two periods; but he additionally collected all
references to famines and infectious diseases from Irish literature, either published or
in manuscript, available to him. Before AD 1200 this included the whole corpus of
Irish Annals excluding the Annals of Lough Ce and Chronichum Scotorum. After AD
1200 most of the Anglo-Norman chronicles were used and from AD 1500 some
published Tudor English and Renaissance Gaelic contemporary literature was
included (Crawford 1989 1-2).
Britton (1937) compiled a similar set of data for Great Britain and Ireland, which is
useful as climatic comparisons can be drawn between Ireland and Great Britain;
However a detailed critique of this work was not attempted.
In recent times a compilation, from AD 900-1500, was published by Lyons, a
medieval historian, (1989 31-74) for a work on the history of Irish Famines. This
contains a useful discussion on the nature and extent of Irish sources. The listing is
not complete as not only are entries missing but she also often quotes only one set of
annals when a particular event occurs in more than one. The strength of her
compilation is in her translations of Latin texts, particularly from the Anglo-Norman
sources, but it is not clear whether this is a complete listing.
Crawford published a transcript of Wilde's entries from AD 1500-1850 and included
entries omitted by Lyons to AD 1500. It includes a list of the sources used by Wildle
plus a short appreciation of his scholarship (Crawford 1989 1-30).
Lyon's used two other sources. These were Titow's compilation of Estate records
from the Bishopric of Winchester and published dendrochronological indices from
Dublin and Belfast. Both were used as control data and for comparative purposes. The
former is problematic as it assumes that climate in the south east of England is
comparable to Ireland. The author recognised this and states that while it may be valid
for the south and east of Ireland (excluding marginal land) it is not necessarily apt for
the north and west. The latter use of the indices purely as an indicator of rainfall is not
a position acceptable to dendrochronologists. She was considerably more cautious in
making this assumption in her unpublished thesis on the Medieval Manorial
economies of the Archbishopric of Dublin.
More recently Cantwell compiled an index of entries from the most important and
accessible Gaelic Annals on a page by page basis for all weather references. These
were Annals of Clonmacnoise, AD 500-1408 (gap AD1182-99); Annals of I
Connaught, AD 1328-1544; Annals of the Four Masters, AD 500-1599; Annals of
Inisfallen, AD 500-1328 (gap AD 1131-59); Annals of Lough Ce, AD 500-1140 (gap
AD 1317-1413); Annals of Ulster, AD 500-1541 (gap AD 1132-55); and Chronicum
Scotorum, AD 500-1140.
For the purposes of this dissertation additions and corrections were made using Lyons
and Crawford (op. cit.) A copy of the author's compilation index and copies of
Crawford and Lyons appears in an appendix. Ideally, for the convenience of future
researchers, there should be a database containing full transcripts of all entries in
Gaelic and Latin with their respective and sometimes variant translations, however
within the time frame of this dissertation this proved impossible.
EURO-CLIMHIST Indices
Christian Pfister first developed the methodology used for the creation of indices in
1984 for analysis he conducted in Switzerland. This has since become the basis of the
research conducted by the EURO-CLIMHIST project from the early 1990s and has
been used successfully as reported by numerous publications over the last ten years,
as has been discussed earlier. The Department of History, Bern University, currently
holds this database. It is planned to put it on the World Wide Web by the turn of the
millennium but at time of writing this has not yet happened.
Overall the main advantages of this using documentary data are (quoted from Pfister
etal 1982 332):
• An absolute dating control
• A high (seasonal, monthly or daily) time resolution
• A disentanglement of the effects of temperature and precipitation
• A coverage of all seasons of the year (this is particularly crucial for the cold
season, for which documentary data are often the only or most accurate proxies)
• A high sensitivity to anomalies and natural hazards: the more extreme an event,
the more often and more meticulously it is described
The main disadvantages (ibid. 333) are:
• They are discontinuous and may be biased by the selective perception of the
observer
• Compilations are mostly made up of a mishmash of reliable and unreliable data
and the entries are not fully documented.
The methodology of reconstruction using this type of proxy data has been discussed
by Pfister et al (1994 329-76) and the indices themselves described in the
introductions to all articles. The basic aim is that every month is given a value
depending on whether it is average (0), colder or wetter than normal (-1), or warmer
or dryer than normal (+1). These are then added together to get a seasonal figure that
range from +3 to - 3 . These are then plotted in a seasonal temperature or precipitation
time-series. Finally, should there be sufficient data, a curve such as thirty-year
running mean or Gaussian low pass filter with an eleven year cut off period, is
computed (Glaser 1999 172-5 & Pfister 1998 538-9 & 547-8).
The seasons are subdivided into winter (December to February), spring (March to
May), summer (June to August) and autumn (September to November). The
published literature shows that this seasonal breakdown works best after about AD
1500 when there is sufficient data that can be analysed with chronological exactitude.
Before AD 1500 results on only winter temperatures have been published and this
probably for two reasons. The first is that it there are difficulties in classifying the
data with sufficient seasonal, let alone monthly, precision. The second is that
documentary data is the only proxy record available for winter and they provide an
essential complementary understanding to reconstructed summer temperatures.
It should be noted that the concept of 'average' does cause difficulties because this
can be taken as the average of the period in question or to a modern period such as
AD 1901-61. Certainly the contemporary observer will observe the weather in terms
of the average he is used to, but for a proper reconstruction of temperature and
precipitation it has to be relative to a documented instrumental period. This tends to
assume that climate dynamics are the same throughout history and that by
reconstructing temperature and precipitation climate can also be reconstructed. In
effect this assumes that it is possible to read climate backwards. In reality this
hypothesis remains to be proved and should not become a paradigm.
Two specific problems can be used as an illustration. The first is that one season does
not predicate another and the documentary literature indicates that the balance of
different types of season have changed over time for reasons that are little understood.
The second is that climate in the pre and post-industrial periods are not necessarily
comparable due to the major anthropogenic influences, particularly the increase of
C 0 2 in the atmosphere. Climatologists now recognise that the last 100 years have
been particularly benign and unrepresentative of climate of the last 2,000. Therefore
researchers* who use contemporary rather than modern 'averages' may not be
altogether wrong and that the two perspectives should be used for their
complementary points of view.
Overall it is possible that due to the historian's rejection of the relationship between
climate and history and the scientists rejection of documentary data there is a major
effort to make the project as scientific as possible. However it is hoped that history
does not get completely lost in the process.
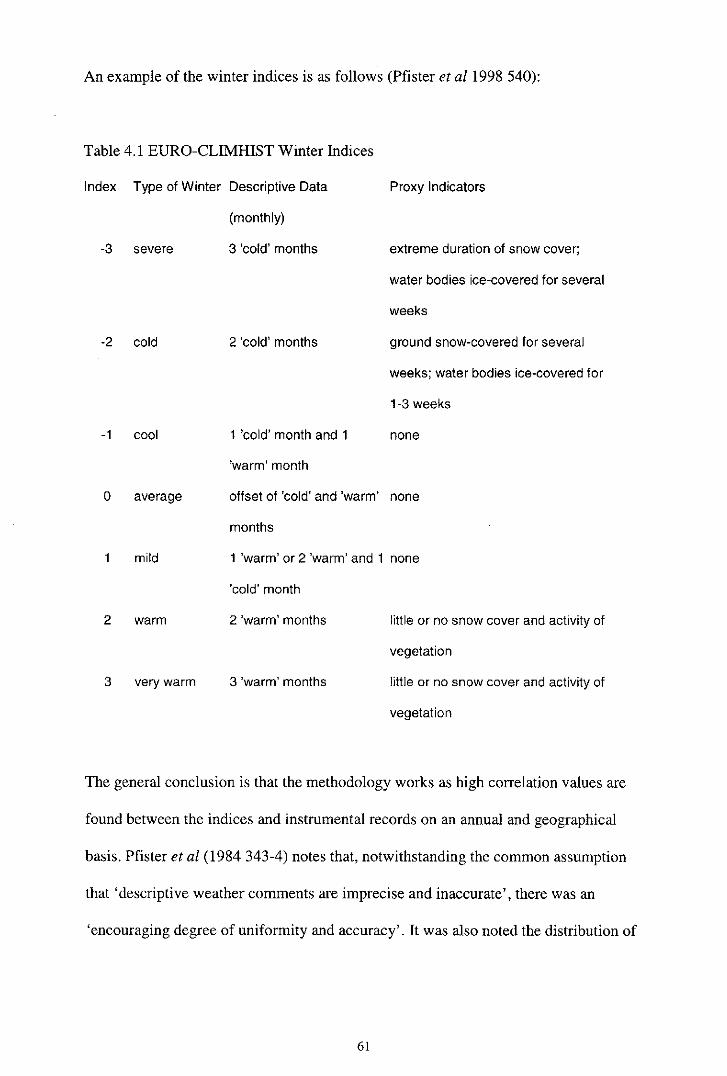
An example of the winter indices is as follows (Pfister et al 1998 540):
Table 4.1 EURO-CLIMHIST Winter Indices
Index Type of Winter Descriptive Data
(monthly)
-3 severe
-2 cold
-1 cool
0 average
1 mild
warm
very warm
3 'cold' months
2 'cold' months
Proxy Indicators
extreme duration of snow cover;
water bodies ice-covered for several
weeks
ground snow-covered for several
weeks; water bodies ice-covered for
1 -3 weeks
1 'cold' month and 1 none
'warm' month
offset of 'cold' and 'warm' none
months
1 'warm' or 2 'warm' and 1 none
'cold' month
2 'warm' months little or no snow cover and activity of
vegetation
3 'warm' months little or no snow cover and activity of
vegetation
The general conclusion is that the methodology works as high correlation values are
found between the indices and instrumental records on an annual and geographical
basis. Pfister et al (1984 343-4) notes that, notwithstanding the common assumption
that 'descriptive weather comments are imprecise and inaccurate', there was an
'encouraging degree of uniformity and accuracy'. It was also noted the distribution of
the verifiable data was more important because they provided synoptic charts that
were "meteoro-logical" i.e. 'consistent with physical laws of the atmosphere'.
There are two problems relating to their use in Ireland. The first is that under the strict
guidelines laid down by the EURO-CLIMHIST programme the Gaelic Annals cannot
be used as they are all non-contemporary and secondly there is not enough entries to
develop climatic patterns for this oceanic region (Pfister pers. comm.). The first is a
valid criticism but is ideally used where there are other contemporary records
available, which is not the case in Ireland. As already discussed the issue of
chronological control has been extensively researched in Ireland and the
chronological framework for the various compilations is accepted by Irish historians.
It does seem unreasonable to reject the whole corpus of data on this basis when it is
unique in terms of its temporal and geographical coverage. England is not necessarily
an adequate alternative, as most of the records tend to come from the south east,
which is more continental in climate.
It is certainly the case that there are not enough entries to provide overall climatic
patterns but the process was carried out so that the methodology and its implications
could be understood. It was deem likely that a comparison of Ireland and northern
Europe would be a useful indicator for regional analysis. This is not a specific
problem to Irish sources as the extent of documentary coverage in Europe is highly
variable.
In the future it may be better to move away from an overly strict definition of seasons
and measure the length of winters, which often include spring, by snow cover and low
temperatures; and summers by proxy agricultural data. It is not possible to categorise
the data with sufficient seasonal exactitude before AD 1000.
There are three sets of published sets of indices that cover European data before AD
1600.
• The first is an examination of winter temperatures in 'Western Europe' (Pfister et
al 1998 535-552). The indices are not given and have been reconstructed from the
charts. These are difficult to interpret with exactitude and have been confirmed
from the text where dates have been discussed.
• The second is an examination of winter temperatures in 'Europe' in the 14 t h
century (Pfister et al 1996 91-108). The indices are published in an appendix.
• The third is an examination of 16 t h century seasonal temperature and precipitation
in various countries in 'Central Europe' (Glaser et al 1999 169-200). The indices
are not published but it is possible to reconstruct them from the charts. The areas
covered by the charts are Germany, Switzerland and the Czech Republic. Only
Germany has year by year coverage and comparison was confined to that country.
There are still major lacunae covering the 15 t h century and the earlier medieval period
excluding winter temperatures.
OTHER INDICES
A second set of climatic indices for southern England, developed by Lamb, have been
published for AD 1200-1439 (Oglivie & Farmer 1997 124-8). These haveT)een up
dated and corrected by the Climatic Research Unit, University of East Anglia, to
improve the chronological precision missing in previous analysis. These indices are
based on a monthly score of precipitation and temperature where +2 indicates
conditions slightly more severe than normal while ±3 indicates a particularly severe
month. Negative values indicate drier or cooler conditions while positive values
indicate warmer or wetter conditions, depending on whether they are scoring
temperature or precipitation. These are than added together on a seasonal basis, pace
Pfister, and give maximum values of ±9 per season. These can then be developed into
decadal annual temperature or precipitation indices (ibid. 121 & 129).
They are not directly comparable with the EURO CLIMHIST indices. The main
difference appears to be that while EURO CLIMHIST is concerned with length Lamb
is concerned with severity. The purpose of the comparison is to get a further
indication of the boundaries between the regions.
A third set of indices are those compiled by C. Easton for western Europe in his 1928
work Les hivers dan VEurope occidentale. These have been partially republished by
Lamb (1982 45) who concentrated on the coldest winters by century. Easton's ratings
range between 10 (coldest) to over 80 (warmest). The coldest periods are rated as 10
or 21.
While noting that this index may not pass the strict criteria laid down by the EURO
CLIMHIST programme, and therefore may not reflect actual winters they are
included as a chronological contrast. It is not until AD 764 that there is the first
chronological correlation between Easton and Ireland, thereafter two thirds are
correlated with Europe.
As a general point there are difficulties in indexing such short references as 'Great
snows' or 'Great droughts'. It is only when they are more descriptive in terms of the t h
length of time such 'Great snow on the 29 April' or 'Abnormal Ice and snow from
Epiphany to Shrove' can such indexing be more seasonally exact. Earlier observers
were of course not scientists but it can be possible to deduce the intensity of an event
or season through the effects such as famine, crop damage or cattle mortality.
Therefore a certain amount of judgment is necessary to index ambiguous entries. Any
individual interpretation may be incorrect or may not be recognised as appropriate by
international researchers and to cover this eventuality all indices are given in a
separate appendix for critical examination.
The analysis of winter temperatures and summer temperatures plus precipitation was
the most successful. It was mainly impossible to index any entries for spring and
autumn, as most of the entries can not be placed in these seasons with adequate
precision. Another type of analysis that was impossible to perform was winter
precipitation because there were no entries in the Gaelic Annals. Taking each major
type of analysis the following tentative methodological conclusions were established.
Winter Temperature
This is a proxy record of extreme winters based on snowstorms, freezing of water
bodies and the length of time of each. One of the associated problems is that it is not
always clear whether they are always take place only in the winter as many fall into
the first month of spring. This was always significant as it usually delayed spring
plowing. Where possible this has been noted but failing these entries have always
been put into the winter season. It is difficult to properly index entries where no dates
or duration are given. However this can be deduced sometimes if the effects of famine
and animal mortality are used as proxy indicators. In earlier periods this is often
impossible, but most severe winters are given a - 3 due because they would not have
been mentioned unless there had been a serious human impact given the fact that
extreme winters are unusual on the island.
Unlike the rest of Europe there were no references to unusual warmth of winter even
though the concept was recognised in Irish literature (Kelly 1998 3). By and large all
events are anomalies from the contemporary perspective of the compilers.
Summer temperature and precipitation
This is somewhat variable due to the lack of adequate data.'The contemporary average
is sufficient rainfall and sunshine for pasture and crop growth and anomalies are
either too little or too much of each. While there appears to have been little complaint
about high temperatures, associated droughts could have serious consequences. In
Ireland they to go together and represent African continental high-pressure systems.
In these situations +1 to +3 was given for temperature and precipitation. Where there
was too much rain and/or too little sunshine the range was -1 to - 3 . Like winter crop
failure and animal mortality was used as a proxy indicator.
The lack of many references to extreme seasonal variations indicate that Irish climate
was largely benign. In fact what worried the Irish farmer was storm damage caused by
anti-cyclonic and cyclonic systems or tropical hurricanes. These were usually short
episodes but varied in intensity and geographical coverage. Their implications for
precipitation patterns is unclear and they have not been included as part of the
precipitation analysis. However two separate set of charts were drawn, the first
combining summer precipitation indices and storms (the latter given a value of -0.5)
and another giving the incidence of storm types either storm, lightning and hail. In
most cases storms are associated with mortality and damage to animals, crops and/or
property.
The results show that the Gaelic annalists compiled observations that were of direct
relevance to agricultural production. Therefore winter events were noted for the
impact they had on early plowing and the availability of winter grass. Summer events
were given if there was either a drought or precipitation destroyed crops. Storms were
only significant if they caused damage. A detailed examination of the results will be
found in the chapter relating to Climate History and various tables and charts can be
found in an appendix.
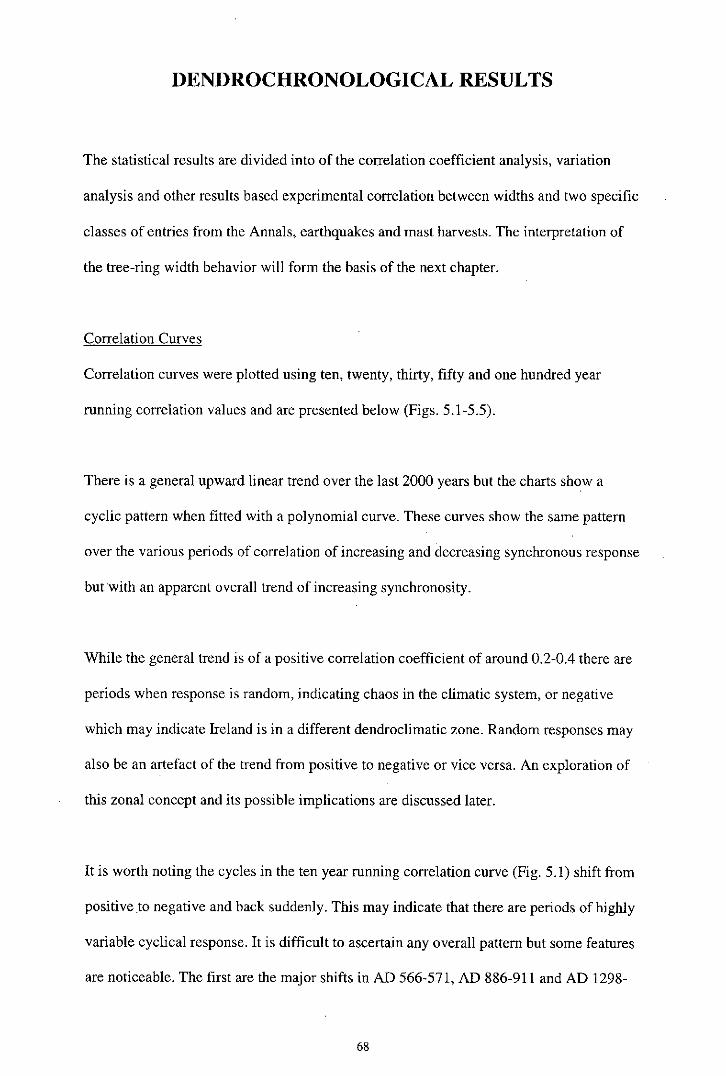
DENDROCHRONOLOGICAL RESULTS
The statistical results are divided into of the correlation coefficient analysis, variation
analysis and other results based experimental correlation between widths and two specific
classes of entries from the Annals, earthquakes and mast harvests. The interpretation of
the tree-ring width behavior will form the basis of the next chapter.
Correlation Curves
Correlation curves were plotted using ten, twenty, thirty, fifty and one hundred year
running correlation values and are presented below (Figs. 5.1-5.5).
There is a general upward linear trend over the last 2000 years but the charts show a
cyclic pattern when fitted with a polynomial curve. These curves show the same pattern
over the various periods of correlation of increasing and decreasing synchronous response
but with an apparent overall trend of increasing synchronosity.
While the general trend is of a positive correlation coefficient of around 0.2-0.4 there are
periods when response is random, indicating chaos in the climatic system, or negative
which may indicate Ireland is in a different dendroclimatic zone. Random responses may
also be an artefact of the trend from positive to negative or vice versa. An exploration of
this zonal concept and its possible implications are discussed later.
It is worth noting the cycles in the ten year running correlation curve (Fig. 5.1) shift from
positive to negative and back suddenly. This may indicate that there are periods of highly
variable cyclical response. It is difficult to ascertain any overall pattern but some features
are noticeable. The first are the major shifts in AD 566-571, AD 886-911 and AD 1298-
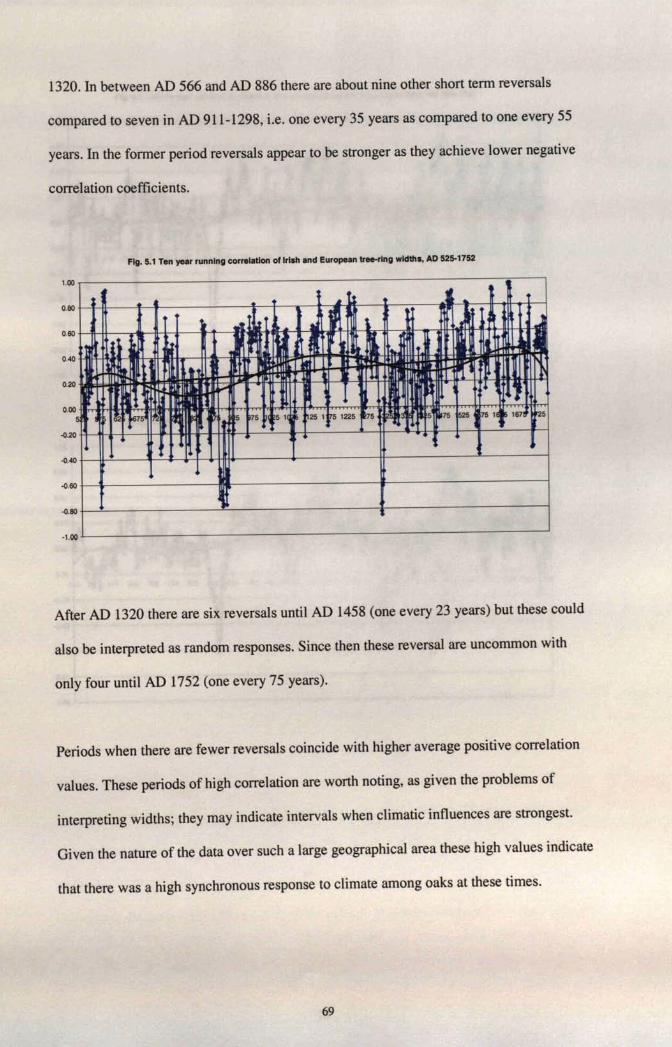
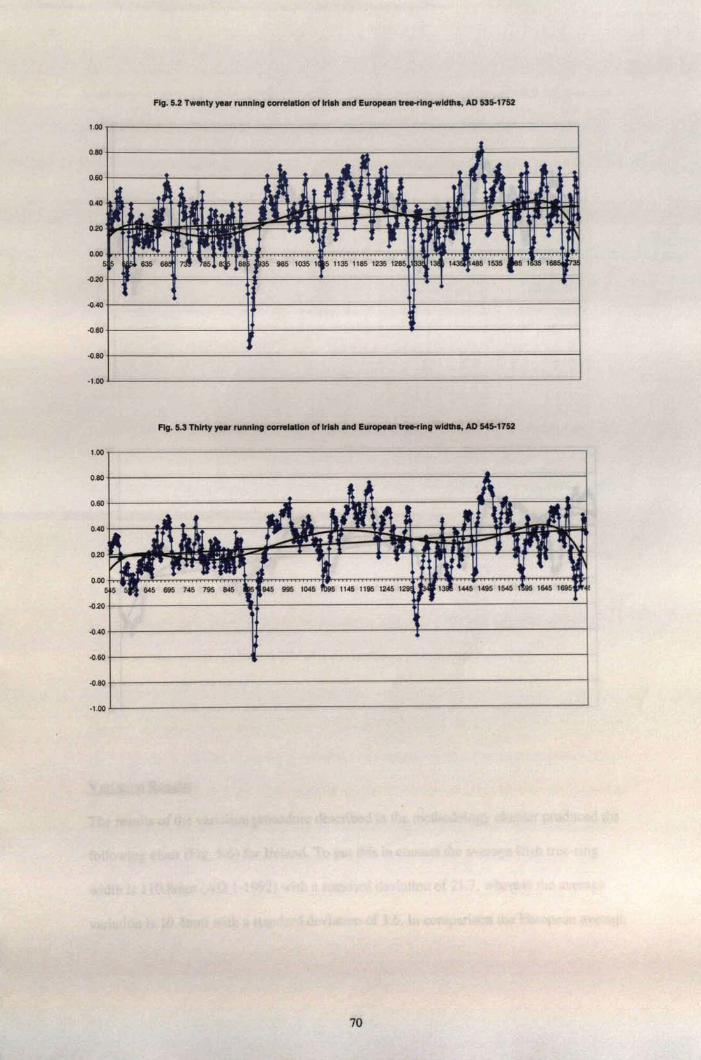
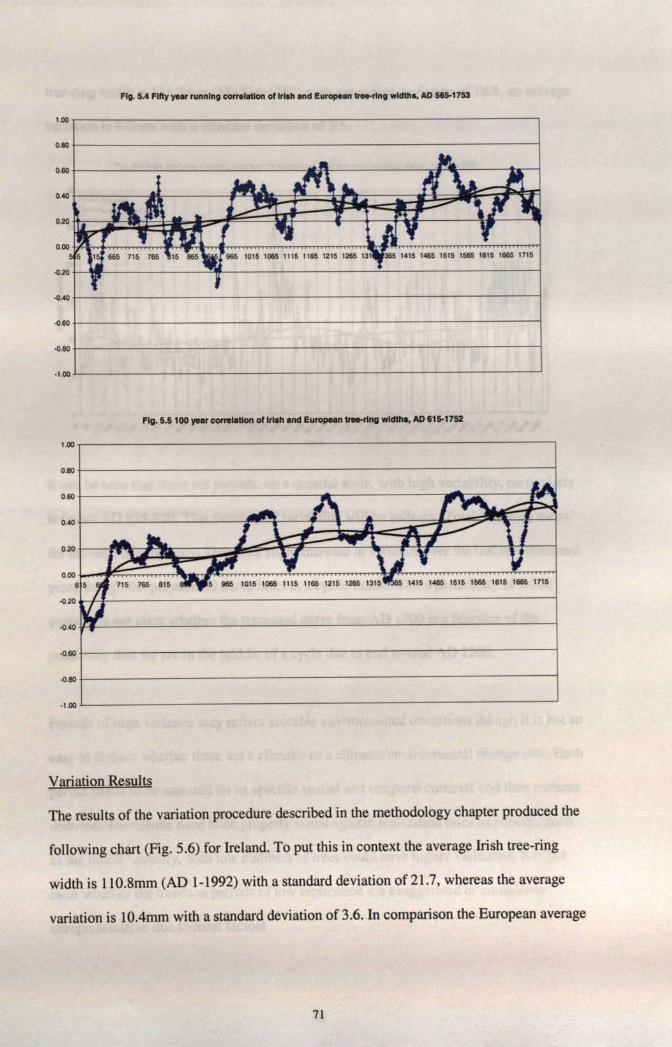
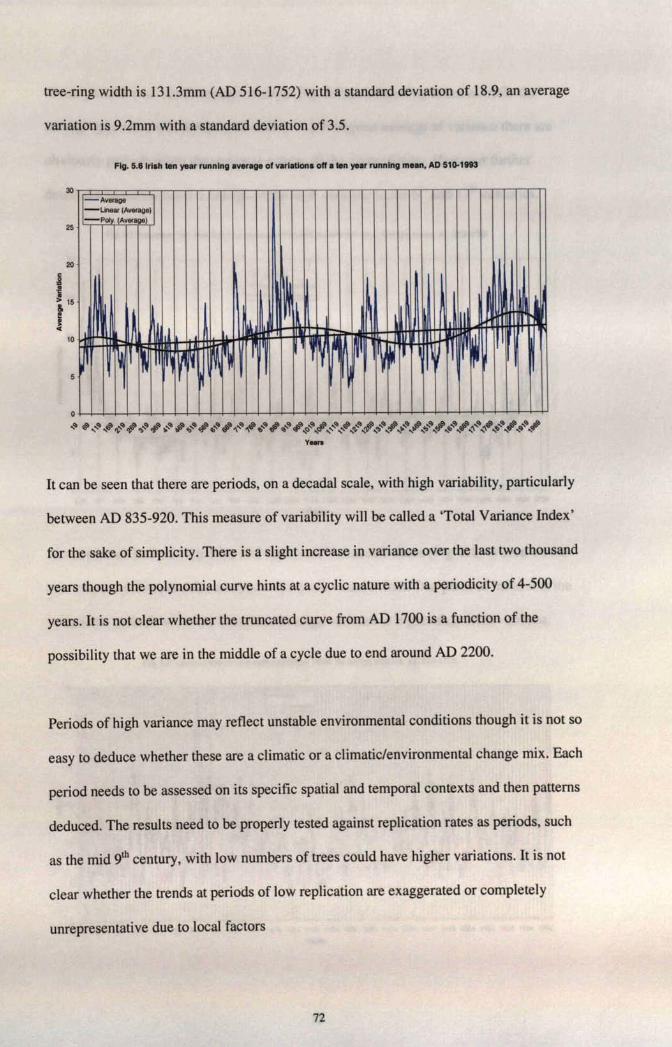
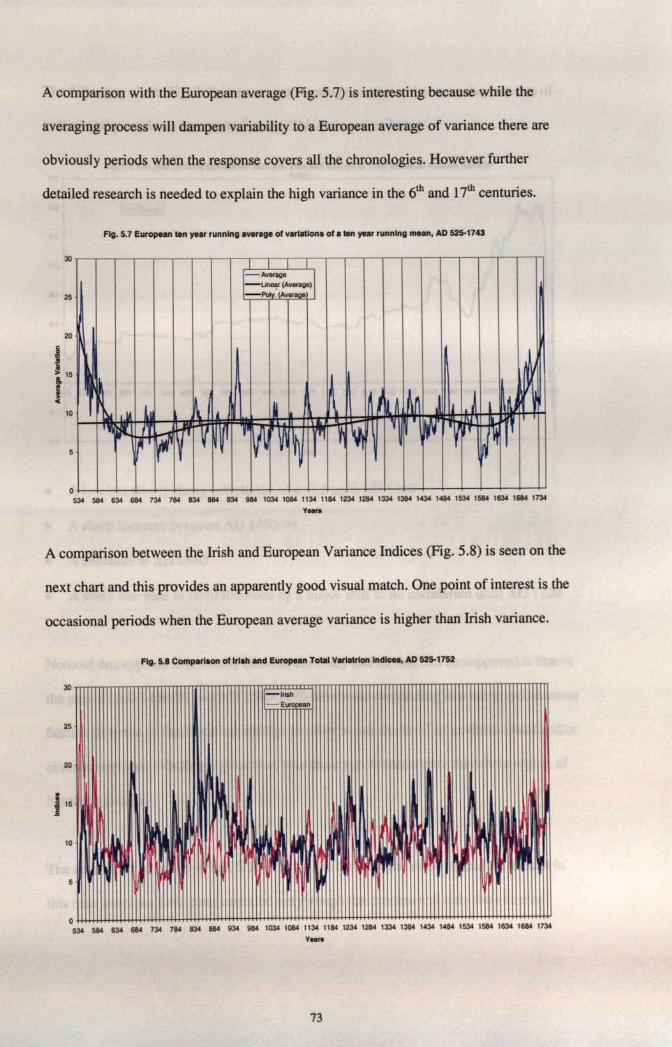
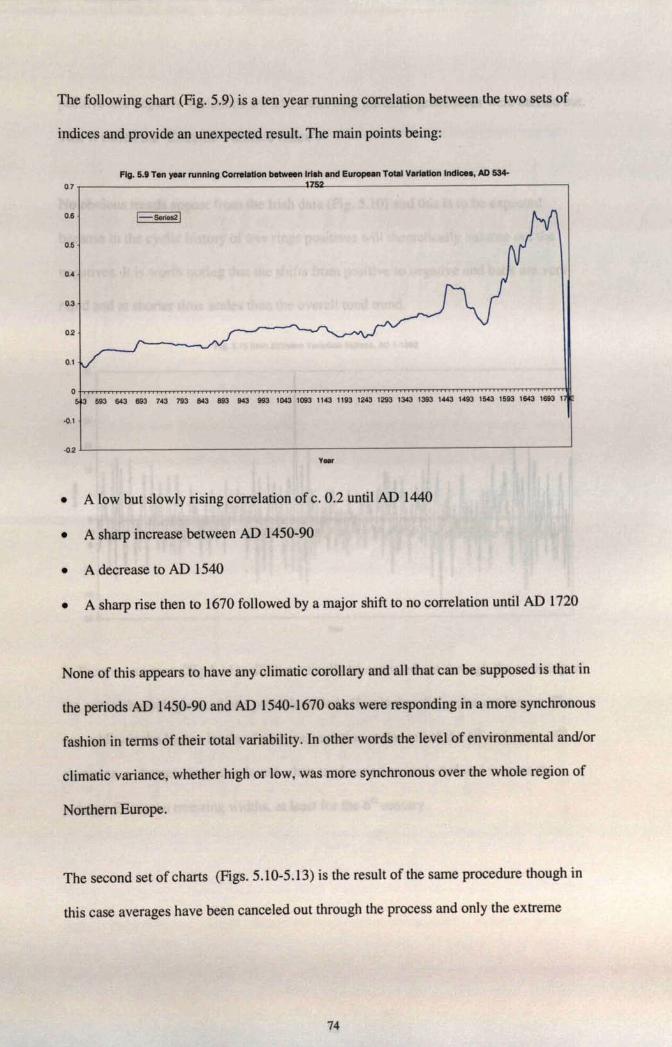
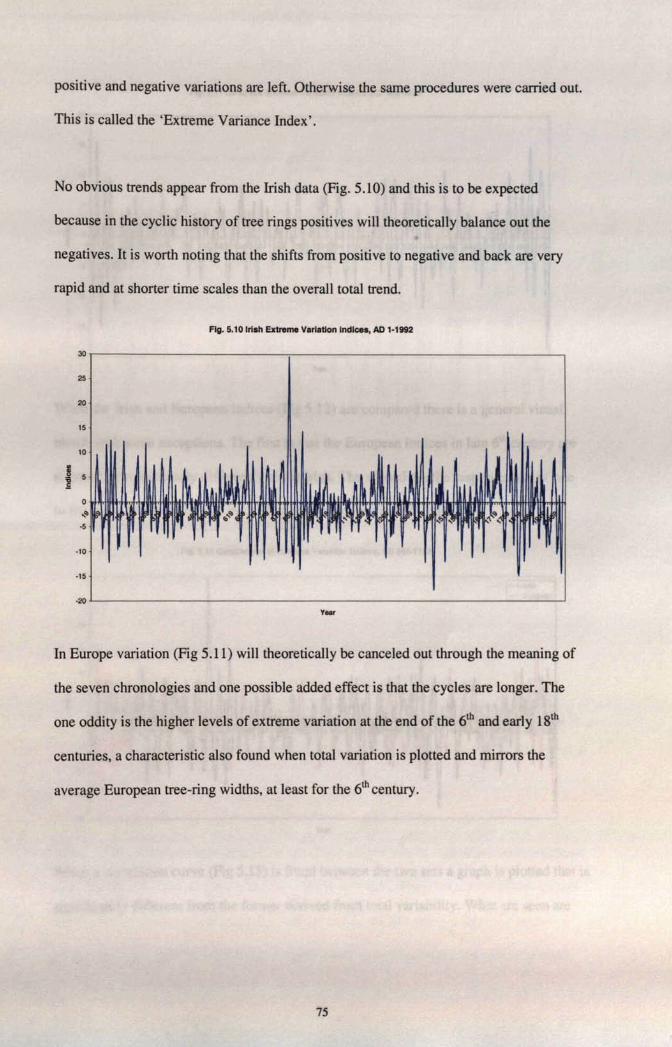
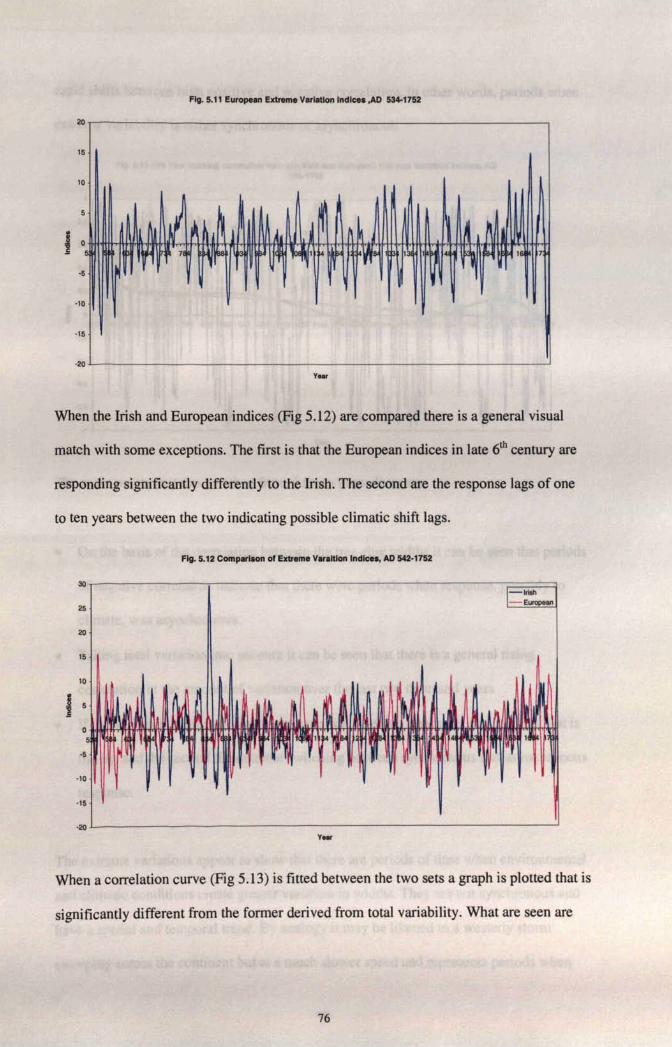
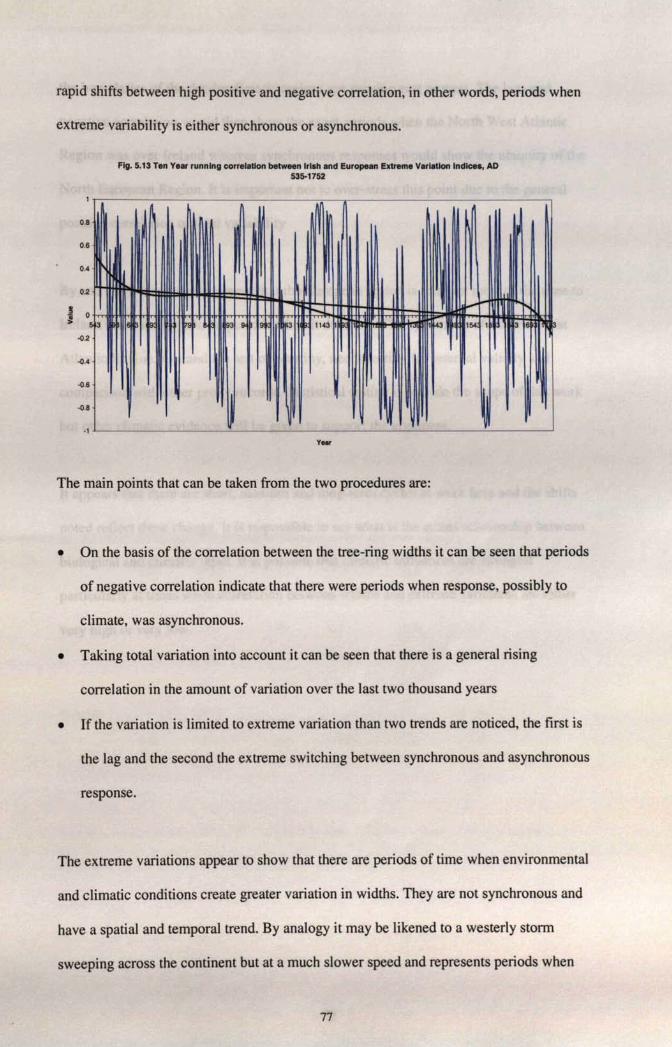
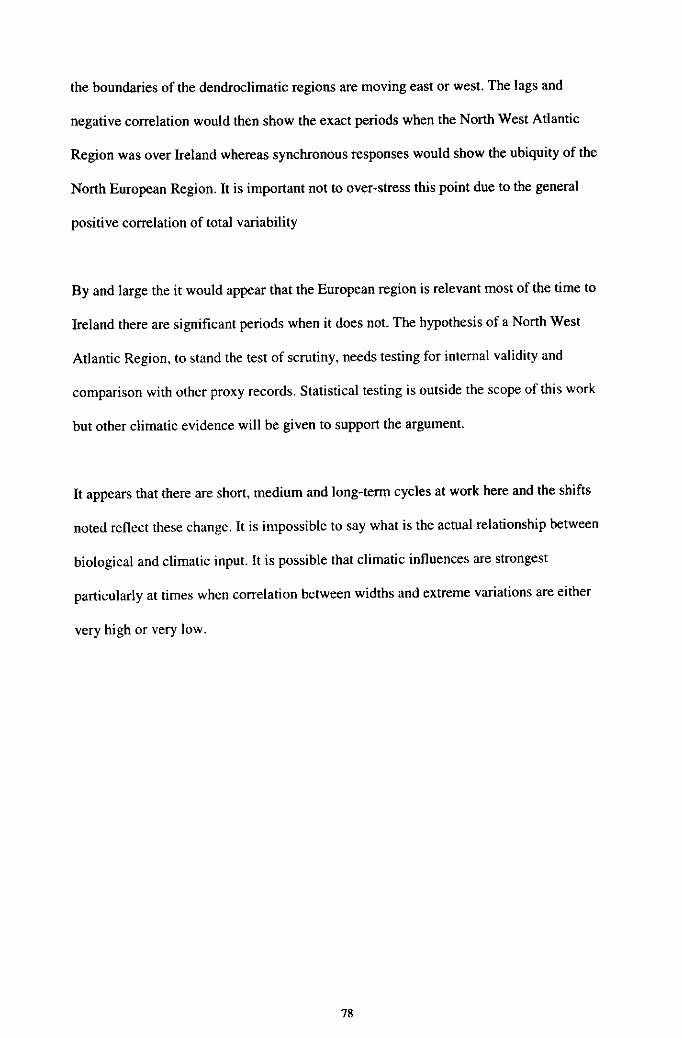
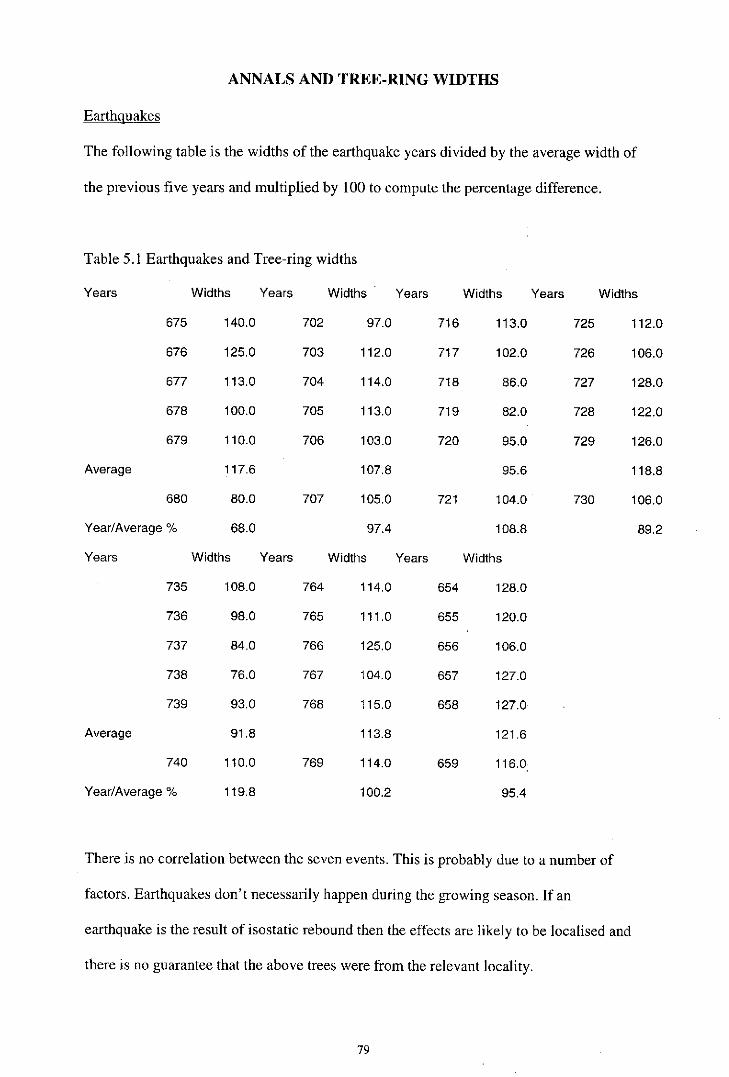
ANNALS AND TREE-RING WIDTHS
Earthquakes
The following table is the widths of the earthquake years divided by the average width of
the previous five years and multiplied by 100 to compute the percentage difference.
Table 5.1 Earthquakes and Tree-ring widths
Years Widths Years Widths Years Widths Years Widths
675 140.0 702 97.0 716 113.0 725 112.0
676 125.0 703 112.0 717 102.0 726 106.0
677 113.0 704 114.0 718 86.0 727 128.0
678 100.0 705 113.0 719 82.0 728 122.0
679 110.0 706 103.0 720 95.0 729 126.0
Average 117.6 107.8 95.6 118.8
680 80.0 707 105.0 721 104.0 730 106.0
Year/Average % 68.0 97.4 108.8 89.2
Years Widths Years Widths Years Widths
735 108.0 764 114.0 654 128.0
736 98.0 765 111.0 655 120.0
737 84.0 766 125.0 656 106.0
738 76.0 767 104.0 657 127,0
739 93.0 768 115.0 658 127.0
Average 91.8 113.8 121.6
740 110.0 769 114.0 659 116.0
Year/Average % 119.8 100.2 95.4
There is no correlation between the seven events. This is probably due to a number of
factors. Earthquakes don't necessarily happen during the growing season. If an
earthquake is the result of isostatic rebound then the effects are likely to be localised and
there is no guarantee that the above trees were from the relevant locality.
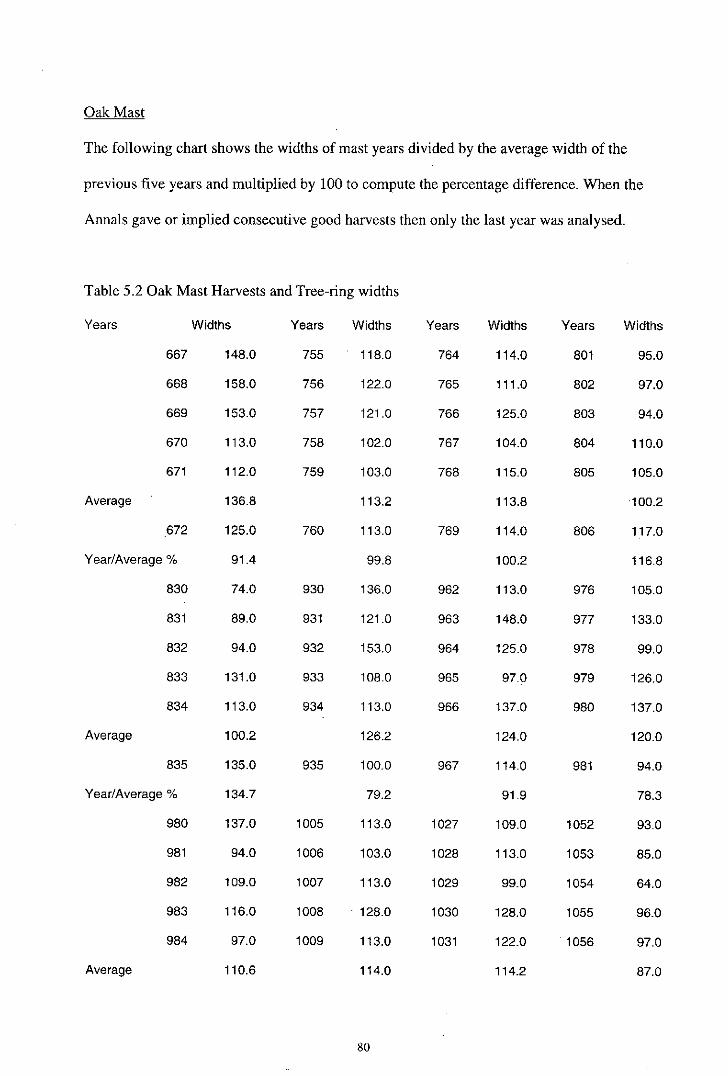
The following chart shows the widths of mast years divided by the average width of the
previous five years and multiplied by 100 to compute the percentage difference. When the
Annals gave or implied consecutive good harvests then only the last year was analysed.
Table 5.2 Oak Mast Harvests and Tree-ring widths
Years Widths Years Widths Years Widths Years Widths
667 148.0 755 118.0 764 114.0 801 95.0
668 158.0 756 122.0 765 111.0 802 97.0
669 153.0 757 121.0 766 125.0 803 94.0
670 113.0 758 102.0 767 104.0 804 110.0
671 112.0 759 103.0 768 115.0 805 105.0
Average 136.8 113.2 113.8 100.2
.672 125.0 760 113.0 769 114.0 806 117.0
Year/Average % 91.4 99.8 100.2 116.8
830 74.0 930 136.0 962 113.0 976 105.0
831 89.0 931 121.0 963 148.0 977 133.0
832 94.0 932 153.0 964 125.0 978 99.0
833 131.0 933 108.0 965 97.0 979 126.0
834 113.0 934 113.0 966 137.0 980 137.0
Average 100.2 126.2 124.0 120.0
835 135.0 935 100.0 967 114.0 981 94.0
Year/Average % 134.7 79.2 91.9 78.3
980 137.0 1005 113.0 1027 109.0 1052 93.0
981 94.0 1006 103.0 1028 113.0 1053 85.0
982 109.0 1007 113.0 1029 99.0 1054 64.0
983 116.0 1008 128.0 1030 128.0 1055 96.0
984 97.0 1009 113.0 1031 122.0 1056 97.0
Average 110.6 114.0 114.2 87.0
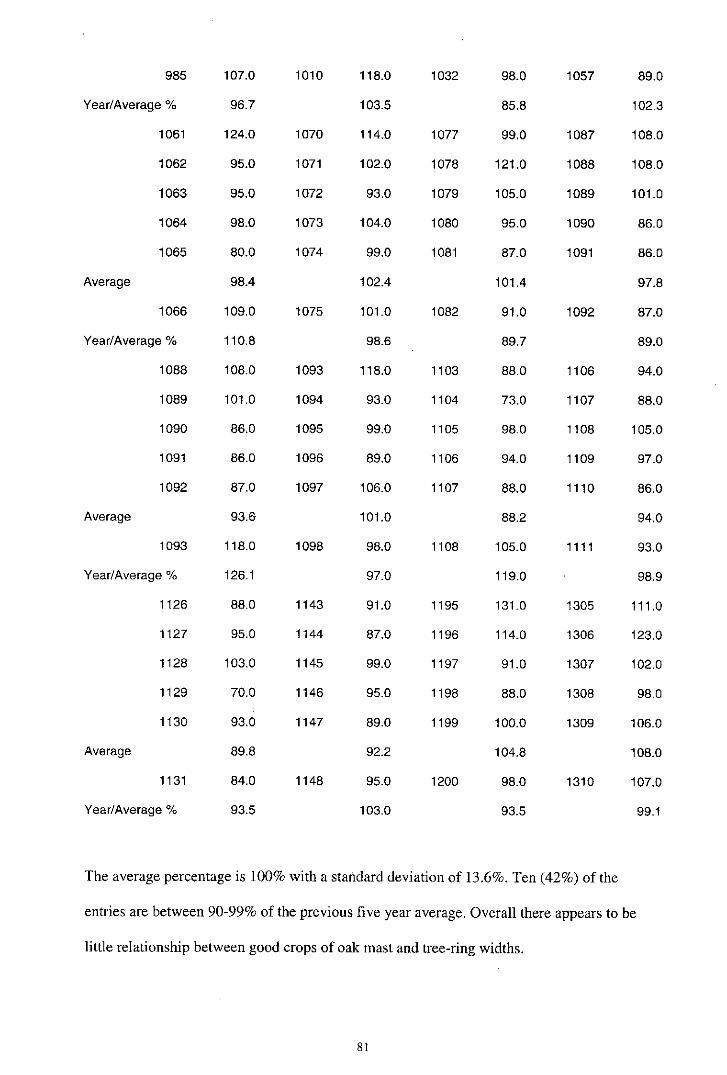
985 107.0 1010 118.0 1032 98.0 1057 89.0
Year/Average % 96.7 103.5 85.8 102.3
1061 124.0 1070 114.0 1077 99.0 1087 108.0
1062 95.0 1071 102.0 1078 121.0 1088 108.0
1063 95.0 1072 93.0 1079 105.0 1089 101.0
1064 98.0 1073 104.0 1080 95.0 1090 86.0
1065 80.0 1074 99.0 1081 87.0 1091 86.0
Average 98.4 102.4 101.4 97.8
1066 109.0 1075 101.0 1082 91.0 1092' 87.0
Year/Average % 110.8 98.6 89.7 89.0
1088 108.0 1093 118.0 1103 88.0 1106 94.0
1089 101.0 1094 93.0 1104 73.0 1107 88.0
1090 86.0 1095 99.0 1105 98.0 1108 105.0
1091 86.0 1096 89.0 1106 94.0 1109 97.0
1092 87.0 1097 106.0 1107 88.0 1110 86.0
Average 93.6 101.0 88.2 94.0
1093 118.0 1098 98.0 1108 105.0 1111 93.0
Year/Average % 126.1 97.0 119.0 98.9
1126 88.0 1143 91.0 1195 131.0 1305 111.0
1127 95.0 1144 87.0 1196 114.0 1306 123.0
1128 103.0 1145 99.0 1197 91.0 1307 102.0
1129 70.0 1146 95.0 1198 88.0 1308 98.0
1130 93.0 1147 89.0 1199 100.0 1309 106-0
Average 89.8 92.2 104.8 108.0
1131 84.0 1148 95.0 1200 98.0 1310 107.0
Year/Average % 93.5 103.0 93.5 99.1
The average percentage is 100% with a standard deviation of 13.6%. Ten (42%) of the
entries are between 90-99% of the previous five year average. Overall there appears to be
little relationship between good crops of oak mast and tree-ring widths.
IRISH QUERCUS TREE-RING WIDTH CYCLES
There are no established methodologies for the analysis of tree-ring widths as
previously discussed. What follows is therefore experimental and explores the data,
because it offers a different perspective of the Quercus response to regional climatic
and biological trends. Where possible these have been disentangled through a mixture
of mathematical formulae allied with visual examination. Within the framework of
this dissertation only an introduction is possible with the addition of cameo samples
of some of the more interesting examples and trends.
The chart (Fig. 6.1) below shows the patterns of tree-ring widths of the last 2,000
years in Ireland and has a one hundred year moving average added (charts analysing
widths on a centennial scale are in an appendix). It is of course possible to use a
number of different averages and this is done when greater detail is needed. However
it does show the general trend and it is interesting to note those extreme widths
whether positive or negative tend, with a few exceptions, happen when the average is
either rising or falling respectively. Therefore low values always have to be taken
within the context of where they are in the overall trend. In comparison indices, which
are relative variations from a mathematical curve, are perhaps more appropriate for
identifying years with extreme values.
The character of cyclic change in the previous 5,000 years is different but the period
of depressed widths extends back to the 2 n d century BC (Baillie pers. com.)
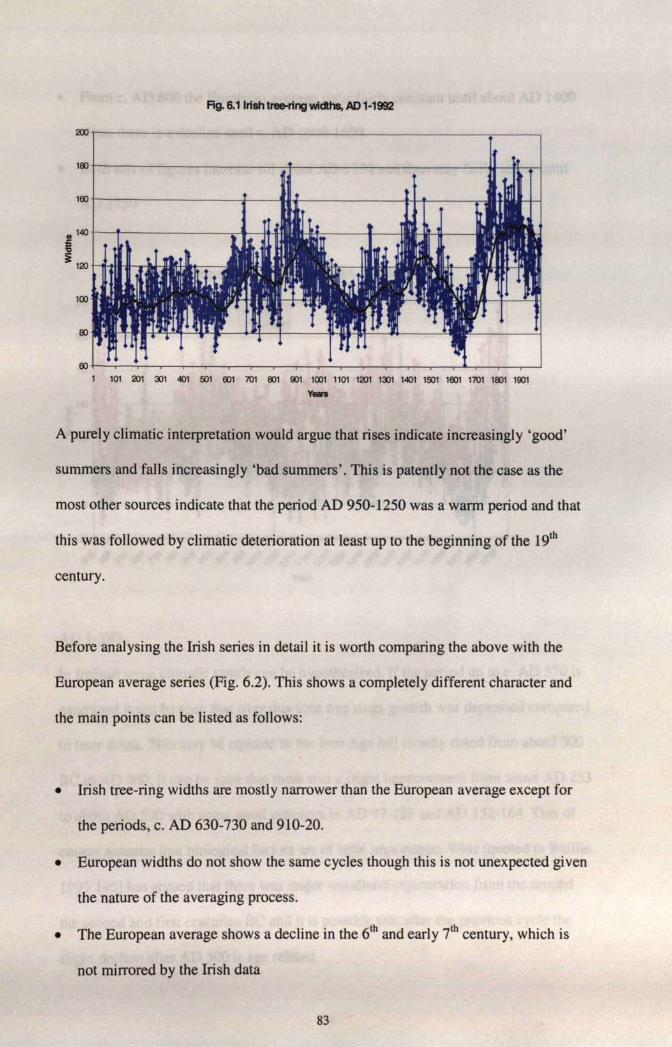
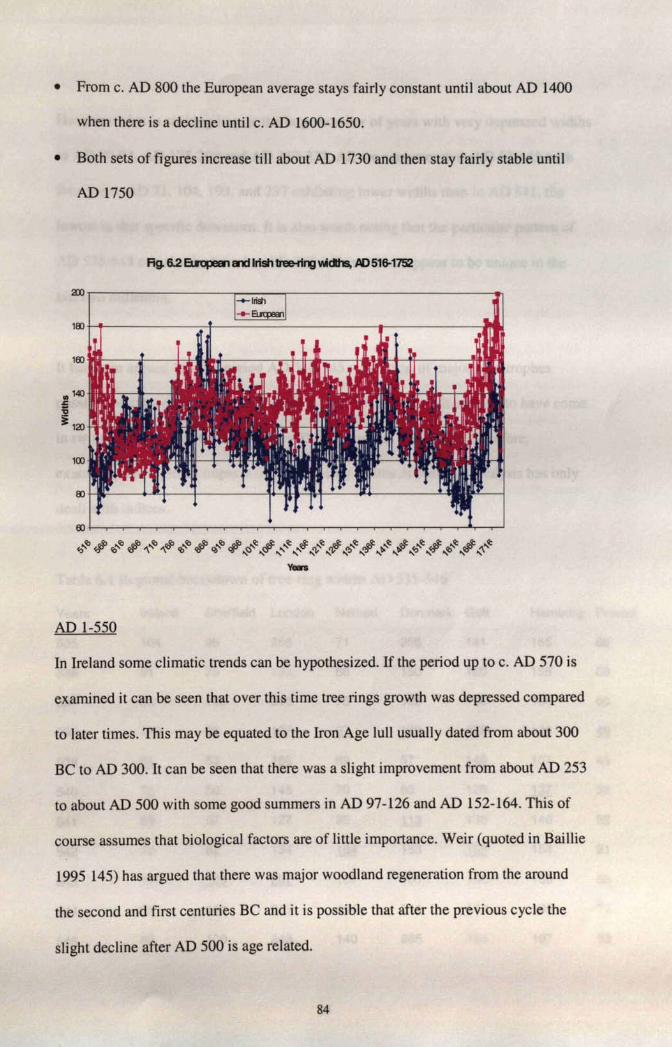
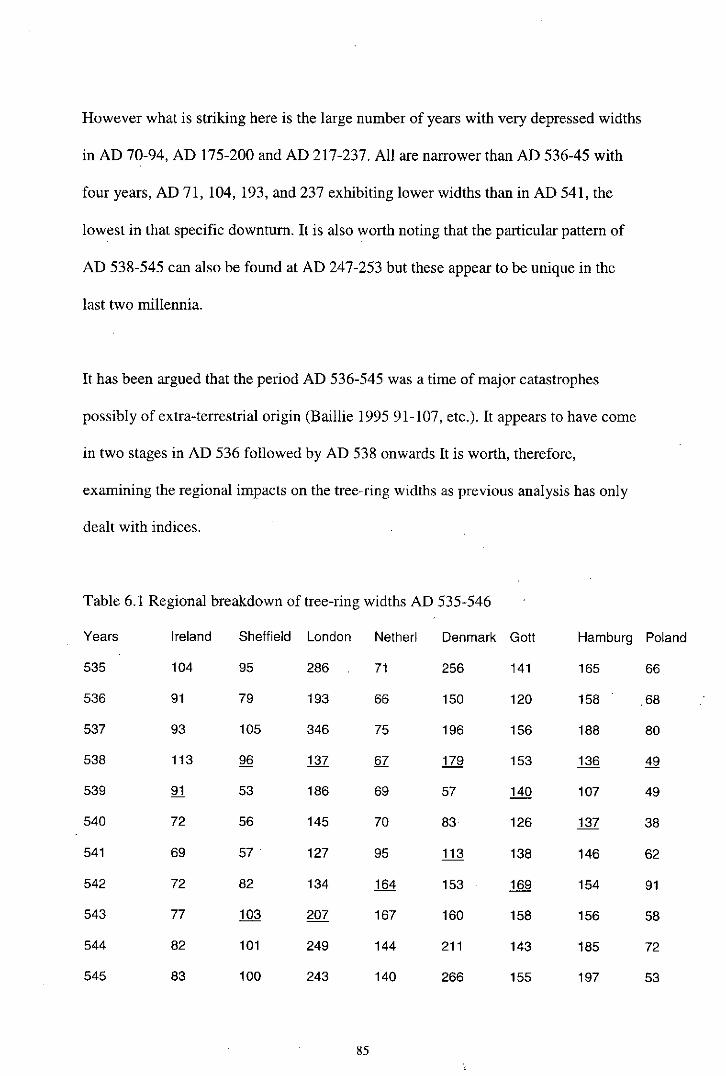
However what is striking here is the large number of years with very depressed widths
in AD 70-94, AD 175-200 and AD 217-237. All are narrower than AD 536-45 with
four years, AD 71, 104, 193, and 237 exhibiting lower widths than in AD 541, the
lowest in that specific downturn. It is also worth noting that the particular pattern of
AD 538-545 can also be found at AD 247-253 but these appear to be unique in the
last two millennia.
It has been argued that the period AD 536-545 was a time of major catastrophes
possibly of extra-terrestrial origin (Baillie 1995 91-107, etc.). It appears to have come
in two stages in AD 536 followed by AD 538 onwards It is worth, therefore,
examining the regional impacts on the tree-ring widths as previous analysis has only
dealt with indices.
Table 6.1 Regional breakdown of tree-ring widths AD 535-546
Years Ireland Sheffield London Netherl Denmark Gott Hamburg Poland
535 104 95 286 71 256 141 165 66
536 91 79 193 66 150 120 158 .68
537 93 105 346 75 196 156 188 80
538 113 96 137 67 179 153 136 49
539 91 53 186 69 57 140 107 49
540 72 56 145 70 83 126 137 38
541 69 57 127 95 113 138 146 62
542 72 82 134 164 153 169 154 91
543 77 103 207 167 160 158 156 58
544 82 101 249 144 211 143 185 72
545 83 100 243 140 266 155 197 53
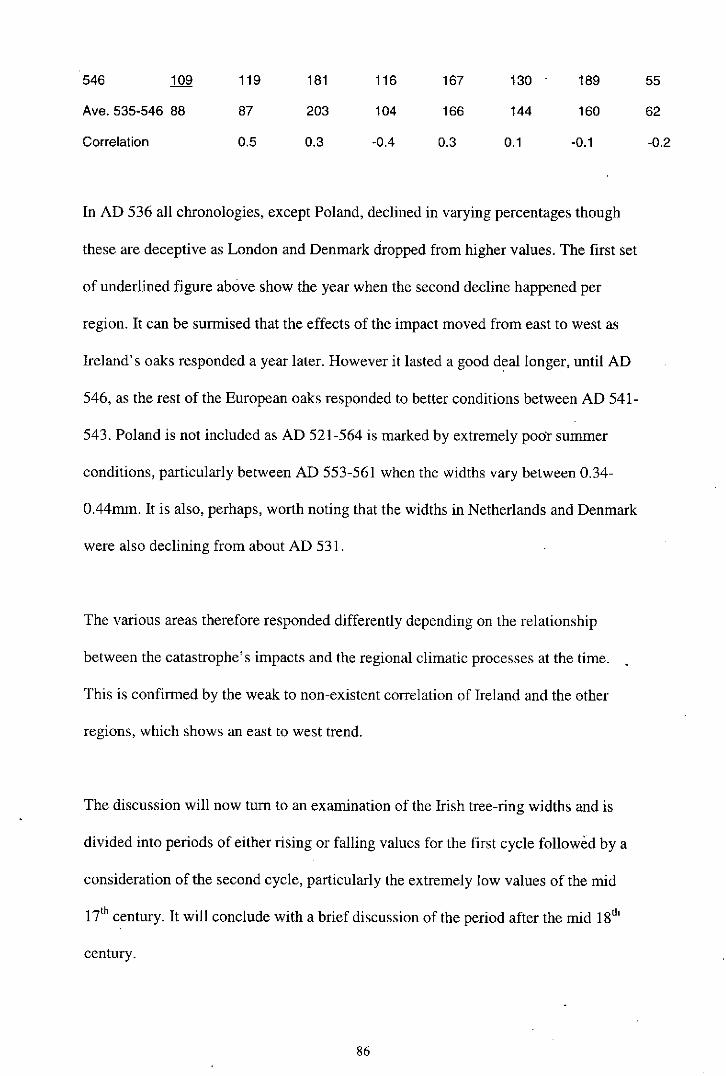
546 109 119 181 116 167 130 189
Ave. 535-546 88 87 203 104 166 144 160
Correlation 0.5 0.3 -0.4 0.3 0.1 -0.1
In AD 536 all chronologies, except Poland, declined in varying percentages though
these are deceptive as London and Denmark dropped from higher values. The first set
of underlined figure above show the year when the second decline happened per
region. It can be surmised that the effects of the impact moved from east to west as
Ireland's oaks responded a year later. However it lasted a good deal longer, until AD
546, as the rest of the European oaks responded to better conditions between AD 541-
543. Poland is not included as AD 521-564 is marked by extremely poor: summer
conditions, particularly between AD 553-561 when the widths vary between 0.34-
0.44mm. It is also, perhaps, worth noting that the widths in Netherlands and Denmark
were also declining from about AD 531.
The various areas therefore responded differently depending on the relationship
between the catastrophe's impacts and the regional climatic processes at the time. ,
This is confirmed by the weak to non-existent correlation of Ireland and the other
regions, which shows an east to west trend.
The discussion will now turn to an examination of the Irish tree-ring widths and is
divided into periods of either rising or falling values for the first cycle followed by a
consideration of the second cycle, particularly the extremely low values of the mid
17 t h century. It will conclude with a brief discussion of the period after the mid 18 t h
century.
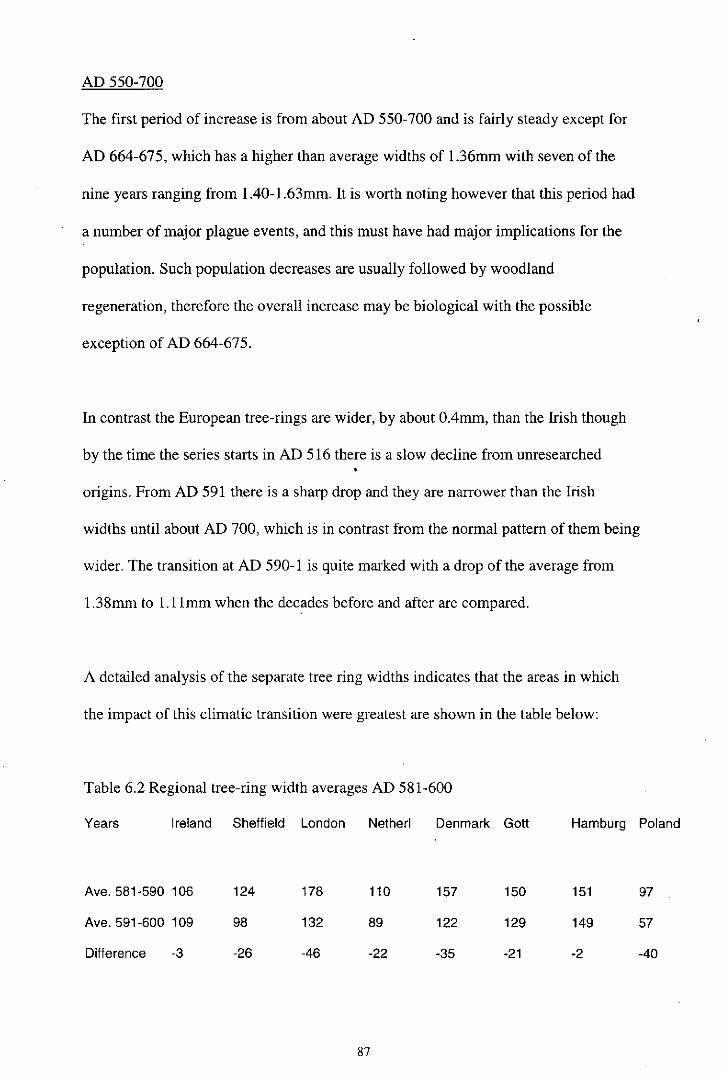
AD 550-700
The first period of increase is from about AD 550-700 and is fairly steady except for
AD 664-675, which has a higher than average widths of 1.36mm with seven of the
nine years ranging from 1.40-1.63mm. It is worth noting however that this period had
a number of major plague events, and this must have had major implications for the
population. Such population decreases are usually followed by woodland
regeneration, therefore the overall increase may be biological with the possible
exception of AD 664-675.
In contrast the European tree-rings are wider, by about 0.4mm, than the Irish though
by the time the series starts in AD 516 there is a slow decline from unresearched
origins. From AD 591 there is a sharp drop and they are narrower than the Irish
widths until about AD 700, which is in contrast from the normal pattern of them being
wider. The transition at AD 590-1 is quite marked with a drop of the average from
1.38mm to 1.11mm when the decades before and after are compared.
A detailed analysis of the separate tree ring widths indicates that the areas in which
the impact of this climatic transition were greatest are shown in the table below:
Table 6.2 Regional tree-ring width averages AD 581-600
Years Ireland Sheffield London Netherl Denmark Gott Hamburg Pol;
Ave. 581-590 106 124 178 110 157 150 151 97
Ave. 591-600 109 98 132 89 122 129 149 57
Difference -3 -26 -46 -22 -35 -21 -2 -40
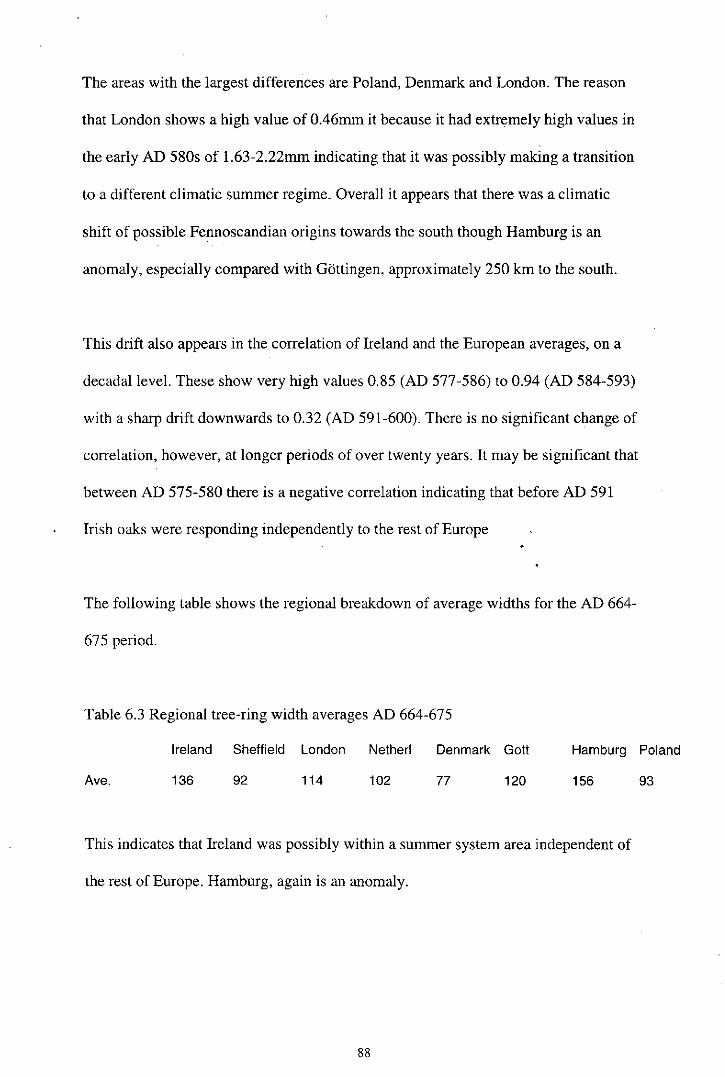
The areas with the largest differences are Poland, Denmark and London. The reason
that London shows a high value of 0.46mm it because it had extremely high values in
the early AD 580s of 1.63-2.22mm indicating that it was possibly making a transition
to a different climatic summer regime. Overall it appears that there was a climatic
shift of possible Fennoscandian origins towards the south though Hamburg is an
anomaly, especially compared with Gottingen, approximately 250 km to the south.
This drift also appears in the correlation of Ireland and the European averages, on a
decadal level. These show very high values 0.85 (AD 577-586) to 0.94 (AD 584-593)
with a sharp drift downwards to 0.32 (AD 591-600). There is no significant change of
correlation, however, at longer periods of over twenty years. It may be significant that
between AD 575-580 there is a negative correlation indicating that before AD 591
Irish oaks were responding independently to the rest of Europe
The following table shows the regional breakdown of average widths for the AD 664-
675 period.
Table 6.3 Regional tree-ring width averages AD 664-675
Ireland Sheffield London Netherl Denmark Gott Hamburg Poland
Ave. 136 92 114 102 77 120 156 93
This indicates that Ireland was possibly within a summer system area independent of
the rest of Europe. Hamburg, again is an anomaly.
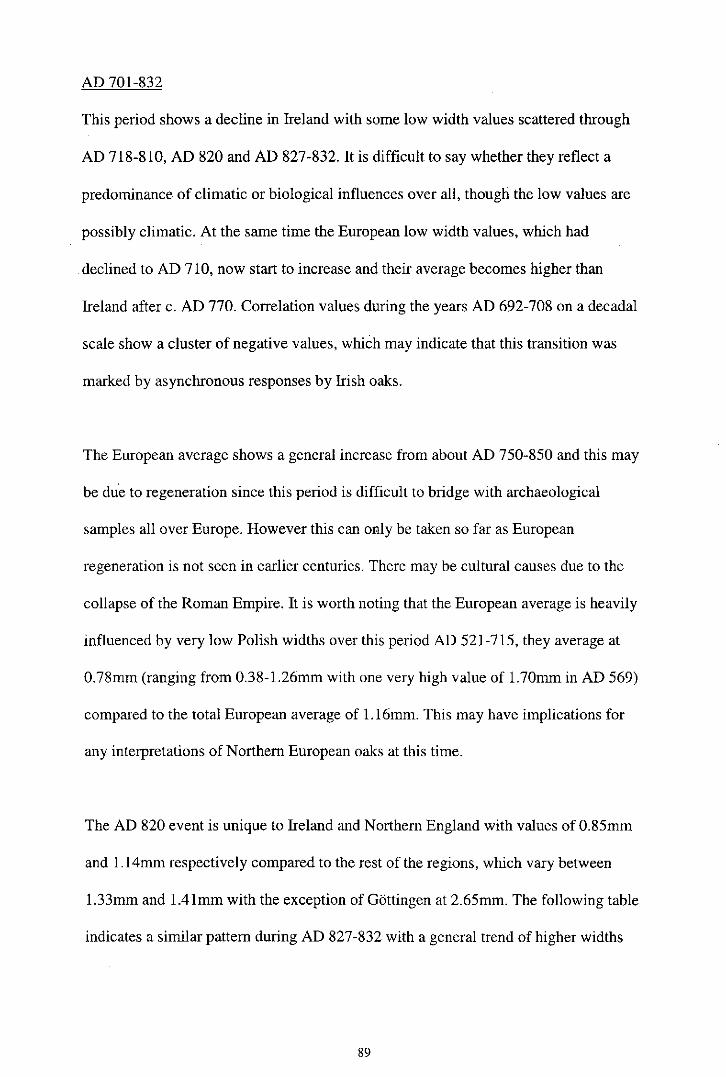
AD 701-832
This period shows a decline in Ireland with some low width values scattered through
AD 718-810, AD 820 and AD 827-832. It is difficult to say whether they reflect a
predominance of climatic or biological influences over all, though the low values are
possibly climatic. At the same time the European low width values, which had
declined to AD 710, now start to increase and their average becomes higher than
Ireland after c. AD 770. Correlation values during the years AD 692-708 on a decadal
scale show a cluster of negative values, which may indicate that this transition was
marked by asynchronous responses by Irish oaks.
The European average shows a general increase from about AD 750-850 and this may
be due to regeneration since this period is difficult to bridge with archaeological
samples all over Europe. However this can only be taken so far as European
regeneration is not seen in earlier centuries. There may be cultural causes due to the
collapse of the Roman Empire. It is worth noting that the European average is heavily
influenced by very low Polish widths over this period AD 521-715, they average at
0.78mm (ranging from 0.38-1.26mm with one very high value of 1.70mm in AD 569)
compared to the total European average of 1.16mm. This may have implications for
any interpretations of Northern European oaks at this time.
The AD 820 event is unique to Ireland and Northern England with values of 0.85mm
and 1.14mm respectively compared to the rest of the regions, which vary between
1.33mm and 1.41mm with the exception of Gottingen at 2.65mm. The following table
indicates a similar pattern during AD 827-832 with a general trend of higher widths
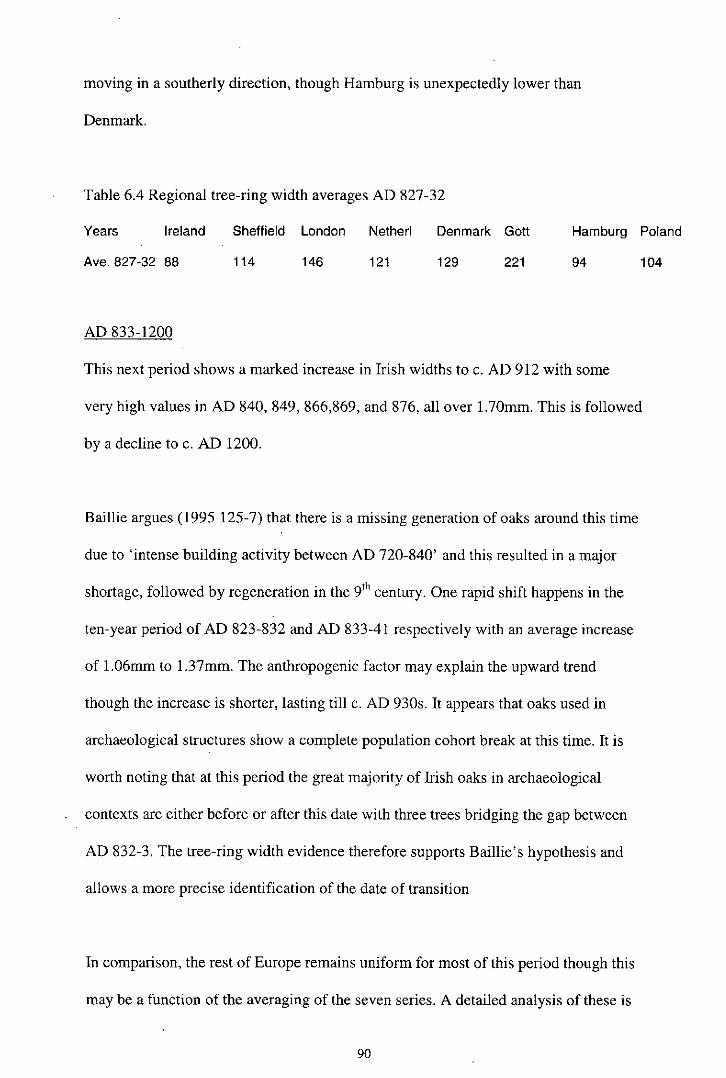
moving in a southerly direction, though Hamburg is unexpectedly lower than
Denmark.
Table 6.4 Regional tree-ring width averages AD 827-32
Years Ireland Sheffield London Netherl Denmark Gott Hamburg Poland
Ave. 827-32 88 114 146 121 129 221 94 104
AD 833-1200
This next period shows a marked increase in Irish widths to c. AD 912 with some
very high values in AD 840, 849, 866,869, and 876, all over 1.70mm. This is followed
by a decline to c. AD 1200.
Baillie argues (1995 125-7) that there is a missing generation of oaks around this time
due to 'intense building activity between AD 720-840' and this resulted in a major
shortage, followed by regeneration in the 9 t h century. One rapid shift happens in the
ten-year period of AD 823-832 and AD 833-41 respectively with an average increase
of 1.06mm to 1.37mm. The anthropogenic factor may explain the upward trend
though the increase is shorter, lasting till c. AD 930s. It appears that oaks used in
archaeological structures show a complete population cohort break at this time. It is
worth noting that at this period the great majority of Irish oaks in archaeological
contexts are either before or after this date with three trees bridging the gap between
AD 832-3. The tree-ring width evidence therefore supports Baillie's hypothesis and
allows a more precise identification of the date of transition
In comparison, the rest of Europe remains uniform for most of this period though this
may be a function of the averaging of the seven series. A detailed analysis of these is
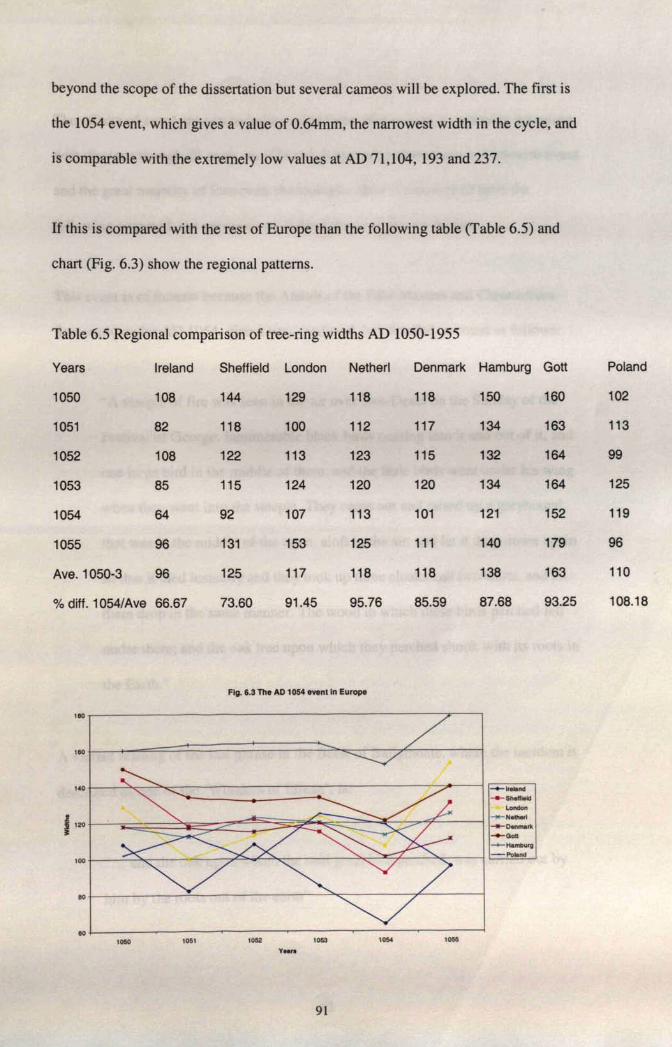
The effects of event appears to have moved from west to east, its intensity lessening
with distance though all areas are affected. It appears to have been a short-term event
and the great majority of European chronologies show a recovery of trees the
following year with the exception of Poland due to unknown factors.
This event is of interest because the Annals of the Four Masters and Chronichum
Scotorum, under AD 1054, give a very confused, but detailed, account as follows:
"A steeple of fire was seen in the air over Ros-Deala on the Sunday of the
Festival of George; innumerable black birds passing into it and out of it, and
one large bird in the middle of them; and the little birds went under his wing
when they went into the steeple. They came out and raised up a greyhound,
that was in the middle of the town, aloft in the air, and let it drop down again
so that it died instantly and they took up three cloaks and two shirts, and let
them drop in the same manner. The wood in which these birds perched fell
under them; and the oak tree upon which they perched shook with its roots in
the Earth."
A variant reading of the last phrase in the Book of Ballymoate, where the incident is
described as one of the 'Wonders of Eirean', is:
"... and the oak upon which the said great bird perched was carried out by
him by the roots out of the earth"
O'Donovan, the editor, identified Ros-Deala, as near Durrow, Co. Westmeath. He
also notes that the Festival of George was on Saturday in AD 1054, and Sunday the
following year. His opinion was that the text probably meant the Sunday following
the event as he states that the chronology of the Annals of the Four Masters is
accurate for this period. This opinion could be questioned as the previous great winter
is recorded in the same Annals under AD 1048, but AD 1047 in the other annals.
Overall it is likely that the event did take place in AD 1054 but a year either side is
also possible. The Festival of George is intriguing, as this saint is also associated with
dragons, sometimes seen as a metaphor for extra-terrestrial phenomena.
In a recent article McCarthy (1997 1-43) stated that this is a very garbled account of
the first sighting of the Crab Nebula, which is not otherwise recorded in European
contemporary sources. An alternative scenario is that it was an extremely climatic
event, i.e. a tornado, since obviously it is impossible for a nebula to impact on tree-
rings in this way. The main argument against the latter alternative is that none of the
Annals describe any destruction with the exception of a lake moving from Sewran to
the Boyne, both in Co. Meath. Certainly some major short-term event can be
hypothesised, though on the basis of extant Irish sources, it is impossible to identify
what exactly was the reason for the narrow widths.
The second period covers the period AD 886-911 which show very high values of
negative correlation and this indicates that summers in Ireland were responding in a
completely opposite way to the rest of Europe (Fig. 6.4-6.6).
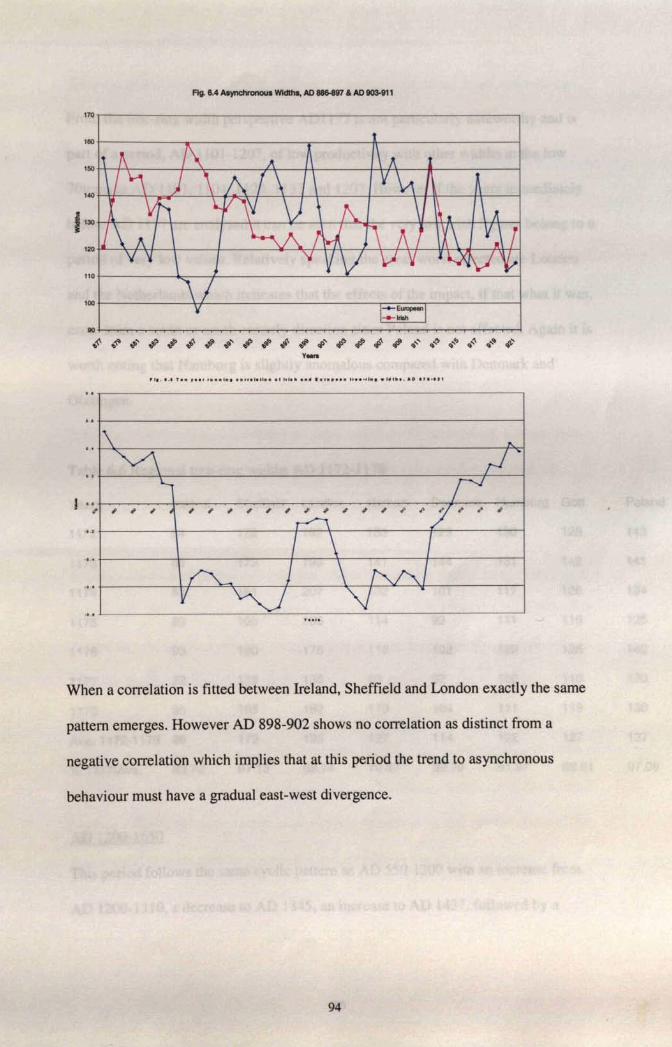
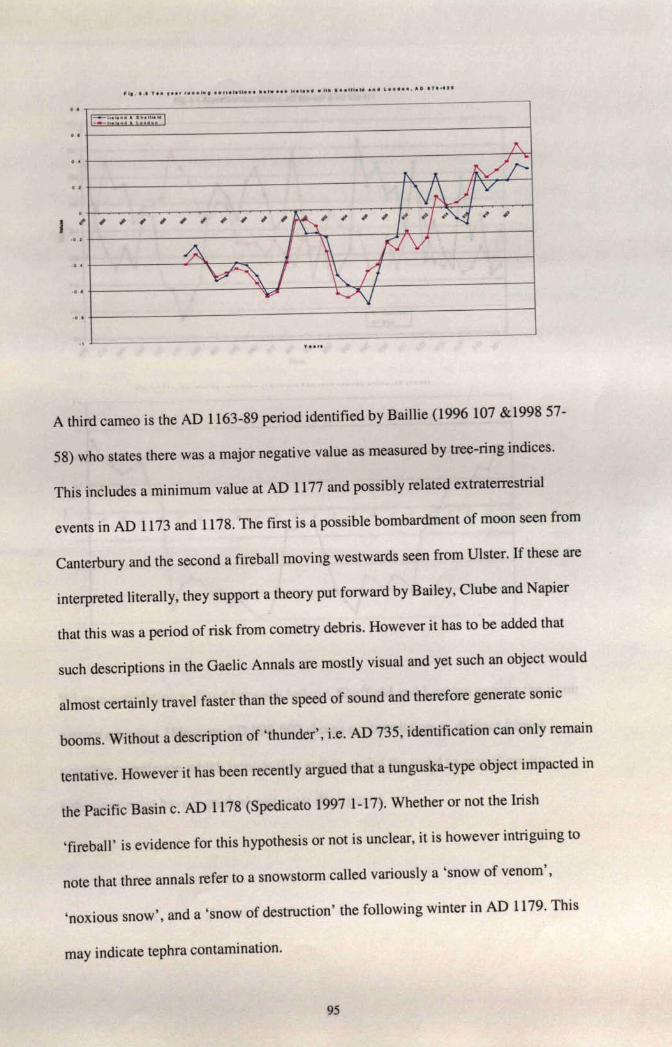
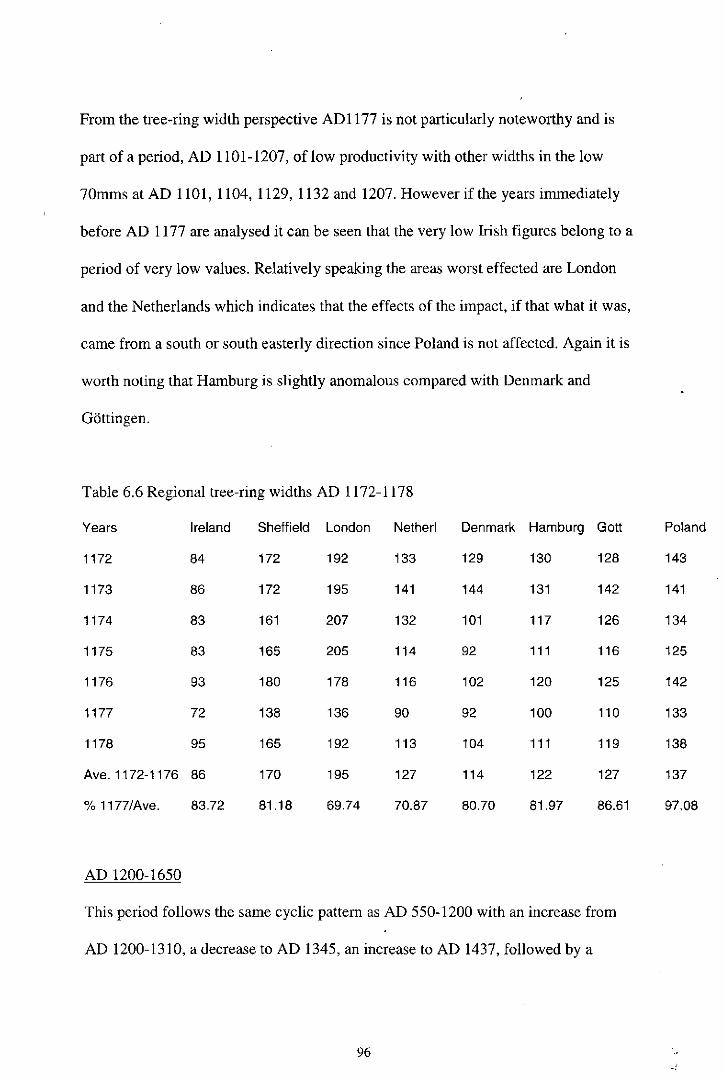
From the tree-ring width perspective AD1177 is not particularly noteworthy and is
part of a period, AD 1101-1207, of low productivity with other widths in the low
70mms at AD 1101, 1104, 1129, 1132 and 1207. However if the years immediately
before AD 1177 are analysed it can be seen that the very low Irish figures belong to a
period of very low values. Relatively speaking the areas worst effected are London
and the Netherlands which indicates that the effects of the impact, if that what it was,
came from a south or south easterly direction since Poland is not affected. Again it is
worth noting that Hamburg is slightly anomalous compared with Denmark and
Gottingen.
Table 6.6 Regional tree-ring widths AD 1172-1178
Years Ireland Sheffield London Netherl Denmark Hamburg Gott Poland
1172 84 172 192 133 129 130 128 143
1173 86 172 195 141 144 131 142 141
1174 83 161 207 132 101 117 126 134
1175 83 165 205 114 92 111 116 125
1176 93 180 178 116 102 120 125 142
1177 72 138 136 90 92 100 110 133
1178 95 165 192 113 104 111 119 138
Ave. 1172-1176 86 170 195 127 114 122 127 137
% 1177/Ave. 83.72 81.18 69.74 70.87 80.70 81.97 86.61 97.08
AD 1200-1650
This period follows the same cyclic pattern as AD 550-1200 with an increase from
AD 1200-1310, a decrease to AD 1345, an increase to AD 1437, followed by a
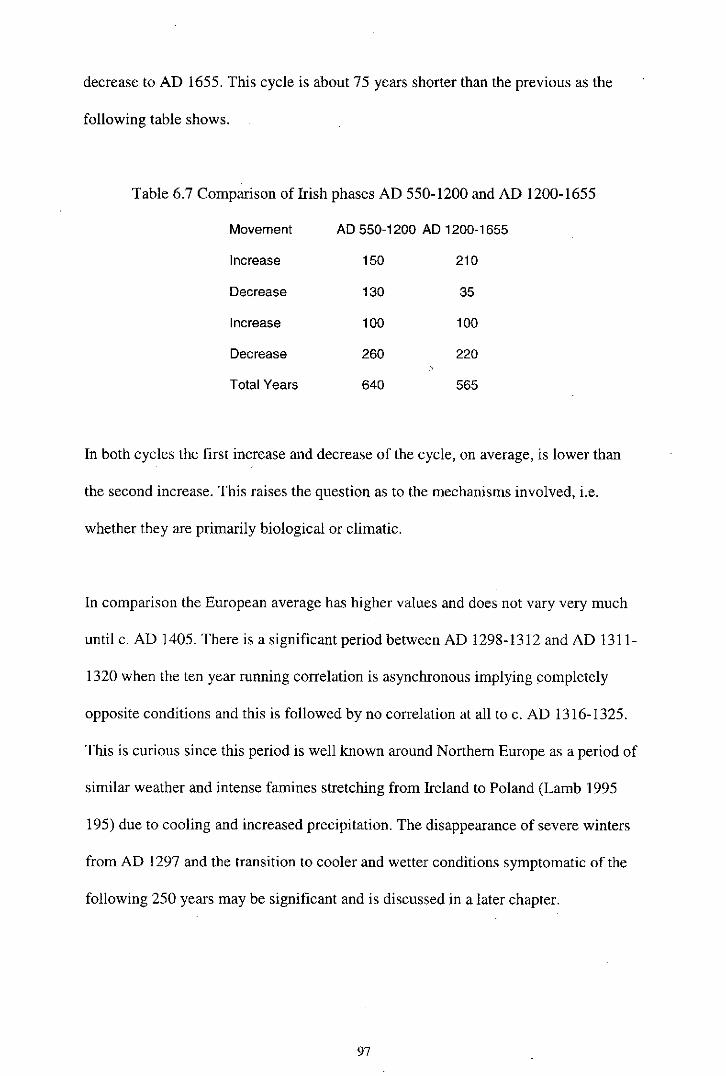
decrease to AD 1655. This cycle is about 75 years shorter than the previous as the
following table shows.
Table 6.7 Comparison of Irish phases AD 550-1200 and AD 1200-1655
Movement AD 550-1200 AD 1200-1655
Increase 150 210
Decrease 130 35
Increase 100 100
Decrease 260 220
Total Years 640 565
In both cycles the first increase and decrease of the cycle, on average, is lower than
the second increase. This raises the question as to the mechanisms involved, i.e.
whether they are primarily biological or climatic.
In comparison the European average has higher values and does not vary very much
until c. AD 1405. There is a significant period between AD 1298-1312 and AD 1311-
1320 when the ten year running correlation is asynchronous implying completely
opposite conditions and this is followed by no correlation at all to c. AD 1316-1325.
This is curious since this period is well known around Northern Europe as a period of
similar weather and intense famines stretching from Ireland to Poland (Lamb 1995
195) due to cooling and increased precipitation. The disappearance of severe winters
from AD 1297 and the transition to cooler and wetter conditions symptomatic of the
following 250 years may be significant and is discussed in a later chapter.

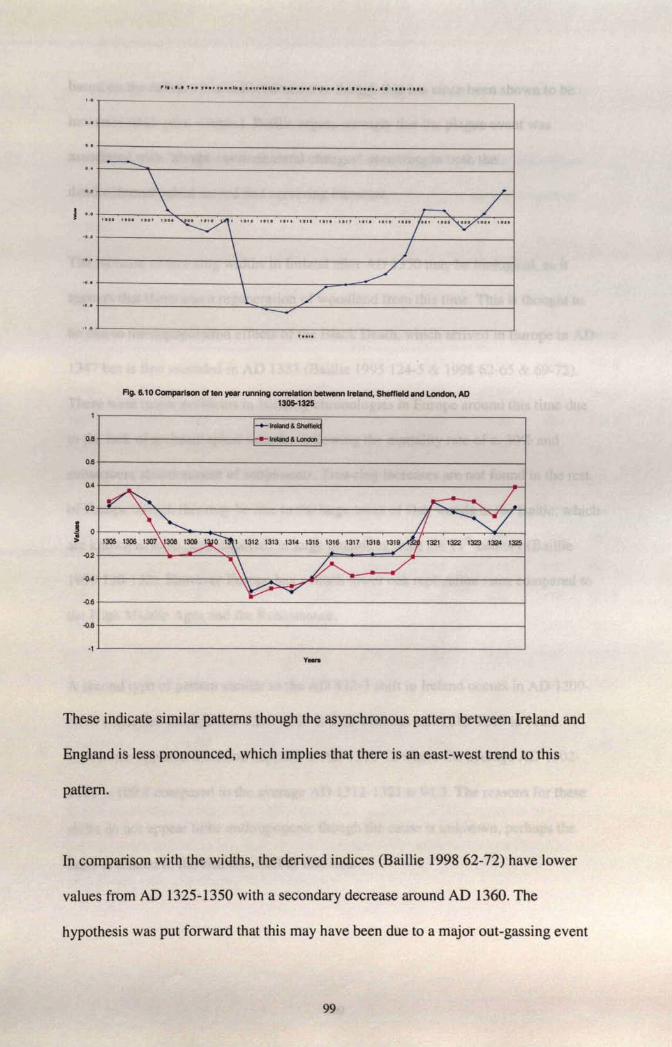
based on the radiocarbon calibration curve though this has since been shown to be
incorrect (ibid. pers. comm.). Baillie argues strongly that the plague event was
associated with 'abrupt environmental changes' appearing in both the
dendrochronological record and surviving literature.
The increase of tree-ring widths in Ireland after AD 1350 may be biological, as it
appears that there was a regeneration of woodland from this time. This is thought to
be due to the depopulation effects of the Black Death, which arrived in Europe in AD
1347 but is first recorded in AD 1333 (Baillie 1995 124-5 & 1998 62-65 & 69-72).
There were major problems in building chronologies in Europe around this time due
to the lack of archaeological samples following the mortality rate of c. 30% and
subsequent abandonment of settlements. Tree-ring increases are not found in the rest
of Europe though this may be due to the large areas of Oak woods in the Baltic, which
are known to have been imported in large quantities since the 11 t h century (Baillie
1995 130-132). However Europe has a much lower oak replication rates compared to
the High Middle Ages and the Renaissance.
A second type of pattern similar to the AD 832-3 shift in Ireland occurs in AD 1209-
1210 where the average AD 1200-1209 is 93.6 whereas AD 1210-1219 is 112.5. A
shift in the opposite direction happens at AD 1311-12 where the average AD 1302-
1311 is 109.8 compared to the average AD 1312-1321 is 94.3. The reasons for these
shifts do not appear to be anthropogenic though the cause is unknown, perhaps the
latter is related to the climatic shift of that time.
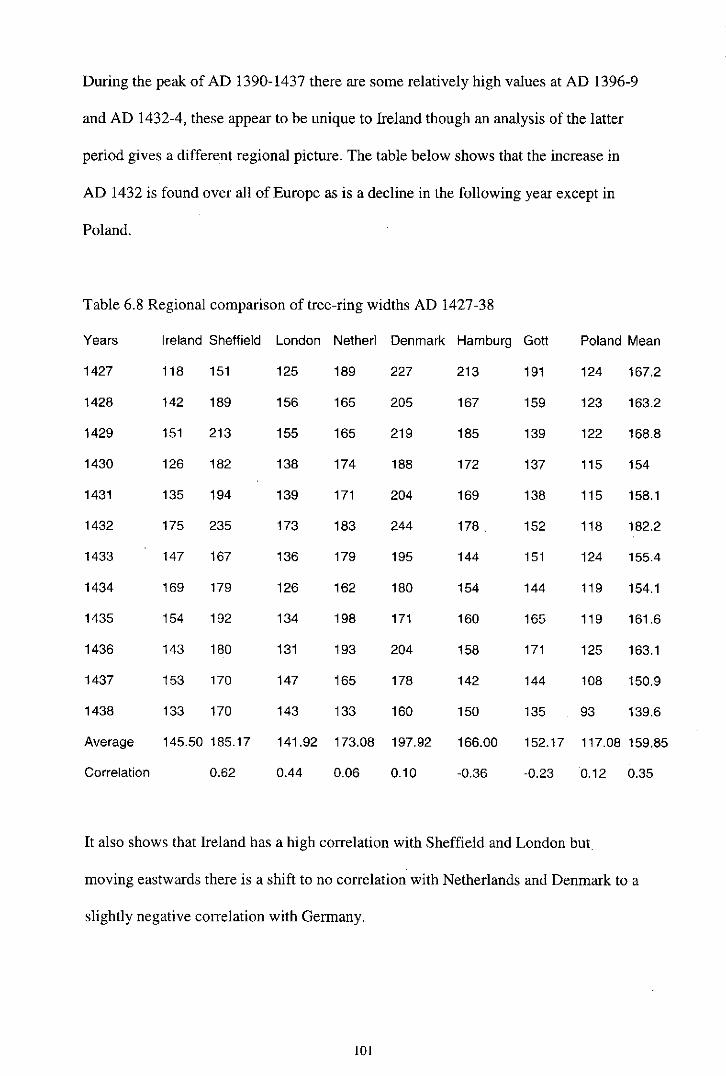
During the peak of AD 1390-1437 there are some relatively high values at AD 1396-9
and AD 1432-4, these appear to be unique to Ireland though an analysis of the latter
period gives a different regional picture. The table below shows that the increase in
AD 1432 is found over all of Europe as is a decline in the following year except in
Poland.
Table 6.8 Regional comparison of tree-ring widths AD 1427-38
Years Ireland Sheffield London Netherl Denmark Hamburg Gott Poland Mean
1427 118 151 125 189 227 213 191 124 167.2
1428 142 189 156 165 205 167 159 123 163.2
1429 151 213 155 165 219 185 139 122 168.8
1430 126 182 138 174 188 172 137 115 154
1431 135 194 139 171 204 169 138 115 158.1
1432 175 235 173 183 244 178 . 152 118 182.2
1433 147 167 136 179 195 144 151 124 155.4
1434 169 179 126 162 180 154 144 119 154.1
1435 154 192 134 198 171 160 165 119 161.6
1436 143 180 131 193 204 158 171 125 163.1
1437 153 170 147 165 178 142 144 108 150.9
1438 133 170 143 133 160 150 135 93 139.6
Average 145.50 185.17 141.92 173.08 197.92 166.00 152.17 117.08 159.85
Correlation 0.62 0.44 0.06 0.10 -0.36 -0.23 0.12 0.35
It also shows that Ireland has a high correlation with Sheffield and London but.
moving eastwards there is a shift to no correlation with Netherlands and Denmark to a
slightly negative correlation with Germany.
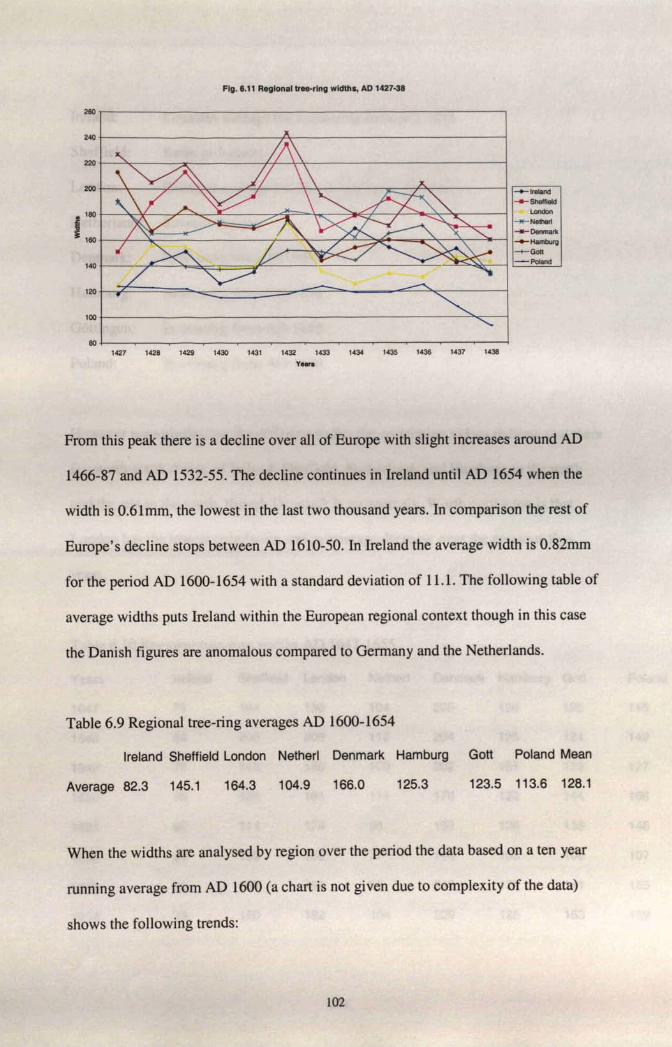
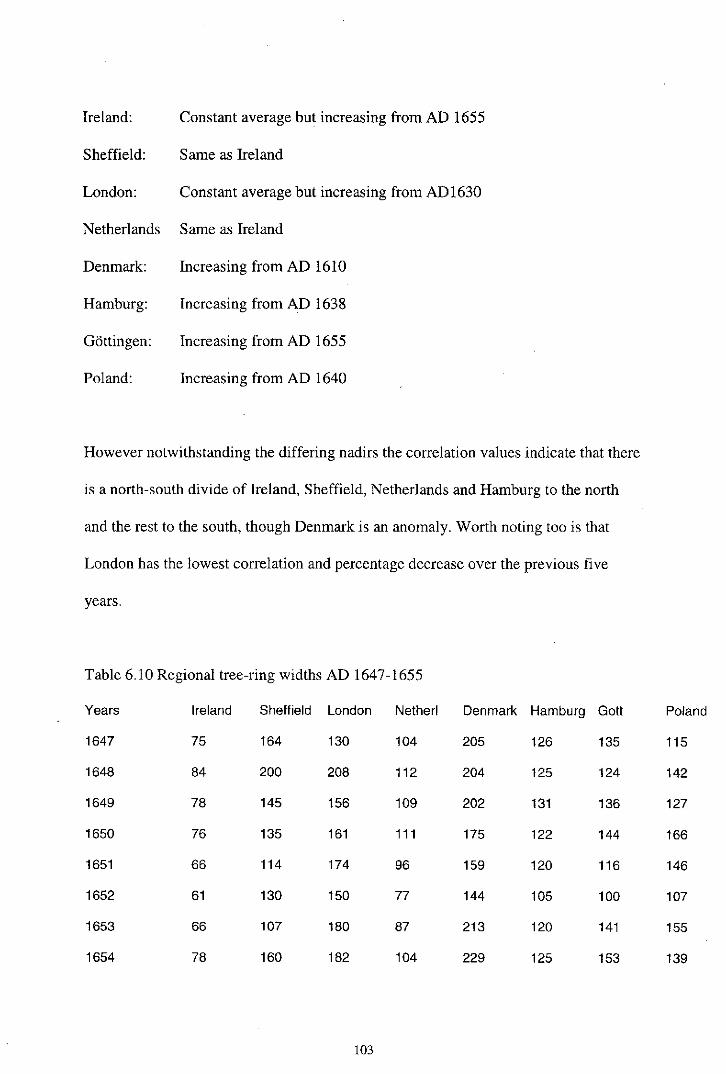
Ireland: Constant average but increasing from AD 1655
Sheffield: Same as Ireland
London: Constant average but increasing from AD 1630
Netherlands Same as Ireland
Denmark: Increasing from AD 1610
Hamburg: Increasing from AD 1638
Gottingen: Increasing from AD 1655
Poland: Increasing from AD 1640
However notwithstanding the differing nadirs the correlation values indicate that there
is a north-south divide of Ireland, Sheffield, Netherlands and Hamburg to the north
and the rest to the south, though Denmark is an anomaly. Worth noting too is that
London has the lowest correlation and percentage decrease over the previous five
years.
Table 6.10 Regional tree-ring widths AD 1647-1655
Years Ireland Sheffield London Netherl Denmark Hamburg Gott Poland
1647 75 164 130 104 205 126 135 115
1648 84 200 208 112 204 125 124 142
1649 78 145 156 109 202 131 136 127
1650 76 135 161 111 175 122 144 166
1651 66 114 174 96 159 120 116 146
1652 61 130 150 77 144 105 100 107
1653 66 107 180 87 213 120 141 155
1654 78 160 182 104 229 125 153 139
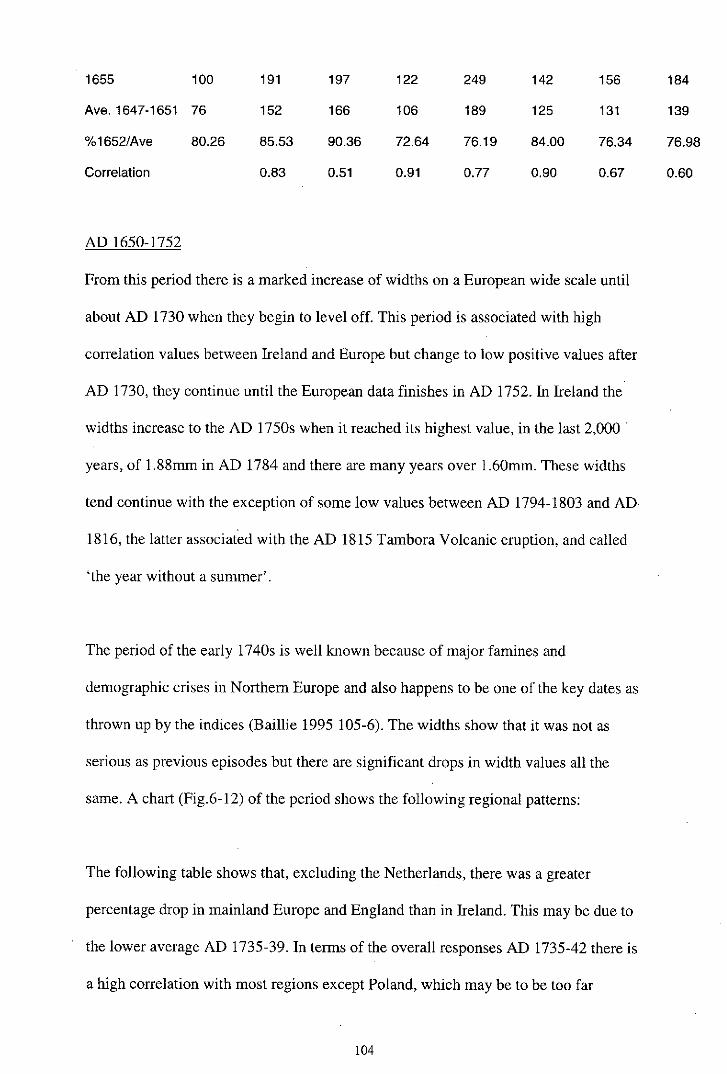
1655 100 191 197 122 249 142 156 184
Ave. 1647-1651 76 152 166 106 189 125 131 139
%1652/Ave 80.26 85.53 90.36 72.64 76.19 84.00 76.34 76.98
Correlation 0.83 0.51 0.91 0.77 0.90 0.67 0.60
AD 1650-1752
From this period there is a marked increase of widths on a European wide scale until
about AD 1730 when they begin to level off. This period is associated with high
correlation values between Ireland and Europe but change to low positive values after
AD 1730, they continue until the European data finishes in AD 1752. In Ireland the
widths increase to the AD 1750s when it reached its highest value, in the last 2,000
years, of 1.88mm in AD 1784 and there are many years over 1.60mm. These widths
tend continue with the exception of some low values between AD 1794-1803 and AD
1816, the latter associated with the AD 1815 Tambora Volcanic eruption, and called
'the year without a summer'.
The period of the early 1740s is well known because of major famines and
demographic crises in Northern Europe and also happens to be one of the key dates as
thrown up by the indices (Baillie 1995 105-6). The widths show that it was not as
serious as previous episodes but there are significant drops in width values all the
same. A chart (Fig.6-12) of the period shows the following regional patterns:
The following table shows that, excluding the Netherlands, there was a greater
percentage drop in mainland Europe and England than in Ireland. This may be due to
the lower average AD 1735-39. In terms of the overall responses AD 1735-42 there is
a high correlation with most regions except Poland, which may be to be too far
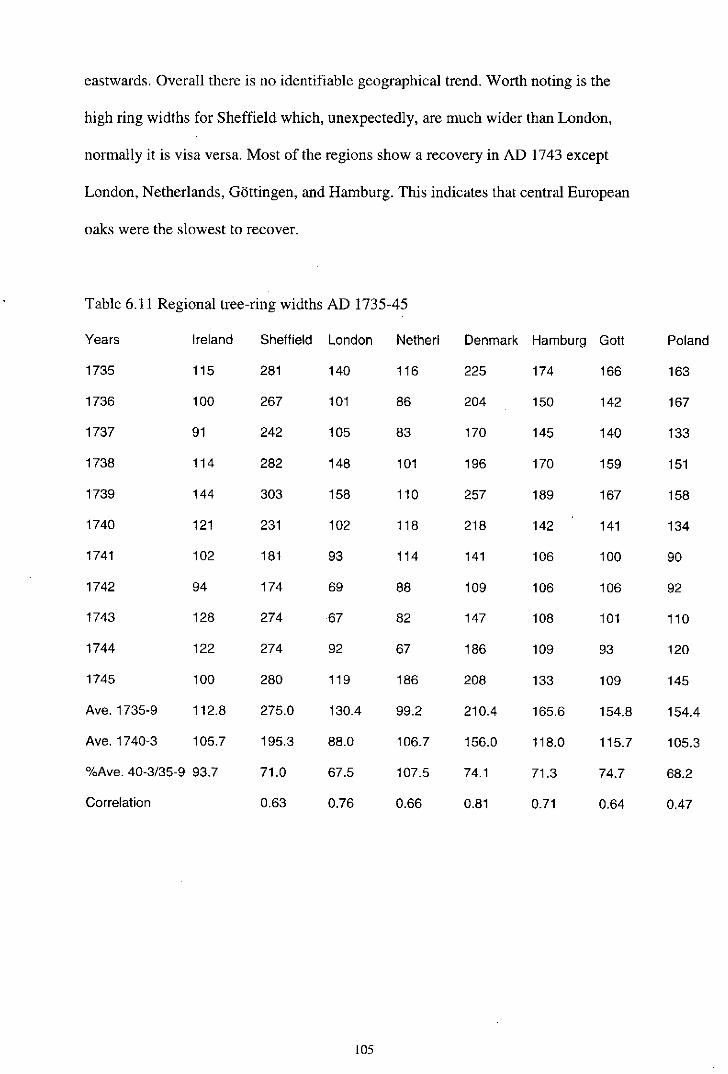
eastwards. Overall there is no identifiable geographical trend. Worth noting is the
high ring widths for Sheffield which, unexpectedly, are much wider than London,
normally it is visa versa. Most of the regions show a recovery in AD 1743 except
London, Netherlands, Gottingen, and Hamburg. This indicates that central European
oaks were the slowest to recover.
Table 6.11 Regional tree-ring widths AD 1735-45
Years Ireland Sheffield London Netherl Denmark Hamburg Gott Poland
1735 115 281 140 116 225 174 166 163
1736 100 267 101 86 204 150 142 167
1737 91 242 105 83 170 145 140 133
1738 114 282 148 101 196 170 159 151
1739 144 303 158 110 257 189 167 158
1740 121 231 102 118 218 142 141 134
1741 102 181 93 114 141 106 100 90
1742 94 174 69 88 109 106 106 92
1743 128 274 67 82 147 108 101 110
1744 122 274 92 67 186 109 93 120
1745 100 280 119 186 208 133 109 145
Ave. 1735-9 112.8 275.0 130.4 99.2 210.4 165.6 154.8 154.4
Ave. 1740-3 105.7 195.3 88.0 106.7 156.0 118.0 115.7 105.3
%Ave. 40-3/35-9 93.7 71.0 67.5 107.5 74.1 71.3 74.7 68.2
Correlation 0.63 0.76 0.66 0.81 0.71 0.64 0.47

are in AD 71, 104, 193, 237, 1054 and 1652. However in the case of the widths these
tend to be the low points within their cycles but are worth investigating in their own
right as they sometimes represent turning points.
Whether Poland should be included in this analysis is a point that needs to be
explored further as there appears to be periods when there is little correlation between
Polish and Irish trees. Of course individual comparative correlation coefficients
indicate that there generally is an east west trend but if this exercise was to be
repeated the recommendation would be to omit the Polish data from the mean but to
include the French data if it is of northern, rather than Mediterranean, origin. It would
be interesting to tie in Atlantic Iberian chronologies if such were available.
Furthermore a region by region inter-comparative survey would be useful.
There is also the problem of anomalies, which were regularly noted above. For
instance it is not clear why Hamburg is often out of step with Gottingen, Denmark and
the Netherlands. Whether this has implications for regions or is an artefact of
Hamburg's research methodologies is unknown but may be worth investigating.
One of the questions raised by the above process is the definition of a region. This has
been recently discussed by Baillie (1982 73-82) who concluded that 'the question was
reduntant' and that in fact that the evidence shows a north-west Europe signal as
distinct from a one from the British Isles that was 'mutualy exclusive' (as defined by
Fletcher) to mainland Europe at least for the period AD 1780-1959. Since then he has
used master chronologies from Ireland to Poland (but generally excluding France used
in the 1982 article) implying at least that there is a northern European signal.
However as previously noted there appears to an increasing level of synchronisity
between AD 516-1752 but it is unknown whether this continued to modern times as if
it did this would have implications for the conclusions.
There are now four complementary perspectives
• Indices indicate strong regional positive correlation
• Widths indicate long periods of positive correlation interspersed with short
periods of negative correlation.
• Total variation indicates a rising positive correlation
• Extreme variation show rapid shifts between positive correlation and negative
correlation
They may appear to be contradictory but they can be paired, the first with the third
and the second with the fourth.
We can only speculate as to why Ireland should diverge in such a fashion. Biology
does not appear to be an issue here as these periods have reasonable replication.
Overall the indications that the boundaries of the regions, however they may be
defined, vary over space and time and sometimes show sharp inter-regional
differences rather than diffuse incremental changes.
A theory that encompasses these perspectives will be a major step forward in
Dendrochronology.
CLIMATE IN IRELAND - AD 500-1300
Gaelic literature suggests that the ranking of weather systems, discussed in a previous
chapter, is not static and there were periods when others were more important. It is
possible to plot periods when particular weather regimes were predominant and it is
sometimes possible to plot transitions. The history of this change is the primary focus
of this study and the above descriptive system will be used as a perspective. These
periods will be compared with the climate of the 20 t h century with the understanding
that it is not necessarily typical but is at the benign end of climate variation.
The focus will be to interpret the data and compare it to European climate and offer
some conclusions as to how Ireland compares and contrasts with the mainland and the
relevance of the continental model in discussing Ireland. Particular note will be paid
to the Oceanic/Continental relationship and to geographical variations between the
northern sub-continent and Ireland. For the purposes of the discussion three main
periods, AD 500-1000, AD 1000-1300, and AD 1300-1600 will be considered, though
these dates are arbitrary and based on European models. The last period of AD 1300-
1600 is discussed in the following chapter.
First a short review of Irish climate in the pre-historic period will set the scene.
THE HOLOCENE AND PREHISTORIC CLIMATE
The end of the last glacial epoch, known as the Midlandian in Ireland, is dated to
13,000 BP. This was followed by a reasonably warm period that was interrupted by a
cold snap, the Younger Dryas, that lasted 750-1000 years and ended approximately
10,000 BP (11,500 BC). This period is known for its periglacial activity; glaciation
was unknown with the exception of a few mountain corries. It is believed that climate
in the last ten thousand years was similar to the present day though there were
moderate variations of temperature and precipitation. The old European climate
designation of the Boreal warm dry climate lasting until c. 500 BC with the exception
of the Atlantic cool wet period of c. 5000-3000 BC is not now believed to be the best
historic model though many of the opinions are still accepted with reservations.
The Bronze Age, c. 2000-500 BC, is thought to have been several degrees warmer
than modern times and was followed by a climatic collapse and soil deterioration,
which marks the transition to the Iron Age around 500 BC. The result was a
contraction of grasslands and a decline of arable farming followed by a period of
woodland regeneration that probably lasted from c. 500 BC to AD 200-300 and is
generally called the Iron Age lull (Mitchell & Ryan 1998 237 & Baillie 1995 45).
Raftery colourfully describes the plight of the farmer as being soaked, cold and
hungry, living under leaden skies and unceasing rain, wondering if they were on the
'Brink of Armageddon' (1994 36-7). This lull is a global phenomena found in most
documentary and proxy sources, though there are regional differences (Lamb 1995
152-4).
Worth noting is the fact that oak ring widths are very low through the Iron Age Lull
with a period when no Irish bog oaks are known to have survived. Tree ring widths
are depressed though there is slight average increase from c. AD 275. This is followed
by a slight average decline from c. AD 450 but significant average increases are not
found until AD 570. It is possible to offer the hypothesis that the cause of increasing
widths to the end of the third century AD was climatic and the decline that followed
was biological as the oak population was possibly near the end of its growth cycle.
The average increase that followed in AD 570 possibly represents the start of a new
cohort though climate may be a factor as there is a relative decline across Europe
from the beginning of the 6 t h century. The Irish dendrochronological evidence may
support the ending of the Iron Age lull in Ireland but not necessarily in the rest of
Europe.
In cultural terms it is argued that the period to the end of the 6 t h century was a time of
political upheaval with the formation of new dynasties and the submergence of old
population groups (O'Croinin 1995 41). This may indicate more clement times as
political 'winners' had more to gain from control of agricultural and craft production.
It is very difficult to concisely date the end of this period, as the proxy records are
inconsistent. The possible interpretations of three sets of evidence are as follows.
• Gaelic Literature does not record any climate change. Historians usually take the
beginning of the historic period as c. AD 300-500. This opinion is based on the
date when the literary evidence becomes trustworthy.
• There is a steady increase of oaks (from very few) from archaeological sites for
the period c. AD 1-550.
• The tree-ring widths may indicate a change in summers from around the third
century AD though this data is probably heavily compromised by biological
influences.
• Palynological research indicates that there is no coherent signal of change due to
anthropogenic influences.
CLIMATIC IMPROVEMENT, AD 500-1000
This period is poorly documented in Europe and as such only a broad picture can be
conjectured. Lamb, particularly, notes a major lack of documentary evidence around
50° latitude for most of the period before AD 600 but from that then it is that
summers were wet during AD 500-700 (with a run of very wet years in the AD 580s)
and AD 800-900. Cold winters appear to be common for most of the period, though
the earliest to be documented is in the AD 760s (Lamb 1995 163-6). Lamb, in the mid
1970s, thought that between AD 300-500 and in AD 900-1000 there were an
anomalously high number of anti-cyclones at 50° latitudes (Severin 1979 179). With
the exception of extreme anomalies EURO-CLIMHIST (Pfister 1998) does not
discuss winters before AD 1000 and analysis only begins in AD 750 when Europeans
start to trust their documentary sources.
To this may be added Grove who stated that there were glacial advances in Europe in
the 2-6ih centuries (Grove 1988 304) though there is insufficient evidence to make any
direct comparisons with the 'Little Ice Age'.
In Ireland the situation is similar in terms of documentation though there is more than
the rest of Northern Europe. To put this period in climatic context it is worth noting
what the Irish Wisdom texts of the 9 t h century have to say about ideal and
unseasonable weather. The former is taken from Tecosca Cormaic and the latter from
Immacallam in dd thuarad (Kelly 1998 3).
Season Ideal Unseasonable
Winter Fine and frosty Leafy
Spring Dry and windy Without flowers
Summer Dry and showery Gloomy
Autumn Heavy dewed and fruitful Without fruits
What is striking about the latter text is the absence of snow and freezing in the winter,
which indicates that, except for exceptional circumstances, this was not a major
problem. Winters that were too warm were claimed to be more of a hazard but they
are never referred to in the Irish Annals. Perhaps this concept was a borrowing from
European literature. Another possible question is whether these texts reflect good/bad
weather from a pastoral or arable viewpoint.
Monastic agricultural ideology, according to early hagiographies of Saints, was
oriented towards a vegetarian grain economy (Stout 1997 129-30). However this may
be questioned as there was a strong demand for cattle hides for the making of vellum
and it is well documented that Irish monasteries were not immune to the secular habit
of cattle raiding against other monasteries (Lucas 1967 172-229). While a vegetarian
economy may have been found in smaller and early monastic foundations it does not
appear to be general in larger monasteries with large land holdings. Lyons (1989 38)
argues that pastoral was more important than arable farming based on the lack of
references to the success or failure of grain harvests until the 11 t h century. However
the heavy focus of monastic legal texts to arable farming indicates its importance and
it has to be noted that entries describing 'scarcity and hunger' are given without
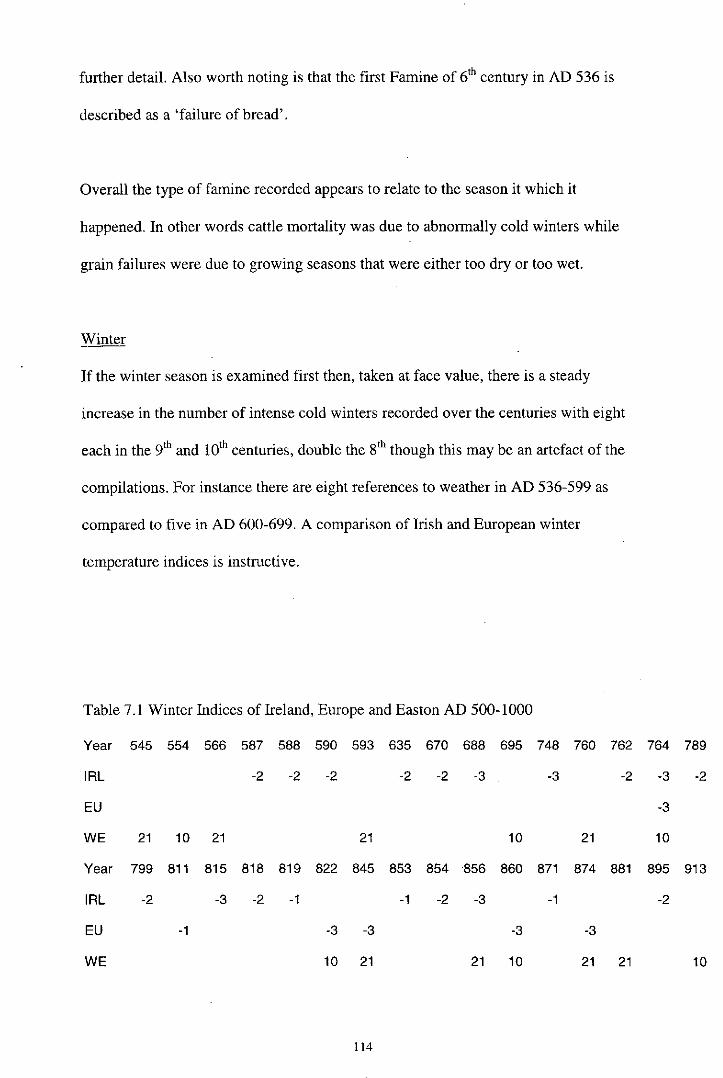
further detail. Also worth noting is that the first Famine of 6 m century in AD 536 is
described as a 'failure of bread'.
Overall the type of famine recorded appears to relate to the season it which it
happened. In other words cattle mortality was due to abnormally cold winters while
grain failures were due to growing seasons that were either too dry or too wet.
Winter
If the winter season is examined first then, taken at face value, there is a steady
increase in the number of intense cold winters recorded over the centuries with eight
each in the 9 t h and 10 t h centuries, double the 8 t h though this may be an artefact of the
compilations. For instance there are eight references to weather in AD 536-599 as
compared to five in AD 600-699. A comparison of Irish and European winter
temperature indices is instructive.
Table 7.1 Winter Indices of Ireland, Europe and Easton AD 500-1000
Year 545 554 566 587 588 590 593 635 670 688 695 748 760 762 764 789
IRL -2 -2 -2 -2 -2 -3 -3 -2 -3 -2
EU -3
WE 21 10 21 21 10 21 10
Year 799 811 815 818 819 822 845 853 854 856 860 871 874 881 895 913
IRL -2 -3 -2 -1 -1 -2 -3 -1 -2
EU -1 -3 -3 -3 -3
WE 10 21 21 10 21 21 10
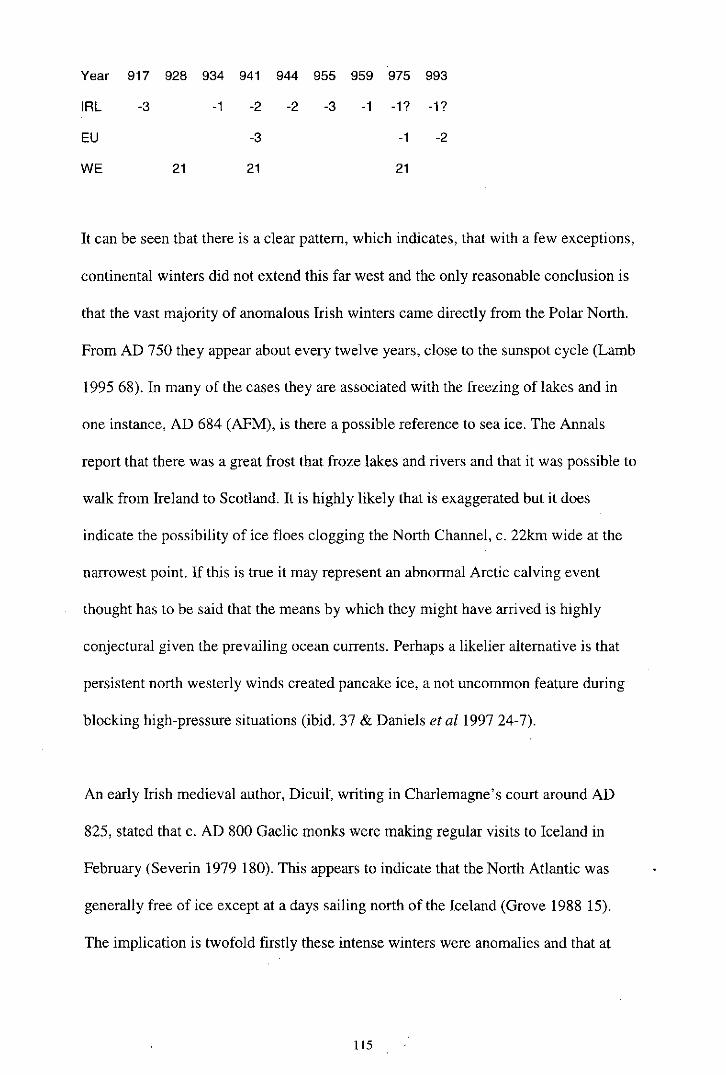
Year 917 928 934 941 944 955 959 975 993
IRL -3 -1 -2 -2 -3 -1 -1? -1?
EU -3 -1 -2
WE 21 21 21
It can be seen that there is a clear pattern, which indicates, that with a few exceptions,
continental winters did not extend this far west and the only reasonable conclusion is
that the vast majority of anomalous Irish winters came directly from the Polar North.
From AD 750 they appear about every twelve years, close to the sunspot cycle (Lamb
1995 68). In many of the cases they are associated with the freezing of lakes and in
one instance, AD 684 (AFM), is there a possible reference to sea ice. The Annals
report that there was a great frost that froze lakes and rivers and that it was possible to
walk from Ireland to Scotland. It is highly likely that is exaggerated but it does
indicate the possibility of ice floes clogging the North Channel, c. 22km wide at the
narrowest point. If this is true it may represent an abnormal Arctic calving event
thought has to be said that the means by which they might have arrived is highly
conjectural given the prevailing ocean currents. Perhaps a likelier alternative is that
persistent north westerly winds created pancake ice, a not uncommon feature during
blocking high-pressure situations (ibid. 37 & Daniels et al 1997 24-7).
An early Irish medieval author, Dicuil, writing in Charlemagne's court around AD
825, stated that c. AD 800 Gaelic monks were making regular visits to Iceland in
February (Severin 1979 180). This appears to indicate that the North Atlantic was
generally free of ice except at a days sailing north of the Iceland (Grove 1988 15).
The implication is twofold firstly these intense winters were anomalies and that at
these time at least the winter climate regime in the NWAR was different to the
Northern European Region.
The impact of these severe winters appeared to have been sometimes catastrophic
with major famines reported in AD 635, 684, 700, 764, 799, and 964. At other times
scarcity was reported though without reported human mortality, winters with recorded
animal mortality are AD 748, 815, 917 (including salmon), 955 and 993. Others only
record scarcity. The majority of these episodes refer to cattle mortality, as they were
vulnerable to severe winter weather. Cattle at this time were completely dependent on
winter grass because haymaking was not practised in Ireland until the late 12 t h century
(Kelly 1998 46-7).
One of the winters that stands out is AD 764, and is described as the 'most
outstanding cold episode in the last 2000 years' (Pfister 1998 541). It is described by
sources in Germany, France and Constantinople where Theophanes the Confessor
reported icebergs on the Bosphorus (Telelis and Chrysos 1992 17-32). Easton's
indices broadly support those devised by EURO-CLIMHIST with the exception of
AD 856 referenced by Easton and the Gaelic Annals but not by EURO-CLIMHIST.
Overall winters probably matched the monastic ideal though blocking polar high-
pressure systems appeared at regular intervals.
Spring
Spring weather is rarely recorded with the exception of the occasional snowfall in AD
780, 855 and 917 the last a continuation of winter. Presumably therefore this season
was benign overall with no impacts on the normal practise of ploughing and sowing in
March (Kelly 1998 230-1).
Summer
There were two types of bad summers from an agricultural viewpoint, these were
when it rained too much or there were droughts. The former is only listed three times
in AD 720, 777 ('a summer like winter') and 801, compared to five of the latter in AD
587-91, 663, 714, 764 and 934. The effects of these are not given; however there are
three references to grain shortages in AD 536, 765 and 899, though no reason is
given, presumably they were failures of the growing season of March to September.
However it has to be noted that seasonally unclassifiable events took place around AD
875-80 and c. AD 975 with laconic statements such as 'very bad weather'. In AD 879
the description of a scarcity of cattle fodder in spring and abundance in autumn could
mean either a cold or wet winter followed by a cold or wet spring and then a normal
summer and autumn. The hagiographies of Gaelic Saints indicate that heavy rain was
a constant hazard and was responsible for many crop-saving miracles (O'Croinin
1995 93).
The drought of AD 748 is of interest as it followed a very severe winter. It appears to
have been a European wide phenomenon as it described as follows: The world was
parched with an unusual drought'. This indicates that there was a continuation of
high-pressure systems for about nine months. This is the first Irish reference to this
type of winter-summer pairing.

Lamb (op. cit.) argued that there were wet periods in Europe c. AD 500-700,
particularly the AD 580s, and around AD 800-900. The implication is that increased
precipitation came from the west but there is no Irish evidence of this one way or
another. The Annals don't specifically refer to any periods of increased precipitation.
It may be significant that this period has a major period of asynchronous behaviour
between Irish and English oaks. There is negative correlation in AD 878-97, no
correlation in AD 898-901, negative correlation AD 902-8 followed by a trend to
positive correlation from AD 916. It therefore appears that Irish oaks are responding
to a different type of summer regime and that the Irish Sea is the boundary between
them. This may be a 'blocking' zone and is discussed in more detail for the AD 1298-
1320 period when there is more information. It is worth adding that while this is the
second longest phase of asynchronous behaviour there are rapid shifts between
positive and negative correlation between c. AD 700-925. The climatic implications
are that, based on the response of oaks, summers of the NWAR went through climatic
phases that were different, and perhaps opposite, from England and mainland Europe
at this time.
Autumn
There are no references that can be identified with this season.
Storms
Twenty nine storms are reported in this period, the first in AD 564. Of these fifteen
are called 'Great winds' or 'Great storms', the other fourteen state that there was
lightning. The former appear to be either gale-force storms associated with low-
pressure systems or hurricanes, and when destruction is mentioned it is limited to
damage to buildings and flooding but not to agriculture. They are scattered randomly
through time at about one every 35 years to AD 875 and one every twenty years
thereafter to AD 1000.
Of the fourteen lightning storms, eleven are in the period AD 767-876. This may
indicate a prevalence of Maritime high-pressure systems at this time. In a few cases
destruction of woods and buildings are mentioned, with Armagh Cathedral mentioned
twice in AD 773 and 995. They could also be spectacular; in AD 772 an assembly of
people conducted a hand clapping ritual 'at which occurred lightning and thunder like
the Day of Judgement', they also fasted against the fear of 'Fire from Heaven'. In fact
some of these lightning storms may be called 'Fires from Heaven'. These weather
rituals were often associated with evil times because lightning was often seen as a
harbinger of plague.
Conclusions
Overall this period appears to have been climatically benign. O'Croinin (1995 108-9)
states:
"... high productivity implied by the substantial rents and food renders, give
an impression of relative prosperity."
He also notes the possibility of over-population in the period before AD 684 as
agricultural land was in short supply. Leaving aside the combined effects of bad
weather, plagues and animal diseases discussed later, the impression is of a settled
society who recovered quickly from the occasional bad year and, though at times, the
shortages were extreme they never lasted longer than a year. In comparison to the rest
of Europe Irish winters were milder and summers dryer if Lamb's opinions (1992
163-6) are correct.
It can be concluded that the climate in NWAR, for the period AD c. 500-1000, can be
called the 'Early Medieval Dry Period'.
'MEDIEVAL WARM PERIOD', AD 1000-1300
The classic description of the 'Medieval Warm Period' (MWP) in Europe comes from
Lamb (1977 435)
. "In most of Europe the warmest period seems to have been between 1150 and
about 1300, though with notable warmth also in the late 900s".
Though he is more circumspect in a later work (1995 171-186) his general
conclusions have not changed radically. His hypothesis has come under critical
review in recent times and has been recently reviewed by Hughes and Diaz (1994
109-142), using a mix of evidence from tree-rings, ice cores, geomorphology and
documentary sources. They conclude that this warm period was neither global nor
synchronous (ibid. 109 & 116). In comparing Europe and Fennoscandia they note that
at this time these areas had higher temperature variations then elsewhere but are
unable to decide whether this reflects reality or is an artifact of the various research
methodologies (ibid. 116 &120). In reviewing Europe they note a range of opinions
and these may be put as follows (ibid. 131):
Lamb (1977)
• European wide warm period AD 900-1300, peaking in AD 1150-1300
Alexandre (1987)
• Europe, north of the Alps, AD 1150-1330 cold winters predominating. Rainfall
AD 1240-1400 higher than AD 1170-1240
• Europe, western, warm springs AD 1220-1310 followed by a sharp decline in the
period AD 1300-1350. High rainfall in the periods AD 1150-1200 and after AD
1310, dry during AD 1200-1310.
Guiot (1988 & 1992)
• 12 t h century cold, AD 1200-1300 temperatures as modern, and AD 1300-1400
modern or slightly less.
Hughes and Diaz (1994)
• Highest temperatures AD 1472-1561 and AD 1202-1321
Oglivie and Farmer (1997 130) argued that there was stable dry weather in western
Europe with a general increase of precipitation during AD 1240-1426 but that
southern England's temperatures declined between AD 1240-1340. They describe the
period as climatologically complex and that the term MWP is not easily defensible.
They also question the temperature seesaw between Greenland and Northern Europe.
Pfister (1998 546-9) argued that, while he agreed with the chronological boundaries
proposed by Lamb, the MWP was restricted to winters (which were not homogenous)
in western central Europe and there was not enough evidence to support the definition
for all seasons in Europe. He also noted Oglivie and Farmer's dismissal of the concept
of the MWP but thought that it should be kept, as there was no other acceptable
alternative definition.
It can be seen that there is yet no consensus though this may be a function of
definition and perspective. For instance taking Alexandre as an example it is not clear
exactly, whether Ireland is north of the Alps or in Western Europe. In general the
above authors delineate the following regions, Mediterranean, Alpine, Western,
Eastern and Fennoscandia. As noted the NWAR does not fit easily into any of the
above regional continental perspectives, which encompass a wide range of latitudes
and longitudes.
Overall however there seems to be a growing continental consensus that in Europe
there is no strong evidence for a ubiquitous Medieval Warm Period c. AD 1000-1250
but high variability and regional variations on a decadal and multidecadal scale. The
one criticism of Hughes and Diaz, and possibly others, is that they did not discuss
famines as a possible proxy indicator of climate. For instance the period AD 1315-20
was a period of intense cold and wet summer weather and is seen as the cause of the
First European Famine (Lamb 1995 195-202). This has obvious implications for some
of the above interpretations, which state that warm temperatures continue until the
AD 1320s.
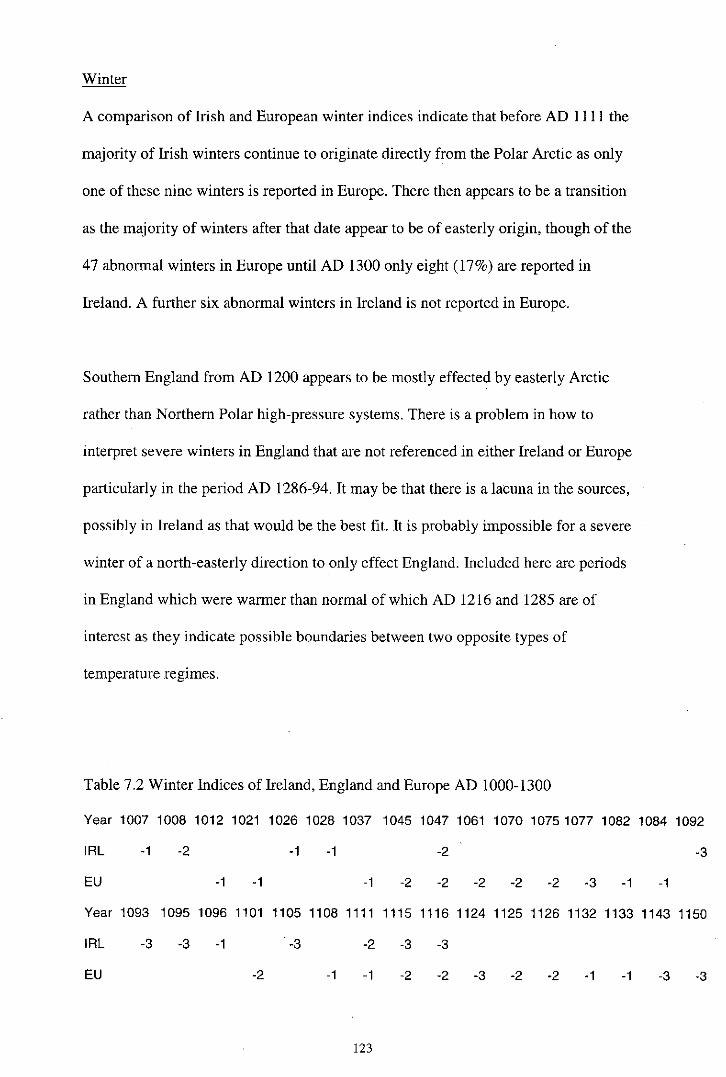
Winter
A comparison of Irish and European winter indices indicate that before AD 1111 the
majority of Irish winters continue to originate directly from the Polar Arctic as only
one of these nine winters is reported in Europe. There then appears to be a transition
as the majority of winters after that date appear to be of easterly origin, though of the
47 abnormal winters in Europe until AD 1300 only eight (17%) are reported in
Ireland. A further six abnormal winters in Ireland is not reported in Europe.
Southern England from AD 1200 appears to be mostly effected by easterly Arctic
rather than Northern Polar high-pressure systems. There is a problem in how to
interpret severe winters in England that are not referenced in either Ireland or Europe
particularly in the period AD 1286-94. It may be that there is a lacuna in the sources,
possibly in Ireland as that would be the best fit. It is probably impossible for a severe
winter of a north-easterly direction to only effect England. Included here are periods
in England which were warmer than normal of which AD 1216 and 1285 are of
interest as they indicate possible boundaries between two opposite types of
temperature regimes.
Table 7.2 Winter Indices of Ireland, England and Europe AD 1000-1300
Year 1007 1008 1012 1021 1026 1028 1037 1045 1047 1061 1070 1075 1077 1082 1084 1092
IRL -1 -2 -1 -1 -2 -3
EU -1 -1 -1 -2 -2 -2 -2 -2 -3 -1 -1
Year 1093 1095 1096 1101 1105 1108 1111 1115 1116 1124 1125 1126 1132 1133 1143 1150
IRL -3 -3 -1 -3 -2 -3 -3
EU -2 -1 -1 -2 -2 -3 -2 -2 -1 -1 -3 -3
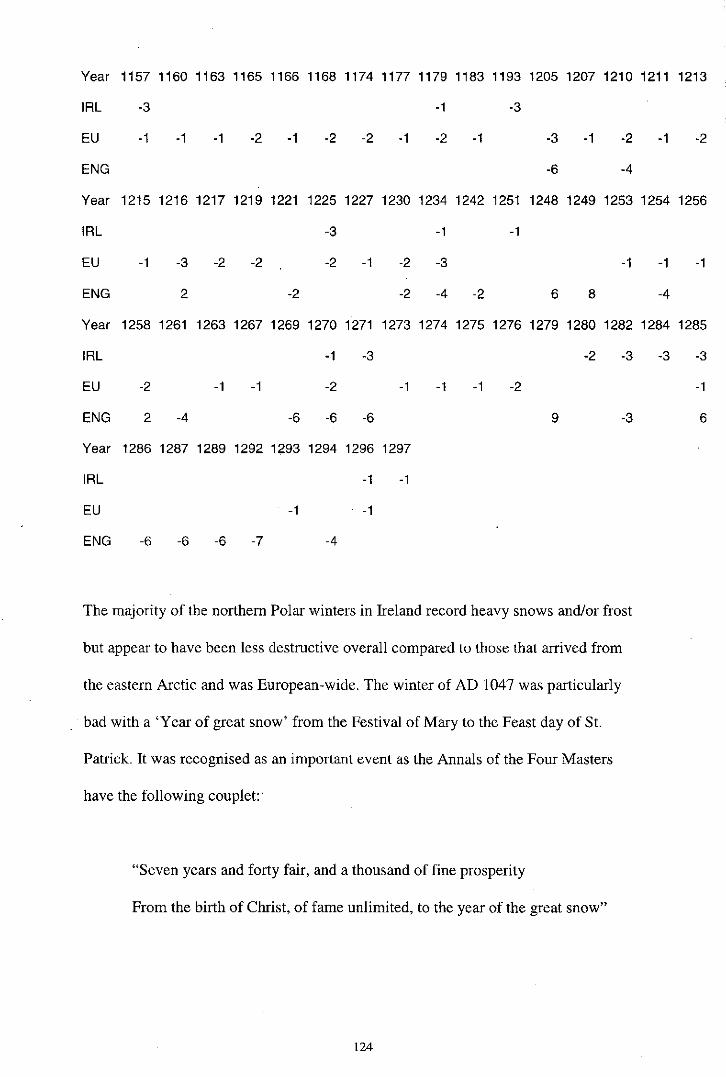
Year 1157 1160 1163 1165 1166 1168 1174 1177 1179 1183 1193 1205 1207 1210 1211 1213
IRL -3 -1 -3
EU -1 -1 -1 -2 -1 -2 -2 -1 -2 -1 -3 -1 -2 -1 -2
ENG -6 -4
Year 1215 1216 1217 1219 1221 1225 1227 1230 1234 1242 1251 1248 1249 1253 1254 1256
IRL -3 -1 -1
EU -1 -3 -2 -2 -2 -1 -2 -3 -1 -1 -1
ENG 2 -2 -2 -4 -2 6 8 -4
Year 1258 1261 1263 1267 1269 1270 1271 1273 1274 1275 1276 1279 1280 1282 1284 1285
IRL -1 -3 -2 -3 -3 -3
EU -2 -1 -1 -2 -1 -1 -1 -2 -1
ENG 2 -4 -6 -6 -6 9 -3 6
Year 1286 1287 1289 1292 1293 1294 1296 1297
IRL -1 -1
EU -1 -1
ENG -6 -6 -6 -7 -4
The majority of the northern Polar winters in Ireland record heavy snows and/or frost . |
but appear to have been less destructive overall compared to those that arrived from •
the eastern Arctic and was European-wide. The winter of AD 1047 was particularly
bad with a 'Year of great snow' from the Festival of Mary to the Feast day of St.
Patrick. It was recognised as an important event as the Annals of the Four Masters I'
have the following couplet: i i-
"Seven years and forty fair, and a thousand of fine prosperity
From the birth of Christ, of fame unlimited, to the year of the great snow"
While it is impossible to say whether the couplet is tinged with Golden Age nostalgia
or based on empirical evidence is difficult to say, the event is recognised as
significant. It caused a forced migration of the northern population of Ulaid (Ulster) to
Leinster, even though they were traditional enemies. Given the fact that this snow
caused mortality of cattle, birds, wild animals and sea life the implication is that this
winter was northern in origin and then moved eastwards declining in intensity. The
reference to sea-life mortality is the only one recorded in the period under review
indicating a possible reversal of the North Atlantic Current, a taste, perhaps, of the
climate during the Younger Dryas. This winter inaugurated the series of famines
caused by downturns longer than one season and one year, the AD 1047 famine lasted
till at least AD 1051. In contrast the rest of Europe only suffered excessive snows
without major effect (Pfister 1998 542).
The winter of AD 1157 may have followed a similar track from the Polar North, as
the mainland was milder. Whether the same could be said about AD 1225 is difficult
to judge as war and fever were reported as well, particularly in Connaught, where
there was a major power struggle between the Anglo Normans and the recently
deposed High King of Ireland. The winters of AD 1092-5 also had serious effects
with human and animal mortality referenced in most of the annals, but these appear to
have had a minimal impact on the rest of Europe.
Likewise AD 1115 and 1116 were very serious in Ireland. In the first instance
extreme bad weather was recorded from the end of December 1114 to February the
following year. This resulted in a great scarcity of food with the deaths of men,
animals and birds. This caused a Spring Famine and it was reported that 'man ate
man' and that children were sold for food. In the following year frost, snow and
boisterous weather were reported in most annals causing the death of men, cattle and
birds with a famine, mostly in Leinster, and forced migration throughout Ireland and
overseas. It was certainly as serious as AD 1047-51 but somewhat mitigated by an
excellent harvest in AD 1156. In Europe it is still an open question whether this was
one episode or two but is not seen as particularly extreme (ibid. 543).
In contrast the winter of AD 1077 was a major event in terms of its length and
extreme severity in Europe and is recorded in more than 35 independent sources. The
explanation is that a period of Polar maritime air was followed by a phase of dry
Arctic air and intensified north of the Alps due to a combination of dryness and a
snow covered landscape. This led to positive feedback, which intensified the
development of the anti-cyclone. These are now known as a cyclonic bora (ibid. 542).
In Ireland a great scarcity in AD 1076 and 1077 is recorded but no cause is given. It is
worth adding that this is not a duplication as the in the latter year it states that the
scarcity continues.
The winters of AD 1150 and AD 1234 were two other major European events that had
a minimal effect in Ireland, in the latter case only a great frost was recorded and the
former is not mentioned at all in Ireland. This may have implications for the
hypothesis that the latter winter is analogous to the Great Winter of AD 1675, which
occurred during the Late Maunder Minimum. Sun spot cycles and solar radiation are
seen as a possible causes (ibid. 544). However it is still unclear whether sun spot
cycles reduce or redistribute solar radiation (Pfister et al 1994 289).
There is a gap in severe winters lasting more than one season from AD 1118 until
about AD 1270 when there is a definite deterioration in climate. There was a famine
from unspecified causes in AD 1268 and was followed by two bad winters in AD
1270 and 1271. More extreme winters followed in AD 1280-1284 and AD 1294-7
Spring
The only two references that can be specifically related to this season are the
continuation of snow to Easter in AD 1008 and the very bad year of AD 1117. This
latter year followed the extremely bad winters of the previous two years. Heavy rains
from Candlemas to August destroyed crops and 'caused a hunger so widespread' that
settlements were deserted and destruction in Ireland and Europe was 'staggering'.
Summer
Summer weather is difficult to reconstruct but on the basis of lack of many abnormal
events it therefore must have been normal to the contemporary observer. Droughts
were rare and are mentioned in AD 1095, 1129, 1252, and 1262. The first is noted in
Chronicum Scotorum as the third year of heat but it is only in the last year that human
mortality is mentioned.
The AD 1252 drought was stated to have scorched trees and that harvesting was over
by mid-July, two months earlier than normal, and though this should not be taken
literally, it indicates crops had ripened early. Lamb's indices have a warm period for
the months, March, April, May, July and August at +2 per month in AD 1252 but AD
1262 has no reference at all.
In England the years AD 1236, 1241, 1242 and 1288 stand out as being very wet. In
Ireland the only one referenced is in AD 1236 when great rains caused a famine.
Autumn
As before AD 1000 there are no references that can be taken to be specific to the
season.
Storms
The period to AD 1100 do not appear to be very stormy though the frequency
increases in AD 1100-50 and there is an appearance of cycles in AD 1187-90, 1218-
24 and around AD 1250. Only ten lightning storms are mentioned and these appear to
be uncommon.
Conclusions
The main features of the period are the following.
• AD 1000-1299, 7-9 events of heavy snows and intense frosts per century, for the
period AD 1200-1299, seven are after AD 1270. From AD 1047 periods of bad
weather could last longer than one season or year. Major famine periods are AD
1047-51, 1115-17, and 1280-1297, with minor episodes in AD 1011-12, 1157-58,
1224-5 and 1270-1
• Droughts, 3-4 events per century AD 1000-1199 and two AD 1200-1299
• Windstorms, around ten events each for the period AD 1100-1299, though most
relate to destruction and death in specific localities. This is double the number of
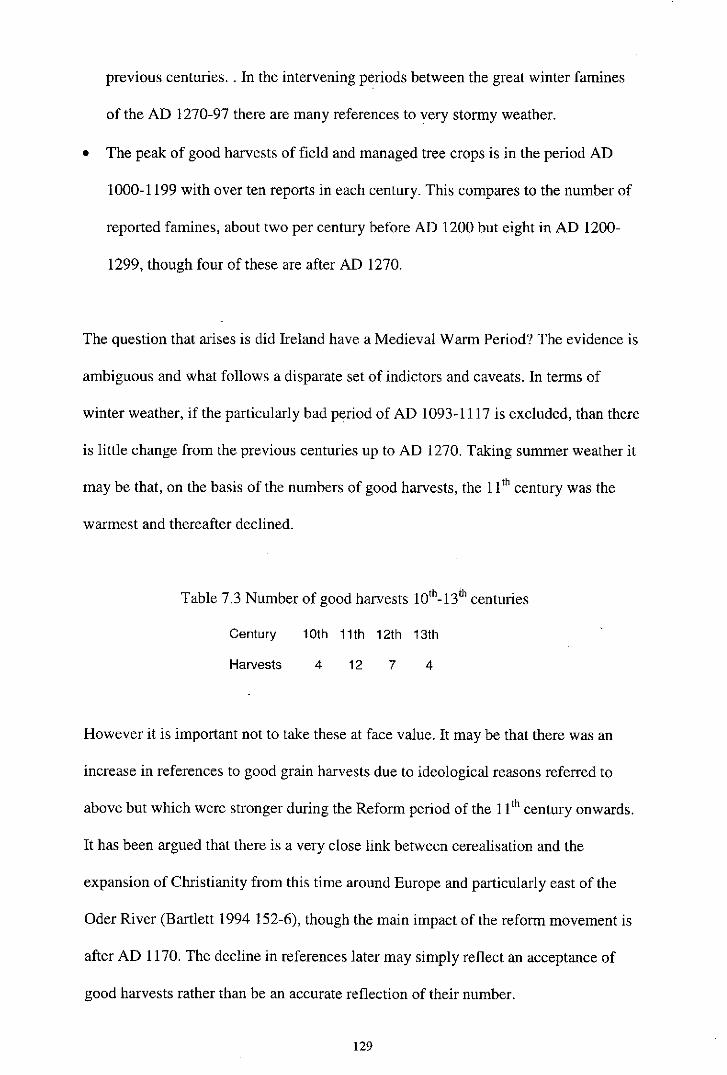
previous centuries. . In the intervening periods between the great winter famines
of the AD 1270-97 there are many references to very stormy weather.
• The peak of good harvests of field and managed tree crops is in the period AD
1000-1199 with over ten reports in each century. This compares to the number of
reported famines, about two per century before AD 1200 but eight in AD 1200-
1299, though four of these are after AD 1270.
The question that arises is did Ireland have a Medieval Warm Period? The evidence is
ambiguous and what follows a disparate set of indictors and caveats. In terms of
winter weather, if the particularly bad period of AD 1093-1117 is excluded, than there
is little change from the previous centuries up to AD 1270. Taking summer weather it
may be that, on the basis of the numbers of good harvests, the 11 t h century was the
warmest and thereafter declined.
Table 7.3 Number of good harvests 10 t h -13 & centuries
Century 10th 11th 12th 13th
Harvests 4 12 7 4
However it is important not to take these at face value. It may be that there was an
increase in references to good grain harvests due to ideological reasons referred to
above but which were stronger during the Reform period of the 11 t h century onwards.
It has been argued that there is a very close link between cerealisation and the
expansion of Christianity from this time around Europe and particularly east of the
Oder River (Bartlett 1994 152-6), though the main impact of the reform movement is
after AD 1170. The decline in references later may simply reflect an acceptance of
good harvests rather than be an accurate reflection of their number.
There are a couple of references to viticulture in Co. Wexford in the early 13 century
(Terry Barry pers. comm.). This corner of the island is the most likely to have had the
required summer temperatures but it does not indicate an increase in temperatures as
it is likely that viticulture was imported by Continental Orders c. AD 1200. Lamb
(1995 195) notes that many new vineyards were started at this time in England. He
argues that this indicates average summer temperatures 0.7-1.0°C warmer than the
current averages and 1.0-1.4°C warmer than central Europe (Lamb 1995 179-80).
Viticulture has been attempted, without any great success, in this area in the 1920s.
The only contemporary commentator, Geraldus Cambrensis, writing in the early
1180s had this to say:
"For this country more than others suffers from storms of wind and rain...
What is born and comes forth in the spring and is nourished in the summer and
advanced can scarcely be reaped in the harvest because of unceasing rain."
While his political and cultural biases are viewed with a certain amount of suspicion
this comment may not be inaccurate as he was brought up on the other side of the
Irish sea and would have been familiar with the climate of the region. It is therefore
possible that summers were wetter than first appears. The Annals indicate that very
severe storms came about every ten years and if this is compared with the above
quotation then it appears that there were large variations between oceanic and
continental weather systems. There may also have been instability at the boundaries
of climatic system as they shifted seasonally, annually and over longer time periods.
There is strong evidence in Great Britain and Norway of expansion of tillage to
greater altitudes in this period (Lamb 1995 177-9). Unfortunately the same has not
been found in Ireland and this is probably due to a number of factors; Irish altitudes
were more exposed and less fertile, the popularity of transhumance, and the expansion
of ridge and furrow potato crops before AD 1845. As a general point it is extremely
difficult to assess climatic change through agriculture at this time because of the
major cultural changes brought about by the absorption of the island into the English
Kingship. Overall we are not able to compare like with like.
Having taken the various caveats into account it is possible that the summers did
improve in the 11 t h century though in the following two centuries there was higher
variations in temperature and precipitation over all seasons. The cycle of bad years of
AD 1047-51 and 1095-1117 are the first of their type and may indicate a shift in
winter variability. There were also increases in storminess from the 11 t h century and a
shift of abnormal winters of Arctic origin. Overall this cannot be classified as a MWP
for the NWAR but if the AD 1270-97 is included it may be more accurate to call it the
'Medieval Transition' because there is an increase in climate variability. It may reflect
a time of transition between the benign climate before AD 1040 and the major shift to
a lull after AD 1310. There is not yet enough evidence to say that that this is a
definable climatic period in Ireland.
CLIMATIC DECLINE, AD 1270-1600
The climatic decline can be dated to between AD 1270-1310 when there was a
complete change in climatic characteristics. From AD 1310 and perhaps from as early
as AD 1298, the growing season became cooler and wetter and winters milder. This
section will be divided into AD 1270-1499 and AD 1500-1600 not because there was
any significant change at this point but is the dividing line between the published
indices of EURO-CLIMHIST. The latter two decades of the 16 t h century are then
discussed as the point where changes in the temperature regime indicate the onset of
the colder winters diagnostic of the 'Little Ice Age'.
The 13 t h century in Europe is seen as a period of climatic deterioration. Lamb (1995
191-4) argues that increased storminess can be dated from the middle of the century in
coastal north-west Europe and that from AD 1300 precipitation increased markedly
particularly in the summer with an all year round decline in temperature of about 1°C
(ibid. 84-5 & 195-9). There is perhaps some contradictory evidence in Ireland, as it
appears that AD 1000-1300 was a time of dune stability (McClenahan 1997) though
this may be due to temporal resolution. There was also a short period of glacial
advance in the Alps around 1300 (Grove 1988 354).
Detailed analysis of winters by Pfister (1996 100-2) of central and western Europe,
but excluding Ireland, northern England, Scotland, Denmark and Fennoscandia,
concluded that there was no clear trend in 14 t h century winter temperatures and
identified four different time sub-periods. However he believed it was reasonable to
argue that the shift from the 'Medieval warm epoch' the 'long' Little Ice Age took
place at the beginning of the 14th century. However the onset of major glaciation in
Iceland, Scandinavia and the Alpine region is dated to c. AD 1570-1600 (Grove 1989
18, 107, 113 & 167). A comparison of the number of references to winter in Central
Europe shows that they almost doubled from 27 in the 13 t h century (average indices
1.56) to 47 in the 14 t h (average indices 1.70).
There is little agreement as to the nature and extent of the Little Ice Age. The
arguments presented in European climatic literature argue contradictorily that it exists
or it doesn't, i.e. it is a katathermal. Those researchers who favour the former argue
than it begins anytime between AD 1250 and 1600. Those that argue for an early date
appear to assume that that climatic decline of the AD 1270s predicates the further
i t .
decline of the late 16 century.
There is problem with an early date from the NWAR perspective, The evidence for
Ireland suggests that there are not that many climatic similarities before and after AD
1600. The second is that the term 'Little Ice Age' is a central European definition that
is determined by glaciation and temperature, whereas in the NWAR the main
determinant for the period c. AD 1270-1590 is precipitation. There is no evidence of
long-term cold temperatures and almost none of snow/ice with the exception of
periglacial sollifluction in Gleann na Sneachta (Glen of the snow), Co. Kerry (P.
Coxon, unpublished research) and occasional references in the Annals.
Jones and Bradley (1992 658-660), concluded that there is 'considerable uncertainty'
about the timing and characteristics of the 'Little Ice Age' and note that the main
problem is that there is no standard definition and without this it is impossible to
explain the nature and timing of the period. Surveying the global evidence, presented
in the compilation they edited, they concluded that there has not been a monotonously
cold period over the last 500 years, but geographical variability in the intensity and
timing of temperature on an annual and seasonal basis. They, however, do not offer
any definition and only recommend that the term 'Little Ice Age' be used cautiously.
Winter
As mentioned in the previous chapter there was a major decline in the weather in
Ireland from AD 1270. This can be seen in the sudden increase of entries that relate to
snow, frost and wind storms. However as the following table indicates, such winter
systems largely disappeared until the late AD 1580s with the exception of AD 1335-9
and AD 1434-5 and a few outliers. This is in marked contrast to the rest of Europe
where winter systems steadily got colder and there was a resurgence of glaciers in
Europe. The following chart shows Irish and European indices to AD 1300-1399,
there are no published indices for Europe between AD 1400-1500.
Table 8.1 Winter indices of Ireland, England and Europe
Year 1303 1305 1306 1308 1309 1310 1311 1314 1315 1317 1318 1319 1322 1323 1325 1326
IRL -1
EU -2 -1 -3 -2 -1 -1 -2 -2 -2 -3 -2 -3 -1 -3
ENG -4 -7 -3 -6 -4 -6 -3 -6
Year 1328 1330 1333 1335 1336 1338 1339 1340 1342 1349 1351 1352 1353 1354 1355 1359
IRL -2 -2
EU -2 -2 -2 -1 -2 -1 -1 -1 -1 -3 -2
ENG -6 -6 -9 -8 -6 -2 -6 -6 -8
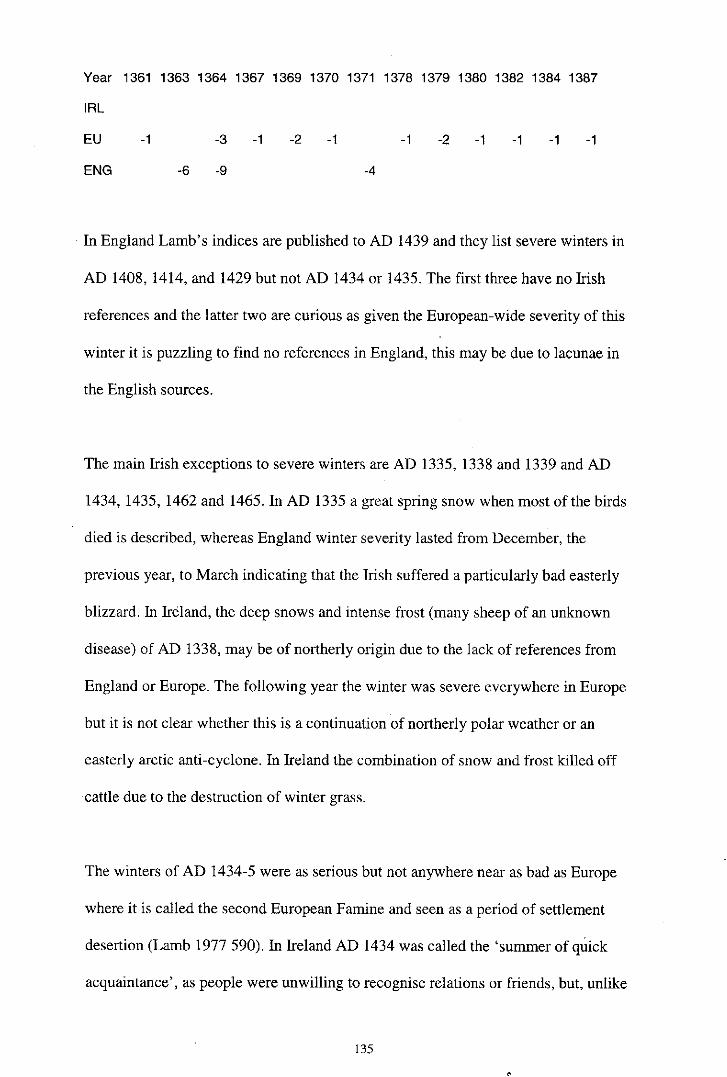
Year 1361 1363 1364 1367 1369 1370 1371 1378 1379 1380 1382 1384 1387
IRL
EU -1 -3 -1 -2 -1 -1 -2 -1 -1 -1 -1
ENG -6 -9 -4
In England Lamb's indices are published to AD 1439 and they list severe winters in
AD 1408, 1414, and 1429 but not AD 1434 or 1435. The first three have no Irish
references and the latter two are curious as given the European-wide severity of this
winter it is puzzling to find no references in England, this may be due to lacunae in
the English sources.
The main Irish exceptions to severe winters are AD 1335, 1338 and 1339 and AD
1434, 1435, 1462 and 1465. In AD 1335 a great spring snow when most of the birds
died is described, whereas England winter severity lasted from December, the
previous year, to March indicating that the Irish suffered a particularly bad easterly
blizzard. In Ireland, the deep snows and intense frost (many sheep of an unknown
disease) of AD 1338, may be of northerly origin due to the lack of references from
England or Europe. The following year the winter was severe everywhere in Europe
but it is not clear whether this is a continuation of northerly polar weather or an
easterly arctic anti-cyclone. In Ireland the combination of snow and frost killed off
cattle due to the destruction of winter grass.
The winters of AD 1434-5 were as serious but not anywhere near as bad as Europe
where it is called the second European Famine and seen as a period of settlement
desertion (Lamb 1977 590). In Ireland AD 1434 was called the 'summer of quick
acquaintance', as people were unwilling to recognise relations or friends, but, unlike
Europe, there is no evidence of settlement desertion. In AD 1462 a great frost is
recorded from the beginning of the year to the middle of February. AD 1465 was
more serious with a great snow and frost that froze the ground and prevented spring
growth until the middle of May. The resulting delay in ploughing caused a famine.
With the exception of these episodes there is the almost complete disappearance of
severe abnormal winters for nearly 200 years until the AD 1580
Spring, Summer and Autumn
As has been noted the climate went through a major downturn from AD 1310 that
affected the main growing season starting with a 'hard spring' of that year. The
following years, until about AD 1320, were disastrous in Ireland with major cattle and
grain shortages. Cattle murrains caused by damp weather were common and were
conducive to human mortality. This period is known as the first European Famine but
unlike the rest of Europe there is not the same type of settlement desertion. In Ireland
there was a transition from arable to pastoral farming by Gaelic farmers who took
over lands abandoned by Anglo-Norman settlers (Barry 1988 350-4). However a
contributing factor is the unstable political situation caused by the Gaelic Resurgence
and the Bruce invasion of AD 1315-8. The latter was responsible for considerable
destruction of crops and farmland in Ulster and northern Leinster until the Battle of
Faughert in AD 1318. It is likely that the grain shortages of this period were as much
a function of warfare as of heavy rainfall. Grain shortages were a fact of life up the
AD 1330s, for example, in AD 1331, stranded whales in Dublin Bay are recorded as
easing a famine amongst the citizenry.
In AD 1326 and 1333 there are the first references to a good summers and autumns
with successful early harvests and the climate appears to have been fairly benign,
though wet, until the AD 1390s. The Gaelic and Anglo-Norman sources present a
sorry picture of climatically induced famines for the next 100 years. These in brief
are:
• AD 1397. Summer and autumn windy wet and cold
• AD 1410. Scarcity of corn and a great famine
• AD 1443-50. This period had extremely bad springs, summers and autumns with
a combination of cool temperatures, continuous rains and torrential storms that
caused cattle mortality, grain shortages and famines. AD 1450 is called a
'warlick' year, this word may be the old dialect word 'warlock' which stands for
cruciferous weeds indicating a survival diet for the starving.
• AD 1462. 'The worst spring and summer in a long time'.
• AD 1478. 'A hard niggardly year'.
• AD 1488-97. Another bad period of continuous rains and stormy weather in AD
1488, 1491, 1496 and 1497. AD 1491 was called the 'Dismal year' and in AD
1497 there is a possible reference to cannibalism, the first reported since AD
1315-8.
Droughts are rare and only one is reported in AD 1419. It appears to have been very
serious as it was described as a 'living fire in the earth', while crops suffered, wild
trees and bushes produced a major crop. Clement summers are equally infrequent and
are reported only in AD 1333 and 1471
In comparison, Lamb's index for Southern England to 1439, show the following
periods with dry summers: AD 1297-1313, 1325-1388, and 1407-24, particularly in
June and July. Periods that were wetter than normal were AD 1314-16 and 1399-
1404. Springs tended to be the harbinger of summer in that they were similar.
However Augusts and autumns tended to be wet in most years. It therefore appears
that Southern England and Ireland experienced two very different summer regimes.
Storms
Stormy weather continued from the previous period but to be cyclic with episodes
around AD 1310, 1360 and a long period from AD 1470-1528. These are primarily
storms though hailstorms are listed in AD 1470 and 1471 and lightning-storms in AD
1306, 1308, 1330, and 1487. As in earlier periods they are mostly related to
destruction so it is unclear whether the above are representative or not.
AD 1500-1600
This century is dealt with separately as comparative published indices covering all
seasons can be used. However the downside is that there is a decline in the Gaelic
sources so the quantity and quality of information is reduced and has to be
complemented by available English authors writing about Ireland.
In Europe warm summers appear to have begun earlier and lasted for a longer period,
AD 1461-1561 (Hughes & Diaz 1994 122) with a peak in England in the AD 1520s
(Lamb 1995 84). However there was, according to Pfister (quoted in Lamb 1995 213)
a decline in winter temperatures in the Alpine area from the AD 1540s though the
period AD 1530-60 was otherwise similar to the 20 t h century climatic optimum

(Pfister 1992 135). This does not appear to have had an impact in Ireland until the AD
1590s and even then was not as severe as Scotland, which had seven famines during
this decade (Lamb 1995 221).
Winter
A comparison of German (Glaser et al 1999 184) and Irish winter temperature indices
indicates that Irish winters remained mild until about 1588 when snows returned with
cold temperatures lasting until spring. Southern English winters are of the same origin
as central Europe, and those that are not referenced in either England or Europe are
probably European or Scandinavian in origin, as severe winters are not a feature in
Ireland for this period. The last decade is poorly recorded but other historical sources
indicate a deterioration of winter temperatures particularly in mountainous areas. It is
likely that this season is under reported. No famines are recorded but there does
appear to have been a decline in agricultural output in marginal areas. The first 17 t h
century reference to famine comes in 1600 due to a combination of a 'great frost and
tempestuous weather' (Crawford 1989 9). Overall winter climate was predominantly
western, with the exception of AD 1541, which continued into spring.
Table 8.2 Winter indices of Ireland and Germany
Year 1502 1503 1504 1508 1509 1511 1512 1513 1514 1517 1522 1525 1526 1529 1534 1535
IRL
GY -2 -3 -2 -2 -2 -3 -2 -2 -3 -3 -2 -2 -1 -2 -3 -1
Year 1536 1537 1541 1543 1544 1546 1548 1550 1554 1557 1561 1563 1564 1565 1569 1571
IRL -3
GY -2 -1 -2 -2 -2 -2 -2 -2 -1 -1 -3 -1 -1 -3 -3 -3
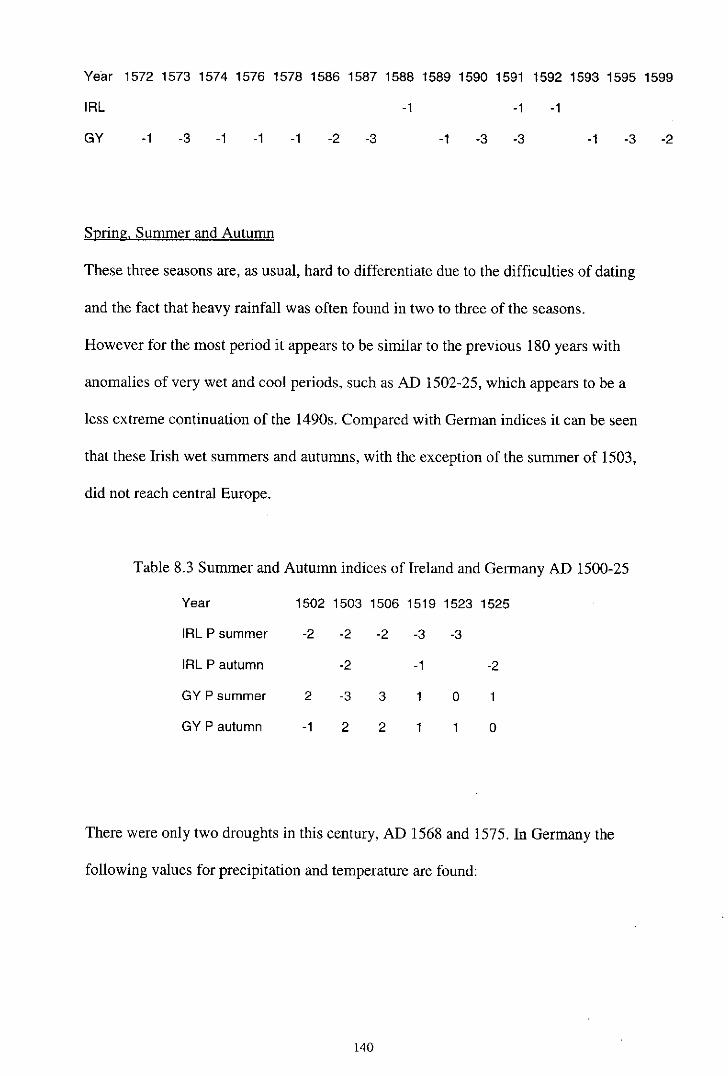
Year 1572 1573 1574 1576 1578 1586 1587 1588 1589 1590 1591 1592 1593 1595 1599
IRL -1 -1 -1
GY -1 -3 -1 -1 -1 -2 -3 -1 -3 -3 -1 -3 -2
Spring, Summer and Autumn
These three seasons are, as usual, hard to differentiate due to the difficulties of dating
and the fact that heavy rainfall was often found in two to three of the seasons.
However for the most period it appears to be similar to the previous 180 years with
anomalies of very wet and cool periods, such as AD 1502-25, which appears to be a
less extreme continuation of the 1490s. Compared with German indices it can be seen
that these Irish wet summers and autumns, with the exception of the summer of 1503,
did not reach central Europe.
Table 8.3 Summer and Autumn indices of Ireland and Germany AD 1500-25
Year 1502 1503 1506 1519 1523 1525
IRL P summer -2 -2 -2 -3 -3
IRL P autumn -2 -1 -2
GY P summer 2 -3 3 1 0 1
GY P autumn -1 2 2 1 1 0
There were only two droughts in this century, AD 1568 and 1575. In Germany the
following values for precipitation and temperature are found:
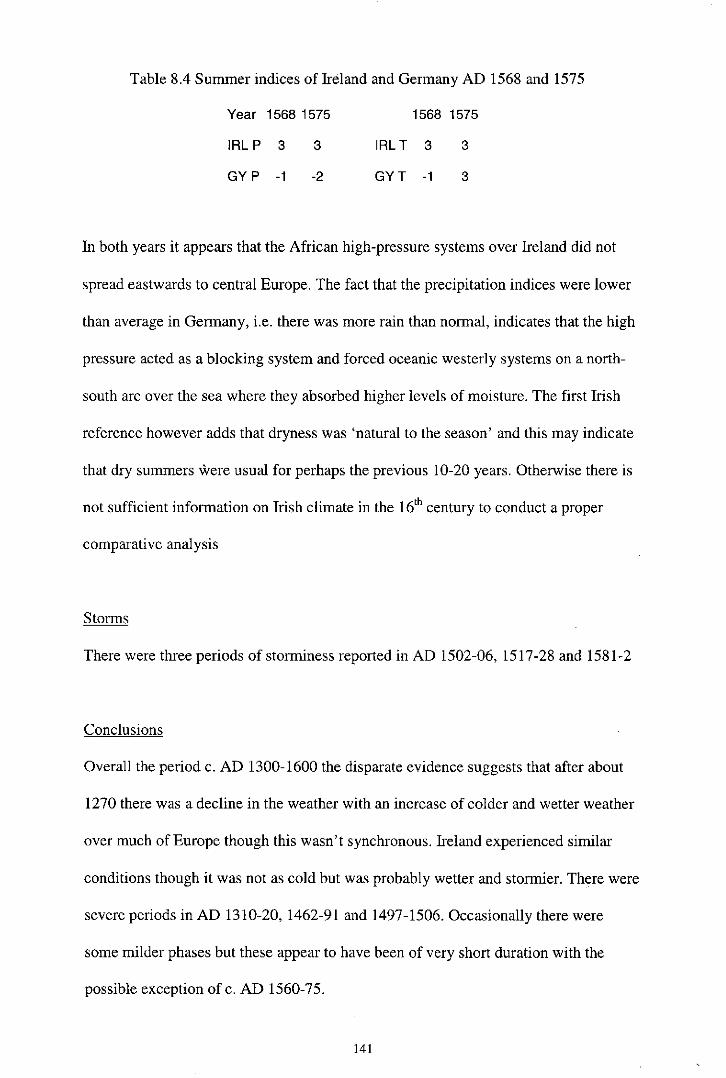
Table 8.4 Summer indices of Ireland and Germany AD 1568 and 1575
Year 1568 1575 1568 1575
IRLP 3 3 IRLT 3 3
GYP -1 -2 GYT -1 3
In both years it appears that the African high-pressure systems over Ireland did not
spread eastwards to central Europe. The fact that the precipitation indices were lower
than average in Germany, i.e. there was more rain than normal, indicates that the high
pressure acted as a blocking system and forced oceanic westerly systems on a north-
south arc over the sea where they absorbed higher levels of moisture. The first Irish
reference however adds that dryness was 'natural to the season' and this may indicate
that dry summers were usual for perhaps the previous 10-20 years. Otherwise there is
not sufficient information on Irish climate in the 16 t h century to conduct a proper
comparative analysis
Storms
There were three periods of storminess reported in AD 1502-06, 1517-28 and 1581-2
Conclusions
Overall the period c. AD 1300-1600 the disparate evidence suggests that after about
1270 there was a decline in the weather with an increase of colder and wetter weather
over much of Europe though this wasn't synchronous. Ireland experienced similar
conditions though it was not as cold but was probably wetter and stormier. There were
severe periods in AD 1310-20, 1462-91 and 1497-1506. Occasionally there were
some milder phases but these appear to have been of very short duration with the
possible exception of c. AD 1560-75.
The evidence for Ireland indicates that there was a major transition of climatic
characteristics between AD 1297-1310. The first major trend was the disappearance
of blocking winter anti-cyclones and the second was the decline in temperatures and
increase of precipitation in the other three seasons accompanied by an increase of
tempestuous stormy weather.
There is a possible correlation between the asynchronous tree-ring widths of AD
1308-24 in Ireland, England and the rest of Europe and the documentary sources. The
decline does coincide with the change to cooler and wetter weather in Ireland but it
remains to be seen whether this is diagnostic given the fact that a similar climatic
decline happened in the rest of Europe. Further detailed comparative analysis needs to
be done between the EURO-CLIMHIST indices for the summer season and Lamb's
indices with Irish and European tree-ring widths.
A possible explanation is that from AD 1270 there was the build up of climatic
change, as measured by increasing atmospheric turbulence, that lasted until AD 1294-
7, which triggered a sudden climatic shift. The change is obvious in Ireland as the
climate changed to cooler wetter conditions with the disappearance of regular high
pressure blocking systems. The weather in AD 1294-97 was extremely bad and is
referenced in all the Annals as lasting three years. Glyn, in AD 1294, adds that
"On the festival of the Blessed Virgin Mary there was lightening and meteors
destroying the blades of corn, whence proceeded very great scarcity, by which
many perished of famine " (Crawford 1989 5)
This is the only set of Annals that note such a specific cause and by itself appears
unverifiable. However in China, AD 1295, there are reports of fireballs the size of
houses, and the following year there was an extraterrestrial impact in Russia and
major forest fires among Sequoias in California in AD 1297 (Baillie 1999 23). It is
possible that the planet passed through a meteorite dust cloud in the AD 1290s. It may
be that a bombardment acted as a trigger, catalyst or was a significant cause in the
climatic shift, since its arrival would have intensified the natural cycle of climatic
change. If it can be taken that Atmospheric turbulence is a measure of the
'competition' between the forces for change and inertia in the climatic systems, then
inertia was possibly more powerful before AD 1294. Perhaps they are related on a
deeper level that has not yet been considered.
The tree-rings tell a slightly different story. From the asynchronous behavior
previously noted it is possible that there was a climatic boundary down the Irish Sea
that divided Ireland from England and the rest of Europe between AD 1298-1324. At
this time Irish oak responses were completely the converse to the rest of Europe
except for the period AD 1312-20 where there is no relationship at all (though this
may be an artefact of the trend of change). The closest analogy is of a blocking high
to the west of Ireland with an eastern boundary through the Irish Sea. This mirrors the
location of atmospheric blocking systems but have they last longer.
It may be that the climatic shift moved from west to east and that for the Irish trees
responded first in AD 1307, followed by England (Sheffield is slightly ahead of
London here) in AD 1320 and the rest of Europe in AD 1325. Or it could be the
opposite direction. If this were the case than it would appear that there was a response
lag across Europe, perhaps similar to the lags seen in the extreme variance curves of
tree-ring widths (pp. 76-7). The period AD 1312-20, where there is no correlation,
may indicate chaos in the response of oaks to the climatic shift. The logic would
therefore be that change was not instantaneous as it takes a few years to completely
change the global atmospheric system. There are also possible geographical variations
in climatic inertia that needs to be considered.
It is worth noting the coincidence of dates between the end of the AD 1294-7 famine
and the beginning of asynchronous behaviour in AD 1298; and the AD 1312-20
period, the height of the European Famine. It is however not possible to explain the
reason behind the different responses between Ireland and the rest of Europe since
climate, as we perceive it, suggests that change was roughly synchronous. Oaks
responses provide a different perspective to this climatic shift. However because we
have no real idea why oaks behave as they do we have no way of explaining why
there are two different responses.
It is also worth noting that there were major environmental changes in the early 14 t h
century, though more in China and East Asia than in Europe. This is believed to have
triggered the latest plague, the Black Death, which lasted until the late 15 t h century
though with some later outliers. On the basis of this outbreak and the previous wave
500 BC-AD 550 it is possible to hypothosise that initial plaque outbreaks are
climatically related. They tend to flourish during climatic periods, which in Ireland is
represented by cool, wet and stormy conditions, i.e. the Iron Age and Medieval lulls.
It is difficult to make definitive comparisons for the rest of the period but in general it
appears, at times, to have been significantly different from England and Europe where
Ireland suffered and over abundance of precipitation Europe suffered from declining
temperatures. Irish Summers were much cooler though the two 16 t h century droughts
are odd since they were not noted in Europe.
In conclusion the period AD 1310-1590 is analogous to the Iron Age lull of 500 BC to
AD 300 and for this reason the NWAR could be defined as experiencing a 'Medieval
Lull'. After c. AD 1590 the deterioration in winter temperatures suggests that the
katathermal called the 'Little Ice Age' began in Ireland. However it has not been
successfully established whether this is a culmination of the previous three hundred
years of climatic processes or the result of a completely different set of environmental
and climatic conditions.
Conclusions, Discussion and Recommendations
The aim of the dissertation was to reconstruct climate in medieval Ireland using
documentary and dendrochronological data. This has been successful subject to the
limitations of the data and methodologies. The findings offer new perspectives on
climate in Ireland, in relation to Europe in particular. What follows are the main
conclusions, a discussion that relates climate to Irish history, and the main
recommendations for future research into a hitherto unexplored subject.
Conclusions
Climate
The weather over the last 2,000 years has gone through cycles of warm/cold and
wet/dry. These are not invariable and it appears that various types of solar, climatic
and environmental cycles are active at any one time. Grove (1988 307), for instance,
argues that glacial advances are at 1,000-1,500 year intervals and this appears to be
one of the medium term cycles but they are intermixed with a variety of short and
long term cycles such as sun spot activity (Lamb 1995 p. 69). Within the North
Atlantic setting there are two added effects. The first is that increased moisture in the
atmosphere causes greater turbulence through the injection of energy, and the second
are the extreme values in the atmosphere as measured by the North Atlantic
Oscillation, which creates greater climatic stress between the two 'poles' of Iceland
and the Azores. Also worth noting is the impact of terrestrial and extra-terrestrial
catastrophic events.
In Europe, the first part of the first millennium AD appears to have been poor up to
around the end of the 4 t h century and is associated with the Iron Age Lull of most of
the sub continent. There was a gradual improvement with a peak c. AD 1100-1200 but
was followed by a decline to wetter weather and cooler temperatures. Colder
conditions set in the latter part of the 16 t h century.
Ireland tends to follow this pattern but there are some significant differences. Given
the nature of the data and the various caveats, that have been discussed previously, the
following tentative conclusions can be drawn.
• The Iron Age Lull is typified by cool and wet summers and winters and ended
around AD 300, though it is difficult to be precise.
• The Early Medieval Dry period is identified by mild winters with occasional
severe episodes of Polar origin specific to the NWAR. Warm springs, summers
and autumns were showery but not overly wet. Extremely bad summers, either too
wet or dry, appear to be uncommon but there is insufficient evidence for any
categorical statements.
• The beginning of the Medieval Transition is hard to date due to seasonal
differences and any chosen will be arbitrary. To a certain extent change was by
degree with an increase in variability but not a change in climate type. However
three points can be noted:
1. From the mid 11 t h century the incidence of storminess increases
2. From the mid AD 1090s severe winters increase and were more likely to last
for longer than one year such as AD 1092-1116 and AD 1270-1297

3. Summers and associated seasons are more difficult to assess due to the
vagueness of the data and the number of unclassifiable seasonal events
particularly around AD 875-80 and c. AD 975. Generally summers appear to
be fairly similar to the earlier period
Overall it appears that from around AD 1050-1100 the climate became more
variable with abnormal seasons lasting longer and westerly cyclonic systems
becoming more turbulent but there does not appear to be major changes in
temperature or precipitation.
The Medieval Lull. The beginning can be dated to AD 1270, when a severe run of
winters began; AD 1298 when cold winters almost disappeared; or from around
AD 1310 when cool and wet weather became predominant. There was a definite
decline in spring, summer and autumn temperatures and increasing precipitation
associated with an intensification of stormy weather from AD 1310 at the latest.
The latter date is, perhaps, preferable but it depends on whether the choice is
temperature or precipitation. Taking the evidence into account it appears that the
AD 1294-7 event was typical of the weather over the previous 250 years with an
increase of intensity after c. AD 1270. After AD 1310, at least, the climate has a
completely different character as measured by temperature and precipitation. It
therefore appears that the change is between AD 1298-1310. The difference is
clearly seen in Ireland though this does not appear to be the case in Europe due to
different regional climate dynamics and perspectives.
The 'Little Ice Age' in Ireland begins around AD 1588 but there was poor weather
in the other seasons.
One argument of this dissertation was that there is sufficient evidence to support the
validity of the North West Atlantic Region hypothesis. It has been argued that climate
dynamics in Ireland can be significantly different to Great Britain and mainland
Europe through the use of climatic and dendrochronoligical data. The north-south
boundary can sometimes be seen in the Irish Sea, but there is a need for more regional
proxy data from England, Scotland, Wales, Brittany, and the northern Iberian
Peninsula for a fuller picture of how climatic patterns shift in space and time. It is also
essential to test whether this region, if it exists, is ephemeral or permanent.
Dendrochronology
As may have been expected an analysis of the tree-ring widths of Quercus could not
be directly related to long term climate and climatic changes due to biological and
environmental factors. There are some hints that some of the changes seen in the
dendrochronological record can be correlated with periods of climatic change such as
in the beginning of the 14 t h century. However considerable work yet needs to be done
on tree-ring history to elucidate the patterns of change found in the series. The tree-
ring widths also provide evidence that supports the human-environmental relationship
and oak population life cycles.
An elucidation of the oak's total response to its ecosystem on micro and macro scales
has proved to be difficult, as the disentanglement of biological, climatic and
environmental influences is problematical. The reality is that there is no
comprehensive theory that explains the response patterns of tree-ring widths.
Notwithstanding the methodological problems an attempt was made to provide an
outline of their history over the last 2,000 years though all suppositions must be
regarded as tentative.
Regional issues came to the fore with the discovery of regional asynchronous
behaviour. While the idea has been explored before now this work indicates that the
boundaries can be geographically located at specific time periods. The nature of the
differences has yet to be discovered but if a theory can be provided that explains the
apparently contradictory evidence, than it may be possible to find enough information
to compare dendroclimatic and climatic zones or regions, whatever their life-span.
Many other questions remain unanswered such as the cause of the decline of widths in
AD 700-830 and AD 1410-1445 in Ireland as well as the pan European (including
Ireland) rise from c. AD 1650 to mention but a few.
However the exercise was worthwhile as it gives a different perspective on the
behaviour of oaks. It provided a greater understanding of the biological and
environmental issues pertaining to the ecology of Quercus. Also without the research
on widths the value of indices would not have been appreciated. However it must be
noted that a major research limit was statistical competence. While simple statistics
were understood easily enough, in the higher reaches understanding was primitive i.e.
'High Correlation is Good' and 'Low Correlation is Bad (or just plain different)'.
Most interpretation at this stage was based on the visual examination of charts that
were often dimly understood.
Discussion
It is worth exploring the relationship between climate and history using the different
perspectives of the research results. It is not the intention to go into any great detail,
but to explore the possible consequences by navigating a safe passage between the
shoals of political and climatic determinism. What, in other words, are the
implications of these perspectives and what does it tell us about the Irish social
history? A full analysis of this interplay is outside the scope of this dissertation, as it
would entail rewriting Irish history. However it behoves the historian to make some
attempt at revision, no matter how limited it is. Whether this is relevant to the modern
debate on climate change, as often claimed, is perhaps open to question.
It has been noted that Irish agricultural society benefited from a benign climate to
about AD 1270 with the exception of a 25 year period at the turn of the 12 t h century.
The island supported a mixed agricultural economy of cattle and grain, famines were
few and though they could be very severe recovery was apparently quick. From the
end of the 13 t h century medieval expansion appears to have halted and an agricultural
retrenchment took place reflecting the colder wetter conditions of the 14 t h-16 t h
centuries and the severe winters after AD 1590. This of course is not the whole story
and the impact of infectious diseases; endemic warfare, agricultural innovations a!nd
cultural change were also significant factors in shaping history over this time.
The first major event that we know of is the famine of AD 536 with the laconic
statement of a 'shortage of bread'. This can not be taken very far as it there is no way
of knowing its intensity or duration, except to say that the impact of the catastrophic
event, possibly of extra-terrestrial origin and discussed fully by Baillie (1995 91-107
& 1999), must have happened after March. This event is recorded in tree-rings world
wide, though in Ireland the impact is not so clear and this may be due to the fact that
tree-ring widths were depressed at this time. The Irish widths recovered over the
following two years but declined again during AD 539-45. The impact on the human
population is unclear since we do not have any direct correlation between the annals
and tree-rings widths.
The Justinian Plague followed in AD 545, with recurrences in AD 549 and 556 with
smallpox in AD 554 and 577 and Leprosy (Hansen's disease) in AD 576. Other
diseases are harder to identify and many were named by 19 t h century medical
historians, particularly, William Wilde. Modern epidemiologists note that over time
virus and bacteria either become extinct or mutate into something else, either
becoming benign or more toxic and/or virulent and are a function of the never-ending
competition between immune systems and diseases. The combination of ambiguous
diagnostic information and these mutations often make the identification of historic
diseases problematical.
While the mid 6 t h century catastrophe was important, in terms of negative impacts on
a global scale, it is important not to take it out of context. For instance it is likely that
the Mediterranean was technically active at the plate margins, for example there was
the volcanic eruption of Vesuvius in AD 513 and a major earthquakes in and around
the basin in the 6 t h century. (Zinsser 1935 107). A second point is that while the
Justinian Plague was the worst that had been known; it followed the Athenian Plague
of 430 BC; and others in 54 BC; AD 80; AD 165-89 (Plague of Antoninus or Galen);
AD 250-6 (Cyprian plague); AD 310-13; AD 445-6; AD 467 and AD 477 (ibid. 99-
106).
However the origins of epidemics are complex. There appears to be a general
relationship between climate and spread amongst some diseases such as the plague. In
any environmental catastrophe, there is a migration of rodents, their parasites and a
miscellany of viral and bacterial diseases. These diseases usually have a major impact
on populations with no natural immunities. However human disturbances, such as
landscape clearances, can also have the same effect.
The issue is complicated by urbanisation, the effects of which have been recognised
since the time of Hippocrates if not earlier. Urban centres are major disease vectors
because of their location, their trade functions and their cultural mores. This is not
only a question of poor sanitation; but also any large agglomerations of people,
whether permanent or temporary, create the conditions by where transfers of DNA
become very straightforward and this allows rapid mutations of diseases into possibly
more virulent and toxic forms. A further issue is the relationship between the
breakdown of sexual mores and the mutation of sexually transmitted diseases, which
tends to be ignored (with the exception of gonorrhoea) until the 16 t h century when
syphilis became a major epidemic.
A possible explanation for the plague is that at the global climate downturn in 500 BC
there was major environmental changes to the natural world. This resulted in the
spread of vegetation cohorts to new locations and extinction at the old, followed by
the knock-on effect on the fauna, including the major disease vector, the rodent. The
spread of rodents would then cause the breakout of infectious diseases and this would
have a major impact on traditional agricultural societies and then travel on the
existing trade networks. The above chronology suggests waves of plague coming
from Asia and Africa, being channelled through Turkey and into Europe, becoming
stronger and reaching further west every time culminating in the strongest and last of
the succession, the Justinian Plaque.
The aetiology of these various waves of plague show different characteristics
suggesting that they are all different variants, each more powerful than the previous. It
is likely that as the human population builds up immunity the virus almost completely
dies out except for the mutations that survive through random natural selection. These
mutations are therefore stronger and more virulent and the ancestors of the next
outbreak. Human immune systems unfortunately breed stronger plague variants,
though it happens at a slower time scale than the modern period of antibiotics. This
supplements the relationship between climatic lulls and plague outbreaks but climatic
effects on other major diseases are largely unknown.
It is also worth noting that Smallpox, believed to have originated in India c. 2000 BC,
has been implicated in the Plague of Athens and the Justinian Plague, as well as some
of the others. Recently the theory of 'Gumbo diseases' has been put forward which
argues that disease combinations often have deadly interrelationships (Garrett 1998
207). Smallpox appears on it's own at other times and is found in nearly all periods of
history but became less toxic over time. In Ireland mortality rates for smallpox appear
to have been lower than the plague.
This relationship of plague and climate may help to define climatic lulls, though
plague outliers appear to last well into changed climatic times. In the modern period
most of our new diseases originate from the destruction of Tropical Rain Forests, but
a climatic downturn to 'Lull' type conditions could intensify the current wave of
infectious diseases as new outbreaks of plague arrive from Asia. It is perhaps
debatable whether environmental disturbance is the sole forcing mechanism because
there may be an independent relationship between some other climatic signal and viral
mutation of the plague (and other infectious diseases) and its subsequent spread.
When the Justinian Plague arrived in Europe it caused a major loss of life amongst the
Mediterranean population with a possible mortality rate of one-third. However this
outbreak was mostly among people with some built up immunity in contrast to Ireland
where there is no evidence of previous outbreaks of plague. The question than arises
as to the mortality rate in Ireland in the AD 540s. The annalists say that two-thirds of
the world died, perhaps they were closer to the truth than we care give them credit for.
The following outbreaks between AD 664-684 appear only to happen in Ireland
indicating it took a few generations, perhaps three to five, for the community to build
up immunity.
It can also be noted that the spread of animal diseases follows the same patterns. It is
therefore difficult to say whether any particular outbreak is climatically related or a
result of the importation of a new disease on an animal population that had no
previous immunity. This is particularly a problem, of island biogeography, though
Ireland is large enough not to face complete extinction of its animal (or human)
populations, though the evidence suggests that it came close on a number of