Embed Size (px)
Citation preview
1
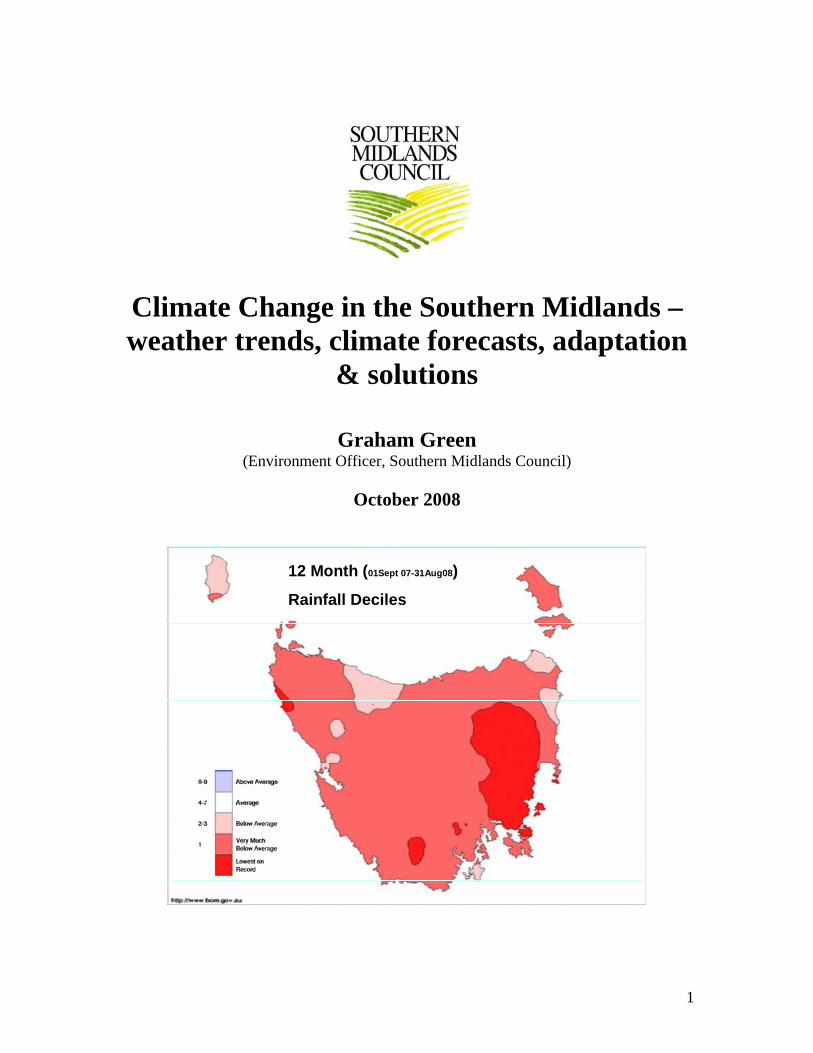
Climate Change in the Southern Midlands – weather trends, climate forecasts, adaptation
& solutions
Graham Green (Environment Officer, Southern Midlands Council)
October 2008
12 Month (01Sept 07-31Aug08)
Rainfall Deciles
S O U T H E R N M I D L A N D S C O U N C I L C L I M A T E C H A N G E I N F O R M A T I O N 2
TABLE OF CONTENTS
1.0 INTRODUCTION.......................................................................................................................... 3
2.0 LOCAL TRENDS .......................................................................................................................... 4
2.1 RECENT RAINFALL TRENDS .......................................................................................................... 4 2.2 LONGER-TERM RAINFALL TRENDS FOR OATLANDS ...................................................................... 5
3.0 REGIONAL TRENDS & FORECASTS...................................................................................... 6
3.1 REGIONAL TRENDS ...................................................................................................................... 6 3.1.1 Rainfall ................................................................................................................................... 6 3.1.2 Atmospheric Pressure............................................................................................................. 7 3.1.3 Temperature ........................................................................................................................... 8
3.2 REGIONAL CLIMATE FORECASTS.................................................................................................. 8 3.3 IMPLICATIONS OF THE FORECAST FOR AGRICULTURE ................................................................... 9
4.0 ADAPTATION & SOLUTIONS ................................................................................................ 10
4.1 THE IMPORTANCE OF INCREASING SOIL ORGANIC CARBON IN AGRICULTURAL LAND ............ 11 4.1.1 What is soil organic carbon?................................................................................................ 11 4.1.2 Importance of soil organic carbon in agriculture ................................................................ 11 4.1.3 How much carbon can be stored in soils? ............................................................................ 12 4.1.4 Factors affecting soil carbon level ....................................................................................... 12 4.1.5 Management practices that reduce soil organic carbon ...................................................... 13 4.1.6 Management practices that increase soil organic carbon.................................................... 13 4.1.8 Further information on soil carbon:..................................................................................... 15
4.2 PYROLYSIS - PRODUCTION OF CHARCOALS (BIOCHAR) TO DRAW CARBON FROM THE
ATMOSPHERE, IMPROVE SOIL FERTILITY, INCREASE MICROBIAL ACTIVITY, ENHANCE MOISTURE RETENTION
AND PROVIDE RENEWABLE ENERGY.......................................................................................................... 15 4.2.1 Benefits of pyrolysis and ‘agrichar’ ..................................................................................... 16 4.2.1 Further information on pyrolysis: ........................................................................................ 18
4.3 WATER AVAILABILITY AND EFFICIENCY ................................................................................. 18 4.3.1 Keyline systems..................................................................................................................... 20 4.3.2 Further information on keyline systems................................................................................ 22
4.4 BENEFITS OF RENEWABLE ENERGY.......................................................................................... 22 4.4.1 Renewable energy case study from the island of Samso, Denmark ...................................... 23
S O U T H E R N M I D L A N D S C O U N C I L C L I M A T E C H A N G E I N F O R M A T I O N 3
1.0 Introduction Climate change has become an issue of concern for many Midlands residents as the social and economic fabric of the region is deeply connected with seasonal conditions, particularly the frequency and magnitude of rainfall events. Agricultural enterprises have been undertaken in the region since the early 1800s and until recent decades there was relative predictability around the timing of spring and autumn breaks. This predictability was so important in determining the annual business cycles, productivity of the land and general prosperity of the region. In recent times, the lack of an autumn break has become normal and good spring rains are no longer guaranteed. This has had many implications and serious consequences for farmers including:
the health and productivity of farms is rarely consistent; the ability to plan ahead with confidence in relation to cropping cycles and
stocking rates has evaporated; the ability to feed and water stock is at times lost; an acceptable ‘bottom line’ can now be absent for several years in a row; tree decline and land degradation is increasing; and the future viability of enterprises is being questioned.
There has been a noticeable drying of the landscape and there is anecdotal evidence right across the municipality that springs and streams have dried up for the first time since the settlement of the region. People working closely with the land and those experienced in observing and recording local weather patterns are now concerned that observed drying is now bigger than ‘natural variability’ and may in fact be evidence of a shifting climate. This report provides analysis of local and regional meteorological data to demonstrate the nature of recent and longer term trends in climate. Information is also provided on modelled climate forecasts for Tasmania which will be crucial in terms of developing longer term strategies for agriculture in the region. The current situation and nature of the forecast appear challenging and there is now little doubt that the climate is changing and significant adaptation and brave decision making is required in order for a viable future in agriculture in the Midlands. In light of this situation the report offers potential adaptation measures for farmers of the region and suggested contributions that may be made to address the developing climate problem. Some inspiring case studies are presented that make the changing climate appear more of an opportunity rather than a problem.
S O U T H E R N M I D L A N D S C O U N C I L C L I M A T E C H A N G E I N F O R M A T I O N 4
2.0 Local Trends
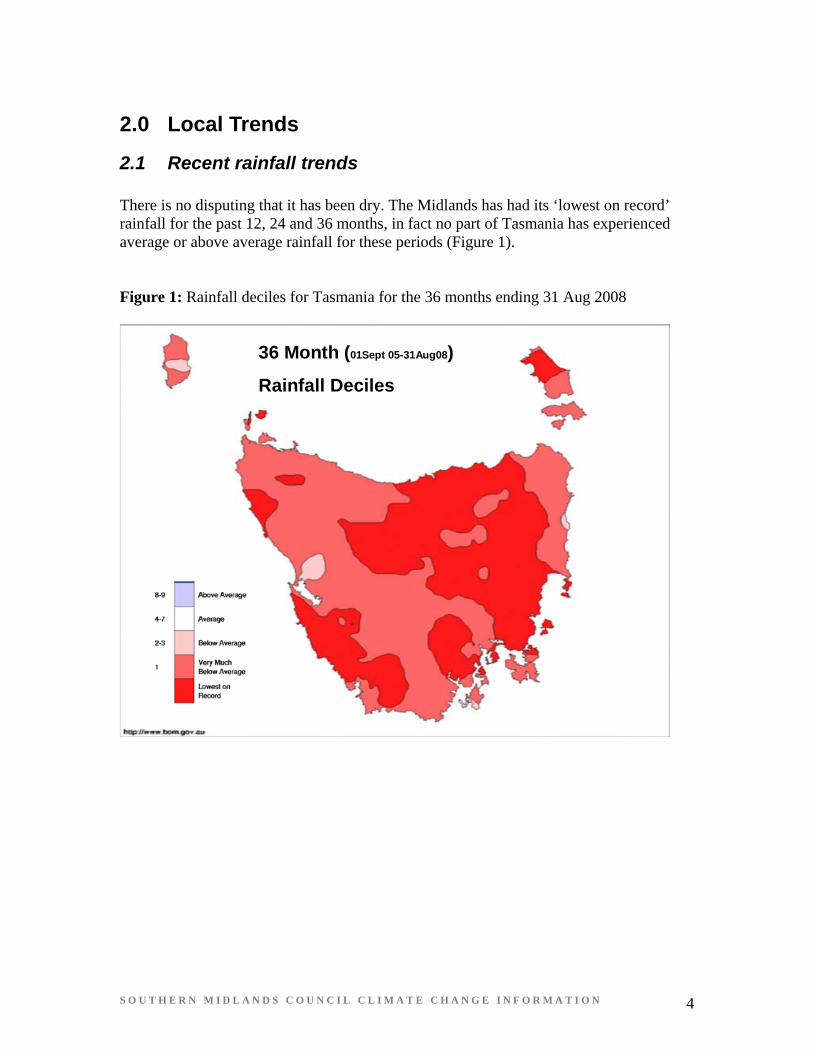
2.1 Recent rainfall trends There is no disputing that it has been dry. The Midlands has had its ‘lowest on record’ rainfall for the past 12, 24 and 36 months, in fact no part of Tasmania has experienced average or above average rainfall for these periods (Figure 1). Figure 1: Rainfall deciles for Tasmania for the 36 months ending 31 Aug 2008
36 Month (01Sept 05-31Aug08)
Rainfall Deciles
S O U T H E R N M I D L A N D S C O U N C I L C L I M A T E C H A N G E I N F O R M A T I O N 5
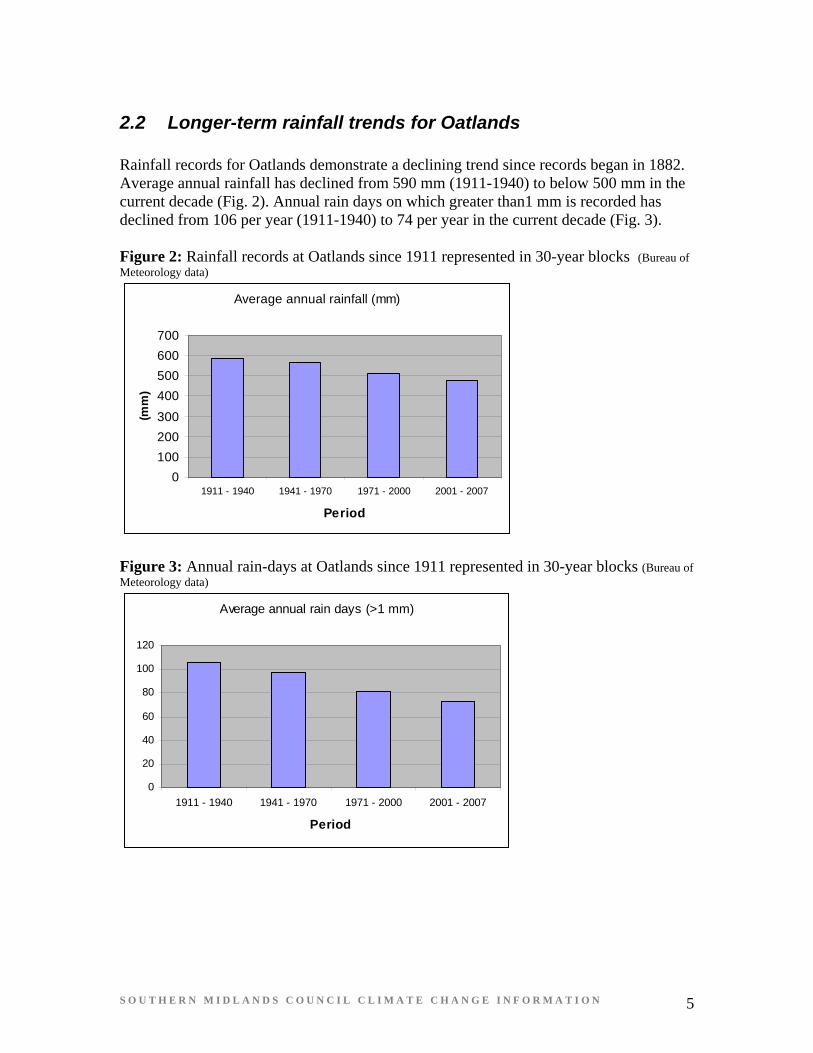
2.2 Longer-term rainfall trends for Oatlands Rainfall records for Oatlands demonstrate a declining trend since records began in 1882. Average annual rainfall has declined from 590 mm (1911-1940) to below 500 mm in the current decade (Fig. 2). Annual rain days on which greater than1 mm is recorded has declined from 106 per year (1911-1940) to 74 per year in the current decade (Fig. 3). Figure 2: Rainfall records at Oatlands since 1911 represented in 30-year blocks (Bureau of Meteorology data)
Average annual rainfall (mm)
0
100
200
300
400
500
600
700
1911 - 1940 1941 - 1970 1971 - 2000 2001 - 2007
Period
(mm
)
Figure 3: Annual rain-days at Oatlands since 1911 represented in 30-year blocks (Bureau of Meteorology data)
Average annual rain days (>1 mm)
0
20
40
60
80
100
120
1911 - 1940 1941 - 1970 1971 - 2000 2001 - 2007
Period
S O U T H E R N M I D L A N D S C O U N C I L C L I M A T E C H A N G E I N F O R M A T I O N 6
3.0 Regional trends & forecasts
3.1 Regional Trends
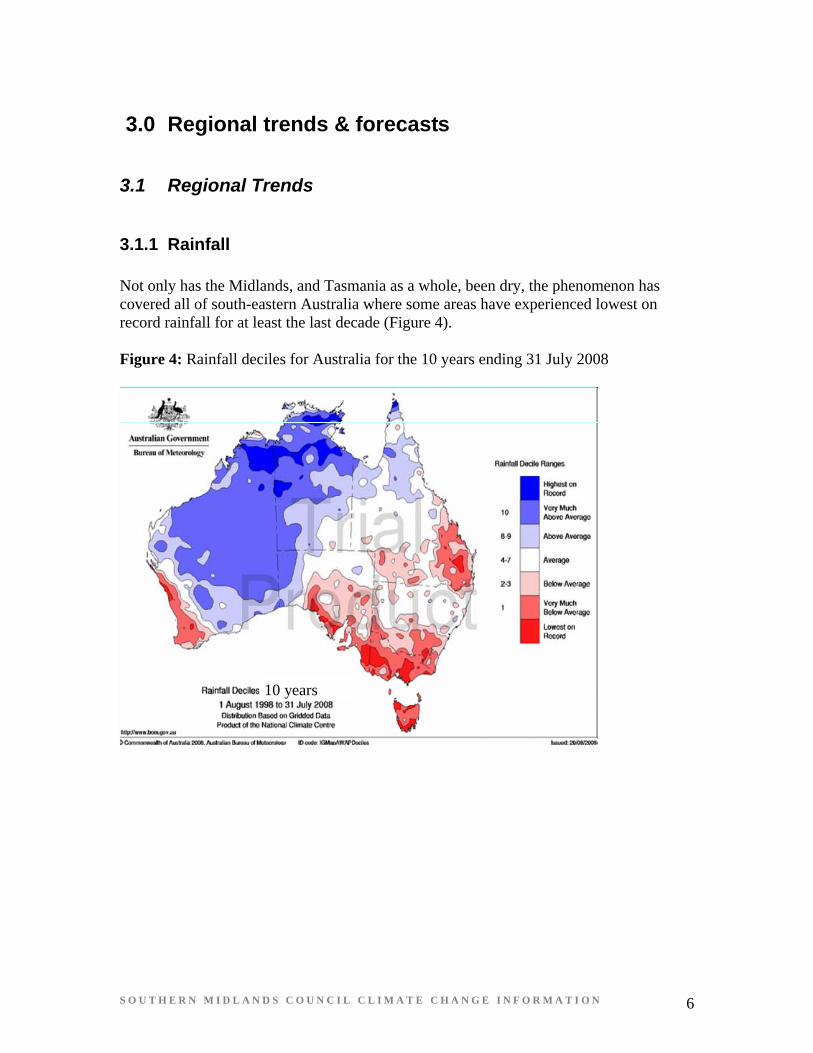
3.1.1 Rainfall Not only has the Midlands, and Tasmania as a whole, been dry, the phenomenon has covered all of south-eastern Australia where some areas have experienced lowest on record rainfall for at least the last decade (Figure 4). Figure 4: Rainfall deciles for Australia for the 10 years ending 31 July 2008
10 years
S O U T H E R N M I D L A N D S C O U N C I L C L I M A T E C H A N G E I N F O R M A T I O N 7
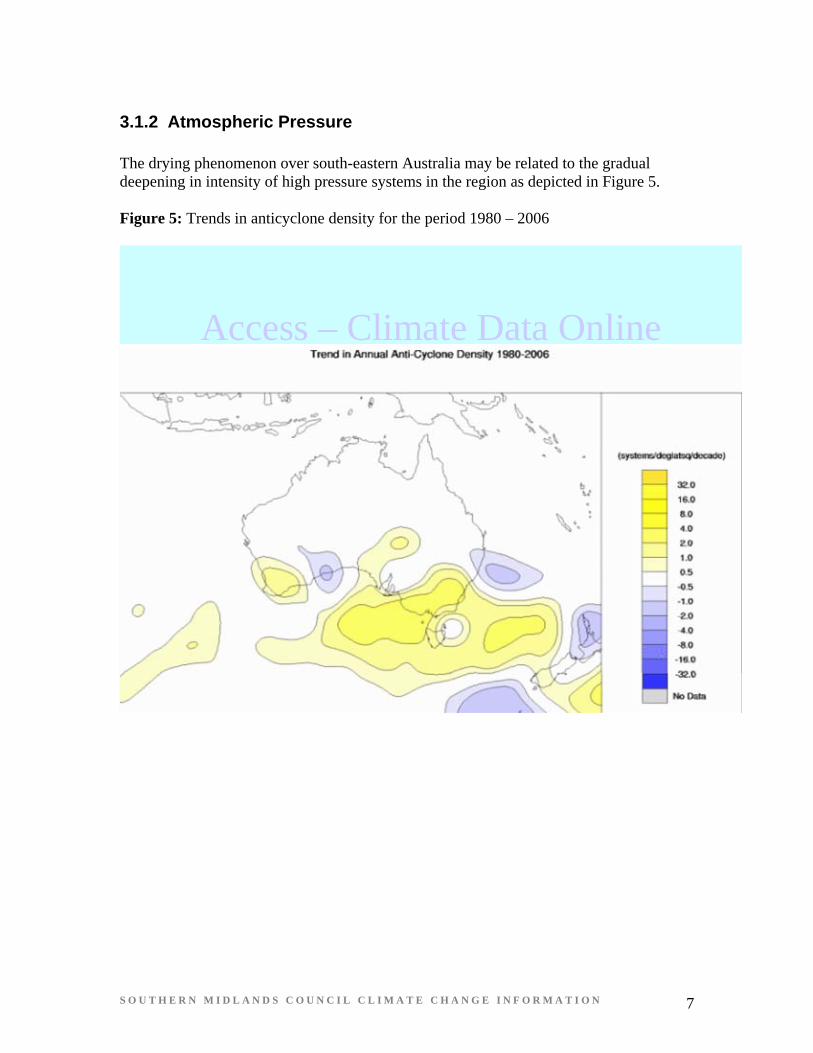
3.1.2 Atmospheric Pressure The drying phenomenon over south-eastern Australia may be related to the gradual deepening in intensity of high pressure systems in the region as depicted in Figure 5. Figure 5: Trends in anticyclone density for the period 1980 – 2006
Access – Climate Data Online
S O U T H E R N M I D L A N D S C O U N C I L C L I M A T E C H A N G E I N F O R M A T I O N 8
3.1.3 Temperature
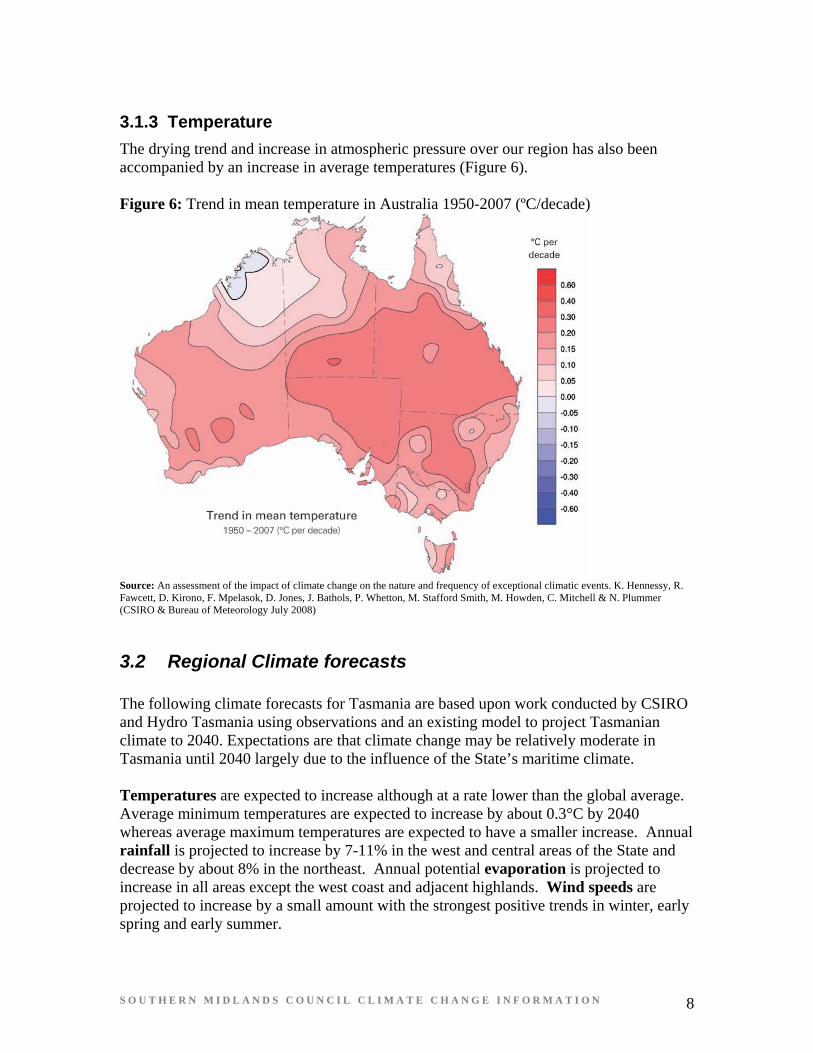
The drying trend and increase in atmospheric pressure over our region has also been accompanied by an increase in average temperatures (Figure 6). Figure 6: Trend in mean temperature in Australia 1950-2007 (ºC/decade)
Source: An assessment of the impact of climate change on the nature and frequency of exceptional climatic events. K. Hennessy, R. Fawcett, D. Kirono, F. Mpelasok, D. Jones, J. Bathols, P. Whetton, M. Stafford Smith, M. Howden, C. Mitchell & N. Plummer (CSIRO & Bureau of Meteorology July 2008)
3.2 Regional Climate forecasts The following climate forecasts for Tasmania are based upon work conducted by CSIRO and Hydro Tasmania using observations and an existing model to project Tasmanian climate to 2040. Expectations are that climate change may be relatively moderate in Tasmania until 2040 largely due to the influence of the State’s maritime climate. Temperatures are expected to increase although at a rate lower than the global average. Average minimum temperatures are expected to increase by about 0.3°C by 2040 whereas average maximum temperatures are expected to have a smaller increase. Annual rainfall is projected to increase by 7-11% in the west and central areas of the State and decrease by about 8% in the northeast. Annual potential evaporation is projected to increase in all areas except the west coast and adjacent highlands. Wind speeds are projected to increase by a small amount with the strongest positive trends in winter, early spring and early summer.
S O U T H E R N M I D L A N D S C O U N C I L C L I M A T E C H A N G E I N F O R M A T I O N 9
A new climate modelling project ‘Climate Futures for Tasmania’ will model Tasmania’s future climate at a finer scale than has been possible in the past. This project is being undertaken by the Antarctic Climate and Ecosystems Cooperative Research Centre and will more accurately represent Tasmania’s geography and its effect on the local climate. This project will help fine tune the regional variability we can expect in climate impact.
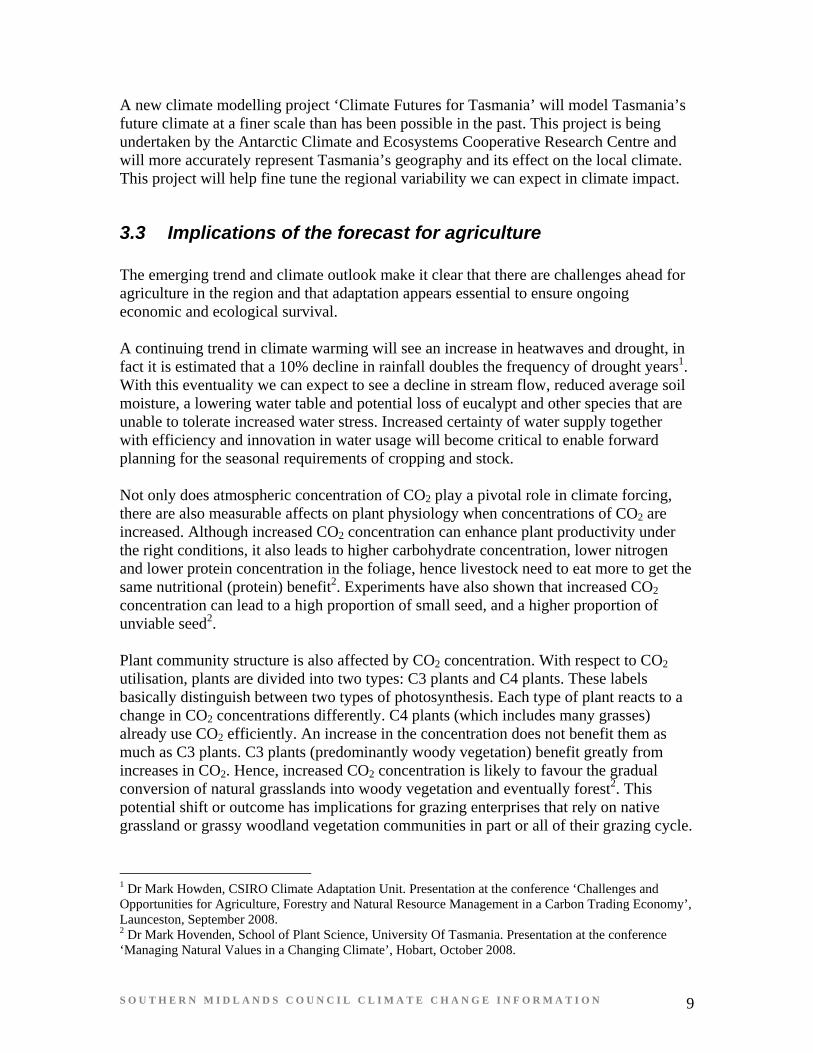
3.3 Implications of the forecast for agriculture The emerging trend and climate outlook make it clear that there are challenges ahead for agriculture in the region and that adaptation appears essential to ensure ongoing economic and ecological survival. A continuing trend in climate warming will see an increase in heatwaves and drought, in fact it is estimated that a 10% decline in rainfall doubles the frequency of drought years1. With this eventuality we can expect to see a decline in stream flow, reduced average soil moisture, a lowering water table and potential loss of eucalypt and other species that are unable to tolerate increased water stress. Increased certainty of water supply together with efficiency and innovation in water usage will become critical to enable forward planning for the seasonal requirements of cropping and stock. Not only does atmospheric concentration of CO2 play a pivotal role in climate forcing, there are also measurable affects on plant physiology when concentrations of CO2 are increased. Although increased CO2 concentration can enhance plant productivity under the right conditions, it also leads to higher carbohydrate concentration, lower nitrogen and lower protein concentration in the foliage, hence livestock need to eat more to get the same nutritional (protein) benefit2. Experiments have also shown that increased CO2 concentration can lead to a high proportion of small seed, and a higher proportion of unviable seed2. Plant community structure is also affected by CO2 concentration. With respect to CO2 utilisation, plants are divided into two types: C3 plants and C4 plants. These labels basically distinguish between two types of photosynthesis. Each type of plant reacts to a change in CO2 concentrations differently. C4 plants (which includes many grasses) already use CO2 efficiently. An increase in the concentration does not benefit them as much as C3 plants. C3 plants (predominantly woody vegetation) benefit greatly from increases in CO2. Hence, increased CO2 concentration is likely to favour the gradual conversion of natural grasslands into woody vegetation and eventually forest2. This potential shift or outcome has implications for grazing enterprises that rely on native grassland or grassy woodland vegetation communities in part or all of their grazing cycle.
1 Dr Mark Howden, CSIRO Climate Adaptation Unit. Presentation at the conference ‘Challenges and Opportunities for Agriculture, Forestry and Natural Resource Management in a Carbon Trading Economy’, Launceston, September 2008. 2 Dr Mark Hovenden, School of Plant Science, University Of Tasmania. Presentation at the conference ‘Managing Natural Values in a Changing Climate’, Hobart, October 2008.
S O U T H E R N M I D L A N D S C O U N C I L C L I M A T E C H A N G E I N F O R M A T I O N 10
4.0 Adaptation & solutions The introduction of the Australian Government’s Emission Trading Scheme in 2010 will see the setting of an annual target for Australia’s greenhouse gas emissions. Constraints on the annual emission of greenhouse gases will see price increases in energy products such as petroleum and electricity generated from coal. We will all become passive contributors to a reduction in greenhouse gas emissions. As the emission reduction targets of the scheme seem likely to be modest at best and are likely not to be adequate to alleviate what scientists are calling ‘dangerous climate change’, it is therefore important that many Australians also take up the challenge to become active contributors to reducing the impact of climate change. There area many ways in which individuals and businesses can take on an active role to address and adapt to climate change. Options include:
reduction in the usage of fossil fuels through use of fuel efficient or hybrid vehicles, opting for public transport where available, flying less or car pooling;
adopting renewable energy (e.g. solar electricity and hot water systems) at a household or community scale;
choosing passive solar house design; reducing household energy consumption through insulation and usage of energy
efficient appliances; offsetting carbon emissions through existing schemes or through personal
initiatives such as tree planting or increasing soil carbon; supporting businesses or agriculture that practice sustainable production; conserving water, reusing water and being innovative with water use.
The topics that will be expanded upon below are practices that have multiple benefits in agricultural systems such as increasing soil carbon and the commercial scale production of a charcoal-based soil conditioner. Not only are significant draw-downs of atmospheric carbon possible using these methods and technologies but significant increases in farm productivity can result. Water availability and usage will also be discussed simply because without a short-term guarantee that there will be some water available the region may well lose the economic footing that is necessary to adapt and solve climate change in other ways. Finally, the positive economic benefits that renewable energy development can bring will be highlighted in a case study from Denmark.
S O U T H E R N M I D L A N D S C O U N C I L C L I M A T E C H A N G E I N F O R M A T I O N 11
4.1 The importance of increasing soil organic carbon in agricultural land The Tasmanian Midlands has suffered enormous challenges with drought in recent decades. The unpredictability of the seasons has lead to great difficulty in the management of stock numbers and the management of pasture and fodder. The unprecedented drying of the landscape and associated complete loss of ground cover at times has at times led to soil loss. Landscape stress of this kind can lead to the loss of carbon to the atmosphere as CO2 that was originally held in the soil as humus. The challenge that lies ahead for farmers is to stem the loss of carbon from their holdings and manage the landscape in order that it has the greatest potential to accumulate and store carbon. The material presented below highlights the important role soil carbon has in agricultural fertility and the enormous potential that agricultural soils have for carbon sequestration. The following material is sourced from: Yin Chan (2008) Increasing soil organic carbon of agricultural land. Primefact 735, NSW Department of Primary Industries.
4.1.1 What is soil organic carbon? Soil organic carbon (SOC) is the carbon associated with soil organic matter. Soil organic matter is the organic fraction of the soil that is made up of decomposed plant and animal materials as well as microbial organisms. Soil carbon can also be present in inorganic forms, e.g. lime or carbonates in some soils in drier areas. It is convenient to divide total SOC into different pools dependent on their ease of decomposition, namely labile pool, slow pool and inert pool. The labile pool includes all the freshly added plant and animal residues as well as micro-organisms. As these are easily decomposed, they are labile. The slow pool includes well- decomposed organic materials, the humus. The inert pool refers to the fraction that is old, resistant to further breakdown and represents the products of the last stage of decomposition, e.g. charcoal.
4.1.2 Importance of soil organic carbon in agriculture
Soil organic carbon is important for all three aspects of soil fertility, namely chemical, physical and biological fertility. Nutrient availability. Decomposition of soil organic matter releases nitrogen, phosphorus and a range of other nutrients for plant growth. Soil structure and soil physical properties. SOC promotes soil structure by holding the soil particles together as stable aggregates improves soil physical properties such as water
S O U T H E R N M I D L A N D S C O U N C I L C L I M A T E C H A N G E I N F O R M A T I O N 12
holding capacity, water infiltration, gaseous exchange, root growth and ease of cultivation. Biological soil health. As a food source for soil fauna and flora, soil organic matter plays an important role in the soil food web by controlling the number and types of soil inhabitants which serve important functions such as nutrient cycling and availability, assisting root growth and plant nutrient uptake, and even suppressing crop diseases. As a buffer against toxic and harmful substances. Soil organic matter can lessen the effect of harmful substances e.g. toxins, and heavy metals, by acting as buffers, e.g. sorption of toxins and heavy metals, and increasing degradation of harmful pesticides.
4.1.3 How much carbon can be stored in soils?
There are a whole range of SOC levels in different soils. For instance, for the surface soils, SOC ranges from about 10% in the alpine soils to less than 0.5% in the desert soils. The amount of SOC stored in the soil profile can be considerable. For example, if there is 1% SOC over 30 cm soil depth, the amount of SOC stored over 1 hectare of land can weigh about 42 tonnes. Usually, the surface layer has the highest level of SOC which decreases with depth down the soil profile. The actual amount of SOC present in a soil is dependent on a number of factors.
4.1.4 Factors affecting soil carbon level
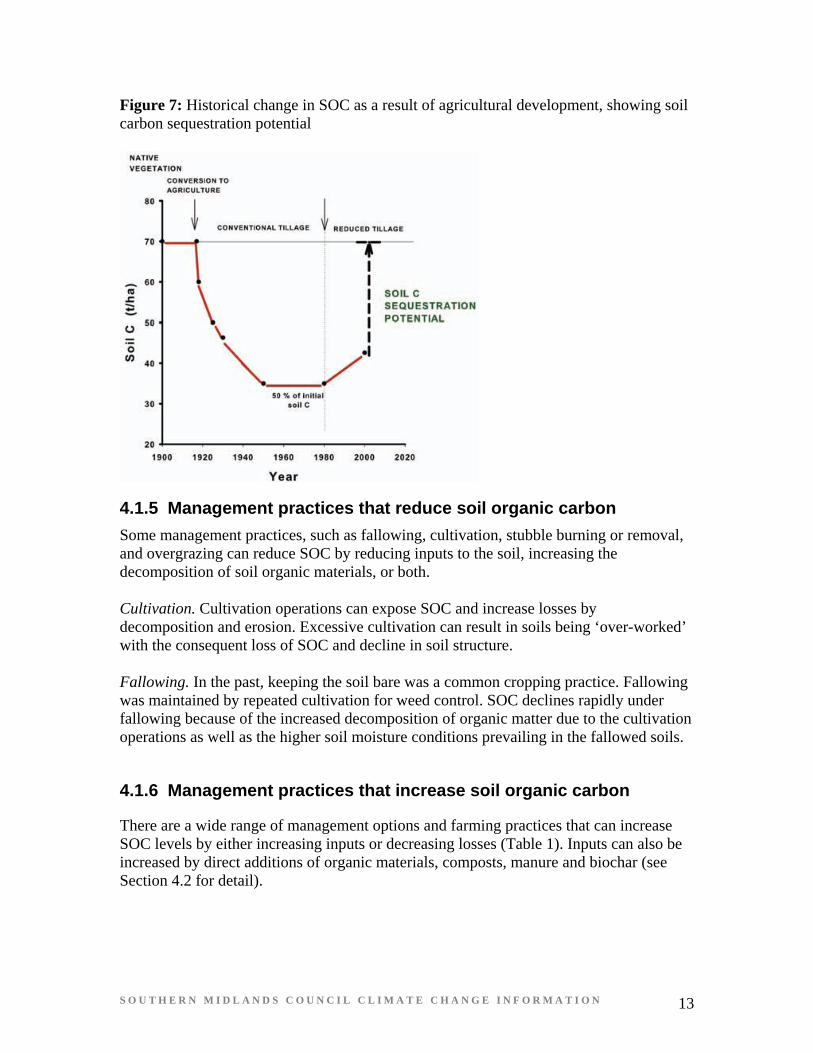
Soil carbon levels are determined by factors such as rainfall, temperature, vegetation and soil type and reach equilibrium values associated with individual systems and locations. However, these equilibria are disturbed when areas are cleared and used for agricultural production. Globally, clearing natural vegetation for agriculture results in large reductions in SOC levels and further declines may occur due to management practices (Figure 7). In Australia, it has been estimated that, in many areas, soil carbon levels have dropped by up to 50% compared to pre-agricultural periods. Most of the reduction in SOC occurs in the surface soil layer, 0–10 cm. Therefore, soil carbon levels of agricultural soils are lower than corresponding soils under natural vegetation. This difference in SOC indicates the potential for soil carbon storage. In agricultural systems, soil carbon levels tend to be variable and dependent on management practices. The change in SOC is determined by the balance of carbon inputs over losses.
S O U T H E R N M I D L A N D S C O U N C I L C L I M A T E C H A N G E I N F O R M A T I O N 13
Figure 7: Historical change in SOC as a result of agricultural development, showing soil carbon sequestration potential
4.1.5 Management practices that reduce soil organic carbon
Some management practices, such as fallowing, cultivation, stubble burning or removal, and overgrazing can reduce SOC by reducing inputs to the soil, increasing the decomposition of soil organic materials, or both. Cultivation. Cultivation operations can expose SOC and increase losses by decomposition and erosion. Excessive cultivation can result in soils being ‘over-worked’ with the consequent loss of SOC and decline in soil structure. Fallowing. In the past, keeping the soil bare was a common cropping practice. Fallowing was maintained by repeated cultivation for weed control. SOC declines rapidly under fallowing because of the increased decomposition of organic matter due to the cultivation operations as well as the higher soil moisture conditions prevailing in the fallowed soils.
4.1.6 Management practices that increase soil organic carbon
There are a wide range of management options and farming practices that can increase SOC levels by either increasing inputs or decreasing losses (Table 1). Inputs can also be increased by direct additions of organic materials, composts, manure and biochar (see Section 4.2 for detail).
S O U T H E R N M I D L A N D S C O U N C I L C L I M A T E C H A N G E I N F O R M A T I O N 14
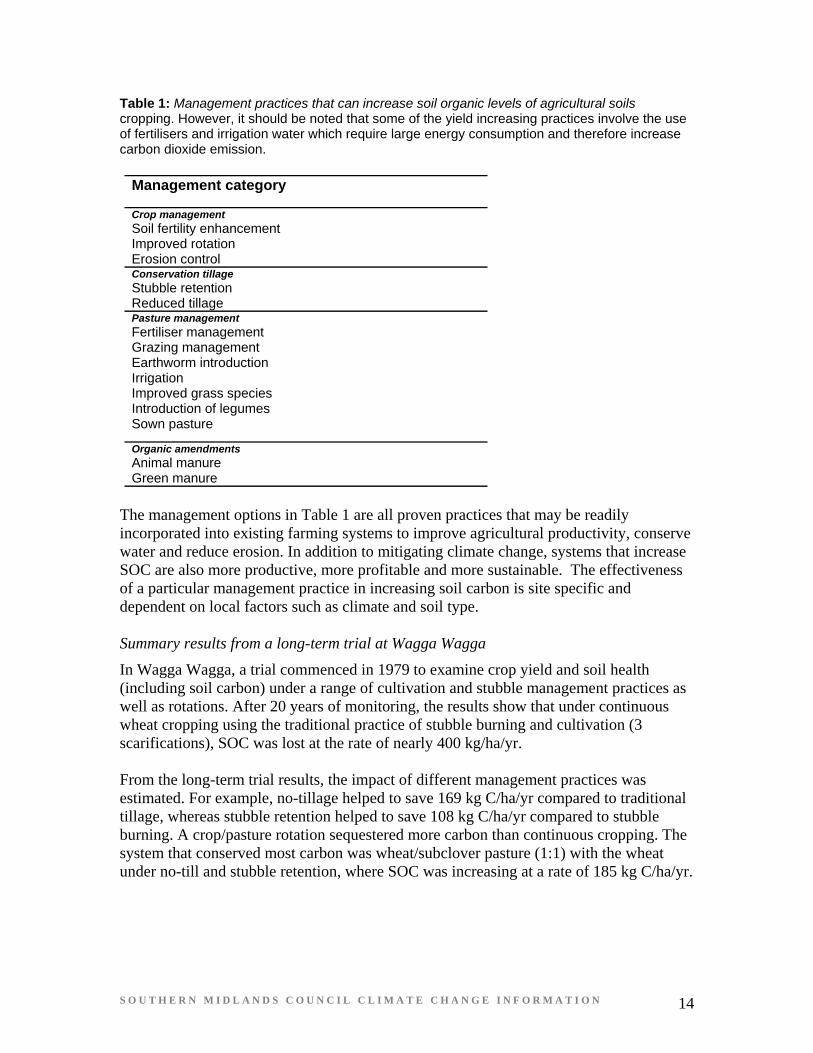
Table 1: Management practices that can increase soil organic levels of agricultural soils cropping. However, it should be noted that some of the yield increasing practices involve the use of fertilisers and irrigation water which require large energy consumption and therefore increase carbon dioxide emission.
Management category
Crop management Soil fertility enhancement Improved rotation Erosion control Conservation tillage Stubble retention Reduced tillage Pasture management Fertiliser management Grazing management Earthworm introduction Irrigation Improved grass species Introduction of legumes Sown pasture
Organic amendments Animal manure Green manure
The management options in Table 1 are all proven practices that may be readily incorporated into existing farming systems to improve agricultural productivity, conserve water and reduce erosion. In addition to mitigating climate change, systems that increase SOC are also more productive, more profitable and more sustainable. The effectiveness of a particular management practice in increasing soil carbon is site specific and dependent on local factors such as climate and soil type. Summary results from a long-term trial at Wagga Wagga
In Wagga Wagga, a trial commenced in 1979 to examine crop yield and soil health (including soil carbon) under a range of cultivation and stubble management practices as well as rotations. After 20 years of monitoring, the results show that under continuous wheat cropping using the traditional practice of stubble burning and cultivation (3 scarifications), SOC was lost at the rate of nearly 400 kg/ha/yr. From the long-term trial results, the impact of different management practices was estimated. For example, no-tillage helped to save 169 kg C/ha/yr compared to traditional tillage, whereas stubble retention helped to save 108 kg C/ha/yr compared to stubble burning. A crop/pasture rotation sequestered more carbon than continuous cropping. The system that conserved most carbon was wheat/subclover pasture (1:1) with the wheat under no-till and stubble retention, where SOC was increasing at a rate of 185 kg C/ha/yr.
S O U T H E R N M I D L A N D S C O U N C I L C L I M A T E C H A N G E I N F O R M A T I O N 15
4.1.8 Further information on soil carbon: www.carboncoalition.com.au
www.soilcarbon.com.au
www.carbonfarmersofaustralia.com.au
4.2 Pyrolysis - Production of charcoals (biochar) to draw carbon from the atmosphere, improve soil fertility, increase microbial activity, enhance moisture retention and provide renewable energy. Pyrolysis may be described as a win-win-win technology in that it is a:
solution to climate change;
a business opportunity;
a renewable energy producer; and
provides a soil conditioner (char) as a major output. Slow pyrolysis technology was developed in Australia as a collaborative research, development and commercialisation program between BEST Energies and the NSW Department of Primary Industries (DPI). The technology was awarded the United Nations Association of Australia 2007 World Environment Day Awards top honour for ‘Meeting the Greenhouse Challenge’. The technology involves heating low-grade biomass without oxygen to generate a gaseous biofuel and a very stable, carbon-rich, char product. Once the high carbon char product is added as an amendment to agricultural soils some of the most remarkable and promising benefits of this technology become apparent. Agronomic experiments have demonstrated that the char product can improve several soil health indicators as well as increase productivity. In addition, it decreases emissions of the potent greenhouse gas, nitrous oxide3. BEST Energies has a fully integrated pilot plant in NSW which has demonstrated the viability of the technology and assisted the design of commercial scale units.
3 Downie, A. (2007). Australian pyrolysis technology leads the world in demonstrating renewable energy production and biosequestration. University of New South Wales/BEST Energies.
S O U T H E R N M I D L A N D S C O U N C I L C L I M A T E C H A N G E I N F O R M A T I O N 16
4.2.1 Benefits of pyrolysis and ‘agrichar’ Source: Flannery T. (2008). Now or Never – A Sustainable Future For Australia? Quarterly Essay issue 31 There is one class of technology that promises a solution different both in quantity and quality from all the others. Known as pyrolysis, it results in energy generation, soil improvement and long term withdrawal of carbon from the atmosphere, all at the same time. Pyrolysis is an everyday phenomenon that involves the heating of biological matter in the absence of oxygen. It occurs when the outer layers of the biomass oxidises (burns), but the inside does not, as in frying, roasting and toasting. Thus, because oxygen can’t reach inside the steak you cook on the BBQ, it cooks by pyrolysis. Charcoal — composed chiefly of carbon — is a product of pyrolysis; making charcoal by such means is an ancient practice, going back thousands of years. Modern pyrolysis is simply a very sophisticated means of making charcoal, but its end result is far different from any pyrolysis known previously. Any biological material — crop waste, animal manure, forestry offcuts and even human sewage — can be used as base material. Why is charcoal important? When we grow trees to offset the carbon emissions created by the burning of fossil fuel, we are really trading a very secure form of carbon sequestration (that oil or coal would have stayed buried for millions of years if we hadn’t dug it up) for a less secure form of storage. After all, the carbon in a tree is “volatile” in the sense that if the tree rots or burns, the carbon will quickly be released back into the atmosphere, and climatic, political and economic changes can all make that tree likely to burn. All living things are made of volatile carbon: you and I, for example, will rot away pretty quickly when we die. But when we turn biomass into charcoal, we transform much of that carbon from something volatile to something inert. Ploughed back into the soil, charcoal won’t readily rot or burn, a fact that scientists exploit when they use ancient charcoal for C14 dating. So when we turn biomass into charcoal, we’re effectively breaking the carbon cycle — by locking C02 that the plant took from the atmosphere as it grew (or the animal that ate the plant) into a solid material that cannot rot and return to the atmosphere for hundreds, even thousands, of years. Let’s examine what happens to a crop of corn in the normal course of events. After the cobs are harvested, the crop waste is usually left to rot in the field. This doesn’t take long, with the bulk of the carbon in the crop waste returning to the atmosphere as C02 in a few months. If, however, the farmer harvested the entire corn plant and processed the inedible portion through a pyrolysis machine, one-third to one-half of the carbon captured by the crop would be transformed into charcoal, and the rest would be incorporated into a synthetic gas or oil, which could in turn be used to generate electricity or transport fuel. There are several kinds of pyrolysis machines, some classified as “slow” (those with long residence times for the biomass in the machine, which create synthetic gas) and some as “fast” (those which briefly subject biomass to temperatures of up to 500 degrees Celsius, and which can produce a bio-oil or a gas). Pyrolysis machines also operate at a variety of
S O U T H E R N M I D L A N D S C O U N C I L C L I M A T E C H A N G E I N F O R M A T I O N 17
scales, from those capable of processing just 50 kilograms per hour, to those which process up to 4000 kilograms per hour — and the machines can be made transportable. While some of the synthetic gas generated by the process is required to run the machine, there is usually a lot left over, which can be used to generate heat or electricity. Where farms are connected to the electricity grid, and legislation permits the transfer of electricity from renewable energy producers into the grid, this represents a major financial benefit to the farmer. The real biological benefits, though, occur when the charcoal is ploughed back into the field. Charcoal is very porous — after all, it was once the cells in a living thing — and its pores contain residual nutrients and minerals. If it is ploughed back into a field, bacteria and soil fungi essential to healthy plant growth soon colonise its cellular spaces, leading in turn to a healthier flora and fauna. This, along with charcoal’s capacity to lower soil acidity, generally results in a better crop in the following year. Charcoal also holds moisture, so the soil’s moisture retention is improved, meaning that plants have access to water and nutrients (from liquid fertilisers) for longer. Furthermore, the fertilisers tend not to run off into creeks and rivers, which improves their water quality. Of course, different soils react differently to applications of charcoal, but overwhelmingly the indications are that most soils benefit from it. A study published in 2007 in Nature indicates the immense capacity of pyrolysis to change our world. If the technology were applied vigorously in global agriculture, by 2030 humanity could be pulling nine gigatonnes of carbon per annum out of the atmosphere using pyrolysis machines. As already noted, the standing stock of carbon pollution in the atmosphere is roughly 200 gigatonnes. Nine gigatonnes represents around 5 per cent of this. If this is added to the carbon sequestered in tropical forests, it amounts to a mighty contribution to combating climate change — all told, between 7.5 and 10 per cent of the standing stock per annum. But pyrolysis offers even greater greenhouse benefits, for it greatly reduces the production of agricultural nitrous oxide, which is 270 times as powerful a greenhouse gas as C02. With so many benefits, why is pyrolysis not more widely utilised? Pyrolysis machines are expensive, and farms are mostly still family businesses. If farmers are ever to be able to afford these machines, they’ll need to be paid around US$37 per tonne for the carbon they create. They’ll also need to be living in areas with carbon-trading schemes that allow charcoal as a recognised method of carbon sequestration. The world’s rangelands are too dry, or the soils too poor, to support agriculture, yet they far exceed in extent the area of arable land. And today, the more marginal of the rangelands are also under threat of severe degradation through desertification and soil erosion, as we see in the Sahel and northern China. Such degradation results in the release of carbon from the soil. While estimates of the contribution such desertification makes to the atmospheric carbon flux are difficult to come by, it’s likely that it is considerable. For this reason, even small increases in the rate of soil carbon capture on the rangelands can have a big positive impact. If, for example, we were able to increase soil carbon in the world’s dry rangelands by a mere 2 per cent, it’s estimated that we
S O U T H E R N M I D L A N D S C O U N C I L C L I M A T E C H A N G E I N F O R M A T I O N 18
could pull down around 800 gigatonnes of carbon from the atmosphere. Of course, the soil carbon thus sequestered is volatile (likely to be lost again if erosion recommences), but this is still a valuable contribution.
4.2.1 Further information on pyrolysis: www.bestenergies.com
Nature, Vol 447 10 May 2007 – A handful of carbon
Nature, Vol 442 10 August 2006 – Black is the new green
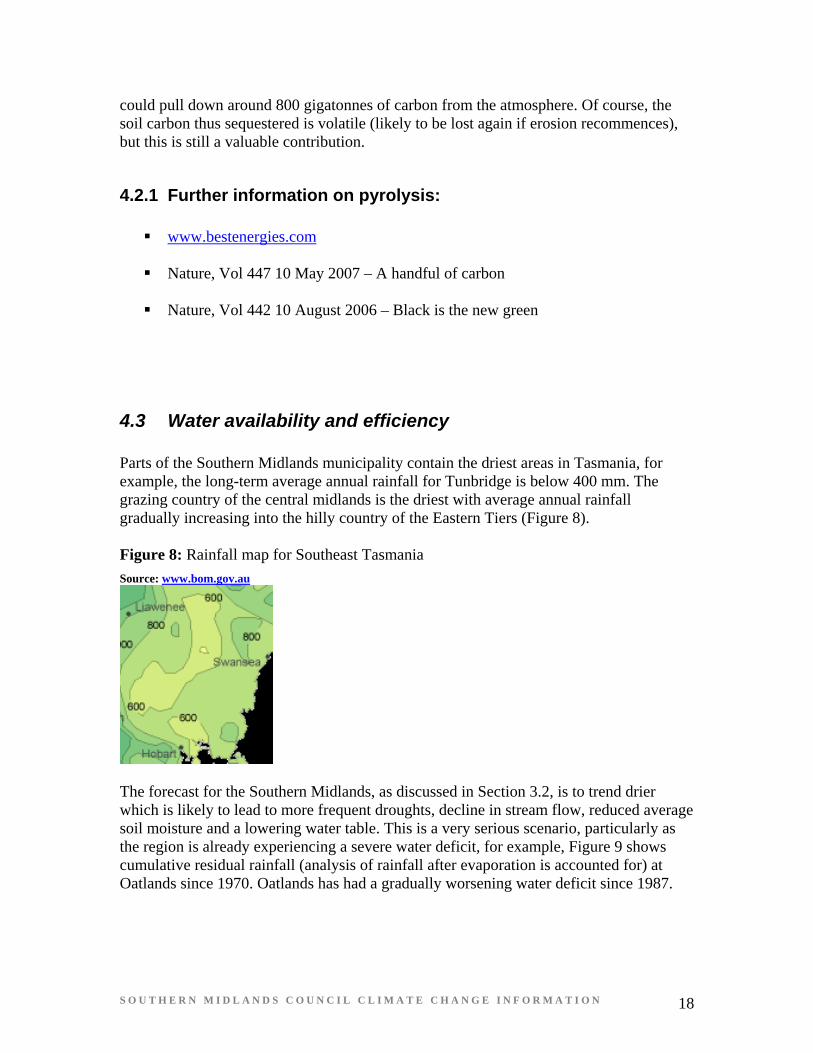
4.3 Water availability and efficiency Parts of the Southern Midlands municipality contain the driest areas in Tasmania, for example, the long-term average annual rainfall for Tunbridge is below 400 mm. The grazing country of the central midlands is the driest with average annual rainfall gradually increasing into the hilly country of the Eastern Tiers (Figure 8). Figure 8: Rainfall map for Southeast Tasmania
Source: www.bom.gov.au
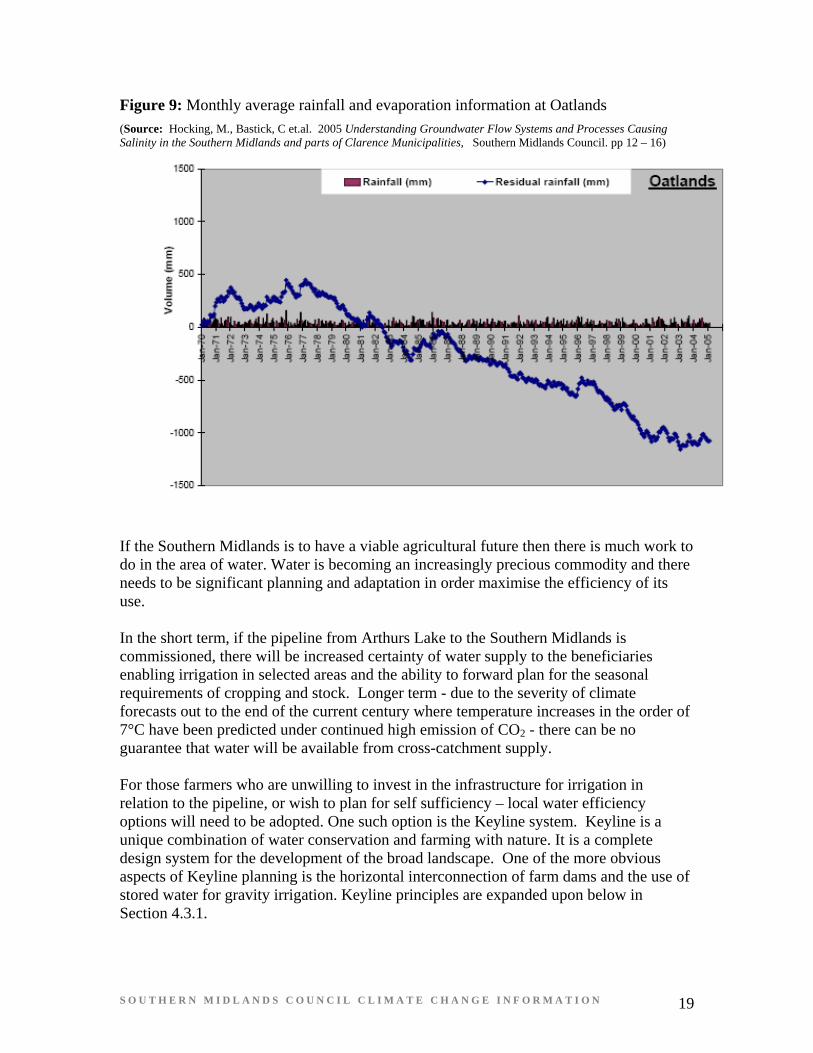
The forecast for the Southern Midlands, as discussed in Section 3.2, is to trend drier which is likely to lead to more frequent droughts, decline in stream flow, reduced average soil moisture and a lowering water table. This is a very serious scenario, particularly as the region is already experiencing a severe water deficit, for example, Figure 9 shows cumulative residual rainfall (analysis of rainfall after evaporation is accounted for) at Oatlands since 1970. Oatlands has had a gradually worsening water deficit since 1987.
S O U T H E R N M I D L A N D S C O U N C I L C L I M A T E C H A N G E I N F O R M A T I O N 19
Figure 9: Monthly average rainfall and evaporation information at Oatlands
(Source: Hocking, M., Bastick, C et.al. 2005 Understanding Groundwater Flow Systems and Processes Causing Salinity in the Southern Midlands and parts of Clarence Municipalities, Southern Midlands Council. pp 12 – 16)
If the Southern Midlands is to have a viable agricultural future then there is much work to do in the area of water. Water is becoming an increasingly precious commodity and there needs to be significant planning and adaptation in order maximise the efficiency of its use. In the short term, if the pipeline from Arthurs Lake to the Southern Midlands is commissioned, there will be increased certainty of water supply to the beneficiaries enabling irrigation in selected areas and the ability to forward plan for the seasonal requirements of cropping and stock. Longer term - due to the severity of climate forecasts out to the end of the current century where temperature increases in the order of 7°C have been predicted under continued high emission of CO2 - there can be no guarantee that water will be available from cross-catchment supply. For those farmers who are unwilling to invest in the infrastructure for irrigation in relation to the pipeline, or wish to plan for self sufficiency – local water efficiency options will need to be adopted. One such option is the Keyline system. Keyline is a unique combination of water conservation and farming with nature. It is a complete design system for the development of the broad landscape. One of the more obvious aspects of Keyline planning is the horizontal interconnection of farm dams and the use of stored water for gravity irrigation. Keyline principles are expanded upon below in Section 4.3.1.
S O U T H E R N M I D L A N D S C O U N C I L C L I M A T E C H A N G E I N F O R M A T I O N 20
4.3.1 Keyline systems Source: www.keyline.com.au One of the primary objectives of Keyline planning is to enhance the swift development of deep biologically fertile soil in a designed landscape. Keyline methods rapidly develop the biological fertility and structural stability of the soil and reduce water loss from the land. Keyline is the natural way to defeat the prospect of soil erosion and salinity as an incidental to total landscape improvement. The Keyline Plan is to prepare the land to quickly absorb, and hold by way of increased field capacity, increasing amounts of rainfall, and to store surplus run off water, where ever practical, in large, on farm storages each equipped with a 'Lockpipe System'. The Lockpipe System is a large pipeline positioned under the dam wall, which when opened, releases the water rapidly for use by gravity powered irrigation. Keyline irrigation is quick, not labour intensive and functions to enhance the development of deep, fertile soil. Keyline farming aims to increase the productivity of the soil to levels greater than were present before the land was farmed, to the point where the soil does not need or respond to chemically processed fertiliser. The emphasis is placed on improving soil and increasing soil organic matter by deep non-inversion tillage combined with cyclic high-density grazing. Keyline farming practices were first developed by Percival Yeomans in the early 1940s. His philosophy was that permanent agriculture must materially benefit the farmer, the land and the soil. Keyline planning
A keyline design is unique to each property and will be formed from evaluation of water movements over the land with the idea of controlling and making use of this resource in the management of the land. Water movement over the land and the land's features are directly related to each other, and water resources can only be used if they can be controlled. Other factors such as climate, geology and rainfall patterns originally determined the land's topography. Water is the main focus in keyline planning as this is one variable which is easily controlled and manipulated. Keyline cultivation
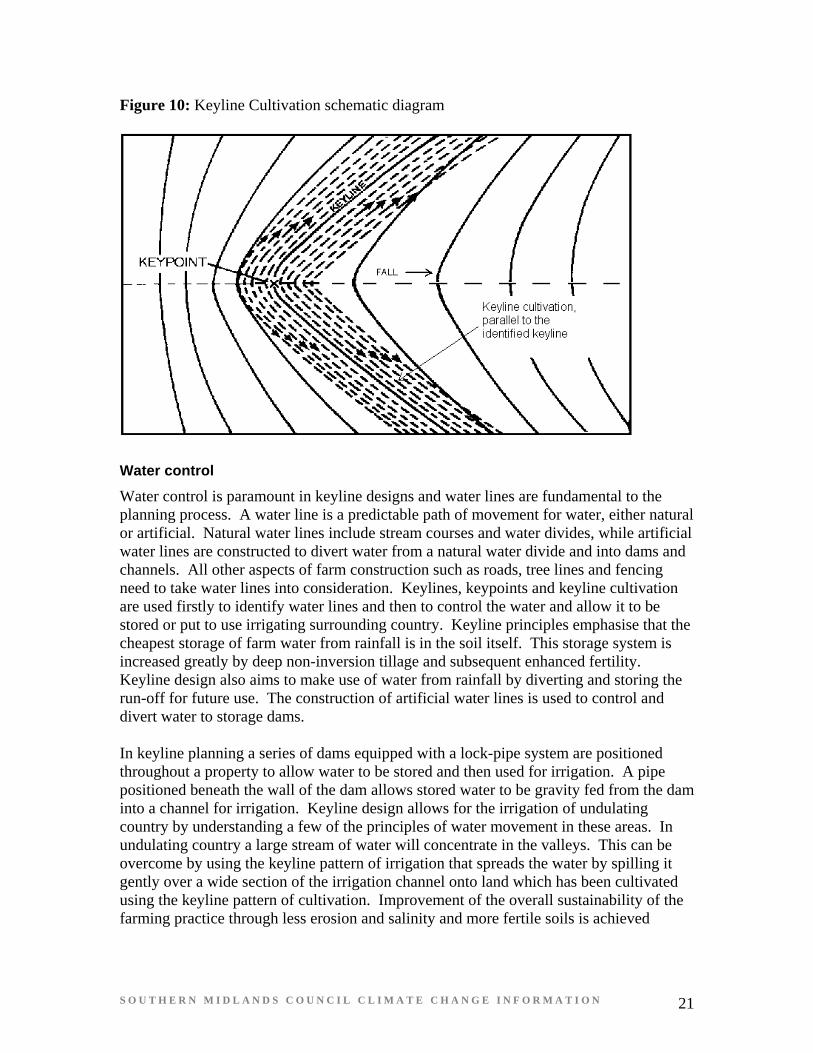
Once ‘keypoints’ and ‘keylines’ have been identified, the control of water movement over the land can be achieved through a keyline pattern of cultivation. Keyline cultivation aims to spread the run-off water away from the centre of the valley to minimise the flow concentration in this area (Figure 10). By cultivating parallel to identified keylines, both above and below the line, a cultivation pattern is developed which spreads the run-off evenly across the valley and does not allow the water to follow its natural path and concentrate in the valleys. This aids in the stabilisation of the valley and increases its ability to resist erosion and wash-outs.
S O U T H E R N M I D L A N D S C O U N C I L C L I M A T E C H A N G E I N F O R M A T I O N 21
Figure 10: Keyline Cultivation schematic diagram
Water control
Water control is paramount in keyline designs and water lines are fundamental to the planning process. A water line is a predictable path of movement for water, either natural or artificial. Natural water lines include stream courses and water divides, while artificial water lines are constructed to divert water from a natural water divide and into dams and channels. All other aspects of farm construction such as roads, tree lines and fencing need to take water lines into consideration. Keylines, keypoints and keyline cultivation are used firstly to identify water lines and then to control the water and allow it to be stored or put to use irrigating surrounding country. Keyline principles emphasise that the cheapest storage of farm water from rainfall is in the soil itself. This storage system is increased greatly by deep non-inversion tillage and subsequent enhanced fertility. Keyline design also aims to make use of water from rainfall by diverting and storing the run-off for future use. The construction of artificial water lines is used to control and divert water to storage dams. In keyline planning a series of dams equipped with a lock-pipe system are positioned throughout a property to allow water to be stored and then used for irrigation. A pipe positioned beneath the wall of the dam allows stored water to be gravity fed from the dam into a channel for irrigation. Keyline design allows for the irrigation of undulating country by understanding a few of the principles of water movement in these areas. In undulating country a large stream of water will concentrate in the valleys. This can be overcome by using the keyline pattern of irrigation that spreads the water by spilling it gently over a wide section of the irrigation channel onto land which has been cultivated using the keyline pattern of cultivation. Improvement of the overall sustainability of the farming practice through less erosion and salinity and more fertile soils is achieved
S O U T H E R N M I D L A N D S C O U N C I L C L I M A T E C H A N G E I N F O R M A T I O N 22
through the control and efficient use of water in a well-designed and planned layout of the property.
4.3.2 Further information on keyline systems Yeomans, K., Sustainable Agriculture: Water for Every Farm - Yeomans Keyline
Plan, Griffin Press, 1993.
www.yeomansplow.com.au
4.4 Benefits of renewable energy Many promising and viable renewable energy technologies have emerged that have the potential to almost entirely replace fossil fuel use within a decade given appropriate political leadership and targeted investment. Amongst these are: solar, solar thermal, geothermal and wind. As each year goes by it seems Tasmania is struggling more to meet its energy demands from the existing hydro electricity system, hence there is increasing urgency for localised electricity generation to loosen reliance on the burning of coal and gas and to provide a buffer against increasing energy costs, particularly with the advent of the carbon trading scheme. The technology for capturing solar energy at a domestic level through photovoltaic cells and solar hot water cylinders has been available in Australia for some time, however, enormous potential still remains for the uptake of this technology. There is no reason why almost every household in the country could not be a beneficiary of renewable energy at this scale. Domestic solar is also becoming an attractive financial option with rebates available for installation and the ongoing prospect of income generation through feed-in tariffs. Two areas of renewable energy that offer great promise to supply the bulk of the country’s base load power are geothermal and solar thermal. ‘Hot rocks’ suitable for the generation of geothermal energy have been located in eastern Tasmania and the Cooper Basin offers enormous potential to power the entire Australian economy for 75 years4. Solar thermal technology refers to the capture and utilisation of solar energy for use in heat or electricity production. Enormous potential exists to use solar thermal collectors to power steam turbines. Individuals and communities in the Tasmanian midlands are well placed to capitalise on renewable energy. One thing there is a great abundance of is sunshine and wind, and
4 Flannery, T. (2008) Now or Never, a Sustainable Future for Australia. Quarterly Essay issue 31.
S O U T H E R N M I D L A N D S C O U N C I L C L I M A T E C H A N G E I N F O R M A T I O N 23
there is no reason why the prosperity of the region could be reignited through uptake of these technologies at a domestic and community level. The case study presented below encapsulates neatly how a small community has taken up the challenge to concentrate the foundation of their economy on a range of renewable energies. It speaks of the challenges that were faced and the massive benefits they are now reaping due to the transformation away from fossil fuel dependency to being an exporter of renewable energy.
4.4.1 Renewable energy case study from the island of Samso, Denmark Source: The miraculous island of Samso. Robin McKie, The Observer, 21/9/2008 In the past 10 years, one Danish island has cut its carbon footprint by 140%. Now, with a simple grid of windfarms, solar panels and sheep, it's selling power to the mainland. Jorgen Tranberg looks a farmer to his roots: grubby blue overalls, crumpled T-shirt and crinkled, weather-beaten features. His laconic manner, blond hair and black clogs also reveal his Scandinavian origins. Jorgen farms at Norreskifte on Samso, a Danish island famed for its rich, sweet strawberries and delicately flavoured early potatoes. But Samso has recently undergone a remarkable transformation, one that has given it an unexpected global importance and international technological standing. Although members of a tightly knit, deeply conservative community, Samsingers have launched a renewable-energy revolution on this windswept scrap of Scandinavia. Solar, biomass, wind and wood-chip power generators have sprouted up across the island, while traditional fossil-fuel plants have been closed and dismantled. Nor was it hard to bring about these changes. 'For me, it has been a piece of cake,' says Jorgen. Nevertheless, the consequences have been dramatic. Ten years ago, islanders drew nearly all their energy from oil and petrol brought in by tankers and from coal-powered electricity transmitted to the island through a mainland cable link. Today that traffic in energy has been reversed. Samsingers now export millions of kilowatt hours of electricity from renewable energy sources to the rest of Denmark. In doing so, islanders have cut their carbon footprint by a staggering 140 per cent. And what Samso can do today, the rest of the world can achieve in the near future, it is claimed. Last year, carbon dioxide reached a record figure of 384 parts per million - a rise of around 35 per cent on levels that existed before the Industrial Revolution. The Intergovernmental Panel on Climate Change (IPCC) has warned that such changes could soon have a dramatic impact on the world's weather patterns. Already, Arctic sea ice is dwindling alarmingly and scientists say the world has only a few years left to make serious carbon-output cuts before irreversible, devastating climate change ensues. Samso suggests one route for avoiding such a fate.
S O U T H E R N M I D L A N D S C O U N C I L C L I M A T E C H A N G E I N F O R M A T I O N 24
Everywhere you travel on the island you see signs of change. There are dozens of wind turbines of various sizes dotted across the landscape, houses have solar-panelled roofs, while a long line of giant turbines off the island's southern tip swirl in the wind. Towns are linked to district heating systems that pump hot water to homes. These are either powered by rows of solar panels covering entire fields, or by generators which burn straw or timber chips from local farms. None of these enterprises has been imposed by outsiders or been funded by major energy companies. Each plant is owned either by a collective of local people or by an individual islander. The Samso revolution has been an exercise in self-determination - a process in which islanders have decided to demonstrate what can be done to alleviate climate damage while still maintaining a comfortable lifestyle. Consider Jorgen. As he wanders round his cowsheds, he scarcely looks like an energy entrepreneur. Yet the 47-year-old farmer is a true power broker. Apart from his fields of pumpkins and potatoes, as well as his 150 cows, he has erected a giant 1 megawatt (mw) wind turbine that looms down on his 120-hectare dairy farm. Four other great machines stand beside it, swirling in Samso's relentless winds. Each device is owned either by a neighbouring farmer or by a collective of locals. In addition, Jorgen has bought a half share in an even bigger, 2.3mw generator, one of the 10 devices that guard the south coast of Samso and now help to supply a sizeable chunk of Denmark's electricity. The people of Samso were once the producers of more than 45,000 tonnes of carbon dioxide every year - about 11 tonnes a head. Through projects like these, they have cut that figure to -15,000 tonnes. (The minus figure comes from the fact that Samsingers export their excess wind power to mainland Denmark, where it replaces electricity that would otherwise be generated using coal or gas). It is a remarkable transformation, wrought mainly by Samsingers themselves, albeit with the aid of some national and European Union funds and some generous, guaranteed fixed prices that Denmark provides for wind-derived electricity. The latter ensures turbines pay for themselves over a six- or seven-year period. After that, owners can expect to rake in some tidy profits. 'It has been a very good investment,' admits Jorgen. 'It has made my bank manager very happy. But none of us is in it just for the money. We are doing it because it is fun and it makes us feel good.' Nor do his efforts stop with his turbines. Jorgen recently redesigned his cowshed so it requires little straw for bedding for his cattle. Each animal now has its own natty mattress. Instead, most of the straw from Jorgen's fields is sold to his local district heating plant, further increasing his revenue and limiting carbon dioxide production. (Carbon dioxide is absorbed as crops grow in fields. When their stalks - straw - are burned, that carbon dioxide is released, but only as a gas that has been recycled within a single growing season. By contrast, oil, coal and gas are the remains of plants that are millions of years old and so, when burned, release carbon dioxide that had been sequestered aeons ago.)
S O U T H E R N M I D L A N D S C O U N C I L C L I M A T E C H A N G E I N F O R M A T I O N 25
Samso's transformation owes its origin to a 1997 experiment by the Danish government. Four islands, Laeso, Samso, Aero and Mon, as well as the region of Thyholm in Jutland, were each asked to compete in putting up the most convincing plan to cut their carbon outputs and boost their renewable-energy generation. Samso won.
Although it lies at the heart of Denmark, the nation's fractured geography also ensures the island is one of its most awkward places to reach, surrounded as it is by the Kattegat, an inlet of the North Sea. To get to Samso from Copenhagen, you have to travel by train for a couple of hours to Kalundborg and then take one of the twice daily ferries to Samso. A total of 4,100 people live here, working on farms or in hotels and restaurants. The place is isolated and compact and ideal for an experiment in community politics and energy engineering - particularly as it is low-lying and windswept.
The job of setting up the Samso experiment fell to Soren Harmensen, a former environmental studies teacher, with thinning greyish hair and an infectious enthusiasm for all things renewable. Soren is a proselytiser and proud of his island's success. However, achieving it was not an easy matter. It took endless meetings to get things started. Every time there was a community issue at stake, he would arrive and preach his sermon about renewable energy and its value to the island. Slowly, the idea took hold and eventually public meetings were held purely to discuss his energy schemes.
Eventually the first projects were launched, a couple of turbines on the west coast, and a district heating plant. 'Nothing was achieved without talk and a great deal of community involvement,' says Soren, a message he has since carried round the planet. 'I visited Shropshire recently,' he says. 'A wind-farm project there was causing a huge fuss, in particular among the three villages nearest the proposed site. The planners would soothe the objections of one village, only for the other two to get angry - so local officials would turn to them. Then the first village started to object all over again. The solution was simple, of course. Give each village a turbine, I told them. The prospect of cheap electricity would have changed everyone's minds.' Needless to say, this did not happen.
On another visit - this time to Islay, off the west coast of Scotland - Soren found similar problems. 'I was asked to attend a public meeting to debate the idea of turning the island into a renewable energy centre like Samso. But nearly all the speakers droned on about ideals and about climate change in general. But what people really want is to be involved themselves and to do something that can make a difference to the world. That point was entirely lost.
'Later I found that a local Islay distillery was installing a new set of boilers. Why not use the excess water to heat local homes, I suggested. That would be far too much bother, I was told. Yet that was just the kind of scheme that could kick-start a renewable-energy revolution.'
Of course, there is something irritating about this Scandinavian certainty. Not every community is as cohesive as Samso's, for one thing. And it should also be noted that the island's transformation has come at a price: roughly 420m kroner - about £40m - that includes money from the Danish government, the EU, local businessmen and individual members of collectives. Thus the Samso revolution cost around £10,000 per islander, although a good chunk has come from each person's own pockets. Nevertheless, if you
S O U T H E R N M I D L A N D S C O U N C I L C L I M A T E C H A N G E I N F O R M A T I O N 26
multiply that sum by 60m - the population of Great Britain - you get a figure of around £600bn as the cost of bringing a similar revolution to Britain. It is utterly impractical, of course - a point happily acknowledged by Soren.
'This is a pilot project to show the world what can be done. We are not suggesting everyone makes the sweeping changes that we have. People should cherry pick from what we have done in order to make modest, but still meaningful carbon emission cuts. The crucial point is that we have shown that if you want to change how we generate energy, you have to start at the community level and not impose technology on people. For example, Shell heard about what we were doing and asked to be involved - but only on condition they ended up owning the turbines. We told them to go away. We are a nation of farmers, of course. We believe in self-sufficiency.'
Jesper Kjems was a freelance journalist based in Copenhagen when he and his wife came to Samso for a holiday four years ago. They fell in love with the island and moved in a few months later, although neither had jobs. Jesper started playing in a local band and met Soren Harmensen, its bassist, who sold him the Samso energy dream. Today Jesper is official spokesman for the Samso project.
Outside the town of Nordby, he showed me round its district heating project. A field has been covered with solar panels mounted to face the sun. Cold water is pumped in at one end to emerge, even on a gloomy day, as seriously hot water - around 70C - which is then piped to local houses for heating and washing. On particularly dark, sunless days, the plant switches mode: wood chips are scooped by robot crane into a furnace which heats the plant's water instead. The entire system is completely automated. 'There are some living creatures involved, however,' adds Jesper. 'A flock of sheep is sent into the field every few days to nibble the grass before it grows long enough to prevent the sun's rays hitting the panels.'
Everywhere you go, you find renewable- energy enthusiasts like Jesper. Crucially, most of them are recent recruits to the cause. Nor do planning rows concerning the sight of 'eyesore' wind turbines affect Samsingers as they do Britons. 'No one minds wind turbines on Samso for the simple reason that we all own a share of one,' says electrician Brian Kjar.
And that is the real lesson from Samso. What has happened here is a social not a technological revolution. Indeed, it was a specific requirement of the scheme, when established, that only existing, off-the-shelf renewable technology be used. The real changes have been those in attitude. Brian's house near the southern town of Orby reveals the consequences. He has his own wind turbine, which he bought second-hand for £16,000 - about a fifth of its original price. This produces more electricity than his household needs, so he uses the excess to heat water that he keeps in a huge insulated tank that he also built himself. On Samso's occasional windless days, this provides heating for his home when the 70ft turbine outside his house is not moving.
'Everyone knows someone who is interested in renewable energy today,' he adds. 'Something like this starts with a few people. It just needs time to spread. That is the real lesson of Samso.'