Embed Size (px)
Citation preview
This article was downloaded by: [Julia Jones]On: 21 June 2013, At: 11:37Publisher: Taylor & FrancisInforma Ltd Registered in England and Wales Registered Number: 1072954 Registered office: Mortimer House,37-41 Mortimer Street, London W1T 3JH, UK
Atmosphere-OceanPublication details, including instructions for authors and subscription information:http://www.tandfonline.com/loi/tato20
Climate and Streamflow Trends in the ColumbiaRiver Basin: Evidence for Ecological and EngineeringResilience to Climate ChangeKendra L. Hatcher a & Julia A. Jones aa Geography Program, College of Earth, Ocean, and Atmospheric Sciences , Oregon StateUniversity , Corvallis , Oregon , USAPublished online: 20 Jun 2013.
To cite this article: Kendra L. Hatcher & Julia A. Jones (2013): Climate and Streamflow Trends in the ColumbiaRiver Basin: Evidence for Ecological and Engineering Resilience to Climate Change, Atmosphere-Ocean,DOI:10.1080/07055900.2013.808167
To link to this article: http://dx.doi.org/10.1080/07055900.2013.808167
PLEASE SCROLL DOWN FOR ARTICLE
Full terms and conditions of use: http://www.tandfonline.com/page/terms-and-conditions
This article may be used for research, teaching, and private study purposes. Any substantial or systematicreproduction, redistribution, reselling, loan, sub-licensing, systematic supply, or distribution in any form toanyone is expressly forbidden.
The publisher does not give any warranty express or implied or make any representation that the contentswill be complete or accurate or up to date. The accuracy of any instructions, formulae, and drug doses shouldbe independently verified with primary sources. The publisher shall not be liable for any loss, actions, claims,proceedings, demand, or costs or damages whatsoever or howsoever caused arising directly or indirectly inconnection with or arising out of the use of this material.
Climate and Streamflow Trends in the Columbia River Basin:Evidence for Ecological and Engineering Resilience to Climate
Change
Kendra L. Hatcher and Julia A. Jones*
Geography Program, College of Earth, Ocean, and Atmospheric Sciences, Oregon State University,Corvallis, Oregon, USA
[Original manuscript received 19 February 2012; accepted 2 March 2013]
ABSTRACT Large river basins transfer the water signal from the atmosphere to the ocean. Climate change iswidely expected to alter streamflow and potentially disrupt water management systems. We tested the ecologicalresilience—capacity of headwater ecosystems to sustain streamflow under climate change—and the engineeringresilience—capacity of dam and reservoir management to overprint a climate change signal—in sevensub-basins of the Columbia River from 1950 to 2011. Sub-basins had a headwater gauge above dams with along-term streamflow record and a nearby climate station with a long-term record of air temperature andprecipitation, as well as matching long-term streamflow records at gauges downstream of dams. Trends werefitted to daily data for maximum and minimum temperature, precipitation, and streamflow over the period ofrecord (mostly 1950–2011). Consistent with predicted streamflow response to climate warming, annual snowmeltrunoff peaks in five of seven headwater basins shifted to a few days earlier over the period 1950 to 2010, but thechanges were small, displaying ecological resilience. Below dams, streamflow change was attributable to reservoiroperation for flood control (reduced annual peak flows) and irrigation (augmented late summer low flows), as wellas flow management for hydropower, navigation, and recreation, but predicted streamflow responses to climatechange were absent, indicating engineering resilience. Thus, to date, climate-warming effects on streamflowhave been limited to headwaters, and flow regulation has obscured the expression of climate change on streamflowbelow dams in the Columbia River basin.
RÉSUMÉ [Traduit par la rédaction] Les grands bassins fluviaux transfèrent le signal d’eau de l’atmosphère àl’océan. De manière générale, on s’attend à ce que le changement climatique modifie l’écoulement fluvial etpossiblement perturbe les systèmes de gestion d’eau. Nous avons étudié la résilience écologique — la capacitédes écosystèmes des cours supérieurs des rivières de maintenir l’écoulement fluvial dans le contexte d’unchangement climatique — et la résilience des ouvrages hydrauliques — la capacité de la gestion des barrageset des réservoirs à compenser un signal de changement climatique — dans sept sous-bassins du fleuve Columbiade 1950 à 2011. Les sous-bassins avaient une jauge de niveau en amont des barrages avec des enregistrementsd’écoulement à long terme, une station climatologique à proximité avec des enregistrements de température etde précipitations à long terme ainsi que, en aval des barrages, des enregistrements à long terme correspondantsd’écoulement à des jauges de niveau. Les tendances ont été ajustées en fonction des données quotidiennes detempératures maximale et minimale, de précipitations et d’écoulement fluvial pour la période des enregistrements(principalement 1950–2011). Conformément à la réponse prévue de l’écoulement fluvial au réchauffementclimatique, les pointes annuelles de ruissellement d’eau de fonte dans cinq des sept bassins supérieurs se sontdéplacées quelques jours plus tôt au cours de la période 1950–2010, mais les changements étaient petits, ce quitémoigne d’une résilience écologique. En aval des barrages, le changement d’écoulement fluvial était attribuableà l’utilisation des réservoirs pour la protection contre les crues (débits de pointe annuels réduits) et l’irrigation(débits d’étiage de fin d’été augmentés) de même qu’à la gestion de l’écoulement pour les besoins de l’énergiehydroélectrique, de la navigation et des activités récréatives, mais les réponses prévues des écoulements fluviauxau changement climatique étaient absentes, ce qui indique une résilience des ouvrages hydrauliques. Donc, jusqu’àmaintenant, les effets du réchauffement climatique sur l’écoulement fluvial se sont limités aux cours supérieurs desrivières et la gestion de l’écoulement a masqué l’empreinte du changement climatique sur l’écoulement fluvial enaval des barrages dans le bassin du fleuve Columbia.
KEYWORDS climate change; streamflow; regional; statistical; observational
*Corresponding author’s email: [email protected]
ATMOSPHERE-OCEAN iFirst article, 2013, 1–20 http://dx.doi.org/10.1080/07055900.2013.808167Canadian Meteorological and Oceanographic Society
Dow
nloa
ded
by [
Julia
Jon
es]
at 1
1:37
21
June
201
3
1 IntroductionClimate change is widely expected to alter streamflow andpotentially disrupt water management systems. Increasedtemperature throughout the region (Littell et al., 2011) isassociated with declining snow water equivalent in much ofthe Pacific Northwest (Hamlet, Mote, Clark, & Lettenmaier,2005; Knowles, Dettinger, & Cayan, 2006; Mote, 2003).Warming and earlier snowmelt are associated with earlieronset of snowmelt runoff in spring (Cayan, Kammerdiener,Dettinger, Caprio, & Peterson, 2001; Nayak, Marks, Chandler,& Seyfried, 2010; Stewart, Cayan, & Dettinger, 2005), whichin turn is expected to reduce late summer streamflow (Barnettet al., 2008; Mote et al., 2003), increasing streamflow variabil-ity (Karl, Melillo, & Peterson, 2009). Hydrologic models indi-cate that climate change has altered snowmelt timing andintensified late summer drought in the Pacific Northwest(Hamlet et al., 2005; Hamlet & Lettenmaier, 2007; Lutz,Hamlet, & Littell, 2012), and trends in monthly flow from1958 to 2008 for 68 streams in the Pacific Northwest are con-sistent with these predictions (Chang, Jung, Steele, & Gannett,2012). Since 1948, streamflow in low flow years has declinedsignificantly in the Pacific Northwest (Luce & Holden, 2009),and the centre of timing of river flows shifted earlier over theperiod 1950 to 2000 in the Columbia River basin (Barnettet al., 2008). Climate change models predict continuedwarming with little change in precipitation in the PacificNorthwest (Lutz et al., 2012; Mote & Salathé, 2010). Theseobserved and anticipated future trends suggest that water man-agers may face intensified conflicts among alternative wateruses, especially in late summer.However, two important sets of processes may mitigate
these effects on water availability induced by climatechange. Headwater ecosystems in the Columbia River basinare dominated by conifer forests which are adapted tosummer drought and capable of reducing transpiration inresponse to elevated temperature. Conifers may also exploitearlier snowmelt to initiate transpiration and photosynthesisearlier in the year. These mechanisms may confer ecologicalresilience to climate change in headwater basins, which wedefine as the capacity of headwater ecosystems to sustainamount, timing, and variability of streamflow despiteclimate warming. This definition follows Holling (1973),who defined resilience as the amount of disturbance asystem can absorb and still remain in the same state. Holling(1996) included persistence, change, and unpredictability inhis concept of ecological resilience; Folke (2003) emphasizedthat the complete hydrologic cycle in headwaters is fundamen-tal to ecosystem resilience.Since 1900 more than 2,000 dams have been constructed in
the Pacific Northwest, and reservoir operations for floodcontrol, irrigation, recreation, hydropower, and other benefitshave significantly altered streamflow signals throughoutmost of the network. Dam construction in the United Statesin the last century produced a nearly linear increase in thecumulative volume of reservoir storage capacity to itspresent level, equivalent to 35% of the mean annual flow in
the Pacific Northwest region (Graf, 1999, 2006). Reservoiroperations designed to diminish winter or spring peakflows may counteract or obscure a climate-induced shift toearlier streamflow, and reservoir operations to store andrelease water for late summer low flow augmentationwould tend to have the opposite effect of climate-inducedhydrologic drought. In large river basins such as theColumbia River, these mechanisms may confer engineeringresilience to climate change, which we define as the capacityof engineered water management system operations tomitigate or overwhelm trends in streamflow induced byclimate change. This definition follows Holling (1996),who characterized engineering resilience as focusing onefficiency, constancy, and predictability.
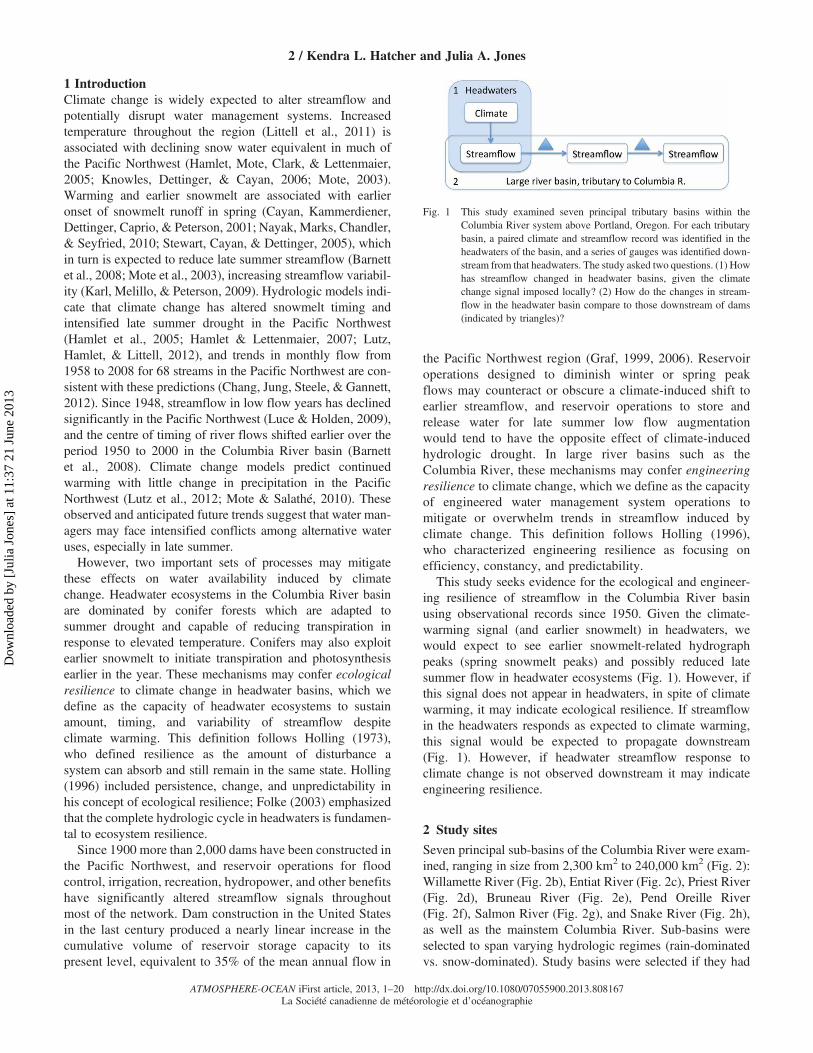
This study seeks evidence for the ecological and engineer-ing resilience of streamflow in the Columbia River basinusing observational records since 1950. Given the climate-warming signal (and earlier snowmelt) in headwaters, wewould expect to see earlier snowmelt-related hydrographpeaks (spring snowmelt peaks) and possibly reduced latesummer flow in headwater ecosystems (Fig. 1). However, ifthis signal does not appear in headwaters, in spite of climatewarming, it may indicate ecological resilience. If streamflowin the headwaters responds as expected to climate warming,this signal would be expected to propagate downstream(Fig. 1). However, if headwater streamflow response toclimate change is not observed downstream it may indicateengineering resilience.
2 Study sites
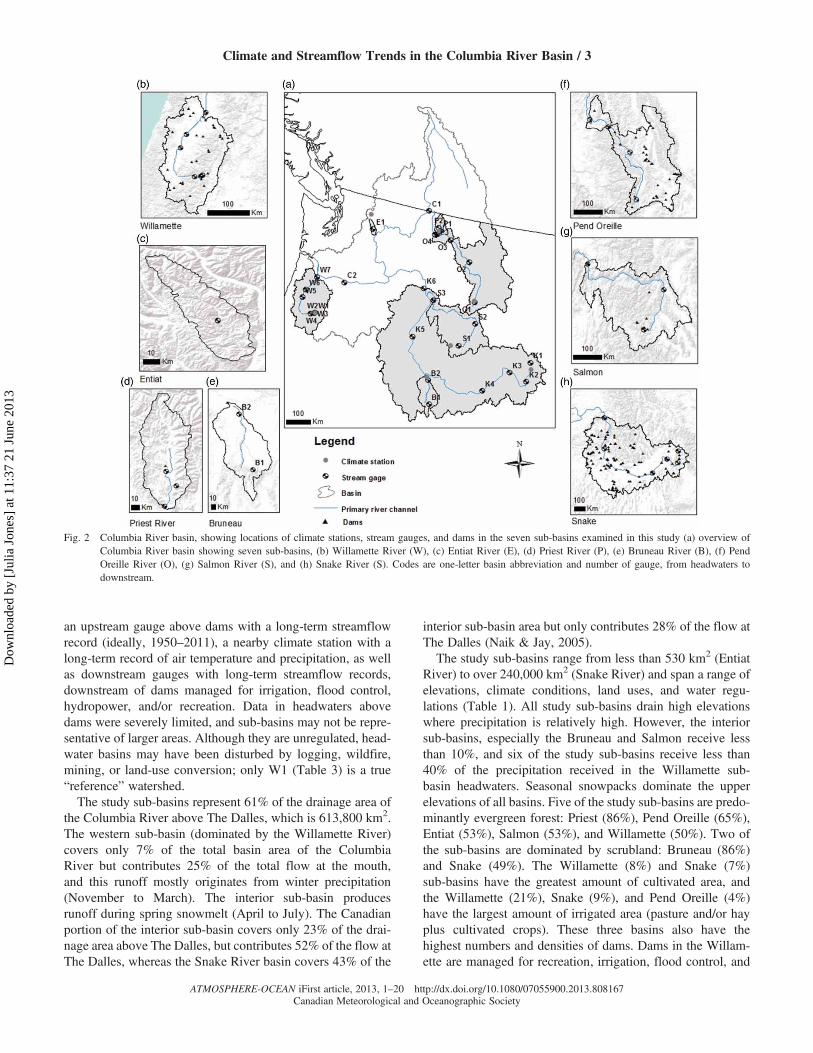
Seven principal sub-basins of the Columbia River were exam-ined, ranging in size from 2,300 km2 to 240,000 km2 (Fig. 2):Willamette River (Fig. 2b), Entiat River (Fig. 2c), Priest River(Fig. 2d), Bruneau River (Fig. 2e), Pend Oreille River(Fig. 2f), Salmon River (Fig. 2g), and Snake River (Fig. 2h),as well as the mainstem Columbia River. Sub-basins wereselected to span varying hydrologic regimes (rain-dominatedvs. snow-dominated). Study basins were selected if they had
Fig. 1 This study examined seven principal tributary basins within theColumbia River system above Portland, Oregon. For each tributarybasin, a paired climate and streamflow record was identified in theheadwaters of the basin, and a series of gauges was identified down-stream from that headwaters. The study asked two questions. (1) Howhas streamflow changed in headwater basins, given the climatechange signal imposed locally? (2) How do the changes in stream-flow in the headwater basin compare to those downstream of dams(indicated by triangles)?
2 / Kendra L. Hatcher and Julia A. Jones
ATMOSPHERE-OCEAN iFirst article, 2013, 1–20 http://dx.doi.org/10.1080/07055900.2013.808167La Société canadienne de météorologie et d’océanographie
Dow
nloa
ded
by [
Julia
Jon
es]
at 1
1:37
21
June
201
3
an upstream gauge above dams with a long-term streamflowrecord (ideally, 1950–2011), a nearby climate station with along-term record of air temperature and precipitation, as wellas downstream gauges with long-term streamflow records,downstream of dams managed for irrigation, flood control,hydropower, and/or recreation. Data in headwaters abovedams were severely limited, and sub-basins may not be repre-sentative of larger areas. Although they are unregulated, head-water basins may have been disturbed by logging, wildfire,mining, or land-use conversion; only W1 (Table 3) is a true“reference” watershed.The study sub-basins represent 61% of the drainage area of
the Columbia River above The Dalles, which is 613,800 km2.The western sub-basin (dominated by the Willamette River)covers only 7% of the total basin area of the ColumbiaRiver but contributes 25% of the total flow at the mouth,and this runoff mostly originates from winter precipitation(November to March). The interior sub-basin producesrunoff during spring snowmelt (April to July). The Canadianportion of the interior sub-basin covers only 23% of the drai-nage area above The Dalles, but contributes 52% of the flow atThe Dalles, whereas the Snake River basin covers 43% of the
interior sub-basin area but only contributes 28% of the flow atThe Dalles (Naik & Jay, 2005).
The study sub-basins range from less than 530 km2 (EntiatRiver) to over 240,000 km2 (Snake River) and span a range ofelevations, climate conditions, land uses, and water regu-lations (Table 1). All study sub-basins drain high elevationswhere precipitation is relatively high. However, the interiorsub-basins, especially the Bruneau and Salmon receive lessthan 10%, and six of the study sub-basins receive less than40% of the precipitation received in the Willamette sub-basin headwaters. Seasonal snowpacks dominate the upperelevations of all basins. Five of the study sub-basins are predo-minantly evergreen forest: Priest (86%), Pend Oreille (65%),Entiat (53%), Salmon (53%), and Willamette (50%). Two ofthe sub-basins are dominated by scrubland: Bruneau (86%)and Snake (49%). The Willamette (8%) and Snake (7%)sub-basins have the greatest amount of cultivated area, andthe Willamette (21%), Snake (9%), and Pend Oreille (4%)have the largest amount of irrigated area (pasture and/or hayplus cultivated crops). These three basins also have thehighest numbers and densities of dams. Dams in the Willam-ette are managed for recreation, irrigation, flood control, and
Fig. 2 Columbia River basin, showing locations of climate stations, stream gauges, and dams in the seven sub-basins examined in this study (a) overview ofColumbia River basin showing seven sub-basins, (b) Willamette River (W), (c) Entiat River (E), (d) Priest River (P), (e) Bruneau River (B), (f) PendOreille River (O), (g) Salmon River (S), and (h) Snake River (S). Codes are one-letter basin abbreviation and number of gauge, from headwaters todownstream.
Climate and Streamflow Trends in the Columbia River Basin / 3
ATMOSPHERE-OCEAN iFirst article, 2013, 1–20 http://dx.doi.org/10.1080/07055900.2013.808167Canadian Meteorological and Oceanographic Society
Dow
nloa
ded
by [
Julia
Jon
es]
at 1
1:37
21
June
201
3
hydropower, whereas dams on the Snake and Pend Oreille arepredominantly managed for irrigation (Table 1).
3 Methods
In each sub-basin a headwater basin record was identified foran unregulated (but not necessarily undisturbed) basin. A dailyclimate station record was identified as near as possible to theheadwaters basin (grey dots in Fig. 2); these records exceeded50 years (Table 2). Streamflow records were obtained from theheadwater basin and gauges at successive downstream points(Table 3, Fig. 3). Most of these records exceeded 50 years. Ofseven headwater basins, four had climate records of 60 years,two had records of 48 years, and one had a record of 41 years(Table 2). Of 28 stream gauges, 12 had records longer than 60years, 10 had records longer than 50 years, one had a recordlonger than 40 years, three had records longer than 30 years,one had a record longer than 20 years, and one had a recordlonger than 10 years (Table 3).Trends in maximum and minimum temperature (T), pre-
cipitation (P), and streamflow (Q) for each day of the yearover the period of record were determined using linearregression. Streamflow and precipitation data were log-transformed prior to analysis. Days with zero precipitationwere replaced with 0.0001 mm prior to log transformation.Trends were calculated for absolute flow and for relativeflow (daily flow as a fraction of annual flow) for each day.A 95% confidence interval was constructed around theregression slope for each day; slopes falling above the confi-dence interval were considered to be significant positive
trends, while slopes falling below the confidence intervalwere considered to be significant negative trends. Hovmöllerplots (Hovmöller, 1949) were created for original and log-transformed data and examined to visually discriminatelong-term trends from cyclical or short-term patterns. Ana-lyses were conducted in MATLAB.
The 95% confidence interval balances type I errors (accept-ing a false positive) with type II errors (incorrectly acceptingthe null hypothesis). For these data, there may be more typeI errors because separate linear regressions on each day ofthe year may not be independent or might be considered mul-tiple comparisons; in both cases this would argue for the use ofa smaller confidence interval to protect against type I errors.However, the type II error of a test depends not only onsample size (power) but also on how data transformationaffects the change being examined. Log-transformation of pre-cipitation and discharge data effectively magnifies the smallvalues (i.e., low precipitation, low flows) and diminishes thelarge values (i.e., high precipitation, peak flows), thus increas-ing the probability of a type II error (failing to detect a changethat occurred) for days with high and variable precipitation (orstreamflow). Further discussion of type I and type II errors instreamflow statistical analysis can be found in Jones and Grant(1996), Thomas and Megahan (1998), Jones and Grant (2001),and Thomas and Megahan (2001).
For each day of the year, we evaluated statistical signifi-cance (p less than some critical value) and practical signifi-cance (magnitude of change) of the trend over time (Ramsay& Schaefer, 1996). Because of interannual variability, trendsin high flows may be “practically significant” even if they
Table 1. Key characteristics of sub-basins of the Columbia River examined in this study.
Bruneau Entiat Pend Oreille Priest Salmon Snake Willamette
Area (km2) 7000 530 62700 2300 34800 240800 29000Elevation (m)Minimum 750 183 628 632 487 300 20Maximum 3221 2743 3186 2158 3485 3668 3106
Climate station 771 387 1183 725 1908 2072 485Temperature (°C)a
Minimum 4 3 0 0 −8 −6 5Maximum 17 15 15 13 11 10 14
Precipitation (mm) 181 853 371 811 181 603 2250% of total areab
Evergreen forest 0 53 65 86 53 23 50Shrub/scrub 86 31 15 6 27 49 11Grass/herb 9 10 10 2 17 14 4Pasture/hay 0 0 3 0 1 2 13Developed 0 2 1 0 0 0 4Crops 1 0 1 0 0 7 8
Damsc
Number of dams 1 0 50 1 12 126 33Damsd/1000 km2 0.14 0.00 0.80 0.43 0.34 0.52 1.14Earliest dam 1952 — 1897 1978 1935 1901 1911Latest dam — — 1996 — 1994 1998 1975
Predominant usese Hydro, Rec,Irrigation
— Irrigation (34), Rec (19),Hydro (10)
Hydro,Rec
Tailings(9)
Irrigation (84), Hydro(31), Rec (31)
Rec (16), Irrigation (13), Flood(11), Hydro (9)
aClimate data are from climate stations with long records, but not all these climate stations are in headwater or high-elevation locations. See Table 2.bPercentage of area in major land cover classes; classes for which no basin had more than 2% cover are omitted, so percentages may not sum to 100.cFrom headwaters to downstream gauge in this study. The dam listed for the Bruneau River is on the Snake River, but backs up the Bruneau River.dNumber of dams along the mainstem divided by the total area of the basin.eAll uses counted; some dams operated for multiple purposes.
4 / Kendra L. Hatcher and Julia A. Jones
ATMOSPHERE-OCEAN iFirst article, 2013, 1–20 http://dx.doi.org/10.1080/07055900.2013.808167La Société canadienne de météorologie et d’océanographie
Dow
nloa
ded
by [
Julia
Jon
es]
at 1
1:37
21
June
201
3
were not statistically significant. Conversely, trends in low-flows, which have low interannual variability, may be statisti-cally significant, but their practical significance may bedebatable. To test for type II errors, we calculated the differ-ence in mean daily precipitation and temperature (andmedian streamflow) between the first and last decades of therecord. This is a measure of “practical significance” of thechange (see grey and black lines in Figs 4 to 11). For eachday, we plotted this change as a function of the mean (for T,P) or median (Q) value for the entire period of record (Figs4 to 11). We evaluated whether this difference was statisticallysignificant using the linear regression approach (see grey andblack dots, and grey and black x’s in Figs 4 to 11). Moreover,
we evaluated shifts in runoff timing based on the means andmedians plots (Figs 4 to 11).
We analyzed trends for each day of the year, rather thanusing data that had been smoothed or aggregated intocoarser time intervals (e.g., months). Smoothing the datawith a running mean would introduce (more) autocorrelationin the data. Grouping data by arbitrary units (months) obscuresshifts in the timing of streamflow that are less than one month.Results were interpreted by examining groups of multiple dayswith significant changes to avoid inferring trends on daysaffected by a recent flood.
We conducted a linear regression of appropriately trans-formed data rather than the nonparametric Mann-Kendall
Table 2. Climate station elevation and record length in headwaters of seven sub-basins of the Columbia River.
Watershed Climate Station Name Elevation (m) Start End Source
Bruneau Bruneau 771 1962 2010 NOAAEntiat STEHEKIN 4 NW, WA (458059) 387 1950 2010 USHCNSnake Moran 2072 1950 2010 USHCNPend Oreille Darby 1183 1950 2010 NOAAPriest Priest River Ex Station 725 1950 2010 USHCNSalmon Stanley 1908 1962 2003 NOAAWillamette CS2MET 485 1958 2006 ClimDB/HydroDB
Table 3. Basin size and record length for gauges in seven sub-basins of the Columbia River in this study.
Stream gauge Code Size (km2) Start End Source Q (mm) P (mm)
Bruneau RiverUSGS 13162225 Jarbidge RV blw Jarbidge, NV B1 80 1998 2010 USGS 380 192USGS 13168500 Bruneau River near Hot Spring, ID B2 7000 1950 2011 USGS 47 —
Entiat RiverUSGS 12452800 Entiat River near Ardenvoir, WA E1 530 1957 2011 USGS 637 898
Snake RiverUSGS 13010065 Snake River Ab Jackson Lake at Flagg Ranch, WY K1 1300 1984 2011 USGS 634 610USGS 13018750 Snake River Bl Flat Creek near Jackson, WY K2 6800 1976 2011 USGS 476 —
USGS 13037500 Snake River near Heise, ID K3 14,900 1950 2011 USGS 424 —
USGS 13077000 Snake River at Neeley, ID K4 35,200 1950 2011 USGS 191 —
USGS 13269000 Snake River at Weiser, ID K5 179,200 1950 2011 USGS 89 —
USGS 13334300 Snake River near Anatone, WA K6 240,800 1958 2011 USGS 129 —
Pend Oreille RiverUSGS 12344000 Bitterroot River near Darby, MT O1 2700 1950 2011 USGS 291 396USGS 12389000 Clark Fork near Plains, MT O2 51,700 1950 2011 USGS 344 —
USGS 12392000 Clark Fork at Whitehorse Rapids near Cabinet, ID O3 57,200 1953 2009 USGS 356 —
USGS 12395500 Pend Oreille River at Newport, WA O4 62,700 1953 2011 USGS 368 —
Priest RiverBenton Dam at Priest River EF P1 4 1955 2008 Priest R EF 444 816USGS 12394000 Priest River near Coolin, ID P2 1600 1950 2006 USGS 724 —
USGS 12395000 Priest River near Priest River, ID P3 2300 1950 2011 USGS 653 —
Salmon RiverUSGS 13297330 Thompson Creek near Clayton, ID S1 80 1973 2011 USGS 200 190USGS 13302500 Salmon River at Salmon, ID S2 9700 1950 2011 USGS 183 —
USGS 13317000 Salmon River at White Bird, ID S3 34,800 1950 2011 USGS 295 —
Willamette RiverWS2 W1 0.6 1953 2008 ClimDB 1337 2261Lookout Creek W2 60 1950 2008 ClimDB 1722 —
USGS 14162200 Blue River at Blue River, OR W3 230 1967 2011 USGS 1802 —
USGS 14162500 Mckenzie River near Vida, OR W4 2400 1950 2011 USGS 1561 —
USGS 14174000 Willamette River at Albany, OR W5 12,500 1950 2009 USGS 1039 —
USGS 14191000 Willamette River at Salem, OR W6 19,000 1950 2009 USGS 1131 —
USGS 14211720 Willamette River at Portland, OR W7 29,000 1973 2011 USGS 1035 —
Columbia River mainstemUSGS 12399500 Columbia River at International Boundary C1 154,600 1950 2011 USGS 583 —
USGS 14105700 Columbia River at The Dalles, OR C2 613,800 1950 2011 USGS 270 —
Climate and Streamflow Trends in the Columbia River Basin / 5
ATMOSPHERE-OCEAN iFirst article, 2013, 1–20 http://dx.doi.org/10.1080/07055900.2013.808167Canadian Meteorological and Oceanographic Society
Dow
nloa
ded
by [
Julia
Jon
es]
at 1
1:37
21
June
201
3
test recommended for analysis of trends in precipitation andstreamflow (Helsel, Mueller, & Slack, 2005; Helsel &Hirsch, 1992). Linear regression and Mann-Kendall testsproduced virtually identical results for 280 datasets of stream-flow from headwater basins (Hatcher, 2011).
Autocorrelation was tested before and after trend analysis.Each day of data for which a trend analysis was conductedwas tested for year-to-year autocorrelation at lags up to tenyears. Of the possible 3650 significant autocorrelations ineach dataset (365 days × 10 1-day lags), autocorrelation was
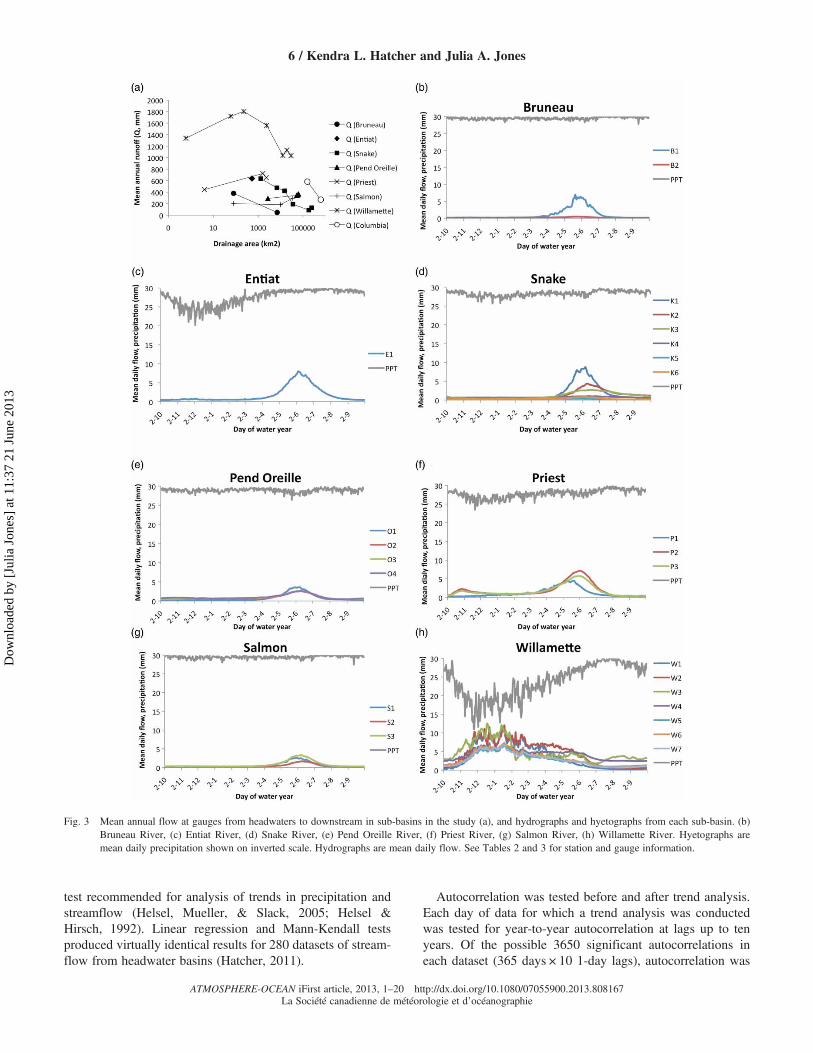
Fig. 3 Mean annual flow at gauges from headwaters to downstream in sub-basins in the study (a), and hydrographs and hyetographs from each sub-basin. (b)Bruneau River, (c) Entiat River, (d) Snake River, (e) Pend Oreille River, (f) Priest River, (g) Salmon River, (h) Willamette River. Hyetographs aremean daily precipitation shown on inverted scale. Hydrographs are mean daily flow. See Tables 2 and 3 for station and gauge information.
6 / Kendra L. Hatcher and Julia A. Jones
ATMOSPHERE-OCEAN iFirst article, 2013, 1–20 http://dx.doi.org/10.1080/07055900.2013.808167La Société canadienne de météorologie et d’océanographie
Dow
nloa
ded
by [
Julia
Jon
es]
at 1
1:37
21
June
201
3
present in 0 to 12% of the 28 streamflow records tested, with amean of 2.3%. Residuals of each daily regression were alsotested for autocorrelation, which was present in 0 to 6% ofthe 28 streamflow records, with a mean of 1.8%.Land-cover types, elevation, and dams were documented
for each basin. Watershed boundaries were taken fromUnited States Geological Survey data (USGS, 2012a),edited to include only the area upstream of the most down-stream stream gauge. Land cover was taken from the 2006National Land Cover Database, which has 30 m resolutionand 16 land-cover classes (USGS, 2012b). Elevation wasdetermined from 1 km Global 30 Arc Second (GTOPO30)digital elevation models (DEM) (USGS, 2012c). Data ondams were from the Major Dams of the United States
dataset created by the National Atlas (US Department ofthe Interior, 2012).
4 Results
Irrespective of basin area, streamflow is highest in the western(Willamette) and lowest in the eastern (Bruneau, Snake, PendOreille, Salmon) sub-basins (Fig. 3a). Precipitation is concen-trated in the early part of the water year (November–January)at the Entiat, Priest, and Willamette sub-basins but relativelyevenly distributed throughout the year at the other sub-basins (Figs 3b to 3g). Seasonal snowpack accumulation andmelt delays peak annual flows to May or June at all sub-basins except the Willamette, where peak annual flows
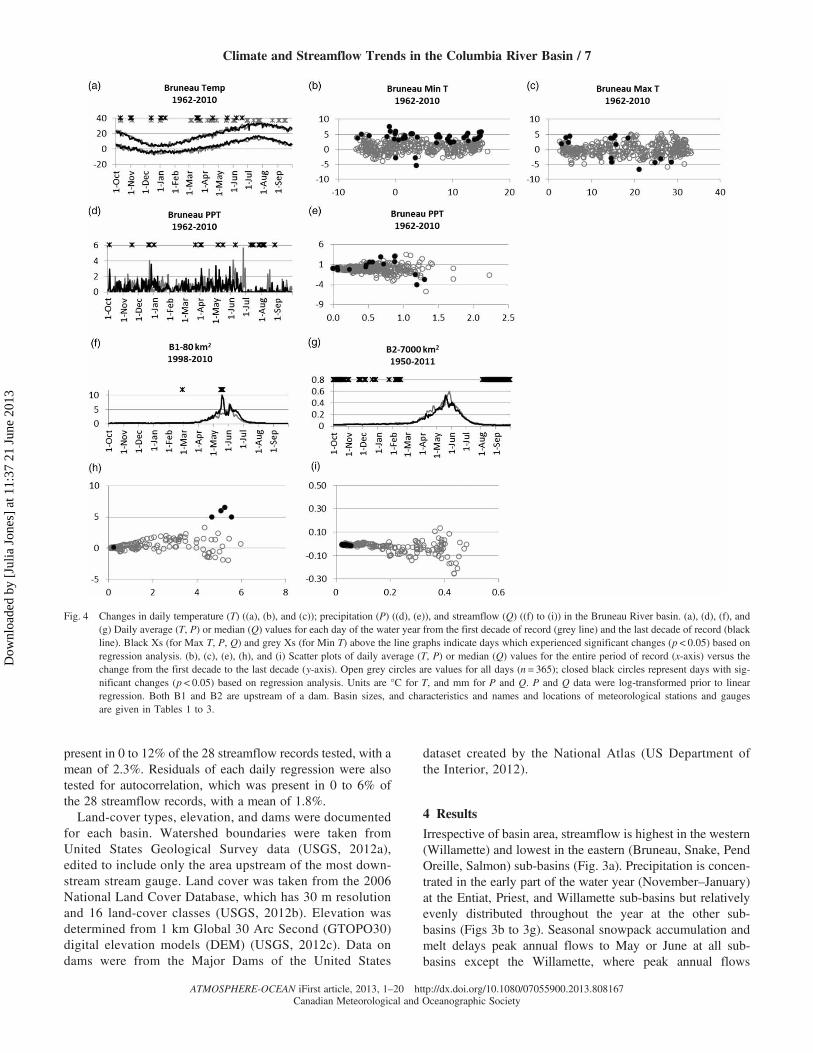
Fig. 4 Changes in daily temperature (T) ((a), (b), and (c)); precipitation (P) ((d), (e)), and streamflow (Q) ((f) to (i)) in the Bruneau River basin. (a), (d), (f), and(g) Daily average (T, P) or median (Q) values for each day of the water year from the first decade of record (grey line) and the last decade of record (blackline). Black Xs (for Max T, P, Q) and grey Xs (for Min T) above the line graphs indicate days which experienced significant changes (p < 0.05) based onregression analysis. (b), (c), (e), (h), and (i) Scatter plots of daily average (T, P) or median (Q) values for the entire period of record (x-axis) versus thechange from the first decade to the last decade (y-axis). Open grey circles are values for all days (n = 365); closed black circles represent days with sig-nificant changes (p < 0.05) based on regression analysis. Units are °C for T, and mm for P and Q. P and Q data were log-transformed prior to linearregression. Both B1 and B2 are upstream of a dam. Basin sizes, and characteristics and names and locations of meteorological stations and gaugesare given in Tables 1 to 3.
Climate and Streamflow Trends in the Columbia River Basin / 7
ATMOSPHERE-OCEAN iFirst article, 2013, 1–20 http://dx.doi.org/10.1080/07055900.2013.808167Canadian Meteorological and Oceanographic Society
Dow
nloa
ded
by [
Julia
Jon
es]
at 1
1:37
21
June
201
3
coincide with peak precipitation in December to February. TheColumbia River mainstem at the United States–Canada borderand the Columbia River at The Dalles have annual peaks inearly June.
a Temperature and Precipitation Trends in Sub-BasinsMinimum and/or maximum daily air temperature increasedbut daily precipitation did not change consistently at climatestations in the headwaters of study sub-basins over theperiod 1950 to 2010 (Figs 4 to 10). At all seven sites, signifi-cant increases in minimum or maximum daily temperature orboth were observed on more than ten days. The number ofdays with significant increases was larger than the numberwith significant decreases, and the average temperaturechange was positive (Figs 4 to 10), consistent with muchmore complete regional studies of climate trends (e.g.,Littell et al., 2011).In the Bruneau headwaters, minimum daily temperature
increased on 37 days (average change +0.3°C per decade
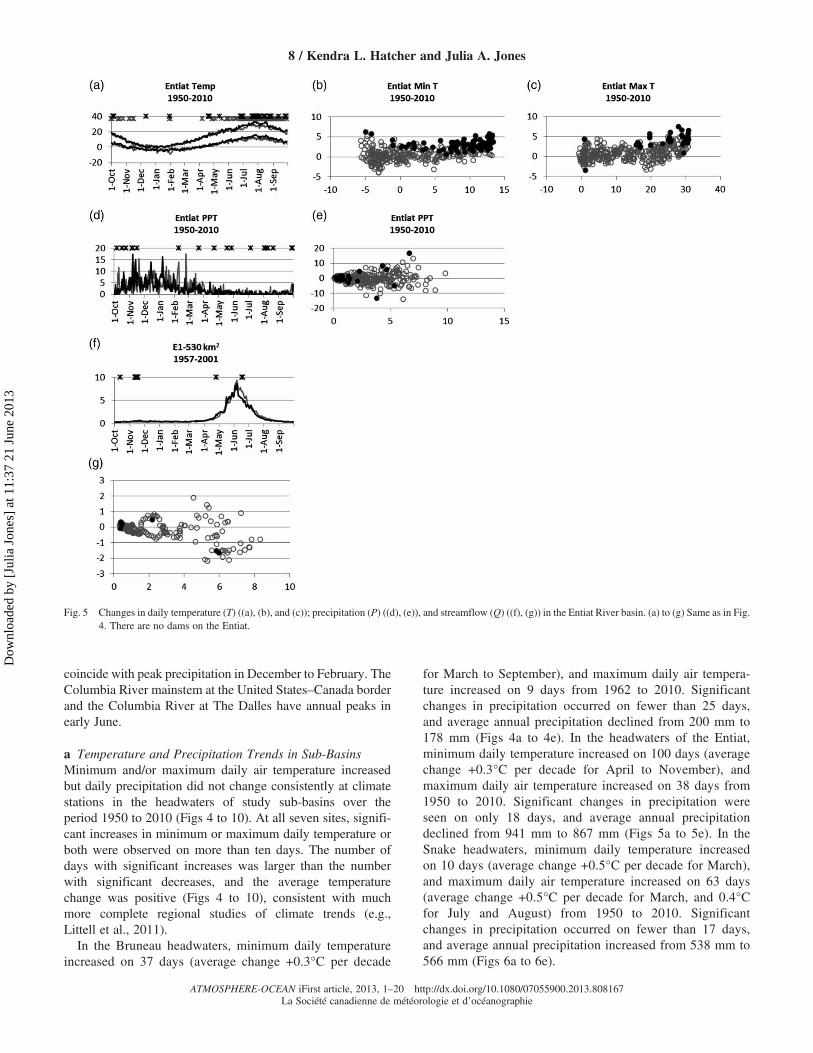
for March to September), and maximum daily air tempera-ture increased on 9 days from 1962 to 2010. Significantchanges in precipitation occurred on fewer than 25 days,and average annual precipitation declined from 200 mm to178 mm (Figs 4a to 4e). In the headwaters of the Entiat,minimum daily temperature increased on 100 days (averagechange +0.3°C per decade for April to November), andmaximum daily air temperature increased on 38 days from1950 to 2010. Significant changes in precipitation wereseen on only 18 days, and average annual precipitationdeclined from 941 mm to 867 mm (Figs 5a to 5e). In theSnake headwaters, minimum daily temperature increasedon 10 days (average change +0.5°C per decade for March),and maximum daily air temperature increased on 63 days(average change +0.5°C per decade for March, and 0.4°Cfor July and August) from 1950 to 2010. Significantchanges in precipitation occurred on fewer than 17 days,and average annual precipitation increased from 538 mm to566 mm (Figs 6a to 6e).
Fig. 5 Changes in daily temperature (T) ((a), (b), and (c)); precipitation (P) ((d), (e)), and streamflow (Q) ((f), (g)) in the Entiat River basin. (a) to (g) Same as in Fig.4. There are no dams on the Entiat.
8 / Kendra L. Hatcher and Julia A. Jones
ATMOSPHERE-OCEAN iFirst article, 2013, 1–20 http://dx.doi.org/10.1080/07055900.2013.808167La Société canadienne de météorologie et d’océanographie
Dow
nloa
ded
by [
Julia
Jon
es]
at 1
1:37
21
June
201
3
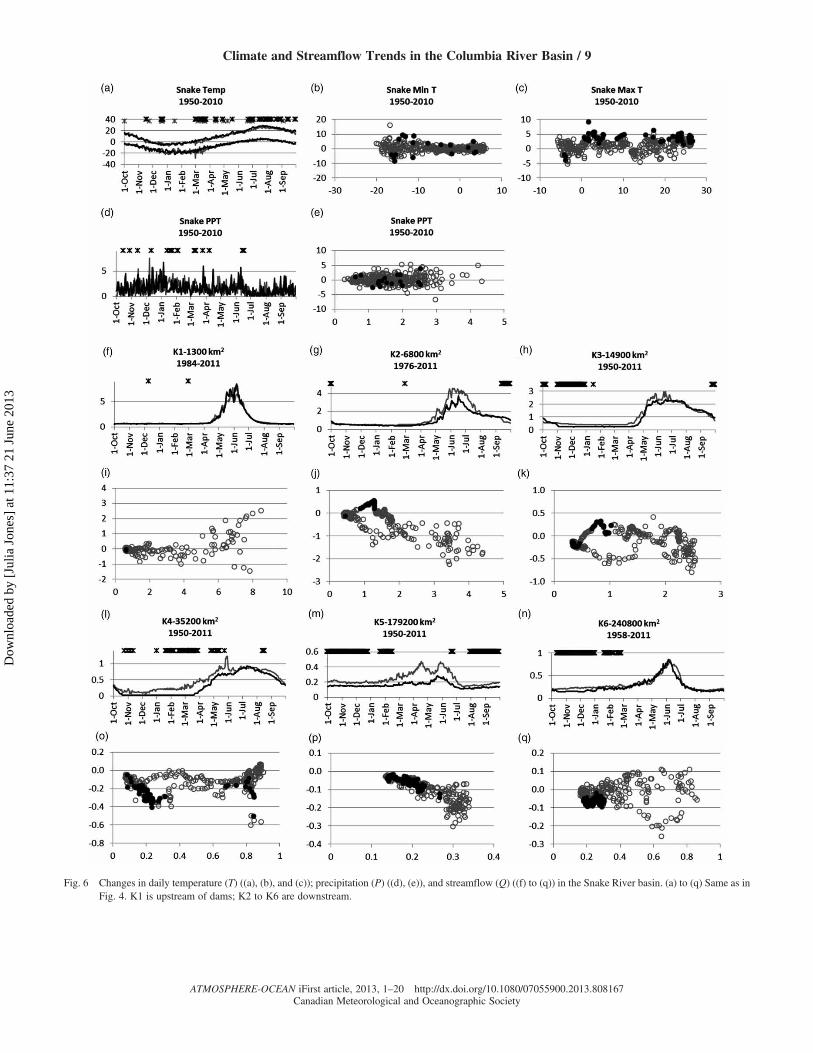
Fig. 6 Changes in daily temperature (T) ((a), (b), and (c)); precipitation (P) ((d), (e)), and streamflow (Q) ((f) to (q)) in the Snake River basin. (a) to (q) Same as inFig. 4. K1 is upstream of dams; K2 to K6 are downstream.
Climate and Streamflow Trends in the Columbia River Basin / 9
ATMOSPHERE-OCEAN iFirst article, 2013, 1–20 http://dx.doi.org/10.1080/07055900.2013.808167Canadian Meteorological and Oceanographic Society
Dow
nloa
ded
by [
Julia
Jon
es]
at 1
1:37
21
June
201
3
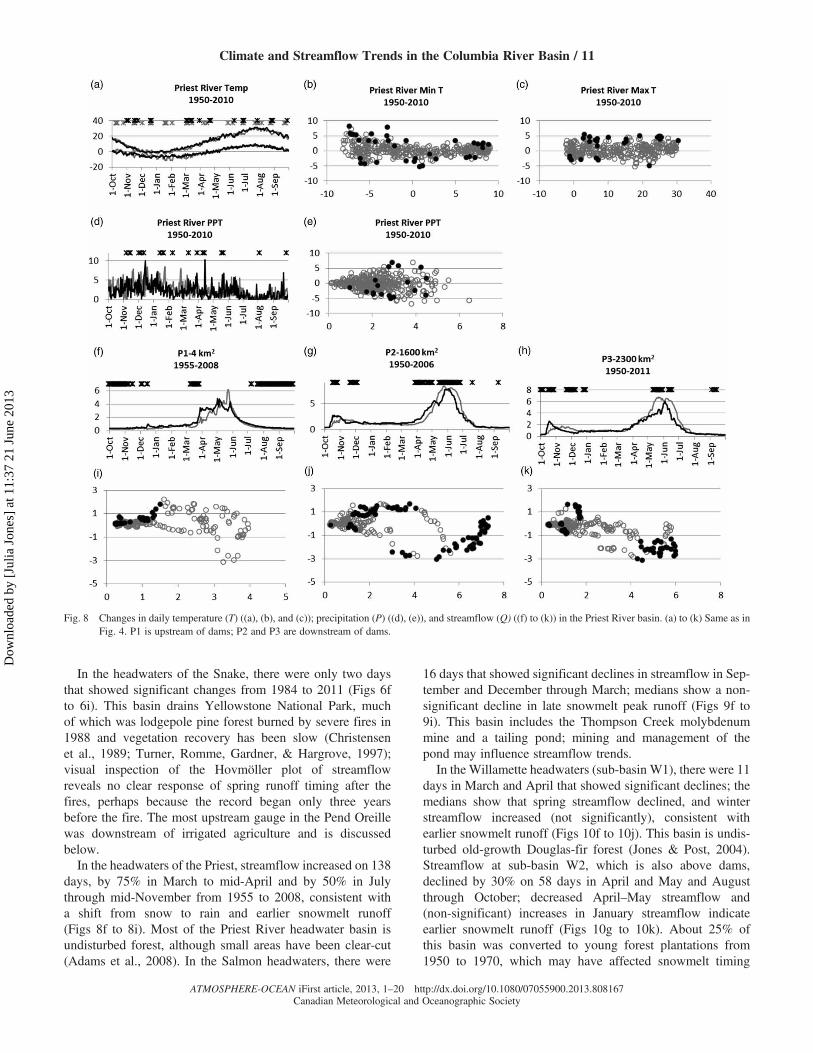
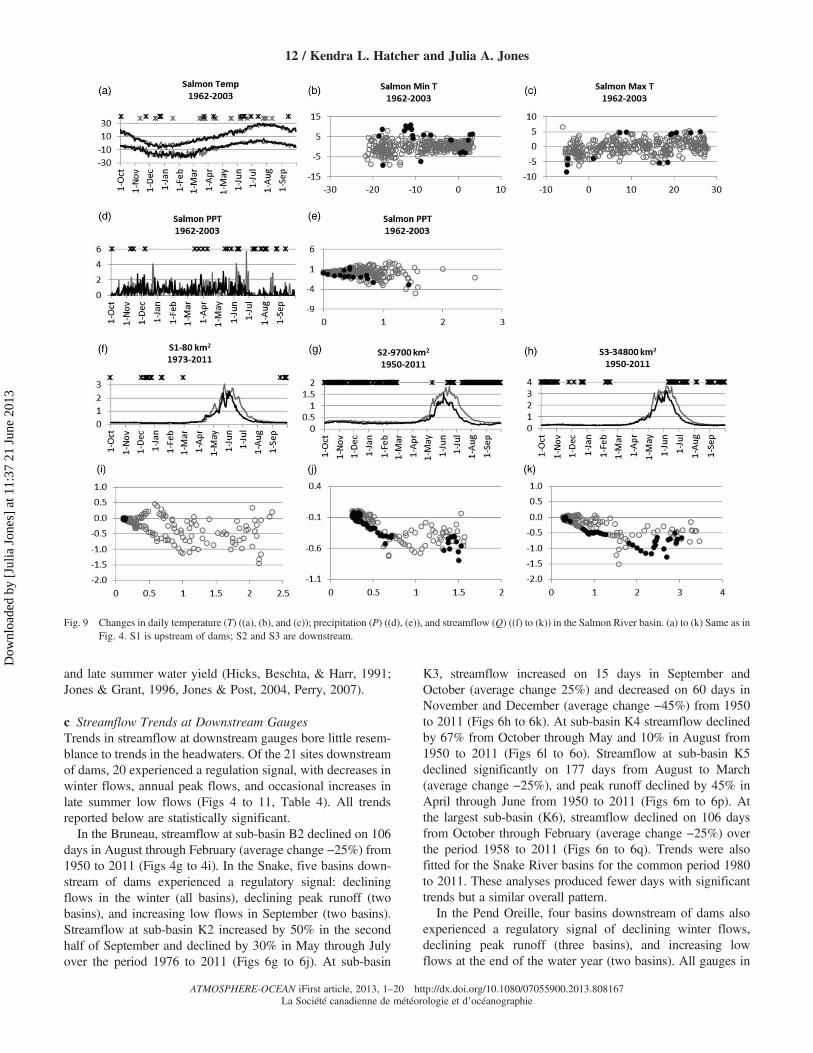
In the headwaters of the Pend Oreille, minimum daily temp-erature increased on 48 days (average change +0.4°C perdecade for March), and maximum daily air temperatureincreased on 43 days (average change +0.6°C per decade forMarch and +0.4°C per decade for July through September). Sig-nificant changes in precipitation were seen on a total of 15 days,and average annual precipitation declined from 404 mm to330 mm (Figs 7a to 7e). In the Priest headwaters, minimumdaily air temperature both increased and decreased on 35 days(average change +0.1°C per decade in March through July),and maximum daily air temperature increased on 21 days(average change +0.1°C per decade for March through July)from 1950 to 2010. Significant changes in precipitationoccurred on a total of 18 days, and average annual precipitationdeclined from 875 mm to 778 mm (Figs 8a to 8e). In the head-waters of the Salmon, minimum daily air temperature increasedon 16 days (average change +0.2°C per decade for Marchthrough August), and maximum daily air temperature increasedon 7 days (average change +0.1°C per decade for Marchthrough August) from 1962 to 2003. Significant changes in pre-cipitation occurred on a total of 25 days, and average annualprecipitation did not change (Figs 9a to 9e). In the Willametteheadwaters, minimum daily air temperature increased on 46days (average change +0.4°C per decade in January and+0.2°C per decade in March and April), and maximum dailyair temperature increased on 16 days (average change +0.4°C
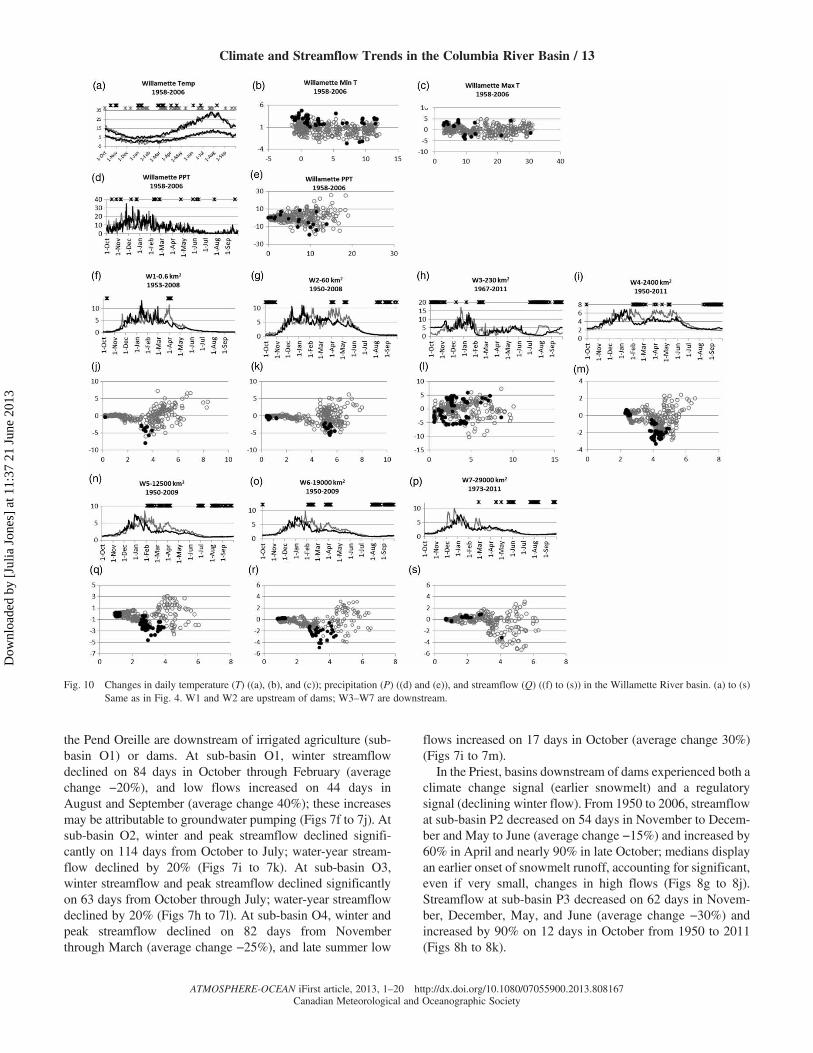
per decade in January and +0.1°C per decade in March andApril) from 1958 to 2006. Significant changes in precipitationwere seen on a total of 18 days, and average annualprecipitation increased from 2237 mm to 2336 mm (Figs 10ato 10e).
b Streamflow Trends in HeadwatersHeadwater streamflow was expected to show a climate changesignal, but headwater records from unregulated basins alsomay have been influenced by wildfire, logging, and mining.Of the seven headwater basins, four experienced no change,two experienced earlier snowmelt runoff, and one (PendOreille), which is downstream of irrigated agriculture,showed a regulatory signal (Figs 4 to 10, Table 4). In the head-waters of the Bruneau, few daily streamflow changes wereobserved, but the record only covers 1998 to 2010 (Figs 4fand 4h). There were few days of streamflow change in theEntiat headwaters from 1957 to 2001 (Figs 5f and 5g).However, much of the basin area burned in 1970 (Adams,Loughry, & Plaugher, 2008; Woodsmith, Vache, McDonnell,Seibert, & Helvey, 2007). Forest removal tends to delay snow-melt (e.g., Jones & Post, 2004), and visual examination of theHovmöller plot of Entiat streamflow reveals delayed springrunoff after 1970, potentially counteracting climate-warmingeffects.
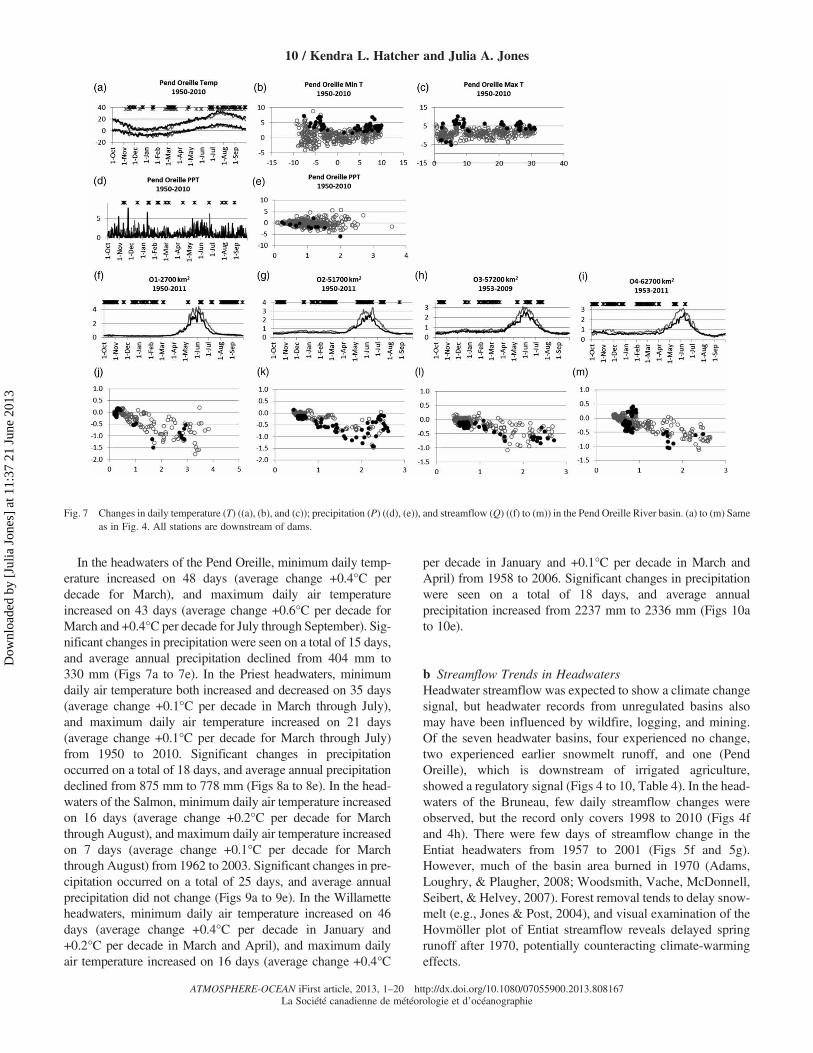
Fig. 7 Changes in daily temperature (T) ((a), (b), and (c)); precipitation (P) ((d), (e)), and streamflow (Q) ((f) to (m)) in the Pend Oreille River basin. (a) to (m) Sameas in Fig. 4. All stations are downstream of dams.
10 / Kendra L. Hatcher and Julia A. Jones
ATMOSPHERE-OCEAN iFirst article, 2013, 1–20 http://dx.doi.org/10.1080/07055900.2013.808167La Société canadienne de météorologie et d’océanographie
Dow
nloa
ded
by [
Julia
Jon
es]
at 1
1:37
21
June
201
3
In the headwaters of the Snake, there were only two daysthat showed significant changes from 1984 to 2011 (Figs 6fto 6i). This basin drains Yellowstone National Park, muchof which was lodgepole pine forest burned by severe fires in1988 and vegetation recovery has been slow (Christensenet al., 1989; Turner, Romme, Gardner, & Hargrove, 1997);visual inspection of the Hovmöller plot of streamflowreveals no clear response of spring runoff timing after thefires, perhaps because the record began only three yearsbefore the fire. The most upstream gauge in the Pend Oreillewas downstream of irrigated agriculture and is discussedbelow.In the headwaters of the Priest, streamflow increased on 138
days, by 75% in March to mid-April and by 50% in Julythrough mid-November from 1955 to 2008, consistent witha shift from snow to rain and earlier snowmelt runoff(Figs 8f to 8i). Most of the Priest River headwater basin isundisturbed forest, although small areas have been clear-cut(Adams et al., 2008). In the Salmon headwaters, there were
16 days that showed significant declines in streamflow in Sep-tember and December through March; medians show a non-significant decline in late snowmelt peak runoff (Figs 9f to9i). This basin includes the Thompson Creek molybdenummine and a tailing pond; mining and management of thepond may influence streamflow trends.
In the Willamette headwaters (sub-basin W1), there were 11days in March and April that showed significant declines; themedians show that spring streamflow declined, and winterstreamflow increased (not significantly), consistent withearlier snowmelt runoff (Figs 10f to 10j). This basin is undis-turbed old-growth Douglas-fir forest (Jones & Post, 2004).Streamflow at sub-basin W2, which is also above dams,declined by 30% on 58 days in April and May and Augustthrough October; decreased April–May streamflow and(non-significant) increases in January streamflow indicateearlier snowmelt runoff (Figs 10g to 10k). About 25% ofthis basin was converted to young forest plantations from1950 to 1970, which may have affected snowmelt timing
Fig. 8 Changes in daily temperature (T) ((a), (b), and (c)); precipitation (P) ((d), (e)), and streamflow (Q) ((f) to (k)) in the Priest River basin. (a) to (k) Same as inFig. 4. P1 is upstream of dams; P2 and P3 are downstream of dams.
Climate and Streamflow Trends in the Columbia River Basin / 11
ATMOSPHERE-OCEAN iFirst article, 2013, 1–20 http://dx.doi.org/10.1080/07055900.2013.808167Canadian Meteorological and Oceanographic Society
Dow
nloa
ded
by [
Julia
Jon
es]
at 1
1:37
21
June
201
3
and late summer water yield (Hicks, Beschta, & Harr, 1991;Jones & Grant, 1996, Jones & Post, 2004, Perry, 2007).
c Streamflow Trends at Downstream GaugesTrends in streamflow at downstream gauges bore little resem-blance to trends in the headwaters. Of the 21 sites downstreamof dams, 20 experienced a regulation signal, with decreases inwinter flows, annual peak flows, and occasional increases inlate summer low flows (Figs 4 to 11, Table 4). All trendsreported below are statistically significant.In the Bruneau, streamflow at sub-basin B2 declined on 106
days in August through February (average change −25%) from1950 to 2011 (Figs 4g to 4i). In the Snake, five basins down-stream of dams experienced a regulatory signal: decliningflows in the winter (all basins), declining peak runoff (twobasins), and increasing low flows in September (two basins).Streamflow at sub-basin K2 increased by 50% in the secondhalf of September and declined by 30% in May through Julyover the period 1976 to 2011 (Figs 6g to 6j). At sub-basin
K3, streamflow increased on 15 days in September andOctober (average change 25%) and decreased on 60 days inNovember and December (average change −45%) from 1950to 2011 (Figs 6h to 6k). At sub-basin K4 streamflow declinedby 67% from October through May and 10% in August from1950 to 2011 (Figs 6l to 6o). Streamflow at sub-basin K5declined significantly on 177 days from August to March(average change −25%), and peak runoff declined by 45% inApril through June from 1950 to 2011 (Figs 6m to 6p). Atthe largest sub-basin (K6), streamflow declined on 106 daysfrom October through February (average change −25%) overthe period 1958 to 2011 (Figs 6n to 6q). Trends were alsofitted for the Snake River basins for the common period 1980to 2011. These analyses produced fewer days with significanttrends but a similar overall pattern.
In the Pend Oreille, four basins downstream of dams alsoexperienced a regulatory signal of declining winter flows,declining peak runoff (three basins), and increasing lowflows at the end of the water year (two basins). All gauges in
Fig. 9 Changes in daily temperature (T) ((a), (b), and (c)); precipitation (P) ((d), (e)), and streamflow (Q) ((f) to (k)) in the Salmon River basin. (a) to (k) Same as inFig. 4. S1 is upstream of dams; S2 and S3 are downstream.
12 / Kendra L. Hatcher and Julia A. Jones
ATMOSPHERE-OCEAN iFirst article, 2013, 1–20 http://dx.doi.org/10.1080/07055900.2013.808167La Société canadienne de météorologie et d’océanographie
Dow
nloa
ded
by [
Julia
Jon
es]
at 1
1:37
21
June
201
3
the Pend Oreille are downstream of irrigated agriculture (sub-basin O1) or dams. At sub-basin O1, winter streamflowdeclined on 84 days in October through February (averagechange −20%), and low flows increased on 44 days inAugust and September (average change 40%); these increasesmay be attributable to groundwater pumping (Figs 7f to 7j). Atsub-basin O2, winter and peak streamflow declined signifi-cantly on 114 days from October to July; water-year stream-flow declined by 20% (Figs 7i to 7k). At sub-basin O3,winter streamflow and peak streamflow declined significantlyon 63 days from October through July; water-year streamflowdeclined by 20% (Figs 7h to 7l). At sub-basin O4, winter andpeak streamflow declined on 82 days from Novemberthrough March (average change −25%), and late summer low
flows increased on 17 days in October (average change 30%)(Figs 7i to 7m).
In the Priest, basins downstream of dams experienced both aclimate change signal (earlier snowmelt) and a regulatorysignal (declining winter flow). From 1950 to 2006, streamflowat sub-basin P2 decreased on 54 days in November to Decem-ber and May to June (average change −15%) and increased by60% in April and nearly 90% in late October; medians displayan earlier onset of snowmelt runoff, accounting for significant,even if very small, changes in high flows (Figs 8g to 8j).Streamflow at sub-basin P3 decreased on 62 days in Novem-ber, December, May, and June (average change −30%) andincreased by 90% on 12 days in October from 1950 to 2011(Figs 8h to 8k).
Fig. 10 Changes in daily temperature (T) ((a), (b), and (c)); precipitation (P) ((d) and (e)), and streamflow (Q) ((f) to (s)) in the Willamette River basin. (a) to (s)Same as in Fig. 4. W1 and W2 are upstream of dams; W3–W7 are downstream.
Climate and Streamflow Trends in the Columbia River Basin / 13
ATMOSPHERE-OCEAN iFirst article, 2013, 1–20 http://dx.doi.org/10.1080/07055900.2013.808167Canadian Meteorological and Oceanographic Society
Dow
nloa
ded
by [
Julia
Jon
es]
at 1
1:37
21
June
201
3
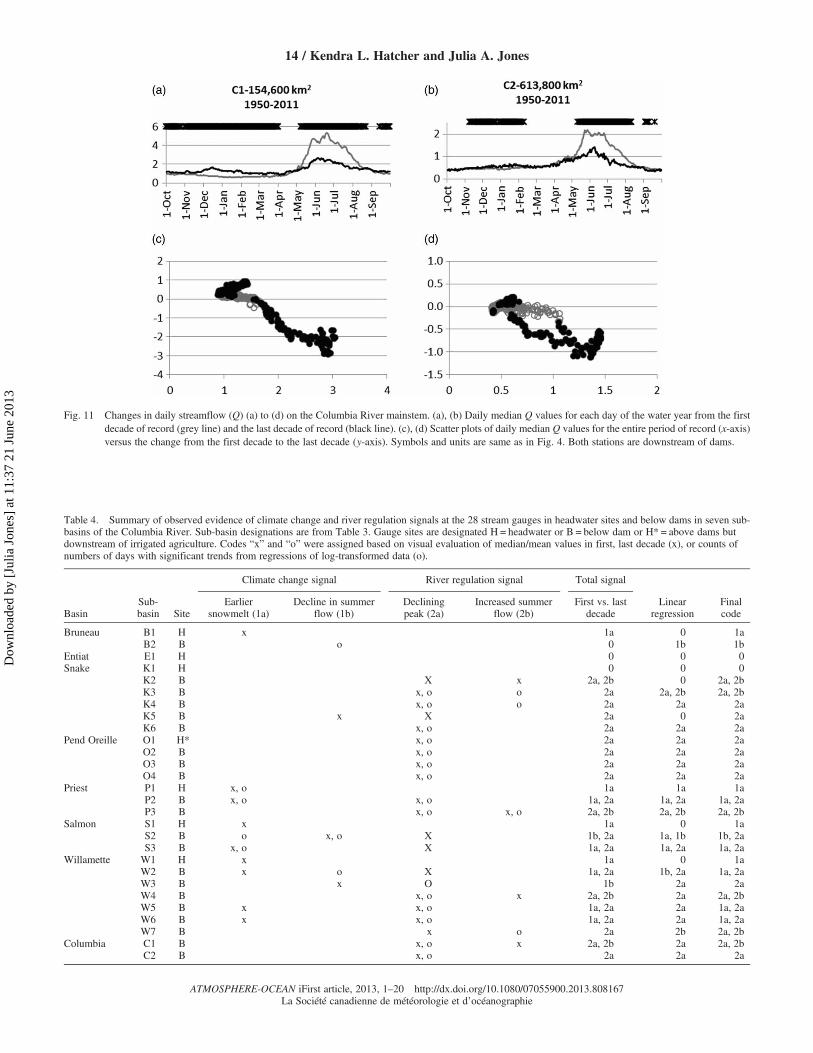
Fig. 11 Changes in daily streamflow (Q) (a) to (d) on the Columbia River mainstem. (a), (b) Daily median Q values for each day of the water year from the firstdecade of record (grey line) and the last decade of record (black line). (c), (d) Scatter plots of daily median Q values for the entire period of record (x-axis)versus the change from the first decade to the last decade (y-axis). Symbols and units are same as in Fig. 4. Both stations are downstream of dams.
Table 4. Summary of observed evidence of climate change and river regulation signals at the 28 stream gauges in headwater sites and below dams in seven sub-basins of the Columbia River. Sub-basin designations are from Table 3. Gauge sites are designated H = headwater or B = below dam or H* = above dams butdownstream of irrigated agriculture. Codes “x” and “o” were assigned based on visual evaluation of median/mean values in first, last decade (x), or counts ofnumbers of days with significant trends from regressions of log-transformed data (o).
BasinSub-basin Site
Climate change signal River regulation signal Total signal
Linearregression
Finalcode
Earliersnowmelt (1a)
Decline in summerflow (1b)
Decliningpeak (2a)
Increased summerflow (2b)
First vs. lastdecade
Bruneau B1 H x 1a 0 1aB2 B o 0 1b 1b
Entiat E1 H 0 0 0Snake K1 H 0 0 0
K2 B X x 2a, 2b 0 2a, 2bK3 B x, o o 2a 2a, 2b 2a, 2bK4 B x, o o 2a 2a 2aK5 B x X 2a 0 2aK6 B x, o 2a 2a 2a
Pend Oreille O1 H* x, o 2a 2a 2aO2 B x, o 2a 2a 2aO3 B x, o 2a 2a 2aO4 B x, o 2a 2a 2a
Priest P1 H x, o 1a 1a 1aP2 B x, o x, o 1a, 2a 1a, 2a 1a, 2aP3 B x, o x, o 2a, 2b 2a, 2b 2a, 2b
Salmon S1 H x 1a 0 1aS2 B o x, o X 1b, 2a 1a, 1b 1b, 2aS3 B x, o X 1a, 2a 1a, 2a 1a, 2a
Willamette W1 H x 1a 0 1aW2 B x o X 1a, 2a 1b, 2a 1a, 2aW3 B x O 1b 2a 2aW4 B x, o x 2a, 2b 2a 2a, 2bW5 B x x, o 1a, 2a 2a 1a, 2aW6 B x x, o 1a, 2a 2a 1a, 2aW7 B x o 2a 2b 2a, 2b
Columbia C1 B x, o x 2a, 2b 2a 2a, 2bC2 B x, o 2a 2a 2a
14 / Kendra L. Hatcher and Julia A. Jones
ATMOSPHERE-OCEAN iFirst article, 2013, 1–20 http://dx.doi.org/10.1080/07055900.2013.808167La Société canadienne de météorologie et d’océanographie
Dow
nloa
ded
by [
Julia
Jon
es]
at 1
1:37
21
June
201
3
In the Salmon, basins downstream of dams experienced aregulatory signal (declining winter flow and declining peakflow) but no low flow augmentation. Streamflow at sub-basin S2 declined on 208 days in June through February(average change −25%) from 1950 to 2011 (Figs 9g to 9j).At S3, streamflow declined on 96 days, also in Junethrough February (average change −20%) from 1950 to2011 (Figs 9h to 9k).In the Willamette, basins below dams displayed a regulatory
signal of declining peak flows and augmented low flows.Streamflow at sub-basin W3 declined on 60 days in February,July, and August (average change −25%) and increased by125% on 54 days from September through November(average change 125%) from 1967 to 2011 (Figs 10h to 10l).Trends at sub-basin W3 are consistent with flood regulation
and are affected by relocation of stream gauges during the con-struction of the Blue River dam, completed in 1969. At sub-basin W4, peak streamflow declined on 34 days in Februarythrough May (average change −25%), and low flow increasedon 42 days from September to mid-October (average change20%) from 1950 to 2011 (Figs 10i to 10m). At sub-basin W5,peak streamflow declined on 62 days from February throughApril (average change −35%), and low flow increased on 42days in August and September (average change 15%) from1950 to 2009 (Figs 10n to 10q). At sub-basin W6 peak stream-flow declined on 31 days from February to April (averagechange −30%), and low flow increased on 52 days fromAugust to September (average change 20%) from 1950 to2009 (Figs 10o to 10r). At sub-basin W7, streamflow increasedon 36 days in April through June (average change 15%) from
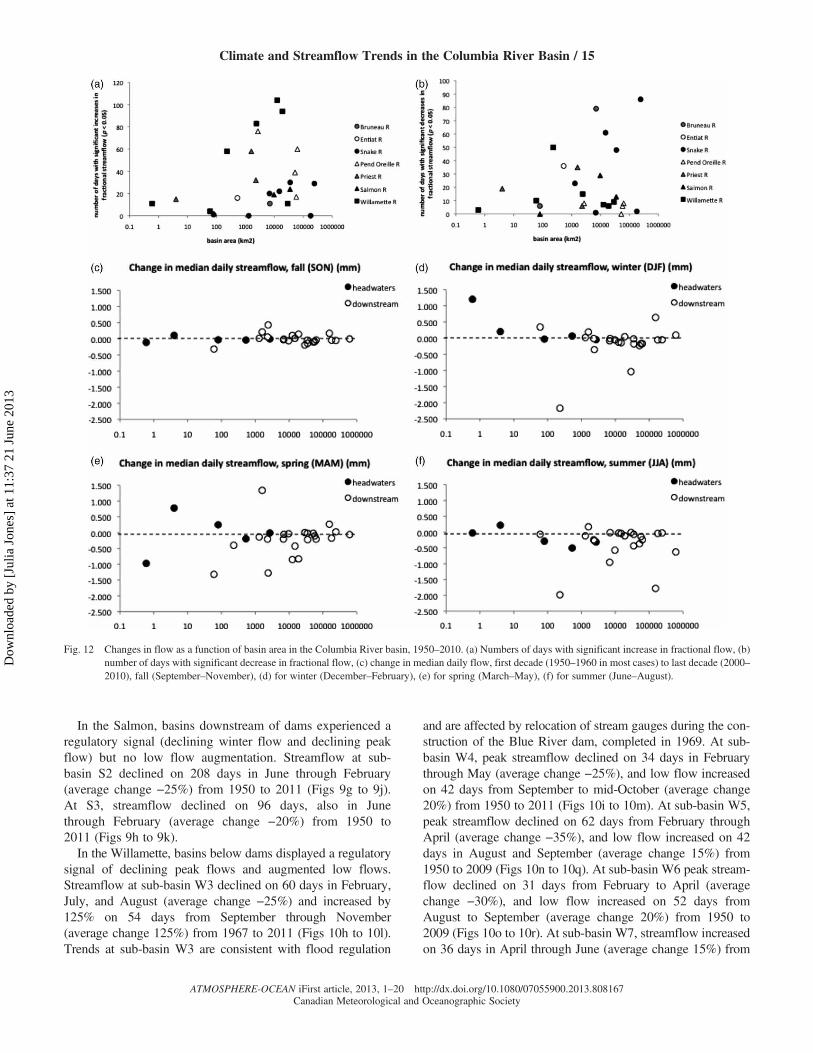
Fig. 12 Changes in flow as a function of basin area in the Columbia River basin, 1950–2010. (a) Numbers of days with significant increase in fractional flow, (b)number of days with significant decrease in fractional flow, (c) change in median daily flow, first decade (1950–1960 in most cases) to last decade (2000–2010), fall (September–November), (d) for winter (December–February), (e) for spring (March–May), (f) for summer (June–August).
Climate and Streamflow Trends in the Columbia River Basin / 15
ATMOSPHERE-OCEAN iFirst article, 2013, 1–20 http://dx.doi.org/10.1080/07055900.2013.808167Canadian Meteorological and Oceanographic Society
Dow
nloa
ded
by [
Julia
Jon
es]
at 1
1:37
21
June
201
3
1973 to 2011 (Figs 10p to 10s). The medians of sub-basins W4,W5, W6, and W7 all show declines in peak flows from the firstto the last decade of record.
d Streamflow Trends on the ColumbiaIn the Columbia River basin at the United States–Canadaborder (sub-basin C1) peak streamflow declined on 105days from early May to mid-August (average change−40%) and increased on 192 days from September throughApril (average change 50%) from 1950 to 2011 (Figs 11aand 11c). On the mainstem Columbia River downstream atThe Dalles (sub-basin C2), peak streamflow decreased on97 days from early May to September (average change
−30%) and increased on 84 days from October throughFebruary (average change 15%) from 1950 to 2011 (Figs11b and 11d).
e Summary of Streamflow TrendsThis analysis revealed that streamflow changes could be stat-istically significant (significant p-value) or practically signifi-cant (change is large), or both, depending on the time of year.Overall, more significant changes were detected for days withlow, or unvarying flow, whereas days with high, variableflows were unlikely to have statistically significant trends,although plots of median flow indicate some large, practi-cally significant changes. The numbers of days that showedsignificant changes in flows increased from the headwaters
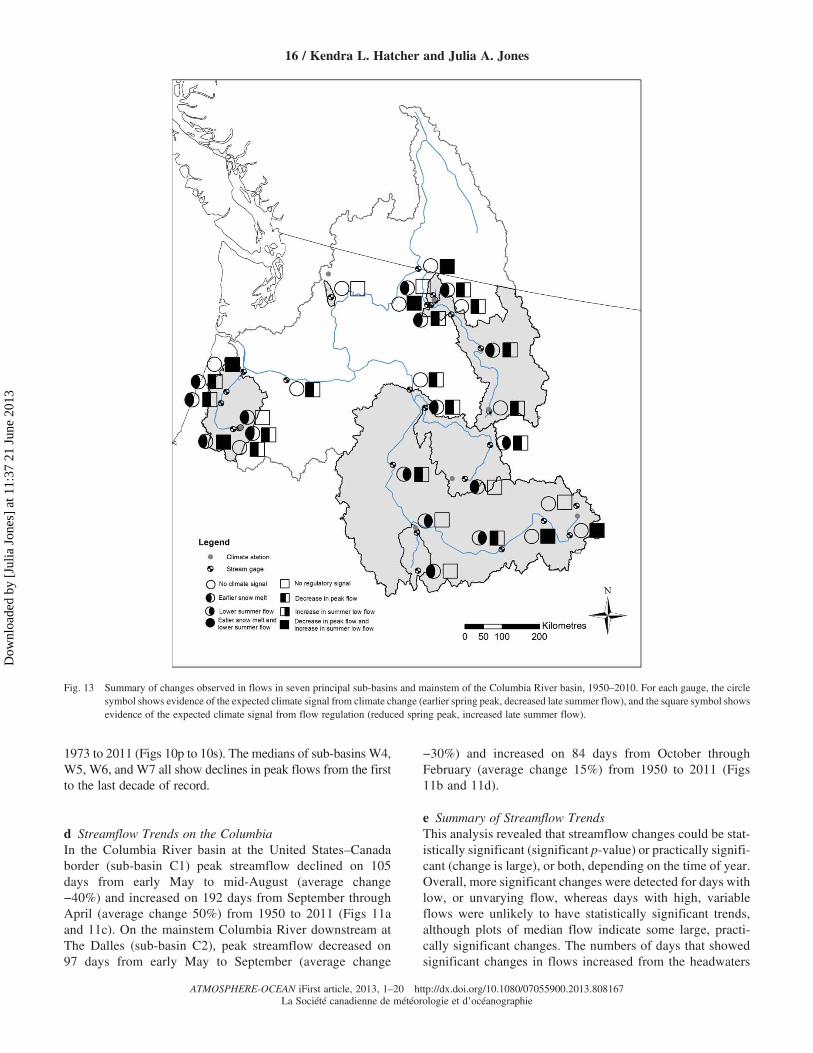
Fig. 13 Summary of changes observed in flows in seven principal sub-basins and mainstem of the Columbia River basin, 1950–2010. For each gauge, the circlesymbol shows evidence of the expected climate signal from climate change (earlier spring peak, decreased late summer flow), and the square symbol showsevidence of the expected climate signal from flow regulation (reduced spring peak, increased late summer flow).
16 / Kendra L. Hatcher and Julia A. Jones
ATMOSPHERE-OCEAN iFirst article, 2013, 1–20 http://dx.doi.org/10.1080/07055900.2013.808167La Société canadienne de météorologie et d’océanographie
Dow
nloa
ded
by [
Julia
Jon
es]
at 1
1:37
21
June
201
3
to downstream (Figs 12a to 12b). The magnitude of thechange in daily median streamflow between the first andlast decade of record did not follow trends in numbers ofdays with significant changes (Figs 12c to 12g). On anannual basis, and during fall, changes in median daily flowwere small and did not vary with basin size. In contrast,streamflow in spring (March–May) and summer (June–August) declined in most large basins but did not change con-sistently in headwater basins. Over the period of record,streamflow variability (coefficient of variation of dailystreamflow) declined in headwaters above dams in theEntiat, Pend Oreille, Priest, andWillamette basins but increasedin the headwaters of the Snake and Salmon basins. At gaugesbelow dams, streamflow variability declined abruptly in the1970s on the Columbia River mainstem, declined in the PendOreille, Priest, and Willamette basins, remained steady in theSalmon basin, and increased or remained steady in theBruneau and Snake basins.
5 Discussion
Climate warming was associated with earlier spring peak flowsin relatively undisturbed or partially logged headwaters of theColumbia River basin but not in headwaters that experiencedwildfire or mining, and flow regulation downstream of damsappears to have overwhelmed the climate-warming signalfrom the headwaters over the period 1950 to 2010 (Fig. 13).Large river basins integrate the signal of water from atmos-
pheres to oceans. The tips of a large river basin network (theheadwater streams) sense atmospheric inputs most directly,whereas downstream portions of the network integrate theatmospheric inputs as well as the influence of land use,water withdrawals, and flow regulation (dams). Therefore,headwater streamflow is expected to be more sensitive toclimate change and variability than downstream flow (e.g.,Jones et al., 2012). In the western United States climatewarming is associated with earlier snowmelt, and insnowmelt-affected headwaters of large river basins climatewarming is expected to produce a shift to earlier spring peakflows and reduced late summer flows. In contrast, downstreamflows may sense the effects of flow regulation and land usemore than climate warming (Cuo, Lettenmaier, Alberti,& Richey, 2009; Matheussen, Kirschbaum, Goodman,O’Donnell, & Lettenmaier, 2000; VanShaar, Haddeland,& Lettenmaier, 2002).In a study of 68 unregulated streams in the Pacific North-
west from 1958 to 2008, Chang et al. (2012) documented sig-nificant increases in the proportion of March streamflow toannual streamflow at stations above 1000 m elevation domi-nated by surface flow, but absolute March streamflow didnot increase at most stations. In this study, however, climatewarming was associated with earlier spring peak streamflowin only two of seven headwater basins; using medians, fourof seven basins showed altered snowmelt runoff timing.These seven basins have long-term records of climate andstreamflow, but they are not necessarily representative of the
entire Columbia River basin. Spring streamflow shiftedearlier in the headwaters of the Priest and Willamette, butnot in the Bruneau (record only twelve years), Entiat (affectedby wildfire), Pend Oreille (downstream of irrigated agricul-ture), Salmon (downstream of mining), or Snake (affectedby wildfire) River basins. Although climate warmingappears to have accelerated snowmelt runoff in relativelyundisturbed headwater basins, disturbances have counteractedor obscured a climate signal on runoff in other headwaterbasins. Thus, ecological resilience (sensu Holling, 1996, i.e.,persistence, variability, and unpredictability) has characterizedheadwater ecosystem responses to climate warming in theColumbia River basin.
By reducing snowpacks and accelerating snowmelt,climate warming may extend the summer drought period inwestern basins, leading to declines in late summer flows(Barnett et al., 2008; Hamlet et al., 2005; Hamlet & Letten-maier, 2007; Lutz et al., 2012; Mote et al., 2003) andperhaps to increased variability of flow (Luce & Holden,2009). Chang et al. (2012) detected significant negativetrends in September absolute streamflow in a majority of 68gauges on unregulated streams in the Pacific Northwestfrom 1958 to 2008. However, in this study no reductions inlate summer flow were detected in headwater basins, eitherin absolute or relative terms, despite the ability of thismethod to detect changes in very low flows. Moreover,streamflow variability (coefficient of variation of dailyflow) increased only in the Salmon and Snake headwaters.In our study, September mean monthly flows declined atthe Entiat, Snake, Salmon, and Willamette headwaterbasins, but we did not detect declining trends in daily flowin these basins, indicating that our method may be more con-servative than methods that use mean monthly flows such asChang et al. (2012). On the other hand, unless they are cor-rected for precipitation, trends in monthly flows in Septem-ber, at the end of the water year, may be affected by thetiming of the arrival of the fall rains. Headwater ecosystemsin the Columbia River basin are dominated by coniferforests which are adapted to summer drought and capableof reducing transpiration in response to elevated temperature.Our study found limited evidence of a climate-warming effecton late summer flows in headwater basins, indicating thatstreamflow from headwater ecosystems may have some eco-logical resilience to climate warming.
As expected, streamflow changed significantly over theperiod 1950 to 2010 throughout much of the year at gaugesdownstream of dams, reflecting management for engineeringresilience to climate variability over the study period. Thelarger the basin, the more dams probably went into operationupstream over the period 1950 to 2010, and this resulted in aprogressive increase from headwaters to downstream innumbers of days affected by river regulation. Moreover, thetrends in streamflow observed downstream of dams were con-sistent with river regulation for flood control and low flowaugmentation as shown by other studies (e.g., Graf, 2006).These expected changes included widespread reductions in
Climate and Streamflow Trends in the Columbia River Basin / 17
ATMOSPHERE-OCEAN iFirst article, 2013, 1–20 http://dx.doi.org/10.1080/07055900.2013.808167Canadian Meteorological and Oceanographic Society
Dow
nloa
ded
by [
Julia
Jon
es]
at 1
1:37
21
June
201
3
flows during winter, spring, and early summer, when snow-packs melt and contribute to annual peak flows. Streamflowincreased in late summer in the Snake River basin, and frac-tional flows increased in October in some downstreamgauges in the Entiat, Pend Oreille, Snake, Priest, and Willam-ette basins. The latter four basins have a high density of damsalong the mainstem that are operated for recreation and irriga-tion, and thus for supplementing late dry season low flows(Table 1). In addition, flow on the Columbia River mainstemat the United States–Canada border decreased from May toAugust and increased from September through April. Otherstudies have examined the effects of dams on streamflow inthe Pacific Northwest (Dynesius & Nilsson, 1994; Graf,1999, 2006; Moore, Arrigoni, & Wilcox, 2012) and con-sidered how to mitigate modelled climate change effects onstreamflow by altered reservoir operation (Hamlet & Letten-maier, 1999; Lee, Hamlet, Fitzgerald, & Burges, 2009;Payne, Wood, Hamlet, Palmer, & Lettenmaier, 2004). Thecumulative effect of increasing the number of dams on floodreduction during peak flow periods and flow augmentationduring low flow periods was clearly expressed in thesebasins and overwhelmed the streamflow signal from head-waters indicating that flow regulation in these basins overthe study period conferred engineering resilience to climate-warming effects on streamflow.Because flow regulation for engineering resilience—flood
peak reduction and supplementing late season low flows—may shift flow timing, even from one water year intoanother, flow regulation effects may be mistaken forclimate-warming effects. For example, warning of an impend-ing water supply crisis from climate change, Barnett et al.(2008) cited the reduced variability of flow on the ColumbiaRiver, but this reduced flow variability is the clear result ofthe United States–Canada treaty on flow regulation (TreatyRelating to Cooperative Development of the Water Resourcesof the Columbia River Basin, 1961), which resulted in anabrupt decline in flow variability along the Columbia Rivermainstem in the 1970s.Over the long term, climate change may increase stream-
flow variability in headwaters, but river regulation will con-tinue to damp flow variability downstream. Which willdominate in the long term? Future trends in streamflow inthe Columbia River basin will depend on ecological resili-ence, which is a measure of headwater ecosystem and stream-flow response to climate warming and other disturbances,and engineering resilience, which depends on reservoir
capacity, reservoir operation rule curves, and dam removal.If streamflow from headwater ecosystems displays ecologicalresilience to climate warming, the anticipated exacerbation oflate summer hydrologic drought may not occur despite earliersnowmelt. At the same time, our study indicates that flowregulation in sub-basins of the Columbia River has providedconsiderable engineering resilience to climate warming.Although this engineered capacity may be reduced byfuture dam removal, it may also be increased by adjustmentof dam operating rule curves. Thus, future streamflowresponses to climate change in the Columbia River basinwill be mitigated by both ecological and engineeringresilience.
6 Conclusion
Ecological resilience (sensu Holling, 1996, i.e., persistence,variability, and unpredictability) has characterized headwaterecosystem responses to climate warming in the ColumbiaRiver basin, in the sense that spring snowmelt runofftiming was only slightly changed and no reductions in latesummer flow were detected in headwater basins. In contrast,engineering resilience (efficiency, constancy, and predictabil-ity of flows) has characterized streamflow trends downstreamof dams producing widespread reductions in flows duringwinter, spring, and early summer. Flow regulation alsoshifted the timing of flows, and these shifts may have beenmistaken for climate change effects. Future streamflowresponse to climate change in the Columbia River basinwill depend on ecological resilience, the net headwaterstreamflow response to climate warming and other disturb-ances and engineering resilience, a function of reservoircapacity, reservoir operation rule curves, and dam removal.
Acknowledgements
This paper is dedicated to the memory of Gail Achterman,whose deep understanding of water management and encour-agement of big-picture scientific research inspired this work.This paper benefited from input from two anonymous referees.Support for this research was provided by National ScienceFoundation funding to the H.J. Andrews Long-term Ecologi-cal Research program (NSF 0823380), U.S. GeologicalSurvey support of stream gauging, and ongoing U.S. ForestService support to the H.J. Andrews, Entiat, and the PriestRiver Experimental Forests.
ReferencesAdams, M. B., Loughry, L., & Plaugher, L. (Comps.) (2008). ExperimentalForests and Ranges of the USDA Forest Service (General TechnicalReport NE-321 Revised). Newtown Square, PA: U.S. Department ofAgriculture, Forest Service, Northeastern Research Station.
Barnett, T. P., Pierce, D. W., Hidalgo, H. G., Bonfils, C., Santer, B. D., Das,T.,…Dettinger, M. D. (2008). Human-induced changes in the hydrology ofthe western United States. Science, 319, 1080–1083.
Cayan, D. R., Kammerdiener, S. A., Dettinger, M. D., Caprio, J. M., &Peterson, D. H. (2001). Changes in the onset of spring in the westernUnited States. Bulletin of the American Meteorological Society, 82(3),399–415.
Chang, H., Jung, I. W., Steele, M., & Gannett, M. (2012). Spatial patterns ofMarch and September streamflow trends in Pacific Northwest streams,1958–2008. Geographical Analysis, 44, 177–201.
18 / Kendra L. Hatcher and Julia A. Jones
ATMOSPHERE-OCEAN iFirst article, 2013, 1–20 http://dx.doi.org/10.1080/07055900.2013.808167La Société canadienne de météorologie et d’océanographie
Dow
nloa
ded
by [
Julia
Jon
es]
at 1
1:37
21
June
201
3
Christensen, N. L., Agee, J. K., Brussard, P. F., Hughes, J., Knight, D. H.,Minshall, G. W., … Wright, H. A. (1989). Interpreting the Yellowstonefires of 1988: Ecosystem responses and management implications.BioScience, 39, 678–722.
Cuo, L., Lettenmaier, D. P., Alberti, M., & Richey, J. (2009). Effects of acentury of land cover and climate change on the hydrology of the PugetSound basin. Hydrological Processes, 23, 907–933.
Dynesius, M., & Nilsson, C. (1994). Fragmentation and flow regulationof river systems in the northern third of the world. Science, 266,753–762.
Folke, C. (2003). Freshwater for resilience: A shift in thinking. PhilosophicalTransactions of the Royal Society London, series B, 358, 2027–2036.doi:10.1098/rstb.2003.1385
Graf, W. L. (1999). Dam nation: A geographic census of American dams andtheir large-scale hydrologic impacts. Water Resources Research, 35,1305–1311.
Graf, W. L. (2006). Downstream hydrologic and geomorphic effects of largedams on American rivers. Geomorphology, 79, 336–360.
Hamlet, A. F., & Lettenmaier, D. P. (1999). Effects of climate changeon hydrology and water resources objectives in the Columbia Riverbasin. Journal of the American Water Resources Association, 35,1597–1624.
Hamlet, A. F., & Lettenmaier, D. P. (2007). Effects of 20th century warmingand climate variability on flood risk in the western U.S. Water ResourcesResearch, 43, W06427. doi:10.1029/2006WR005099
Hamlet, A. F., Mote, P. W., Clark, M. P., & Lettenmaier, D. P. (2005). Effectsof temperature and precipitation variability on snowpack trends in thewestern United States. Journal of Climate, 18, 4545–4561.
Hatcher, K. L. (2011). Interacting effects of climate, forest dynamics, land-forms, and river regulation on streamflow trends since 1950: Examplesfrom the Willamette Basin and forested headwater sites in the US.Oregon State University, Corvallis, Oregon. Retrieved from http://ir.library.oregonstate.edu/xmlui/handle/1957/88
Helsel, D. R., & Hirsch, R. M. (Eds.). (1992). Statistical methods in waterresources. New York: Elsevier.
Helsel, D. R., Mueller, D. K., & Slack, J. R. (2005).Computer program for theKendall family of trend tests (Scientific Investigations Report 2005-5275).Retrieved from http://pubs.usgs.gov/sir/2005/5275/pdf/sir2005-5275.pdf
Hicks, B. J., Beschta, R. L., & Harr, R. D. (1991). Long-term changes instreamflow following logging in western Oregon and associated fisheriesimplications. Water Resources Bulletin, 27, 217–226.
Holling, C. S. (1973). Resilience and stability of ecological systems. AnnualReview of Ecology and Systematics, 4, 1–23.
Holling, C. S. (1996). Engineering resilience versus ecological resilience. In P.C. Schulze (Ed.), Engineering within ecological constraints (pp. 31–43).Washington, DC: National Academy Press.
Hovmöller, E. (1949). The trough-and-ridge diagram. Tellus, 1, 62–66.Jones, J. A., Creed, I. F., Hatcher, K. L., Warren, R. J., Adams, M. B., Benson,M. H., … Williams, M. W. (2012). Ecosystem processes and human influ-ences regulate streamflow response to climate change at long-term ecologi-cal research sites. BioScience, 62(4), 390–404.
Jones, J. A., & Grant, G. E. (1996). Peak flow response to clearcutting androads in small and large basins, western Cascades, Oregon. WaterResources Research, 32, 959–974.
Jones, J. A., & Grant, G. E. (2001). Comment on “Peak flow responses toclear-cutting and roads in small and large basins, western Cascades,Oregon: A second opinion” by R. Thomas and W. Megahan [paper98WR02500. Water Resources Research, 34 (12), December 1998].Water Resources Research, 37, 175–178.
Jones, J. A., & Post, D. A. (2004). Seasonal and successional streamflowresponse to forest cutting and regrowth in the northwest and easternUnited States. Water Resources Research, 40, W05203. doi:10.1029/2003WR002952
Karl, T. R., Melillo, J. M., & Peterson, T. C. (Eds.). (2009). Global climatechange impacts in the United States: A state of knowledge report fromthe U.S. Global Change Research Program. New York: CambridgeUniversity Press.
Knowles, N., Dettinger, M. D., & Cayan, D. R. (2006). Trends in snowfallversus rainfall in the western United States. Journal of Climate, 19,4545–4559.
Lee, S. Y., Hamlet, A. F., Fitzgerald, C. J., & Burges, S. J. (2009). Optimizedflood control in the Columbia River basin for a global warming scenario.Journal of Water Resources Planning and Management, 135, 440–450.
Littell, J. S., Elsner, M. M., Mauger, G. S., Lutz, E., Hamlet, A. F., & Salathé,E. (2011). Regional climate and hydrologic change in the northern USRockies and Pacific Northwest: Internally consistent projections of futureclimate for resource management (Project report: April 17, 2011).Retrieved from the Center for Science in the Earth System website: http://cses.washington.edu/picea/USFS/pub/Littell_etal_2010/
Luce, C. H., & Holden, Z. A. (2009). Declining annual streamflow distri-butions in the Pacific Northwest United States, 1948–2006. GeophysicalResearch Letters, 36, L16401. doi:10.1029/2009GL039407
Lutz, E. R., Hamlet, A. F., & Littell, J. S. (2012). Paleoreconstruction of coolseason precipitation and warm season streamflow in the Pacific Northwestwith applications to climate change assessments. Water ResourcesResearch, 48, W01525. doi:10.1029/2011WR010687
Matheussen, B., Kirschbaum, R. L., Goodman, I. A., O’Donnell, G. M., &Lettenmaier, D. P. (2000). Effects of land cover change on streamflow inthe interior Columbia River Basin: USA and Canada. HydrologicalProcesses, 14, 867–885.
Moore, J. N., Arrigoni, A. S., & Wilcox, A. C. (2012). Impacts of dams onflow regimes in three headwater subbasins of the Columbia River basin,United States. Journal of the American Water Resources Association, 48,925–938. doi:10.1111/j.1752-1688.2012.00660.x
Mote, P. W. (2003). Trends in snow water equivalent in the Pacific Northwestand their climatic causes. Geophysical Research Letters, 30, 1601–1604.doi:10.1029/2003GL017258
Mote, P. W., Parson, E. A., Hamlet, A. F., Keeton, W. S., Lettenmaier, D.,Mantua, N., … Snover, A. (2003). Preparing for climatic change: Thewater, salmon, and forests of the Pacific Northwest. Climatic Change, 61,45–88.
Mote, P. W., & Salathé, E. P. (2010). Future climate in the Pacific Northwest.Climatic Change, 102, 29–50. doi:10.1007/s10584-010-9848-z
Naik, P., & Jay, D. A. (2005). Estimation of Columbia River virgin flow: 1879to 1928. Hydrological Processes, 19, 1807–1824.
Nayak, A., Marks, D., Chandler, D. G., & Seyfried, M. (2010). Long-termsnow, climate, and streamflow trends at the Reynolds CreekExperimental Watershed, Owyhee Mountains, Idaho, United States.Water Resources Research, 46, W06519. doi:10.1029/2008WR007525
Payne, J. T., Wood, A. W., Hamlet, A. F., Palmer, R. N., & Lettenmaier, D. P.(2004). Mitigating the effects of climate change on the water resources ofthe Columbia River Basin. Climatic Change, 62(1–3), 233–256.
Perry, T. D. (2007). Do vigorous young forests reduce streamflow? Resultsfrom up to 54 years of streamflow records in eight paired-watershed exper-iments in the H. J. Andrews and South Umpqua Experimental Forests.(Unpublished master’s thesis). Oregon State University, Corvallis,Oregon. Retrieved from http://ir.library.oregonstate.edu/xmlui/handle/1957/88
Ramsay, F. L., & Schaefer, D. W. (1996). The statistical sleuth: A course inmethods of data analysis. Belmont, CA: Duxbury Press.
Stewart, I. T., Cayan, D. R., & Dettinger, M. D. (2005). Changes towardearlier streamflow timing across western North America. Journal ofClimate, 18, 1136–1155.
Thomas, R. B., & Megahan, W. F. (1998). Peak flow responses to clear-cutting and roads in small and large basins, western Cascades, Oregon: Asecond opinion. Water Resources Research, 34, 3393–3403.
Thomas, R. B., & Megahan, W. F. (2001). Reply to Comment on Peak flowresponses to clear-cutting and roads in small and large basins, westernCascades, Oregon: A second opinion by R. Thomas and W. Megahan[paper 98WR02500. Water Resources Research, 34(12), December1998]. Water Resources Research, 37, 181–183.
Treaty Relating to Cooperative Development of the Water Resources of theColumbia River Basin, United States of America–Canada, January 17,1961, 15 U.S.T. 1555.
Climate and Streamflow Trends in the Columbia River Basin / 19
ATMOSPHERE-OCEAN iFirst article, 2013, 1–20 http://dx.doi.org/10.1080/07055900.2013.808167Canadian Meteorological and Oceanographic Society
Dow
nloa
ded
by [
Julia
Jon
es]
at 1
1:37
21
June
201
3
Turner, M. B., Romme, W. H., Gardner, R. H., & Hargrove, W. W. (1997).Effects of fire size and pattern on early succession in YellowstoneNational Park. Ecological Monographs, 67, 411–433.
US Department of the Interior. (2012). National Atlas Data Download [Data].Retrieved from http://www.nationalatlas.gov/atlasftp.html#dams00x
USGS (United States Geological Survey). (2012a). 1:250,000-scaleHydrologic Units of the United States [Data]. Retrieved from http://water.usgs.gov/GIS/metadata/usgswrd/XML/huc250k.xml
USGS (United States Geological Survey). (2012b). National Land CoverDatabase 2006 (NLCD2006) [Data]. Retrieved from the Multi-ResolutionLand Characteristics Consortium (MRLC) website: http://www.mrlc.gov/nlcd06_data.php
USGS (United States Geological Survey). (2012c). Global 30 Arc-SecondElevation (GTOPO30) [Data]. Retrieved from the Earth Resources
Observation and Science (EROS) Center website: http://eros.usgs.gov/#/Find_Data/Products_and_Data_Available/GTOPO30
VanShaar, J. R., Haddeland, I., & Lettenmaier, D. P. (2002). Effects ofland-cover changes on the hydrological response of interior ColumbiaRiver basin forested catchments. Hydrological Processes, 16,2499–2520.
Woodsmith, R. D., Vache, K. B., McDonnell, J. J., Seibert, J., & Helvey,J. D. (2007). The Entiat Experimental Forest: A unique opportunity toexamine hydrologic response to wildfire. In M. Furniss, C. Clifton, &K. Ronnenberg (Eds.), Advancing the fundamental sciences: Proceedingsof the Forest Service National Earth Sciences Conference, San Diego,CA, 18–22 October 2004 (pp. 205–216) (PNW-GTR 689). Portland, OR:U.S. Department of Agriculture, Forest Service, Pacific NorthwestResearch Station.
20 / Kendra L. Hatcher and Julia A. Jones
ATMOSPHERE-OCEAN iFirst article, 2013, 1–20 http://dx.doi.org/10.1080/07055900.2013.808167La Société canadienne de météorologie et d’océanographie
Dow
nloa
ded
by [
Julia
Jon
es]
at 1
1:37
21
June
201
3


![Climate and Streamflow Trends in the Columbia River Basin ...ceoas.oregonstate.edu/people/files/jones/hatcher_jones_atmos-ocean_13.pdf · Downloaded by [Julia Jones] at 11:37 21 June](https://img.pdfslide.us/doc/110x75/5ed517a534f27f38dd678796/climate-and-streamflow-trends-in-the-columbia-river-basin-ceoas-downloaded-by.jpg)