Embed Size (px)
Citation preview
Effect of land use and land cover dynamics on streamflowby using SWAT model in Chindwin Basin, Myanmar
Chinaporn Meechaiya1, Ate Poortinga1,2, Kel Markert3, Eric Anderson3, Farrukh Chishtie1, Raghavan Srinivasan4, Peeranan Towashiraporn1 and, David Saah1,2,5
20 September 2018Brussels, Belgium
1SERVIR-Mekong, Asian Disaster Preparedness Center, Bangkok, Thailand2Spatial Informatics Group, 2529 Yolanda Ct., Pleasanton, CA 94566, USA
3NASA/SERVIR Science Coordination Office, Earth System Science Center, University of Alabama, Huntsville, USA4Spatial Sciences Laboratory, Department of Ecosystem Science and Management, Texas A&M University, College Station, TX 77843, USA
5Geospatial Analysis Laboratory, Department of Ecosystem Science, University of San Francisco, San Francisco, CA 94117 USA

Introduction-Problem statement/objective
-What is RLCMS?
ContentMethodology1 2Conclusion3 4Results
- Sensitivity of Hydrological model with 3 different Global LC products / inputs
- Summary- Limitations- Further study and Recommendation
- How to achieve objective?- Case study in Myanmar
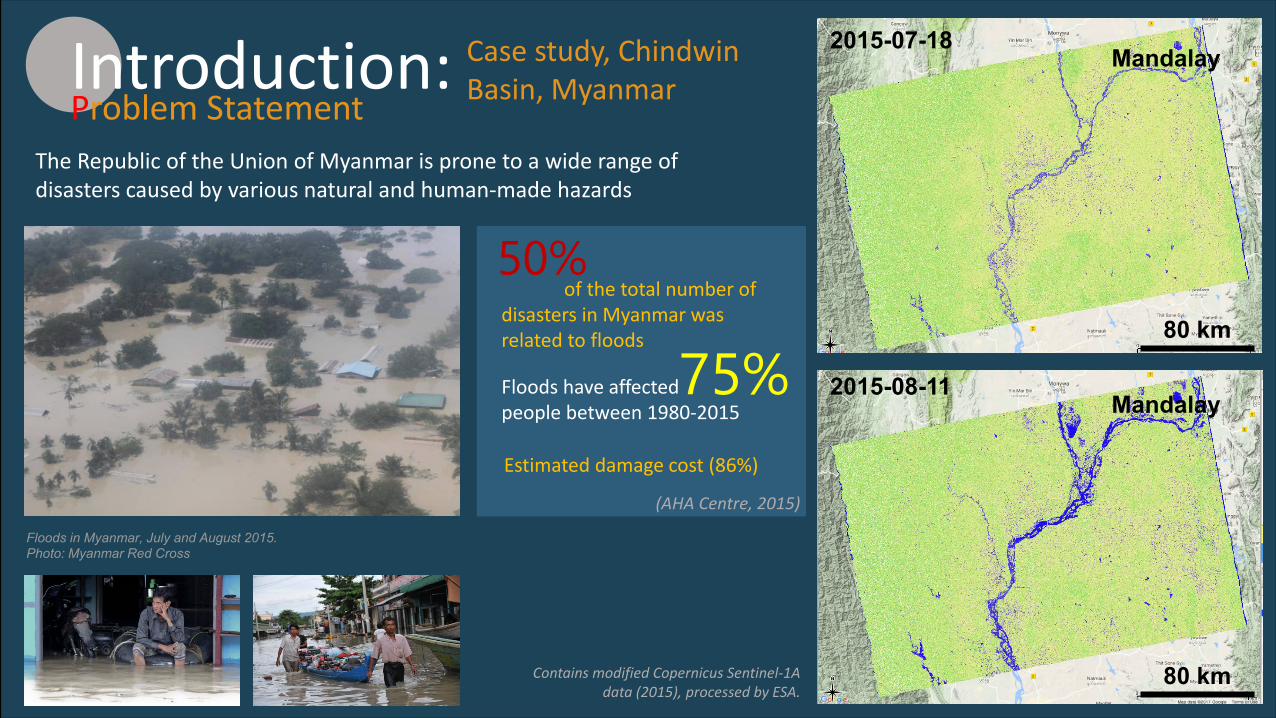
Introduction: Case study, Chindwin Basin, Myanmar
80 km
2015-07-18Mandalay
80 km
2015-08-11Mandalay
The Republic of the Union of Myanmar is prone to a wide range of disasters caused by various natural and human-made hazards
Floods in Myanmar, July and August 2015. Photo: Myanmar Red Cross
of the total number of disasters in Myanmar was related to floods
(AHA Centre, 2015)
Floods have affected people between 1980-2015
Estimated damage cost (86%)
50%
75%
Contains modified Copernicus Sentinel-1A data (2015), processed by ESA.
Problem Statement

Introduction: What is VRSGIS Tool?
Date Height19-Jul-15 97.491-Apr-15 88.43
21-Apr-15 88.0930-Apr-15 87.98
10-May-15 88.2120-May-15 87.5530-May-15 89.01
9-Jun-15 89.4619-Jun-15 92.4229-Jun-15 93.73
9-Jul-15 96.3111-Apr-15 87.6329-Jul-15 98.638-Aug-15 97.05
18-Aug-15 95.96
Water level Data outputFlood in Myanmar 2015Problem Statement
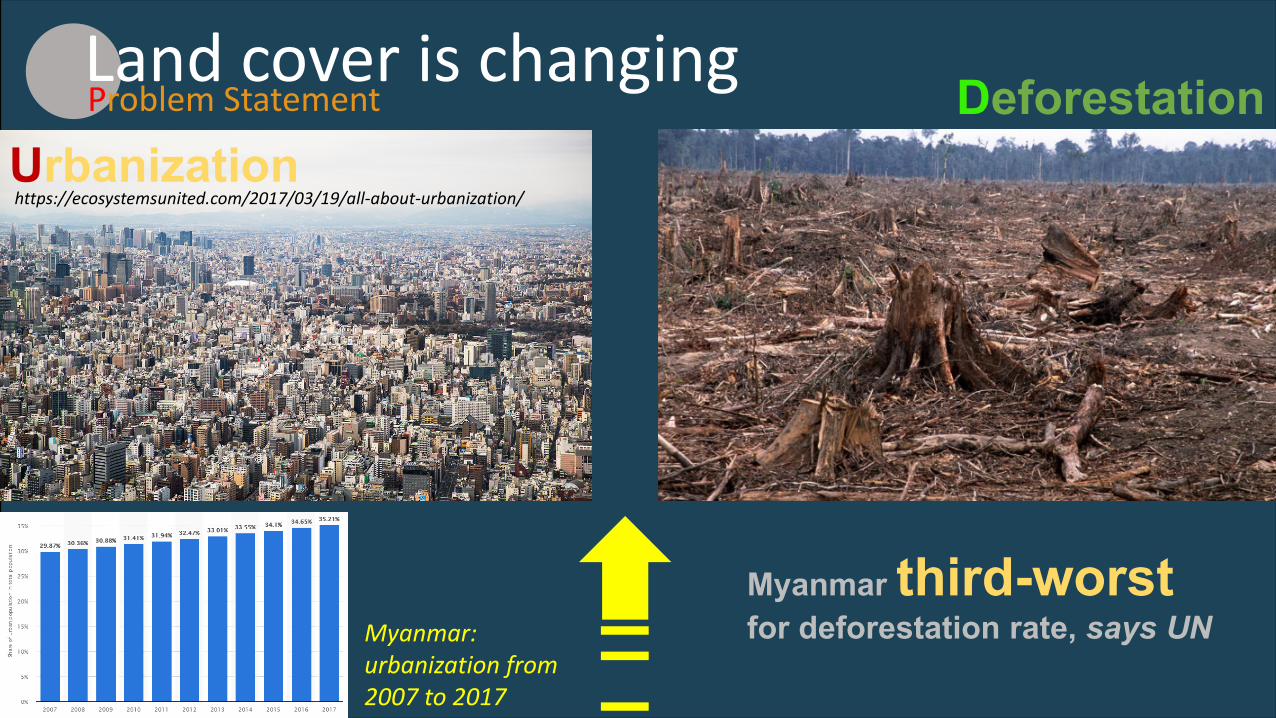
Land cover is changing
Myanmar: urbanization from 2007 to 2017
https://ecosystemsunited.com/2017/03/19/all-about-urbanization/Urbanization
Problem Statement Deforestation
Myanmar third-worstfor deforestation rate, says UN
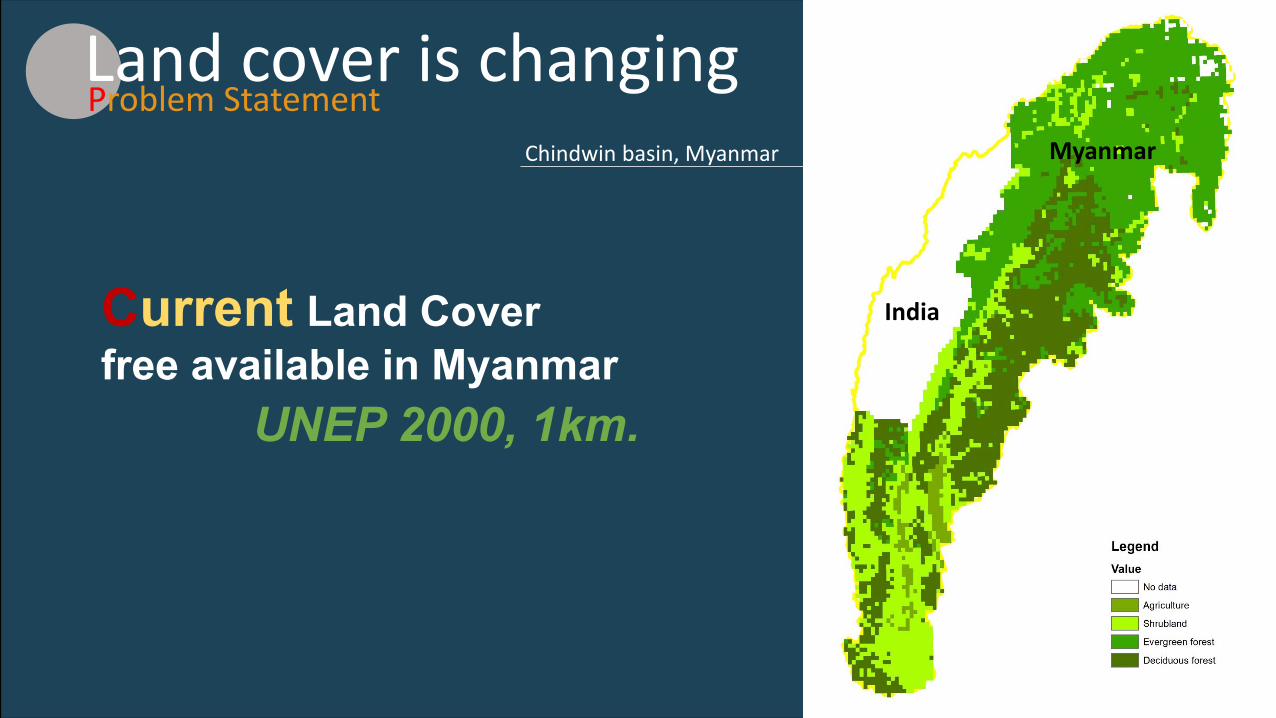
Land cover is changingProblem Statement
Current Land Cover free available in Myanmar
UNEP 2000, 1km.
Chindwin basin, Myanmar
India
Myanmar
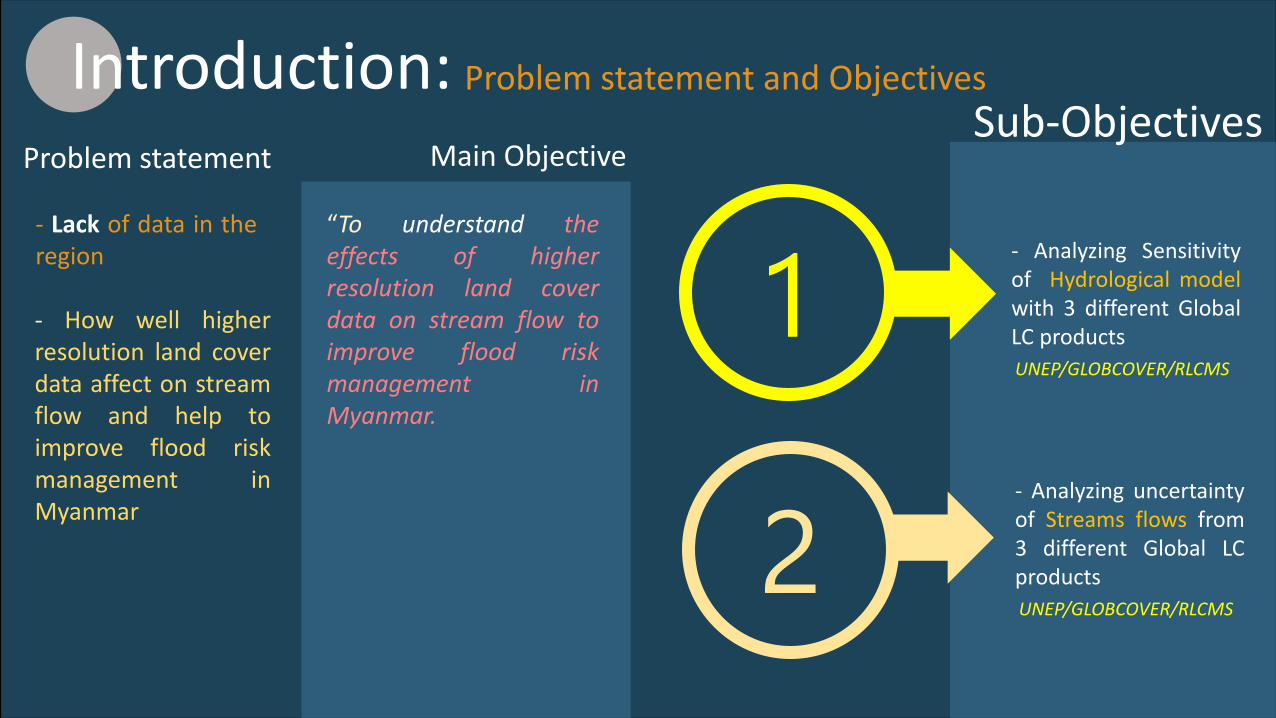
Introduction: Problem statement and Objectives
Problem statementSub-Objectives
1
2
- Analyzing Sensitivityof Hydrological modelwith 3 different GlobalLC productsUNEP/GLOBCOVER/RLCMS
- Lack of data in theregion
“To understand theeffects of higherresolution land coverdata on stream flow toimprove flood riskmanagement inMyanmar.
Main Objective
- How well higherresolution land coverdata affect on streamflow and help toimprove flood riskmanagement inMyanmar
- Analyzing uncertaintyof Streams flows from3 different Global LCproductsUNEP/GLOBCOVER/RLCMS
Introduction: What is VRSGIS Tool?
Virtual Rain and Stream Gauge Information Service (VRSGIS)
Date Height19-Jul-15 97.491-Apr-15 88.43
21-Apr-15 88.0930-Apr-15 87.98
10-May-15 88.2120-May-15 87.5530-May-15 89.01
9-Jun-15 89.4619-Jun-15 92.4229-Jun-15 93.73
9-Jul-15 96.3111-Apr-15 87.6329-Jul-15 98.638-Aug-15 97.05
18-Aug-15 95.96
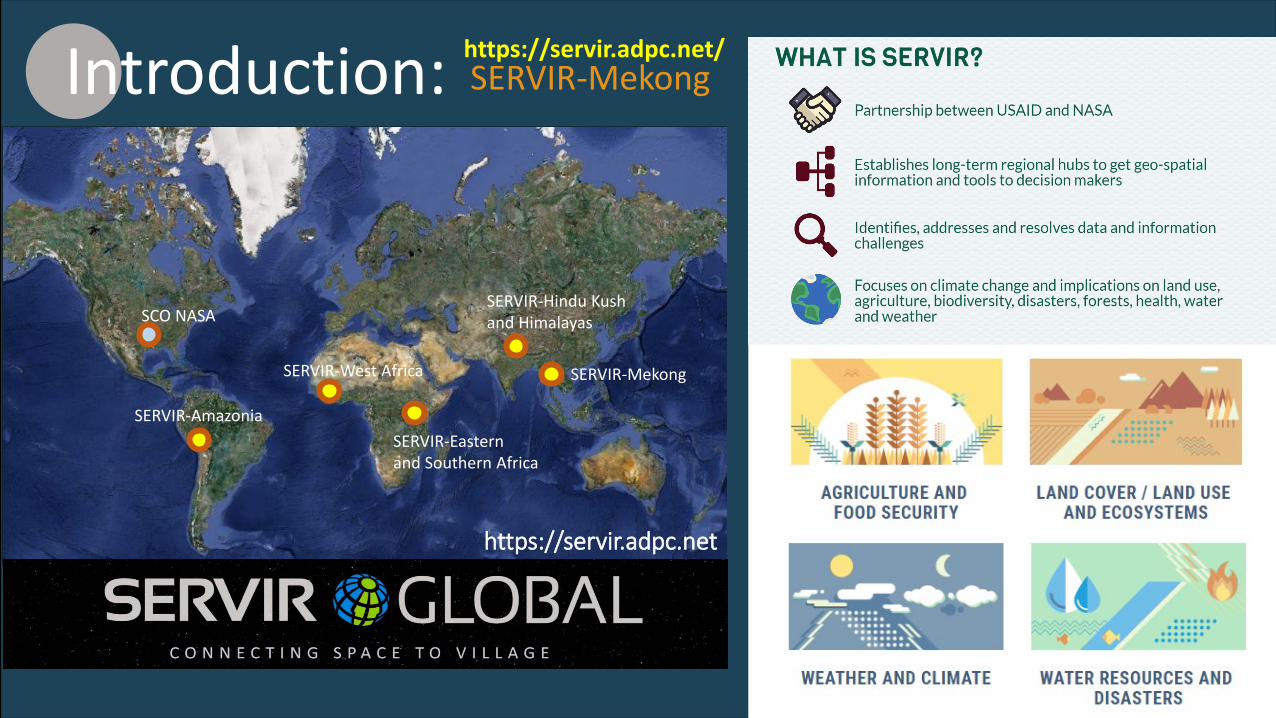
Water level Data outputIntroduction: SERVIR-Mekong
SCO NASA
SERVIR-Eastern and Southern Africa
SERVIR-Hindu Kushand Himalayas
SERVIR-MekongSERVIR-West Africa
SERVIR-Amazonia
https://servir.adpc.net
https://servir.adpc.net/
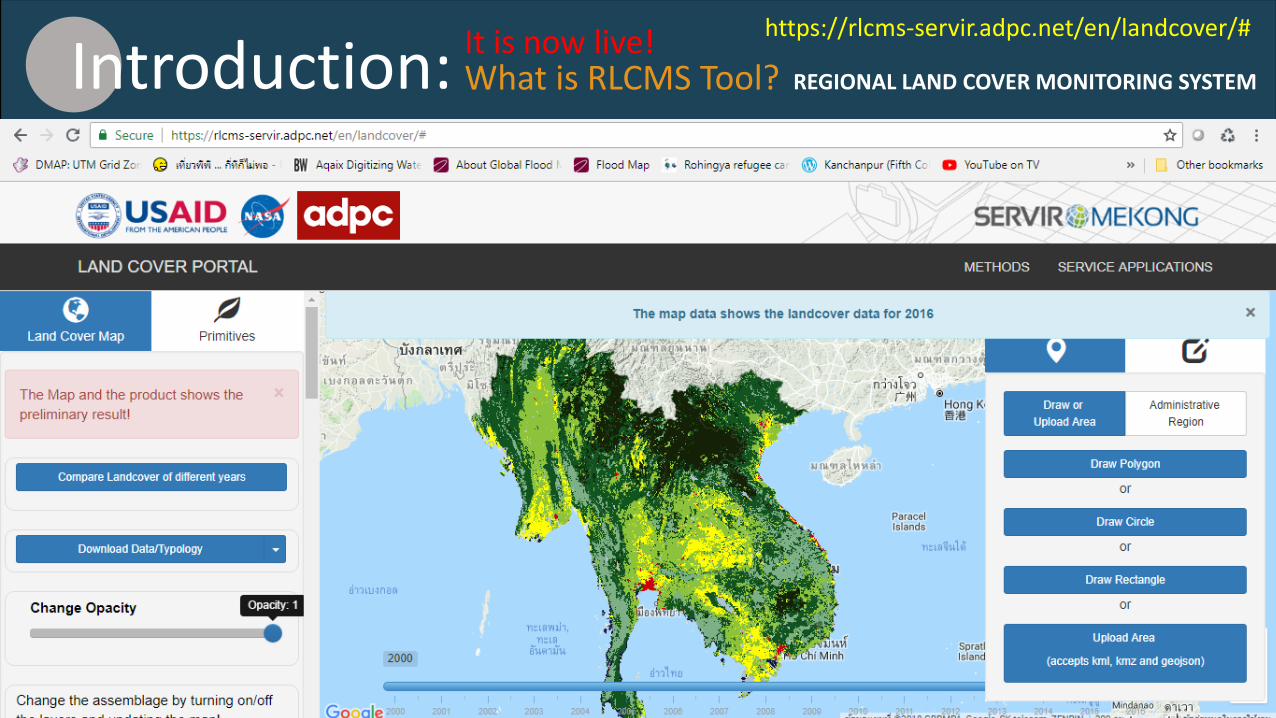
Introduction: What is RLCMS Tool?https://rlcms-servir.adpc.net/en/landcover/#It is now live!
REGIONAL LAND COVER MONITORING SYSTEM
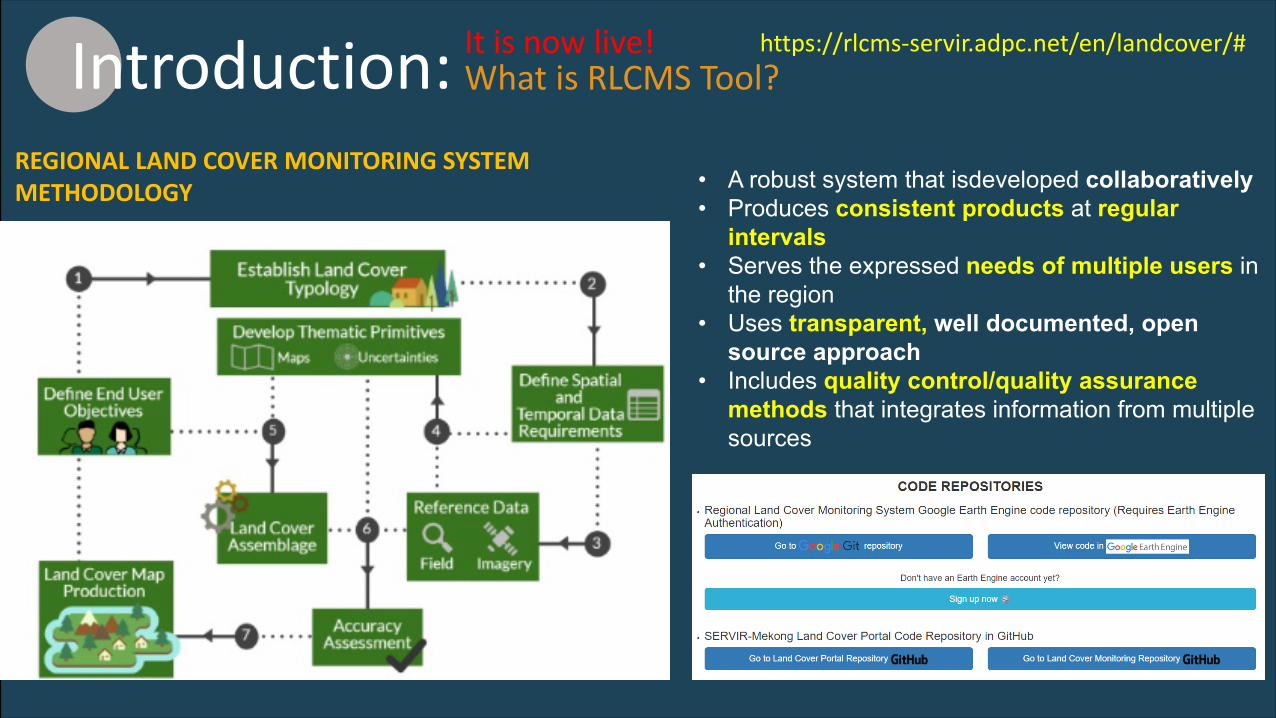
Introduction: What is RLCMS Tool?It is now live!
• A robust system that isdeveloped collaboratively• Produces consistent products at regular
intervals• Serves the expressed needs of multiple users in
the region• Uses transparent, well documented, open
source approach• Includes quality control/quality assurance
methods that integrates information from multiple sources
REGIONAL LAND COVER MONITORING SYSTEM METHODOLOGY
https://rlcms-servir.adpc.net/en/landcover/#
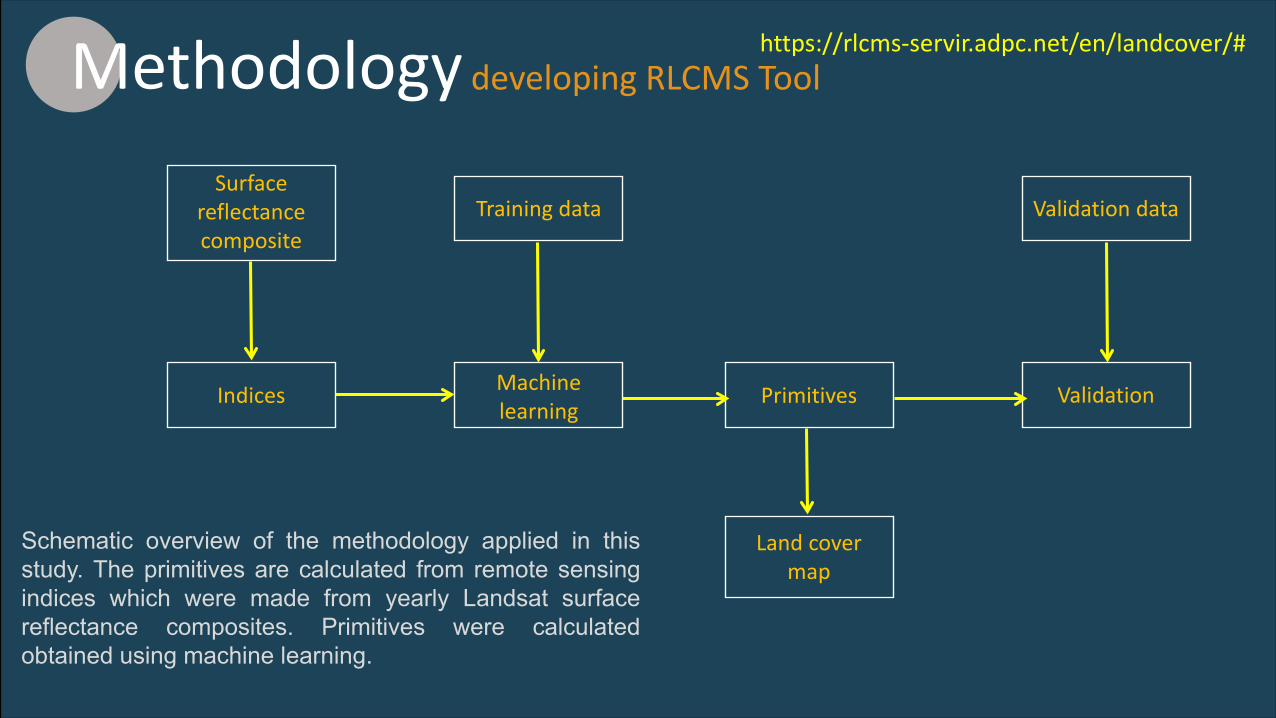
Methodology developing RLCMS Tool
Surface reflectance composite
Indices Machine learning
Primitives Validation
Training data Validation data
Land cover map
Schematic overview of the methodology applied in thisstudy. The primitives are calculated from remote sensingindices which were made from yearly Landsat surfacereflectance composites. Primitives were calculatedobtained using machine learning.
https://rlcms-servir.adpc.net/en/landcover/#
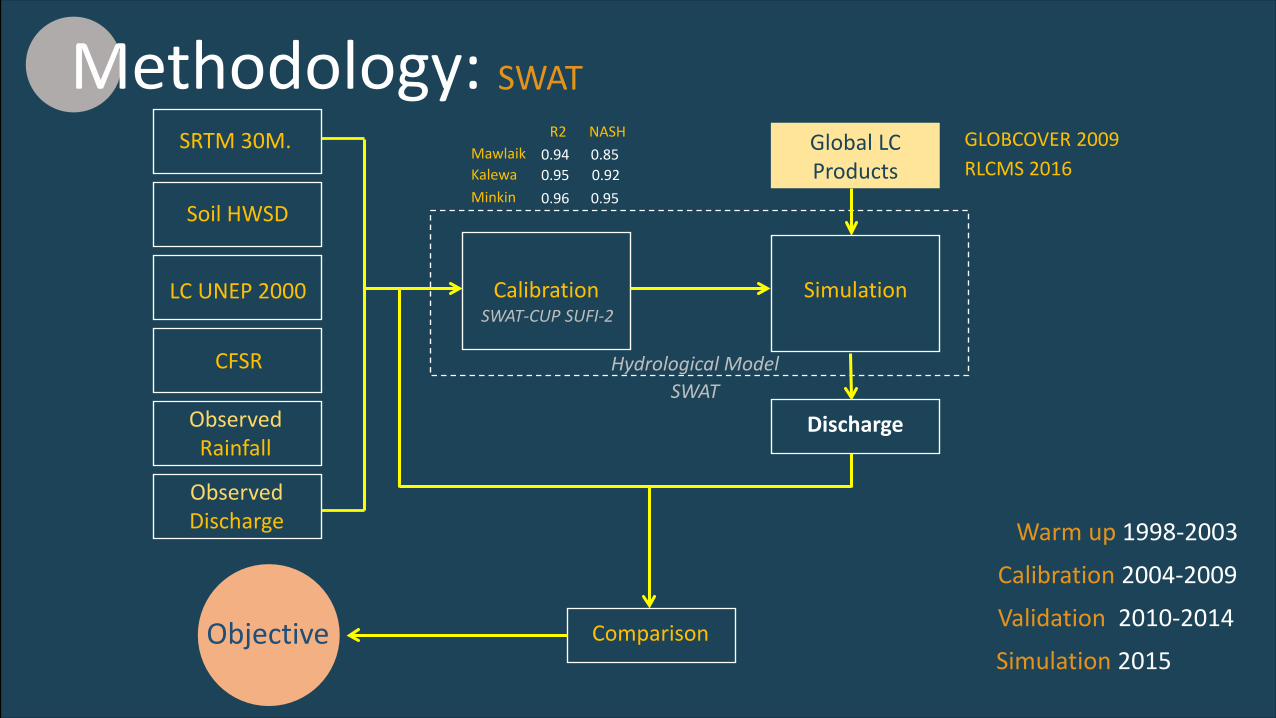
Methodology:
LC UNEP 2000
ObservedDischarge
Calibration
Hydrological Model
Simulation
Global LC Products
GLOBCOVER 2009RLCMS 2016
Discharge
ComparisonObjective
R2MawlaikKalewaMinkin
0.940.950.96
NASH0.850.920.95
SWAT
SRTM 30M.
Soil HWSD
ObservedRainfall
CFSR
SWAT
Warm up 1998-2003
Calibration 2004-2009
Simulation 2015
SWAT-CUP SUFI-2
Validation 2010-2014
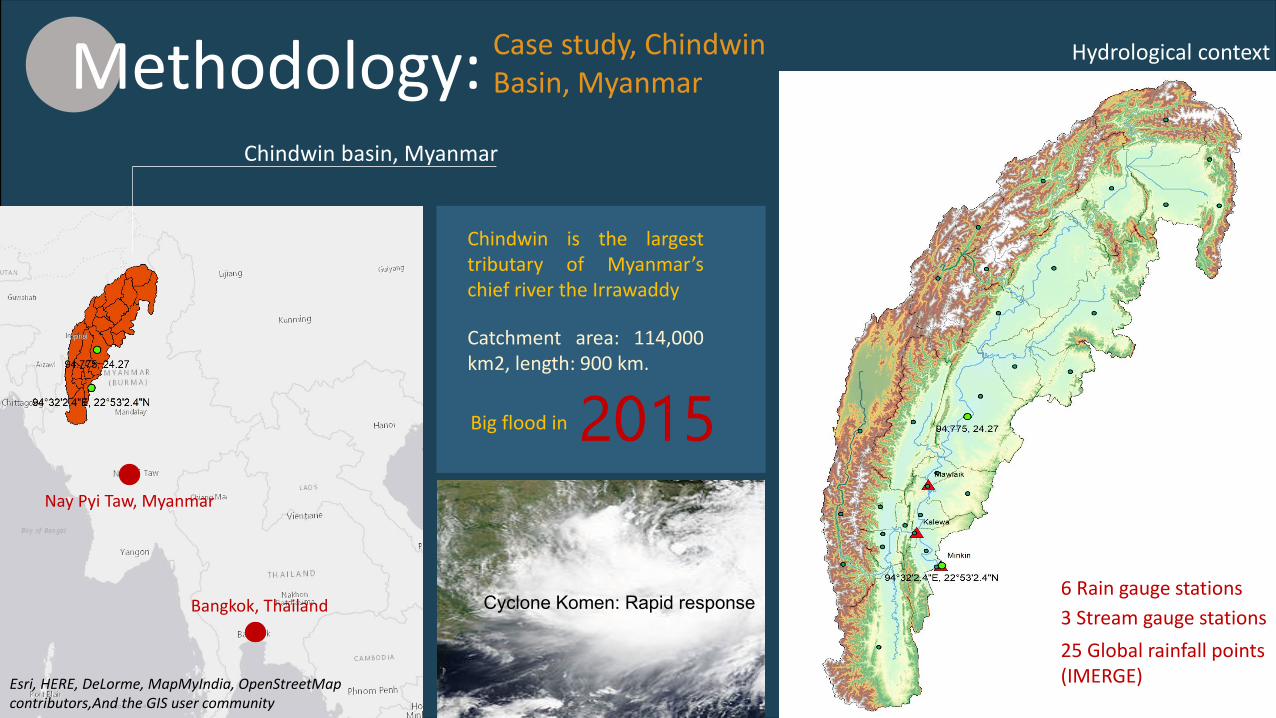
Methodology: Case study, Chindwin Basin, Myanmar
Chindwin basin, Myanmar
Bangkok, Thailand
Nay Pyi Taw, Myanmar
3 Stream gauge stations25 Global rainfall points(IMERGE)
6 Rain gauge stations
Chindwin is the largesttributary of Myanmar’schief river the Irrawaddy
Catchment area: 114,000km2, length: 900 km.
Big flood in 2015
Cyclone Komen: Rapid response
Hydrological context
Esri, HERE, DeLorme, MapMyIndia, OpenStreetMapcontributors,And the GIS user community
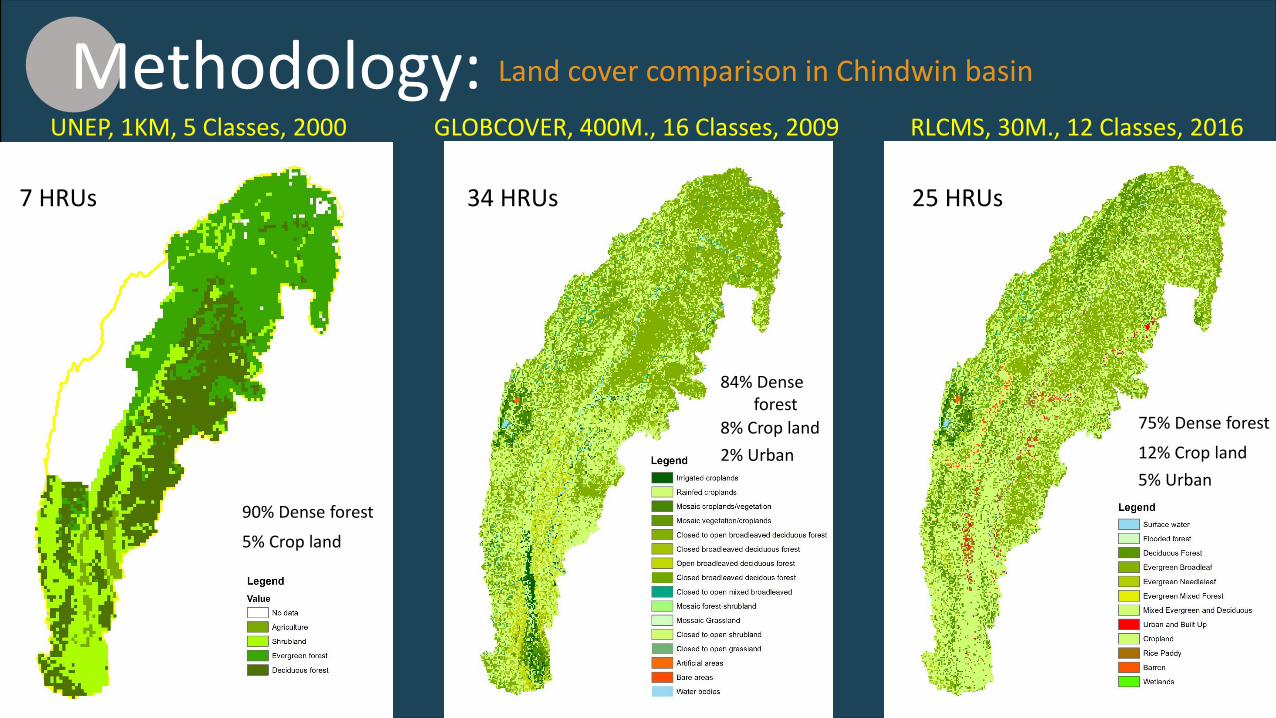
Methodology: Land cover comparison in Chindwin basin
UNEP, 1KM, 5 Classes, 2000 GLOBCOVER, 400M., 16 Classes, 2009 RLCMS, 30M., 12 Classes, 2016
7 HRUs 34 HRUs 25 HRUs
90% Dense forest
5% Crop land
75% Dense forest
12% Crop land5% Urban
84% Dense forest
8% Crop land2% Urban
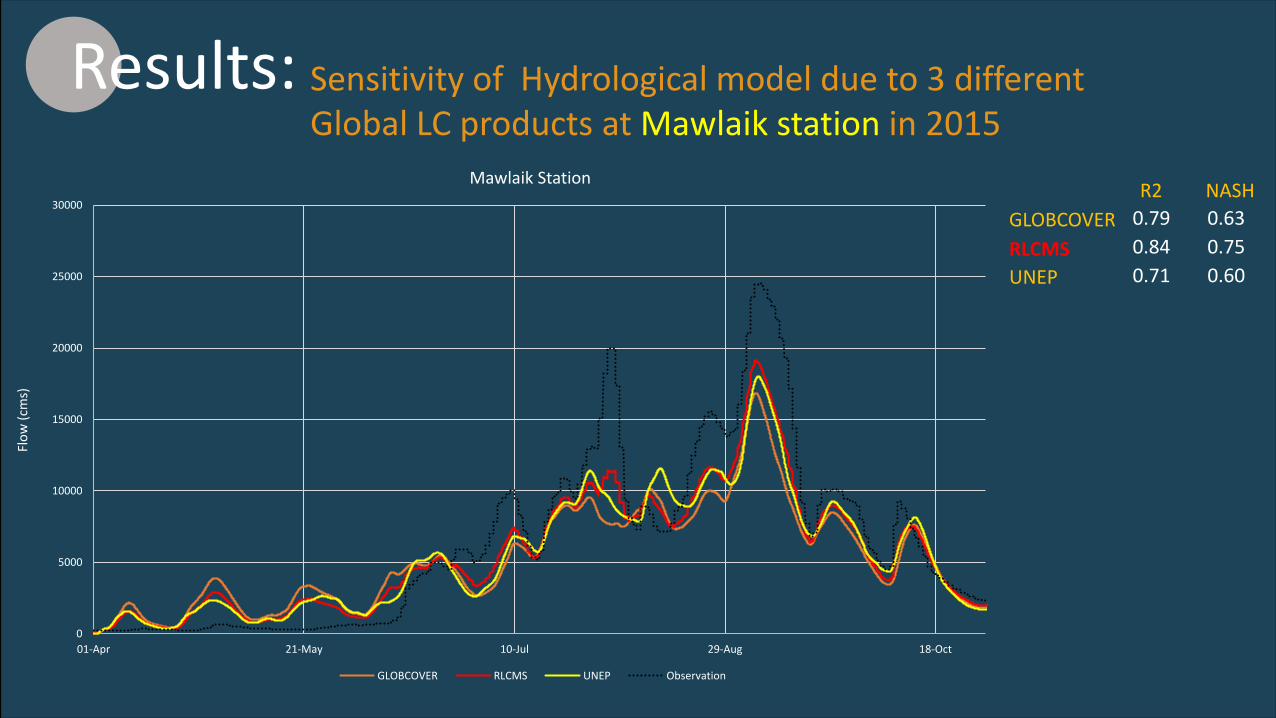
Results: Sensitivity of Hydrological model due to 3 different Global LC products at Mawlaik station in 2015
R2GLOBCOVERRLCMSUNEP
0.790.840.71
NASH0.630.750.60
Flow
(cm
s)
0
5000
10000
15000
20000
25000
30000
01-Apr 21-May 10-Jul 29-Aug 18-Oct
Mawlaik Station
GLOBCOVER RLCMS UNEP Observation
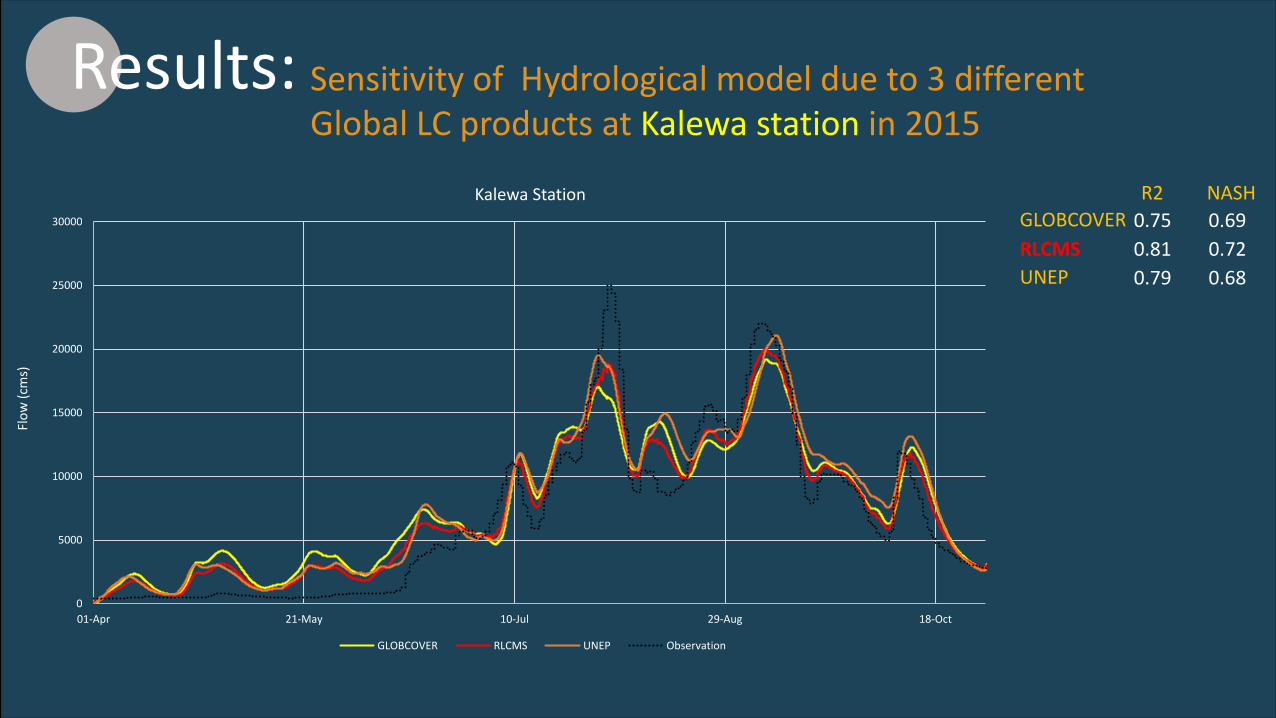
Results: Sensitivity of Hydrological model due to 3 different Global LC products at Kalewa station in 2015
R20.750.810.79
NASH0.690.720.68
Flow
(cm
s)
0
5000
10000
15000
20000
25000
30000
01-Apr 21-May 10-Jul 29-Aug 18-Oct
Kalewa Station
GLOBCOVER RLCMS UNEP Observation
GLOBCOVERRLCMSUNEP
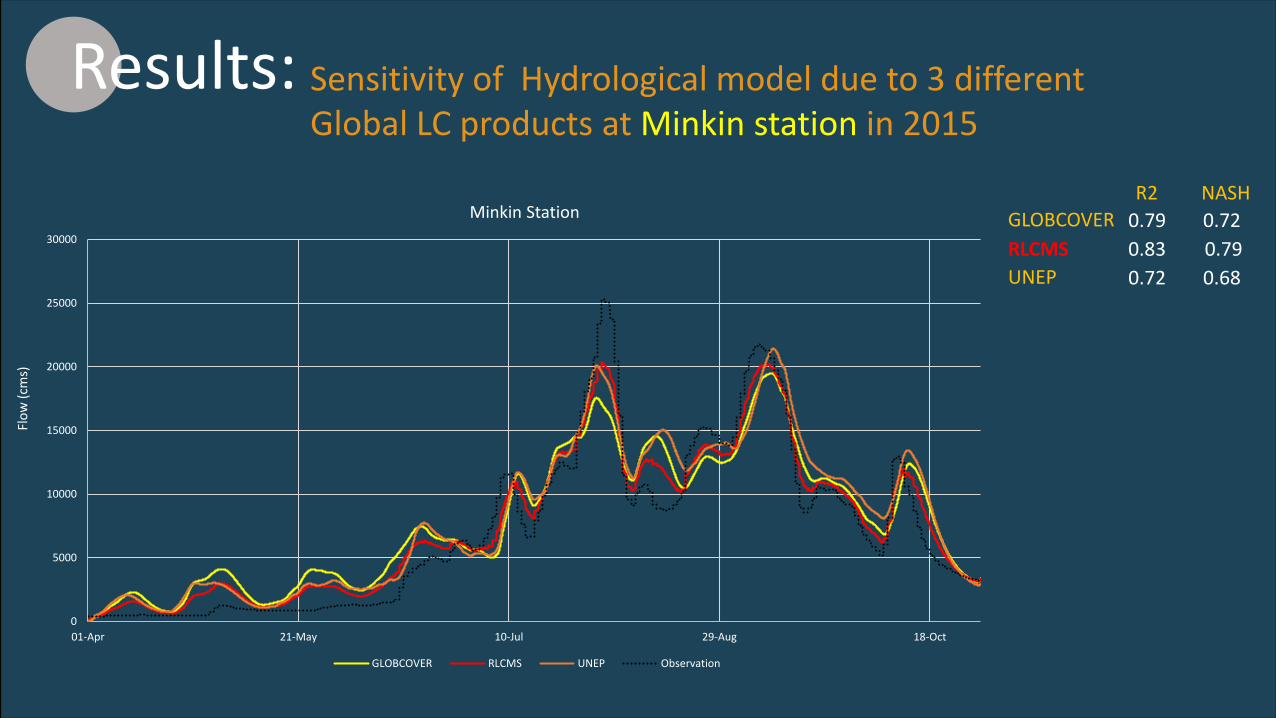
Results: Sensitivity of Hydrological model due to 3 different Global LC products at Minkin station in 2015
R20.790.830.72
NASH0.720.790.68
Flow
(cm
s)
0
5000
10000
15000
20000
25000
30000
01-Apr 21-May 10-Jul 29-Aug 18-Oct
Minkin Station
GLOBCOVER RLCMS UNEP Observation
GLOBCOVERRLCMSUNEP
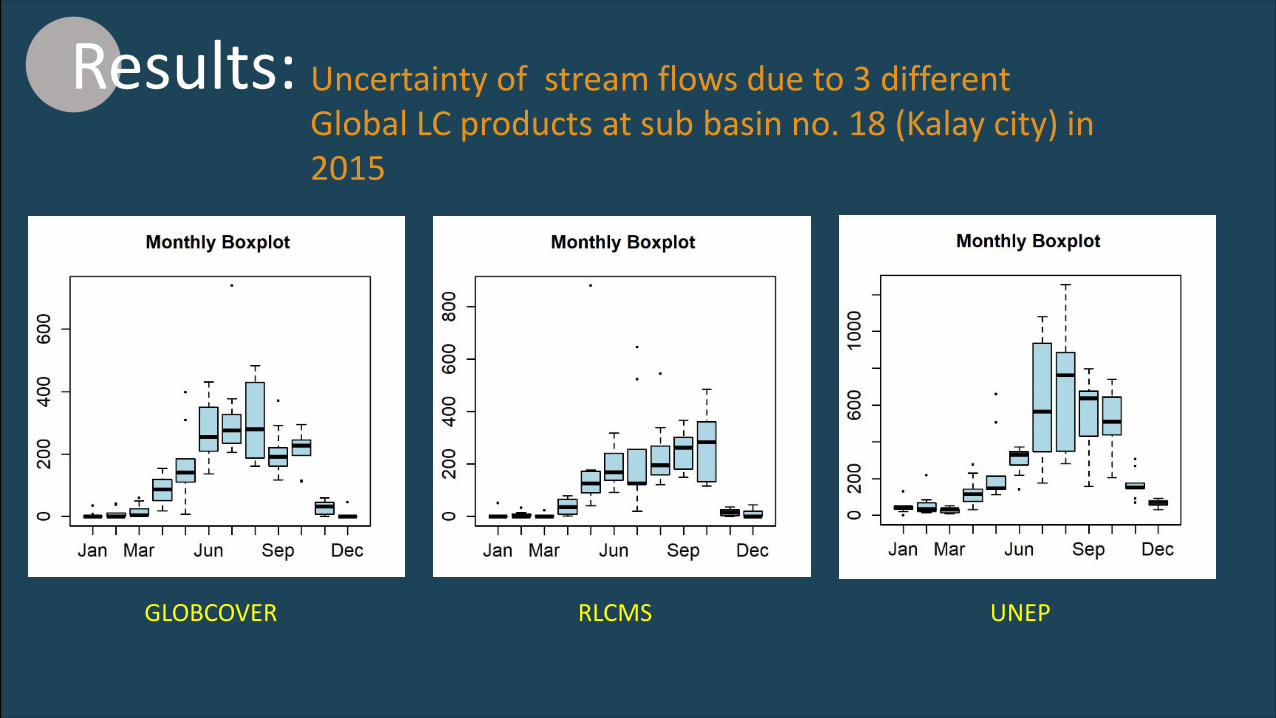
Results: Uncertainty of stream flows due to 3 different Global LC products at sub basin no. 18 (Kalay city) in 2015
GLOBCOVER RLCMS UNEP
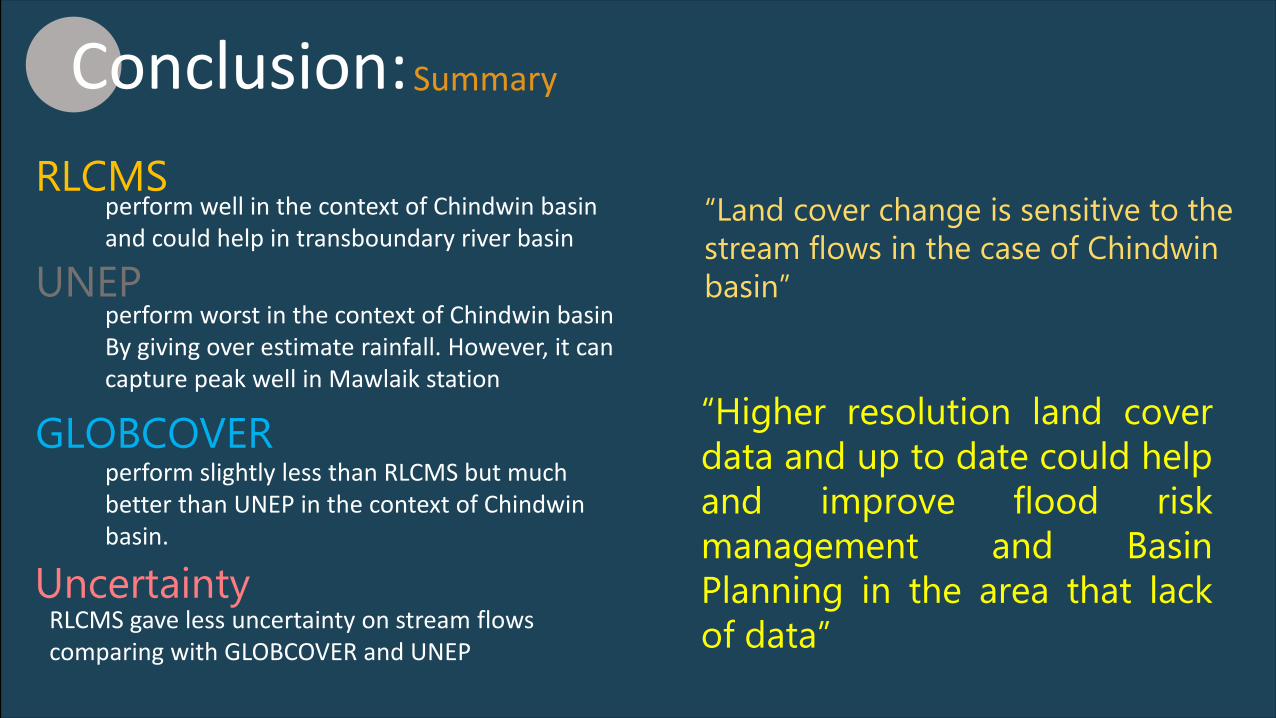
Conclusion:Summary
RLCMS perform well in the context of Chindwin basin and could help in transboundary river basin
perform worst in the context of Chindwin basinBy giving over estimate rainfall. However, it can capture peak well in Mawlaik station
UNEP
UncertaintyRLCMS gave less uncertainty on stream flows comparing with GLOBCOVER and UNEP
GLOBCOVERperform slightly less than RLCMS but much better than UNEP in the context of Chindwin basin.
“Higher resolution land coverdata and up to date could helpand improve flood riskmanagement and BasinPlanning in the area that lackof data”
“Land cover change is sensitive to the stream flows in the case of Chindwin basin”
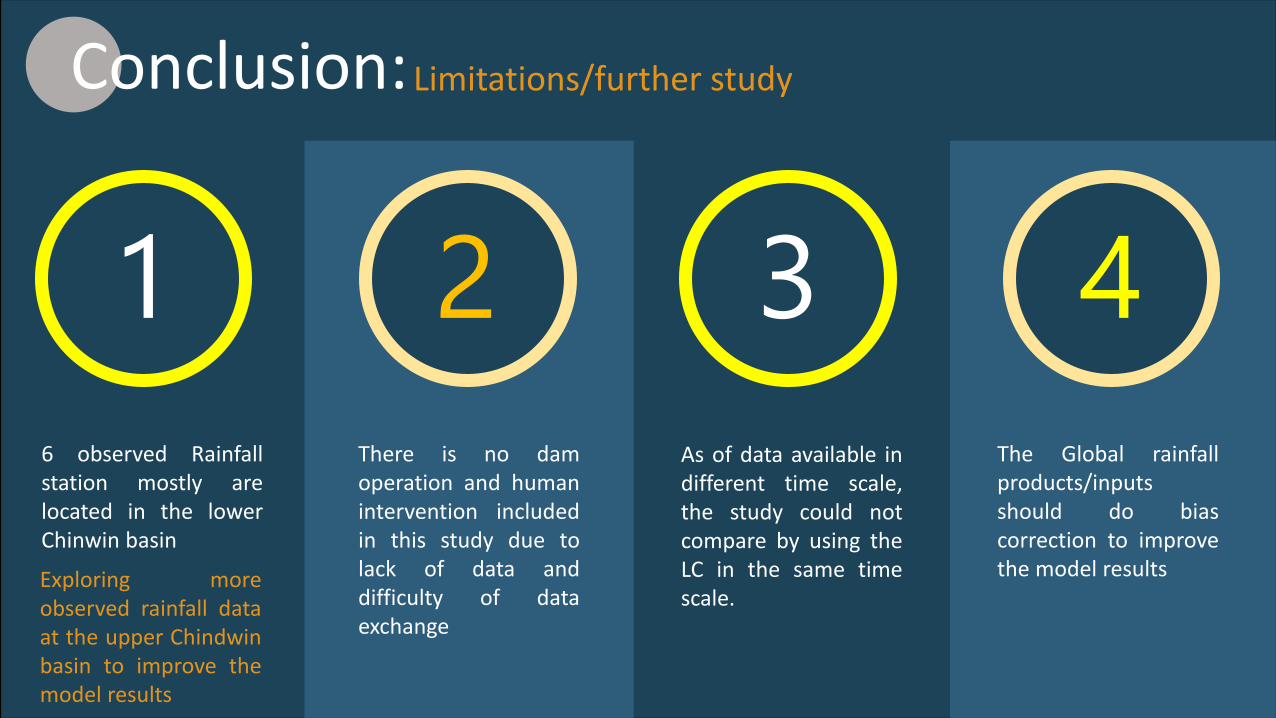
Conclusion:Limitations/further study
16 observed Rainfallstation mostly arelocated in the lowerChinwin basin
2 3 4There is no damoperation and humanintervention includedin this study due tolack of data anddifficulty of dataexchange
As of data available indifferent time scale,the study could notcompare by using theLC in the same timescale.
Exploring moreobserved rainfall dataat the upper Chindwinbasin to improve themodel results
The Global rainfallproducts/inputsshould do biascorrection to improvethe model results

THANK YOU

Results: Hydrological model calibration at Mawlaik station
0
5000
10000
15000
20000
25000
30000
Apr May Jun Jul Aug Sep Oct
Flow
(cm
s)
Simulation Observation
R2Observation 0.94
NASH0.85
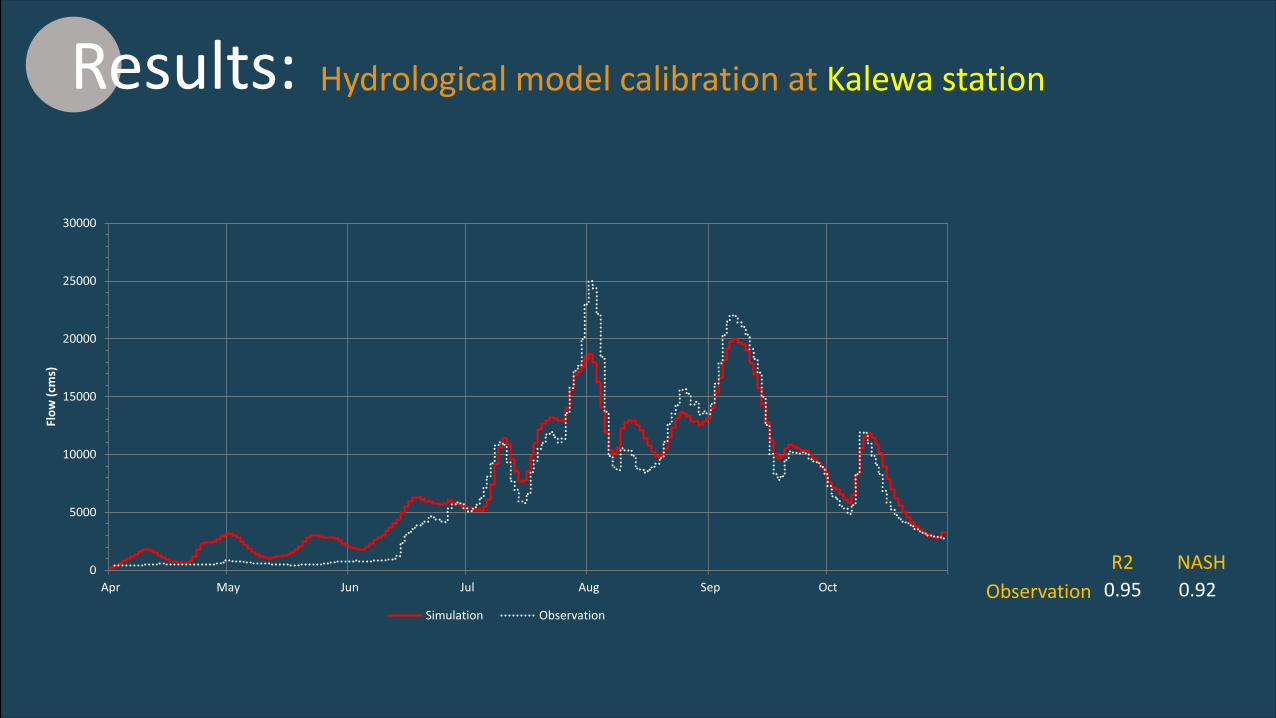
Results: Hydrological model calibration at Kalewa station
0
5000
10000
15000
20000
25000
30000
Apr May Jun Jul Aug Sep Oct
Flow
(cm
s)
Simulation Observation
R2Observation 0.95
NASH0.92
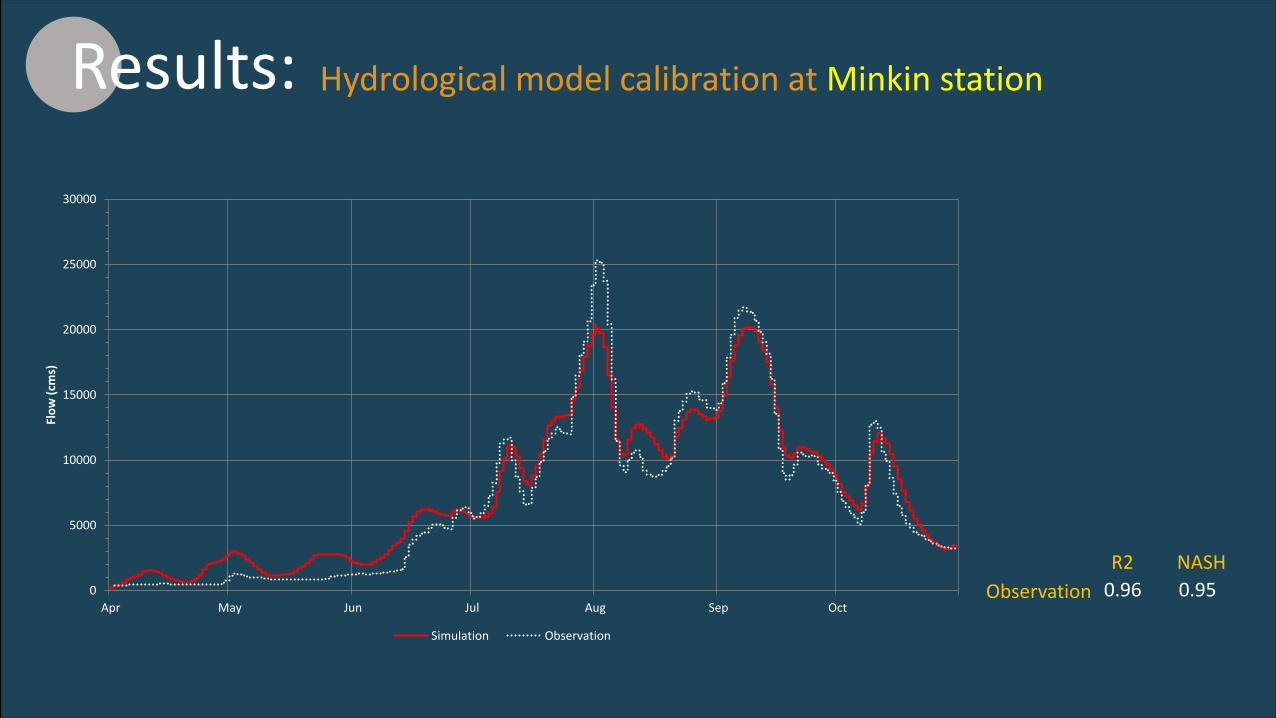
Results: Hydrological model calibration at Minkin station
0
5000
10000
15000
20000
25000
30000
Apr May Jun Jul Aug Sep Oct
Flow
(cm
s)
Simulation Observation
R2Observation 0.96
NASH0.95